operating funds...this section provides information for all county operating funds including...
TRANSCRIPT

This section provides information for all County operating funds including definitions and assumptions concerning each fund’s major revenue sources, financial summaries for each operating fund, and the 2020 budget.
Section 3
OPERATINGFUNDS
OPERATING FUNDS OVERVIEWThe County maintains 42 separate operating funds that are categorized into four operating fund types: General and Tax-Related Special Revenue Funds, Other Special Revenue Funds, Enterprise Funds, and Internal Service Funds. The types and the individual funds within them are highlighted in this section.
This section is outlined as follows:
• Revenue definitions and assumptions used for forecasting are provided for all major revenue sources by fund group and individual fund.
• A discussion of prior year actual results compared to the current year’s budget is provided for all major funds.
• Revenue and expense/expenditure schedules showing the history of the fund over the last three years and the budget year are shown for all operating funds.
• Pie charts showing budgeted revenues and expenses/expenditures are provided for the operating fund groups and all major operating funds.
Governmental Funds
General and Tax-Related Special Revenue Operating Funds:General and Tax-Related Funds are those whose primary revenues are derived from property taxes. Grouping them this way shows what services are funded from property tax dollars.
Other Special Revenue Operating Funds:Other Special Revenue Funds account for proceeds of specific revenue sources that are restricted or committed to a specific purpose other than debt service or capital projects.
Budget Basis for Governmental FundsBudgets for governmental fund types are adopted on the modified accrual basis with the following exception – changes in fair value of investments are not treated as adjustments to revenue in the annual operating budget.
Under the modified accrual basis of accounting, revenues are recognized when they become both measurable and available to finance expenditures of the fiscal year. Measurable means the amount of the transaction can be determined. Available is defined as collectible within the current period or soon enough thereafter to be used to pay liabilities of the current period. Expenditures are generally recognized when a liability is incurred, with a few exceptions.
GOVERNMENTAL FUNDS PROPRIETARY FUNDS
GENERAL & TAX-RELATED SPECIAL REVENUE FUNDS
$722,809,588
ENTERPRISE
$483,789,158
OTHER SPECIAL REVENUE FUNDS FUNDS
$54,853,710
INTERNAL SERVICE FUNDS
$181,239,979
2020 Operating Budget $1,442,692,435
FY 2020 Budget Document • I I I | 1
Proprietary Funds
Enterprise Operating Funds:Enterprise Funds are financed and operated in a manner similar to the private sector. Services are supported through user fees and charges. Revenues earned in excess of operations are reinvested in infrastructure through a contribution to a related capital fund.
Internal Service Operating Funds:Internal Service Funds account for goods or services provided by one department or agency in the County to another. Other funds or departments pay the Internal Service Funds on a cost reimbursement basis.
Budget Basis for Proprietary FundsBudgets for proprietary fund types are adopted on the full accrual basis of accounting with the following exceptions:
a) Changes in fair value of investments are not treated as adjustments to revenue in the annual operating budget;
b) Debt service and capital lease principal payments are treated as expenses in the annual operating budget;
c) Depreciation expense is not recognized in the annual operating budget; and
d) Capital purchases are recognized in the annual operating budget.
Under the full accrual basis of accounting, transactions and events are recognized as revenues or expenses when they occur, regardless of when cash is received or disbursed.
2 | I I I • FY 2020 Budget Document
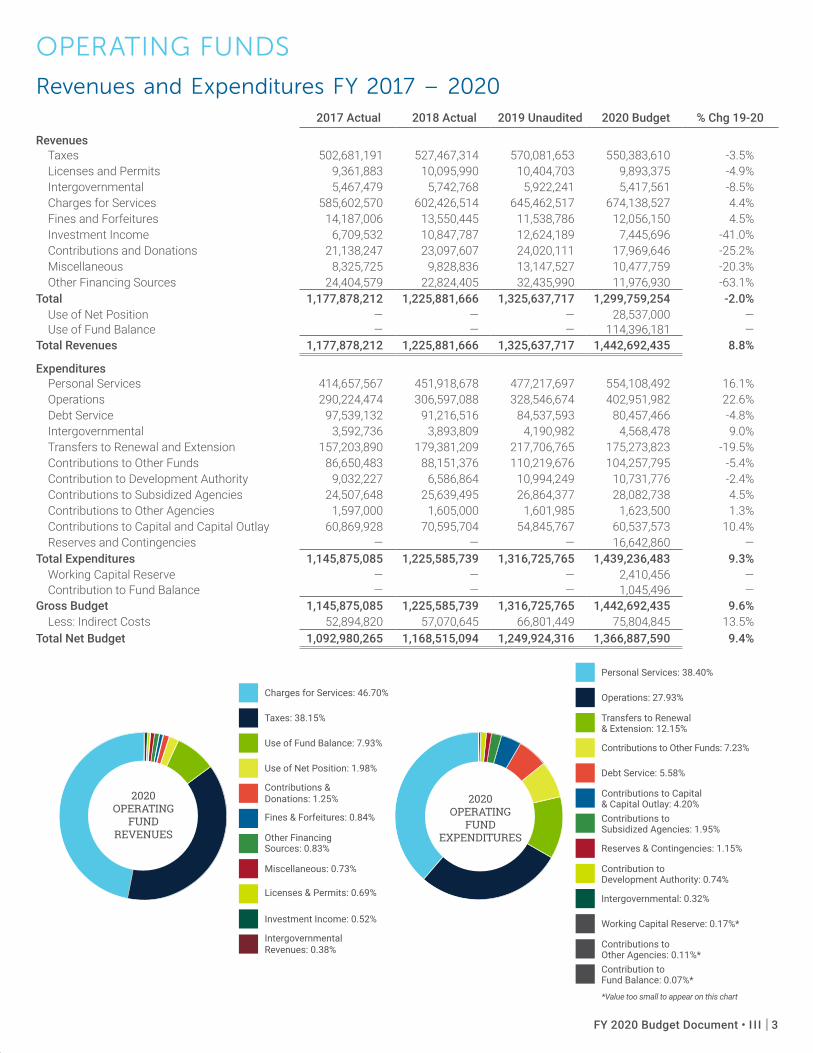
Personal Services: 38.40%
Operations: 27.93%
Transfers to Renewal & Extension: 12.15%
Contributions to Other Funds: 7.23%
Debt Service: 5.58%
Contributions to Capital & Capital Outlay: 4.20%Contributions to Subsidized Agencies: 1.95%
Reserves & Contingencies: 1.15%
Contribution to Development Authority: 0.74%
Intergovernmental: 0.32%
Working Capital Reserve: 0.17%*
Contributions to Other Agencies: 0.11%*Contribution to Fund Balance: 0.07%*
Charges for Services: 46.70%
Taxes: 38.15%
Use of Fund Balance: 7.93%
Use of Net Position: 1.98%
Contributions & Donations: 1.25%
Fines & Forfeitures: 0.84%
Other Financing Sources: 0.83%
Miscellaneous: 0.73%
Licenses & Permits: 0.69%
Investment Income: 0.52%
Intergovernmental Revenues: 0.38%
2020 OPERATING
FUND REVENUES
*Value too small to appear on this chart
2020OPERATING
FUND EXPENDITURES
OPERATING FUNDS
Revenues and Expenditures FY 2017 – 2020 2017 Actual 2018 Actual 2019 Unaudited 2020 Budget % Chg 19-20
RevenuesTaxes 502,681,191 527,467,314 570,081,653 550,383,610 -3.5%Licenses and Permits 9,361,883 10,095,990 10,404,703 9,893,375 -4.9%Intergovernmental 5,467,479 5,742,768 5,922,241 5,417,561 -8.5%Charges for Services 585,602,570 602,426,514 645,462,517 674,138,527 4.4%Fines and Forfeitures 14,187,006 13,550,445 11,538,786 12,056,150 4.5%Investment Income 6,709,532 10,847,787 12,624,189 7,445,696 -41.0%Contributions and Donations 21,138,247 23,097,607 24,020,111 17,969,646 -25.2%Miscellaneous 8,325,725 9,828,836 13,147,527 10,477,759 -20.3%Other Financing Sources 24,404,579 22,824,405 32,435,990 11,976,930 -63.1%
Total 1,177,878,212 1,225,881,666 1,325,637,717 1,299,759,254 -2.0%Use of Net Position — — — 28,537,000 —Use of Fund Balance — — — 114,396,181 —
Total Revenues 1,177,878,212 1,225,881,666 1,325,637,717 1,442,692,435 8.8%
ExpendituresPersonal Services 414,657,567 451,918,678 477,217,697 554,108,492 16.1%Operations 290,224,474 306,597,088 328,546,674 402,951,982 22.6%Debt Service 97,539,132 91,216,516 84,537,593 80,457,466 -4.8%Intergovernmental 3,592,736 3,893,809 4,190,982 4,568,478 9.0%Transfers to Renewal and Extension 157,203,890 179,381,209 217,706,765 175,273,823 -19.5%Contributions to Other Funds 86,650,483 88,151,376 110,219,676 104,257,795 -5.4%Contribution to Development Authority 9,032,227 6,586,864 10,994,249 10,731,776 -2.4%Contributions to Subsidized Agencies 24,507,648 25,639,495 26,864,377 28,082,738 4.5%Contributions to Other Agencies 1,597,000 1,605,000 1,601,985 1,623,500 1.3%Contributions to Capital and Capital Outlay 60,869,928 70,595,704 54,845,767 60,537,573 10.4%Reserves and Contingencies — — — 16,642,860 —
Total Expenditures 1,145,875,085 1,225,585,739 1,316,725,765 1,439,236,483 9.3%Working Capital Reserve — — — 2,410,456 —Contribution to Fund Balance — — — 1,045,496 —
Gross Budget 1,145,875,085 1,225,585,739 1,316,725,765 1,442,692,435 9.6%Less: Indirect Costs 52,894,820 57,070,645 66,801,449 75,804,845 13.5%
Total Net Budget 1,092,980,265 1,168,515,094 1,249,924,316 1,366,887,590 9.4%
FY 2020 Budget Document • I I I | 3
GENERAL & TAX-RELATED SPECIAL REVENUE FUNDS
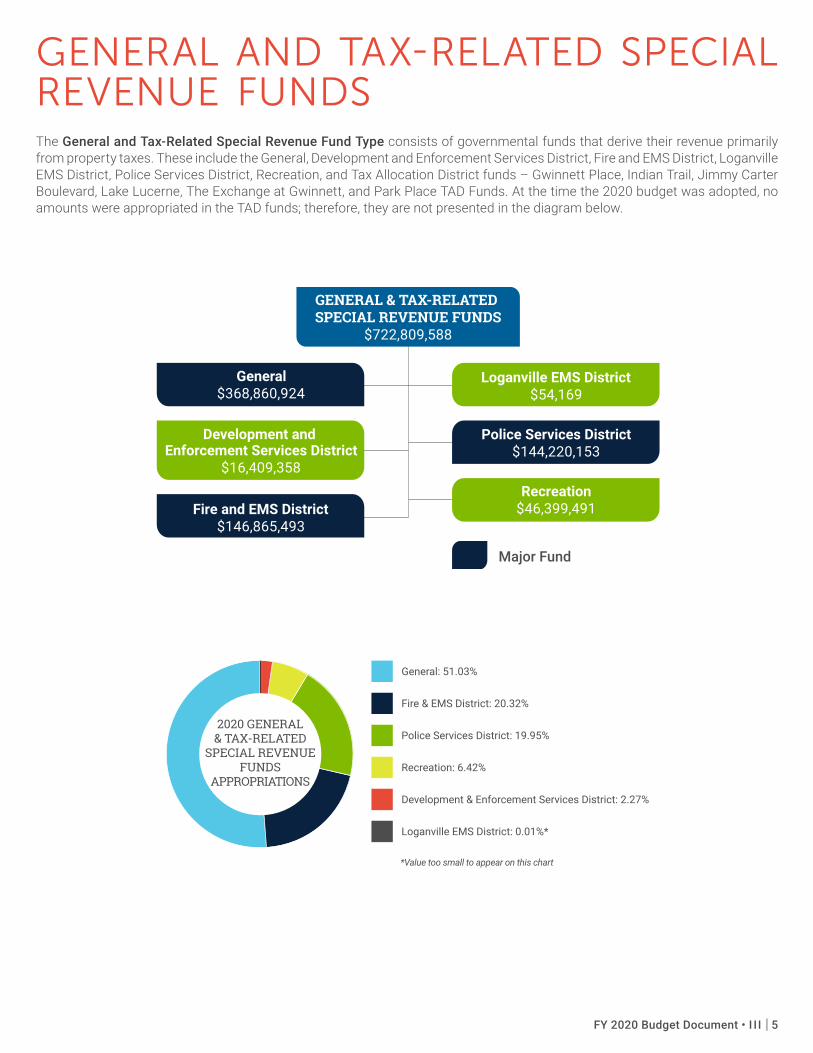
GENERAL AND TAX-RELATED SPECIAL REVENUE FUNDSThe General and Tax-Related Special Revenue Fund Type consists of governmental funds that derive their revenue primarily from property taxes. These include the General, Development and Enforcement Services District, Fire and EMS District, Loganville EMS District, Police Services District, Recreation, and Tax Allocation District funds – Gwinnett Place, Indian Trail, Jimmy Carter Boulevard, Lake Lucerne, The Exchange at Gwinnett, and Park Place TAD Funds. At the time the 2020 budget was adopted, no amounts were appropriated in the TAD funds; therefore, they are not presented in the diagram below.
GENERAL & TAX-RELATED SPECIAL REVENUE FUNDS
$722,809,588
General$368,860,924
Fire and EMS District$146,865,493
Loganville EMS District$54,169
Police Services District$144,220,153
Recreation$46,399,491
Development and Enforcement Services District
$16,409,358
Major Fund
General: 51.03%
Fire & EMS District: 20.32%
Police Services District: 19.95%
Recreation: 6.42%
Development & Enforcement Services District: 2.27%
Loganville EMS District: 0.01%*
*Value too small to appear on this chart
2020 GENERAL & TAX-RELATED
SPECIAL REVENUE FUNDS
APPROPRIATIONS
General: 51.03%
Fire & EMS District: 20.32%
Police Services District: 19.95%
Recreation: 6.42%
Development & Enforcement Services District: 2.27%
Loganville EMS District: 0.01%*
*Value too small to appear on this chart
2020 GENERAL & TAX-RELATED
SPECIAL REVENUE FUNDS
APPROPRIATIONS
FY 2020 Budget Document • I I I | 5
*Value too small to appear on this chart
*Value too small to appear on this chart
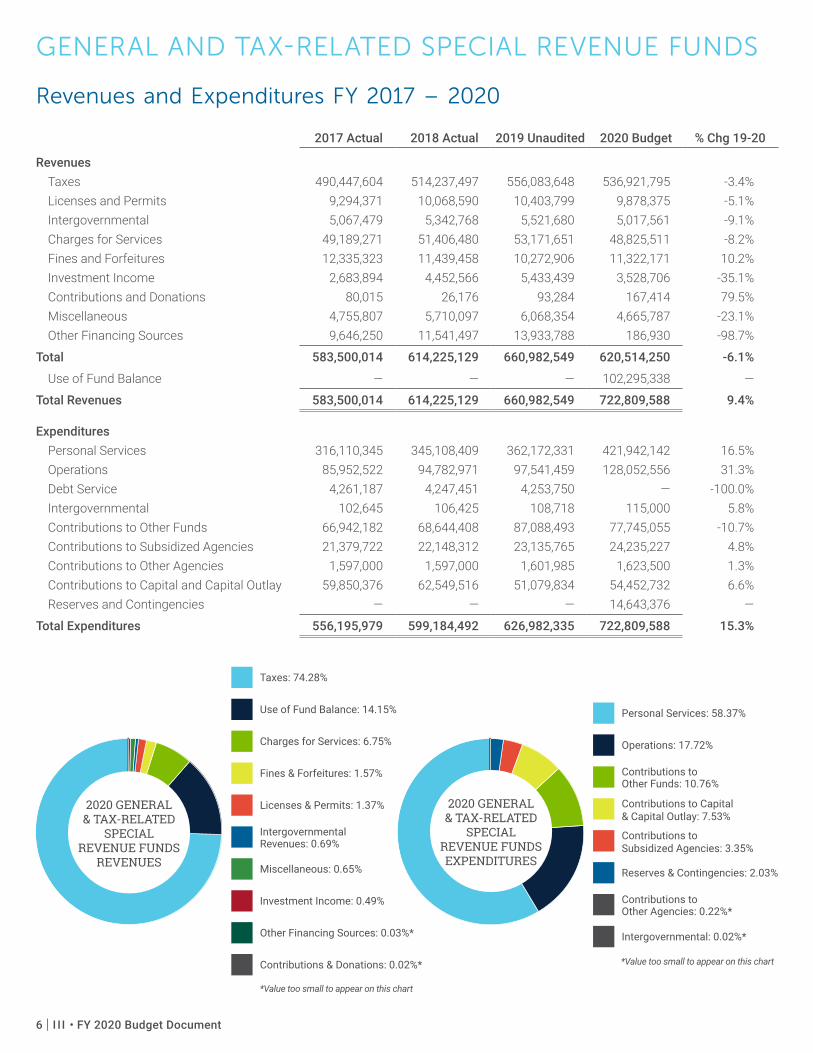
Taxes: 74.28%
Use of Fund Balance: 14.15%
Charges for Services: 6.75%
Fines & Forfeitures: 1.57%
Licenses & Permits: 1.37%
Intergovernmental Revenues: 0.69%
Miscellaneous: 0.65%
Investment Income: 0.49%
Other Financing Sources: 0.03%*
Contributions & Donations: 0.02%*
2020 GENERAL & TAX-RELATED
SPECIAL REVENUE FUNDS
REVENUES
Personal Services: 58.37%
Operations: 17.72%
Contributions to Other Funds: 10.76%
Contributions to Capital & Capital Outlay: 7.53%
Contributions to Subsidized Agencies: 3.35%
Reserves & Contingencies: 2.03%
Contributions to Other Agencies: 0.22%*
Intergovernmental: 0.02%*
2020 GENERAL & TAX-RELATED
SPECIAL REVENUE FUNDS EXPENDITURES
GENERAL AND TAX-RELATED SPECIAL REVENUE FUNDS
Revenues and Expenditures FY 2017 – 2020
2017 Actual 2018 Actual 2019 Unaudited 2020 Budget % Chg 19-20
RevenuesTaxes 490,447,604 514,237,497 556,083,648 536,921,795 -3.4%Licenses and Permits 9,294,371 10,068,590 10,403,799 9,878,375 -5.1%Intergovernmental 5,067,479 5,342,768 5,521,680 5,017,561 -9.1%Charges for Services 49,189,271 51,406,480 53,171,651 48,825,511 -8.2%Fines and Forfeitures 12,335,323 11,439,458 10,272,906 11,322,171 10.2%Investment Income 2,683,894 4,452,566 5,433,439 3,528,706 -35.1%Contributions and Donations 80,015 26,176 93,284 167,414 79.5%Miscellaneous 4,755,807 5,710,097 6,068,354 4,665,787 -23.1%Other Financing Sources 9,646,250 11,541,497 13,933,788 186,930 -98.7%
Total 583,500,014 614,225,129 660,982,549 620,514,250 -6.1%
Use of Fund Balance — — — 102,295,338 —
Total Revenues 583,500,014 614,225,129 660,982,549 722,809,588 9.4%
ExpendituresPersonal Services 316,110,345 345,108,409 362,172,331 421,942,142 16.5%Operations 85,952,522 94,782,971 97,541,459 128,052,556 31.3%Debt Service 4,261,187 4,247,451 4,253,750 — -100.0%Intergovernmental 102,645 106,425 108,718 115,000 5.8%Contributions to Other Funds 66,942,182 68,644,408 87,088,493 77,745,055 -10.7%Contributions to Subsidized Agencies 21,379,722 22,148,312 23,135,765 24,235,227 4.8%Contributions to Other Agencies 1,597,000 1,597,000 1,601,985 1,623,500 1.3%Contributions to Capital and Capital Outlay 59,850,376 62,549,516 51,079,834 54,452,732 6.6%Reserves and Contingencies — — — 14,643,376 —
Total Expenditures 556,195,979 599,184,492 626,982,335 722,809,588 15.3%
6 | I I I • FY 2020 Budget Document
GENERAL AND TAX-RELATED SPECIAL REVENUE FUNDS
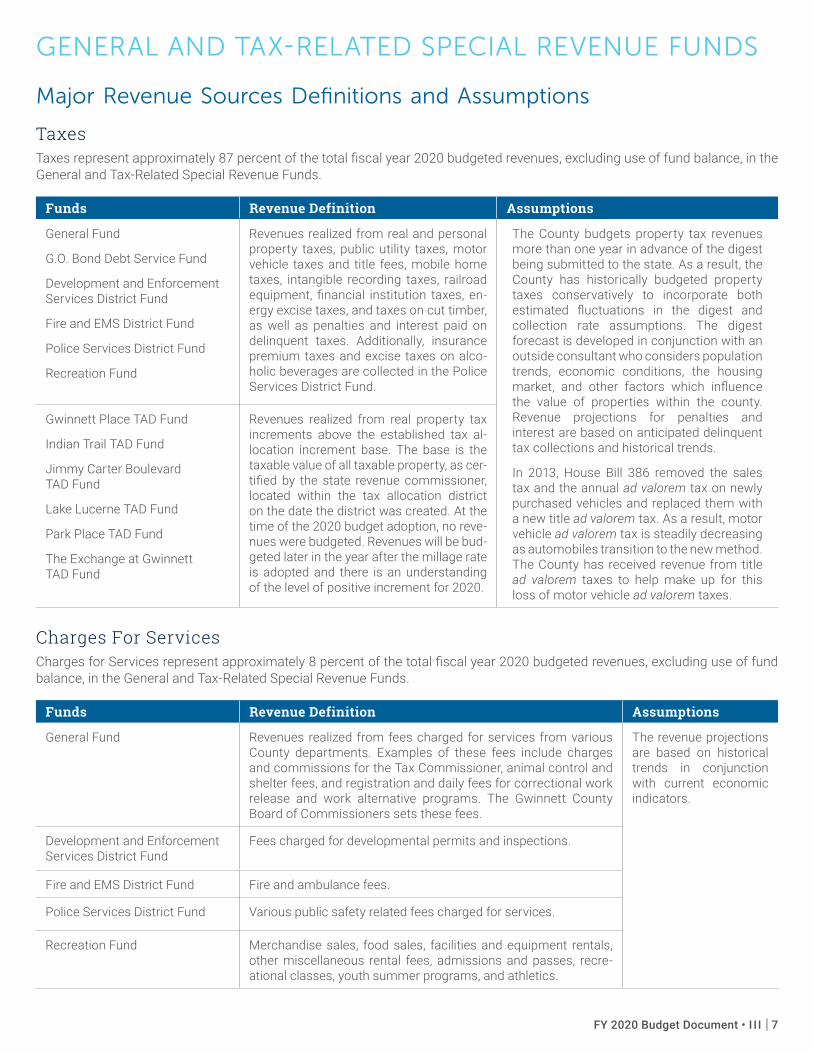
Major Revenue Sources Definitions and Assumptions
TaxesTaxes represent approximately 87 percent of the total fiscal year 2020 budgeted revenues, excluding use of fund balance, in the General and Tax-Related Special Revenue Funds.
Funds Revenue Definition Assumptions
General Fund
G.O. Bond Debt Service Fund
Development and Enforcement Services District Fund
Fire and EMS District Fund
Police Services District Fund
Recreation Fund
Revenues realized from real and personal property taxes, public utility taxes, motor vehicle taxes and title fees, mobile home taxes, intangible recording taxes, railroad equipment, financial institution taxes, en-ergy excise taxes, and taxes on cut timber, as well as penalties and interest paid on delinquent taxes. Additionally, insurance premium taxes and excise taxes on alco-holic beverages are collected in the Police Services District Fund.
The County budgets property tax revenues more than one year in advance of the digest being submitted to the state. As a result, the County has historically budgeted property taxes conservatively to incorporate both estimated fluctuations in the digest and collection rate assumptions. The digest forecast is developed in conjunction with an outside consultant who considers population trends, economic conditions, the housing market, and other factors which influence the value of properties within the county. Revenue projections for penalties and interest are based on anticipated delinquent tax collections and historical trends.
In 2013, House Bill 386 removed the sales tax and the annual ad valorem tax on newly purchased vehicles and replaced them with a new title ad valorem tax. As a result, motor vehicle ad valorem tax is steadily decreasing as automobiles transition to the new method. The County has received revenue from title ad valorem taxes to help make up for this loss of motor vehicle ad valorem taxes.
Gwinnett Place TAD Fund
Indian Trail TAD Fund
Jimmy Carter Boulevard TAD Fund
Lake Lucerne TAD Fund
Park Place TAD Fund
The Exchange at Gwinnett TAD Fund
Revenues realized from real property tax increments above the established tax al-location increment base. The base is the taxable value of all taxable property, as cer-tified by the state revenue commissioner, located within the tax allocation district on the date the district was created. At the time of the 2020 budget adoption, no reve-nues were budgeted. Revenues will be bud-geted later in the year after the millage rate is adopted and there is an understanding of the level of positive increment for 2020.
Charges For ServicesCharges for Services represent approximately 8 percent of the total fiscal year 2020 budgeted revenues, excluding use of fund balance, in the General and Tax-Related Special Revenue Funds.
Funds Revenue Definition Assumptions
General Fund Revenues realized from fees charged for services from various County departments. Examples of these fees include charges and commissions for the Tax Commissioner, animal control and shelter fees, and registration and daily fees for correctional work release and work alternative programs. The Gwinnett County Board of Commissioners sets these fees.
The revenue projections are based on historical trends in conjunction with current economic indicators.
Development and Enforcement Services District Fund
Fees charged for developmental permits and inspections.
Fire and EMS District Fund Fire and ambulance fees.
Police Services District Fund Various public safety related fees charged for services.
Recreation Fund Merchandise sales, food sales, facilities and equipment rentals, other miscellaneous rental fees, admissions and passes, recre-ational classes, youth summer programs, and athletics.
FY 2020 Budget Document • I I I | 7
GENERAL FUND
The General Fund is the primary operating fund for all County revenues and expenditures that are not accounted for in other funds. The County’s General Fund supports services that benefit everyone countywide, such as sheriff, jail, courts, correctional facility, tax commissioner, health and human services, transportation, and elections. This fund also supports various capital projects with contributions to the Capital Project Fund.
In 2020, expenditures of the General Fund are expected to total $368.9 million—an increase of $42.7 million, or 13.1 percent, from 2019 actual expenditures. This increase is primarily attributable to an increase in personal services of $24.3 million, which includes 66 new positions, pay-for-performance salary adjustments, and longevity pay for eligible employees. Other increases for 2020 include an increase in operations of $12.4 million, a $7.4 million appropriation for reserves and contingencies, and an increase in payments to subsidized agencies of $1.0 million. These increases are offset by a decrease of $1.9 million in contri-butions to other funds and a $0.3 million decrease in contributions to capital.
Budgeted Use of Fund Balance in the General Fund totals $42.0 million, which represents a 23.9 percent reduction in the fund’s estimated ending fund balance from 2019 to 2020. With the County’s unreserved fund balance well above the required reserve of three months of normal operating expenditures, this amount is appropriated to balance the budget and allow for reserves and contingencies. Due to salary savings and other budget surpluses, it is anticipated that by the end of 2020 this full amount will not actually be utilized.
8 | I I I • FY 2020 Budget Document
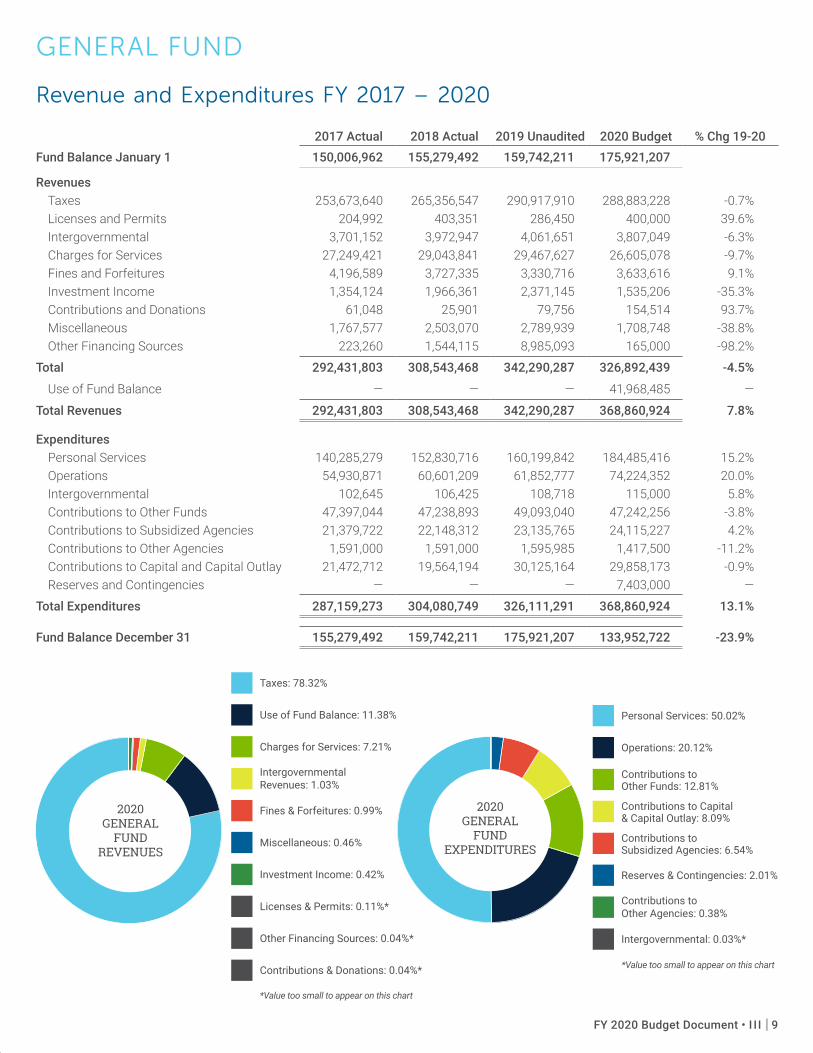
Personal Services: 50.02%
Operations: 20.12%
Contributions to Other Funds: 12.81%
Contributions to Capital & Capital Outlay: 8.09%
Contributions to Subsidized Agencies: 6.54%
Reserves & Contingencies: 2.01%
Contributions to Other Agencies: 0.38%
Intergovernmental: 0.03%*
*Value too small to appear on this chart
Taxes: 78.32%
Use of Fund Balance: 11.38%
Charges for Services: 7.21%
Intergovernmental Revenues: 1.03%
Fines & Forfeitures: 0.99%
Miscellaneous: 0.46%
Investment Income: 0.42%
Licenses & Permits: 0.11%*
Other Financing Sources: 0.04%*
Contributions & Donations: 0.04%*
2020GENERAL
FUND REVENUES
2020GENERAL
FUND EXPENDITURES
*Value too small to appear on this chart
GENERAL FUND
Revenue and Expenditures FY 2017 – 2020
2017 Actual 2018 Actual 2019 Unaudited 2020 Budget % Chg 19-20Fund Balance January 1 150,006,962 155,279,492 159,742,211 175,921,207
RevenuesTaxes 253,673,640 265,356,547 290,917,910 288,883,228 -0.7%Licenses and Permits 204,992 403,351 286,450 400,000 39.6%Intergovernmental 3,701,152 3,972,947 4,061,651 3,807,049 -6.3%Charges for Services 27,249,421 29,043,841 29,467,627 26,605,078 -9.7%Fines and Forfeitures 4,196,589 3,727,335 3,330,716 3,633,616 9.1%Investment Income 1,354,124 1,966,361 2,371,145 1,535,206 -35.3%Contributions and Donations 61,048 25,901 79,756 154,514 93.7%Miscellaneous 1,767,577 2,503,070 2,789,939 1,708,748 -38.8%Other Financing Sources 223,260 1,544,115 8,985,093 165,000 -98.2%
Total 292,431,803 308,543,468 342,290,287 326,892,439 -4.5%
Use of Fund Balance — — — 41,968,485 —
Total Revenues 292,431,803 308,543,468 342,290,287 368,860,924 7.8%
ExpendituresPersonal Services 140,285,279 152,830,716 160,199,842 184,485,416 15.2%Operations 54,930,871 60,601,209 61,852,777 74,224,352 20.0%Intergovernmental 102,645 106,425 108,718 115,000 5.8%Contributions to Other Funds 47,397,044 47,238,893 49,093,040 47,242,256 -3.8%Contributions to Subsidized Agencies 21,379,722 22,148,312 23,135,765 24,115,227 4.2%Contributions to Other Agencies 1,591,000 1,591,000 1,595,985 1,417,500 -11.2%Contributions to Capital and Capital Outlay 21,472,712 19,564,194 30,125,164 29,858,173 -0.9%Reserves and Contingencies — — — 7,403,000 —
Total Expenditures 287,159,273 304,080,749 326,111,291 368,860,924 13.1%
Fund Balance December 31 155,279,492 159,742,211 175,921,207 133,952,722 -23.9%
FY 2020 Budget Document • I I I | 9
GENERAL FUND
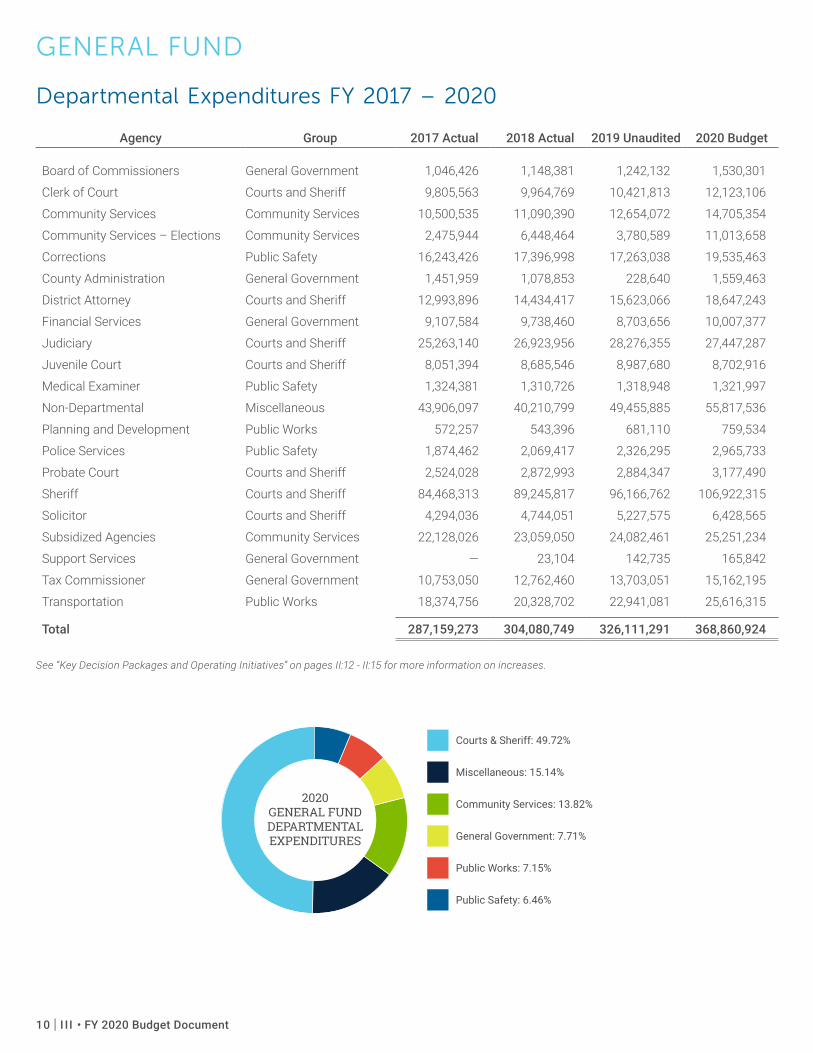
Departmental Expenditures FY 2017 – 2020
Agency Group 2017 Actual 2018 Actual 2019 Unaudited 2020 Budget
Board of Commissioners General Government 1,046,426 1,148,381 1,242,132 1,530,301
Clerk of Court Courts and Sheriff 9,805,563 9,964,769 10,421,813 12,123,106
Community Services Community Services 10,500,535 11,090,390 12,654,072 14,705,354
Community Services – Elections Community Services 2,475,944 6,448,464 3,780,589 11,013,658
Corrections Public Safety 16,243,426 17,396,998 17,263,038 19,535,463
County Administration General Government 1,451,959 1,078,853 228,640 1,559,463
District Attorney Courts and Sheriff 12,993,896 14,434,417 15,623,066 18,647,243
Financial Services General Government 9,107,584 9,738,460 8,703,656 10,007,377
Judiciary Courts and Sheriff 25,263,140 26,923,956 28,276,355 27,447,287
Juvenile Court Courts and Sheriff 8,051,394 8,685,546 8,987,680 8,702,916
Medical Examiner Public Safety 1,324,381 1,310,726 1,318,948 1,321,997
Non-Departmental Miscellaneous 43,906,097 40,210,799 49,455,885 55,817,536
Planning and Development Public Works 572,257 543,396 681,110 759,534
Police Services Public Safety 1,874,462 2,069,417 2,326,295 2,965,733
Probate Court Courts and Sheriff 2,524,028 2,872,993 2,884,347 3,177,490
Sheriff Courts and Sheriff 84,468,313 89,245,817 96,166,762 106,922,315
Solicitor Courts and Sheriff 4,294,036 4,744,051 5,227,575 6,428,565
Subsidized Agencies Community Services 22,128,026 23,059,050 24,082,461 25,251,234
Support Services General Government — 23,104 142,735 165,842
Tax Commissioner General Government 10,753,050 12,762,460 13,703,051 15,162,195
Transportation Public Works 18,374,756 20,328,702 22,941,081 25,616,315
Total 287,159,273 304,080,749 326,111,291 368,860,924
See “Key Decision Packages and Operating Initiatives” on pages II:12 - II:15 for more information on increases.
Courts & Sheriff: 49.72%
Miscellaneous: 15.14%
Community Services: 13.82%
General Government: 7.71%
Public Works: 7.15%
Public Safety: 6.46%
2020GENERAL FUND DEPARTMENTAL EXPENDITURES
Courts & Sheriff: 49.72%
Miscellaneous: 15.14%
Community Services: 13.82%
General Government: 7.71%
Public Works: 7.15%
Public Safety: 6.46%
2020GENERAL FUND DEPARTMENTAL EXPENDITURES
Courts & Sheriff: 49.72%
Miscellaneous: 15.14%
Community Services: 13.82%
General Government: 7.71%
Public Works: 7.15%
Public Safety: 6.46%
2020GENERAL FUND DEPARTMENTAL EXPENDITURES
10 | I I I • FY 2020 Budget Document
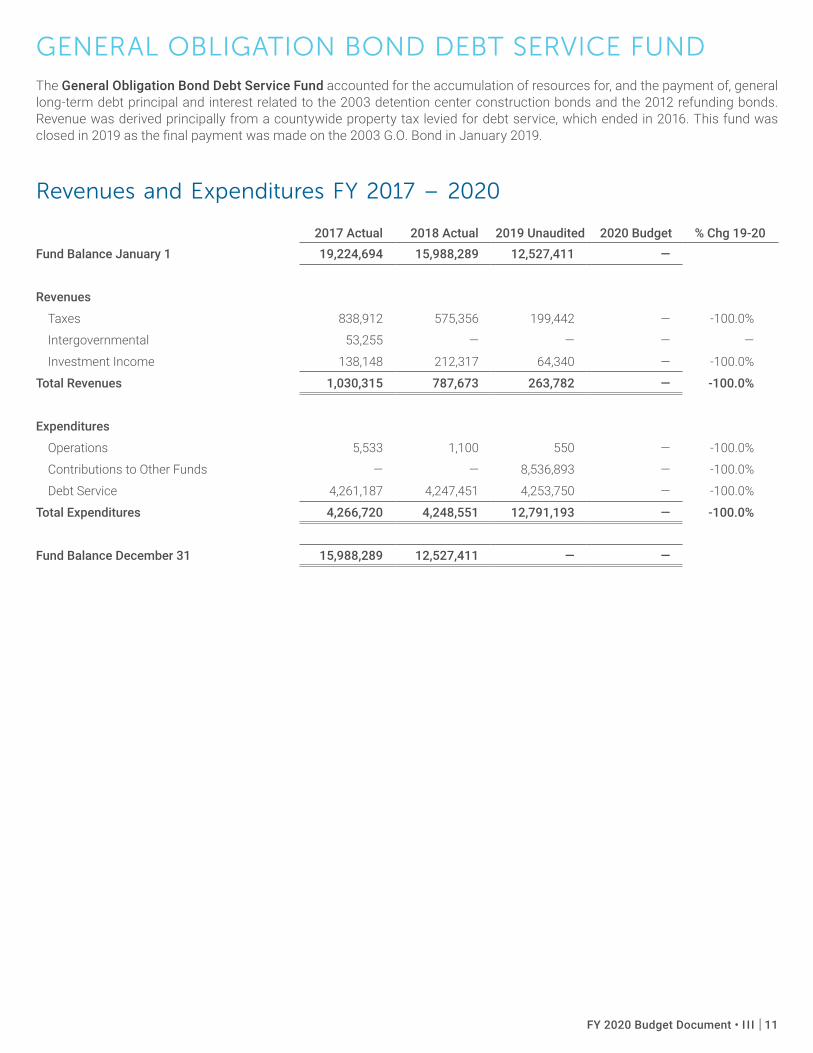
GENERAL OBLIGATION BOND DEBT SERVICE FUNDThe General Obligation Bond Debt Service Fund accounted for the accumulation of resources for, and the payment of, general long-term debt principal and interest related to the 2003 detention center construction bonds and the 2012 refunding bonds. Revenue was derived principally from a countywide property tax levied for debt service, which ended in 2016. This fund was closed in 2019 as the final payment was made on the 2003 G.O. Bond in January 2019.
Revenues and Expenditures FY 2017 – 2020
2017 Actual 2018 Actual 2019 Unaudited 2020 Budget % Chg 19-20Fund Balance January 1 19,224,694 15,988,289 12,527,411 —
Revenues
Taxes 838,912 575,356 199,442 — -100.0%
Intergovernmental 53,255 — — — —
Investment Income 138,148 212,317 64,340 — -100.0%
Total Revenues 1,030,315 787,673 263,782 — -100.0%
Expenditures
Operations 5,533 1,100 550 — -100.0%
Contributions to Other Funds — — 8,536,893 — -100.0%
Debt Service 4,261,187 4,247,451 4,253,750 — -100.0%
Total Expenditures 4,266,720 4,248,551 12,791,193 — -100.0%
Fund Balance December 31 15,988,289 12,527,411 — —
FY 2020 Budget Document • I I I | 11
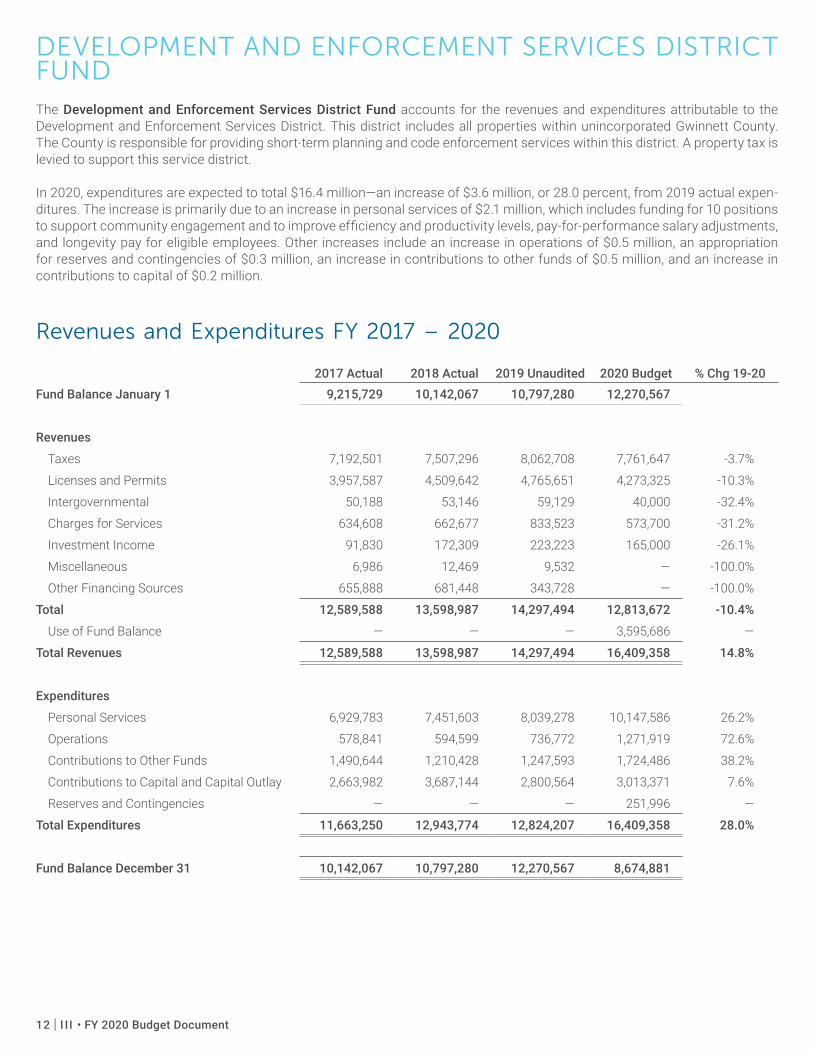
DEVELOPMENT AND ENFORCEMENT SERVICES DISTRICT FUNDThe Development and Enforcement Services District Fund accounts for the revenues and expenditures attributable to the Development and Enforcement Services District. This district includes all properties within unincorporated Gwinnett County. The County is responsible for providing short-term planning and code enforcement services within this district. A property tax is levied to support this service district.
In 2020, expenditures are expected to total $16.4 million—an increase of $3.6 million, or 28.0 percent, from 2019 actual expen-ditures. The increase is primarily due to an increase in personal services of $2.1 million, which includes funding for 10 positions to support community engagement and to improve efficiency and productivity levels, pay-for-performance salary adjustments, and longevity pay for eligible employees. Other increases include an increase in operations of $0.5 million, an appropriation for reserves and contingencies of $0.3 million, an increase in contributions to other funds of $0.5 million, and an increase in contributions to capital of $0.2 million.
Revenues and Expenditures FY 2017 – 2020
2017 Actual 2018 Actual 2019 Unaudited 2020 Budget % Chg 19-20Fund Balance January 1 9,215,729 10,142,067 10,797,280 12,270,567
Revenues
Taxes 7,192,501 7,507,296 8,062,708 7,761,647 -3.7%
Licenses and Permits 3,957,587 4,509,642 4,765,651 4,273,325 -10.3%
Intergovernmental 50,188 53,146 59,129 40,000 -32.4%
Charges for Services 634,608 662,677 833,523 573,700 -31.2%
Investment Income 91,830 172,309 223,223 165,000 -26.1%
Miscellaneous 6,986 12,469 9,532 — -100.0%
Other Financing Sources 655,888 681,448 343,728 — -100.0%
Total 12,589,588 13,598,987 14,297,494 12,813,672 -10.4%
Use of Fund Balance — — — 3,595,686 —
Total Revenues 12,589,588 13,598,987 14,297,494 16,409,358 14.8%
Expenditures
Personal Services 6,929,783 7,451,603 8,039,278 10,147,586 26.2%
Operations 578,841 594,599 736,772 1,271,919 72.6%
Contributions to Other Funds 1,490,644 1,210,428 1,247,593 1,724,486 38.2%
Contributions to Capital and Capital Outlay 2,663,982 3,687,144 2,800,564 3,013,371 7.6%
Reserves and Contingencies — — — 251,996 —
Total Expenditures 11,663,250 12,943,774 12,824,207 16,409,358 28.0%
Fund Balance December 31 10,142,067 10,797,280 12,270,567 8,674,881
12 | I I I • FY 2020 Budget Document
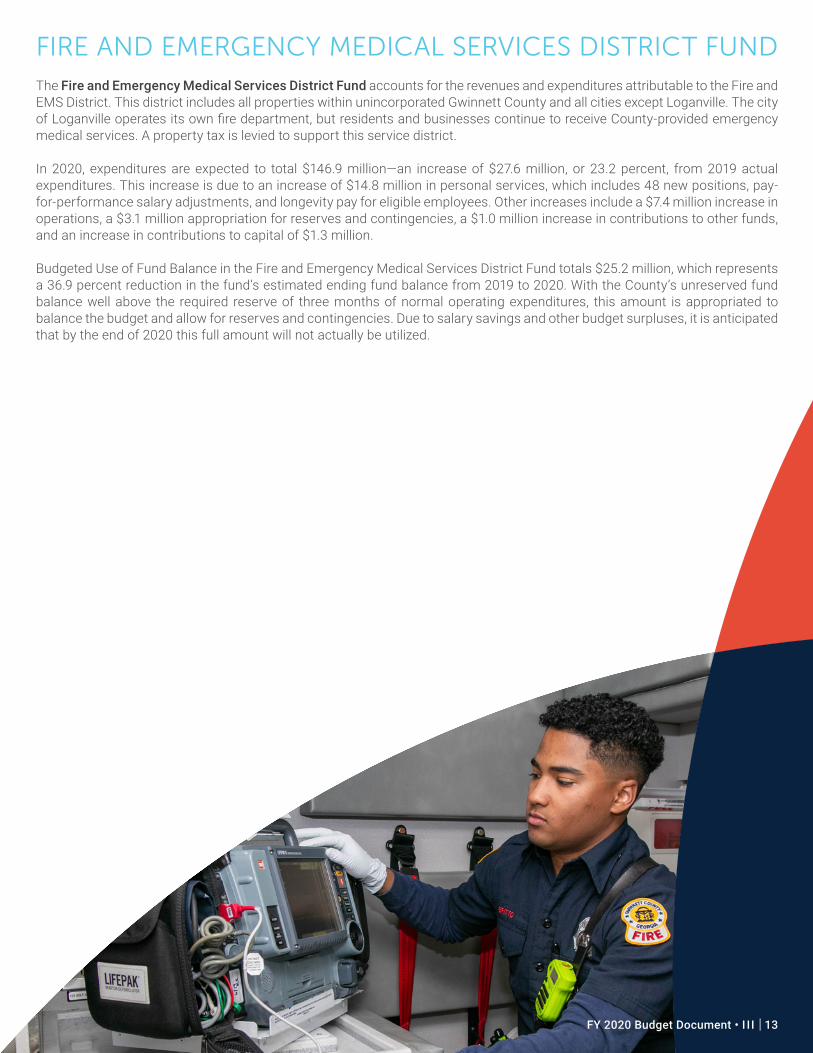
FIRE AND EMERGENCY MEDICAL SERVICES DISTRICT FUNDThe Fire and Emergency Medical Services District Fund accounts for the revenues and expenditures attributable to the Fire and EMS District. This district includes all properties within unincorporated Gwinnett County and all cities except Loganville. The city of Loganville operates its own fire department, but residents and businesses continue to receive County-provided emergency medical services. A property tax is levied to support this service district.
In 2020, expenditures are expected to total $146.9 million—an increase of $27.6 million, or 23.2 percent, from 2019 actual expenditures. This increase is due to an increase of $14.8 million in personal services, which includes 48 new positions, pay-for-performance salary adjustments, and longevity pay for eligible employees. Other increases include a $7.4 million increase in operations, a $3.1 million appropriation for reserves and contingencies, a $1.0 million increase in contributions to other funds, and an increase in contributions to capital of $1.3 million.
Budgeted Use of Fund Balance in the Fire and Emergency Medical Services District Fund totals $25.2 million, which represents a 36.9 percent reduction in the fund’s estimated ending fund balance from 2019 to 2020. With the County’s unreserved fund balance well above the required reserve of three months of normal operating expenditures, this amount is appropriated to balance the budget and allow for reserves and contingencies. Due to salary savings and other budget surpluses, it is anticipated that by the end of 2020 this full amount will not actually be utilized.
FY 2020 Budget Document • I I I | 13
Taxes: 70.74%
Use of Fund Balance: 17.15%
Charges for Services: 10.63%
Licenses & Permits: 0.62%
Intergovernmental Revenues: 0.46%
Investment Income: 0.40%
Miscellaneous: <0.01%*
*Value too small to appear on this chart
2020FIRE & EMS
DISTRICT FUND REVENUES
Personal Services: 70.85%
Operations: 12.52%
Contributions to Other Funds: 7.44%
Contributions to Capital & Capital Outlay: 7.07%
Reserves & Contingencies: 2.12%
2020FIRE & EMS
DISTRICT FUND EXPENDITURES
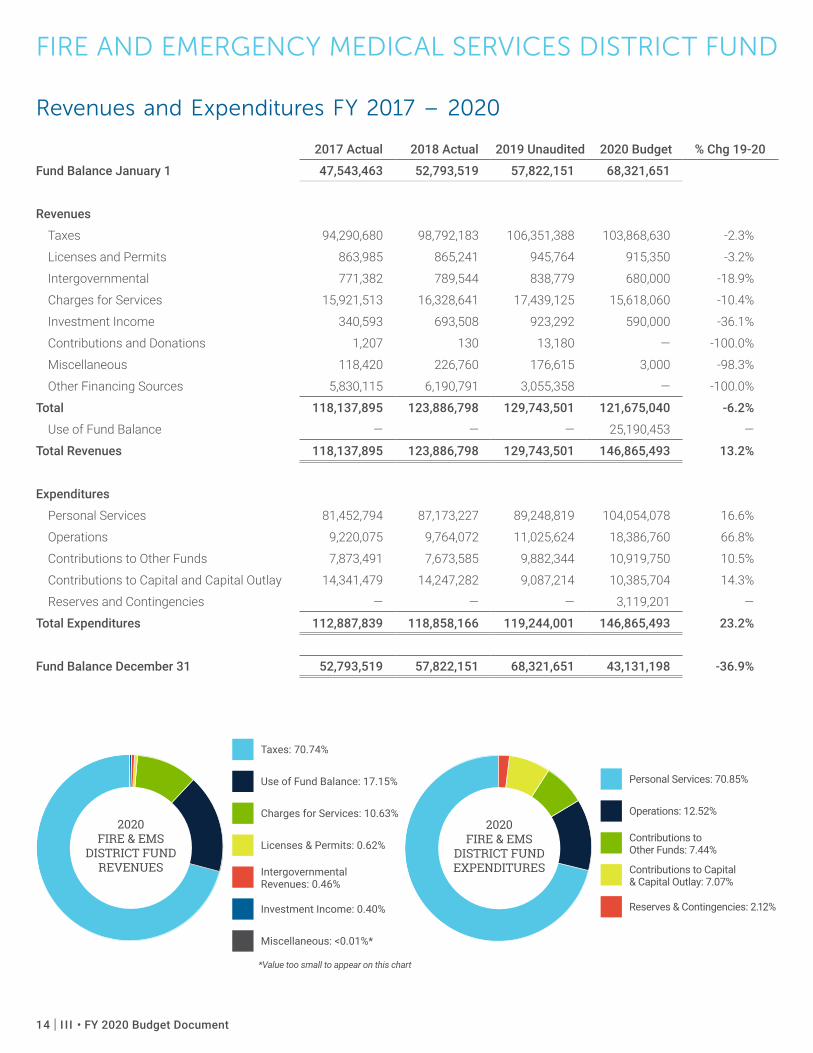
FIRE AND EMERGENCY MEDICAL SERVICES DISTRICT FUND
Revenues and Expenditures FY 2017 – 2020
2017 Actual 2018 Actual 2019 Unaudited 2020 Budget % Chg 19-20
Fund Balance January 1 47,543,463 52,793,519 57,822,151 68,321,651
Revenues
Taxes 94,290,680 98,792,183 106,351,388 103,868,630 -2.3%
Licenses and Permits 863,985 865,241 945,764 915,350 -3.2%
Intergovernmental 771,382 789,544 838,779 680,000 -18.9%
Charges for Services 15,921,513 16,328,641 17,439,125 15,618,060 -10.4%
Investment Income 340,593 693,508 923,292 590,000 -36.1%
Contributions and Donations 1,207 130 13,180 — -100.0%
Miscellaneous 118,420 226,760 176,615 3,000 -98.3%
Other Financing Sources 5,830,115 6,190,791 3,055,358 — -100.0%
Total 118,137,895 123,886,798 129,743,501 121,675,040 -6.2%
Use of Fund Balance — — — 25,190,453 —
Total Revenues 118,137,895 123,886,798 129,743,501 146,865,493 13.2%
Expenditures
Personal Services 81,452,794 87,173,227 89,248,819 104,054,078 16.6%
Operations 9,220,075 9,764,072 11,025,624 18,386,760 66.8%
Contributions to Other Funds 7,873,491 7,673,585 9,882,344 10,919,750 10.5%
Contributions to Capital and Capital Outlay 14,341,479 14,247,282 9,087,214 10,385,704 14.3%
Reserves and Contingencies — — — 3,119,201 —
Total Expenditures 112,887,839 118,858,166 119,244,001 146,865,493 23.2%
Fund Balance December 31 52,793,519 57,822,151 68,321,651 43,131,198 -36.9%
14 | I I I • FY 2020 Budget Document
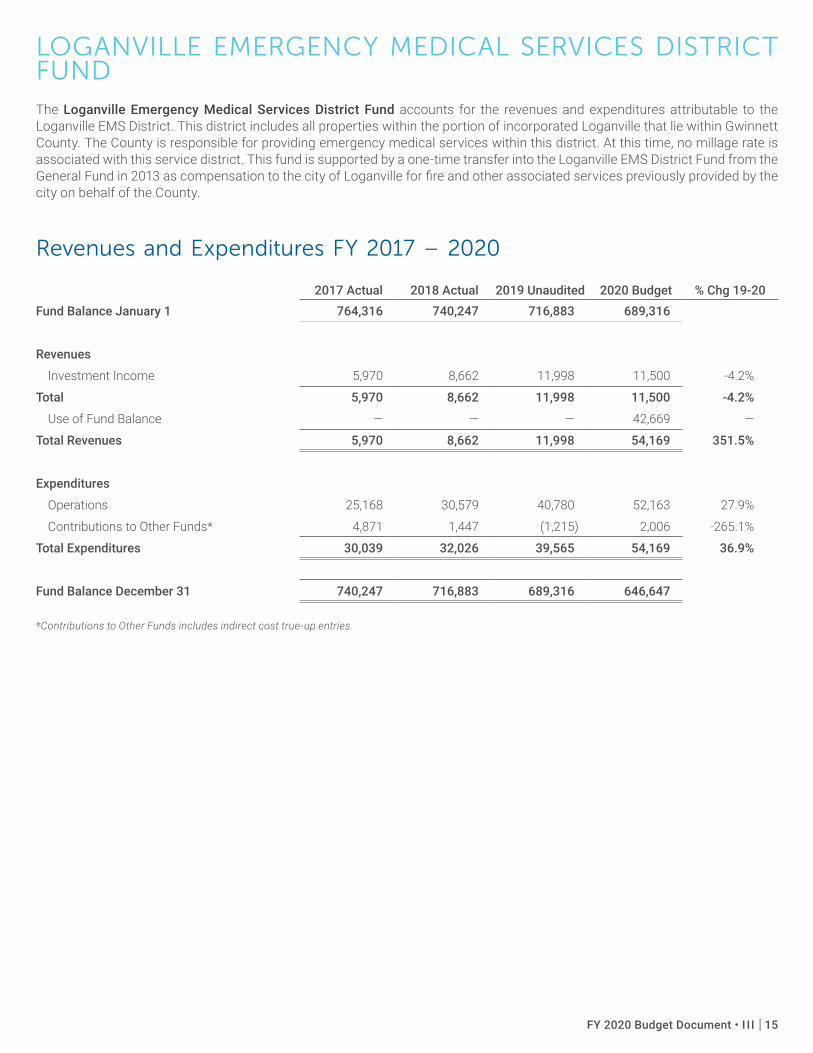
LOGANVILLE EMERGENCY MEDICAL SERVICES DISTRICT FUNDThe Loganville Emergency Medical Services District Fund accounts for the revenues and expenditures attributable to the Loganville EMS District. This district includes all properties within the portion of incorporated Loganville that lie within Gwinnett County. The County is responsible for providing emergency medical services within this district. At this time, no millage rate is associated with this service district. This fund is supported by a one-time transfer into the Loganville EMS District Fund from the General Fund in 2013 as compensation to the city of Loganville for fire and other associated services previously provided by the city on behalf of the County.
Revenues and Expenditures FY 2017 – 2020
2017 Actual 2018 Actual 2019 Unaudited 2020 Budget % Chg 19-20Fund Balance January 1 764,316 740,247 716,883 689,316
Revenues
Investment Income 5,970 8,662 11,998 11,500 -4.2%
Total 5,970 8,662 11,998 11,500 -4.2%
Use of Fund Balance — — — 42,669 —
Total Revenues 5,970 8,662 11,998 54,169 351.5%
Expenditures
Operations 25,168 30,579 40,780 52,163 27.9%
Contributions to Other Funds* 4,871 1,447 (1,215) 2,006 -265.1%
Total Expenditures 30,039 32,026 39,565 54,169 36.9%
Fund Balance December 31 740,247 716,883 689,316 646,647
*Contributions to Other Funds includes indirect cost true-up entries.
FY 2020 Budget Document • I I I | 15
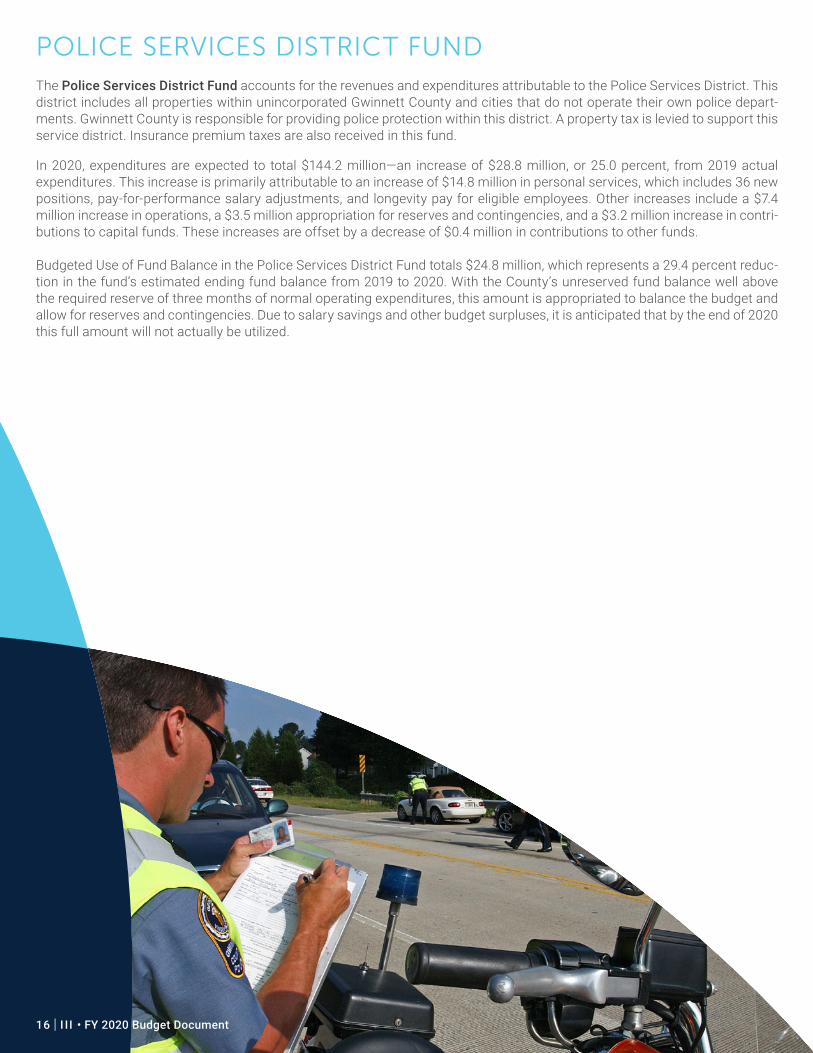
POLICE SERVICES DISTRICT FUNDThe Police Services District Fund accounts for the revenues and expenditures attributable to the Police Services District. This district includes all properties within unincorporated Gwinnett County and cities that do not operate their own police depart-ments. Gwinnett County is responsible for providing police protection within this district. A property tax is levied to support this service district. Insurance premium taxes are also received in this fund.
In 2020, expenditures are expected to total $144.2 million—an increase of $28.8 million, or 25.0 percent, from 2019 actual expenditures. This increase is primarily attributable to an increase of $14.8 million in personal services, which includes 36 new positions, pay-for-performance salary adjustments, and longevity pay for eligible employees. Other increases include a $7.4 million increase in operations, a $3.5 million appropriation for reserves and contingencies, and a $3.2 million increase in contri-butions to capital funds. These increases are offset by a decrease of $0.4 million in contributions to other funds.
Budgeted Use of Fund Balance in the Police Services District Fund totals $24.8 million, which represents a 29.4 percent reduc-tion in the fund’s estimated ending fund balance from 2019 to 2020. With the County’s unreserved fund balance well above the required reserve of three months of normal operating expenditures, this amount is appropriated to balance the budget and allow for reserves and contingencies. Due to salary savings and other budget surpluses, it is anticipated that by the end of 2020 this full amount will not actually be utilized.
16 | I I I • FY 2020 Budget Document
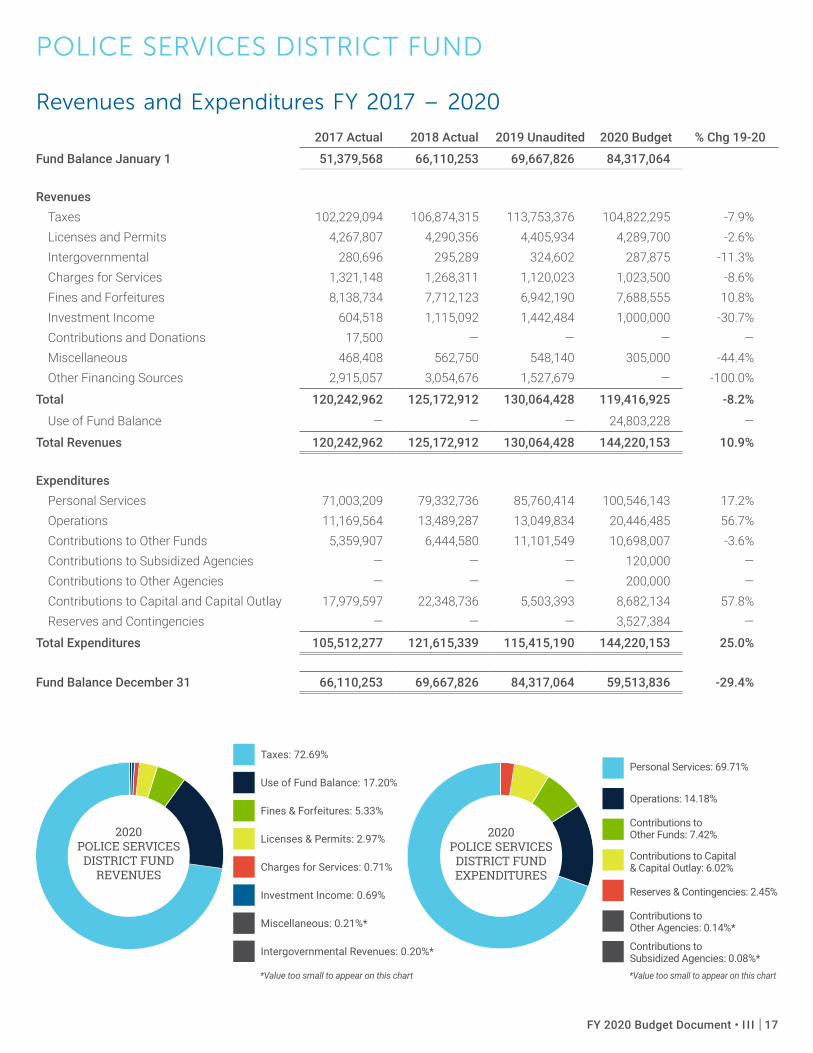
Taxes: 72.69%
Use of Fund Balance: 17.20%
Fines & Forfeitures: 5.33%
Licenses & Permits: 2.97%
Charges for Services: 0.71%
Investment Income: 0.69%
Miscellaneous: 0.21%*
Intergovernmental Revenues: 0.20%*
*Value too small to appear on this chart
2020POLICE SERVICES
DISTRICT FUND REVENUES
Personal Services: 69.71%
Operations: 14.18%
Contributions to Other Funds: 7.42%
Contributions to Capital & Capital Outlay: 6.02%
Reserves & Contingencies: 2.45%
Contributions to Other Agencies: 0.14%*
Contributions to Subsidized Agencies: 0.08%*
2020POLICE SERVICES
DISTRICT FUND EXPENDITURES
*Value too small to appear on this chart
POLICE SERVICES DISTRICT FUND
Revenues and Expenditures FY 2017 – 2020
2017 Actual 2018 Actual 2019 Unaudited 2020 Budget % Chg 19-20
Fund Balance January 1 51,379,568 66,110,253 69,667,826 84,317,064
RevenuesTaxes 102,229,094 106,874,315 113,753,376 104,822,295 -7.9%Licenses and Permits 4,267,807 4,290,356 4,405,934 4,289,700 -2.6%Intergovernmental 280,696 295,289 324,602 287,875 -11.3%Charges for Services 1,321,148 1,268,311 1,120,023 1,023,500 -8.6%Fines and Forfeitures 8,138,734 7,712,123 6,942,190 7,688,555 10.8%Investment Income 604,518 1,115,092 1,442,484 1,000,000 -30.7%Contributions and Donations 17,500 — — — —Miscellaneous 468,408 562,750 548,140 305,000 -44.4%Other Financing Sources 2,915,057 3,054,676 1,527,679 — -100.0%
Total 120,242,962 125,172,912 130,064,428 119,416,925 -8.2%
Use of Fund Balance — — — 24,803,228 —
Total Revenues 120,242,962 125,172,912 130,064,428 144,220,153 10.9%
ExpendituresPersonal Services 71,003,209 79,332,736 85,760,414 100,546,143 17.2%Operations 11,169,564 13,489,287 13,049,834 20,446,485 56.7%Contributions to Other Funds 5,359,907 6,444,580 11,101,549 10,698,007 -3.6%Contributions to Subsidized Agencies — — — 120,000 —Contributions to Other Agencies — — — 200,000 —Contributions to Capital and Capital Outlay 17,979,597 22,348,736 5,503,393 8,682,134 57.8%Reserves and Contingencies — — — 3,527,384 —
Total Expenditures 105,512,277 121,615,339 115,415,190 144,220,153 25.0%
Fund Balance December 31 66,110,253 69,667,826 84,317,064 59,513,836 -29.4%
FY 2020 Budget Document • I I I | 17
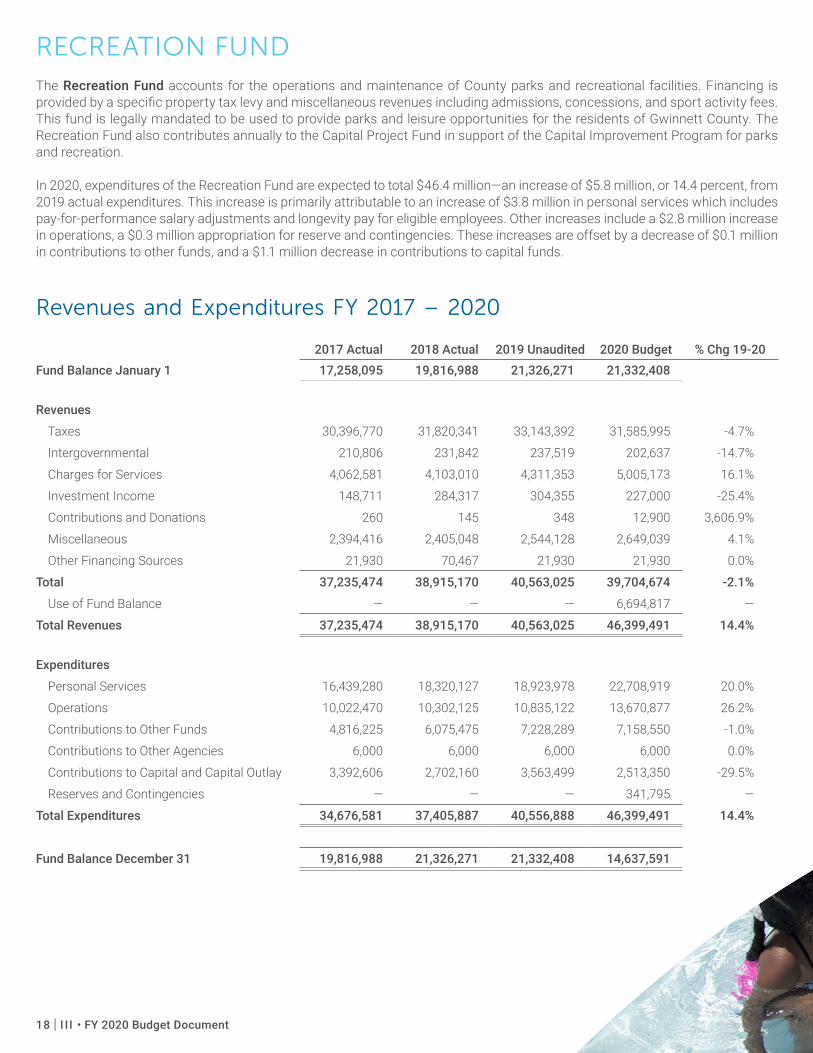
RECREATION FUNDThe Recreation Fund accounts for the operations and maintenance of County parks and recreational facilities. Financing is provided by a specific property tax levy and miscellaneous revenues including admissions, concessions, and sport activity fees. This fund is legally mandated to be used to provide parks and leisure opportunities for the residents of Gwinnett County. The Recreation Fund also contributes annually to the Capital Project Fund in support of the Capital Improvement Program for parks and recreation.
In 2020, expenditures of the Recreation Fund are expected to total $46.4 million—an increase of $5.8 million, or 14.4 percent, from 2019 actual expenditures. This increase is primarily attributable to an increase of $3.8 million in personal services which includes pay-for-performance salary adjustments and longevity pay for eligible employees. Other increases include a $2.8 million increase in operations, a $0.3 million appropriation for reserve and contingencies. These increases are offset by a decrease of $0.1 million in contributions to other funds, and a $1.1 million decrease in contributions to capital funds.
Revenues and Expenditures FY 2017 – 2020
2017 Actual 2018 Actual 2019 Unaudited 2020 Budget % Chg 19-20Fund Balance January 1 17,258,095 19,816,988 21,326,271 21,332,408
Revenues
Taxes 30,396,770 31,820,341 33,143,392 31,585,995 -4.7%
Intergovernmental 210,806 231,842 237,519 202,637 -14.7%
Charges for Services 4,062,581 4,103,010 4,311,353 5,005,173 16.1%
Investment Income 148,711 284,317 304,355 227,000 -25.4%
Contributions and Donations 260 145 348 12,900 3,606.9%
Miscellaneous 2,394,416 2,405,048 2,544,128 2,649,039 4.1%
Other Financing Sources 21,930 70,467 21,930 21,930 0.0%
Total 37,235,474 38,915,170 40,563,025 39,704,674 -2.1%
Use of Fund Balance — — — 6,694,817 —
Total Revenues 37,235,474 38,915,170 40,563,025 46,399,491 14.4%
Expenditures
Personal Services 16,439,280 18,320,127 18,923,978 22,708,919 20.0%
Operations 10,022,470 10,302,125 10,835,122 13,670,877 26.2%
Contributions to Other Funds 4,816,225 6,075,475 7,228,289 7,158,550 -1.0%
Contributions to Other Agencies 6,000 6,000 6,000 6,000 0.0%
Contributions to Capital and Capital Outlay 3,392,606 2,702,160 3,563,499 2,513,350 -29.5%
Reserves and Contingencies — — — 341,795 —
Total Expenditures 34,676,581 37,405,887 40,556,888 46,399,491 14.4%
Fund Balance December 31 19,816,988 21,326,271 21,332,408 14,637,591
18 | I I I • FY 2020 Budget Document
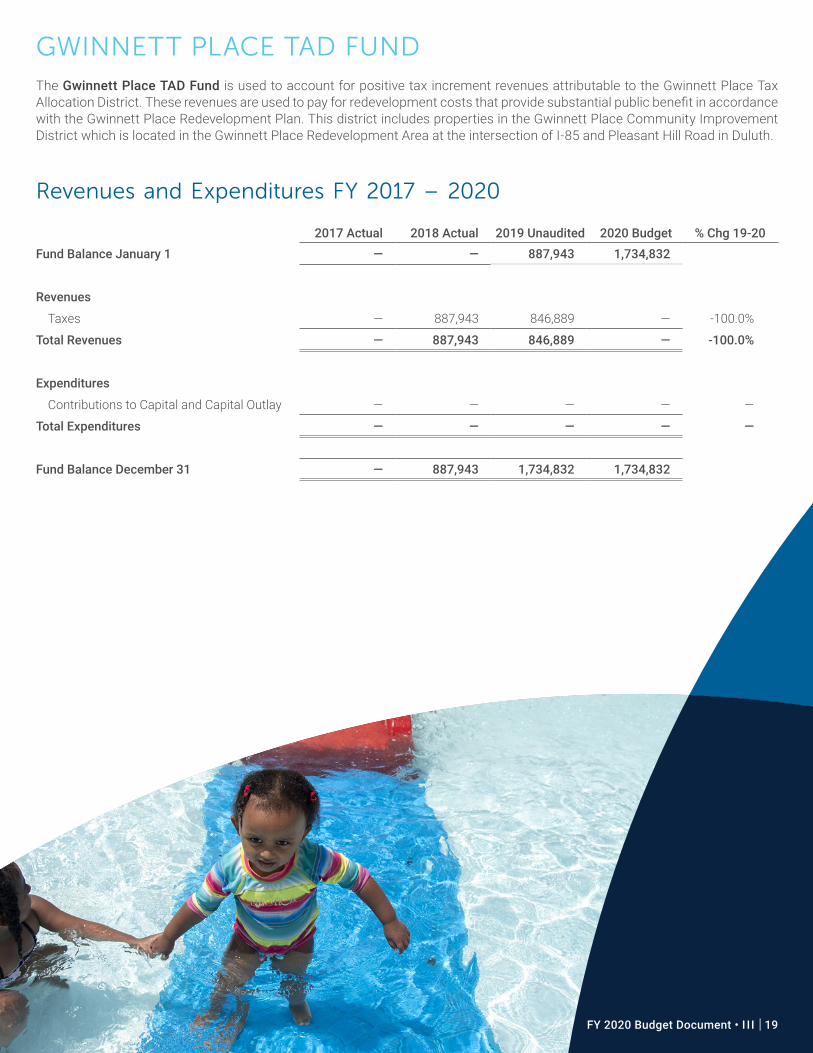
GWINNETT PLACE TAD FUNDThe Gwinnett Place TAD Fund is used to account for positive tax increment revenues attributable to the Gwinnett Place Tax Allocation District. These revenues are used to pay for redevelopment costs that provide substantial public benefit in accordance with the Gwinnett Place Redevelopment Plan. This district includes properties in the Gwinnett Place Community Improvement District which is located in the Gwinnett Place Redevelopment Area at the intersection of I-85 and Pleasant Hill Road in Duluth.
Revenues and Expenditures FY 2017 – 2020
2017 Actual 2018 Actual 2019 Unaudited 2020 Budget % Chg 19-20Fund Balance January 1 — — 887,943 1,734,832
Revenues
Taxes — 887,943 846,889 — -100.0%
Total Revenues — 887,943 846,889 — -100.0%
Expenditures
Contributions to Capital and Capital Outlay — — — — —
Total Expenditures — — — — —
Fund Balance December 31 — 887,943 1,734,832 1,734,832
FY 2020 Budget Document • I I I | 19
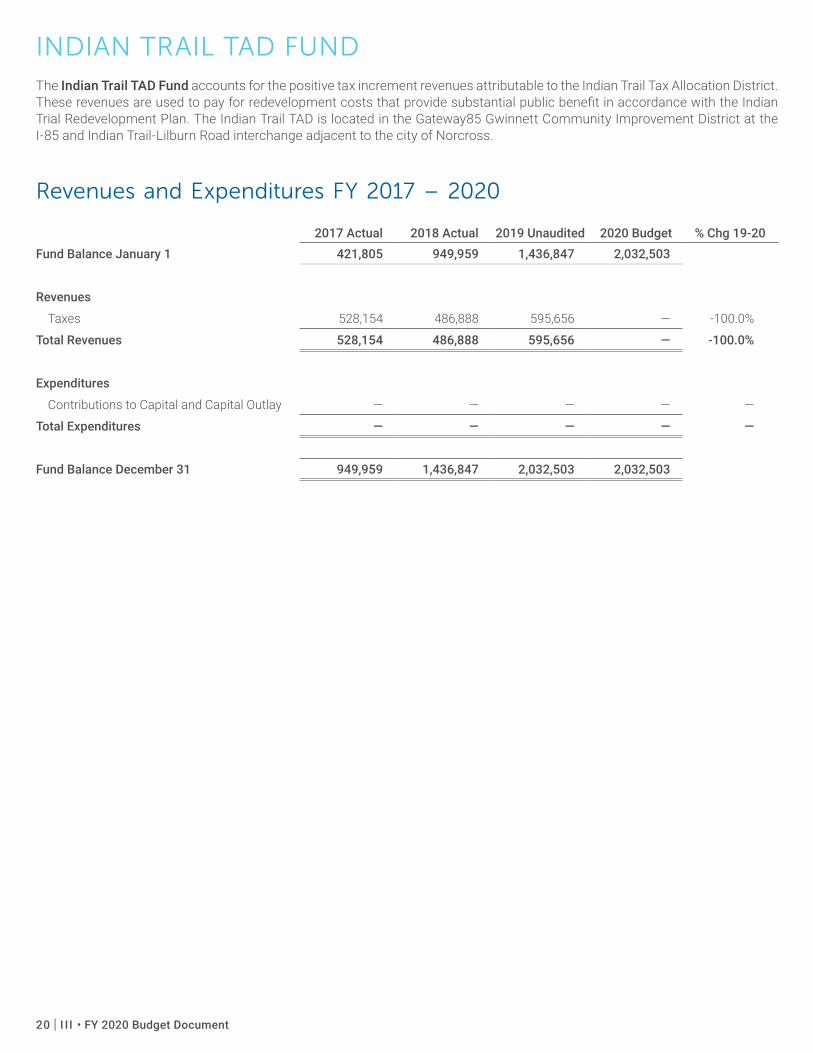
INDIAN TRAIL TAD FUNDThe Indian Trail TAD Fund accounts for the positive tax increment revenues attributable to the Indian Trail Tax Allocation District. These revenues are used to pay for redevelopment costs that provide substantial public benefit in accordance with the Indian Trial Redevelopment Plan. The Indian Trail TAD is located in the Gateway85 Gwinnett Community Improvement District at the I-85 and Indian Trail-Lilburn Road interchange adjacent to the city of Norcross.
Revenues and Expenditures FY 2017 – 2020
2017 Actual 2018 Actual 2019 Unaudited 2020 Budget % Chg 19-20Fund Balance January 1 421,805 949,959 1,436,847 2,032,503
Revenues
Taxes 528,154 486,888 595,656 — -100.0%
Total Revenues 528,154 486,888 595,656 — -100.0%
Expenditures
Contributions to Capital and Capital Outlay — — — — —
Total Expenditures — — — — —
Fund Balance December 31 949,959 1,436,847 2,032,503 2,032,503
20 | I I I • FY 2020 Budget Document
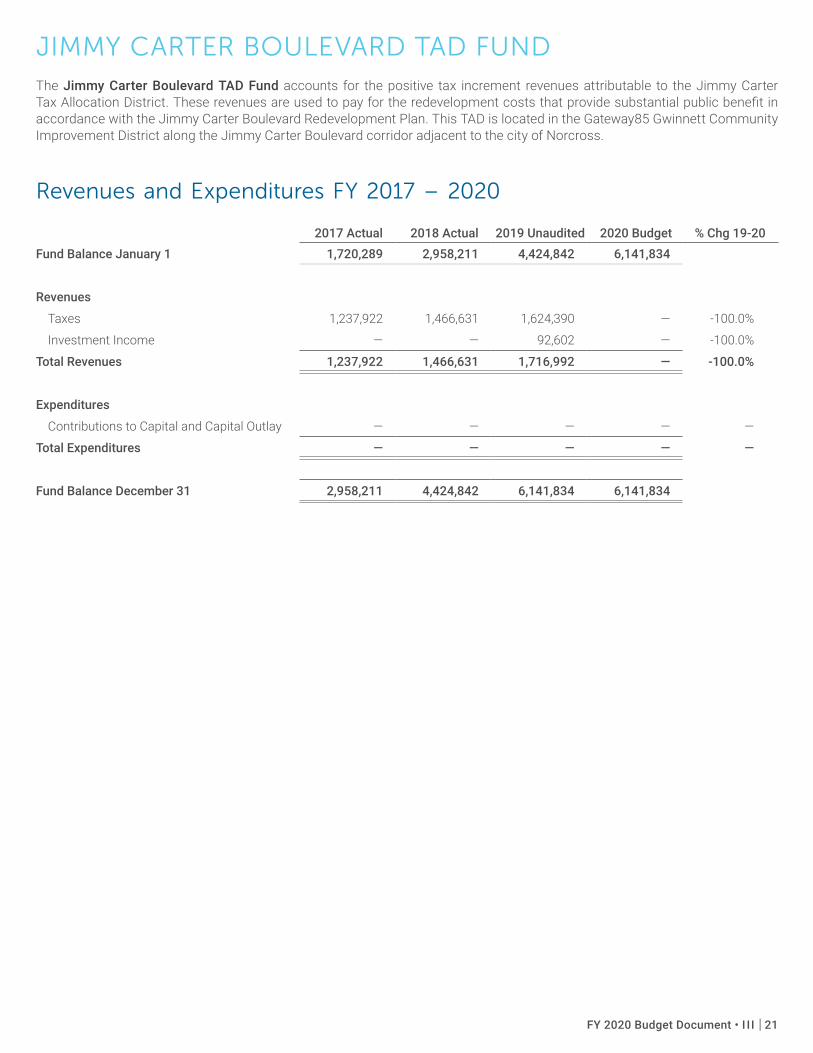
JIMMY CARTER BOULEVARD TAD FUNDThe Jimmy Carter Boulevard TAD Fund accounts for the positive tax increment revenues attributable to the Jimmy Carter Tax Allocation District. These revenues are used to pay for the redevelopment costs that provide substantial public benefit in accordance with the Jimmy Carter Boulevard Redevelopment Plan. This TAD is located in the Gateway85 Gwinnett Community Improvement District along the Jimmy Carter Boulevard corridor adjacent to the city of Norcross.
Revenues and Expenditures FY 2017 – 2020
2017 Actual 2018 Actual 2019 Unaudited 2020 Budget % Chg 19-20Fund Balance January 1 1,720,289 2,958,211 4,424,842 6,141,834
Revenues
Taxes 1,237,922 1,466,631 1,624,390 — -100.0%
Investment Income — — 92,602 — -100.0%
Total Revenues 1,237,922 1,466,631 1,716,992 — -100.0%
Expenditures
Contributions to Capital and Capital Outlay — — — — —
Total Expenditures — — — — —
Fund Balance December 31 2,958,211 4,424,842 6,141,834 6,141,834
FY 2020 Budget Document • I I I | 21
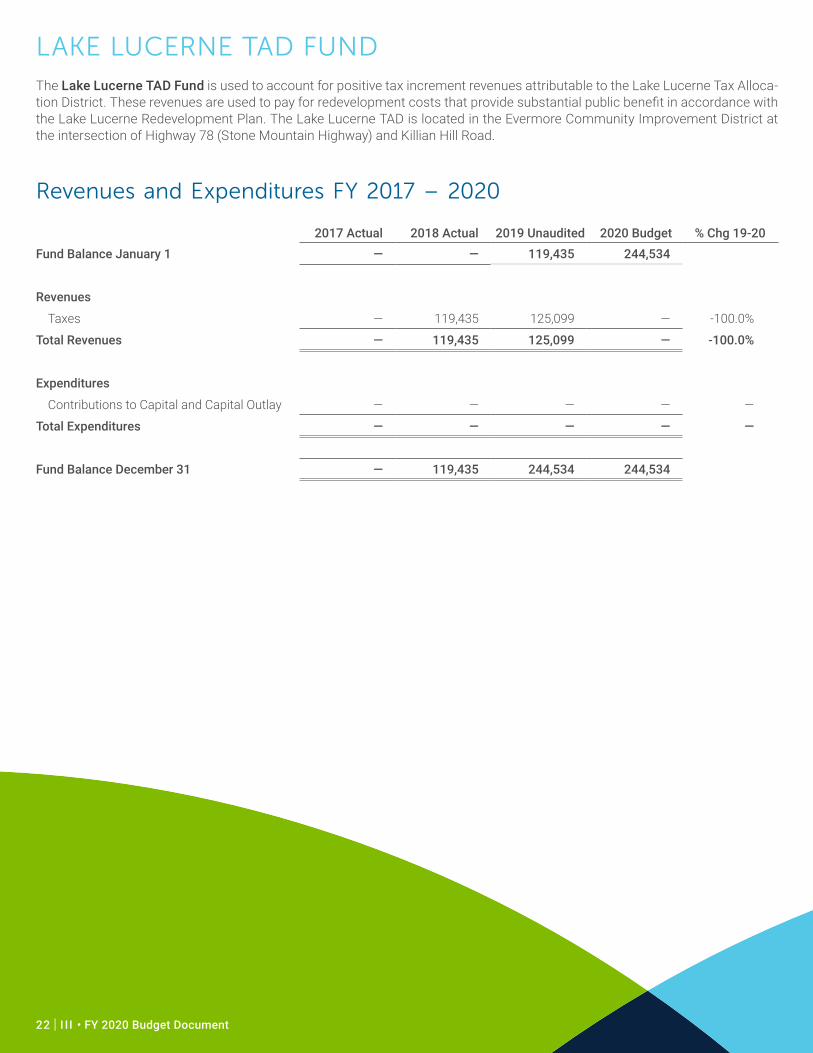
LAKE LUCERNE TAD FUNDThe Lake Lucerne TAD Fund is used to account for positive tax increment revenues attributable to the Lake Lucerne Tax Alloca-tion District. These revenues are used to pay for redevelopment costs that provide substantial public benefit in accordance with the Lake Lucerne Redevelopment Plan. The Lake Lucerne TAD is located in the Evermore Community Improvement District at the intersection of Highway 78 (Stone Mountain Highway) and Killian Hill Road.
Revenues and Expenditures FY 2017 – 2020
2017 Actual 2018 Actual 2019 Unaudited 2020 Budget % Chg 19-20Fund Balance January 1 — — 119,435 244,534
Revenues
Taxes — 119,435 125,099 — -100.0%
Total Revenues — 119,435 125,099 — -100.0%
Expenditures
Contributions to Capital and Capital Outlay — — — — —
Total Expenditures — — — — —
Fund Balance December 31 — 119,435 244,534 244,534
22 | I I I • FY 2020 Budget Document
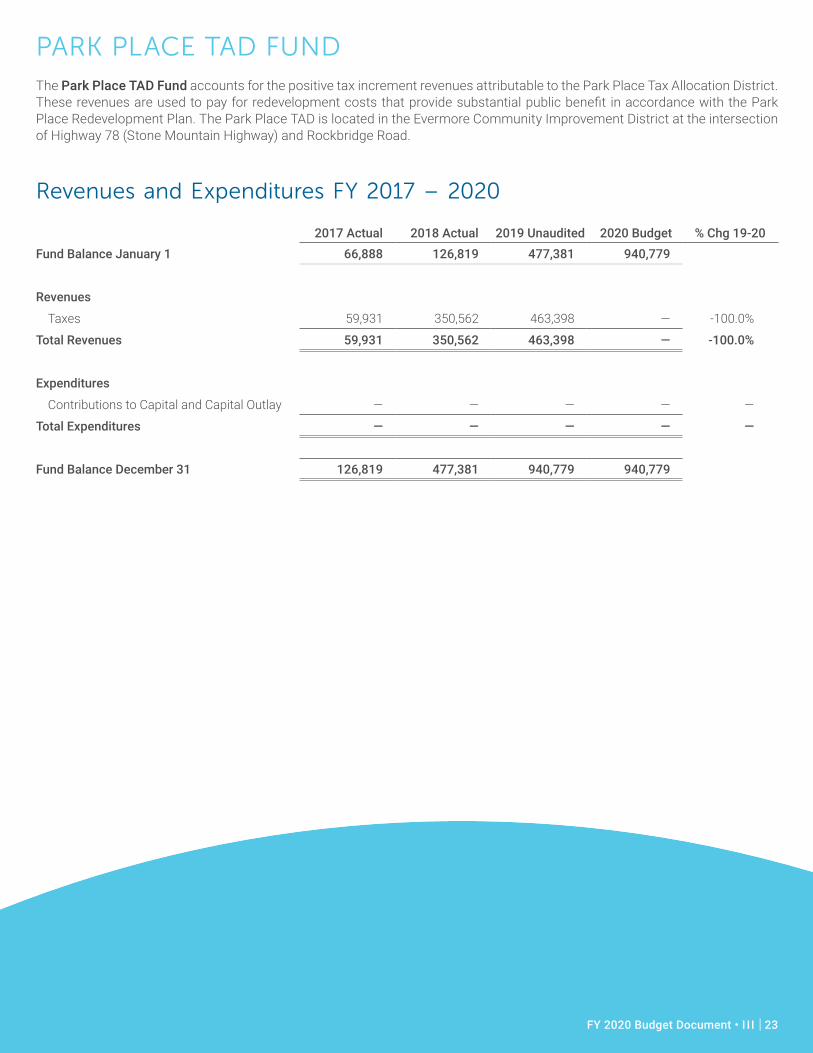
PARK PLACE TAD FUNDThe Park Place TAD Fund accounts for the positive tax increment revenues attributable to the Park Place Tax Allocation District. These revenues are used to pay for redevelopment costs that provide substantial public benefit in accordance with the Park Place Redevelopment Plan. The Park Place TAD is located in the Evermore Community Improvement District at the intersection of Highway 78 (Stone Mountain Highway) and Rockbridge Road.
Revenues and Expenditures FY 2017 – 2020
2017 Actual 2018 Actual 2019 Unaudited 2020 Budget % Chg 19-20Fund Balance January 1 66,888 126,819 477,381 940,779
Revenues
Taxes 59,931 350,562 463,398 — -100.0%
Total Revenues 59,931 350,562 463,398 — -100.0%
Expenditures
Contributions to Capital and Capital Outlay — — — — —
Total Expenditures — — — — —
Fund Balance December 31 126,819 477,381 940,779 940,779
FY 2020 Budget Document • I I I | 23

OTHER SPECIAL REVENUE FUNDS
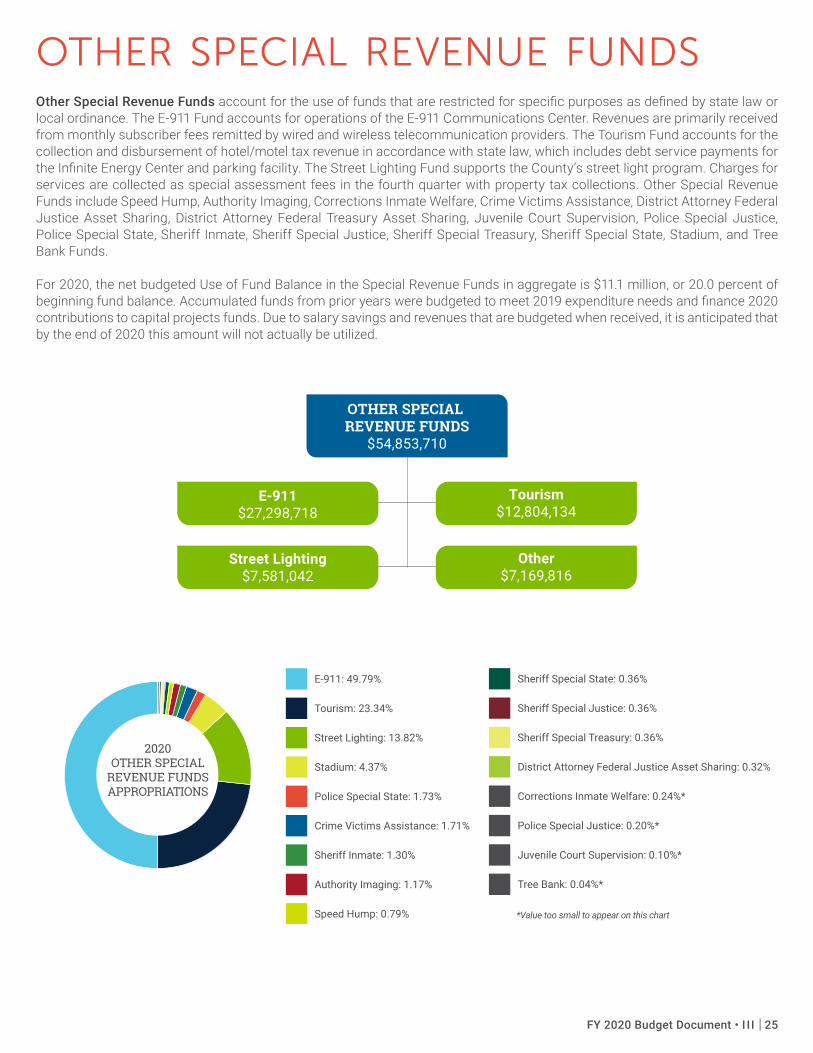
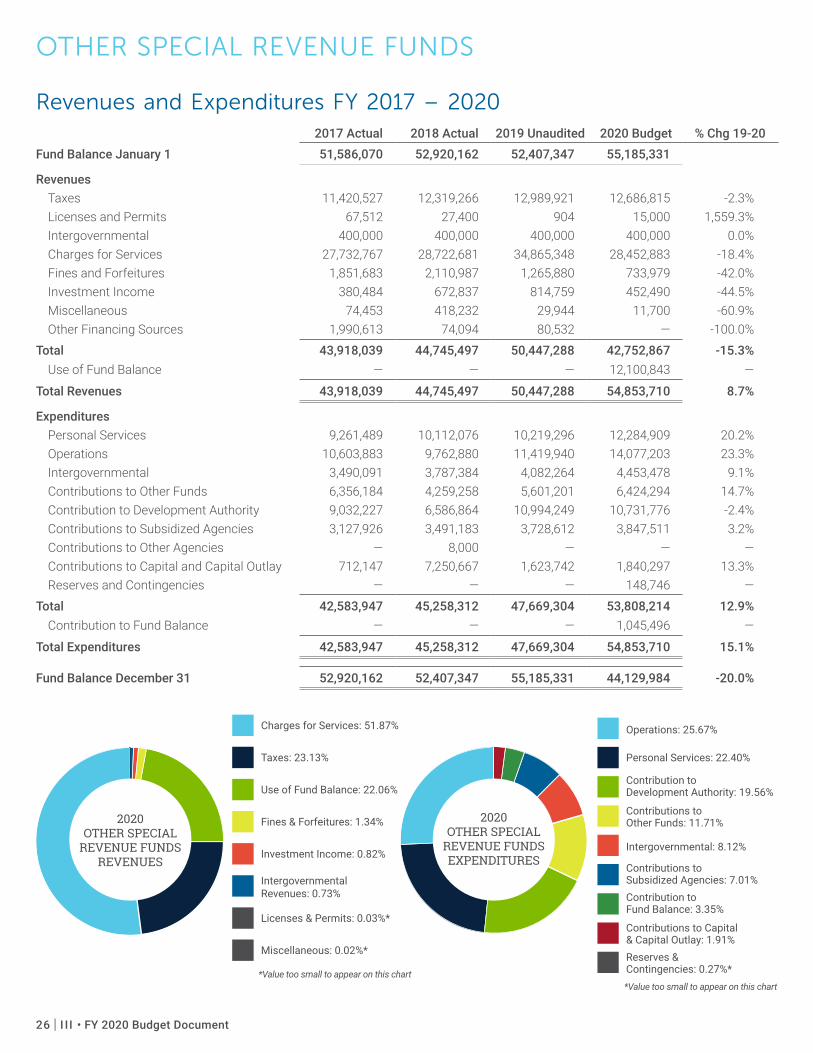
OTHER SPECIAL REVENUE FUNDSOther Special Revenue Funds account for the use of funds that are restricted for specific purposes as defined by state law or local ordinance. The E-911 Fund accounts for operations of the E-911 Communications Center. Revenues are primarily received from monthly subscriber fees remitted by wired and wireless telecommunication providers. The Tourism Fund accounts for the collection and disbursement of hotel/motel tax revenue in accordance with state law, which includes debt service payments for the Infinite Energy Center and parking facility. The Street Lighting Fund supports the County’s street light program. Charges for services are collected as special assessment fees in the fourth quarter with property tax collections. Other Special Revenue Funds include Speed Hump, Authority Imaging, Corrections Inmate Welfare, Crime Victims Assistance, District Attorney Federal Justice Asset Sharing, District Attorney Federal Treasury Asset Sharing, Juvenile Court Supervision, Police Special Justice, Police Special State, Sheriff Inmate, Sheriff Special Justice, Sheriff Special Treasury, Sheriff Special State, Stadium, and Tree Bank Funds.
For 2020, the net budgeted Use of Fund Balance in the Special Revenue Funds in aggregate is $11.1 million, or 20.0 percent of beginning fund balance. Accumulated funds from prior years were budgeted to meet 2019 expenditure needs and finance 2020 contributions to capital projects funds. Due to salary savings and revenues that are budgeted when received, it is anticipated that by the end of 2020 this amount will not actually be utilized.
OTHER SPECIAL REVENUE FUNDS
$54,853,710
E-911$27,298,718
Street Lighting$7,581,042
Tourism$12,804,134
Other$7,169,816
E-911: 49.79%
Tourism: 23.34%
Street Lighting: 13.82%
Stadium: 4.37%
Police Special State: 1.73%
Crime Victims Assistance: 1.71%
Sheriff Inmate: 1.30%
Authority Imaging: 1.17%
Speed Hump: 0.79%
Sheriff Special State: 0.36%
Sheriff Special Justice: 0.36%
Sheriff Special Treasury: 0.36%
District Attorney Federal Justice Asset Sharing: 0.32%
Corrections Inmate Welfare: 0.24%*
Police Special Justice: 0.20%*
Juvenile Court Supervision: 0.10%*
Tree Bank: 0.04%*
*Value too small to appear on this chart
2020OTHER SPECIAL
REVENUE FUNDS APPROPRIATIONS
FY 2020 Budget Document • I I I | 25
OTHER SPECIAL REVENUE FUNDS
Revenues and Expenditures FY 2017 – 2020 2017 Actual 2018 Actual 2019 Unaudited 2020 Budget % Chg 19-20
Fund Balance January 1 51,586,070 52,920,162 52,407,347 55,185,331
RevenuesTaxes 11,420,527 12,319,266 12,989,921 12,686,815 -2.3%Licenses and Permits 67,512 27,400 904 15,000 1,559.3%Intergovernmental 400,000 400,000 400,000 400,000 0.0%Charges for Services 27,732,767 28,722,681 34,865,348 28,452,883 -18.4%Fines and Forfeitures 1,851,683 2,110,987 1,265,880 733,979 -42.0%Investment Income 380,484 672,837 814,759 452,490 -44.5%Miscellaneous 74,453 418,232 29,944 11,700 -60.9%Other Financing Sources 1,990,613 74,094 80,532 — -100.0%
Total 43,918,039 44,745,497 50,447,288 42,752,867 -15.3%Use of Fund Balance — — — 12,100,843 —
Total Revenues 43,918,039 44,745,497 50,447,288 54,853,710 8.7%
ExpendituresPersonal Services 9,261,489 10,112,076 10,219,296 12,284,909 20.2%Operations 10,603,883 9,762,880 11,419,940 14,077,203 23.3%Intergovernmental 3,490,091 3,787,384 4,082,264 4,453,478 9.1%Contributions to Other Funds 6,356,184 4,259,258 5,601,201 6,424,294 14.7%Contribution to Development Authority 9,032,227 6,586,864 10,994,249 10,731,776 -2.4%Contributions to Subsidized Agencies 3,127,926 3,491,183 3,728,612 3,847,511 3.2%Contributions to Other Agencies — 8,000 — — —Contributions to Capital and Capital Outlay 712,147 7,250,667 1,623,742 1,840,297 13.3%Reserves and Contingencies — — — 148,746 —
Total 42,583,947 45,258,312 47,669,304 53,808,214 12.9%Contribution to Fund Balance — — — 1,045,496 —
Total Expenditures 42,583,947 45,258,312 47,669,304 54,853,710 15.1%
Fund Balance December 31 52,920,162 52,407,347 55,185,331 44,129,984 -20.0%
Charges for Services: 51.87%
Taxes: 23.13%
Use of Fund Balance: 22.06%
Fines & Forfeitures: 1.34%
Investment Income: 0.82%
Intergovernmental Revenues: 0.73%
Licenses & Permits: 0.03%*
Miscellaneous: 0.02%*
*Value too small to appear on this chart
2020OTHER SPECIAL
REVENUE FUNDS REVENUES
Operations: 25.67%
Personal Services: 22.40%
Contribution to Development Authority: 19.56%
Contributions to Other Funds: 11.71%
Intergovernmental: 8.12%
Contributions to Subsidized Agencies: 7.01%Contribution to Fund Balance: 3.35%
Contributions to Capital & Capital Outlay: 1.91%Reserves & Contingencies: 0.27%*
2020OTHER SPECIAL
REVENUE FUNDS EXPENDITURES
*Value too small to appear on this chart
26 | I I I • FY 2020 Budget Document
OTHER SPECIAL REVENUE FUNDS
Major Revenue Sources Definitions and Assumptions
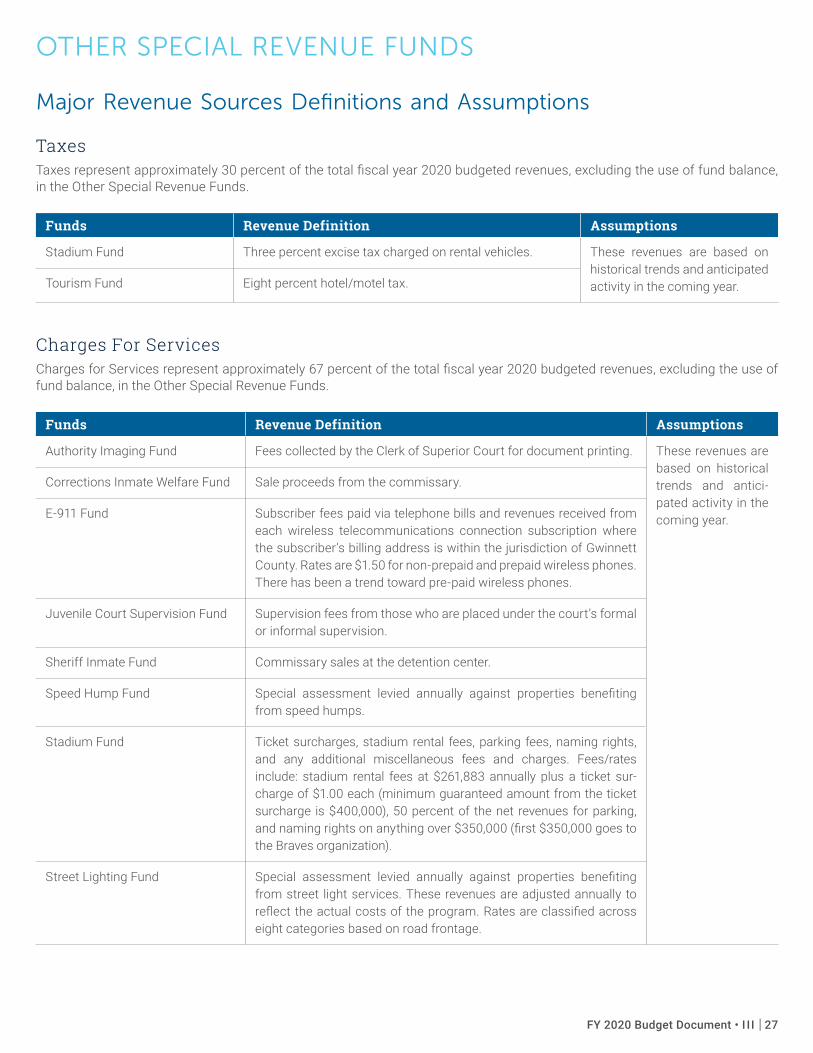
TaxesTaxes represent approximately 30 percent of the total fiscal year 2020 budgeted revenues, excluding the use of fund balance, in the Other Special Revenue Funds.
Funds Revenue Definition Assumptions
Stadium Fund Three percent excise tax charged on rental vehicles. These revenues are based on historical trends and anticipated activity in the coming year.Tourism Fund Eight percent hotel/motel tax.
Charges For ServicesCharges for Services represent approximately 67 percent of the total fiscal year 2020 budgeted revenues, excluding the use of fund balance, in the Other Special Revenue Funds.
Funds Revenue Definition Assumptions
Authority Imaging Fund Fees collected by the Clerk of Superior Court for document printing. These revenues are based on historical trends and antici-pated activity in the coming year.
Corrections Inmate Welfare Fund Sale proceeds from the commissary.
E-911 Fund Subscriber fees paid via telephone bills and revenues received from each wireless telecommunications connection subscription where the subscriber’s billing address is within the jurisdiction of Gwinnett County. Rates are $1.50 for non-prepaid and prepaid wireless phones. There has been a trend toward pre-paid wireless phones.
Juvenile Court Supervision Fund Supervision fees from those who are placed under the court’s formal or informal supervision.
Sheriff Inmate Fund Commissary sales at the detention center.
Speed Hump Fund Special assessment levied annually against properties benefiting from speed humps.
Stadium Fund Ticket surcharges, stadium rental fees, parking fees, naming rights, and any additional miscellaneous fees and charges. Fees/rates include: stadium rental fees at $261,883 annually plus a ticket sur-charge of $1.00 each (minimum guaranteed amount from the ticket surcharge is $400,000), 50 percent of the net revenues for parking, and naming rights on anything over $350,000 (first $350,000 goes to the Braves organization).
Street Lighting Fund Special assessment levied annually against properties benefiting from street light services. These revenues are adjusted annually to reflect the actual costs of the program. Rates are classified across eight categories based on road frontage.
FY 2020 Budget Document • I I I | 27
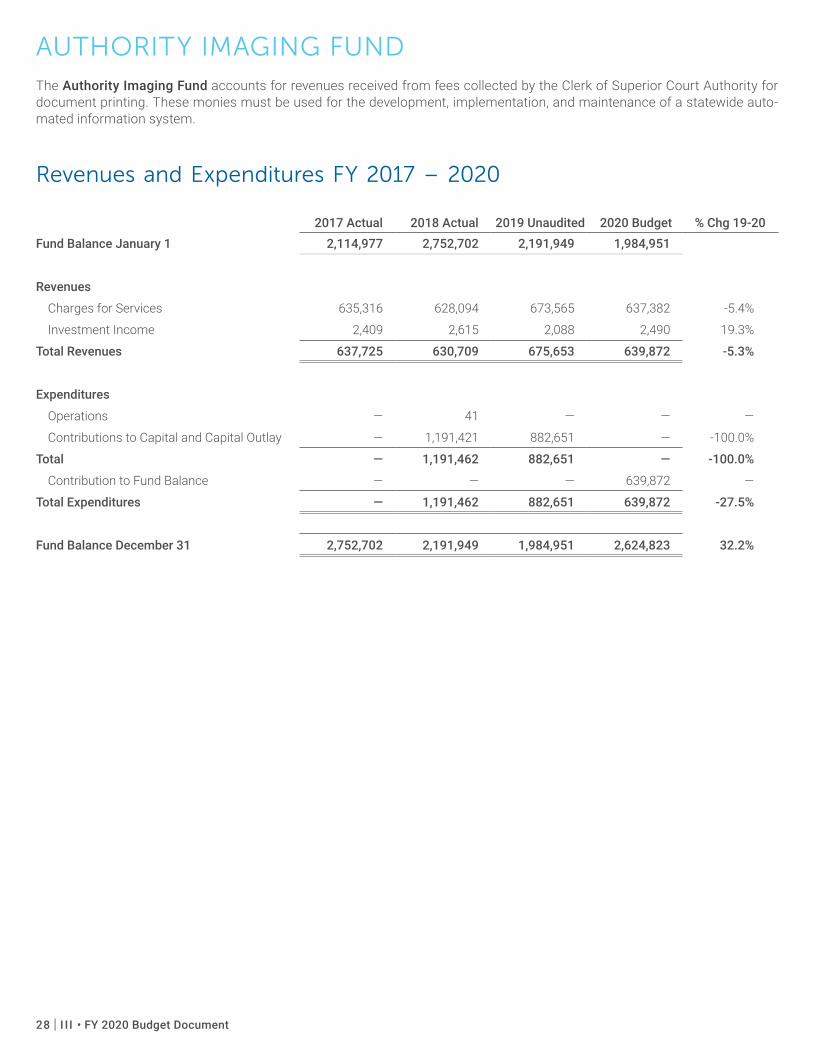
AUTHORITY IMAGING FUNDThe Authority Imaging Fund accounts for revenues received from fees collected by the Clerk of Superior Court Authority for document printing. These monies must be used for the development, implementation, and maintenance of a statewide auto-mated information system.
Revenues and Expenditures FY 2017 – 2020
2017 Actual 2018 Actual 2019 Unaudited 2020 Budget % Chg 19-20Fund Balance January 1 2,114,977 2,752,702 2,191,949 1,984,951
Revenues
Charges for Services 635,316 628,094 673,565 637,382 -5.4%
Investment Income 2,409 2,615 2,088 2,490 19.3%
Total Revenues 637,725 630,709 675,653 639,872 -5.3%
Expenditures
Operations — 41 — — —
Contributions to Capital and Capital Outlay — 1,191,421 882,651 — -100.0%
Total — 1,191,462 882,651 — -100.0%
Contribution to Fund Balance — — — 639,872 —
Total Expenditures — 1,191,462 882,651 639,872 -27.5%
Fund Balance December 31 2,752,702 2,191,949 1,984,951 2,624,823 32.2%
28 | I I I • FY 2020 Budget Document
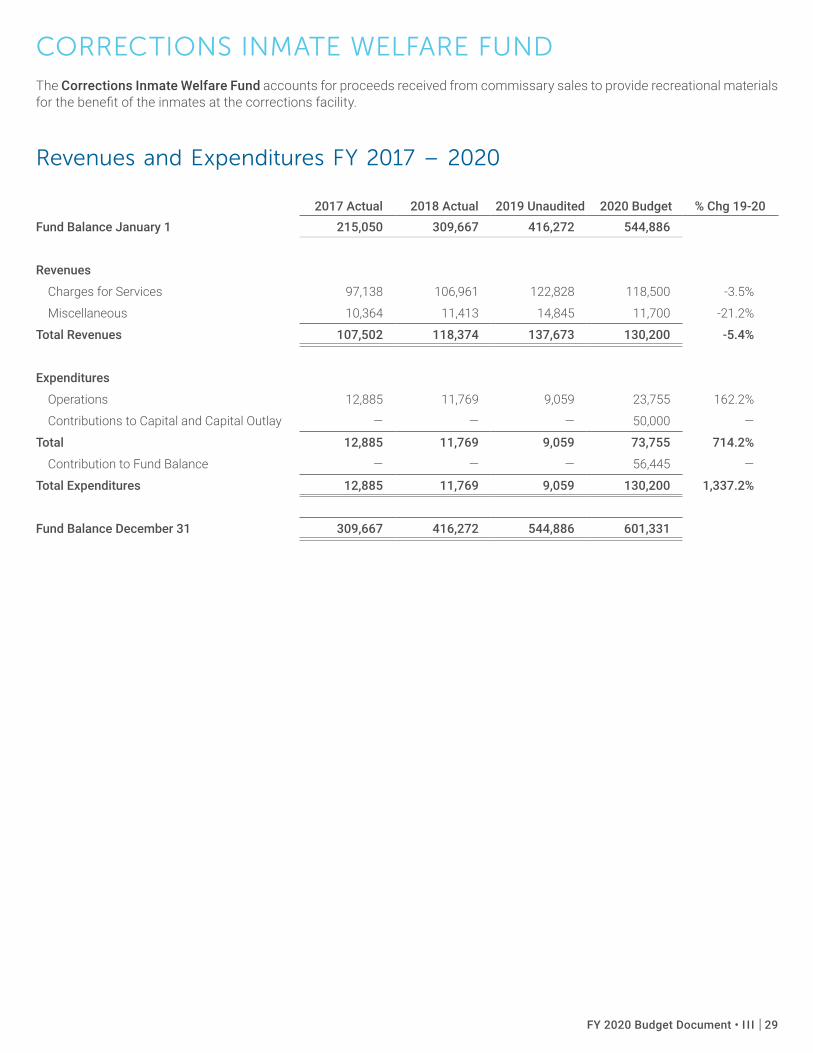
CORRECTIONS INMATE WELFARE FUNDThe Corrections Inmate Welfare Fund accounts for proceeds received from commissary sales to provide recreational materials for the benefit of the inmates at the corrections facility.
Revenues and Expenditures FY 2017 – 2020
2017 Actual 2018 Actual 2019 Unaudited 2020 Budget % Chg 19-20Fund Balance January 1 215,050 309,667 416,272 544,886
Revenues
Charges for Services 97,138 106,961 122,828 118,500 -3.5%
Miscellaneous 10,364 11,413 14,845 11,700 -21.2%
Total Revenues 107,502 118,374 137,673 130,200 -5.4%
Expenditures
Operations 12,885 11,769 9,059 23,755 162.2%
Contributions to Capital and Capital Outlay — — — 50,000 —
Total 12,885 11,769 9,059 73,755 714.2%
Contribution to Fund Balance — — — 56,445 —
Total Expenditures 12,885 11,769 9,059 130,200 1,337.2%
Fund Balance December 31 309,667 416,272 544,886 601,331
FY 2020 Budget Document • I I I | 29
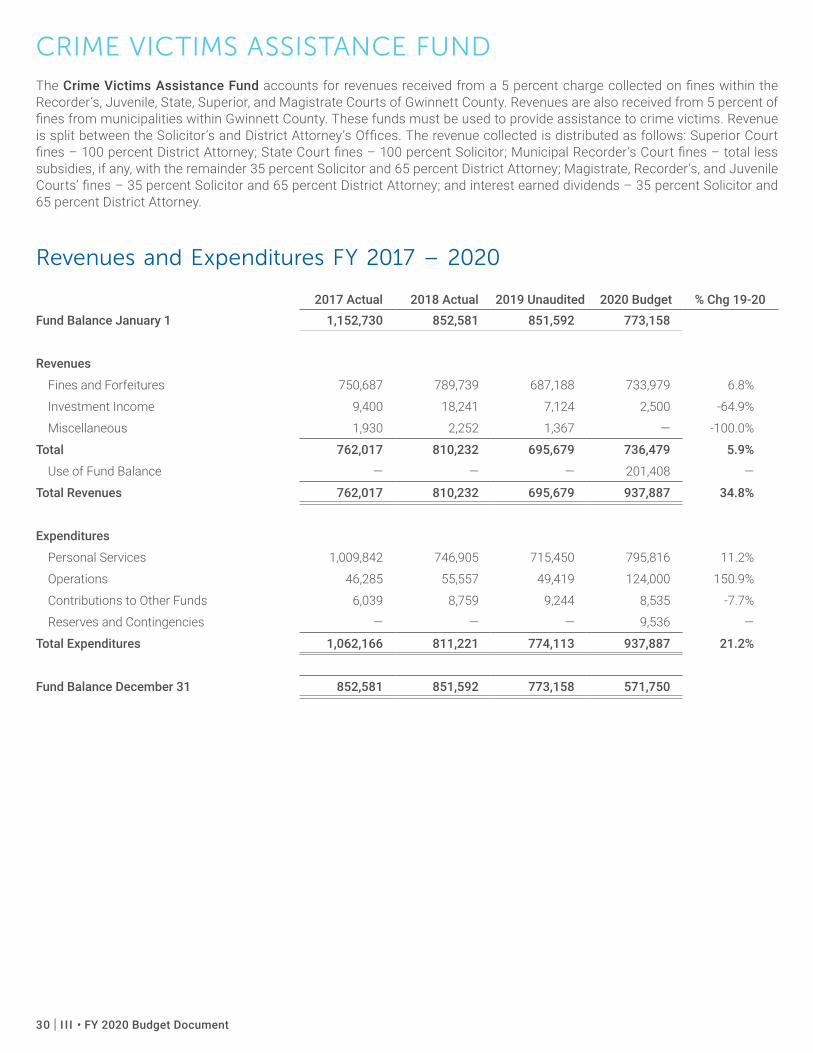
CRIME VICTIMS ASSISTANCE FUNDThe Crime Victims Assistance Fund accounts for revenues received from a 5 percent charge collected on fines within the Recorder’s, Juvenile, State, Superior, and Magistrate Courts of Gwinnett County. Revenues are also received from 5 percent of fines from municipalities within Gwinnett County. These funds must be used to provide assistance to crime victims. Revenue is split between the Solicitor’s and District Attorney’s Offices. The revenue collected is distributed as follows: Superior Court fines – 100 percent District Attorney; State Court fines – 100 percent Solicitor; Municipal Recorder’s Court fines – total less subsidies, if any, with the remainder 35 percent Solicitor and 65 percent District Attorney; Magistrate, Recorder’s, and Juvenile Courts’ fines – 35 percent Solicitor and 65 percent District Attorney; and interest earned dividends – 35 percent Solicitor and 65 percent District Attorney.
Revenues and Expenditures FY 2017 – 2020
2017 Actual 2018 Actual 2019 Unaudited 2020 Budget % Chg 19-20Fund Balance January 1 1,152,730 852,581 851,592 773,158
Revenues
Fines and Forfeitures 750,687 789,739 687,188 733,979 6.8%
Investment Income 9,400 18,241 7,124 2,500 -64.9%
Miscellaneous 1,930 2,252 1,367 — -100.0%
Total 762,017 810,232 695,679 736,479 5.9%
Use of Fund Balance — — — 201,408 —
Total Revenues 762,017 810,232 695,679 937,887 34.8%
Expenditures
Personal Services 1,009,842 746,905 715,450 795,816 11.2%
Operations 46,285 55,557 49,419 124,000 150.9%
Contributions to Other Funds 6,039 8,759 9,244 8,535 -7.7%
Reserves and Contingencies — — — 9,536 —
Total Expenditures 1,062,166 811,221 774,113 937,887 21.2%
Fund Balance December 31 852,581 851,592 773,158 571,750
30 | I I I • FY 2020 Budget Document
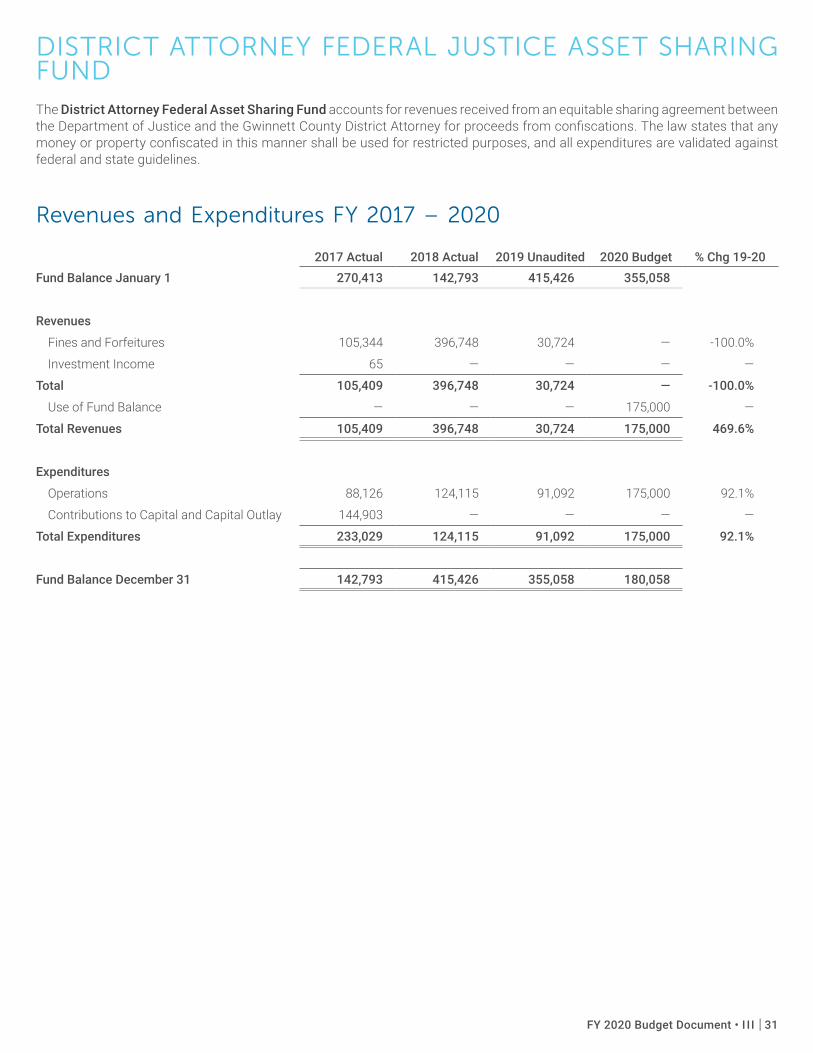
DISTRICT ATTORNEY FEDERAL JUSTICE ASSET SHARING FUNDThe District Attorney Federal Asset Sharing Fund accounts for revenues received from an equitable sharing agreement between the Department of Justice and the Gwinnett County District Attorney for proceeds from confiscations. The law states that any money or property confiscated in this manner shall be used for restricted purposes, and all expenditures are validated against federal and state guidelines.
Revenues and Expenditures FY 2017 – 2020
2017 Actual 2018 Actual 2019 Unaudited 2020 Budget % Chg 19-20Fund Balance January 1 270,413 142,793 415,426 355,058
Revenues
Fines and Forfeitures 105,344 396,748 30,724 — -100.0%
Investment Income 65 — — — —
Total 105,409 396,748 30,724 — -100.0%
Use of Fund Balance — — — 175,000 —
Total Revenues 105,409 396,748 30,724 175,000 469.6%
Expenditures
Operations 88,126 124,115 91,092 175,000 92.1%
Contributions to Capital and Capital Outlay 144,903 — — — —
Total Expenditures 233,029 124,115 91,092 175,000 92.1%
Fund Balance December 31 142,793 415,426 355,058 180,058
FY 2020 Budget Document • I I I | 31
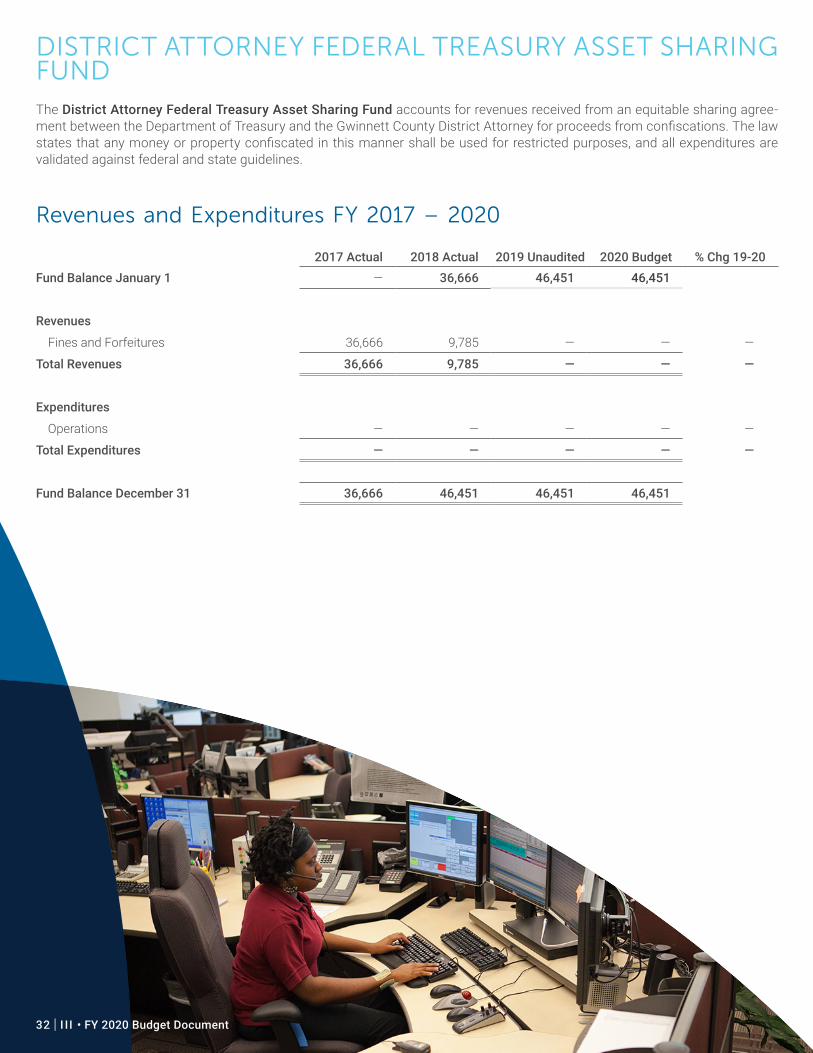
DISTRICT ATTORNEY FEDERAL TREASURY ASSET SHARING FUNDThe District Attorney Federal Treasury Asset Sharing Fund accounts for revenues received from an equitable sharing agree-ment between the Department of Treasury and the Gwinnett County District Attorney for proceeds from confiscations. The law states that any money or property confiscated in this manner shall be used for restricted purposes, and all expenditures are validated against federal and state guidelines.
Revenues and Expenditures FY 2017 – 2020
2017 Actual 2018 Actual 2019 Unaudited 2020 Budget % Chg 19-20Fund Balance January 1 — 36,666 46,451 46,451
Revenues
Fines and Forfeitures 36,666 9,785 — — —
Total Revenues 36,666 9,785 — — —
Expenditures
Operations — — — — —
Total Expenditures — — — — —
Fund Balance December 31 36,666 46,451 46,451 46,451
32 | I I I • FY 2020 Budget Document
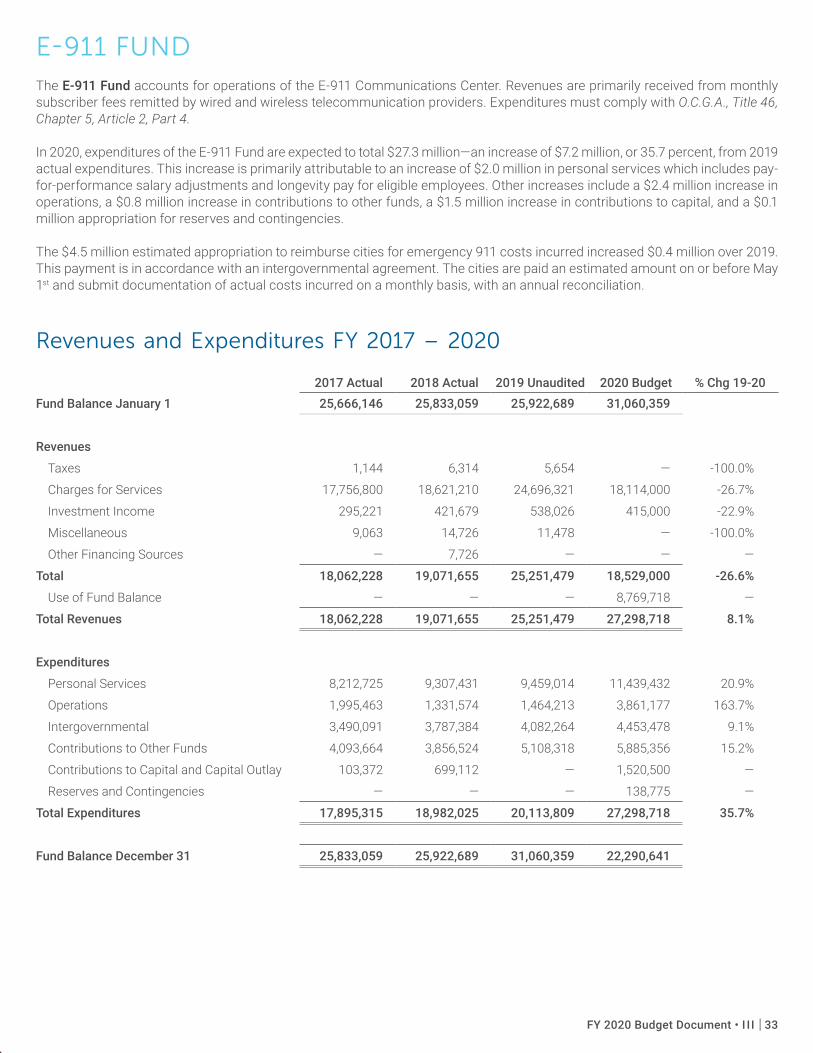
E-911 FUNDThe E-911 Fund accounts for operations of the E-911 Communications Center. Revenues are primarily received from monthly subscriber fees remitted by wired and wireless telecommunication providers. Expenditures must comply with O.C.G.A., Title 46, Chapter 5, Article 2, Part 4.
In 2020, expenditures of the E-911 Fund are expected to total $27.3 million—an increase of $7.2 million, or 35.7 percent, from 2019 actual expenditures. This increase is primarily attributable to an increase of $2.0 million in personal services which includes pay-for-performance salary adjustments and longevity pay for eligible employees. Other increases include a $2.4 million increase in operations, a $0.8 million increase in contributions to other funds, a $1.5 million increase in contributions to capital, and a $0.1 million appropriation for reserves and contingencies.
The $4.5 million estimated appropriation to reimburse cities for emergency 911 costs incurred increased $0.4 million over 2019. This payment is in accordance with an intergovernmental agreement. The cities are paid an estimated amount on or before May 1st and submit documentation of actual costs incurred on a monthly basis, with an annual reconciliation.
Revenues and Expenditures FY 2017 – 2020
2017 Actual 2018 Actual 2019 Unaudited 2020 Budget % Chg 19-20Fund Balance January 1 25,666,146 25,833,059 25,922,689 31,060,359
Revenues
Taxes 1,144 6,314 5,654 — -100.0%
Charges for Services 17,756,800 18,621,210 24,696,321 18,114,000 -26.7%
Investment Income 295,221 421,679 538,026 415,000 -22.9%
Miscellaneous 9,063 14,726 11,478 — -100.0%
Other Financing Sources — 7,726 — — —
Total 18,062,228 19,071,655 25,251,479 18,529,000 -26.6%
Use of Fund Balance — — — 8,769,718 —
Total Revenues 18,062,228 19,071,655 25,251,479 27,298,718 8.1%
Expenditures
Personal Services 8,212,725 9,307,431 9,459,014 11,439,432 20.9%
Operations 1,995,463 1,331,574 1,464,213 3,861,177 163.7%
Intergovernmental 3,490,091 3,787,384 4,082,264 4,453,478 9.1%
Contributions to Other Funds 4,093,664 3,856,524 5,108,318 5,885,356 15.2%
Contributions to Capital and Capital Outlay 103,372 699,112 — 1,520,500 —
Reserves and Contingencies — — — 138,775 —
Total Expenditures 17,895,315 18,982,025 20,113,809 27,298,718 35.7%
Fund Balance December 31 25,833,059 25,922,689 31,060,359 22,290,641
FY 2020 Budget Document • I I I | 33
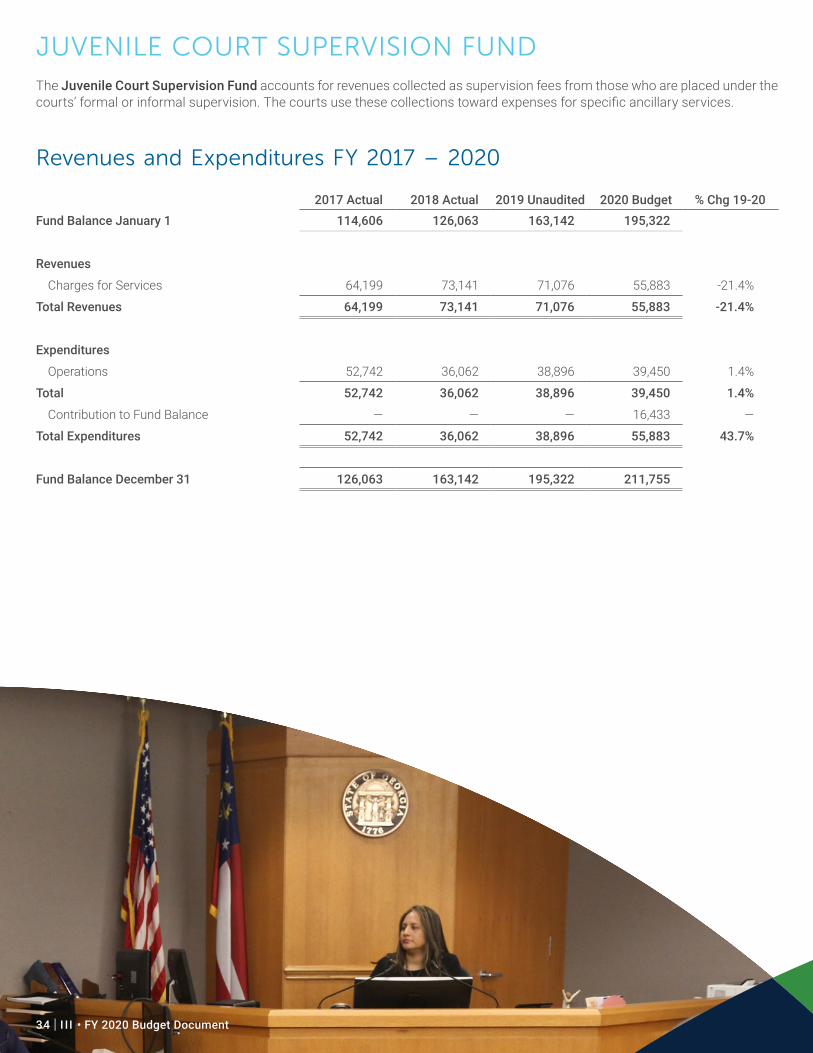
JUVENILE COURT SUPERVISION FUNDThe Juvenile Court Supervision Fund accounts for revenues collected as supervision fees from those who are placed under the courts’ formal or informal supervision. The courts use these collections toward expenses for specific ancillary services.
Revenues and Expenditures FY 2017 – 2020
2017 Actual 2018 Actual 2019 Unaudited 2020 Budget % Chg 19-20Fund Balance January 1 114,606 126,063 163,142 195,322
Revenues
Charges for Services 64,199 73,141 71,076 55,883 -21.4%
Total Revenues 64,199 73,141 71,076 55,883 -21.4%
Expenditures
Operations 52,742 36,062 38,896 39,450 1.4%
Total 52,742 36,062 38,896 39,450 1.4%
Contribution to Fund Balance — — — 16,433 —
Total Expenditures 52,742 36,062 38,896 55,883 43.7%
Fund Balance December 31 126,063 163,142 195,322 211,755
34 | I I I • FY 2020 Budget Document
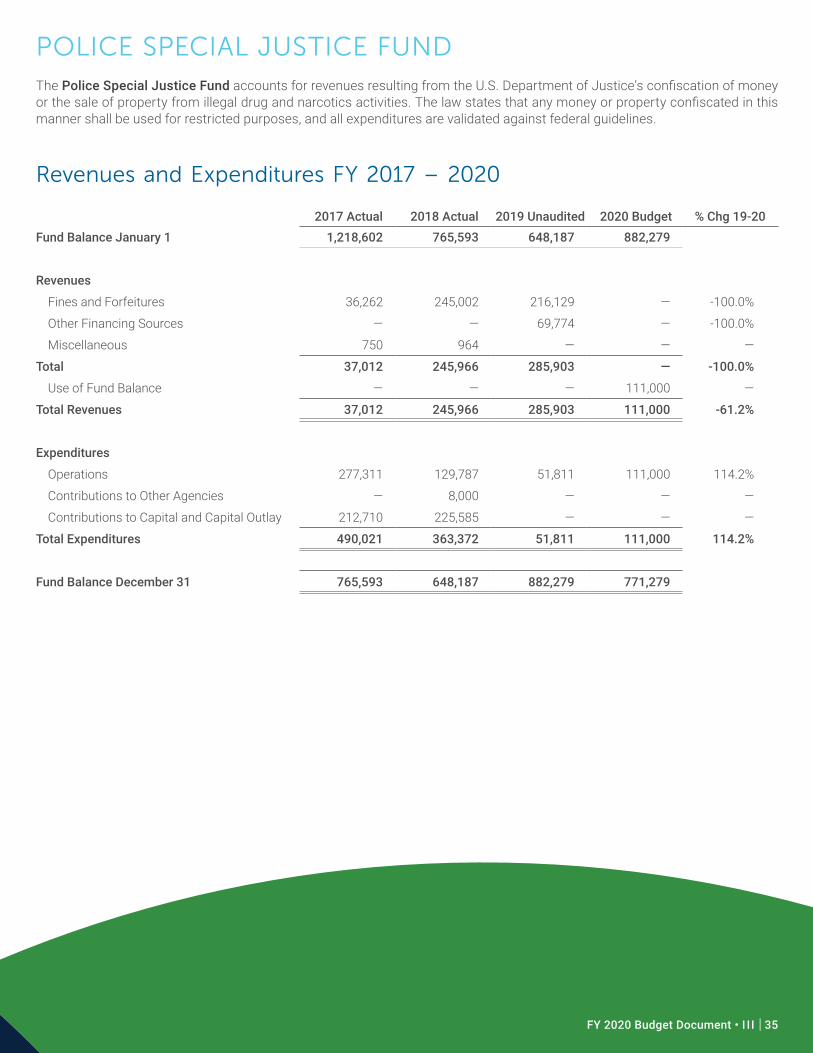
POLICE SPECIAL JUSTICE FUNDThe Police Special Justice Fund accounts for revenues resulting from the U.S. Department of Justice’s confiscation of money or the sale of property from illegal drug and narcotics activities. The law states that any money or property confiscated in this manner shall be used for restricted purposes, and all expenditures are validated against federal guidelines.
Revenues and Expenditures FY 2017 – 2020
2017 Actual 2018 Actual 2019 Unaudited 2020 Budget % Chg 19-20Fund Balance January 1 1,218,602 765,593 648,187 882,279
Revenues
Fines and Forfeitures 36,262 245,002 216,129 — -100.0%
Other Financing Sources — — 69,774 — -100.0%
Miscellaneous 750 964 — — —
Total 37,012 245,966 285,903 — -100.0%
Use of Fund Balance — — — 111,000 —
Total Revenues 37,012 245,966 285,903 111,000 -61.2%
Expenditures
Operations 277,311 129,787 51,811 111,000 114.2%
Contributions to Other Agencies — 8,000 — — —
Contributions to Capital and Capital Outlay 212,710 225,585 — — —
Total Expenditures 490,021 363,372 51,811 111,000 114.2%
Fund Balance December 31 765,593 648,187 882,279 771,279
FY 2020 Budget Document • I I I | 35
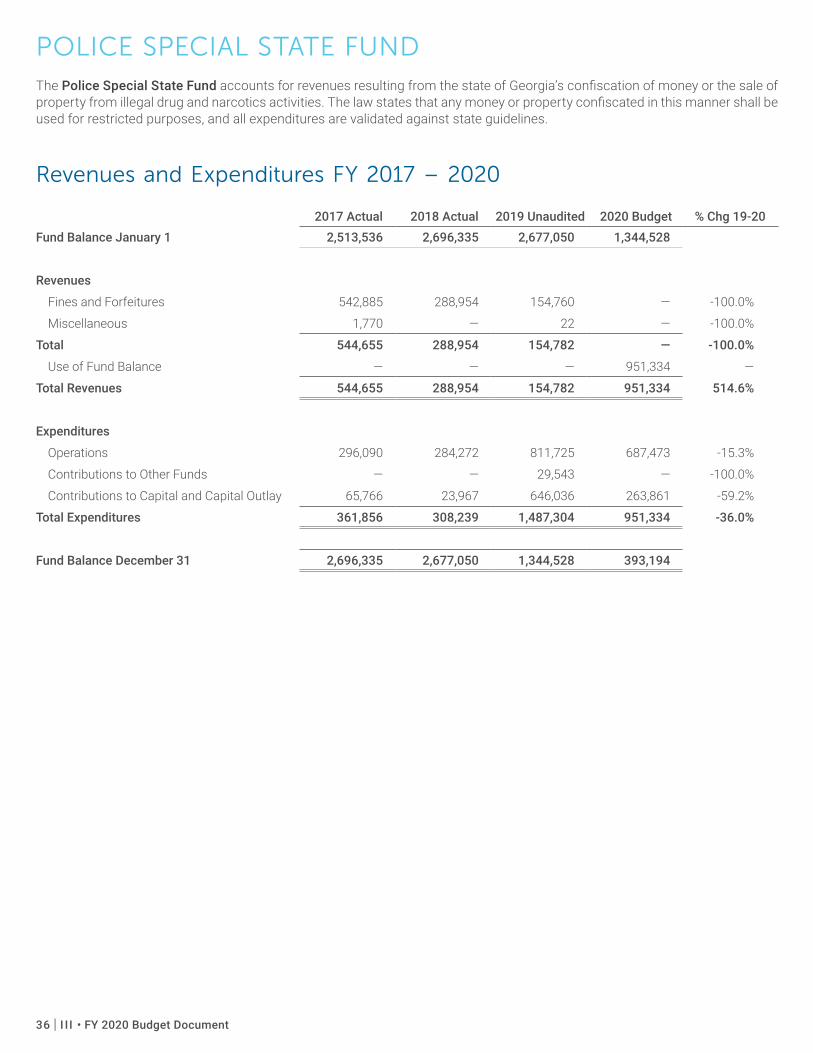
POLICE SPECIAL STATE FUNDThe Police Special State Fund accounts for revenues resulting from the state of Georgia’s confiscation of money or the sale of property from illegal drug and narcotics activities. The law states that any money or property confiscated in this manner shall be used for restricted purposes, and all expenditures are validated against state guidelines.
Revenues and Expenditures FY 2017 – 2020
2017 Actual 2018 Actual 2019 Unaudited 2020 Budget % Chg 19-20Fund Balance January 1 2,513,536 2,696,335 2,677,050 1,344,528
Revenues
Fines and Forfeitures 542,885 288,954 154,760 — -100.0%
Miscellaneous 1,770 — 22 — -100.0%
Total 544,655 288,954 154,782 — -100.0%
Use of Fund Balance — — — 951,334 —
Total Revenues 544,655 288,954 154,782 951,334 514.6%
Expenditures
Operations 296,090 284,272 811,725 687,473 -15.3%
Contributions to Other Funds — — 29,543 — -100.0%
Contributions to Capital and Capital Outlay 65,766 23,967 646,036 263,861 -59.2%
Total Expenditures 361,856 308,239 1,487,304 951,334 -36.0%
Fund Balance December 31 2,696,335 2,677,050 1,344,528 393,194
36 | I I I • FY 2020 Budget Document
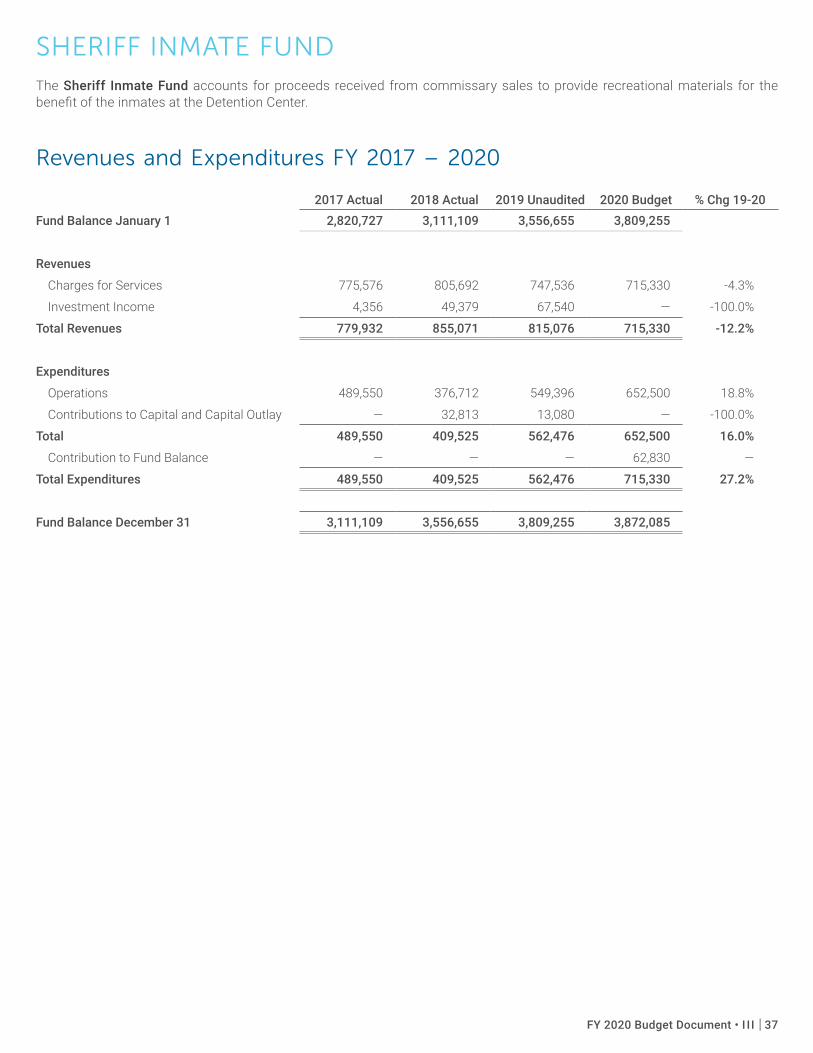
SHERIFF INMATE FUNDThe Sheriff Inmate Fund accounts for proceeds received from commissary sales to provide recreational materials for the benefit of the inmates at the Detention Center.
Revenues and Expenditures FY 2017 – 2020
2017 Actual 2018 Actual 2019 Unaudited 2020 Budget % Chg 19-20Fund Balance January 1 2,820,727 3,111,109 3,556,655 3,809,255
Revenues
Charges for Services 775,576 805,692 747,536 715,330 -4.3%
Investment Income 4,356 49,379 67,540 — -100.0%
Total Revenues 779,932 855,071 815,076 715,330 -12.2%
Expenditures
Operations 489,550 376,712 549,396 652,500 18.8%
Contributions to Capital and Capital Outlay — 32,813 13,080 — -100.0%
Total 489,550 409,525 562,476 652,500 16.0%
Contribution to Fund Balance — — — 62,830 —
Total Expenditures 489,550 409,525 562,476 715,330 27.2%
Fund Balance December 31 3,111,109 3,556,655 3,809,255 3,872,085
FY 2020 Budget Document • I I I | 37
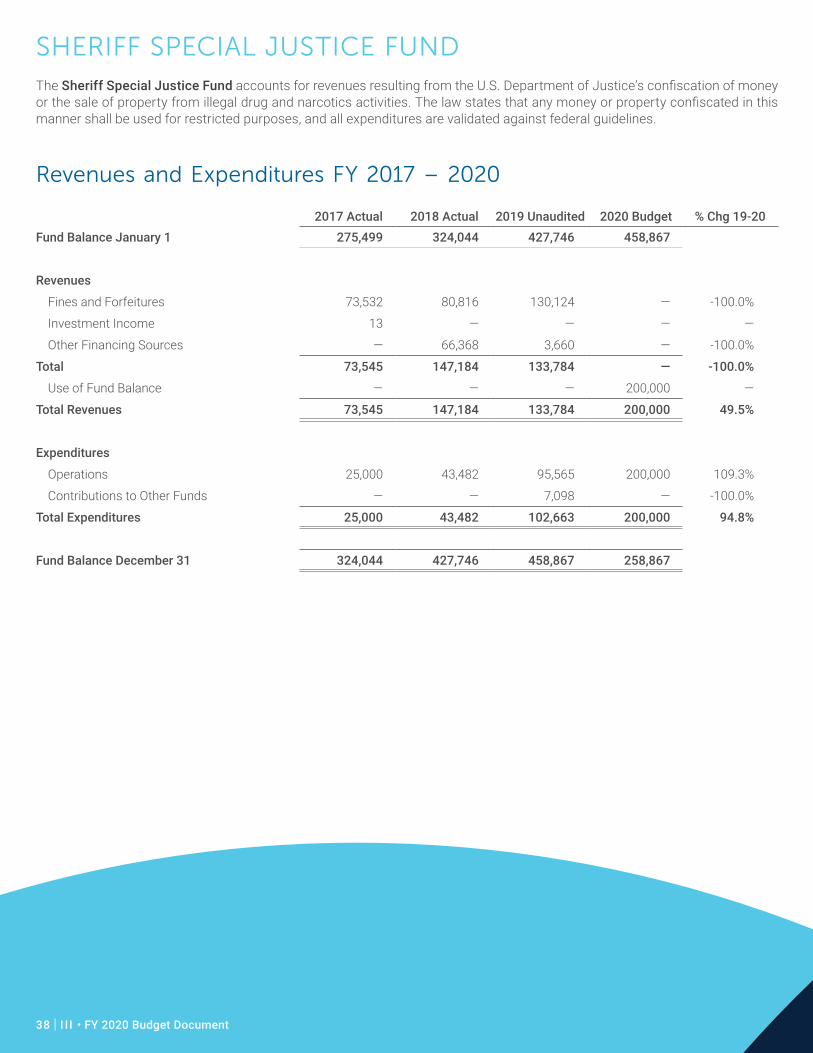
SHERIFF SPECIAL JUSTICE FUNDThe Sheriff Special Justice Fund accounts for revenues resulting from the U.S. Department of Justice’s confiscation of money or the sale of property from illegal drug and narcotics activities. The law states that any money or property confiscated in this manner shall be used for restricted purposes, and all expenditures are validated against federal guidelines.
Revenues and Expenditures FY 2017 – 2020
2017 Actual 2018 Actual 2019 Unaudited 2020 Budget % Chg 19-20Fund Balance January 1 275,499 324,044 427,746 458,867
Revenues
Fines and Forfeitures 73,532 80,816 130,124 — -100.0%
Investment Income 13 — — — —
Other Financing Sources — 66,368 3,660 — -100.0%
Total 73,545 147,184 133,784 — -100.0%
Use of Fund Balance — — — 200,000 —
Total Revenues 73,545 147,184 133,784 200,000 49.5%
Expenditures
Operations 25,000 43,482 95,565 200,000 109.3%
Contributions to Other Funds — — 7,098 — -100.0%
Total Expenditures 25,000 43,482 102,663 200,000 94.8%
Fund Balance December 31 324,044 427,746 458,867 258,867
38 | I I I • FY 2020 Budget Document
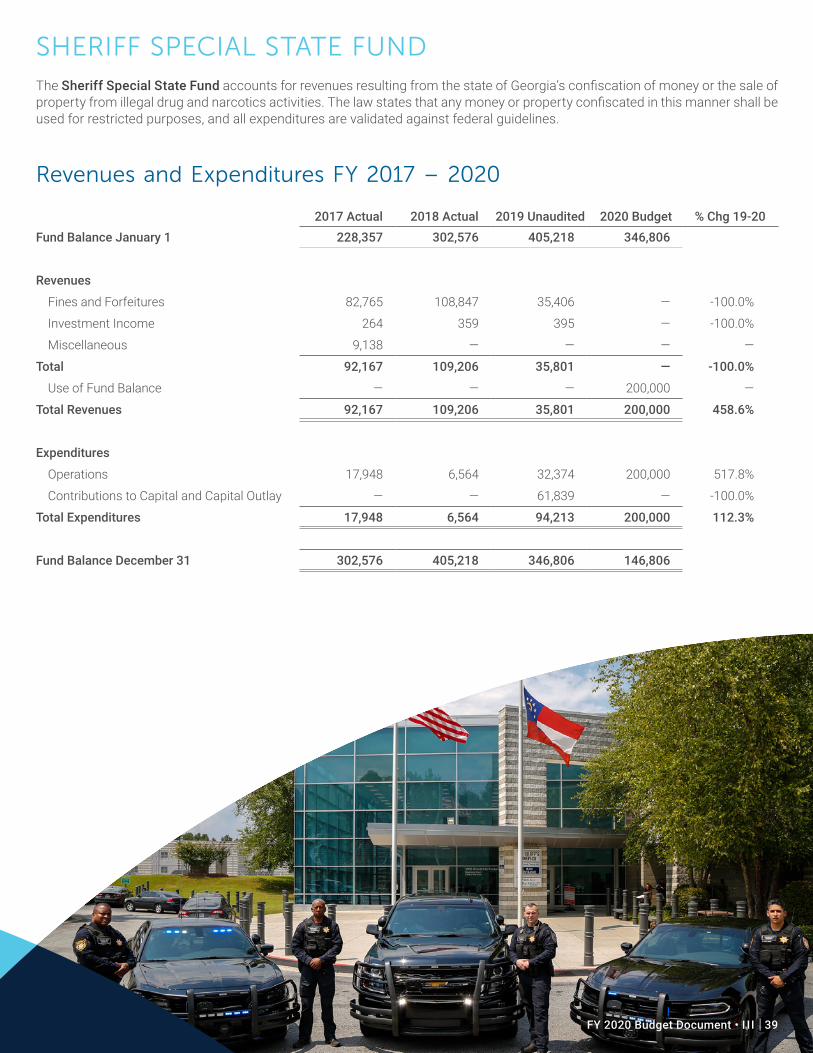
SHERIFF SPECIAL STATE FUNDThe Sheriff Special State Fund accounts for revenues resulting from the state of Georgia’s confiscation of money or the sale of property from illegal drug and narcotics activities. The law states that any money or property confiscated in this manner shall be used for restricted purposes, and all expenditures are validated against federal guidelines.
Revenues and Expenditures FY 2017 – 2020
2017 Actual 2018 Actual 2019 Unaudited 2020 Budget % Chg 19-20Fund Balance January 1 228,357 302,576 405,218 346,806
Revenues
Fines and Forfeitures 82,765 108,847 35,406 — -100.0%
Investment Income 264 359 395 — -100.0%
Miscellaneous 9,138 — — — —
Total 92,167 109,206 35,801 — -100.0%
Use of Fund Balance — — — 200,000 —
Total Revenues 92,167 109,206 35,801 200,000 458.6%
Expenditures
Operations 17,948 6,564 32,374 200,000 517.8%
Contributions to Capital and Capital Outlay — — 61,839 — -100.0%
Total Expenditures 17,948 6,564 94,213 200,000 112.3%
Fund Balance December 31 302,576 405,218 346,806 146,806
FY 2020 Budget Document • I I I | 39
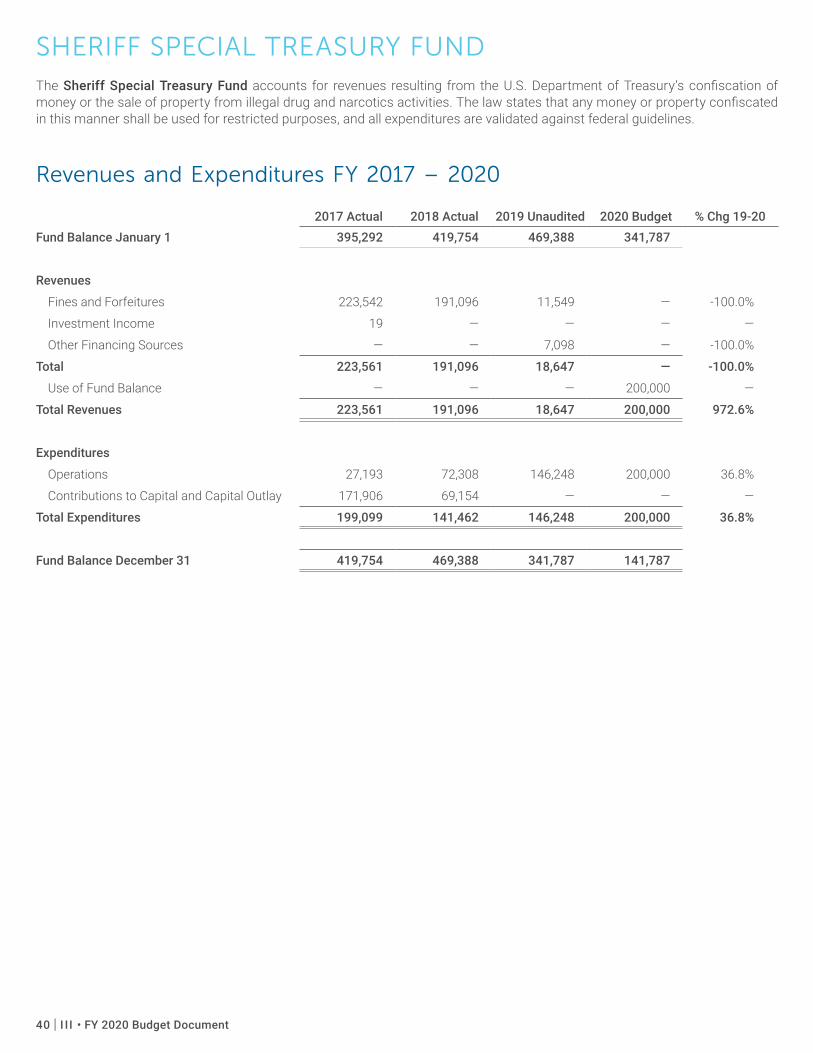
SHERIFF SPECIAL TREASURY FUNDThe Sheriff Special Treasury Fund accounts for revenues resulting from the U.S. Department of Treasury’s confiscation of money or the sale of property from illegal drug and narcotics activities. The law states that any money or property confiscated in this manner shall be used for restricted purposes, and all expenditures are validated against federal guidelines.
Revenues and Expenditures FY 2017 – 2020
2017 Actual 2018 Actual 2019 Unaudited 2020 Budget % Chg 19-20Fund Balance January 1 395,292 419,754 469,388 341,787
Revenues
Fines and Forfeitures 223,542 191,096 11,549 — -100.0%
Investment Income 19 — — — —
Other Financing Sources — — 7,098 — -100.0%
Total 223,561 191,096 18,647 — -100.0%
Use of Fund Balance — — — 200,000 —
Total Revenues 223,561 191,096 18,647 200,000 972.6%
Expenditures
Operations 27,193 72,308 146,248 200,000 36.8%
Contributions to Capital and Capital Outlay 171,906 69,154 — — —
Total Expenditures 199,099 141,462 146,248 200,000 36.8%
Fund Balance December 31 419,754 469,388 341,787 141,787
40 | I I I • FY 2020 Budget Document
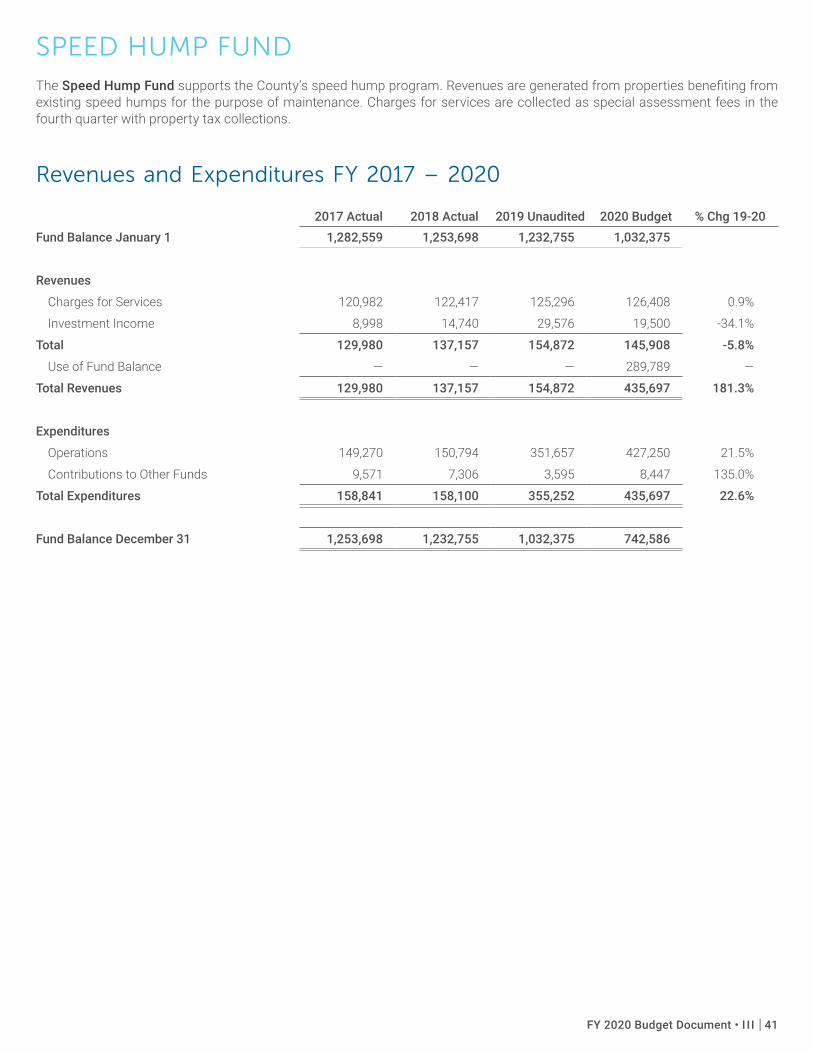
SPEED HUMP FUNDThe Speed Hump Fund supports the County’s speed hump program. Revenues are generated from properties benefiting from existing speed humps for the purpose of maintenance. Charges for services are collected as special assessment fees in the fourth quarter with property tax collections.
Revenues and Expenditures FY 2017 – 2020
2017 Actual 2018 Actual 2019 Unaudited 2020 Budget % Chg 19-20Fund Balance January 1 1,282,559 1,253,698 1,232,755 1,032,375
Revenues
Charges for Services 120,982 122,417 125,296 126,408 0.9%
Investment Income 8,998 14,740 29,576 19,500 -34.1%
Total 129,980 137,157 154,872 145,908 -5.8%
Use of Fund Balance — — — 289,789 —
Total Revenues 129,980 137,157 154,872 435,697 181.3%
Expenditures
Operations 149,270 150,794 351,657 427,250 21.5%
Contributions to Other Funds 9,571 7,306 3,595 8,447 135.0%
Total Expenditures 158,841 158,100 355,252 435,697 22.6%
Fund Balance December 31 1,253,698 1,232,755 1,032,375 742,586
FY 2020 Budget Document • I I I | 41
STADIUM FUNDThe Stadium Fund accumulates stadium-related revenues in order to make lease payments on the stadium and pay other miscellaneous expenditures. Motor vehicle rental excise taxes are receipted one month in arrears. Intergovernmental revenue is realized in the form of a one-time annual payment from the Gwinnett Convention and Visitors Bureau in January. Charges for services revenues from ticket sales, parking, rental fees, and naming rights are received in April, June, and October.
The County has entered into a capital lease for the stadium (Coolray Field). The project was financed with bonds and is leased at cost with lease repayment terms mirroring the required debt service on the bonds. Lease payments are made in January and July and are reflected in the Contribution to Development Authority line item below.
Revenues and Expenditures FY 2017– 2020
2017 Actual 2018 Actual 2019 Unaudited 2020 Budget % Chg 19-20Fund Balance January 1 1,098,110 1,369,975 2,164,024 2,508,406
Revenues
Taxes 998,312 1,025,584 936,302 880,425 -6.0%
Intergovernmental 400,000 400,000 400,000 400,000 0.0%
Charges for Services 1,025,007 1,069,438 1,067,429 1,117,188 4.7%
Investment Income — 12,258 20,167 — -100.0%
Other Financing Sources 1,990,613 — — — —
Miscellaneous 1 1 — — —
Total Revenues 4,413,933 2,507,281 2,423,898 2,397,613 -1.1%
Expenditures
Operations 1,251 750 750 825 10.0%
Contributions to Other Funds 32,195 45,473 51,732 102,631 98.4%
Contribution to Development Authority 4,108,622 1,667,009 2,027,034 2,024,334 -0.1%
Total 4,142,068 1,713,232 2,079,516 2,127,790 2.3%
Contribution to Fund Balance — — — 269,823 —
Total Expenditures 4,142,068 1,713,232 2,079,516 2,397,613 15.3%
Fund Balance December 31 1,369,975 2,164,024 2,508,406 2,778,229
42 | I I I • FY 2020 Budget Document
STREET LIGHTING FUNDThe Street Lighting Fund supports the County’s street light program. Revenues are generated from properties benefiting from existing street lights for the purpose of utility payments. Charges for services are collected as special assessment fees in the fourth quarter with property tax collections.
Revenues and Expenditures FY 2017 – 2020
2017 Actual 2018 Actual 2019 Unaudited 2020 Budget % Chg 19-20Fund Balance January 1 2,136,285 2,252,576 2,256,645 1,723,280
Revenues
Charges for Services 7,256,820 7,294,970 7,357,060 7,568,042 2.9%
Investment Income 13,061 38,541 37,697 13,000 -65.5%
Miscellaneous 41,437 — 2,232 — -100.0%
Total Revenues 7,311,318 7,333,511 7,396,989 7,581,042 2.5%
Expenditures
Personal Services 38,922 57,740 44,832 49,661 10.8%
Operations 7,087,933 7,105,944 7,696,475 7,321,807 -4.9%
Contributions to Other Funds 68,172 157,143 168,911 203,110 20.2%
Contributions to Capital and Capital Outlay — 8,615 20,136 5,936 -70.5%
Reserves and Contingencies — — — 435 —
Total 7,195,027 7,329,442 7,930,354 7,580,949 -4.4%
Contribution to Fund Balance — — — 93 —
Total Expenditures 7,195,027 7,329,442 7,930,354 7,581,042 -4.4%
Fund Balance December 31 2,252,576 2,256,645 1,723,280 1,723,373
FY 2020 Budget Document • I I I | 43
TOURISM FUNDThe Tourism Fund accounts for the collection and disbursement of hotel/motel tax revenue in accordance with state law, which includes lease payments for the Infinite Energy Center, Infinite Energy Center parking facility, and Gwinnett Center expansion. Hotel/motel taxes are receipted one month in arrears. Other expenses associated with this fund are quarterly payments to the Gwinnett Convention and Visitors Bureau, per a management agreement.
The County has entered into a capital lease with the Development Authority for the Infinite Energy Center, parking facility at the Infinite Energy Center, and Gwinnett Center expansion. These projects were financed with bonds and are leased at cost with lease repayment terms mirroring the required debt service on the bonds. Lease payments are made in March and September and are reflected in the Contribution to Development Authority line item below.
Revenues and Expenditures FY 2017 – 2020
2017 Actual 2018 Actual 2019 Unaudited 2020 Budget % Chg 19-20Fund Balance January 1 9,836,098 10,069,866 8,233,653 7,448,154
Revenues
Taxes 10,421,071 11,287,368 12,047,965 11,806,390 -2.0%
Charges for Services 929 758 4,237 150 -96.5%
Miscellaneous — 388,876 — — —
Investment Income 46,678 115,025 112,146 — -100.0%
Total 10,468,678 11,792,027 12,164,348 11,806,540 -2.9%
Use of Fund Balance — — — 997,594 —
Total Revenues 10,468,678 11,792,027 12,164,348 12,804,134 5.3%
Expenditures
Operations 36,836 33,149 31,260 32,966 5.5%
Contributions to Other Funds 2,146,543 184,053 222,760 216,215 -2.9%
Contribution to Development Authority 4,923,605 4,919,855 8,967,215 8,707,442 -2.9%
Contributions to Subsidized Agencies 3,127,926 3,491,183 3,728,612 3,847,511 3.2%
Contributions to Capital and Capital Outlay — 5,000,000 — — —
Total Expenditures 10,234,910 13,628,240 12,949,847 12,804,134 -1.1%
Fund Balance December 31 10,069,866 8,233,653 7,448,154 6,450,560
44 | I I I • FY 2020 Budget Document
TREE BANK FUNDThe Tree Bank Fund accounts for activities related to the Gwinnett County Buffer, Landscape, and Tree Ordinance. During the permitting process, the developer has the option to pay money when the required tree density units cannot be met on site. The monies collected must be used by the Department of Planning and Development, Community Services, and/or Support Ser-vices for the planting of trees at parks, greenways, fire stations, and libraries within the same commission district in which the development is located or within five miles of such district. Alternate planning locations may be approved by the director of the Department of Planning and Development. Expenditures for this fund occur as projects are identified and approved.
Revenues and Expenditures FY 2017 – 2020
2017 Actual 2018 Actual 2019 Unaudited 2020 Budget % Chg 19-20Fund Balance January 1 247,083 301,105 328,505 329,409
Revenues
Licenses and Permits 67,512 27,400 904 15,000 1,559.3%
Total 67,512 27,400 904 15,000 1,559.3%
Use of Fund Balance — — — 5,000 —
Total Revenues 67,512 27,400 904 20,000 2,112.4%
Expenditures
Operations — — — 20,000 —
Contributions to Capital and Capital Outlay 13,490 — — — —
Total Expenditures 13,490 — — 20,000 —
Fund Balance December 31 301,105 328,505 329,409 324,409
FY 2020 Budget Document • I I I | 45

ENTERPRISE FUNDS
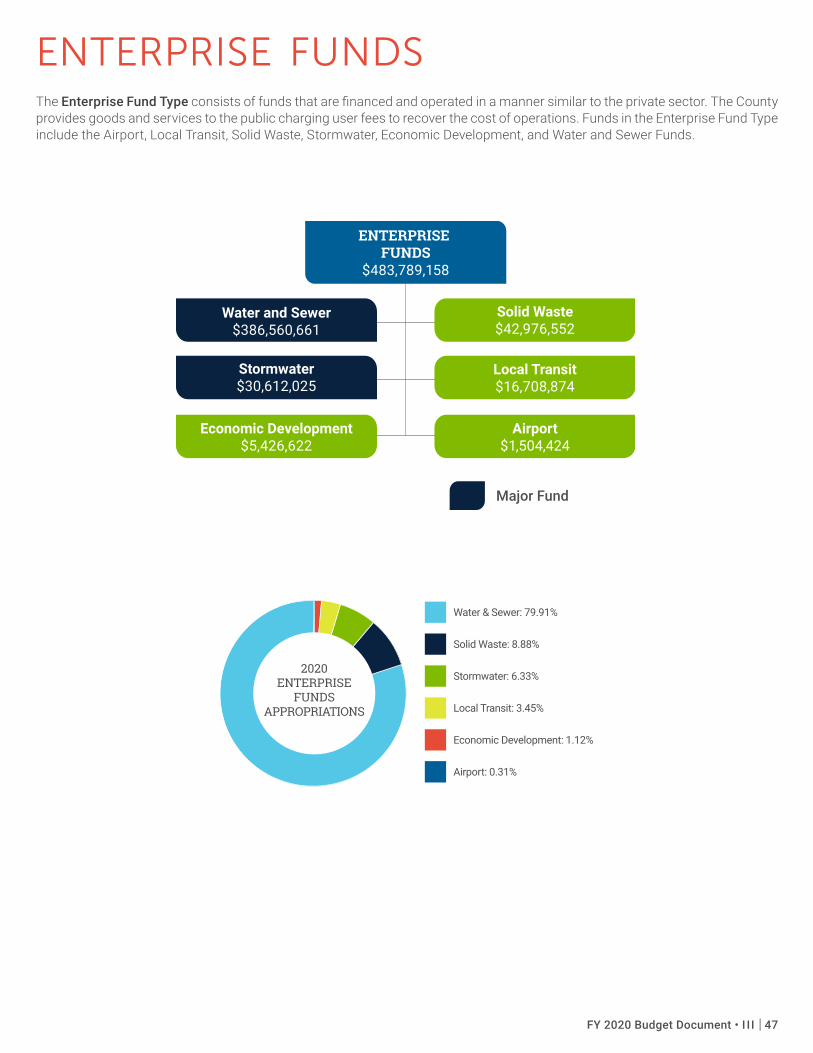
ENTERPRISE FUNDSThe Enterprise Fund Type consists of funds that are financed and operated in a manner similar to the private sector. The County provides goods and services to the public charging user fees to recover the cost of operations. Funds in the Enterprise Fund Type include the Airport, Local Transit, Solid Waste, Stormwater, Economic Development, and Water and Sewer Funds.
ENTERPRISE FUNDS
$483,789,158
Economic Development$5,426,622
Local Transit$16,708,874
Airport$1,504,424
Solid Waste$42,976,552
Stormwater$30,612,025
Water and Sewer$386,560,661
Major Fund
Water & Sewer: 79.91%
Solid Waste: 8.88%
Stormwater: 6.33%
Local Transit: 3.45%
Economic Development: 1.12%
Airport: 0.31%
2020ENTERPRISE
FUNDS APPROPRIATIONS
Water & Sewer: 79.91%
Solid Waste: 8.88%
Stormwater: 6.33%
Local Transit: 3.45%
Economic Development: 1.12%
Airport: 0.31%
2020ENTERPRISE
FUNDS APPROPRIATIONS
FY 2020 Budget Document • I I I | 47
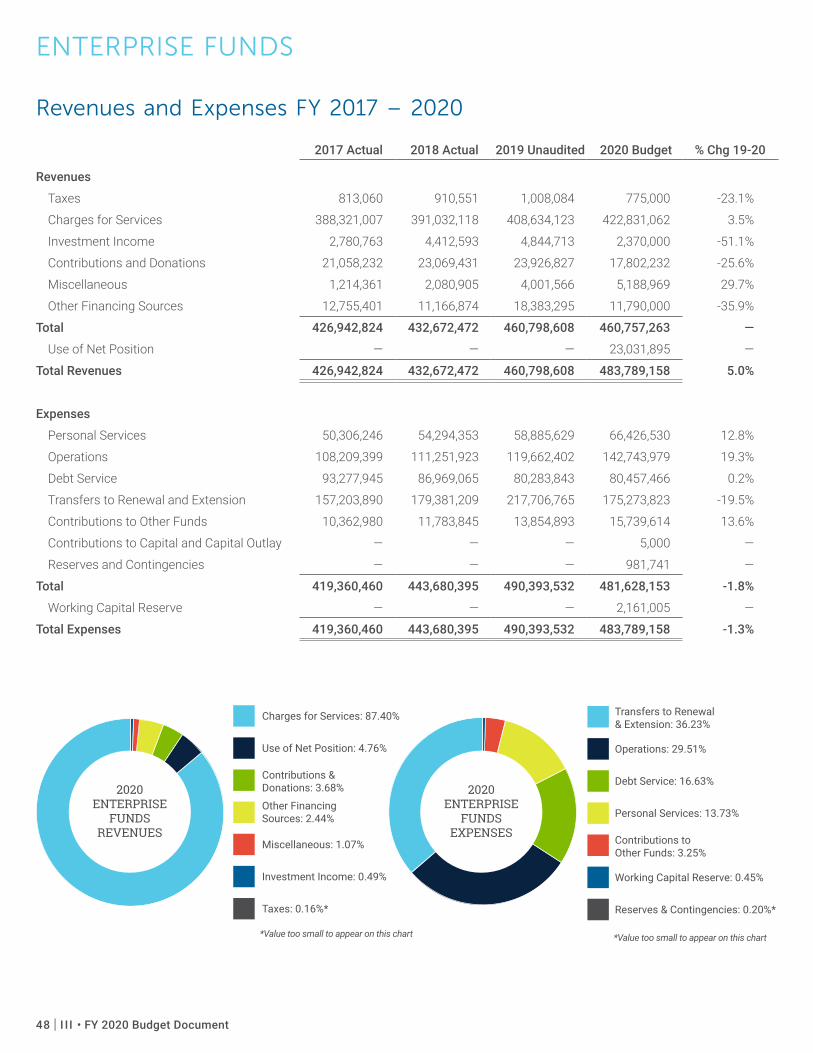
Charges for Services: 87.40%
Use of Net Position: 4.76%
Contributions & Donations: 3.68%
Other Financing Sources: 2.44%
Miscellaneous: 1.07%
Investment Income: 0.49%
Taxes: 0.16%*
Transfers to Renewal & Extension: 36.23%
Operations: 29.51%
Debt Service: 16.63%
Personal Services: 13.73%
Contributions to Other Funds: 3.25%
Working Capital Reserve: 0.45%
Reserves & Contingencies: 0.20%*
2020ENTERPRISE
FUNDS REVENUES
2020ENTERPRISE
FUNDS EXPENSES
*Value too small to appear on this chart*Value too small to appear on this chart
ENTERPRISE FUNDS
Revenues and Expenses FY 2017 – 2020
2017 Actual 2018 Actual 2019 Unaudited 2020 Budget % Chg 19-20
Revenues
Taxes 813,060 910,551 1,008,084 775,000 -23.1%
Charges for Services 388,321,007 391,032,118 408,634,123 422,831,062 3.5%
Investment Income 2,780,763 4,412,593 4,844,713 2,370,000 -51.1%
Contributions and Donations 21,058,232 23,069,431 23,926,827 17,802,232 -25.6%
Miscellaneous 1,214,361 2,080,905 4,001,566 5,188,969 29.7%
Other Financing Sources 12,755,401 11,166,874 18,383,295 11,790,000 -35.9%
Total 426,942,824 432,672,472 460,798,608 460,757,263 —
Use of Net Position — — — 23,031,895 —
Total Revenues 426,942,824 432,672,472 460,798,608 483,789,158 5.0%
Expenses
Personal Services 50,306,246 54,294,353 58,885,629 66,426,530 12.8%
Operations 108,209,399 111,251,923 119,662,402 142,743,979 19.3%
Debt Service 93,277,945 86,969,065 80,283,843 80,457,466 0.2%
Transfers to Renewal and Extension 157,203,890 179,381,209 217,706,765 175,273,823 -19.5%
Contributions to Other Funds 10,362,980 11,783,845 13,854,893 15,739,614 13.6%
Contributions to Capital and Capital Outlay — — — 5,000 —
Reserves and Contingencies — — — 981,741 —
Total 419,360,460 443,680,395 490,393,532 481,628,153 -1.8%
Working Capital Reserve — — — 2,161,005 —
Total Expenses 419,360,460 443,680,395 490,393,532 483,789,158 -1.3%
48 | I I I • FY 2020 Budget Document
ENTERPRISE FUNDS
Major Revenue Sources Definitions and Assumptions
Charges For ServicesCharges for Services represent approximately 92 percent of the total fiscal year 2020 budgeted revenues, excluding the use of net position, in the Enterprise Funds.
Funds Revenue Definition Assumptions
Airport Operating Fund A percentage of gross fees, fuel sales com-missions, rental of tie-down spaces, and other miscellaneous fees and charges.
These revenues have been fairly consistent over time and are based on historical trends and an-ticipated activity in the current year.
Local Transit Operating Fund Fares for bus transportation within the local transit system. The local services rates are $2.50/adult/one-way; $1.25/senior citizen and disabled citizens/one-way. The express service rate is $3.75 (Zone 1) or $5.00 (Zone 2)/adult/one-way.
These revenues are based on historical trends and anticipated activity in the current year. The Local Transit Fund is not completely self-support-ing, and charges for services are subsidized by a contribution from the General Fund.
Solid Waste Operating Fund Residential solid waste fees. The rate for resi-dential services is $18.23 per month.
These revenues have been fairly consistent over time and are based on historical trends and antici-pated activity in the current year.
Stormwater Operating Fund Fees due to an agreement between the County and each city for their stormwater drainage and discharge and fees charged to property owners in unincorporated Gwinnett County for stormwater utility fees. The rate charged has remained $2.46 since 2009.
Water and Sewer Operating Fund
Retail and wholesale sales of water and sew-er services, miscellaneous water and sewer fees and permits, fire hydrant rental fees, and fire service pipe and water service connec-tion charges based on water meter size.
Water and sewer revenues are monitored very closely to ensure that rate structures are in place to adequately fund the public utility system operations and debt service requirements. The Board of Commissioners traditionally enacts multi-year rate resolutions for Water and Sewer. The adopted rate resolution covers the period of 2019 – 2025 with modest rate increases every other year for the next seven years starting in 2019. The increases will result in an average 1.15 percent per year increase in a residential water and sewer bill through 2025.
Contributions And DonationsContributions and Donations represent approximately 4 percent of the total fiscal year 2020 budgeted revenues, excluding the use of net position, in the Enterprise Funds.
Funds Revenue Definition Assumptions
Water and Sewer Operating Fund
Financial resources generally provided by private contributors. Con-tributions from developers and System Development Charge rev-enues are receipted in this category.
These revenues are budgeted based on historical trends and anticipated activity in the current year.
FY 2020 Budget Document • I I I | 49
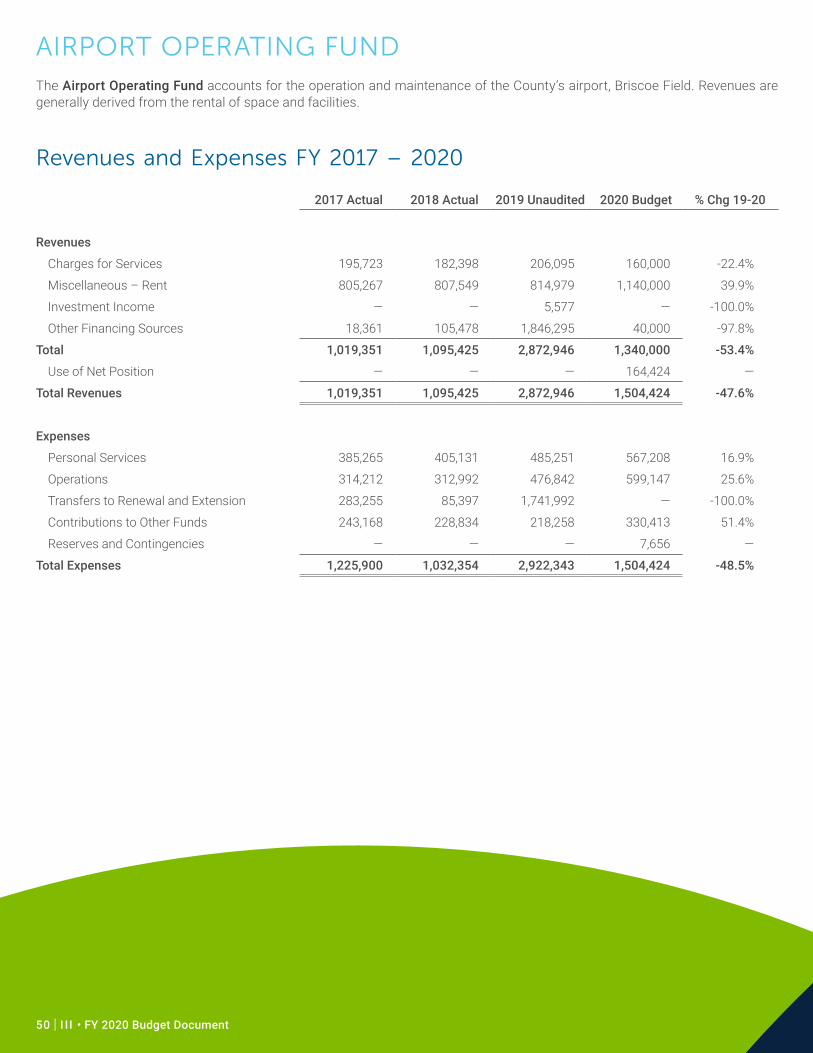
AIRPORT OPERATING FUNDThe Airport Operating Fund accounts for the operation and maintenance of the County’s airport, Briscoe Field. Revenues are generally derived from the rental of space and facilities.
Revenues and Expenses FY 2017 – 2020
2017 Actual 2018 Actual 2019 Unaudited 2020 Budget % Chg 19-20
Revenues
Charges for Services 195,723 182,398 206,095 160,000 -22.4%
Miscellaneous – Rent 805,267 807,549 814,979 1,140,000 39.9%
Investment Income — — 5,577 — -100.0%
Other Financing Sources 18,361 105,478 1,846,295 40,000 -97.8%
Total 1,019,351 1,095,425 2,872,946 1,340,000 -53.4%
Use of Net Position — — — 164,424 —
Total Revenues 1,019,351 1,095,425 2,872,946 1,504,424 -47.6%
Expenses
Personal Services 385,265 405,131 485,251 567,208 16.9%
Operations 314,212 312,992 476,842 599,147 25.6%
Transfers to Renewal and Extension 283,255 85,397 1,741,992 — -100.0%
Contributions to Other Funds 243,168 228,834 218,258 330,413 51.4%
Reserves and Contingencies — — — 7,656 —
Total Expenses 1,225,900 1,032,354 2,922,343 1,504,424 -48.5%
50 | I I I • FY 2020 Budget Document
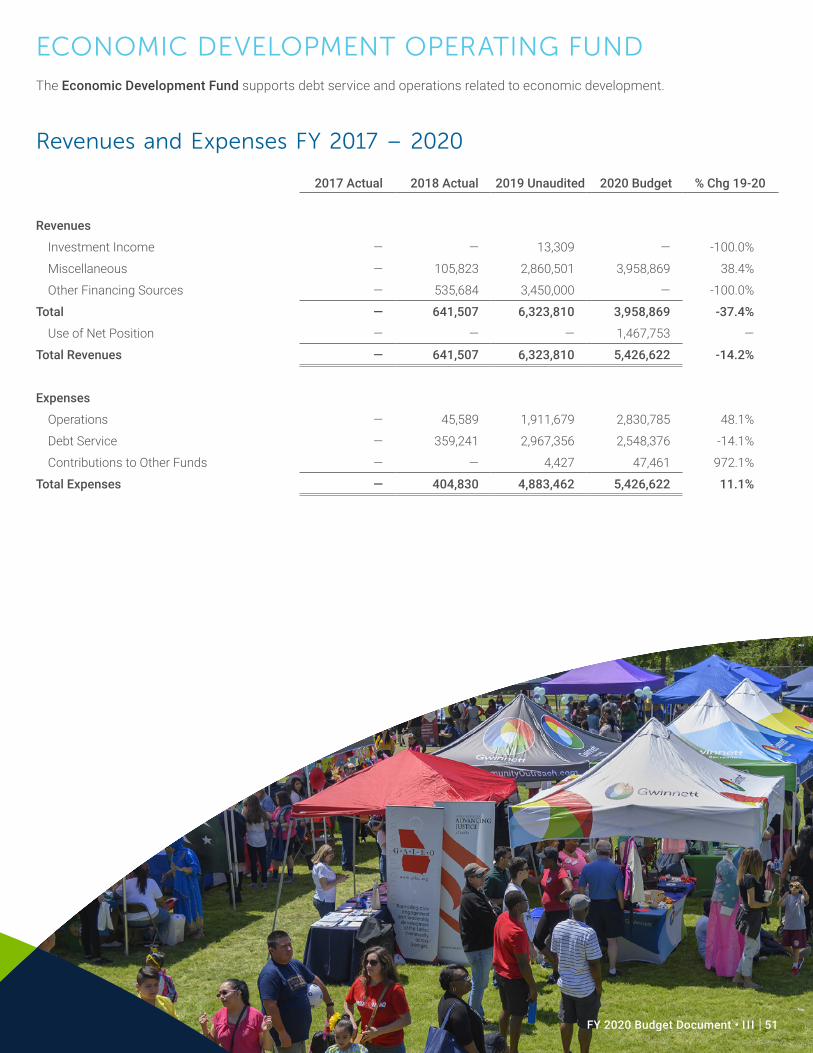
ECONOMIC DEVELOPMENT OPERATING FUNDThe Economic Development Fund supports debt service and operations related to economic development.
Revenues and Expenses FY 2017 – 2020
2017 Actual 2018 Actual 2019 Unaudited 2020 Budget % Chg 19-20
Revenues
Investment Income — — 13,309 — -100.0%
Miscellaneous — 105,823 2,860,501 3,958,869 38.4%
Other Financing Sources — 535,684 3,450,000 — -100.0%
Total — 641,507 6,323,810 3,958,869 -37.4%
Use of Net Position — — — 1,467,753 —
Total Revenues — 641,507 6,323,810 5,426,622 -14.2%
Expenses
Operations — 45,589 1,911,679 2,830,785 48.1%
Debt Service — 359,241 2,967,356 2,548,376 -14.1%
Contributions to Other Funds — — 4,427 47,461 972.1%
Total Expenses — 404,830 4,883,462 5,426,622 11.1%
FY 2020 Budget Document • I I I | 51
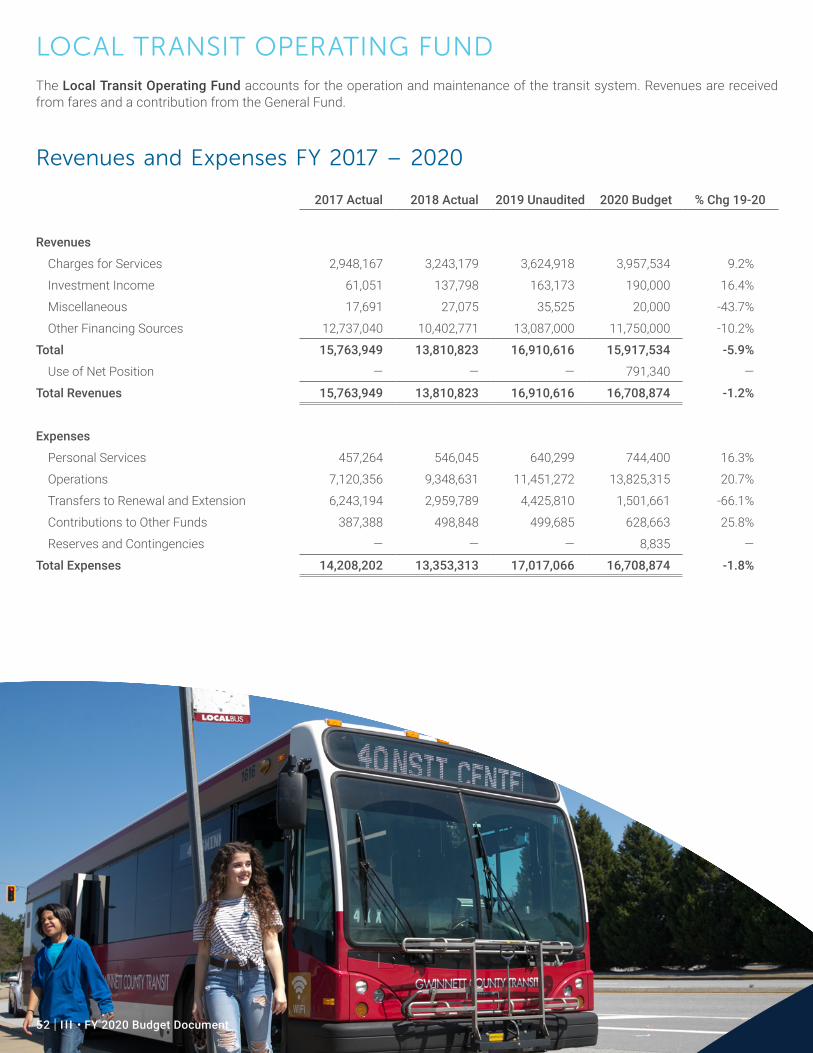
LOCAL TRANSIT OPERATING FUNDThe Local Transit Operating Fund accounts for the operation and maintenance of the transit system. Revenues are received from fares and a contribution from the General Fund.
Revenues and Expenses FY 2017 – 2020
2017 Actual 2018 Actual 2019 Unaudited 2020 Budget % Chg 19-20
Revenues
Charges for Services 2,948,167 3,243,179 3,624,918 3,957,534 9.2%
Investment Income 61,051 137,798 163,173 190,000 16.4%
Miscellaneous 17,691 27,075 35,525 20,000 -43.7%
Other Financing Sources 12,737,040 10,402,771 13,087,000 11,750,000 -10.2%
Total 15,763,949 13,810,823 16,910,616 15,917,534 -5.9%
Use of Net Position — — — 791,340 —
Total Revenues 15,763,949 13,810,823 16,910,616 16,708,874 -1.2%
Expenses
Personal Services 457,264 546,045 640,299 744,400 16.3%
Operations 7,120,356 9,348,631 11,451,272 13,825,315 20.7%
Transfers to Renewal and Extension 6,243,194 2,959,789 4,425,810 1,501,661 -66.1%
Contributions to Other Funds 387,388 498,848 499,685 628,663 25.8%
Reserves and Contingencies — — — 8,835 —
Total Expenses 14,208,202 13,353,313 17,017,066 16,708,874 -1.8%
52 | I I I • FY 2020 Budget Document
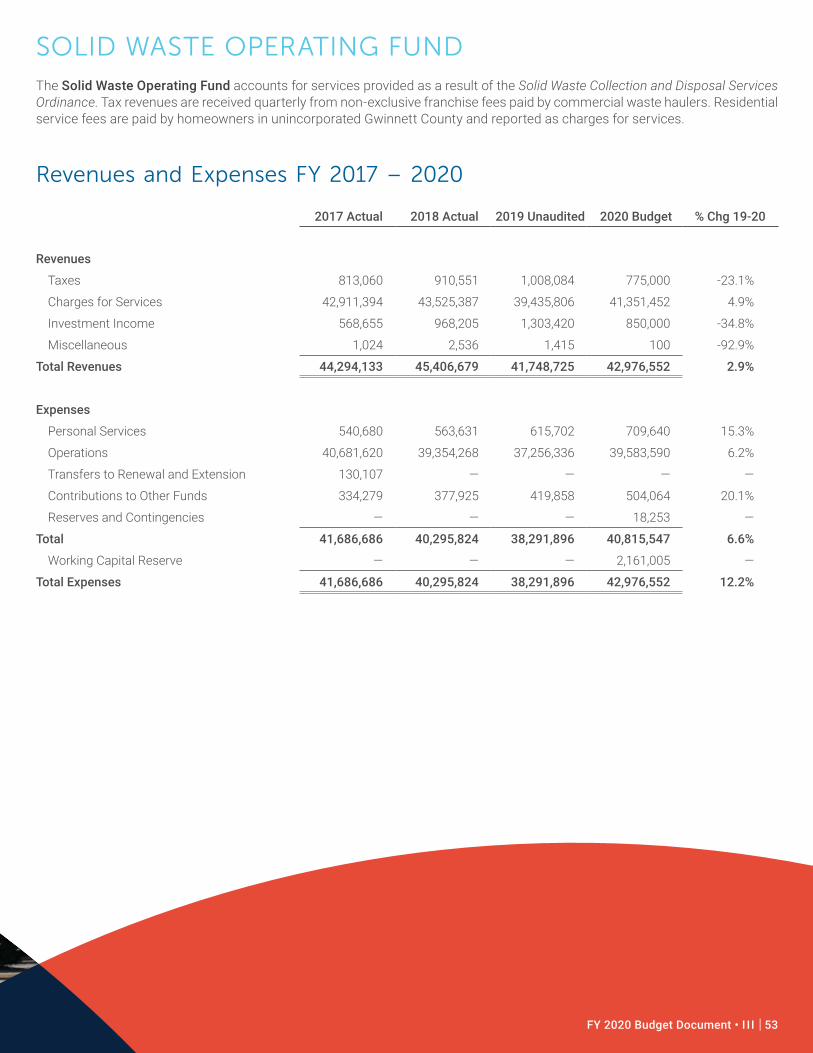
SOLID WASTE OPERATING FUNDThe Solid Waste Operating Fund accounts for services provided as a result of the Solid Waste Collection and Disposal Services Ordinance. Tax revenues are received quarterly from non-exclusive franchise fees paid by commercial waste haulers. Residential service fees are paid by homeowners in unincorporated Gwinnett County and reported as charges for services.
Revenues and Expenses FY 2017 – 2020
2017 Actual 2018 Actual 2019 Unaudited 2020 Budget % Chg 19-20
Revenues
Taxes 813,060 910,551 1,008,084 775,000 -23.1%
Charges for Services 42,911,394 43,525,387 39,435,806 41,351,452 4.9%
Investment Income 568,655 968,205 1,303,420 850,000 -34.8%
Miscellaneous 1,024 2,536 1,415 100 -92.9%
Total Revenues 44,294,133 45,406,679 41,748,725 42,976,552 2.9%
Expenses
Personal Services 540,680 563,631 615,702 709,640 15.3%
Operations 40,681,620 39,354,268 37,256,336 39,583,590 6.2%
Transfers to Renewal and Extension 130,107 — — — —
Contributions to Other Funds 334,279 377,925 419,858 504,064 20.1%
Reserves and Contingencies — — — 18,253 —
Total 41,686,686 40,295,824 38,291,896 40,815,547 6.6%
Working Capital Reserve — — — 2,161,005 —
Total Expenses 41,686,686 40,295,824 38,291,896 42,976,552 12.2%
FY 2020 Budget Document • I I I | 53
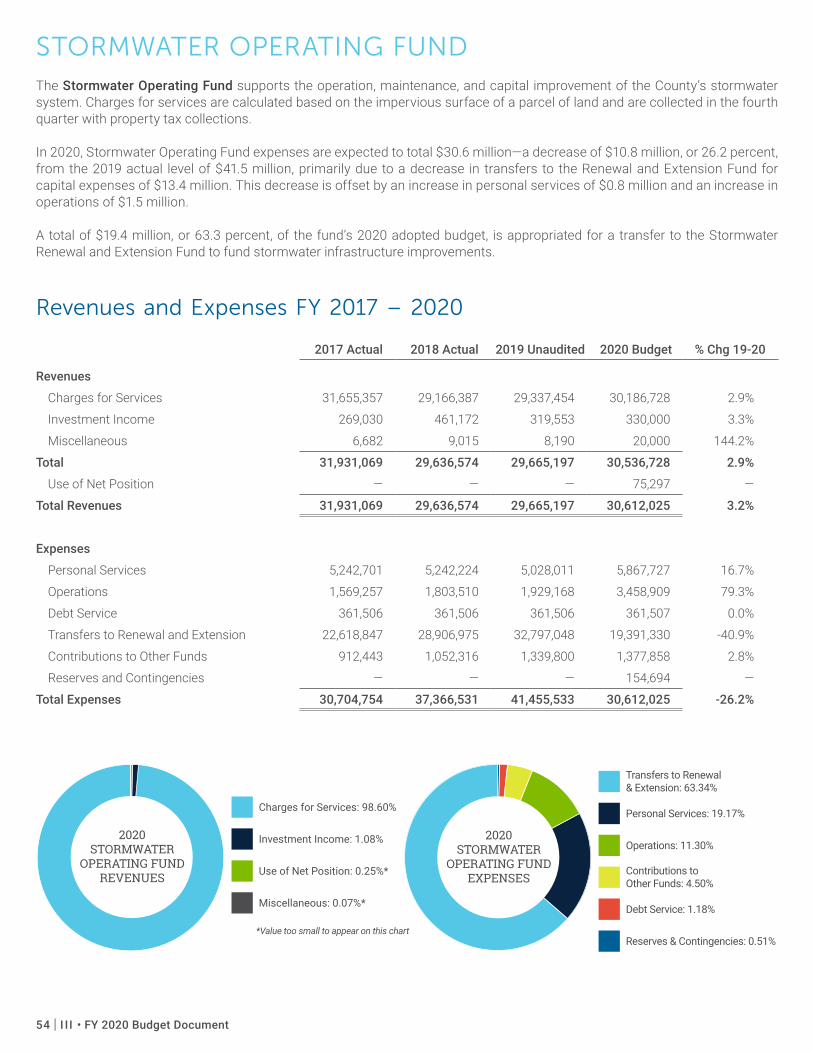
STORMWATER OPERATING FUNDThe Stormwater Operating Fund supports the operation, maintenance, and capital improvement of the County’s stormwater system. Charges for services are calculated based on the impervious surface of a parcel of land and are collected in the fourth quarter with property tax collections.
In 2020, Stormwater Operating Fund expenses are expected to total $30.6 million—a decrease of $10.8 million, or 26.2 percent, from the 2019 actual level of $41.5 million, primarily due to a decrease in transfers to the Renewal and Extension Fund for capital expenses of $13.4 million. This decrease is offset by an increase in personal services of $0.8 million and an increase in operations of $1.5 million.
A total of $19.4 million, or 63.3 percent, of the fund’s 2020 adopted budget, is appropriated for a transfer to the Stormwater Renewal and Extension Fund to fund stormwater infrastructure improvements.
Revenues and Expenses FY 2017 – 2020
2017 Actual 2018 Actual 2019 Unaudited 2020 Budget % Chg 19-20
Revenues
Charges for Services 31,655,357 29,166,387 29,337,454 30,186,728 2.9%
Investment Income 269,030 461,172 319,553 330,000 3.3%
Miscellaneous 6,682 9,015 8,190 20,000 144.2%
Total 31,931,069 29,636,574 29,665,197 30,536,728 2.9%
Use of Net Position — — — 75,297 —
Total Revenues 31,931,069 29,636,574 29,665,197 30,612,025 3.2%
Expenses
Personal Services 5,242,701 5,242,224 5,028,011 5,867,727 16.7%
Operations 1,569,257 1,803,510 1,929,168 3,458,909 79.3%
Debt Service 361,506 361,506 361,506 361,507 0.0%
Transfers to Renewal and Extension 22,618,847 28,906,975 32,797,048 19,391,330 -40.9%
Contributions to Other Funds 912,443 1,052,316 1,339,800 1,377,858 2.8%
Reserves and Contingencies — — — 154,694 —
Total Expenses 30,704,754 37,366,531 41,455,533 30,612,025 -26.2%
Charges for Services: 98.60%
Investment Income: 1.08%
Use of Net Position: 0.25%*
Miscellaneous: 0.07%*
*Value too small to appear on this chart
2020STORMWATER
OPERATING FUND REVENUES
Transfers to Renewal & Extension: 63.34%
Personal Services: 19.17%
Operations: 11.30%
Contributions to Other Funds: 4.50%
Debt Service: 1.18%
Reserves & Contingencies: 0.51%
2020STORMWATER
OPERATING FUND EXPENSES
54 | I I I • FY 2020 Budget Document
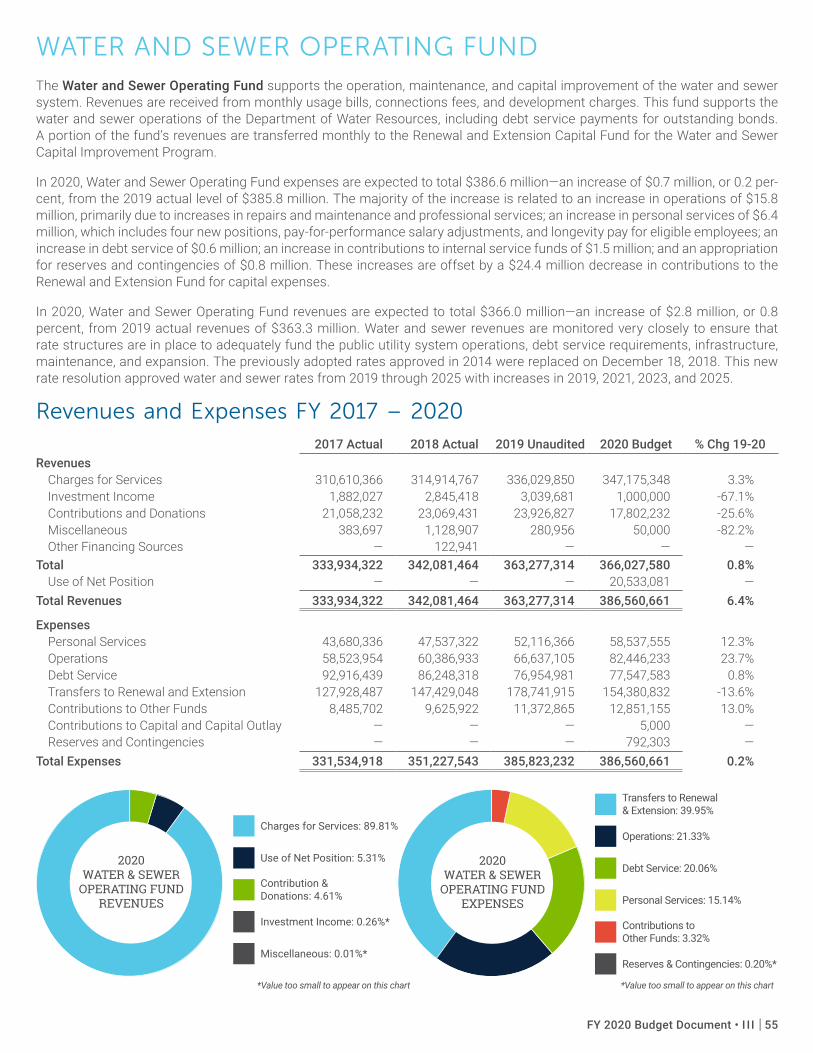
WATER AND SEWER OPERATING FUNDThe Water and Sewer Operating Fund supports the operation, maintenance, and capital improvement of the water and sewer system. Revenues are received from monthly usage bills, connections fees, and development charges. This fund supports the water and sewer operations of the Department of Water Resources, including debt service payments for outstanding bonds. A portion of the fund’s revenues are transferred monthly to the Renewal and Extension Capital Fund for the Water and Sewer Capital Improvement Program.
In 2020, Water and Sewer Operating Fund expenses are expected to total $386.6 million—an increase of $0.7 million, or 0.2 per-cent, from the 2019 actual level of $385.8 million. The majority of the increase is related to an increase in operations of $15.8 million, primarily due to increases in repairs and maintenance and professional services; an increase in personal services of $6.4 million, which includes four new positions, pay-for-performance salary adjustments, and longevity pay for eligible employees; an increase in debt service of $0.6 million; an increase in contributions to internal service funds of $1.5 million; and an appropriation for reserves and contingencies of $0.8 million. These increases are offset by a $24.4 million decrease in contributions to the Renewal and Extension Fund for capital expenses.
In 2020, Water and Sewer Operating Fund revenues are expected to total $366.0 million—an increase of $2.8 million, or 0.8 percent, from 2019 actual revenues of $363.3 million. Water and sewer revenues are monitored very closely to ensure that rate structures are in place to adequately fund the public utility system operations, debt service requirements, infrastructure, maintenance, and expansion. The previously adopted rates approved in 2014 were replaced on December 18, 2018. This new rate resolution approved water and sewer rates from 2019 through 2025 with increases in 2019, 2021, 2023, and 2025.
Revenues and Expenses FY 2017 – 2020 2017 Actual 2018 Actual 2019 Unaudited 2020 Budget % Chg 19-20
RevenuesCharges for Services 310,610,366 314,914,767 336,029,850 347,175,348 3.3%Investment Income 1,882,027 2,845,418 3,039,681 1,000,000 -67.1%Contributions and Donations 21,058,232 23,069,431 23,926,827 17,802,232 -25.6%Miscellaneous 383,697 1,128,907 280,956 50,000 -82.2%Other Financing Sources — 122,941 — — —
Total 333,934,322 342,081,464 363,277,314 366,027,580 0.8%Use of Net Position — — — 20,533,081 —
Total Revenues 333,934,322 342,081,464 363,277,314 386,560,661 6.4%
ExpensesPersonal Services 43,680,336 47,537,322 52,116,366 58,537,555 12.3%Operations 58,523,954 60,386,933 66,637,105 82,446,233 23.7%Debt Service 92,916,439 86,248,318 76,954,981 77,547,583 0.8%Transfers to Renewal and Extension 127,928,487 147,429,048 178,741,915 154,380,832 -13.6%Contributions to Other Funds 8,485,702 9,625,922 11,372,865 12,851,155 13.0%Contributions to Capital and Capital Outlay — — — 5,000 —Reserves and Contingencies — — — 792,303 —
Total Expenses 331,534,918 351,227,543 385,823,232 386,560,661 0.2%
Charges for Services: 89.81%
Use of Net Position: 5.31%
Contribution & Donations: 4.61%
Investment Income: 0.26%*
Miscellaneous: 0.01%*
2020WATER & SEWER
OPERATING FUND REVENUES
Transfers to Renewal & Extension: 39.95%
Operations: 21.33%
Debt Service: 20.06%
Personal Services: 15.14%
Contributions to Other Funds: 3.32%
Reserves & Contingencies: 0.20%*
2020WATER & SEWER
OPERATING FUND EXPENSES
*Value too small to appear on this chart*Value too small to appear on this chart
FY 2020 Budget Document • I I I | 55
INTERNAL SERVICE FUNDS
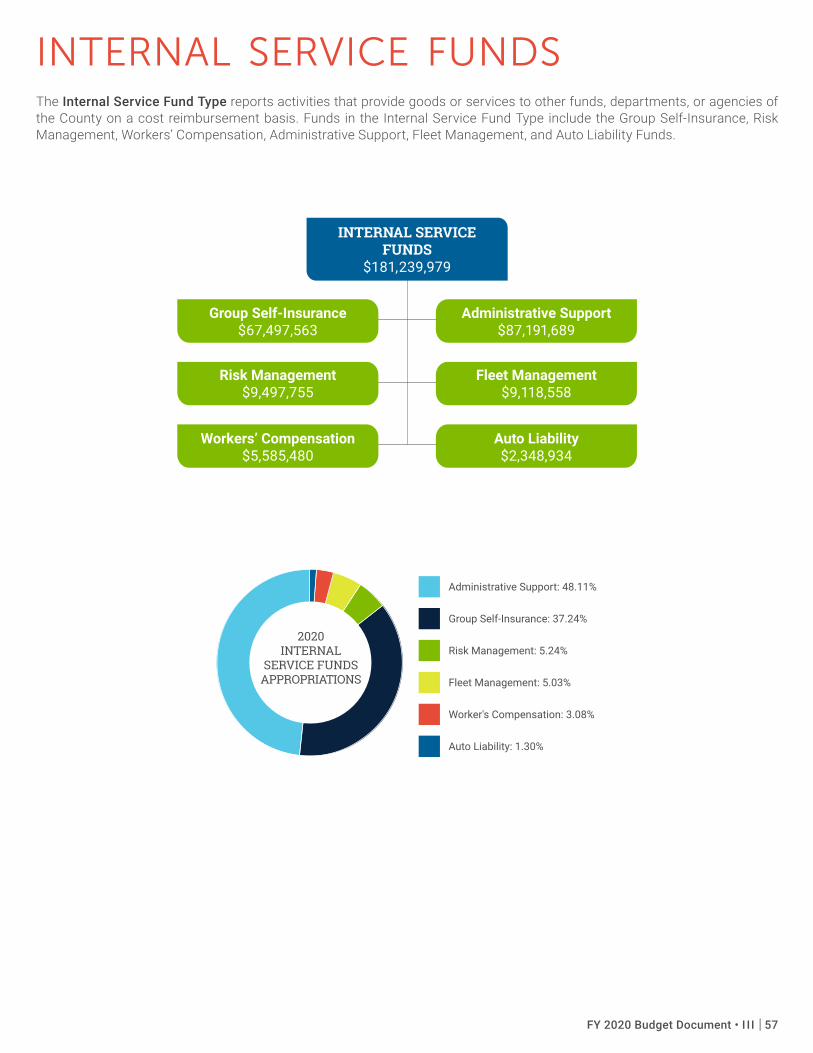
INTERNAL SERVICE FUNDSThe Internal Service Fund Type reports activities that provide goods or services to other funds, departments, or agencies of the County on a cost reimbursement basis. Funds in the Internal Service Fund Type include the Group Self-Insurance, Risk Management, Workers’ Compensation, Administrative Support, Fleet Management, and Auto Liability Funds.
INTERNAL SERVICEFUNDS
$181,239,979
Administrative Support$87,191,689
Auto Liability$2,348,934
Fleet Management$9,118,558
Group Self-Insurance$67,497,563
Risk Management$9,497,755
Workers’ Compensation$5,585,480
Administrative Support: 48.11%
Group Self-Insurance: 37.24%
Risk Management: 5.24%
Fleet Management: 5.03%
Worker's Compensation: 3.08%
Auto Liability: 1.30%
2020INTERNAL
SERVICE FUNDS APPROPRIATIONS
Administrative Support: 48.11%
Group Self-Insurance: 37.24%
Risk Management: 5.24%
Fleet Management: 5.03%
Worker's Compensation: 3.08%
Auto Liability: 1.30%
2020INTERNAL
SERVICE FUNDS APPROPRIATIONS
Administrative Support: 48.11%
Group Self-Insurance: 37.24%
Risk Management: 5.24%
Fleet Management: 5.03%
Worker's Compensation: 3.08%
Auto Liability: 1.30%
2020INTERNAL
SERVICE FUNDS APPROPRIATIONS
FY 2020 Budget Document • I I I | 57
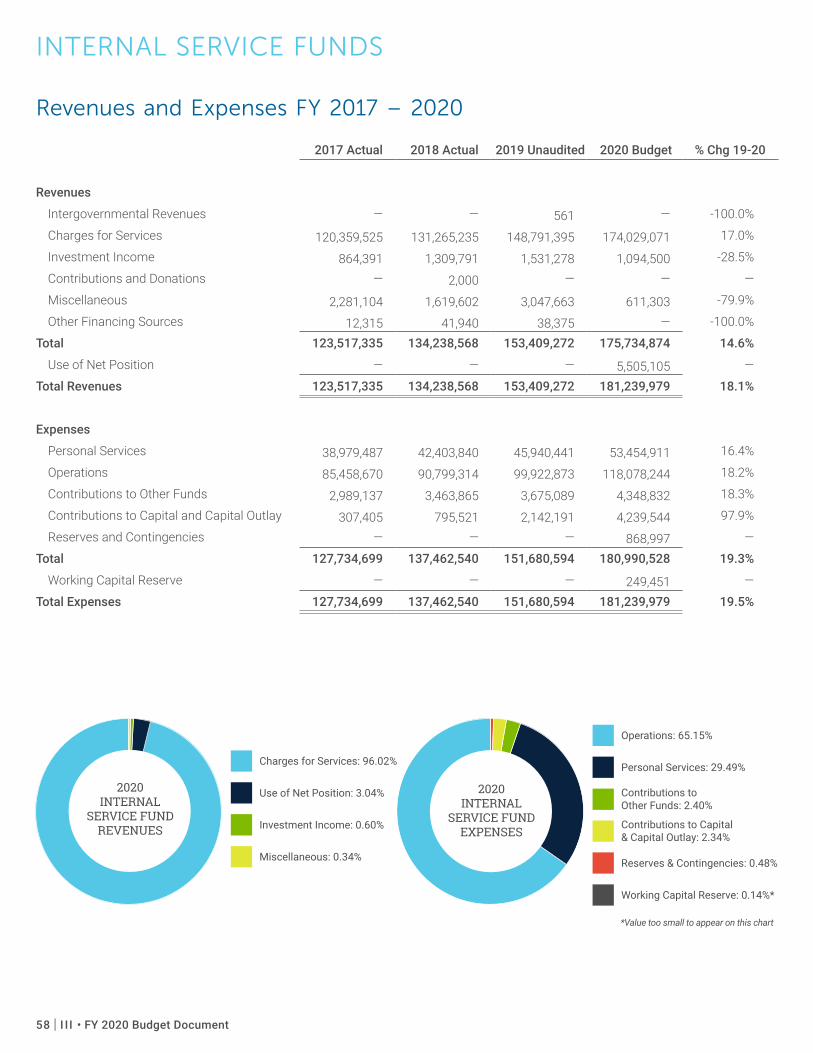
Charges for Services: 96.02%
Use of Net Position: 3.04%
Investment Income: 0.60%
Miscellaneous: 0.34%
2020 INTERNAL
SERVICE FUND REVENUES
Operations: 65.15%
Personal Services: 29.49%
Contributions to Other Funds: 2.40%
Contributions to Capital & Capital Outlay: 2.34%
Reserves & Contingencies: 0.48%
Working Capital Reserve: 0.14%*
2020 INTERNAL
SERVICE FUNDEXPENSES
*Value too small to appear on this chart
INTERNAL SERVICE FUNDS
Revenues and Expenses FY 2017 – 2020
2017 Actual 2018 Actual 2019 Unaudited 2020 Budget % Chg 19-20
Revenues
Intergovernmental Revenues — — 561 — -100.0%
Charges for Services 120,359,525 131,265,235 148,791,395 174,029,071 17.0%
Investment Income 864,391 1,309,791 1,531,278 1,094,500 -28.5%
Contributions and Donations — 2,000 — — —
Miscellaneous 2,281,104 1,619,602 3,047,663 611,303 -79.9%
Other Financing Sources 12,315 41,940 38,375 — -100.0%
Total 123,517,335 134,238,568 153,409,272 175,734,874 14.6%
Use of Net Position — — — 5,505,105 —
Total Revenues 123,517,335 134,238,568 153,409,272 181,239,979 18.1%
Expenses
Personal Services 38,979,487 42,403,840 45,940,441 53,454,911 16.4%
Operations 85,458,670 90,799,314 99,922,873 118,078,244 18.2%
Contributions to Other Funds 2,989,137 3,463,865 3,675,089 4,348,832 18.3%
Contributions to Capital and Capital Outlay 307,405 795,521 2,142,191 4,239,544 97.9%
Reserves and Contingencies — — — 868,997 —
Total 127,734,699 137,462,540 151,680,594 180,990,528 19.3%
Working Capital Reserve — — — 249,451 —
Total Expenses 127,734,699 137,462,540 151,680,594 181,239,979 19.5%
58 | I I I • FY 2020 Budget Document
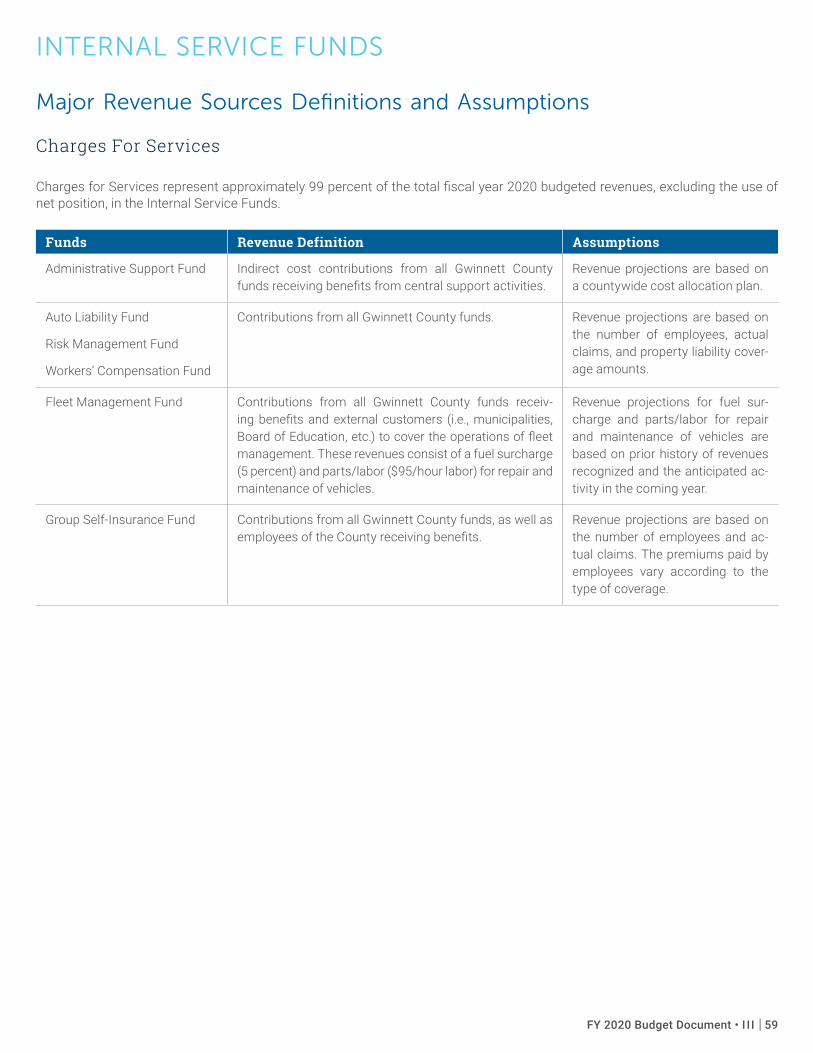
INTERNAL SERVICE FUNDS
Major Revenue Sources Definitions and Assumptions
Charges For Services
Charges for Services represent approximately 99 percent of the total fiscal year 2020 budgeted revenues, excluding the use of net position, in the Internal Service Funds.
Funds Revenue Definition Assumptions
Administrative Support Fund Indirect cost contributions from all Gwinnett County funds receiving benefits from central support activities.
Revenue projections are based on a countywide cost allocation plan.
Auto Liability Fund
Risk Management Fund
Workers’ Compensation Fund
Contributions from all Gwinnett County funds. Revenue projections are based on the number of employees, actual claims, and property liability cover-age amounts.
Fleet Management Fund Contributions from all Gwinnett County funds receiv-ing benefits and external customers (i.e., municipalities, Board of Education, etc.) to cover the operations of fleet management. These revenues consist of a fuel surcharge (5 percent) and parts/labor ($95/hour labor) for repair and maintenance of vehicles.
Revenue projections for fuel sur-charge and parts/labor for repair and maintenance of vehicles are based on prior history of revenues recognized and the anticipated ac-tivity in the coming year.
Group Self-Insurance Fund Contributions from all Gwinnett County funds, as well as employees of the County receiving benefits.
Revenue projections are based on the number of employees and ac-tual claims. The premiums paid by employees vary according to the type of coverage.
FY 2020 Budget Document • I I I | 59
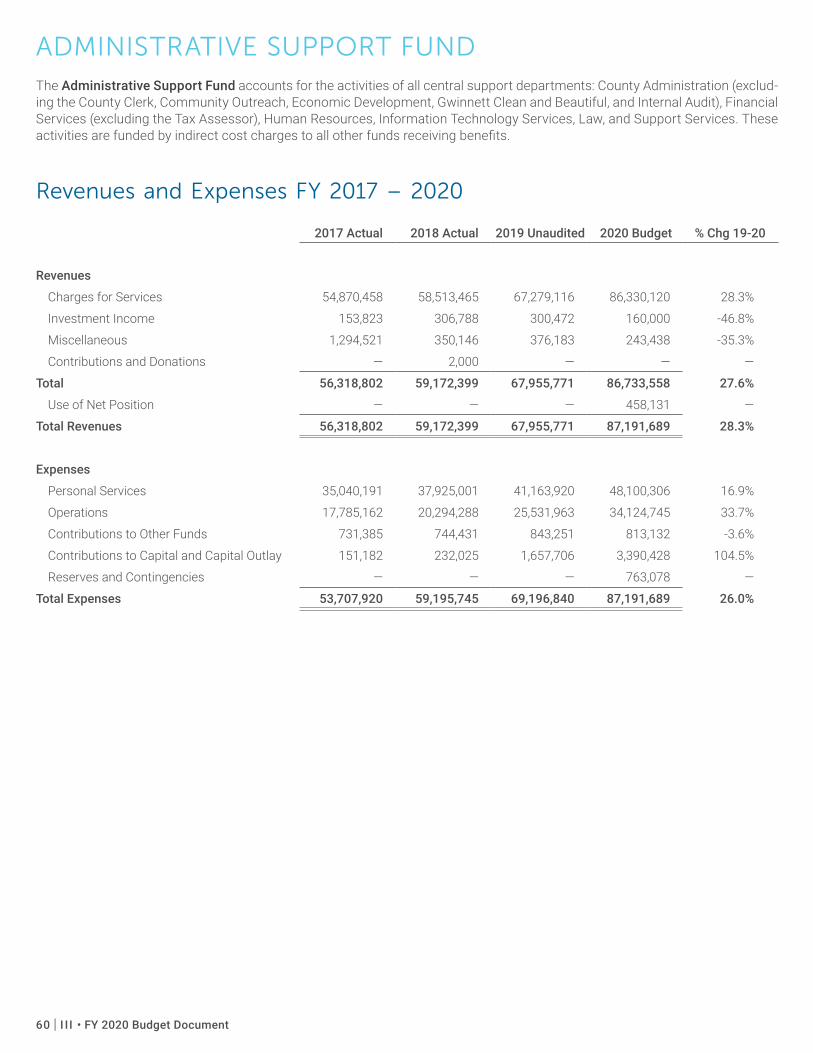
ADMINISTRATIVE SUPPORT FUNDThe Administrative Support Fund accounts for the activities of all central support departments: County Administration (exclud-ing the County Clerk, Community Outreach, Economic Development, Gwinnett Clean and Beautiful, and Internal Audit), Financial Services (excluding the Tax Assessor), Human Resources, Information Technology Services, Law, and Support Services. These activities are funded by indirect cost charges to all other funds receiving benefits.
Revenues and Expenses FY 2017 – 2020
2017 Actual 2018 Actual 2019 Unaudited 2020 Budget % Chg 19-20
Revenues
Charges for Services 54,870,458 58,513,465 67,279,116 86,330,120 28.3%
Investment Income 153,823 306,788 300,472 160,000 -46.8%
Miscellaneous 1,294,521 350,146 376,183 243,438 -35.3%
Contributions and Donations — 2,000 — — —
Total 56,318,802 59,172,399 67,955,771 86,733,558 27.6%
Use of Net Position — — — 458,131 —
Total Revenues 56,318,802 59,172,399 67,955,771 87,191,689 28.3%
Expenses
Personal Services 35,040,191 37,925,001 41,163,920 48,100,306 16.9%
Operations 17,785,162 20,294,288 25,531,963 34,124,745 33.7%
Contributions to Other Funds 731,385 744,431 843,251 813,132 -3.6%
Contributions to Capital and Capital Outlay 151,182 232,025 1,657,706 3,390,428 104.5%
Reserves and Contingencies — — — 763,078 —
Total Expenses 53,707,920 59,195,745 69,196,840 87,191,689 26.0%
60 | I I I • FY 2020 Budget Document
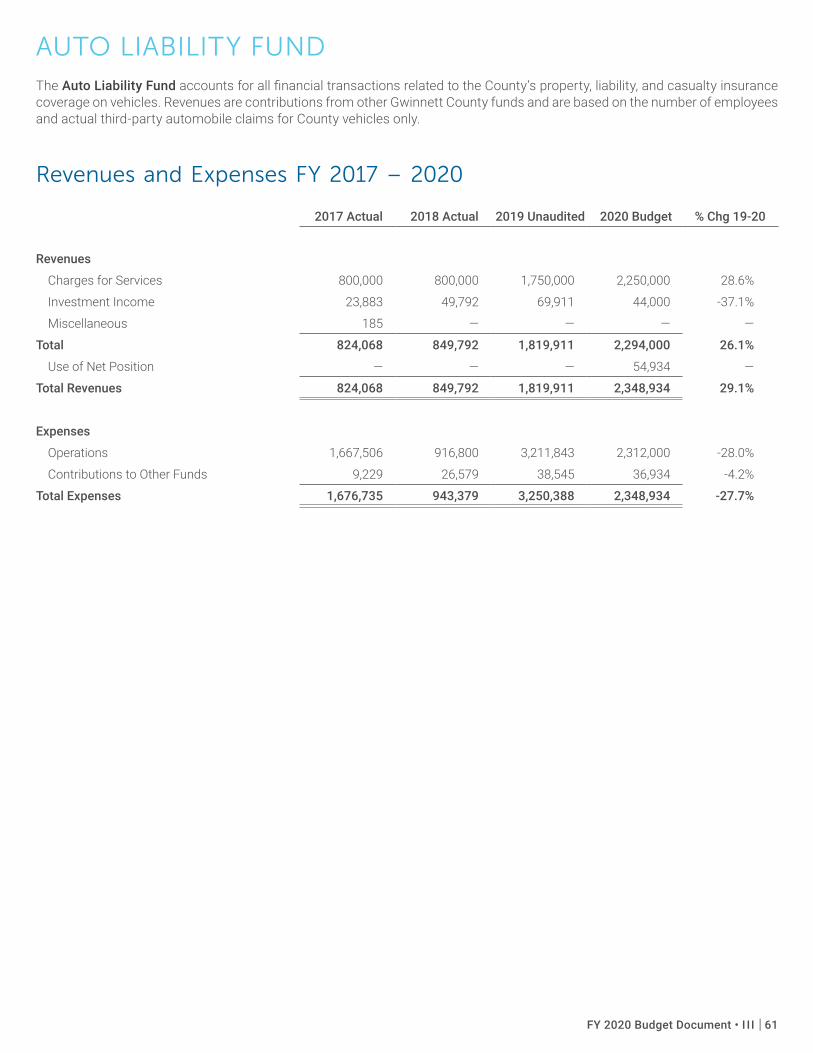
AUTO LIABILITY FUNDThe Auto Liability Fund accounts for all financial transactions related to the County’s property, liability, and casualty insurance coverage on vehicles. Revenues are contributions from other Gwinnett County funds and are based on the number of employees and actual third-party automobile claims for County vehicles only.
Revenues and Expenses FY 2017 – 2020
2017 Actual 2018 Actual 2019 Unaudited 2020 Budget % Chg 19-20
Revenues
Charges for Services 800,000 800,000 1,750,000 2,250,000 28.6%
Investment Income 23,883 49,792 69,911 44,000 -37.1%
Miscellaneous 185 — — — —
Total 824,068 849,792 1,819,911 2,294,000 26.1%
Use of Net Position — — — 54,934 —
Total Revenues 824,068 849,792 1,819,911 2,348,934 29.1%
Expenses
Operations 1,667,506 916,800 3,211,843 2,312,000 -28.0%
Contributions to Other Funds 9,229 26,579 38,545 36,934 -4.2%
Total Expenses 1,676,735 943,379 3,250,388 2,348,934 -27.7%
FY 2020 Budget Document • I I I | 61
FLEET MANAGEMENT FUNDThe Fleet Management Fund accounts for all financial transactions related to the maintenance of the County fleet. Revenues are derived from charges to the user departments for fuel, maintenance, repair, and insurance, plus a fixed flat rate surcharge per vehicle per month.
Revenues and Expenses FY 2017 – 2020
2017 Actual 2018 Actual 2019 Unaudited 2020 Budget % Chg 19-20
Revenues
Intergovernmental Revenues — — 561 — -100.0%
Charges for Services 5,443,260 6,758,578 7,820,745 8,750,693 11.9%
Miscellaneous 283,106 284,829 296,814 367,865 23.9%
Other Financing Sources — 41,940 38,375 — -100.0%
Total Revenues 5,726,366 7,085,347 8,156,495 9,118,558 11.8%
Expenses
Personal Services 2,933,448 3,260,600 3,329,873 3,729,354 12.0%
Operations 1,834,099 1,612,799 1,580,424 2,248,068 42.2%
Contributions to Other Funds 1,478,293 1,557,274 1,503,672 1,986,979 32.1%
Contributions to Capital and Capital Outlay 156,223 563,496 484,485 849,116 75.3%
Reserves and Contingencies — — — 55,590 —
Total 6,402,063 6,994,169 6,898,454 8,869,107 28.6%
Working Capital Reserve — — — 249,451 —
Total Expenses 6,402,063 6,994,169 6,898,454 9,118,558 32.2%
62 | I I I • FY 2020 Budget Document
GROUP SELF-INSURANCE FUNDThe Group Self-Insurance Fund accounts for all financial transactions related to the payment of premiums and benefits for active employees’ health, disability, and life insurance. Revenues are received from employee and employer contributions. The County portion of these contributions is a percentage of each department’s employee salaries.
Revenues and Expenses FY 2017 – 2020
2017 Actual 2018 Actual 2019 Unaudited 2020 Budget % Chg 19-20
Revenues
Charges for Services 52,245,807 57,693,192 62,566,534 66,348,258 6.0%
Investment Income 391,022 559,608 723,658 540,000 -25.4%
Miscellaneous 129,782 554,096 930,218 — -100.0%
Other Financing Sources 12,315 — — — —
Total 52,778,926 58,806,896 64,220,410 66,888,258 4.2%
Use of Net Position — — — 609,305 —
Total Revenues 52,778,926 58,806,896 64,220,410 67,497,563 5.1%
Expenses
Personal Services 566,030 757,656 982,608 1,119,095 13.9%
Operations 55,035,265 58,316,531 59,438,493 66,014,520 11.1%
Contributions to Other Funds* (21,368) 252,137 496,890 339,989 -31.6%
Reserves and Contingencies — — — 23,959 —
Total Expenses 55,579,927 59,326,324 60,917,991 67,497,563 10.8%
*Contributions to Other Funds includes indirect cost true-up entries.
FY 2020 Budget Document • I I I | 63
RISK MANAGEMENT FUNDThe Risk Management Fund accounts for all financial transactions related to the County’s property liability and casualty insurance. Revenues are received from charges to the user departments based on the number of employees, prior claims, and property liability coverage needs.
Revenues and Expenses FY 2017 – 2020
2017 Actual 2018 Actual 2019 Unaudited 2020 Budget % Chg 19-20
Revenues
Charges for Services 4,500,000 5,000,000 6,250,000 6,850,000 9.6%
Investment Income 132,606 149,675 171,362 148,000 -13.6%
Miscellaneous 455,520 18,303 45,043 — -100.0%
Total 5,088,126 5,167,978 6,466,405 6,998,000 8.2%
Use of Net Position — — — 2,499,755 —
Total Revenues 5,088,126 5,167,978 6,466,405 9,497,755 46.9%
Expenses
Personal Services 350,777 395,518 409,970 448,421 9.4%
Operations 4,672,031 5,941,642 5,969,457 7,922,041 32.7%
Contributions to Other Funds 763,374 838,428 746,411 1,111,650 48.9%
Reserves and Contingencies — — — 15,643 —
Total Expenses 5,786,182 7,175,588 7,125,838 9,497,755 33.3%
64 | I I I • FY 2020 Budget Document
WORKERS’ COMPENSATION FUNDThe Workers’ Compensation Fund accounts for financial transactions related to the payment of workers’ compensation claims. Revenue is received from the user departments based upon the number of employees and prior claims. The fund provides pro-tection to County employees for work-related injuries or illnesses.
Revenues and Expenses FY 2017 – 2020
2017 Actual 2018 Actual 2019 Unaudited 2020 Budget % Chg 19-20
Revenues
Charges for Services 2,500,000 2,500,000 3,125,000 3,500,000 12.0%
Investment Income 163,057 243,928 265,875 202,500 -23.8%
Miscellaneous 117,990 412,228 1,399,405 — -100.0%
Total 2,781,047 3,156,156 4,790,280 3,702,500 -22.7%
Use of Net Position — — — 1,882,980 —
Total Revenues 2,781,047 3,156,156 4,790,280 5,585,480 16.6%
Expenses
Personal Services 89,041 65,065 54,070 57,735 6.8%
Operations 4,464,607 3,717,254 4,190,693 5,456,870 30.2%
Contributions to Other Funds 28,224 45,016 46,320 60,148 29.9%
Reserves and Contingencies — — — 10,727 —
Total Expenses 4,581,872 3,827,335 4,291,083 5,585,480 30.2%
FY 2020 Budget Document • I I I | 65