operating bu dgets for fiscal year - truman...
TRANSCRIPT
OP
F
PERATI
FISCAL
ING BUFOR
L YEAR
UDGETS
R 2018
S

FY 2018 BUDGET DOCUMENTS
A. The FY 2018 Education and General Budget Page 1. Executive Summary 1
2. General Budget Priorities 1 3. Revenue Assumptions 1 4. Planned Expenditures 5 5. FY 2018 Education and General Revenue by Category 11 6. FY 2018 Education and General Expenditures by Category 15
B. The FY 2018 Auxiliary Budget 1. Executive Summary 20
2. General Budget Priorities 20 3. Revenue Assumptions 20 4. Planned Expenditures 21 5. FY 2018 Auxiliary Revenue by Category 24 6. FY 2018 Auxiliary Expenditures by Area 26
C. The FY 2018 Restricted Funds Budget
1. Executive Summary 28
2. Projected Restricted Revenues and Expenditures 28 3. FY 2018 Estimated Restricted Revenue and Expenditures 31
D. Combined Operating Budget Summary
1. Operating Budgets 33
2. Revenue Sources 34

1
FISCAL YEAR 2018 EDUCATION AND GENERAL BUDGET NARRATIVE Executive Summary
The Education and General (E&G) Budget is the operating budget which supports the
primary functions of the University including instruction, research, public service, and the
various support areas. It is funded by state appropriations, student fees, and other miscellaneous
sources. The appropriation passed by the General Assembly was a 6.58% cut, however the
budget has been developed with the state appropriation recommended by the Governor which
includes a 9% decrease. Following the 0.7% increase in all tuition categories approved in
February 2017, tuition for 2017-2018 was increased 2.1% for Missouri resident undergraduates,
3.3% for non-resident undergraduates, 2.1% for Missouri resident graduates, and 3.3% for non-
resident graduates and enrollment for FY 2018 is projected to be down by 75 FTE. The overall
result is a 3% decrease in projected revenue and expenditures compared to the FY 2017 budget.
General Budget Priorities
The FY 2018 budget was developed using the following guiding principles:
1. Protect core instructional/academic functions as much as possible.
2. Sustain key student support functions.
3. Continue to develop administrative efficiencies and reduce administrative costs whenever
possible.
4. Reduce equipment/operations funds primarily in targeted areas of where purchases can be
deferred.
5. Avoid significant increases in costs to students by using modest increases in tuition to
enhance revenue while maintaining current levels of student financial aid.
6. Review every vacant position to justify continuation, reconfiguration or elimination.
7. No across the board cuts utilized.
Revenue Assumptions
General Revenue
The base general revenue appropriation for Truman from the State of Missouri and
approved by the General Assembly is 6.58% below FY 2017, however the Governor has not

2
signed this bill. Total funds appropriated from general revenue and lottery proceeds for FY 2018
are $40,671,122. Historically, the Governor withholds at least three percent of these funds as a
contingency. For Fiscal Year 2018 this requires a reserve of $1,220,134 for the standard
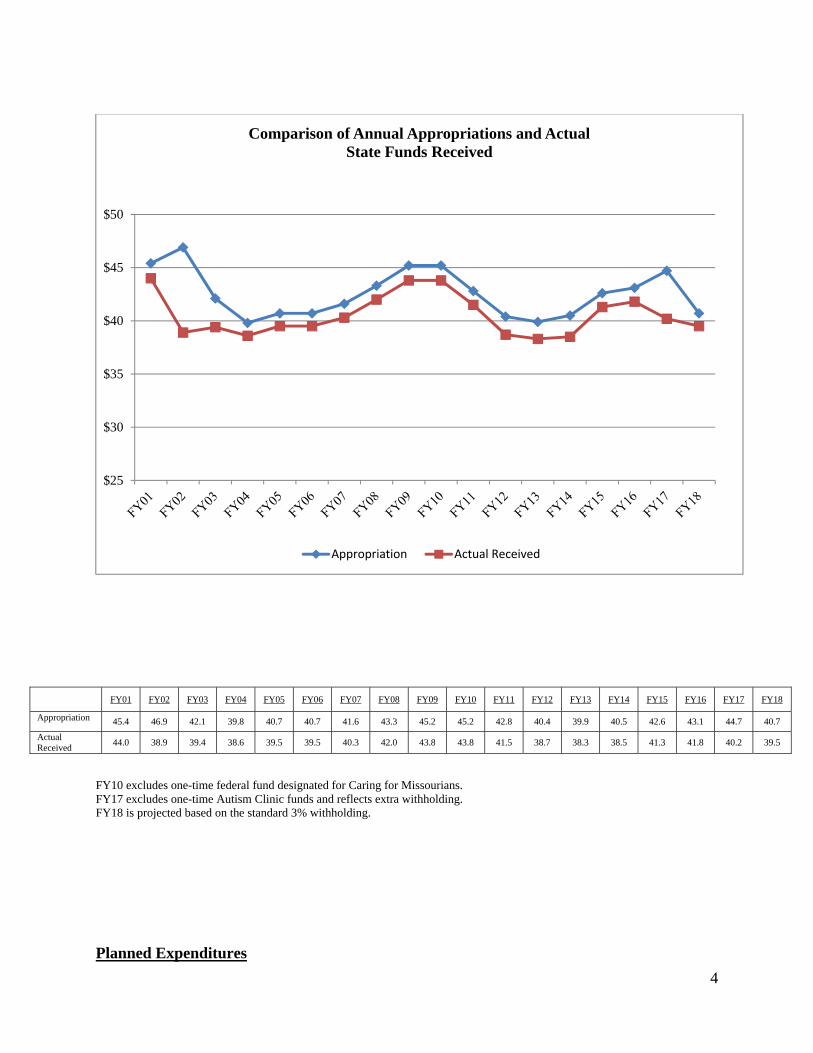
withholding. Table 1 provides a snapshot of total state revenue trends for FY 1998 through FY
2018 and reflects the actual funds received after all state withholding actions, including those
beyond the 3% level. A comparison of initial appropriations and state funds received after
withholding for FY01-FY18 is found on Table 2. Expected state support for the FY 2018 is
roughly equal to the FY 1999 level.
Enrollment Fees and Other Income
The Fall 2017 enrollment is projected for budget purposes at approximately 5,430 full-
time equivalent students. Spring 2018 enrollment is projected at the historical average of 93
percent of the fall semester total. Total tuition and required fees for 2017-2018 was increased by
2.1% for Missouri undergraduate students, increased by 3.3% for non-resident undergraduate
students, 2.1% for Missouri graduate students, and 3.3% for non-resident graduate students.
Sources of income in addition to enrollment fees include special fees, fines, charges for services,
and interest income. Due to continued low interest rates on invested funds, the interest income
available in FY 2018 is projected to be comparable to FY 2017.

3
Table 1 GENERAL REVENUE TRENDS
Ongoing State Appropriations Received
Fiscal Year Appropriation % Change FY98 $35,437,909 4.7% FY99 $39,072,485 10.3% FY00 $41,522,860 6.2% FY01 $43,987,383 5.6% FY02 $38,640,023 -12.2% FY03 $39,427,733 2.0% FY04 $38,619,423 -2.1% FY05 $39,545,109 2.4% FY06 $39,545,109 0.0% FY07 $40,346,396 2.0% FY08 $42,040,945 4.2% FY09 $43,806,665 4.2% FY10 $43,806,665 0.0% FY11 $41,526,613 -5.2% FY12 $38,619,750 -7.0% FY13 $38,325,596 -0.8% FY14 $38,542,604 0.6% FY15 $41,262,248 7.1% FY16 $41,816,820 1.3% FY17 $40,226,391 -3.8%
FY18* $39,450,989 -1.91%
*Projected Note: This table excludes funds appropriated but withheld and one-time funds. For FY10, one-time federal funds of $756,339 are excluded. For FY17, one-time Autism Clinic funds excluded, and reflects extra withholding. For FY18, the standard 3% withholding is assumed.
Table 2
$20,000,000$22,000,000$24,000,000$26,000,000$28,000,000$30,000,000$32,000,000$34,000,000$36,000,000$38,000,000$40,000,000$42,000,000$44,000,000$46,000,000
Fiscal Year
Ongoing State Appropriation
Appropriation
4
FY01 FY02 FY03 FY04 FY05 FY06 FY07 FY08 FY09 FY10 FY11 FY12 FY13 FY14 FY15 FY16 FY17 FY18
Appropriation 45.4 46.9 42.1 39.8 40.7 40.7 41.6 43.3 45.2 45.2 42.8 40.4 39.9 40.5 42.6 43.1 44.7 40.7
Actual Received
44.0 38.9 39.4 38.6 39.5 39.5 40.3 42.0 43.8 43.8 41.5 38.7 38.3 38.5 41.3 41.8 40.2 39.5
FY10 excludes one-time federal fund designated for Caring for Missourians. FY17 excludes one-time Autism Clinic funds and reflects extra withholding. FY18 is projected based on the standard 3% withholding.
Planned Expenditures
$25
$30
$35
$40
$45
$50
Comparison of Annual Appropriations and ActualState Funds Received
Appropriation Actual Received
5
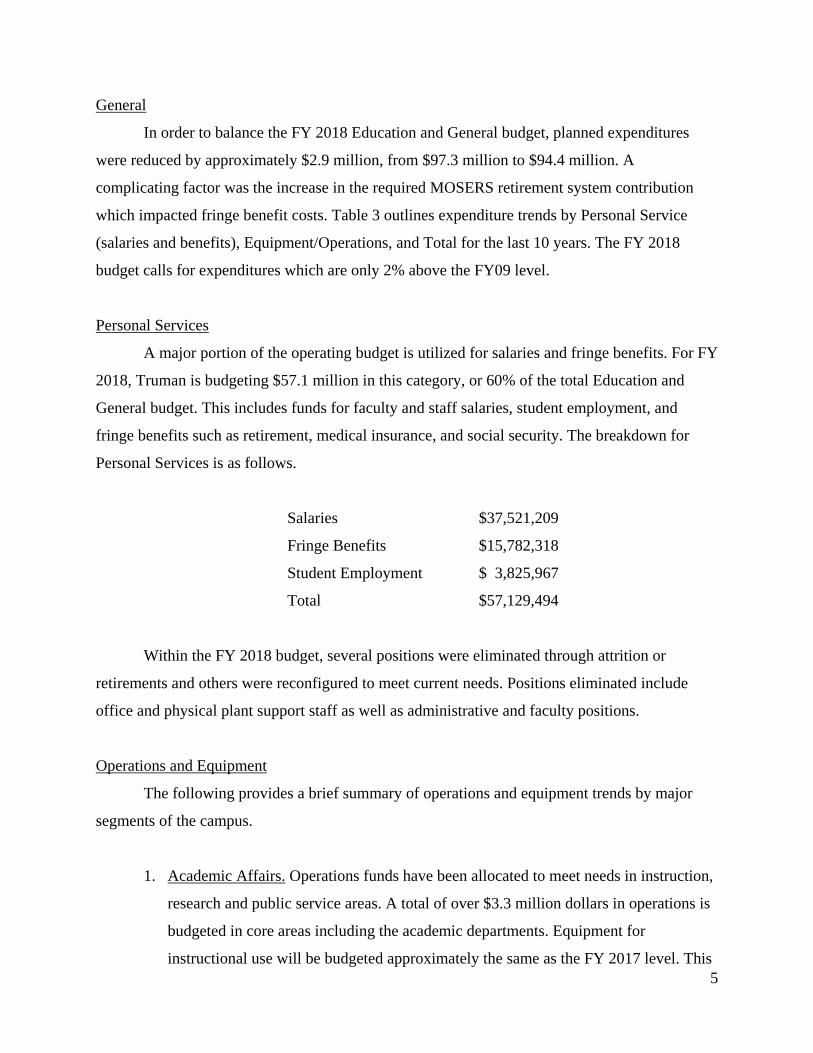
General
In order to balance the FY 2018 Education and General budget, planned expenditures
were reduced by approximately $2.9 million, from $97.3 million to $94.4 million. A
complicating factor was the increase in the required MOSERS retirement system contribution
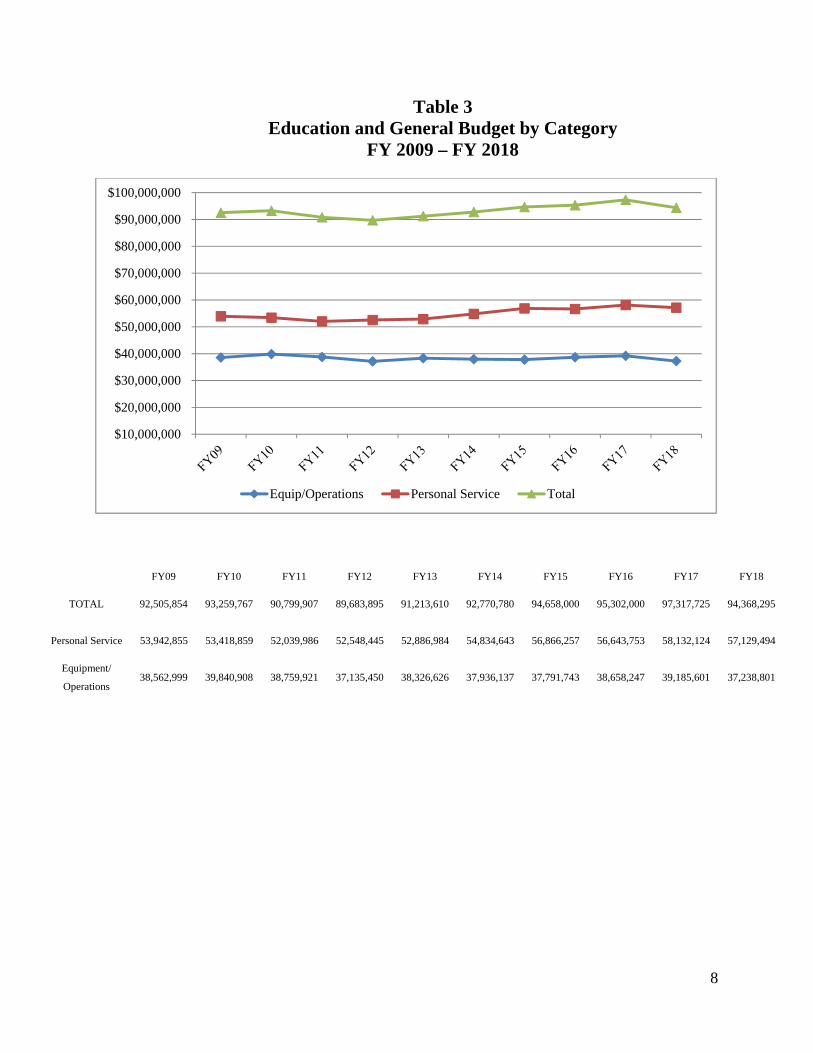
which impacted fringe benefit costs. Table 3 outlines expenditure trends by Personal Service
(salaries and benefits), Equipment/Operations, and Total for the last 10 years. The FY 2018
budget calls for expenditures which are only 2% above the FY09 level.
Personal Services
A major portion of the operating budget is utilized for salaries and fringe benefits. For FY
2018, Truman is budgeting $57.1 million in this category, or 60% of the total Education and
General budget. This includes funds for faculty and staff salaries, student employment, and
fringe benefits such as retirement, medical insurance, and social security. The breakdown for
Personal Services is as follows.
Salaries $37,521,209
Fringe Benefits $15,782,318
Student Employment $ 3,825,967
Total $57,129,494
Within the FY 2018 budget, several positions were eliminated through attrition or
retirements and others were reconfigured to meet current needs. Positions eliminated include
office and physical plant support staff as well as administrative and faculty positions.
Operations and Equipment
The following provides a brief summary of operations and equipment trends by major
segments of the campus.
1. Academic Affairs. Operations funds have been allocated to meet needs in instruction,
research and public service areas. A total of over $3.3 million dollars in operations is
budgeted in core areas including the academic departments. Equipment for
instructional use will be budgeted approximately the same as the FY 2017 level. This

6
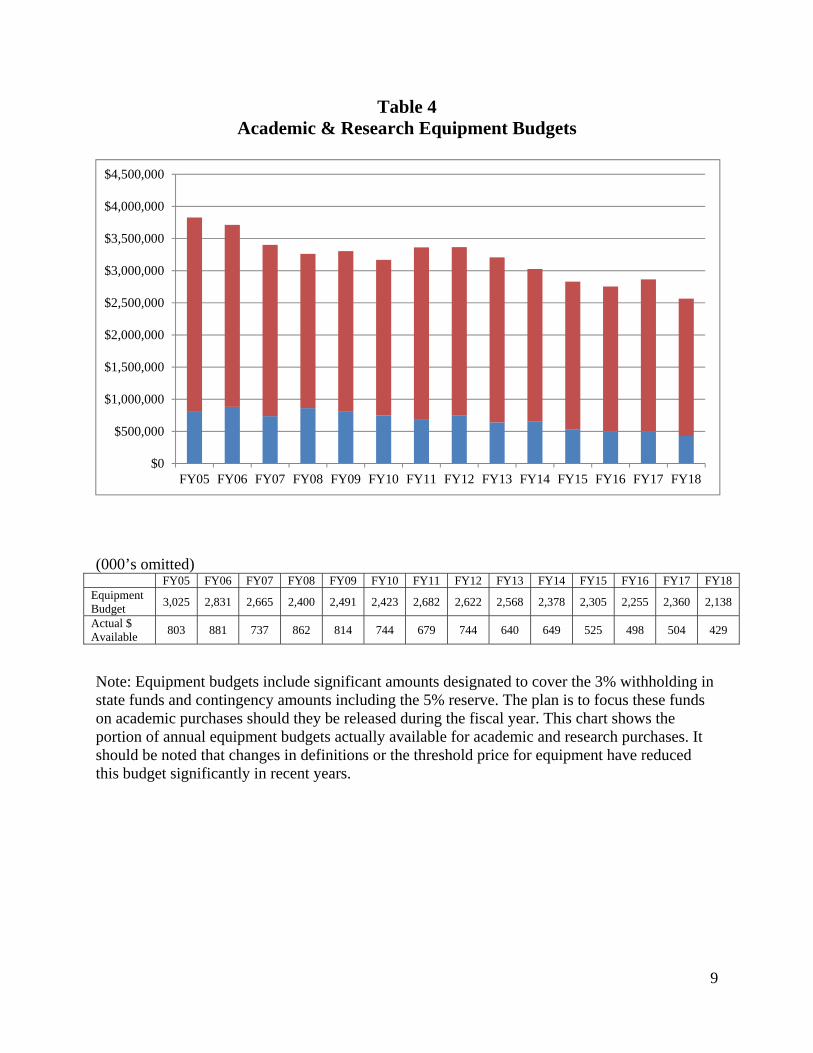
academic equipment is in addition to the campus technology funds. Table 4 outlines
academic and research equipment budgets for FY 2005-FY 2018 and shows the asset
renewal rate for these areas. Research funding totals are just over $600,000 for FY
2018, with most of the funds in the operations and equipment categories. Funds for
Pickler Memorial Library were reduced in the acquisitions category.
2. Student Services. Operating and equipment budgets in the Student Services category
have been allocated to meet priorities in various areas. The offices and functions in
this category within the Education and General budget include Registrar, Financial
Aid, International Students, Multicultural Affairs, Admission, Athletics, Health
Clinic, and Counseling. Nearly $3 million is budgeted for equipment and operations
in the student services category. This includes the funds generated by the student
athletic fee. Additional Student Services areas including Residential Living, the
Student Union, and Recreation Center are funded in the Auxiliary Budget and are not
included here.
3. Computing and Technology. The FY 2018 operating budget includes significant
allocations for computing and technology. A total of $3.4 million is budgeted for
technology services which include staff, operations, equipment and maintenance of
existing systems and networks with over 2,000 laptop and desktop workstations on
campus, and a network with 8,800 ports. Continued technology investment is
necessary to remain competitive. For 2017-2018, technology areas are budgeted at 3.6
percent of the institutional total.
4. Maintenance and Repair Fund. In the mid 1990’s the General Assembly provided
designated appropriations from General Revenue to handle campus maintenance and
repair. These funds were added to the base appropriation for each campus with the
intention to meet needs such as renovations, roof replacements and upgrades to
heating and air conditioning systems. For FY 2018, a total of $1,190,000 is budgeted
for maintenance and repair. Table 5 outlines trends in the Maintenance & Repair
budget for FY 2008-FY 2018.
7
5. Utilities. Due to increases in utility costs and increased demand, utility budgets have
historically increased each year. However, for 2017-18 utility costs are projected to
decline as a result of savings from the recent energy project. Total funds budgeted for
utilities, including operation of the central power plant, are $2.9 million. The
Auxiliary Budget includes additional funds to cover utilities in those facilities.
6. Institutional Support. This area includes many administrative functions such as the
Business Office, Alumni/Advancement, Public Relations, President’s Office and
other support areas. The combined operations and equipment total for this category is
almost $1.9 million, which includes funds transferred from the Foundation to support
advancement and fundraising efforts.
7. Scholarships. For FY 2018, funds for scholarships have been maintained at
approximately the same level to cover projected expenditures for institutionally
funded academic and athletic grants.
8. Student Employment. Student employment budgets are targeted to assist students and
supplement staff in multiple areas. Funds allocated for student employment in the
Education and General budget total over $3.8 million, a small decrease from FY
2017.
8
Table 3 Education and General Budget by Category
FY 2009 – FY 2018
FY09 FY10 FY11 FY12 FY13 FY14 FY15 FY16 FY17 FY18
TOTAL 92,505,854 93,259,767 90,799,907 89,683,895 91,213,610 92,770,780 94,658,000 95,302,000 97,317,725 94,368,295
Personal Service 53,942,855 53,418,859 52,039,986 52,548,445 52,886,984 54,834,643 56,866,257 56,643,753 58,132,124 57,129,494
Equipment/
Operations 38,562,999 39,840,908 38,759,921 37,135,450 38,326,626 37,936,137 37,791,743 38,658,247 39,185,601 37,238,801
$10,000,000
$20,000,000
$30,000,000
$40,000,000
$50,000,000
$60,000,000
$70,000,000
$80,000,000
$90,000,000
$100,000,000
Equip/Operations Personal Service Total
9
Table 4 Academic & Research Equipment Budgets
(000’s omitted) FY05 FY06 FY07 FY08 FY09 FY10 FY11 FY12 FY13 FY14 FY15 FY16 FY17 FY18 Equipment Budget
3,025 2,831 2,665 2,400 2,491 2,423 2,682 2,622 2,568 2,378 2,305 2,255 2,360 2,138
Actual $ Available
803 881 737 862 814 744 679 744 640 649 525 498 504 429
Note: Equipment budgets include significant amounts designated to cover the 3% withholding in state funds and contingency amounts including the 5% reserve. The plan is to focus these funds on academic purchases should they be released during the fiscal year. This chart shows the portion of annual equipment budgets actually available for academic and research purchases. It should be noted that changes in definitions or the threshold price for equipment have reduced this budget significantly in recent years.
$0
$500,000
$1,000,000
$1,500,000
$2,000,000
$2,500,000
$3,000,000
$3,500,000
$4,000,000
$4,500,000
FY05 FY06 FY07 FY08 FY09 FY10 FY11 FY12 FY13 FY14 FY15 FY16 FY17 FY18

10
Table 5 Maintenance & Repair Budget
FY08 FY09 FY10 FY11 FY12 FY13 FY14 FY15 FY16 FY17 FY18
Operating M&R 1,556,300 1,621,665 1,621,665 1,537,337 1,446,084 1,460,875 1,460,875 1,460,875 1,360,875 1,360,875 1,190,000
$0
$200,000
$400,000
$600,000
$800,000
$1,000,000
$1,200,000
$1,400,000
$1,600,000
FY08 FY09 FY10 FY11 FY12 FY13 FY14 FY15 FY16 FY17 FY18

11
FY 2018 EDUCATION AND GENERAL REVENUE BY CATEGORY
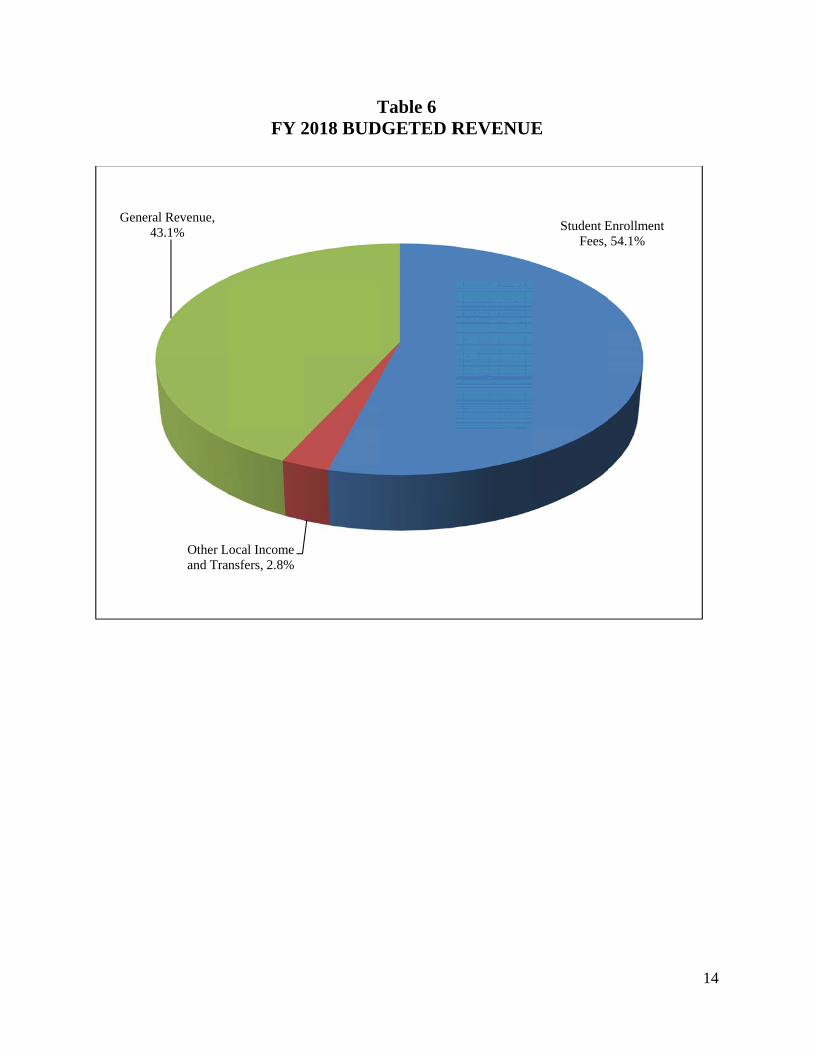
The page that follows provides a summary of projected revenue for FY 2018 in several
major categories. General Revenue, or state funds, provides 43.1% of the proposed budget.
Board policy calls for net tuition income not to exceed a target of 35 percent of the total
budget. This policy has specific guidelines regarding the calculation which allow for the
omission of designated or restricted fees. The policy also compensates for budgeted student aid.
Page 13 of this section provides the detail for the calculation to determine adherence to
the policy for FY 2018. The portion of the adjusted budget supported by student tuition is 30.7%
and, therefore, is within the policy.
Table 6 illustrates budgeted sources of funds for FY 2018. Trends in recent years include
reductions in state funding, increases in student fees, and more revenues from other
miscellaneous sources. As a result, state support now accounts for approximately 43% of
budgeted Education and General revenues.

12
EDUCATION AND GENERAL FY 2018 REVENUE BY CATEGORY
General Revenue $40,671,122
This represents the entire amount appropriated by the General Assembly. A contingency
budget of $1,220,134 has been established for the traditional 3% withholding by the Governor.
In recent years only a small portion of the 3% withholding has been released, and no funds are
expected to be released in FY 2018.
Student Tuition and Enrollment Fees $51,026,000
FY 2018 enrollment income for budget purposes is based upon a 75 FTE decline in
student enrollment. Spring semester enrollment is based on a 93% retention rate. Missouri
students are assumed to make up 70% of the total enrollment; graduate enrollment is expected to
be stable; and summer enrollment is projected at the 2017 summer level. This category also
includes fees for off-campus courses, the athletic fee, study abroad programs, and special
enrollment fees.
Other Local Income and Transfers $ 2,671,173
This includes various revenue sources: investments, athletic gate receipts, sales and
services of educational activities (such as summer camps), rollover from FY 2017, indirect costs
from grants and other miscellaneous sources. Transfers from Auxiliary sources and the
Foundation are also included here.
GRAND TOTAL ALL SOURCES $94,368,295
13
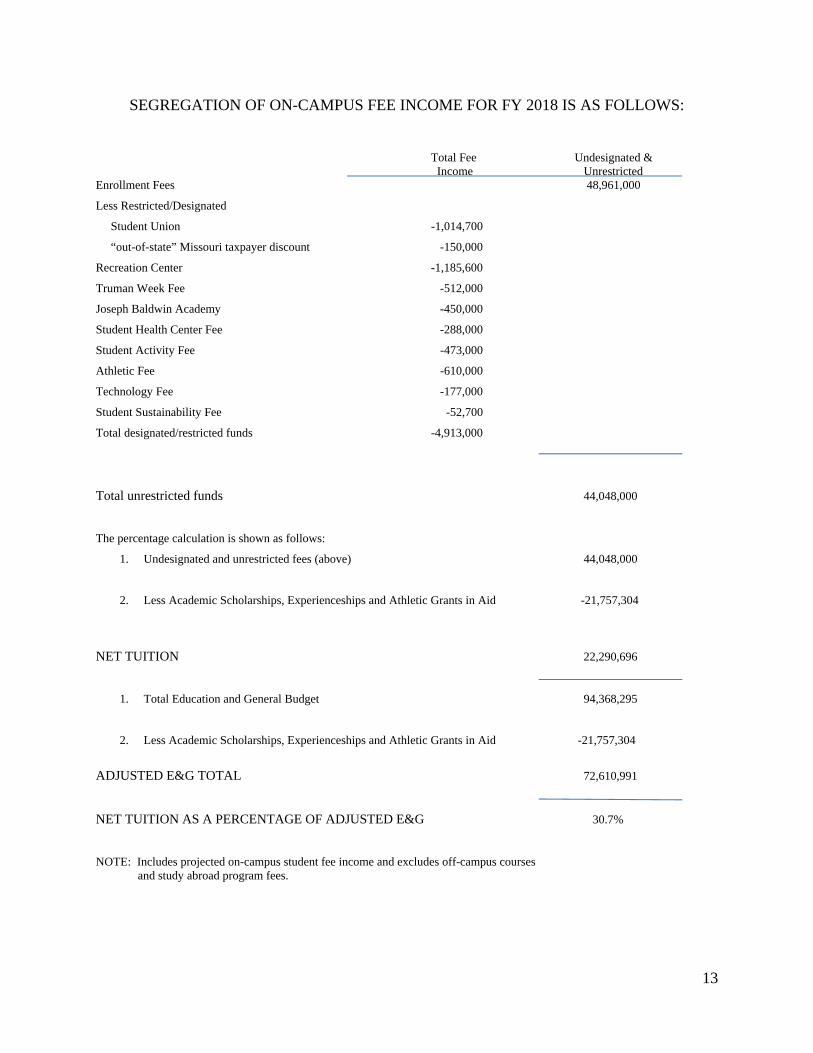
SEGREGATION OF ON-CAMPUS FEE INCOME FOR FY 2018 IS AS FOLLOWS:
Total Fee Undesignated & Income Unrestricted Enrollment Fees 48,961,000
Less Restricted/Designated
Student Union -1,014,700
“out-of-state” Missouri taxpayer discount -150,000
Recreation Center -1,185,600
Truman Week Fee -512,000
Joseph Baldwin Academy -450,000
Student Health Center Fee -288,000
Student Activity Fee -473,000
Athletic Fee -610,000
Technology Fee -177,000
Student Sustainability Fee -52,700
Total designated/restricted funds -4,913,000
Total unrestricted funds 44,048,000
The percentage calculation is shown as follows:
1. Undesignated and unrestricted fees (above) 44,048,000
2. Less Academic Scholarships, Experienceships and Athletic Grants in Aid -21,757,304
NET TUITION 22,290,696
1. Total Education and General Budget 94,368,295
2. Less Academic Scholarships, Experienceships and Athletic Grants in Aid -21,757,304
ADJUSTED E&G TOTAL 72,610,991
NET TUITION AS A PERCENTAGE OF ADJUSTED E&G 30.7%
NOTE: Includes projected on-campus student fee income and excludes off-campus courses and study abroad program fees.
Gener4
Other Land Tra
ral Revenue, 43.1%
FY 2
Local Income nsfers, 2.8%
T2018 BUD
Table 6 DGETED RREVENUEE
Student EFees,
Enrollment 54.1%
14
15
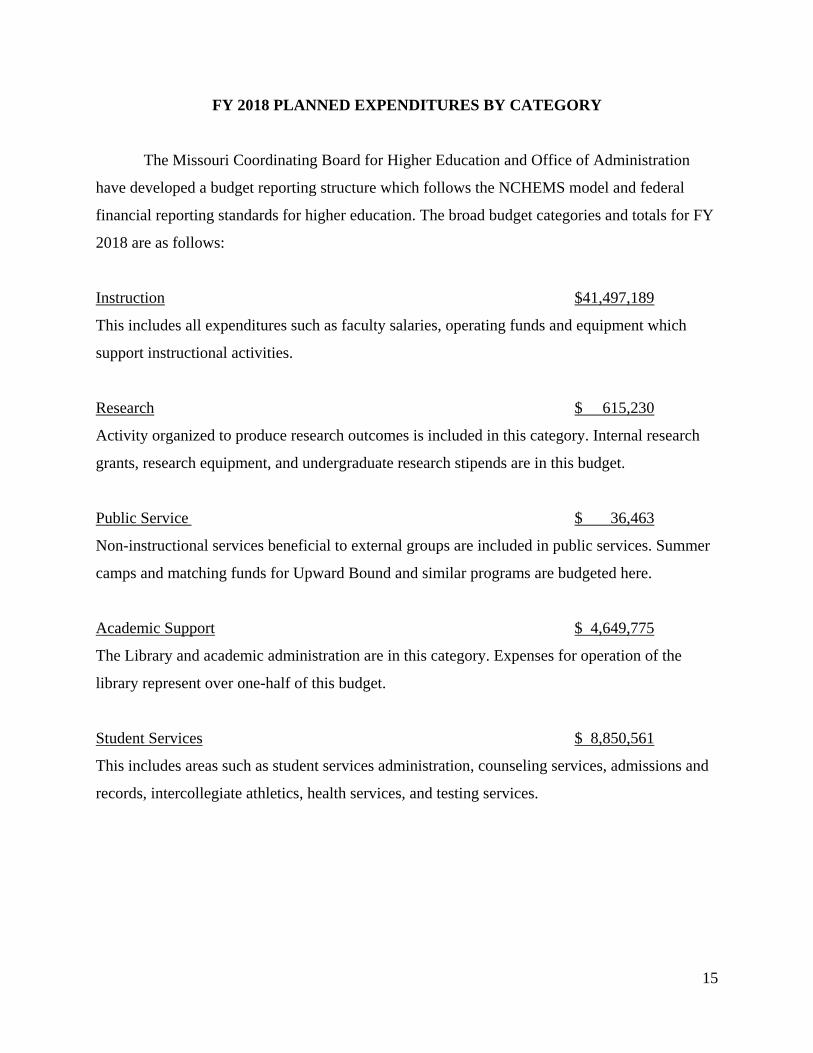
FY 2018 PLANNED EXPENDITURES BY CATEGORY
The Missouri Coordinating Board for Higher Education and Office of Administration
have developed a budget reporting structure which follows the NCHEMS model and federal
financial reporting standards for higher education. The broad budget categories and totals for FY
2018 are as follows:
Instruction $41,497,189
This includes all expenditures such as faculty salaries, operating funds and equipment which
support instructional activities.
Research $ 615,230
Activity organized to produce research outcomes is included in this category. Internal research
grants, research equipment, and undergraduate research stipends are in this budget.
Public Service $ 36,463
Non-instructional services beneficial to external groups are included in public services. Summer
camps and matching funds for Upward Bound and similar programs are budgeted here.
Academic Support $ 4,649,775
The Library and academic administration are in this category. Expenses for operation of the
library represent over one-half of this budget.
Student Services $ 8,850,561
This includes areas such as student services administration, counseling services, admissions and
records, intercollegiate athletics, health services, and testing services.

16
Institutional Support $ 7,126,937
Support areas including fiscal operations, alumni and public relations, and general administration
are in this category.
Physical Plant $ 8,604,836
General physical plant operations, including maintenance, grounds and custodial, and public
safety are in this category. Funds for fuel and utilities are also included here.
Maintenance and Repairs $ 1,190,000
Funds designated for campus building repairs and preventive maintenance are in this category.
Student Aid $ 21,757,304
Student scholarships, experienceships and athletic aid are included here.
Transfers $ 40,000
Mandatory transfers for federal aid programs (Perkins and SEOG) comprise this budget.
TOTAL $94,368,295
Note: Several significant changes in categories have been made to match the 2006 Uniform Financial Reporting Manual developed by the Coordinating Board for Higher Education as well as the most recent National Association of College and University Business Officers guidance regarding classification of various functional areas.
R
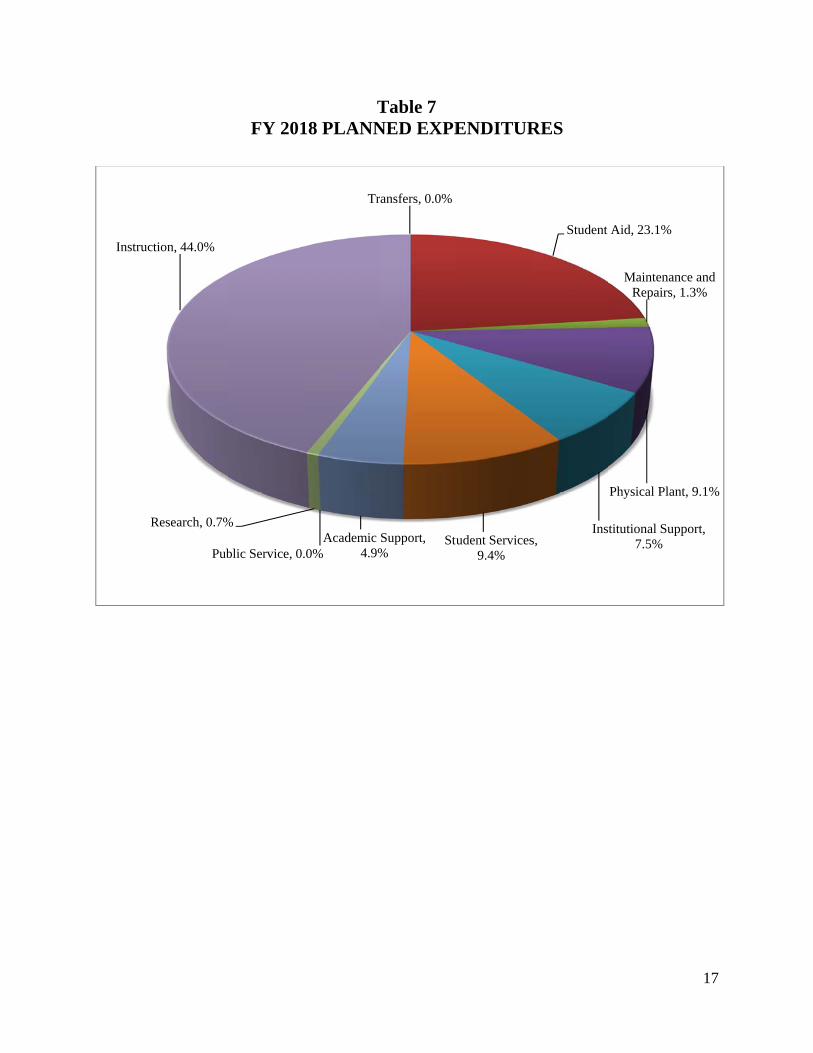
Instruc
Pub
Research, 0.7%
ction, 44.0%
FY 201
blic Service, 0.
%
T18 PLANN
Tr
Academic 4.9%.0%
Table 7 NED EXPE
ansfers, 0.0%
StuSupport, %
ENDITUR
udent Services9.4%
RES
Student
Inss,
Aid, 23.1%
MaintenancRepairs, 1
Physical Plant
titutional Supp7.5%
17
ce and 1.3%
t, 9.1%
port,
18
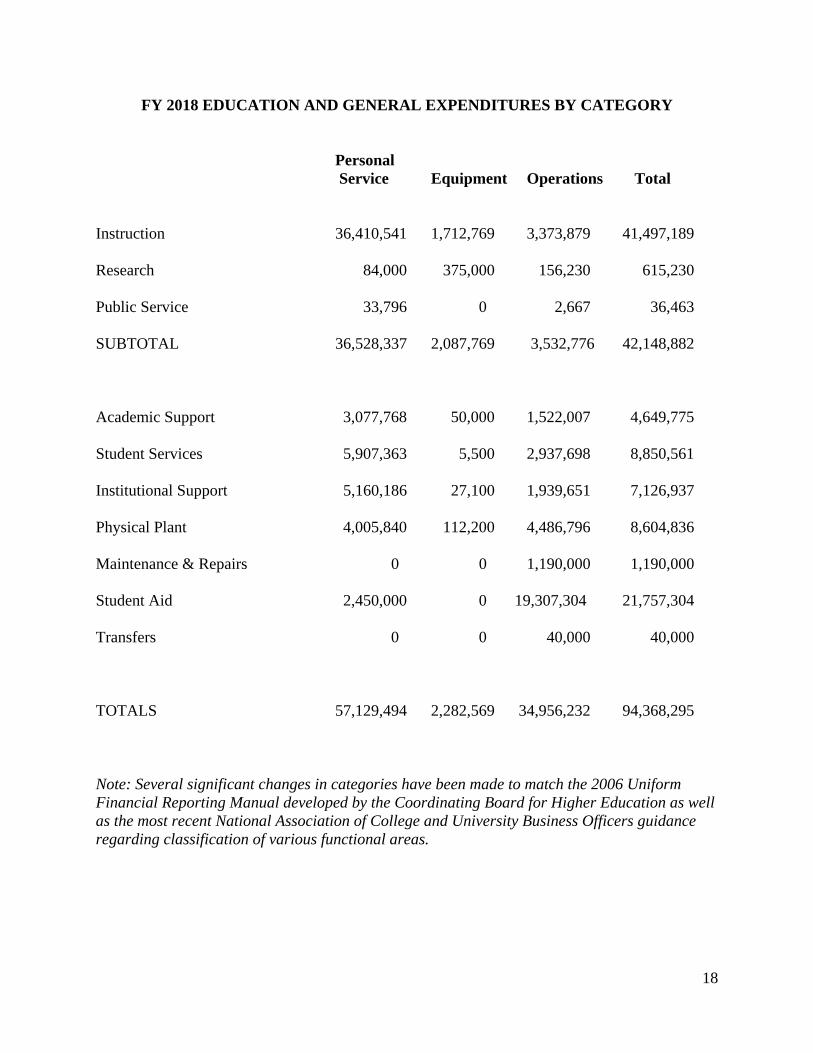
FY 2018 EDUCATION AND GENERAL EXPENDITURES BY CATEGORY
Personal Service Equipment Operations Total
Instruction 36,410,541 1,712,769 3,373,879 41,497,189
Research 84,000 375,000 156,230 615,230
Public Service 33,796 0 2,667 36,463
SUBTOTAL 36,528,337 2,087,769 3,532,776 42,148,882
Academic Support 3,077,768 50,000 1,522,007 4,649,775
Student Services 5,907,363 5,500 2,937,698 8,850,561
Institutional Support 5,160,186 27,100 1,939,651 7,126,937
Physical Plant 4,005,840 112,200 4,486,796 8,604,836
Maintenance & Repairs 0 0 1,190,000 1,190,000
Student Aid 2,450,000 0 19,307,304 21,757,304
Transfers 0 0 40,000 40,000
TOTALS 57,129,494 2,282,569 34,956,232 94,368,295
Note: Several significant changes in categories have been made to match the 2006 Uniform Financial Reporting Manual developed by the Coordinating Board for Higher Education as well as the most recent National Association of College and University Business Officers guidance regarding classification of various functional areas.
19
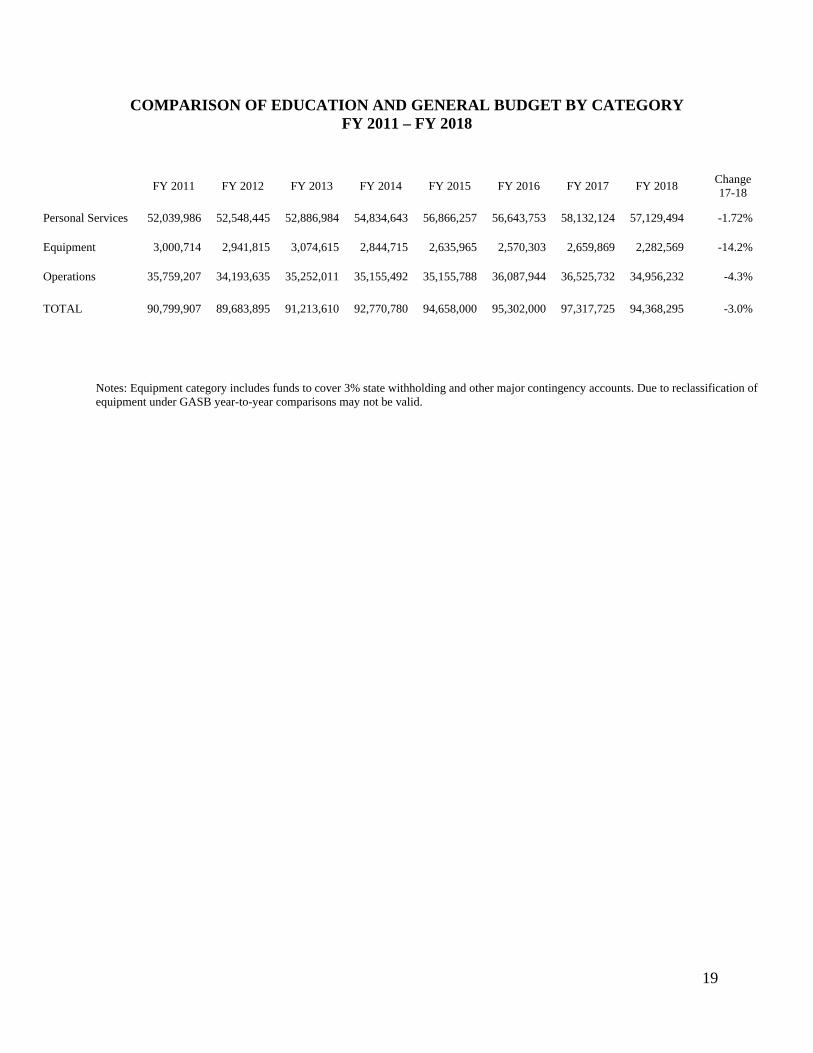
COMPARISON OF EDUCATION AND GENERAL BUDGET BY CATEGORY FY 2011 – FY 2018
FY 2011 FY 2012 FY 2013 FY 2014 FY 2015 FY 2016 FY 2017 FY 2018
Change 17-18
Personal Services 52,039,986 52,548,445 52,886,984 54,834,643 56,866,257 56,643,753 58,132,124 57,129,494 -1.72%
Equipment 3,000,714 2,941,815 3,074,615 2,844,715 2,635,965 2,570,303 2,659,869 2,282,569 -14.2%
Operations 35,759,207 34,193,635 35,252,011 35,155,492 35,155,788 36,087,944 36,525,732 34,956,232 -4.3%
TOTAL 90,799,907 89,683,895 91,213,610 92,770,780 94,658,000 95,302,000 97,317,725 94,368,295 -3.0%
Notes: Equipment category includes funds to cover 3% state withholding and other major contingency accounts. Due to reclassification of equipment under GASB year-to-year comparisons may not be valid.
20
FISCAL YEAR 2018 AUXILIARY BUDGET NARRATIVE
Executive Summary
Revenue from combined auxiliary operations is projected to increase slightly in FY 2018.
This estimate is based on the number housed in the residence halls as well as budgets which are
tied to student enrollment such as the Student Union and Recreation Center. Occupancy levels in
the residence halls are budgeted based on a small decrease from actual this past academic year.
The rates charged to students for residence halls including room and board were increased by an
average of 1.0% for the 2017-18 academic year.
Modest changes in operating and equipment budgets have been recommended for 2017-
2018. For FY 2018, only minor staffing changes are recommended in auxiliary areas. Two
positions were added to work with student career readiness. The major changes in the Auxiliary
Budget for FY 2018 include the increase in funds to cover projected food costs as well as
MOSERS contributions. Savings were realized with the refinancing of bonds in 2015 and 2016
and this is reflected in the operating budgets for FY 2018.
General Budget Priorities
This budget was prepared to meet priorities such as improving services to students, and
activities which will provide more efficient operations. Asset renewal is also important in the
auxiliary area, particularly in the residence halls and Student Union Building. The budget for
auxiliary operations must be balanced and also meet bond payment requirements.
Revenue Assumptions
1. Residence Halls. Room and board rates were raised by an average of 1.0% for FY 2018.
A student living in a typical two-person room will pay $8,558 for the 2017-2018
academic year. Based upon an occupancy rate of 2,475 for the fall semester and 93
percent returning for the spring semester, revenue from residence halls and apartments is
projected at $21,325,000.

21
2. Other Residence Hall Income. Income from off-campus students who dine in the halls
and from rentals, commissions, and miscellaneous sources is projected at $760,000 for
FY 2018. Additional revenue sources include interest income and miscellaneous fees
which should generate approximately $865,000.
3. Student Union. The Student Union is primarily funded by a transfer from enrollment
income to this budget at a rate of $95 per full-time equivalent student per semester. This
fee was established to build, maintain and cover debt service for the Student Union. The
Student Activity Fee helps fund the Center for Student Involvement, which is housed in
the Student Union. Additional income sources include room rentals, bookstore, and food
service commission. Total revenue for the Student Union Building is projected at
$1,370,000.
4. Recreation Center. Major expenses for the Recreation Center include personnel,
operations and debt service. A designated fee of $111 per semester per full-time
equivalent student is included in enrollment fees. Debt on the Recreation Center has been
retired so funds are being budgeted to help finance future renovations. Total revenue for
FY 2018 is projected at $1,260,000 for the Recreation Center.
5. Service Departments. Revenue from auxiliary service departments such as Printing
Services is projected at $660,000 for FY 2018.
Planned Expenditures
A significant portion of the Auxiliary Budget is utilized to operate the residence halls.
Staff includes the Residential Living Office, hall directors, housekeepers, and physical plant
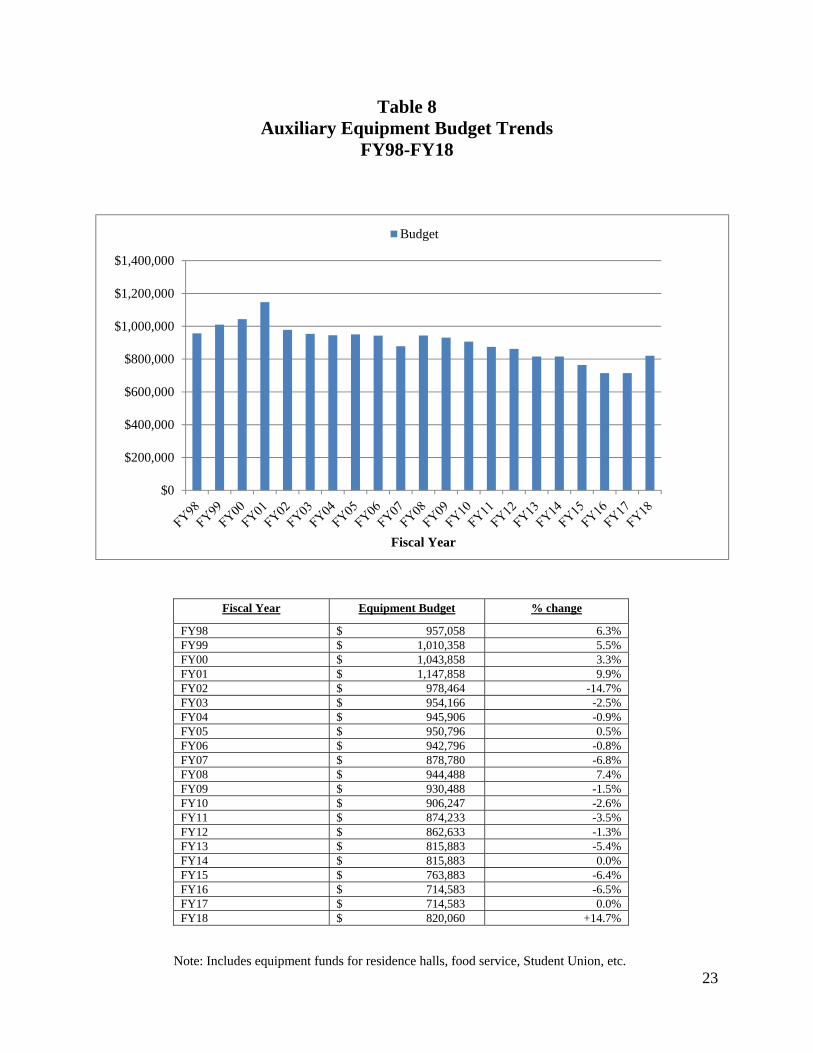
employees assigned to these non-academic areas. Table 8 outlines Auxiliary Budget equipment
trends for FY 1998-FY 2018 and illustrates the emphasis on asset renewal in these areas.
Operating funds for Residential Living include utilities, repairs and renovations, and food
service contracts. Funds are included for furniture replacements, food service equipment, and
general repairs to the facilities. Food service costs will increase to cover increased costs as
agreed to in the food service contract, which is the largest single component of this budget.
22
Utility costs are projected to be stable in 2017-2018 from the current year actual expenditures
and the budget reflects this. A major portion of the Residential Living operating budget is the
$3,337,387 set aside for bond repayments.
On a smaller scale, the Student Union Building budget also covers personnel, operating
costs such as utilities, and funds for replacement and repair of the equipment. Funds are also
included to cover general maintenance of this building and funds have been increased for student
employment. This budget includes $314,898 for bond repayments.
The Recreation Center budget is continued at a level comparable to the previous year.
This will provide for continued staffing and operations funds to meet the usage of this facility.
Utility costs are a major component in the operating budget for this area, and the student
employment budget has been increased. An equipment budget is also provided to replace and
update items as needed. Funds are also budgeted for future equipment and renovation to this
facility.
23
Table 8 Auxiliary Equipment Budget Trends
FY98-FY18
Fiscal Year Equipment Budget % change
FY98 $ 957,058 6.3% FY99 $ 1,010,358 5.5% FY00 $ 1,043,858 3.3% FY01 $ 1,147,858 9.9% FY02 $ 978,464 -14.7% FY03 $ 954,166 -2.5% FY04 $ 945,906 -0.9% FY05 $ 950,796 0.5% FY06 $ 942,796 -0.8% FY07 $ 878,780 -6.8% FY08 $ 944,488 7.4% FY09 $ 930,488 -1.5% FY10 $ 906,247 -2.6% FY11 $ 874,233 -3.5% FY12 $ 862,633 -1.3% FY13 $ 815,883 -5.4% FY14 $ 815,883 0.0% FY15 $ 763,883 -6.4% FY16 $ 714,583 -6.5% FY17 $ 714,583 0.0% FY18 $ 820,060 +14.7%
Note: Includes equipment funds for residence halls, food service, Student Union, etc.
$0
$200,000
$400,000
$600,000
$800,000
$1,000,000
$1,200,000
$1,400,000
Fiscal Year
Budget
24
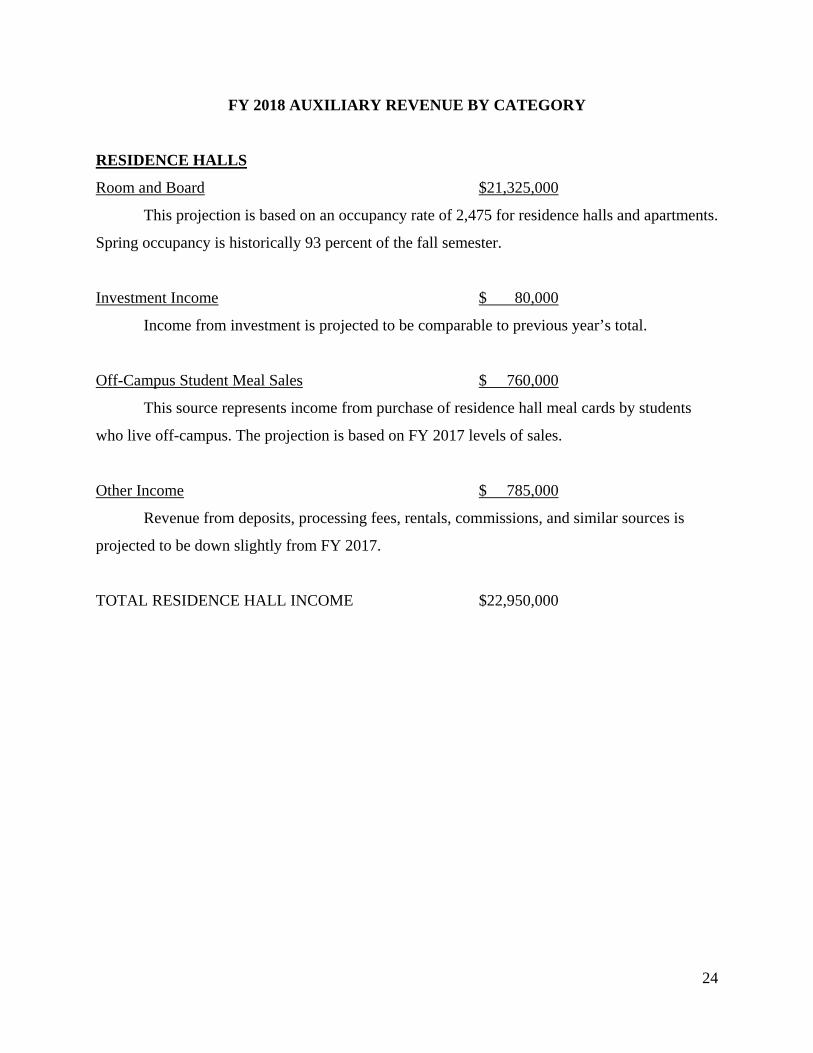
FY 2018 AUXILIARY REVENUE BY CATEGORY
RESIDENCE HALLS
Room and Board $21,325,000
This projection is based on an occupancy rate of 2,475 for residence halls and apartments.
Spring occupancy is historically 93 percent of the fall semester.
Investment Income $ 80,000
Income from investment is projected to be comparable to previous year’s total.
Off-Campus Student Meal Sales $ 760,000
This source represents income from purchase of residence hall meal cards by students
who live off-campus. The projection is based on FY 2017 levels of sales.
Other Income $ 785,000
Revenue from deposits, processing fees, rentals, commissions, and similar sources is
projected to be down slightly from FY 2017.
TOTAL RESIDENCE HALL INCOME $22,950,000
25
STUDENT UNION $ 1,370,000
This revenue source includes the transfer of enrollment fees based on full-time equivalent
(FTE) students. Total revenues are projected to be comparable to FY17 and additional income
sources include rentals, bookstore, and food service commission.
RECREATION CENTER $ 1,260,000
Funds for operation of the Recreation Center and repayment of construction bonds come
primarily from the transfer of enrollment fees based on FTE students. Other sources of income
include rental of the facility to outside groups and faculty/staff membership fees.
SERVICE DEPARTMENTS $ 660,000
Several service departments are operated as auxiliary enterprises. Currently this includes
Campus Printing Services. Revenue is projected to be level for FY18.
GRAND TOTAL AUXILIARY REVENUE $26,240,000
26
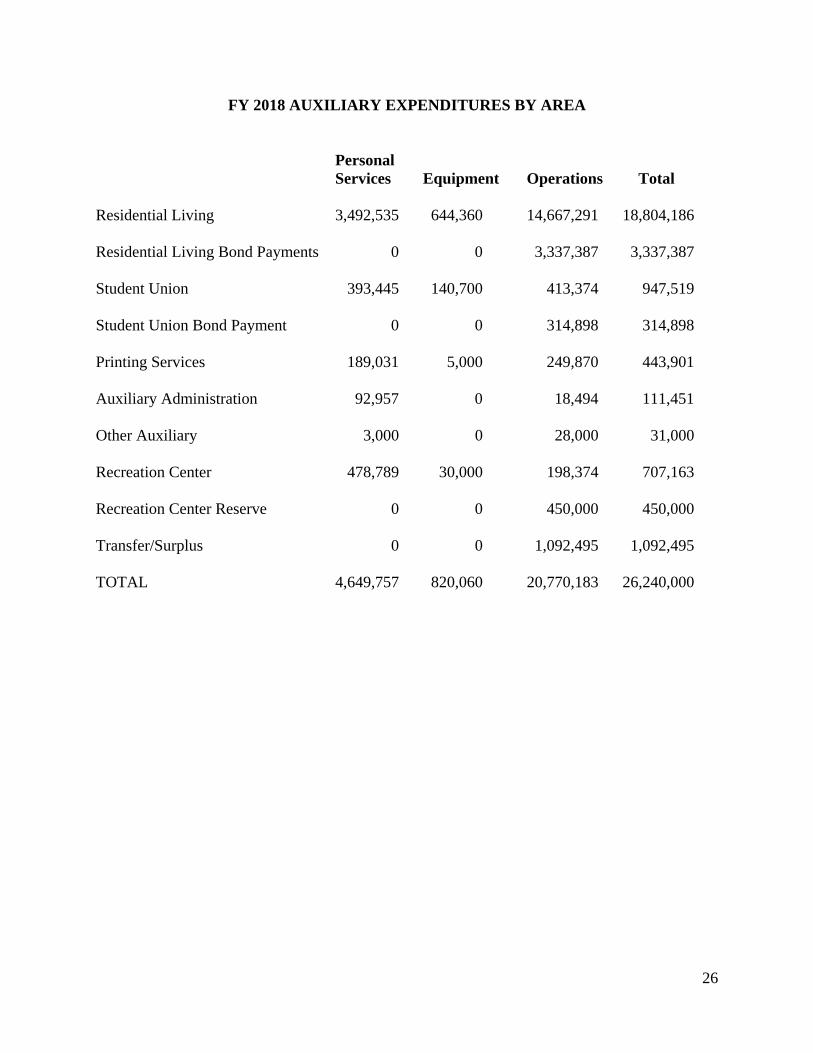
FY 2018 AUXILIARY EXPENDITURES BY AREA
Personal Services Equipment Operations Total Residential Living 3,492,535 644,360 14,667,291 18,804,186 Residential Living Bond Payments 0 0 3,337,387 3,337,387 Student Union 393,445 140,700 413,374 947,519 Student Union Bond Payment 0 0 314,898 314,898 Printing Services 189,031 5,000 249,870 443,901 Auxiliary Administration 92,957 0 18,494 111,451 Other Auxiliary 3,000 0 28,000 31,000 Recreation Center 478,789 30,000 198,374 707,163 Recreation Center Reserve 0 0 450,000 450,000 Transfer/Surplus 0 0 1,092,495 1,092,495 TOTAL 4,649,757 820,060 20,770,183 26,240,000
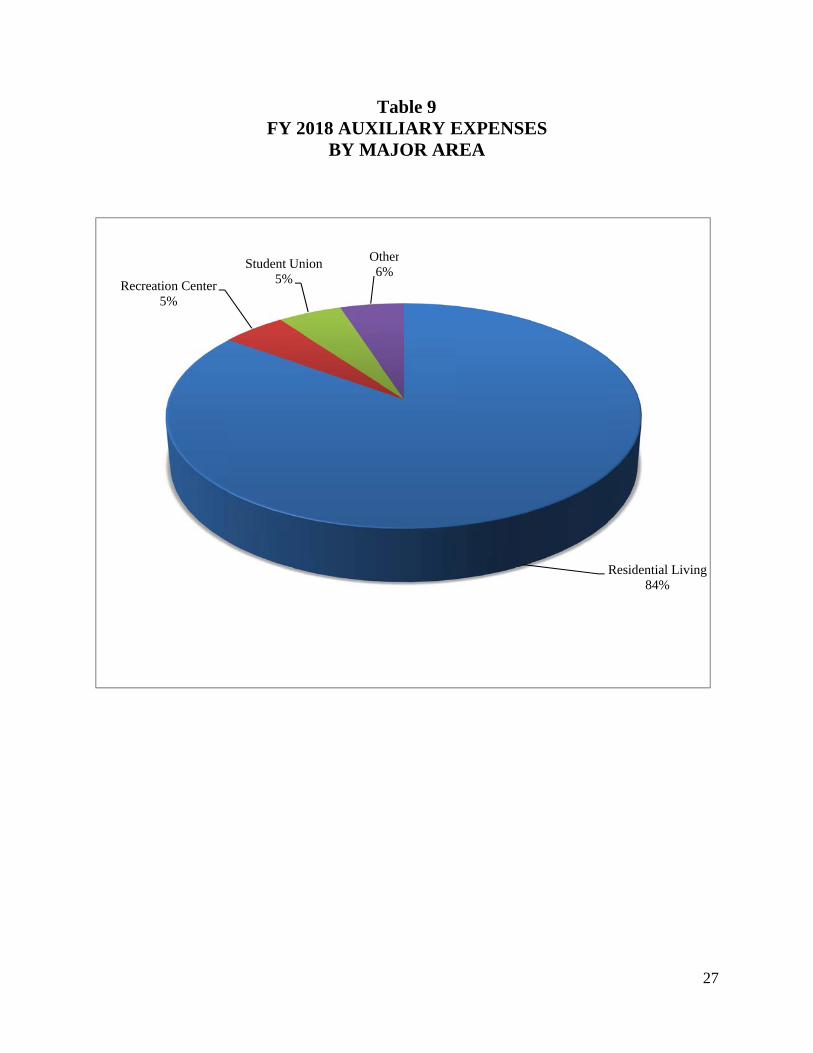
Recreaation Center5%
FY 2
Student Un5%
T2018 AUXI
BY MA
nion Ot6
Table 9 ILIARY EAJOR AR
ther6%
EXPENSEREA
ES
RResidential Liv84%
27
ving
28
FISCAL YEAR 2018 RESTRICTED FUND BUDGET
Executive Summary
This budget includes funds from outside grants and other sources (state and federal)
which are restricted in nature. Examples include federal programs such as McNair and Upward
Bound and state-funded activities such as the Regional Professional Development Center. Due to
the nature of these programs and the fact that the federal fiscal year does not match Truman’s
fiscal year, all revenues in this budget are estimated.
Projected Restricted Revenues and Expenditures
Major activities supported through restricted funds include the following:
Upward Bound $ 405,000
This program is part of the federal TRIO program funded by the Department of
Education. It is designed to assist high school students in building the skills and
motivation necessary for college success.
McNair $ 255,000
Truman has received McNair funding since 1992. The program is designed to provide
disadvantaged college students with preparation for graduate programs.
Regional Professional Development Center $ 900,000
The Regional Professional Development Center is operated in conjunction with Truman’s
School of Health Sciences and Education. The center is funded by the Missouri
Department of Elementary and Secondary Education and provides training and support to
public schools in the northeast region. Any fee income generated by Regional
Professional Development Center activities is restricted and must be returned to the state
if not used for the program.

29
NSF-Preparing & Advancing Scholars in Mathematics & Computer Science
$ 60,000
This grant will identify, recruit, nurture and educate talented young students and place
them in academic and professional careers in mathematics and computer science.
NSF-Robert Noyce Scholars Program for Secondary Mathematics & Physics Teaching
$ 364,857
This project will strive to impact physics and mathematics teacher shortages in Missouri
and nationwide by creating a dual mathematics/physics secondary teacher preparation
tract. The program will recruit and support students following this new contract.
Pell $4,700,000
Pell Grants are provided from federal funds to eligible students based on need. This
amount is a projection as awards are contingent on the number of qualifying students
enrolled.
SEOG $ 101,284
Supplemental Educational Opportunities Grants are provided from federal funds to
eligible students.
Work Study $ 310,818
The College Work-Study Program includes federal funds to support part-time student
workers.
Federal TEACH Grant $ 25,000
This grant provides up to $4,000 to eligible undergraduate and graduate students who
agree to teach specified high-need subjects at schools serving primarily disadvantaged
populations for four years within eight years of graduation. This amount is a projection as
awards are contingent on the number of qualifying students enrolled.
30
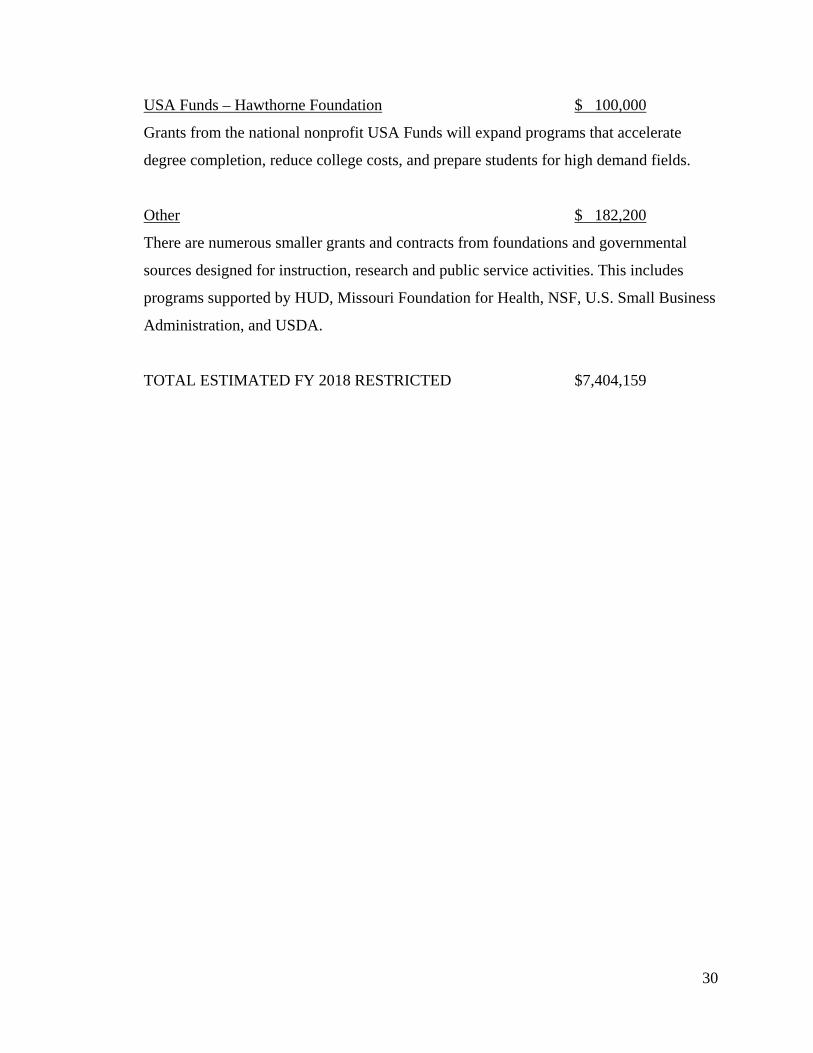
USA Funds – Hawthorne Foundation $ 100,000
Grants from the national nonprofit USA Funds will expand programs that accelerate
degree completion, reduce college costs, and prepare students for high demand fields.
Other $ 182,200
There are numerous smaller grants and contracts from foundations and governmental
sources designed for instruction, research and public service activities. This includes
programs supported by HUD, Missouri Foundation for Health, NSF, U.S. Small Business
Administration, and USDA.
TOTAL ESTIMATED FY 2018 RESTRICTED $7,404,159
31
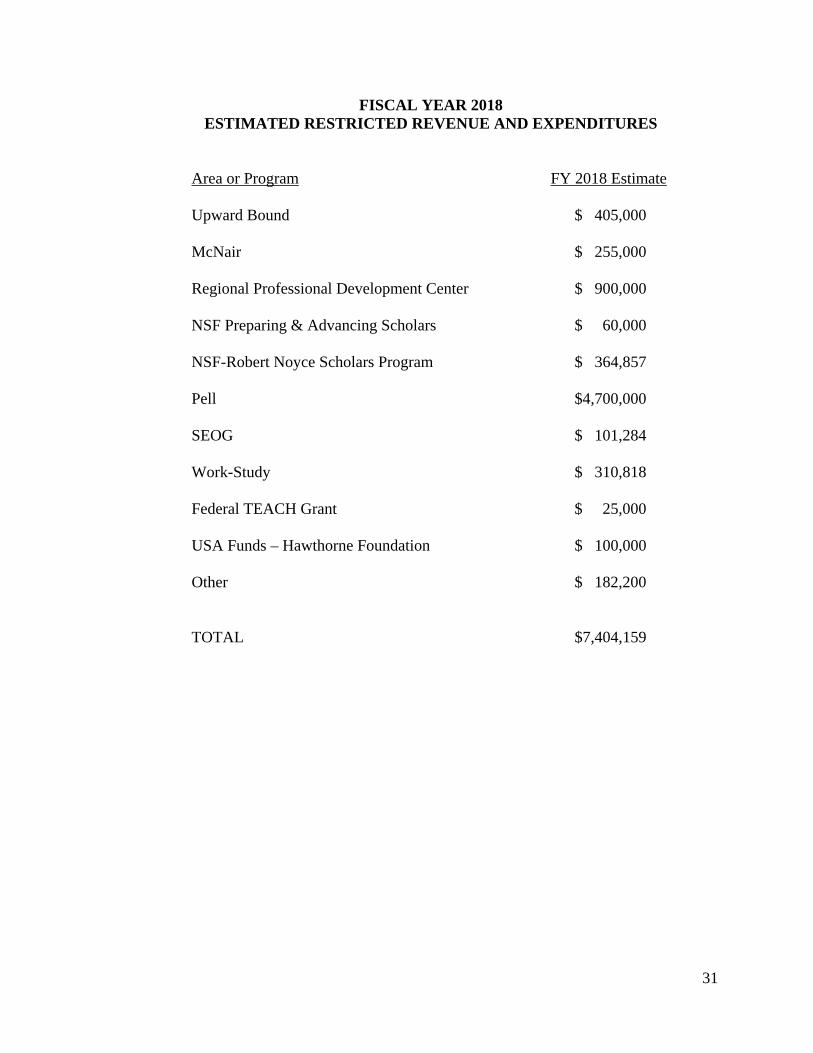
FISCAL YEAR 2018 ESTIMATED RESTRICTED REVENUE AND EXPENDITURES
Area or Program FY 2018 Estimate
Upward Bound $ 405,000
McNair $ 255,000
Regional Professional Development Center $ 900,000
NSF Preparing & Advancing Scholars $ 60,000
NSF-Robert Noyce Scholars Program $ 364,857
Pell $4,700,000
SEOG $ 101,284
Work-Study $ 310,818
Federal TEACH Grant $ 25,000 USA Funds – Hawthorne Foundation $ 100,000
Other $ 182,200
TOTAL $7,404,159
32
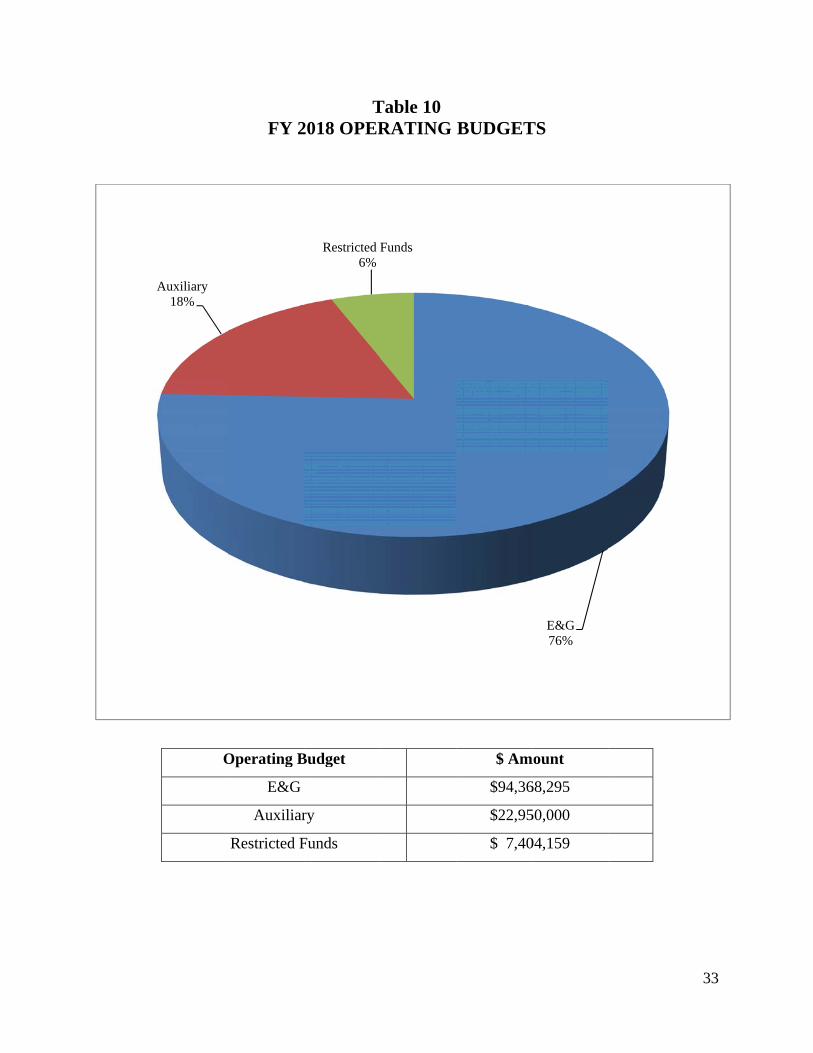
COMBINED OPERATING BUDGET SUMMARY
The combined operating budget for Fiscal Year 2018 totals $124,722,454. Education and General $ 94,368,295 Auxiliary $ 22,950,000 Restricted Funds $ 7,404,159 Total $124,722,454 Table 10 illustrates the combined operating budget distributed by type, and the Education
and General budget represent 75% of the total.
Projected revenues are equal to the various operating budgets, and Table 11 illustrates the
sources of revenue which are combined to produce the funds needed. Major sources, in
descending order, are Student Tuition and Fees, State Appropriations, Auxiliary Revenue, Grants
and Contracts, and Other Income.
O
Auxiliary18%
FY 2
Operating B
E&G
Auxiliar
Restricted F
T2018 OPER
Budget
ry
Funds
Restricted F6%
Table 10 RATING
Funds
BUDGET
$ Am
$94,36
$22,95
$ 7,40
TS
mount
68,295
50,000
04,159
E&G76%
33

Grants & 6%
R
St
Gr
A
Contracts%
Auxiliary R18%
F
Revenue Sou
tate Appropr
Tuition & F
rants & Con
Auxiliary Rev
Other Incom
Revenue%
TFY 2018 R
urces
riation
Fees
ntracts
venue
me
Tuition & Fee41%
Othe
Table 11 Revenue S
es
er Income2%
Sources
$ Am
$40,67
$51,02
$ 7,40
$22,95
$ 2,67
mount
71,122
26,000
04,159
50,000
71,173
State Appr33%
ropriation%
34