opening the door for oil sands expansion - leading canada's
TRANSCRIPT


Opening the Door for Oil Sands Expansion
The Hidden Environmental Impacts of the Enbridge Northern Gateway Pipeline
Greg Brown Jeremy Moorhouse
Jennifer Grant
December 2009

The Pembina Institute ii Opening the Door for Oil Sands Expansion
Opening the Door for Oil Sands Expansion: The Hidden Environmental Impacts of the Enbridge Northern Gateway Pipeline December 2009 Printed in Canada Editor: Roberta Franchuk ©2009 The Pembina Institute and The Pembina Foundation The Pembina Foundation for Environmental Research and Education is a national registered charitable organization that enters into contractual agreements with environmental research and education experts, such as the Pembina Institute, to deliver on its work.
The Pembina Institute Box 7558 Drayton Valley, Alberta T7A 1S7 Canada Phone: 780-542-6272 E-mail: [email protected] Additional copies of this publication may be downloaded from the Pembina Institute website: www.pembina.org.
About the Pembina Institute The Pembina Institute is a national non-profit think tank that advances sustainable energy solutions through research, education, consulting and advocacy. It promotes environmental, social and economic sustainability in the public interest by developing practical solutions for communities, individuals, governments and businesses. The Pembina Institute provides policy research leadership and education on climate change, energy issues, green economics, energy efficiency and conservation, renewable energy, and environmental governance. For more information about the Pembina Institute, visit www.pembina.org or contact [email protected]. Our engaging monthly newsletter offers insights into the Pembina Institute’s projects and activities, and highlights recent news and publications. Subscribe to Pembina eNews: http://www.pembina.org/enews/subscribe.

The Pembina Institute iii Opening the Door for Oil Sands Expansion
About the Authors
Greg Brown is a Policy Analyst with the Pembina Institute. Based in Smithers, British Columbia, he works on British Columbia energy policies and conducts energy planning and renewable energy assessments for communities. In the past Greg has worked with energy utilities, with municipal governments in the Yukon as a community energy planner, with non-profits organizations coordinating international conferences on renewable energy and energy efficiency, and as a EnerGuide for Houses evaluator. Greg holds a geological engineering degree from the University of British Columbia.
Jeremy Moorhouse is an Eco-Efficiency Analyst with the Pembina Institute's Corporate Consulting team. He provides technical analysis for life-cycle value assessments for decision-making. Jeremy's other projects include conducting research into practices and strategies for sustainability, evaluating the performance of current and proposed oil sands projects, and quantifying the relative benefits of different artificial lift technologies. Assessing and evaluating emerging technologies is also a key focus of Jeremy's work. His technical background includes experimental mining equipment design and production, as well as experimental data analysis. He has experience and knowledge in energy systems, water management and solid-waste management. Jeremy holds a bachelor's degree in
mechanical engineering from McGill University.
Jennifer Grant is a Policy Analyst with the Pembina Institute. She has worked with the Institute since 2006 in an effort to address the cumulative impacts of current and future oil sands operations and advocate for the development of an effective policy framework. Jennifer represented the Pembina Institute on the Reclamation Working Group and the Watershed Integrity Task Group of the Cumulative Environmental Management Association (CEMA). Prior to her work with the Pembina Institute, Jennifer worked as a biologist, facilitator and educator for both government and non-government organizations. Jennifer holds a master of science in ecosystem management from the University of Calgary and a bachelor of science in biological sciences from the University of Victoria.
Acknowledgements The Pembina Foundation wishes to thank the William and Flora Hewlett Foundation for their generous support which enabled the sustainable energy experts at the Pembina Institute to prepare this publication.

The Pembina Institute iv Opening the Door for Oil Sands Expansion
Opening the Door for Oil Sands Expansion The Hidden Environmental Impacts of the Enbridge Northern Gateway Pipeline
Table of Contents Executive Summary..................................................................................................................1 1. Introduction ........................................................................................................................3
1.1 The Enbridge Northern Gateway Pipelines Project and the Alberta Oil Sands................3 1.2 The Increasing Role of Oil Sands ...................................................................................5 1.3 Oil Sands Expansion — A Growing Concern..................................................................6 1.4 Purpose of this Report....................................................................................................7 1.5 Methodology and Assumptions ......................................................................................7 1.6 Expanding Pipeline Capacity – A Slippery Slope............................................................9
2. Overview of Oil Sands Development ..............................................................................11 2.1 Extracting Bitumen .......................................................................................................11 2.2 Environmental (Mis)management.................................................................................13
3. Environmental Impacts of Increased Oil Sands Development......................................14 3.1 Greenhouse Gas Emissions.........................................................................................14
3.1.1 Impacts ........................................................................................................................................ 14 3.1.2 Background ................................................................................................................................. 14
3.2 Natural Gas Consumption ............................................................................................15 3.2.1 Impacts ........................................................................................................................................ 15 3.2.2 Background ................................................................................................................................. 16
3.3 Land Impacts in the Boreal Forest................................................................................16 3.3.1 Impacts ........................................................................................................................................ 16 3.3.2 Background ................................................................................................................................. 16
3.4 Troubled Waters...........................................................................................................18 3.4.1 Impacts ........................................................................................................................................ 18 3.4.2 Background ................................................................................................................................. 19
3.5 Toxic Tailings Production .............................................................................................20 3.5.1 Impacts ........................................................................................................................................ 20

The Pembina Institute v Opening the Door for Oil Sands Expansion
3.5.2 Background ................................................................................................................................. 20 3.6 Tailings Seepage and Loss of Containment .................................................................22
3.6.1 Impacts ........................................................................................................................................ 22 3.6.2 Background ................................................................................................................................. 22
3.7 Air Pollution..................................................................................................................23 3.7.1 Impacts ........................................................................................................................................ 23 3.7.2 Background ................................................................................................................................. 23
4. The Upstream Impacts – The Calculations.....................................................................25 4.1 Greenhouse Gas Production ........................................................................................25 4.2 Natural Gas Consumption ............................................................................................26 4.3 Land Impacts................................................................................................................26 4.4 Water Use ....................................................................................................................27 4.5 Toxic Tailings Production .............................................................................................28 4.6 Tailings Seepage .........................................................................................................28 4.7 Air Pollution..................................................................................................................28 4.8 Summary......................................................................................................................29
5. Recommendations ...........................................................................................................30
List of Figures Figure 1. The proposed route for the Enbridge Northern Gateway Pipelines Project...................4 Figure 2. Western Canada Crude Oil Production, 2001-2007 Actuals and 2008-2020 Forecast..6 Figure 3. Oil sands surface mining in the Athabasca Boreal Forest ..........................................11 Figure 4. Steam assisted gravity drainage is the dominant technology used to extract deeper oil
sands deposits ..................................................................................................................12 Figure 5. A stockpile of merchantable timber removed by oil sands mining operations .............17 Figure 6. Tailings lakes in the Athabasca Boreal Forest currently occupy 130 km2 and are
growing rapidly ..................................................................................................................21
List of Tables Table 1. Per Barrel and Cumulative Upstream Environmental Impacts from Bitumen Production
Associated with the Proposed Enbridge Northern Gateway Pipelines Project ...................29
The Pembina Institute 1 Opening the Door for Oil Sands Expansion
Executive Summary The Enbridge Northern Gateway Pipeline project proposes the construction of a twin pipeline system running from central Alberta to an oil tanker port in Kitimat, B.C., providing an unprecedented link between Alberta’s oil sands and Asian markets. The dual pipeline would export 525,000 barrels a day of petroleum products from the oil sands and import 193,000 barrels a day of condensate, a substance used to dilute raw bitumen so that it can flow in a pipeline, aiding additional Alberta oil sands extraction. As such, the environmental consequences and risks of the pipeline project extend beyond the pipeline and the associated oil tanker port. They include the extraction of the additional oil sands bitumen, the tanker traffic and associated risk to B.C.’s inside coastal waters, the upgrading of oil sands bitumen to synthetic crude oil, the refining into usable petroleum products and the end use consumption. The purpose of this report is to estimate the environmental impacts of oil sands expansion that would be enabled by the proposed Northern Gateway Export Pipeline. The data sourced for calculations is from proposed oil sands projects and therefore results in a forward-looking estimate. The extraction of bitumen from the oil sands causes significant environmental impacts to climate, land, water and air, and this will continue should the business-as-usual management of the oil sands prevail.1 Specifically, the exportation of 525,000 barrels per day of diluted bitumen (367,500 barrels a day of bitumen)2 for one year is estimated to:
• consume 200 million barrels of processing water;
• consume 74 billion cubic feet of natural gas for processing; • disturb 12.5 square kilometres of land directly;
• produce 6.5 million tonnes of greenhouse gas emissions; • produce 25 million barrels of toxic tailings;
• contribute to 2.7 million barrels of seepage from toxic tailings lakes into groundwater and surface water.
Currently, there is no regional environmental management system in place to address the climate, land, water, and air impacts of Alberta’s oil sands development.
11 The Pembina Institute offers several reports discussing the impacts of oil sands production at www.oilsandswatch.org. The Pembina Institute is calling for a pause for new oil sands approvals and lease sales until the environmental, social and economic impacts of existing projects are addressed. 2 For analysis purposes, the report assumes that the 525,000 barrels per day export pipeline will ship diluted bitumen at a ratio of 30% diluent, most likely condensate, and 70% bitumen. (0.7x525,000 = 367,500). The pipeline may ship other petroleum products, such as synthetic crude oil, which will require even higher bitumen extraction levels.

The Pembina Institute 2 Opening the Door for Oil Sands Expansion
The consequences of expanded oil sands development of the scale that would be facilitated by the Northern Gateway Pipeline, in the absence of policies that are environmentally, socially and economically responsible, are of national concern. A federal Joint Review Panel, conducted by the National Energy Board and the Canadian Environmental Assessment Agency, will conduct the environmental assessment for the project. However, the draft terms of reference for the panel do not include the impacts of the Northern Gateway Pipeline Project on oil sands production in Alberta, with the resulting increases in greenhouse gas pollution and other environmental impacts. In order for Canadians to make an informed decision on the project, the process to evaluate the Northern Gateway Pipeline Project needs to include these upstream impacts. Until this is done, the project should not be given the go-ahead to proceed. In addition, we support a moratorium on the transportation of oil from Alberta’s oil sands across British Columbia until a public inquiry fully addresses concerns about the environmental impacts. The environmental assessment process currently proposed for the Northern Gateway Pipelines fails to address some of the most potentially harmful environmental consequences of the project. Because communities at both ends of the pipeline route will be most impacted by its development, ensuring their support for the project before it proceeds is essential. The Pembina Institute also recommends a pause on the approval of new oil sands projects until the necessary regulations are put in place by the Alberta and Canadian governments to manage the environmental impacts of oil sands development including greenhouse gas production, land impacts, water use and quality, and air pollution.
Summary of Recommendations 1. The terms of the federal Joint Review Panel’s environmental assessment for the Enbridge
Northern Gateway Pipelines Project must be expanded to include the impacts of increased oil sands production in Alberta, including the associated increase in greenhouse gas emissions.
2. No projects to transport oil from the Alberta oil sands across British Columbia should be approved until a public inquiry fully addresses concerns about the environmental impacts of the project. Because communities along the pipeline route would be most affected by a spill, ensuring their support for the project before it proceeds is essential.
3. No new oil sands projects should be approved until the necessary regulations are put in place to manage the environmental impacts of oil sands development.

The Pembina Institute 3 Opening the Door for Oil Sands Expansion
1. Introduction 1.1 The Enbridge Northern Gateway Pipeline Project and the
Alberta Oil Sands The pace and scale of oil sands development, and the related climate, environmental and social implications, are directly linked to the amount of available space in pipelines that can transport bitumen out of Canada. If approved and constructed, the Northern Gateway Pipeline Project would facilitate the expansion of oil sands development in Alberta by at least 367,500 barrels per day of oil sands bitumen.3 This represents a 28% increase from 2008 daily bitumen production.4 This report estimates the additional impacts that will occur in the oil sands as a result of operating the Northern Gateway Export Pipeline.
The Northern Gateway Pipeline Project5 consists of 1,170 km of dual pipeline connecting Alberta’s oil sands to Asian Pacific and Californian markets. If approved, the 36-inch westward line could export 525,000 barrels per day of diluted bitumen6 and the 20-inch eastward line could import 193,000 barrels per day of condensate (a gasoline-type substance used to dilute raw bitumen so that it can flow in a pipeline). For purposes of this report we assumed a hypothetical lifetime of the pipeline project of 40 years.
3 For analysis purposes, the report assumes that the 525,000 barrels per day export pipeline will ship diluted bitumen at a ratio of 30% diluent, most likely condensate, and 70% bitumen. (0.7x525,000 = 367,500). The pipeline may ship other petroleum products, such a synthetic crude oil, which will require greater than 367,500 of bitumen extraction. 4 In 2008, Alberta produced 207.4 thousand m3/d (1.304 million bbl/day) of crude bitumen. (Energy Resources Conservation Board, ST98-2009: Alberta's Energy Reserves 2008 and Supply/Demand Outlook 2009-2018, June 2009, 2-15, http://www.ercb.ca/portal/server.pt/gateway/PTARGS_0_0_201_0_0_35/http%3B/ercbContent/publishedcontent/publish/ercb_home/publications_catalogue/publications_available/serial_publications/st98.aspx.) Enbridge could carry 367,500 bbl/day of diluted bitumen at a dilution ration of 70:30. 5 Project description is found at Enbridge Northern Gateway Pipelines, “Project Info: Northern Gateway at a Glance”,. 2009, http://www.northerngateway.ca/project-info/northern-gateway-at-a-glance 6 “Oil” for this project is defined by Enbridge as petroleum ordinarily found in liquid form including bitumen, diluted bitumen, and synthetic crude oil. This report assumes diluted bitumen is the petroleum product that could be shipped.

Introduction
The Pembina Institute 4 Opening the Door for Oil Sands Expansion
For the purposes of this report we assumed that the export pipeline (the westward line) would transmit diluted bitumen, and not synthetic crude oil.,7 As such, the impact estimates in this report are conservative for two reasons. First, we did not include the environmental consequences associated with upgrading bitumen into synthetic crude oil; an energy-intensive process which must be done before diesel, gasoline and other useful products can be refined from the product. Second, because the bitumen will be diluted, or thinned out, to flow in the pipeline, less bitumen than synthetic oil can be shipped in a pipeline of similar size.
The pipelines would ship oil sands petroleum product between facilities in Strathcona County near Edmonton, Alberta to Kitimat on British Columbia’s west coast (Figure 1). The dual pipeline would cross almost a thousand stream and rivers and transect important salmon habitat of the Upper Fraser River, Morice/Bulkley tributaries of the Skeena River and the Kitimat River, in addition to traversing the rugged mountains of the coastal range.
Figure 1. The proposed route for the Enbridge Northern Gateway Pipeline Project
As well, the project would necessitate the construction of a marine oil tanker terminal at the north end of Douglas Channel near Kitimat. Each year approximately 220 tankers with a
7 60-65% of Alberta’s bitumen is currently refined to synthetic crude oil. This is projected to drop to 53-54% by 2020. Bob Dunbar, Canada’s Oil Sands Industry — Production & Supply Outlook (Strategy West, 2009), 12, http://www.strategywest.com/downloads/StratWestOutlook200908.pdf

Introduction
The Pembina Institute 5 Opening the Door for Oil Sands Expansion
capacity up to 2 million barrels of oil would access Douglas Channel via Hecate Straight, Queen Charlotte Sound, and/or Dixon Entrance unloading condensate and picking up diluted bitumen and/or synthetic crude.8
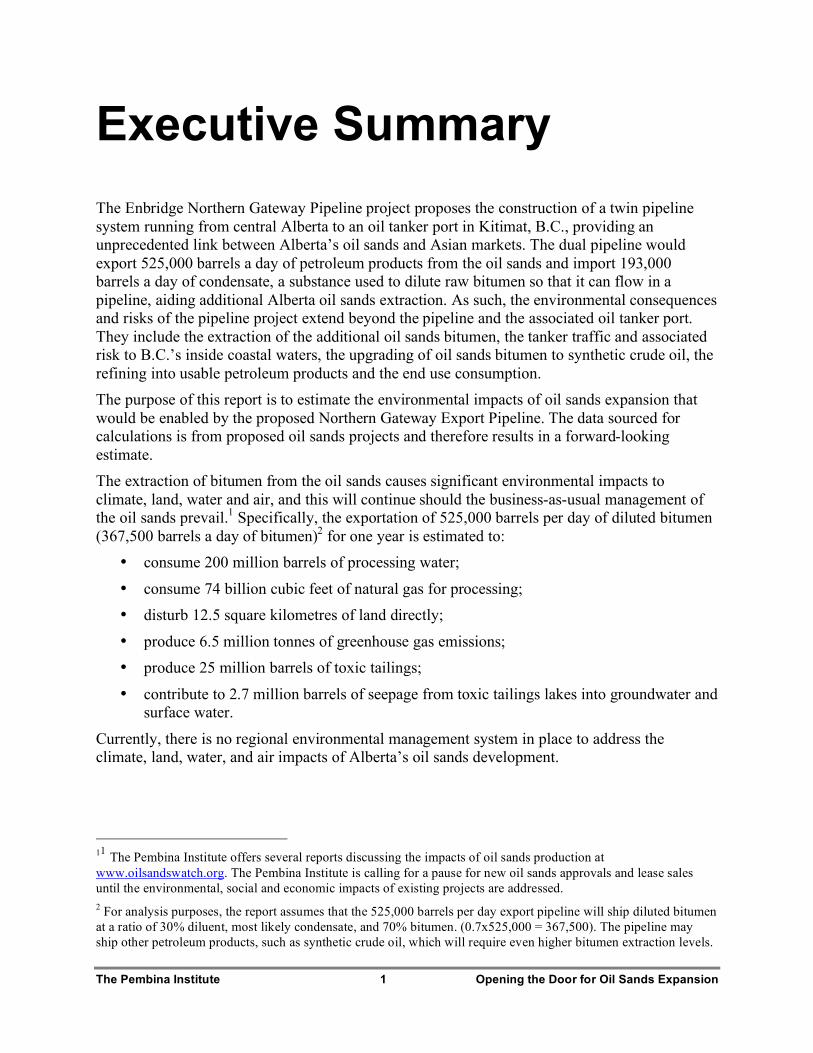
1.2 The Increasing Role of Oil Sands Carbon-intensive, unconventional petroleum resources such as oil sands are rapidly replacing dwindling conventional oil reserves. Alberta’s oil sands have put Canada on the global stage with reserves second in size only to Saudi Arabia.9 In 2007, the Canadian Association of Petroleum Producers (CAPP) reported Western Canada’s production of all crude oil at 2.2 millions barrels per day (mbpd), 1 mbpd from conventional oil sources and 1.2 mbpd from oil sands production10 (Figure 2). By 2020, under moderate growth conditions, CAPP estimates that oil sands production will represent 83% of all crude oil production in Western Canada, with conventional oil production declining by one-third and oil sands production increasing by as much as threefold.11 This production is largely destined for export, since Canada’s demand for oil is rising slowly relative to the size of oil sands expansion.12 Canada will be increasingly shouldering the environmental and social costs of supplying other countries with oil.
8 Enbridge Northern Gateway Pipelines, Enbridge Northern Gateway Project, Kitimat Terminal and Marine Transportation Environmental and Socio-Economic Assessment Discussion Guide, 2009, http://www.northerngateway.ca/environment-safety/environmental-assessment/marine 9 HIS Cambridge Energy Research Associates, Growth in the Canadian Oil Sands: Finding the New Balance, 2009, I-2, http://www.cera.com/aspx/cda/client/knowledgearea/servicedescription.aspx?kid=228 10 Canadian Association of Petroleum Producers, Crude Oil Forecast, Markets & Pipeline Expansions, June 2008, Appendix B1, 30. 11 Ibid. CAPP estimated that oil sands production would be 3.539 mbpd in 2020. Most recent forecasts suggest that even under the current “economic slowdown” conditions, bitumen production capacity could reach 3.4 mbpd by 2020 (David McColl, The Eye of the Beholder: Oil Sands Calamity or Golden Opportunity, Canadian Energy Research Institute, Feb 2009, 5, http://www.ceri.ca/documents/CERIOilSandsBriefingFebruary2009.pdf) 12 Ibid. CAPP estimated that demand for western Canadian crude oil by Canadian refineries is expected to rise from about 825,000 b/d in 2007 to almost 1.1 million b/d in 2015, a 33 percent increase. Over the same period, the U.S. refinery demand for western Canadian crude oil is projected to increase from about 1.6 million b/d to almost 3.5 million b/d, an increase of 120 percent in the light synthetic crude oil supply.
Introduction
The Pembina Institute 6 Opening the Door for Oil Sands Expansion
Figure 2. Western Canada Crude Oil Production, 2001-2007 Actuals and 2008-2020 Forecast Source: Canadian Association of Petroleum Producers, Crude Oil Forecast, Markets & Pipeline Expansions, June 2008.
1.3 Oil Sands Expansion — A Growing Concern Growth in oil sands production has been rapid over the past decade. Between 1999 and 2009 oil sands production increased from approximately 300,00013 barrels per day to 1.3 million barrels per day.14 In 2008, oil sands accounted for 45% of Canada’s total oil production,15 with approximately 55% of oil sands production coming from mining operations and 45% coming from in situ operations.16 Alberta’s bitumen production is estimated to grow to over 3 million
13 Natural Resources Canada, "1999 / 2000 Annual Sector Reports — Oil Sands," http://oee.nrcan.gc.ca/Publications/infosource/Pub/cipec/annual_report99-00/oil.cfm?text=N&printview=N. 14 In 2008, Alberta produced 207.4 thousand m3/d (1.304 million bbl/day) of crude bitumen. ERCB, Alberta's Energy Reserves 2008, 2-15. 15 Calculated from: National Energy Board, Estimated Production of Canadian Crude Oil and Equivalent — 2008 (Revised March 2009), Table 1, http://www.neb.gc.ca/clf-nsi/rnrgynfmtn/sttstc/crdlndptrlmprdct/2008/stmtdprdctncndncrdlqvlnt2008.xls, accessed April 28, 2009. 16 ERCB, Alberta's Energy Reserves 2008, 2-15.

Introduction
The Pembina Institute 7 Opening the Door for Oil Sands Expansion
barrels of oil per day by 2018.17 Collectively, companies have proposed projects that would add up to 7.0 million barrels per day of bitumen production capacity.18
The oil sands are receiving increased national and international attention due to the magnitude of the resource, the substantial capital investment involved, and the unresolved social and environmental consequences involved in the extraction and upgrading bitumen. Amidst rising urgency about the need to fight global warming, the oil sands have emerged as Canada’s fastest-growing source of greenhouse gas pollution.19 Other environmental impacts — including water removal from the Athabasca River, the creation of toxic liquid tailings, and hundreds of square kilometers of strip-mining and drilling in the boreal forest — are growing just as rapidly.
1.4 Purpose of this Report Major pipeline proposals are usually evaluated using a scope that only considers construction and operation of the pipeline and related infrastructure, as in this case, the oil tanker port proposed for Kitimat. In the oil sector, the term “upstream” is commonly used to refer to the search for and the extraction of crude oil and natural gas. In the case of the Enbridge Northern Gateway Pipeline Project, there are major environmental impacts upstream that are currently not being considered within the regulatory review process. The purpose of this report is therefore two-fold:
1. To estimate the upstream environmental impacts of the Enbridge Northern Gateway Export Pipeline;
2. To highlight high-level solutions to address the impacts of future oil sands developments.
Any assessment of the Northern Gateway Pipelines Project needs to include at a minimum the upstream impacts of the production of the bitumen or oil sands oil that will be transported by the pipeline. Section 2 provides an overview of the oil sands development process, Section 3 describes the environmental impacts, Section 4 presents calculations and Section 5 outlines recommendations.
1.5 Methodology and Assumptions The calculations in this report are based on publicly available information provided by oil sands companies in Environmental Impact Assessments. The information was either sourced directly or indirectly via independent research or government publications. The information was used to estimate the upstream environmental impacts that would occur in the production of bitumen to supply the Enbridge pipeline with its initial capacity of 525,000 barrels per day of diluted bitumen. For ease of comparison with other pipeline proposals, the data is reported on a barrel
17 ERCB, Alberta's Energy Reserves 2008, 2. 18 Bob Dunbar, Existing and Proposed Canadian Commercial Oil Sands Projects (Strategy West, August 2009), http://www.strategywest.com/downloads/StratWest_OSProjects_200908.pdf 19 The ecoENERGY Carbon Capture and Storage Task Force, Canada's Fossil Energy Future, Report to the Minister of Alberta Energy and the Minister of Natural Resources Canada, 2008, http://www.energy.gov.ab.ca/Org/pdfs/Fossil_energy_e.pdf

Introduction
The Pembina Institute 8 Opening the Door for Oil Sands Expansion
per day basis, an annual basis, and over a hypothetical 40-year lifetime of the project. Seven indicators (either resources consumed or pollution discharged) were selected to represent the upstream production impacts:
1. greenhouse gas production 2. natural gas consumption 3. land impacts 4. water use 5. mature fine tailings production 6. seepage from tailings ponds 7. air pollution (nitrogen oxides and sulphur dioxide)
The following assumptions were applied to the analysis of the data used for this report.
• The export pipeline (the west line) would transport diluted bitumen, the primary product of oil sands production.20,21 If the pipeline were approved and constructed, it could be used to ship either diluted bitumen, synthetic crude oil, or even refined petroleum products. This is a conservative assumption. If the environmental consequences associated with upgrading and/or refining all or a portion of the bitumen had been included the estimated upstream impacts (particularly GHG, air and water impacts) would have increased significantly.22
• The stated capacity of the proposed export line would be 525,000 barrels per day.
• Transported bitumen would be mixed with a diluent, most likely condensate, at a ratio of 70:30.23 This means that the 525,000 bbls/day export pipeline would require production of 367,500 barrels per day of bitumen. If the pipeline ships synthetic crude oil, or even refined petroleum products, a larger volume of raw bitumen would be extracted to fill the pipeline. 24
• The source of the bitumen is 50% mining projects and 50% in situ. This is the ratio of mining to in situ production based on proposed projects as of February 2009.25 In 2008,
20 Information boards at Enbridge’s 2006 open house stated “Enbridge’s Gateway Project is an important part of Canada’s energy future and will help ensure there is enough capacity to transport new oil expected from Canada’s oil sands in the years to come.” 21 60-65% of Alberta’s bitumen is currently refined to synthetic crude oil. This is projected to drop to 53-54% by 2020. (Dunbar, Oil Sands Industry — Production & Supply Outlook, 12.) 22 Upgrading bitumen results in additional natural gas and water consumption and the release of greenhouse gases and other air pollutants. 23 A. Saniere, I. Hénaut and J.F. Argillier, “Pipeline Transportation of Heavy Oils, A Strategic, Economic and Technological Challenge,” Oil and Gas Science and Technology - Rev. IFP, 59, no. 5, (2004): 462. This means that 70% of transported volume would be bitumen and 30% would be diluent. 24 Some processes for upgrading bitumen to synthetic crude oil increase the volume of product and others reduce the volume. The simplified explanation for this difference it that depends on whether the upgrading process removes the excess carbon or adds additional hydrogen. 25 Dunbar, Existing and Proposed Canadian Commercial Oil Sands Projects. This assumption is consistent with our methodology of only using data from proposed projects with improved extraction techniques versus using existing operations.

Introduction
The Pembina Institute 9 Opening the Door for Oil Sands Expansion
approximately 55% of oil sands production was from mining operations, with in situ operations producing the other 45%.26
• The hypothetical lifetime of the pipeline project is estimated at 40 years. This assumption is not based on information on pipelines but rather on the average lifetime of oil sands projects. In situ projects range from 25 to 40 years and mining projects range from 40 to 50 years.
• The data used in the calculations is representative of oil sands projects and is sourced from a selection of environmental impact assessments that are reported by companies.
• The capacity of the pipelines would not be expanded over the lifetime of the project.
The report did not examine the environmental impacts associated with the pipeline and associated oil port itself including:
• the construction of the pipeline and oil port, • the operation of the pipeline and oil tanker port, and the potential for spill and leaks, • the introduction of oil tankers to the north coast of British Columbia and the risk of a
major oil spill. While the impacts of the pipeline and oil tanker port will most likely be considered during an assessment of the project, the question of whether or not to introduce oil tankers to B.C.’s north coast and introduce the risk of a marine oil spill remains unaddressed.27
1.6 Expanding Pipeline Capacity — A Slippery Slope The domestic market for oil sands is small and saturated — growth in oil sands output is linked to pipeline capacity. It is possible to expand pipeline capacity once a line is in place by adding additional pumping stations, looping sections of the pipeline, or constructing a parallel pipeline.
In the case of Kinder Morgan’s Trans Mountain Pipeline from Edmonton, Alberta to refineries in British Columbia and Washington state, the capacity has been increased twice in recent years. The first increase came from adding 11 additional pumping stations that increased the capacity from 225,000 barrels per day to approximately 260,000 barrels per day. The second increase was achieved by completing the Anchor Loop Project that increased the capacity from 260,000 to 300,000 barrels per day.28
In a second example, Enbridge’s proposed Alberta Clipper line, a 36-inch diameter, 1600 km pipeline from Hardisty, Alberta to Superior,Wisconsin, will have an initial capacity of 450,000 barrels per day. With the addition of more pumping stations the pipeline could achieve an ultimate capacity of 800,000 barrels per day.29
26 ERCB, Alberta's Energy Reserves 2008, 2-15. 27 For more information refer to West Coast Environmental Law, The Enbridge Northern Gateway Pipeline: Getting the Decision Right, 2009, http://www.wcel.org/articles/Enbridge/web_EnbridgeGettingDecisionRight_outreach_2009.pdf 28 Kinder Morgan, “National Energy Board Approves Trans Mountain Anchor Loop Project”, press release, October 31, 2006, http://www.kindermorgan.com/business/canada/TMX_Documentation/575_anchorloopNEB.pdf 29 Enbridge, “Alberta Clipper,” http://www.enbridge-expansion.com/expansion/main.aspx?id=1218. This is an increase of 78% over the initial capacity.

Introduction
The Pembina Institute 10 Opening the Door for Oil Sands Expansion
The Enbridge Northern Gateway Pipelines Project proposes a 36-inch diameter, 1170 km long pipeline serviced by 10 pumping stations with a listed pumping rate of 525,000 barrels per day. This is the expected daily average over a one-year period accounting for periods of non-operation (downtime). The actual peak flow rate — the highest instantaneous flow rate that could be achieved — for this proposed pipeline arrangement is unknown but is higher than 525,000 barrels per day. Given the forecasted growth in the oil sands and the state of emerging markets, it is fair to state that the capacity of the Northern Gateway Pipeline Project could be ramped up over time.

The Pembina Institute 11 Opening the Door for Oil Sands Expansion
2. Overview of Oil Sands Development
2.1 Extracting Bitumen Depending on the depth of the reserves, tar-like oil sands deposits are either surface mined from open pits or heated with injected steam so the bitumen can flow to a well and be pumped to the surface (in situ recovery).
For shallow deposits (less than 75 metres), oil sands ore is surface mined and processed in an extraction plant to separate the bitumen from sand and other minerals. The dominant method of oil sands mining is the truck and shovel method (Figure 3). Large shovels dig oil sands ore and load it into the back of huge hauler trucks. Trucks transport the oil sands ore to crushers where it is broken down in smaller chunks, and the extraction process begins.
Figure 3. Oil sands surface mining in the Athabasca Boreal Forest Photo: Jennifer Grant, The Pembina Institute

Overview of Oil Sands Development
The Pembina Institute 12 Opening the Door for Oil Sands Expansion
Deeper deposits (greater than 75 metres) are exploited using in situ (“in place”) techniques, such as steam assisted gravity drainage (SAGD),30 where high pressure steam is injected into the ore, reducing its viscosity and allowing the oil portion to flow into a horizontal well (Figure X). SAGD consists of well pads ranging in size from one to seven hectares that are cleared of all vegetation; multiple pairs of horizontal wells (an injector well and a producer well) are drilled into the bitumen-containing formation. A large SAGD project can have up to 25 well pads spread over a 150-square-kilometre parcel of land crisscrossed by above-ground pipelines.31 A central facility produces high-pressure steam that is carried by above-ground pipelines to the well pads where it is injected into the formation. The bitumen and water (from the condensed steam) then drains by gravity to the lower producer well where it is pumped to the surface.
Figure 4. Steam assisted gravity drainage is the dominant technology used to extract deeper oil sands deposits Source: The Pembina Institute
30 Steam based recovery techniques such as SAGD are the only methods of in situ extraction used for commercial production. Other in situ methods such as vaporized solvent extraction, toe-to-heel air injection, and electrical heating have not been developed at commercial scale. A second steam-based thermal recovery technique, cyclic steam stimulation (CSS), is also being developed. A review of all approved and proposed in situ projects (i.e. currently non-operational) revealed that 92% (by rate of bitumen extraction) are SAGD. 31 Petro-Canada, Application for Approval of the Meadow Creek Project, vol. 1 (1991): 3-4.

Overview of Oil Sands Development
The Pembina Institute 13 Opening the Door for Oil Sands Expansion
After being separated from the sand, bitumen must be upgraded before it can be refined into gasoline, diesel, jet fuel and other hydrocarbon products. The upgrading process uses intense heat and pressure and the addition of hydrogen to convert the bitumen from thick, molasses-like material into a lighter, higher-quality synthetic crude oil that can be sent to refineries.
2.2 Environmental (Mis)management With each additional oil sands project approved and constructed in Alberta’s boreal forest, the environmental impacts to air quality, boreal forest and wildlife, and fresh water resources increase. While the environmental impacts of each project might appear insignificant on their own, the cumulative environmental impacts of all the project could lead to irreversible ecological damage if not properly managed and mitigated. While government and industry have been successful in facilitating unconstrained oil sands expansion, parallel efforts to protect the environment have failed.
Some of the key gaps in the environmental management of the oil sands are: • No absolute limits on air pollutants and greenhouse gases
• No absolute limit on tailings volumes • No land use plan that protects wildlife and regional ecosystems
• No lower limit on flows of the Athabasca River below which oil sands water withdrawals would be stopped
• No environmental management plan to maintain the integrity of watersheds, most urgently the Muskeg River watershed
• No informed limit on groundwater extraction • No certification standards for oil sands reclamation
For more information on environmental management of the oil sands region see Taking the Wheel: Correcting the Course of Cumulative Environmental Management in the Athabasca Oil Sands32 and Clearing the Air on Oil Sands Myths33.
32 Chris Severson-Baker, Jennifer Grant and Simon Dyer, Taking the Wheel: Correcting the Course of Cumulative Environmental Management in the Athabasca Oil Sands (The Pembina Institute, 2008), http://pubs.pembina.org/reports/Taking_the_Wheel-report.pdf 33 Jennifer Grant, Dan Woynillowicz and Simon Dyer, Clearing the Air on Oil Sands Myths (The Pembina Institute, 2009), http://pubs.pembina.org/reports/clearing-the-air-report.pdf

The Pembina Institute 14 Opening the Door for Oil Sands Expansion
3. Environmental Impacts of Increased Oil Sands Development
If constructed, the Enbridge Northern Gateway Pipeline Project would allow an increase of 367,500 barrels per day of bitumen, a 28% increase from 2008 bitumen production rates. Based on the ratio of proposed in situ and mining projects (50% in situ and 50% mining) and the assumption that no upgrading would occur, the following impacts on climate, land, air and water were calculated. For a description of the calculations refer to Section 4; for a summary of the results see Table 1.
3.1 Greenhouse Gas Emissions
3.1.1 Impacts Oil sands are the fastest-growing source of greenhouse gas (GHG) emissions in Canada. The Northern Gateway Pipeline Preojct would facilitate the emission of 6.5 Megatonnes of greenhouse gases annually due to expanded oil sands production. Over a 40-year hypothetical lifetime of the pipeline project, 260 Megatonnes of greenhouse gases will be emitted.
• The annual GHG emissions are equivalent to the emissions from 1.6 millions cars each year.
• The province of British Columbia emitted 71 Megatonnes in 2007 and has legislated to reduce these emissions to 47.6 megatonnes a year by 2020. The annual emissions from increased oil sands development would represent 17% of B.C.’s 2020 legislated target.
• In 2007, B.C.’s largest single point source, an industrial facility, emitted 1.14 megatonnes of GHGs.34
3.1.2 Background Production of synthetic crude oil from the oil sands uses significantly more energy — primarily in the form of natural gas — and produces significantly more greenhouse gas pollution than conventional oil production.
In a business-as-usual projection, GHG emissions from oil sands are expected to rise from 4% of national emissions in 2006 to 12% in 2020, and account for 44% of the total increase in Canada’s
34 Rio Tinto Alcan’s Kitimat Aluminum Smelter released 1,137,107.82 tonnes of CO2 equivalent in 2007. Environment Canada, "2007 Emissions Data, Table 3: Summary of GHG Emissions by Facility," http://www.ec.gc.ca/pdb/ghg/onlinedata/kdt_t3_e.cfm?year=2007.

Environmental Impacts of Increased Oil Sands Development
The Pembina Institute 15 Opening the Door for Oil Sands Expansion
emissions over that period.35 Although there is quite a wide variation from one oil sands plant to the next, producing a barrel of oil from the oil sands is more than three times as greenhouse gas-intensive as Canadian conventional oil production.36 Canada does not have regulations in place to drive reductions in greenhouse gas emissions consistent with its current government policy announcements.37 Canada is considered a laggard on climate change within the international community.38
For more information on climate change and greenhouse gas emissions see Oil Sands Fever: The Environmental Implications of Canada’s Oil Sands Rush39.
3.2 Natural Gas Consumption
3.2.1 Impacts Natural gas is a significant source of energy for oil sands operations. The increased production due to this project would consume 74 billion cubic feet of natural gas per year. Over the project’s hypothetical 40-year lifetime, three trillion cubic feet of natural gas will be consumed.
• This is equivalent to 34% of British Columbia’s gas consumption for residential, commercial, and industrial uses.40
• This is the annual energy needed to heat 1.3 million households in Canada.41
35 Environment Canada, Turning the Corner: Detailed Emissions and Economic Modelling (2008), 42, http://www.ec.gc.ca/doc/virage-corner/2008-03/pdf/571_eng.pdf. 36 Alex D. Charpentier, Joule A. Bergerson, and Heather L. MacLean, “Understanding the Canadian Oil Sands Industry’s Greenhouse Gas Emissions,” Environmental Research Letters 1 (2009). 37 Matthew Bramley and Clare Demerse, Evaluation of the Government of Canada’s Greenhouse Gas Reduction Policies, Prepared for the Climate Change Performance Index 2009, November 2009, 3. http://climate.pembina.org/pub/1751. 38 Jan Burck, Christoph Bals, Simone Ackermann, Climate Change Performance Index Results 2009, (German Watch and Climate Action Network Europe, December 2008), www.germanwatch.org/ccpi.htm. Canada placed second last (56th of 57) among the world's biggest emitters of greenhouse gases. 39 Dan Woynillowicz, Chris Severson-Baker, and Marlo Raynolds, Oil Sands Fever: The Environmental Implications of Canada's Oil Sands Rush (The Pembina Institute, 2005), http://pubs.pembina.org/reports/OilSands72.pdf 40 B.C. consumed 215 billion ft3 of natural gas in 2006 for residential, commercial and industrial purposes. Ministry of Energy, Mines and Petroleum Resources, Oil and Gas Production and Activity in British Columbia, Statistics and Resource Potential 1996-2006, www.empr.gov.bc.ca/OG/oilandgas/statistics/Documents/5839_OilnGas_Bro.pdf. 41 Total space heating demand for all Canadian households: 794 x 1015 joules (Natural Resources Canada, Energy Use Data Handbook, 2006, http://oee.nrcan.gc.ca/publications/statistics/handbook06/pdf/handbook06.pdf); total number of Canadian households: 12,756 x 103; therefore 62.26 x 10⁹ joules per Canadian household. One cubic meter of gas provides 38.26 x 10⁶ joules of energy (high heating value conversion factor from StatsCan, Report on Energy Supply and Demand in Canada, 2005), therefore 1,627 m3 or 57,500 ft3 per year per Canadian household for space heating. 73.7 million ft3 of gas could therefore heat 1.3 million households.

Environmental Impacts of Increased Oil Sands Development
The Pembina Institute 16 Opening the Door for Oil Sands Expansion
3.2.2 Background Both surface mining and in situ operations are energy intensive. Natural gas is used both to generate the heat necessary to extract the bitumen from the oil sands and as a source of hydrogen to upgrade the bitumen into synthetic crude oil. Consuming natural gas to produce bitumen is an inefficient process, turning a relatively clean-burning fuel into a more carbon-intensive fuel. There are other more efficient uses for natural gas; for example, a vehicle powered by natural gas would generate 48% lower GHG emissions than a vehicle powered by gasoline derived from oil sands on a life-cycle basis.42
In addition, the land use impacts from natural gas extraction are relatively large due to the land fragmentation effects of lines, roads and pipelines.43
3.3 Land Impacts in the Boreal Forest
3.3.1 Impacts Land impacts from both in-situ and mining projects are significant and have the potential to fragment vast areas of Alberta’s boreal forest. The Northern Gateway Pipeline Project would impact an additional 11.5 square kilometres of land annually due to expanded oil sands production. Over the project’s hypothetical 40-year lifetime, 460 square kilometres of land would be affected.
• The annual land impact is equivalent to 2,148 football fields. • The lifetime impact equals to the area of 115 Stanley Parks44, or four times the area of the
City of Vancouver.45
3.3.2 Background Oil sands deposits underlay 142,000 square kilometres of northeastern Alberta.46 The area is covered with boreal forest, a complex array of upland forested areas and wetlands, including bogs, fens, swamps, marshes, and shallow open-water ponds. Canada’s boreal forest serves highly valuable ecological functions by storing fresh water in its wetlands and lakes, storing carbon in its trees, soil and peat, as well as providing habitat for animals such as migratory song birds, waterfowl, bears, wolves, and caribou. Since oil sands development began the Government of Alberta has leased 79,000 km2 of land for oil sands development 47 — an area the size of New
42 Matthew McCulloch et al., Mackenzie Gas Project Greenhouse Gas Analysis (The Pembina Institute, 2007), 24, http://pubs.pembina.org/reports/mgp-ghg-consolidated-report.pdf 43 Sarah M Jordaan, David W Keith and Brad Stelfox, “Quantifying Land Use of Oil Sands Production: A Life Cycle Perspective,” Environmental Research Letters, 4, no. 2 (2009). 44 The area of Stanley Park in Vancouver is approximately 4 km2. 45 The area of the City of Vancouver is approximately 115 km2. 46 ERCB, Alberta's Energy Reserves 2008, 2-4. 47 Alberta Energy, personal communication, May 19, 2009. The total area leased for in situ development as of May 19, 2009 is 7,929,827 hectares.

Environmental Impacts of Increased Oil Sands Development
The Pembina Institute 17 Opening the Door for Oil Sands Expansion
Brunswick — without any assessment of surface impacts or consultation with First Nations communities.
Both forms of oil sands extraction, in situ and mining, are damaging to the boreal forest ecosystem. In situ extraction — which may be the development method used for 80% of the oil sands deposit — requires a network of seismic lines, roads, power line corridors, pipelines and other infrastructure. The direct footprint of these disturbances is less than mining, but because the disturbances are widely distributed, they create a patchwork of fragmented habitat. Since the ecological effects of each cleared area extends out into the surrounding forest, the majority of the forest in tenure areas will be impacted.48 This creates a serious threat to biological diversity because it reduces the amount of habitat available and limits the movement patterns of wildlife and birds.49 A University of Calgary study confirmed that land impacts per barrel of in situ extraction are comparable to mining when the indirect impacts from fragmentation are considered.50
Figure 5. A stockpile of merchantable timber removed by oil sands mining operations Photo: Jennifer Grant, The Pembina Institute
A recent report from Environment Canada noted that all the threatened woodland caribou herds in northern Alberta are on the way to extirpation, largely as a result of the cumulative footprint of
48 Richard Schneider and Simon Dyer, Death by a Thousand Cuts: The Impacts of In Situ Oil Sands Development on Alberta's Boreal Forest (Canadian Parks and Wilderness Society and The Pembina Institute, 2005), 11, http://pubs.pembina.org/reports/1000-cuts.pdf 49 Woynillowicz Severson-Baker and Raynolds, Oil Sands Fever, 37. 50 Jordaan, Keith and Stelfox, “Quantifying Land Use.”

Environmental Impacts of Increased Oil Sands Development
The Pembina Institute 18 Opening the Door for Oil Sands Expansion
industrial development (including in-situ oil sands development) within their ranges.51 Harm could come to 14.5 million breeding birds from direct habitat loss and to as many as 76 million birds from fragmentation and habitat degradation over a 30 to 50 year period.52 Mineable oil sands underlie almost 5,000 square kilometres of boreal forest in the Athabasca formation.53 Oil sands mining permanently changes large tracts of land by diverting rivers, draining complex wetland systems (which include bogs and fens) and stripping away soils for open pit mining operations. The reclaimed landscape that is currently being proposed by industry will be radically different from its original form. Since the 1960s, 520 square kilometers54 of land has been cleared and disturbed as a result of oil sands mining. Oil companies report that they have reclaimed 13.6% of the area, but to date the province has certified only 0.2% (about 1 square kilometer) as reclaimed.55 For more information on impacts on the boreal forest from in situ production and mining see Death by a Thousand Cuts and Oil Sands Fever. For more information on the status of reclamation of oil sands lands see Fact or Fiction: Oil Sands Reclamation.
3.4 Troubled Waters
3.4.1 Impacts Water supply is a growing concern in the Athabasca watershed. The Northern Gateway Pipeline Project would consume an additional 200 million barrels per year due to expanded oil sands production. Over the project’s hypothetical 40-year lifetime, 8 billion barrels of water will be consumed.
• The annual water consumption would equal that of a city with a population of 250,000.56
• A city returns almost all of the water its citizens use back into the river after treatment. In contrast, all water consumed by oil sands operations ends up in the oil sands formation (in the case of in situ) or in tailings lakes (in the case of mines).
51 Environment Canada, Scientific Review for the Identification of Critical Habitat for Woodland Caribou (Rangifer tarandus caribou), Boreal Population, in Canada, 2008, https://www.registrelep-sararegistry.gc.ca/virtual_sara/files/Caribou%5FFull%5F0409%5Fe%2Epdf 52 Jeff Wells et al, Danger in the Nursery: Impact on Birds from Tar Sands Oil Development in Canada’s Boreal Forest (Natural Resources Defense Council, 2008), v, http://www.nrdc.org/wildlife/borealbirds.pdf 53ERCB, Alberta's Energy Reserves 2008, 2-7. This is a new figure inconsistent with previously published Government of Alberta material reporting 3,500 km2. 54 Alberta Environment, Personal communication, November 2008. 55 Jennifer Grant et al, Fact or Fiction: Oil Sands Reclamation (The Pembina Institute, 2008), http://pubs.pembina.org/reports/fact-or-fiction-report-rev-dec08.pdf 56 The average individual in Canada consumes 786 bbl of water per year. Natural Resources Canada, "Domestic Water Consumption, 1999," http://atlas.nrcan.gc.ca/site/english/maps/freshwater/consumption/domestic/1. 200 million barrels of water divided by 786 barrels equals 250,000 barrels per person per year.

Environmental Impacts of Increased Oil Sands Development
The Pembina Institute 19 Opening the Door for Oil Sands Expansion
3.4.2 Background Oil sands mines are large consumers of fresh water from the Athabasca River. It takes between 2 and 4 barrels of fresh water to extract a single barrel of bitumen.57 While companies have processes to recycle water, it becomes contaminated during the washing process, therefore fresh water must be continually added. As a result very large quantities of water are removed from the Athabasca River. In 2007, the water allocation for oil sands mining operations in the Athabasca Basin was more than 550 million m3/year.58 Of this nearly 80% was allocated from the Athabasca River, with the remainder coming almost equally from groundwater and surface runoff.59
The mining operations not only use large volumes of water from the Athabasca River, they also impact groundwater.60 Much of the surface overlying the bitumen is covered by muskeg, wetlands and peatlands, which must be drained before the overburden can be cleared to access the bitumen. This naturally impacts surface flows in the area. Once a mining area is reclaimed, there will be larger areas of dry uplands. With the area of natural spongy peat land reduced, there will be more rapid runoff to the rivers and an impact on groundwater levels. This could, in turn, also affect the Athabasca and other rivers.61 For in situ development, 0.6 to 0.9 barrels of water are needed to extract62 and upgrade63 one barrel of bitumen. This volume is in addition to the water that is recycled through the processes. In situ projects largely use saline and non-saline groundwater. The impacts of in situ operations on shallow non-saline groundwater occur over a wide area and add to the impacts on 57 For oil sands mining, approximately 12 barrels of water are needed to produce each barrel of bitumen in surface mined oil sands operations. Approximately 70% of this water is recycled, leaving a net use of about four barrels of water per barrel of bitumen production. (R. J. Mikula ,V. A. Munoz, and O. Omotoso, “Water Use in Bitumen Production: Tailings Management in Surface Mined Oil Sands” presented at the World Heavy Oil Congress, Edmonton, 2008, 1, http://canmetenergy-canmetenergie.nrcan-rncan.gc.ca/fichier.php/codectec/En/2008-097D/2008-097_en.pdf) 58 This figure is based on the initial allocation for Imperial’s Kearl project, but the licence permits an increase in the volume of water withdrawn from the Athabasca River at later stages in the project. 59 Data provided by Alberta Environment shows that in 2007 the surface water allocations from the Athabasca River (including the Tar River) were approximately 440 million m3/year. The surface runoff allocation is likely to be over 54 million per year, but the absolute figure depends on how much of Imperial’s Kearl allocation is taken from the Athabasca River, and how much from surface runoff. The total groundwater allocation for energy production in the basin is likely to be more than 51 million m3/year, but could be up to 61 million m3/year, if the Kearl project takes a larger proportion of its total allocation from groundwater. 60 For a more detailed description of the impacts, see Mary Griffiths, Amy Taylor and Dan Woynillowicz, Troubled Waters, Troubling Trends: Technology and Policy Options to Reduce Water Use in Oil and Oil Sands Development in Alberta (The Pembina Institute, 2006), 30–35 and 67–81, http://pubs.pembina.org/reports/TroubledW_Full.pdf. 61 Bruce Peachey, Strategic Needs for Energy Related Water Use Technologies: Water and the EnergyINet (EnergyINet, 2005), 36, http://www.aeri.ab.ca/sec/new_res/docs/EnergyINet_and_Water_Feb2005.pdf. Peachey cites a personal communication with Dr. Kevin Parks, Alberta Geological Survey (AGS), who stated that the AGS estimates that 15–25% of river channel flows in northeastern Alberta are directly contributed by groundwater. 62 Griffiths et al, Troubled Waters, Troubling Trends, 16. 63 Randy Provencal, Shell Canada Limited, personal communication, March 2006. In 2005 Shell diverted 6,254,580m3 water for the Scotford upgrader (75% of the licence limits), to produce 3,447,500 m3 of oil (56,575,000 barrels). See also Shell Canada, Scotford Upgrader Project Application (1998), vol. 1, i. and 4-1 for initial project design figures.

Environmental Impacts of Increased Oil Sands Development
The Pembina Institute 20 Opening the Door for Oil Sands Expansion
groundwater from oil sands mining operations along the Athabasca River. Companies must be required to look very carefully for alternatives to non-saline groundwater.
Fresh water used for in situ operations is permanently removed from the watershed. Although most of the injected steam is pumped back to the surface as water with the bitumen, some remains in the formation. Before the water is recycled to generate more steam it must be treated to remove contaminants, and the residual from the treatment process is either sent for deep well disposal or, in some cases, to landfill. Thus, a constant supply of make-up water is required. Where fresh groundwater is used, it will gradually be recharged by precipitation and inflows from other areas, but it is estimated that it will take decades for an aquifer to recover after in situ operations and water withdrawals cease.64 Companies can only make educated guesses about the length of time it will take aquifers to recover, because they admit “it is very difficult to measure natural groundwater recharge rates.”65 It is even more difficult to anticipate the effect of climate change on the rate of recharge. While the impact of one well may be small, the cumulative impact of a large number of in situ operations, each operating for 30 to 40 years, could be extremely large.66 For more information about the use of freshwater and groundwater to wash oil from the sands in mining operations see Oil Sands Fever or Troubled Waters, Troubling Trends.
3.5 Toxic Tailings Production
3.5.1 Impacts The production of tailings, which are the waste product of oil sands mining, is a significant problem because of concerns about toxicity and the problem of finding a long-term storage and reclamation solution. The Northern Gateway Pipeline Project would produce 70,000 barrels per day of “mature fine tailings” due to expanded oil sands production.
• Tailings would fill 4.4 Olympic swimming pools every day.67 • Tailings would fill one and a half BC Place stadiums every year.68
3.5.2 Background Tailings are the liquid waste product created by bitumen extraction in oil sands mines. Once the oil sands ore is mixed with hot water (and sometimes caustic soda) to wash oil from sand, the slurry is then pumped via pipeline to the extraction plant. The extraction process separates the bitumen from the oil sand. The slurry mixture from the hydro-transport pipeline goes into tanks
64 Griffiths et al, Troubled Waters, Troubling Trends, 85. 65 ConocoPhillips, Surmont Thermal Project Submission to the EUB and Alberta Environment Application and EIA, vol. 2, part 3 (2001), 3–14. 66 The potential impacts of in situ operations on fresh groundwater are discussed in more detail in Griffiths et al, Troubled Waters, Troubling Trends, especially pp. 85–90. 67 An Olympic swimming pool contains 15,700 barrels of water. 68 The volume of BC Place Stadium is 16 million barrels.

Environmental Impacts of Increased Oil Sands Development
The Pembina Institute 21 Opening the Door for Oil Sands Expansion
where it settles into layers: the bitumen floats to the surface, the sand settles to the bottom, and in between floats a murky water layer called middlings. 69
The sand and middlings make up the waste byproduct called tailings and consist of water, sand, silt clay, unrecovered hydrocarbons and water with dissolved components.70 Tailings toxicity comes from compounds including residual bitumen, naphthenic acids, phenolic compounds, ammonia-ammonium, and metals. Given the toxic composition of tailings, tailings waste must be held and managed on site. The tailings slurry is pumped hydraulically to deposition sites, called tailings lakes or end pit lakes, where it is left to separate and settle. This settling could take anywhere from a few decades to as much as 125 to 150 years, depending on the tailings management and technologies employed and the proportion of fine materials in the mined oil sands.71
Figure 6. Tailings lakes in the Athabasca Boreal Forest currently occupy 130 km2 and are growing rapidly Photo: Jennifer Grant, The Pembina Institute
69 Michael E. Rogers, Surface Oil Sands Water Management: Summary Report, prepared for the Water Management Systems Task Group of the Surface Water Working Group of the Cumulative Environmental Management Association, December 2006, http://www.cemaonline.ca/index.php/component/docman/doc_download/518-surface-oil-sands-water-management-summary-report 70 M. D. MacKinnon et al., “Water Quality Issues Associated with Composite Tailings (CT) Technology for Managing Oil Sands Tailings,” International Journal of Surface Mining, Reclamation and Environment 15, no. 4 (2001). 71 W.F. Eckert et al., “Prediction of Sedimentation and Consolidation of Fine Tails,” AIChE Journal 42 (1996).

Environmental Impacts of Increased Oil Sands Development
The Pembina Institute 22 Opening the Door for Oil Sands Expansion
Mature fine tailings (MFT) are created over time as tailings settle.72 MFT becomes less liquid and more dense over time, reaching approximately 30% by weight of fine sand and clays. The remaining 70% is composed of water that cannot be recycled because of the suspended sediment. MFT has no bearing strength, meaning it will not support any weight, and therefore it can not be used as a substrate for revegetation or human use. It is also toxic to aquatic organisms. MFT must be impounded indefinitely and there is currently no demonstrated means to reclaim it without further treatment. Tailings systems differ slightly at each oil sands operation and change over time as new technologies become available; however, Alberta’s legacy inventory of mature fine tailings that require long term containment is now 720 million cubic metres.73
Many observers consider tailings lakes to be one of the biggest liabilities facing the oil sands industry. Tailings lakes now cover 130 km2 — an area greater than the size of the city of Vancouver — and are growing rapidly.74 In early 2009 the Energy Resources and Conservation Board released a new tailings directive; unfortunately, the directive will slow but not stop the increase in new liquid tailings and is unclear how the legacy tailings on the landscape today will be addressed.75
For more information on tailings and reclamation see Fact or Fiction: Oil Sands Reclamation.
3.6 Tailings Seepage and Loss of Containment
3.6.1 Impacts Seepage from the tailings lakes is a risk to ground water and surface water. The Northern Gateway Pipeline Project would produce 7,300 barrels per day of tailings seepage due to expanded oil sands production.
• Enough contaminated water could seep from the tailings lakes to fill one Olympic swimming pool every two days.
3.6.2 Background Tailings impoundment structures are built directly on ground that conducts water and are contained within structures constructed of material that conduct water. As a result they leak. Companies report tailings seepage and seepage contamination in the environmental impact assessments submitted to government regulators during the approval process.76 Attempts are 72 M. D. MacKinnon et al., “Water Quality Issues.” 73 Energy Resources Conservation Board, "ERCB Releases Draft Directive on Oil Sands Tailings Management and Enforcement Criteria,” news release, June 26, 2008, http://www.ercb.ca/portal/server.pt/gateway/PTARGS_0_0_303_263_0_43/http%3B/ercbContent/publishedcontent/publish/ercb_home/news/news_releases/2008/nr2008_14.aspx 74 Energy Resources Conservation Board, “Data for Mineable Oil Sands Current and Projected Tailings and Footprint Area”, email received October 2008. 75 The Pembina Institute, “Implementation and Enforcement Critical to Success of First Attempt at Tailings Regulation,” news release, February 3, 2009, http://www.pembina.org/media-release/1776 76 Matt Price, 11 Million Litres a Day: The Tar Sands’ Leaking Legacy (Environmental Defence, 2008), http://www.environmentaldefence.ca/reports/tarsands_dec_2008.html

Environmental Impacts of Increased Oil Sands Development
The Pembina Institute 23 Opening the Door for Oil Sands Expansion
made to slow down the rate of leakage and to recapture water that does escape by utilizing thickeners, drainage ditches, interception wells, and in-ground barriers; however these mitigation measures are not 100% effective. In addition to the risk from continual seepage, tailing impoundments are large structures, some rising over 80 metres high. While the risk of a catastrophic failure is low, a breach and resulting discharge into the river would have serious implications for the watershed and downstream communities. Professor David Schindler, one of Canada’s most respected water scientists, summed up the consequences when he said, “If any of those tailings ponds were ever to breach and discharge into the river, the world would forever forget about Exxon Valdez.” The impact of tailings seepage on groundwater and surface water can likely only be resolved by eliminating the large quantity of tailings lakes on the landscape. These lakes pose unacceptable risks to community and ecosystem health.
For more information seepage from tailings see Clearing the Air on Oil Sands Myths.
3.7 Air Pollution
3.7.1 Impacts Air emissions affect human and environmental health. In particular, nitrogen oxides (NOx) and sulphur dioxide (SO2) contribute to acid rain, which is affecting the land and watersheds of northern Alberta and Saskatchewan. The Northern Gateway Pipeline Project would produce 14,000 tonnes of NOx and 3,200 tonnes of SO2 per year due to expanded oil sands production.
• The increased annual NOx emissions equal those of the city of Victoria, B.C. and its surrounding area.
• The increased annual SO2 emissions equal two-thirds of those of Victoria, B.C. and its surrounding area.77
3.7.2 Background Alberta already ranks number one in Canada for industrial air releases of criteria air contaminants (CACs), which include sulphur dioxide, nitrogen oxides, and particulate matter.78 CACs are emitted in large volumes by oil sands operations.79 Nitrogen oxides are released from the combustion of natural gas to power the extraction plants, heat water, and generate steam, and from the combustion of diesel fuel by huge mine fleet vehicles. Sulphur dioxide emissions are also generated by the combustion of diesel fuel by mine fleet vehicles and the combustion of hydrogen sulphide found in natural gas that is produced as a byproduct of bitumen production during in situ operations. 77 In 2008, the Capital Regional District emissions for NOx and SO2 were 15,857 tonnes and 5,157 respectively. SENES Consultants, Capital Regional District Air Contaminant Emissions Inventory for 2004 (2008 Revision), (Victoria, 2008). 78 PollutionWatch, “PollutionWatch Update: Highlights from the 2006 Data,” 2009, http://www.pollutionwatch.org/highlights.jsp 79 Environment Canada, “Pollution Data Library,” 2007, http://www.ec.gc.ca/inrp-npri/default.asp?lang=En&n=B85A1846-0

Environmental Impacts of Increased Oil Sands Development
The Pembina Institute 24 Opening the Door for Oil Sands Expansion
In addition to NOx and SO2 concerns, other air pollution problems are being exacerbated by the rate of oil sands growth without significant improvements in regulations to control pollution. For example, hydrogen sulphide (H2S) emissions are surpassing Alberta guidelines.80 In the Athabasca oil sands region in 2007, normal hourly hydrogen sulphide emission guidelines were exceeded 361 times, up 88% from exceedances in 2006.81 Normal daily hydrogen sulphide emission guidelines were exceeded 74 times in the Athabasca oil sands region in 2007, up 200% from 2006.82 The oil sands industry has reduced the volume of pollutants it emits to produce a barrel of synthetic crude oil (referred to as emissions intensity). Despite these efforts, the emissions intensity of common pollutants remains considerably higher for oil sands production than for conventional oil production because there are many more steps involved in producing synthetic crude oil from oil sands83, and total emissions continue to rise due to rapid expansion of existing and new extraction and upgrading projects. The Alberta government has not capped air emissions in the Athabasca Boreal Region around Fort McMurray, where the majority of oil sands emission growth is occurring. The provincial government has implemented an initial management framework, developed by the Cumulative Environmental Management Association stakeholders, for acidifying emissions in the Athabasca Boreal Region. However, the framework does not include a limit on acidifying emissions.84
For more information on oil sands related air pollution see Oil Sands Fever.
80 Alberta guidelines for normal quantities of H2S in ambient air are 10 parts per billion (ppb) over a one hour average and 3 ppb over a 24 hour average. Alberta Environment, Alberta Ambient Air Quality Objectives and Guidelines, June 2009, http://environment.gov.ab.ca/info/library/5726.pdf 81 Clean Air Strategic Alliance “Data Reports,” http://www.casadata.org/Reports/SelectCategory.asp, accessed September 16, 2008. Monitoring stations included Mildred Lake Station at the Syncrude Airstrip; Lower Camp, Suncor; Buffalo Viewpoint at the south end of Syncrude South mine; and Mannix Station, Suncor. 82 Ibid. 83 Woynillowicz, Severson-Baker and Raynolds, Oil Sands Fever, 46. 84 NOx-SO2 Management Working Group of the Cumulative Environmental Management Association, Recommendations for the Acid Deposition Management Framework for the Oil Sands Region of North-Eastern Alberta, February 2004, http://www.cemaonline.ca/index.php/component/docman/doc_download/515-nsmwg-acid-deposition-management-framework-recommendation-0402

The Pembina Institute 25 Opening the Door for Oil Sands Expansion
4. The Upstream Impacts – The Calculations
This section explains how the seven selected metrics were calculated. A summary of the impacts is described in Section 3. As discussed in Section 1.4, the following assumptions were made:
• Bitumen source: 50% of the bitumen would come from mining operations and 50% from in situ.85 Unless otherwise noted, all averages are calculated with this weighting.
• Flow of bitumen in the pipeline: The Northern Gateway Pipeline Project would have an initial export capacity to transport 525,000 barrels of diluted bitumen. Assuming a dilution ratio to be 30% (approximately 1 unit of diluent for every 3 units of bitumen)86, the total bitumen transported by the pipeline is 367,500 bbl/d.
• Representative impacts: Enbridge has not publicly reported which specific oil sands projects will be supplying bitumen for transport through the pipeline. In absence of this specific information, data from several environmental impact assessments were used to calculate the results below.
4.1 Greenhouse Gas Production For both mining and in situ developments, GHG emissions result primarily from the burning of natural gas for heat and electricity production. For mining projects, additional emissions result from methane gases released from tailings lakes and diesel combustion in the vehicle fleet used to mine and transport oil sands material from surface mines and extraction plants. For this report, a GHG emission intensity factor for mining was averaged from data sourced from the applications from seven proposed mining projects.87 The average greenhouse gas emissions for these seven projects are 37.6 kilograms of equivalent CO2 per barrel (kgCO2eq/bbl).
The emission intensity for in situ projects was averaged from data sourced from six proposed SAGD projects.88 The average emission intensity for these six projects is 59.3 kgCO2eq/bbl.
85 In 2008, approximately 55% of oil sands production is from mining operations, with in situ operations producing the other 45%. However, the pipeline is not planned to be in operation until 2015. When we consider all current and proposed projects the mining and in situ will account for equal amounts of bitumen production. See Dunbar, Existing and Proposed Canadian Commercial Oil Sands Projects for future production estimates. 86 A. Saniere, I. Hénaut and J.F. Argillier, Pipeline Transportation of Heavy Oils, A Strategic, Economic and Technological Challenge, Oil and Gas Science and Technology, Rev. IFP, Vol 59, 2004, No 5, page 462. This means that 70% of transported volume would be bitumen and 30% would be diluent. 87 Average of seven proposed mines: Synenco Northern Lights, Imperial Kearl, Shell Muskeg River, Petro-Canada Fort Hills, Shell Jackpine Phase 1 and 2, Canadian Natural Horizon, Total Joslyn North Mine Phase 1 and 2.

The Upstream Impacts – The Calculations
The Pembina Institute 26 Opening the Door for Oil Sands Expansion
The weighted average of emissions is 48.5 kgCO2eq/bbl. This is a conservative number, as this does not include emissions associated with any upgrading from bitumen to synthetic crude oil that could occur in Alberta.
4.2 Natural Gas Consumption The extraction of oil sands requires large amounts of energy, primarily for heat and electricity production for steam generation and upgrading facilities. Natural gas intensities for this report were averaged from information provided for proposed projects. For mining projects, the natural gas use of seven proposed mines was averaged89 to get a consumption rate of 60.1 cubic feet of natural gas per barrel (ft3/bbl). The in situ estimate was from the data provided from the Deer Creek project which estimated natural gas requirements at 1040 ft3/bbl90. The weighted average value of these two natural gas intensities is 550 ft3/bbl.
4.3 Land Impacts Land impacts include direct clearing associated with mine and in situ development and indirect disturbance associated with the fragmentation of in situ projects. For the purpose of this project, we considered land within 250 m of in situ infrastructure to be indirectly disturbed.91 In Situ This report estimated direct and indirect land impacts for in situ operations using a case study (the OPTI-Nexen Long Lake Project) that the Canadian Parks and Wilderness Society and the Pembina Institute examined in 2006.92 The total size of the Long Lake Project is 106 square kilometres. The area cleared for an industrial feature, plus the area 250 m adjacent to an industrial feature and therefore disturbed, was estimated at 80% of the total area for total of 84.8 square kilometres. The area directly cleared is 8.84 square kilometres, so the area indirectly disturbed was calculated at 76.0 square kilometres (84.8 km2 minus 8.84 km2).
The Long Lake Project is projected to have a daily production of 70,000 bbl/day93 and a lifespan of 40 years94 for a total estimated lifetime bitumen production of 1 billion barrels.
88 Average of six SAGD in situ projects: Devon Jackfish, Deer Creek Joslyn Phase 3, Petro-Canada MacKay, Husky Sunrise, ConocoPhillips Surmount, Husky Energy Tucker Lake. 89 Average of seven proposed mines: Synenco Northern Lights, Imperial Kearl, Shell Muskeg River, Petro-Canada Fort Hills, Shell Jackpine Phase 1 and 2, Canadian Natural Horizon, Total Joslyn North Mine Phase 1 and 2. 90 Deer Creek Energy Limited, Joslyn SAGD Project IIIA Application for Approval and Supplemental Information, 2005. 91 Simon J. Dyer, Jack P. O’Neill, Shawn M. Wasel and Stan Boutin, “Avoidance of Industrial Development by Woodland Caribou”, Journal of Wildlife Management, 65 (2001) 531-542. 92 Schneider and Dyer, Death by a Thousand Cuts.

The Upstream Impacts – The Calculations
The Pembina Institute 27 Opening the Door for Oil Sands Expansion
Using the land use values and performance expectations above, it is estimated that situ projects will clear 0.00884 m2 of land per barrel (8.84 km2 multiplied by 1,000,000 m2/km2 divided by 1,000,000,000 barrels) and disturb 0.0760 m2 of land per barrel (76.0 km2 times 1,000,000 m2/km2 divided by 1,000,000,000 barrels). Seismic exploration lines (land cleared to make way for equipment used to send and receive sound waves and create a picture of the subsurface) were not included in this calculation.
Mining Mining operations also require large areas of land to produce bitumen. In order to produce a conservative estimate of the land area directly affected by mining bitumen for transport in the Northern Gateway Pipeline Project, the data for the proposed Shell Jackpine Mine Expansion project operation was used as a proxy. The total lease size of the Jackpine Mine Expansion project is 127 square kilometres.95 It has a forecast production rate of 100,000 bbl/day96 and a project lifetime of 40 years97 for a total lifetime production of 1.46 billion barrels. On an intensity basis Shell will clear 0.0871 m2 of land per barrel of bitumen produced (127 km2 times 1,000,000 m2/km divided by 1.46 billion bbl).
An estimate of the indirect disturbance the land adjacent to the disturbed area of the mining was not available and thus was not included in this assessment.
Combined Impact Using the data above, the land impacts from the oil piped through the Northern Gateway Pipeline Project were calculated. The weighted average from direct clearing (in situ plus mining) is 0.048 m2 per barrel. The weighted average from indirect disturbance (contribution from mining was 0) is 0.038 m2/bbl.
4.4 Water Use For mining operations, consumptive water rates were calculated using average values from seven proposed mine project applications.98 The average consumptive water use for these seven projects is 2.64 barrels for water for every barrel of bitumen. For in situ projects, data sourced from six proposed SAGD project applications were averaged. The average for these six projects is 0.31 barrels of water per barrel of bitumen produced.99 93 OPTI-Nexen, Long Lake Project Environmental Impact Assessment: Supplemental Information Binder I–IV. 94 OPTI-Nexen, Application for Approval of the Long Lake South Project, 2006. 95 Shell Canada, Application for Approval of the Jackpine Mine Expansion and Pierre River Mine Project — Environmental Impact Assessment, vol 1. (2007) 19-6. 96 Dunbar, Existing and Proposed Canadian Commercial Oil Sands Projects. 97 Shell Canada, Application for Approval of the Jackpine Mine Expansion Project, vol. 1, section P.iii (2007) 98 Average of seven proposed mines: Synenco Northern Lights, Imperial Kearl, Shell Muskeg River, Petro-Canada Fort Hills, Shell Jackpine Phase 1 and 2, Canadian Natural Horizon, Total Joslyn North Mine Phase 1 and 2. 99 Average of six SAGD insitu projects: Devon Jackfish, Deer Creek Joslyn Phase 3, Petro-Canada MacKay, Husky Sunrise, ConocoPhillips Surmount, Husky Energy Tucker Lake.

The Upstream Impacts – The Calculations
The Pembina Institute 28 Opening the Door for Oil Sands Expansion
The weighted average water consumption is 1.5 barrels of water per barrel of bitumen.
4.5 Toxic Tailings Production Only mining operations produce tailings. This report estimated the volume production rate of the toxic component of tailings, the mature fine tailings (MFT), from mining operations based on the average of seven proposed mining projects used in Section 4.4. The average for these seven projects is 0.38 barrels of MFT per barrel of bitumen. The intensity factor is significantly lower than that of existing operations, primarily because new approvals assert that their operations will successfully employ new technology that has not yet been proven at the commercial scale.100
The weighted average of tailings production (contribution from in situ operations was 0) is 0.02 barrels of MFT per barrel of bitumen.
4.6 Tailings Seepage Only oil sands mines have tailing ponds that seep contaminated water. The seepage value used in this report is based on the average projected seepage rate for five proposed mining projects.101,102 For this report seepage is defined as any contaminated water that escapes planned collection systems. The average seepage rate for these projects is 0.04 barrels of seepage for every barrel of bitumen produced. The weighted average of tailings seepage (contribution from in situ operations was 0) is 0.02 barrels of seepage per barrel of bitumen. This seepage rate is based on the assumption that the tailings lakes will “self-seal” and act according to design. The timing of when the seepage occurs depends on how long the mining projects have been in operation when the pipeline begins operation. The seepage will enter the ground water system before it reaches surface water. In some cases, it may take several hundred years for seepage to contact surface water, depending on factors including location of the tailings lakes and hydrogeology.
4.7 Air Pollution Nitrogen oxides and sulphur dioxide are air contaminants that are released in oil sands operations. Both of these pollutants are major components of acid rain that is impacting the soils and lakes of northern Alberta and Saskatchewan; they contribute to the formation of smog and haze; and they can have detrimental effects on human health at certain levels.
100 For example, a ratio of 1.5 m3 per cubic metre of bitumen is reported in R. J. Mikula, V. A. Munoz and O. Omotoso, “Water Use in Bitumen Production: Tailings Management in Surface Mined Oil Sands,” (presented at the World Heavy Oil Congress, Edmonton, AB, March 10-12, 2008). 101 Average of five proposed mines: Imperial Kearl, Shell Muskeg River, Petro-Canada Fort Hills, Shell Jackpine Phase 1 and 2, Canadian Natural Horizon. 102 For the purposes of this report seepage rates include only seepage that is projected to bypass proposed mitigation measures.

The Upstream Impacts – The Calculations
The Pembina Institute 29 Opening the Door for Oil Sands Expansion
Data was taken from the same projects used to calculate consumptive water use.103,104 On average a mining operation releases 137 g NOx/bbl and 3 g SO2/bbl. On average an in situ operation will release 70 gNOx/bbl and 46 gSO2/bbl. The weighted average of emissions was 103.6 gNOx/bbl and 24.5 g/SO2..
4.8 Summary Table 1 summarizes the environmental impacts per barrel of bitumen production that would be facilitated by the proposed Enbridge Northern Gateway Pipeline Project. Daily and annual impacts are listed. These numbers were calculated by multiplying the per barrel intensity factor by the estimated flow of bitumen in the export pipeline: 367,500 barrels per day or 134 million barrels per year. The impact calculated over the project’s hypothetical 40-year lifetime is also included.
Table 1. Per Barrel and Cumulative Upstream Environmental Impacts from Bitumen Production Associated with the Proposed Enbridge Northern Gateway Pipeline Project
Intensity Factor (per barrel) Impact Unit Surface
Mining In Situ Combined
Intensity
Daily Impact
Annual Impact
40 Year Impact*
Greenhouse Gas Emissions
kg CO2eq 37.6 59.3 48.5 17.8 kilotonnes
6.5 Megatonnes
260 Megatonnes
Natural Gas Consumption ft3 60.1 1040 550 0.2 billion
ft3 73.7 billion
ft3 3 trillion
ft3
Land Cleared m2 0.0871 0.0088 0.048 18,000 m2
6.4 km2
258 km2
Land Disturbed m2 Not
calculated 0.0760 0.038 14,000 m2
5.1 km2
204 km2
Consumptive Water Use bbl 2.6 0.31 1.5 551,000
bbl 200 million
bbl 7.9 billion
bbl Tailings – Mature Fine Tailings (MFT)
bbl 0.38 n/a 0.2 70,000 bbl
25 million bbl
1 billon bbl
Tailings Seepage bbl 0.04 n/a 0.02 7,300
bbl 2.7 million
bbl 107 million
bbl NOx emissions g 137 70 104 38
tonnes 14
kilotonnes 555
kilotonnes SO2 emissions g 3 46 24 9
tonnes 3.2
kilotonnes 130
kilotonnes *Calculations based on a hypothetical 40-year lifetime for the project.
103 Average of seven proposed mines: Synenco Northern Lights, Imperial Kearl, Shell Muskeg River, Petro-Canada Fort Hills, Shell Jackpine Phase 1 and 2, Canadian Natural Horizon, Total Joslyn North Mine Phase 1 and 2. 104 Average of six SAGD in situ projects: Devon Jackfish, Deer Creek Joslyn Phase 3, Petro-Canada MacKay, Husky Sunrise, ConocoPhillips Surmount, Husky Energy Tucker Lake.

The Pembina Institute 30 Opening the Door for Oil Sands Expansion
5. Recommendations The Enbridge Northern Gateway Pipeline Project is much more than just a pipeline project: it is a massive infrastructure project with far-reaching consequences. The pipeline would create a new outlet for oil sands producers and facilitate the expansion of Alberta’s oil sands. In addition, it would introduce oil pipelines to three major salmon watersheds of British Columbia and oil tankers to British Columbia’s West Coast. Development in any of these three areas raises significant concerns, and the Enbridge project raises these questions concurrently. This report focused on just one of these issues: the impacts of oil sands expansion enabled by the additional pipeline capacity. Existing federal and provincial rules for oil sands development are insufficient for dealing with these upstream environmental impacts, and now Canadians are faced with what do to with a project that would allow the environmental impacts of the oil sands to worsen.
A federal Joint Review Panel, conducted by the National Energy Board and the Canadian Environmental Assessment Agency, will conduct the environmental assessment for the project. However, the draft terms of reference for the panel do not include the impacts of the Northern Gateway Pipeline Project on oil sands production in Alberta, with the resulting increases in greenhouse gas pollution and other environmental impacts. In order for Canadians to make an informed decision on the project, the process to evaluate the Northern Gateway Pipeline Project needs to include these upstream impacts. Until this is done, the project should not be given the go ahead to proceed.
In addition, we support a moratorium on the transportation of oil from Alberta’s oil sands across British Columbia until a public inquiry fully addresses concerns about the environmental impacts. The environmental assessment process currently proposed for the Northern Gateway Pipelines fails to address some of the most potentially harmful environmental consequences of the project. Because communities at both ends of the pipeline route will be most impacted by its development, ensuring their support for the project before it proceeds is essential.
The Pembina Institute also recommends a pause on the approval of new oil sands projects until the necessary regulations are put in place by the Alberta and Canadian governments to manage the environmental impacts of oil sands development. These impacts are summarized below. Air impacts: confronting climate change and air pollution
• Greenhouse gas production: Regulations are required at both the federal and provincial levels that reduce greenhouse gases across all sectors of the economy, and that place an adequate price on this pollution. Governments must set a legislated target to reduce Canada’s net greenhouse gas emissions that is based on the best available science and on adopting a responsible role in the global effort to tackle climate change.
• Air pollution: Absolute and binding limits protective of human health and the environment should be set on acidifying emissions such as NOx and SO2 to ensure levels

Recommendations
The Pembina Institute 31 Opening the Door for Oil Sands Expansion
stay well below critical limits. The monitoring and attainment of absolute limits should be publicly reported.
Land impacts: preventing irreversible damage to the Athabasca Boreal Forest • Land impacts: It is essential that the Government of Alberta complete land use planning
to identify areas to be permanently conserved, and set cumulative limits to oil sands development. This is consistent with the recommendation, made by the multi-stakeholder group set up by the governments of Canada and Alberta to improve oil sands management, that 20 to 40% of northeastern Alberta should be permanently protected from industrial development, and that the total oil sands footprint should be tightly constrained.105
Water impacts: protecting the aquatic ecosystem and reducing long-term environmental liabilities
• Groundwater use: Each in situ project is assessed separately, and there is not yet a model to analyze the interactions of surface water and fresh groundwater and cumulative impacts over a wide area.106 Regional monitoring and regional assessments would help ensure groundwater sources are protected. In addition, every effort should be made to facilitate groundwater recharge and protect groundwater from contamination.
• Surface water use: An “ecological base flow” to halt water withdrawals during low flow periods must be implemented to prevent irreversible damage to the Athabasca watershed. Off-stream storage, which can be replenished with water during high stream flows, will help provide requirements for industry while limiting impacts on natural ecosystems. Increasing the recycle rate of water used — and reducing the amount of water that currently ends up in tailings lakes — would also reduce reliance on fresh water from the Athabasca River.
• Water quality: There is widespread concern about the risks posed by oil sands tailings lakes to the environment and human health. The Government of Alberta should begin the process of phasing out all existing oil sands tailings lakes. For new oil sands facilities, extraction technologies that generate mature fine tailings — a waste product that creates long-term economic and environmental liabilities, as there is no proven reclamation strategy — should be prohibited.
105 Sustainable Ecosystem Working Group of the Cumulative Environmental Management Association, Terrestrial Ecosystem Management Framework for the Regional Municipality of Wood Buffalo, 2008, http://www.cemaonline.ca/index.php/cema-recommendations/terrestrial-ecosystem 106 An environmental impact assessment is required for each project, but while each project may examine the potential impacts on their immediate neighbours, there is no overall analysis. This is also hampered by the fact that there is relatively little historical data on groundwater and no consistency in the models used to analyze data.