open research onlineoro.open.ac.uk/45878/1/polymer_1-s2.0-s0032386116302178-main.pdf · accepted...
TRANSCRIPT

Open Research OnlineThe Open University’s repository of research publicationsand other research outputs
Structure evolution in poly(ethylene terephthalate)(PET) - Multi-walled carbon nanotube (MWCNT)composite films during in-situ uniaxial deformationJournal Item
How to cite:
Heeley, Ellen L.; Hughes, Darren J.; Crabb, Eleanor; Kershaw, Matthew; Shebanova, Olga; Leung, Sandy andMcNally, Tony (2016). Structure evolution in poly(ethylene terephthalate) (PET) - Multi-walled carbon nanotube(MWCNT) composite films during in-situ uniaxial deformation. Polymer, 92 pp. 239–249.
For guidance on citations see FAQs.
c© 2016 Elsevier
Version: Accepted Manuscript
Link(s) to article on publisher’s website:http://dx.doi.org/doi:10.1016/j.polymer.2016.03.071
Copyright and Moral Rights for the articles on this site are retained by the individual authors and/or other copyrightowners. For more information on Open Research Online’s data policy on reuse of materials please consult the policiespage.
oro.open.ac.uk

Accepted Manuscript
Structure evolution in polyethylene terephthalate (PET) - multi-walled carbonnanotube (MWCNT) composite films during in-situ uniaxial deformation
Ellen L. Heeley, Darren J. Hughes, Eleanor Crabb, Matthew Kershaw, OlgaShebanova, Sandy Leung, Tony McNally
PII: S0032-3861(16)30217-8
DOI: 10.1016/j.polymer.2016.03.071
Reference: JPOL 18563
To appear in: Polymer
Received Date: 20 January 2016
Revised Date: 18 March 2016
Accepted Date: 22 March 2016
Please cite this article as: Heeley EL, Hughes DJ, Crabb E, Kershaw M, Shebanova O, Leung S,McNally T, Structure evolution in polyethylene terephthalate (PET) - multi-walled carbon nanotube(MWCNT) composite films during in-situ uniaxial deformation, Polymer (2016), doi: 10.1016/j.polymer.2016.03.071.
This is a PDF file of an unedited manuscript that has been accepted for publication. As a service toour customers we are providing this early version of the manuscript. The manuscript will undergocopyediting, typesetting, and review of the resulting proof before it is published in its final form. Pleasenote that during the production process errors may be discovered which could affect the content, and alllegal disclaimers that apply to the journal pertain.

MANUSCRIP
T
ACCEPTED
ACCEPTED MANUSCRIPT
Graphical abstract.
Structure evolution in polyethylene terephthalate (PET) - multi-walled carbon nanotube
(MWCNT) composite films during in-situ uniaxial deformation.
Ellen L. Heeley, Darren J. Hughes, Eleanor Crabb, Matthew Kershaw, Olga Shebanova,
Sandy Leung and Tony McNally.

MANUSCRIP
T
ACCEPTED
ACCEPTED MANUSCRIPT
1
Structure evolution in poly(ethylene terephthalate) (PET) - multi-
walled carbon nanotube (MWCNT) composite films during in-situ
uniaxial deformation.
Ellen L. Heeley,†* Darren J. Hughes, ‡ Eleanor Crabb,† Matthew Kershaw, † Olga Shebanova,§
Sandy Leung¥ and Tony McNally¥*
†Department of Life, Health and Chemical Sciences, Open University, Walton Hall, Milton
Keynes, MK7 6AA, UK.
¥ International Institute for Nanocomposites Manufacturing (IINM), ‡WMG, University of
Warwick, Coventry, CV4 7AL, UK.
§Diamond Light Source, Harwell Science and Innovation Campus, Didcot, Oxfordshire, OX11
0DE.
*Corresponding author: E.L. Heeley; [email protected]; +44(0)1908 655194.
Keywords: polymer multi-walled carbon nanotube composites; Small- and Wide-Angle X-Ray Scattering (SAXS/WAXS); crystalline morphology evolution, nucleating agents.
ABSTRACT
Combined small- and wide-angle X-ray scattering (SAXS/WAXS), mechanical and thermal
techniques have been used to follow the morphology evolution in a series of poly(ethylene
terephthalate) (PET) multiwall carbon nanotube (MWCNT) composite films during quasi solid-
state uniaxial deformation at low strain rates. Uniaxially deformed PET-MWCNT films
displayed improved mechanical properties compared with unfilled PET films. SAXS/WAXS
data revealed a well oriented lamellar structure for unfilled PET films. In contrast, the PET-
MWCNT composites revealed a nanohybrid shish-kebab (NHSK) morphology, with reduced

MANUSCRIP
T
ACCEPTED
ACCEPTED MANUSCRIPT
2
orientation and crystallinity. Mechanistically, this morphology development is attributed to the
MWCNTs acting as shish for the epitaxial growth of PET crystallites. Furthermore, nucleation
and crystal growth occurs in the PET matrix, but MWCNTs ultimately inhibit crystallite
development and hinder a final lamellar structure developing. The results show unequivocally
the role MWCNTs play as nanofillers, in the morphology development, thermal and mechanical
properties in composite polymer films.
1. INTRODUCTION
Multi-walled and single-walled carbon nanotubes (MWCNTs/SWCNTs or CNTs) continue to
be of particular interest in academia and to industry as potential nanoparticulate functional fillers
for polymers. It is well known that CNTs possess exceptional electrical, mechanical and thermal
properties which can be beneficial in enhancing the physical properties of a polymer when
blended into the matrix [1-3]. Indeed, there have been numerous books and reviews published
detailing the relative improvements in stiffness, strength, toughness, electrical and thermal
conductivity of polymers on the addition of CNTs [3-10]. The physical properties of polymer-
CNT composites are governed both by the blending procedure during melt mixing and secondary
processing such as moulding, fibre spinning and solid-state film deformation. The CNT dispersal
and distribution affects the evolution of micro- and macro-morphology of the host polymer,
which ultimately influences its physical and mechanical properties. Furthermore, understanding
the evolution of polymer morphology during processing with respect to the influence of CNTs as
well as correlating this with mechanical and electrical properties, is of great importance in
advancing the applications of polymer nanocomposites.
Here, we focus on a commercially and industrially important polyester; poly(ethylene
terephthalate) (PET), which is widely used in many applications such as fibers, films, bottles,

MANUSCRIP
T
ACCEPTED
ACCEPTED MANUSCRIPT
3
packaging, textiles, automotive parts and engineering components in electronics. The PET
homopolymer was physically blended with low loadings of MWCNTs by weight (wt%), with the
intention of improving the polymers electrical and mechanical properties. The development of
these PET-CNT composite materials could potentially lead to further industrial applications
being realized; e.g. in fuel cells and bipolar plates. Recently, Mayoral [11] and McCrossan [12],
reported on the structural morphology, electrical and mechanical properties of composites of
PET and MWCNTs. The mechanical properties (stiffness, strength and toughness) were vastly
modified on addition MWCNTs into the PET matrix: the PET-MWCNT composites showed an
enhancement in Young’s modulus of 79% and electrical conductivity by 14 orders of magnitude,
compared to neat PET.
It is known that the addition of CNTs to PET not only improves the polymers mechanical and
electrical properties [10], but also increases the rate of crystallization by acting as a nucleating
agent. This is observed during thermal analysis as an increase in the crystallization temperature
of the polymer, although, there is often no increase in melting temperature or change in glass
transition temperature [11,13-17]. Following the structure evolution in polymer-CNT
composites during processing is not straightforward and requires techniques that allow time-
resolved data acquisition ranging from less than a second to several minutes depending on the
processing conditions. The isothermal crystallization of PET-CNT composites is often monitored
using thermal, infrared and X-ray techniques which probe the crystallization kinetics,
crystallinity, orientation/chain conformation and confinement of the host polymer [13-15,18-24].
These studies generally investigate the post-processed material either as melt-spun fibres or cast
films and hence, do not give a comprehensive understanding of the morphology evolution during

MANUSCRIP
T
ACCEPTED
ACCEPTED MANUSCRIPT
4
actual processing, i.e. what is the origin of the morphology which develops in the polymer and
how does this relate to the role of CNTs in the composites final macro and microstructure.
Recently, Laird [25] presented a perspective on the structure and morphology of polymer-
MWCNT composites, in particular CNT–induced polymer crystallization under isothermal and
flow conditions. A nanohybrid shish-kebab structure (NHSK) was argued to arise during the
solution crystallization of polyethylene (PE) and MWCNTs. It was revealed that the MWCNTs
act as heterogeneous nucleation sites; the PE chains wrap around the MWCNTs (which act as the
shish) and crystallize outwards epitaxially perpendicular to the MWCNT as the kebabs.26.27
Likewise, Patil [28] reported that during the flow-induced crystallization (under melt-shear
conditions) of PE-SWCNT composites, high shear rates were required to form a NHSK structure
in the neat PE. However, a NHSK structure was formed in the composites under low shear
conditions where they concluded that the CNTs have a clear role in polymer chain orientation
and hence an oriented shish-kebab structure. Also, Liu [29] and Chen [30] described the
morphology development in isotactic polypropylene (iPP)-MWCNT composites when injection
molded or under melt-shear flow respectively. In each case, using small-angle X-ray scattering
(SAXS), the authors suggest that the iPP chains crystallize perpendicularly outwards from the
CNTs forming either a lamellar morphology under isotheral conditions, or a mixture of oriented
shish-kebab and lamellar morphologies under flow conditions. Wurm [31] investigated the
crystallization of poly(ɛ-caprolactone)(PCL)/MWCNT composite films using combined small-
and wide-angle scattering (SAXS/WAXS) and thermal techniques. The authors proposed three
scenarios for the crystallization process of PCL-MWCNT composites; (i) nucleation and hence
crystallite growth only from the CNT surface, (ii) nucleation in both the polymer matrix and at
the CNT surface, (iii) nucleation in the polymer matrix only.

MANUSCRIP
T
ACCEPTED
ACCEPTED MANUSCRIPT
5
These studies give an insight into the complexity of CNT induced morphology development of
polyolefins during isothermal or melt-flow conditions. Yet, with respect to PET-CNT composite
films, few studies have investigated the in-situ morphology evolution during quasi-solid-state or
solid-state deformation, where most typically studies focus on melt-spun fibres after processing.
Vad [21] detailed the structure evolution and mechanical properties of high speed melt-spun
PET-MWCNT fibres. It was argued that there is a critical draw ratio (DR) for the fibres which
induce CNT orientation parallel to the draw direction. Below, this critical DR the CNTs were
aligned perpendicular to the draw direction. However, little detailed information of the macro-
morphology, whether a NHSK or lamellar structure was presented for the fibres. Anand [20]
drew melt-compounded composites of PET and SWCNTs where wide-angle X-ray scattering
(WAXS) experiments revealed an oriented PET crystalline structure. They concluded that the
CNTs induced the crystallization of PET chains along the CNT axis. Recently, Hur [22]
described the morphology and mechanical properties of both PET-MWCNT melt-spun fibres and
subsequent photo-thermally drawn fibres. Interestingly, WAXS data showed that at high draw
ratios, only the photo-thermally drawn fibres showed an oriented PET crystalline structure.
Mayoral [11] confirmed the formation of different crystal polymorphs when composites of PET
and MWCNTs in extruded sheet form were uniaxial and biaxial deformed.
It should be noted that the aforementioned studies focused on the application of medium to
very high strain rates, which can effectively orient both the CNTs and polymer chains in the
fibres/sheets. From these examples, WAXS has been used to show a final oriented PET
crystalline micro-structure developed in the PET-MWCNT composites. However, the WAXS
technique is limited in its ability to investigate the nature of the macro-structure that evolves
during processing in these composites as it probes only the crystalline lattice. To address this

MANUSCRIP
T
ACCEPTED
ACCEPTED MANUSCRIPT
6
lack of knowledge of the wider morphology evolution, here we present detailed qualitative and
quantitative analyses of the real-time micro-macro-structure evolution in-situ during solid-state
uniaxial deformation of PET-MWCNT composite films using combined SAXS/WAXS
techniques. The SAXS technique reveals information pertaining to the long-range packing of the
PET-MWCNT composite films, allowing estimation of both the morphology and crystallite
dimensions. In this study a purpose-built temperature-controlled polymer film stretching
instrument, has been employed to allow time-resolved SAXS and load-displacement data to be
obtained during uniaxial deformation (and subsequent annealing) of extruded PET-MWCNT
composite films.
The combined use of SAXS, WAXS, mechanical and thermal techniques allows an in-depth
insight into the morphological evolution during low strain rate deformation of PET-MWCNT
composite films for the first time. The results show unequivocally the role the MWCNTs play in
the crystallinity, orientation and morphology development in the polymer composites and how
this is correlated to the mechanical and thermal properties they display.
2 EXPERIMENTAL SECTION
2.1 Materials, composite preparation and thermal characterization.
Commercial grade poly(ethylene terephthalate), Polyclear F019 (IV 0.895 dl/g) was supplied
by Invista Resins & Fibers Gmbh. A 10 wt% master-batch composite blend of PET-MWCNT
was provided by Nanocyl SA, Belgium. The MWCNTs (NC 7000) had an average diameter and
length of 9.5 nm and 1.5 µm respectively. From the dilution method used, blends of PET and
MWCNTs at loadings of 1 wt% and 2 wt% were cast extruded into sheets 100 mm wide and 1
mm thick. Full details of composite preparation, dilution, and extrusion are given in detail

MANUSCRIP
T
ACCEPTED
ACCEPTED MANUSCRIPT
7
elsewhere [11]. Each composite is denoted with respect to its MWCNT loading: PET1% and
PET2%. Table 1, lists the glass transition temperature (Tg), melting temperature (Tm),
crystallization temperature (Tc) and crystallinity (Xc) of the PET-CNT cast composite materials
[11]. The dispersion and distribution of the MWCNTs in the polymer matrix were investigated
using various microscopy techniques and it was found that the MWCNTs were largely randomly
dispersed in the PET matrix, but a small fraction were aligned in the extrusion flow direction due
to the design of the die used in the extrusion process [11].
Table 1. Thermal properties of PET and composites of as extruded sheets of PET and
MWCNTs, from DSC measurements [11].
Sample Tg/°C Tc/°C Tm/°C Xc/%
PET 84.5 194.1 254.1 28
PET1% 85.1 217.1 251.6 37
PET2% 84.9 220.1 251.8 35
Differential Scanning Calorimetry (DSC) measurements were performed on uniaxially
deformed and annealed samples using a Mettler Toledo DSC822 instrument under a continuous
flow of argon gas at 80 mL min-1, calibrated with an indium metal standard. Samples of between
5 mg – 20 mg were loaded into standard 40 µL aluminium pans and heat-cool cycles were run
from 30 °C to 270 °C at 10 °C min-1. The percentage crystallinity Xc, of each sample was
calculated using the following relationship:
f0f (1 )
cH
XH φ
∆=∆ −
(1)

MANUSCRIP
T
ACCEPTED
ACCEPTED MANUSCRIPT
8
where ∆Hf is the enthalpy of fusion from the integrated area under the melting transition from
the DSC thermogram, ϕ is the weight fraction of MWCNTs blended with the PET homopolymer
and ∆Hf0 is the theoretical enthalpy change of 100% crystalline PET having a value of 117.6 J g-
1[32].
2.2 Instrumentation and synchrotron X-ray measurements.
Uniaxial deformation of the cast samples was performed using a purpose-built polymer film
stretching instrument (Figure 1), which was positioned on beamline I22 of the Diamond Light
Source, synchrotron, UK [33]. The X-ray energy used was 12.4 keV. The design and application
of the stretching instrument with synchrotron radiation was previously reported by the authors
[34,35]. The stretching instrument used was essentially an enclosed heated oven with two stepper
motor driven pinions. Jaws attached to the pinions act as sample clamps. Samples of 5 mm width
were secured to the clamps giving an initial gauge length (between the jaws) of 10 mm. Once
clamped in place, the samples were located central to the beam position and drawn at a
temperature of 110 °C with a draw ratio (DR) of 2.5:1 at rates of 0.1 s-1 and 0.2 s-1. Load
displacement data was recorded during the draw using a 500 N rated load cell located in one of
the pinion shafts. Note only one jaw was programmed to move during the experiments. Post-
drawn samples were then step annealed in-situ for 180 s at temperatures of 130, 160 and 190 °C.

MANUSCRIP
T
ACCEPTED
ACCEPTED MANUSCRIPT
9
Figure 1. (A) Uniaxial stretching instrument on beamline I22. Inset (B) shows the sample
secured in the clamps attached to the stepper motor pinions.
A vacuum chamber was positioned between the stretching instrument and SAXS detector
reducing air scattering and absorption. SAXS data was recorded using a Pilatus P3-2M detector
located at a distance of 5.38 m from the sample position and calibrated using silver behenate and
oriented dry chicken collagen. During the drawing of the samples, SAXS data was taken at a
frame rate of 200 ms. Subsequently, one frame of SAXS data was taken for 60 s at each
annealing temperature. SAXS data frames of 60 s duration were also taken for the undrawn cast
film at 30 °C and then at the same step annealing temperatures as the drawn film.
Two-dimensional WAXS data for the post-drawn and annealed samples were obtained on the
XMaS (BM28) beamline [36] at the European Synchrotron Radiation Facility (ESRF), France
with an X-ray beam energy of 12.0 keV. WAXS data was collected on a MAR-CCD detector at
20 s per frame, calibrated with silver behenate. The sample to detector distance was 340 mm.

MANUSCRIP
T
ACCEPTED
ACCEPTED MANUSCRIPT
10
2.3 SAXS/WAXS data analysis.
SAXS and WAXS data were normalized for sample thickness, transmission and background
scattering. X-ray data reduction and analysis was performed using DAWN [37] and CCP13
Fibrefix [38] software suites. The 2D SAXS data was reduced to 1D scattering profiles of
intensity (I) versus scattering vector (q), where q = (4π/λ) sin(θ), 2θ is the scattering angle and λ
is the X-ray wavelength. This was achieved by sector averaging symmetrically around the
meridian (draw direction) by a fixed angle and radius, q. Radial azimuthal 1D profiles were also
produced from the 2D SAXS data in order to estimate the relative orientation, where the angular
variation in intensity, I (q, φ), was obtained at a fixed radius q, over an azimuthal angle, φ, range
of 0 - 360°. The two peaks in the 1D azimuthal profiles were then fitted using Gaussian functions
to obtain the average full width half maximum (FWHM).
Correlation function analysis was performed on the 1D scattering profiles using a purpose-
written correlation function program [39]. The correlation function, γ(R), is expressed as:
∫∞
=0
2
s
)dcos( )(1
)( qqRqqIQ
Rγ (2)
where I(q) is the scattering intensity and Qs is the experimental invariant obtained from the 1D
SAXS profile scattering between the experimental limits of q1 (the first real data point ) and q2
(the region where I(q) is constant), expressed as:
∫∫ ≈=∞ 2
1
d)(d)()( 2
0
2s
q
qqqIqqqIqtQ (3)
The correlation function was obtained from the extrapolation of SAXS data (q → ∞) using a
Porod [40] tail fit and linear back extrapolation (q → 0). Several parameters were extracted from
the correlation function which assumes an ideal two-phase lamellar morphology [41]; long

MANUSCRIP
T
ACCEPTED
ACCEPTED MANUSCRIPT
11
period, Lp, crystalline layer thickness Lc, amorphous layer thickness La and estimated bulk
crystallinity Xc [42,43].
Stress-strain data analysis. For each drawing experiment, the load (N) and jaw displacement
(mm) were recorded. From the load-displacement data, nominal stress-strain curves were
obtained making the assumption that the cross-sectional area of the sample remained constant.
This assumption is likely to be without error in the elastic region, but tends to be less reliable as
plastic deformation occurs, although the relatively low draw ratio and lack of observed necking
minimize errors. Strain at the beam position was estimated from the distance between the jaws.
Elastic (Young’s) modulus was determined from the initial linear portion of the stress-strain
curve.
3 RESULTS AND DISCUSSION
3.1 Undrawn PET and PET-MWCNT composites: X-ray scattering data.
Static SAXS and WAXS patterns were taken of the extruded film before drawing to determine
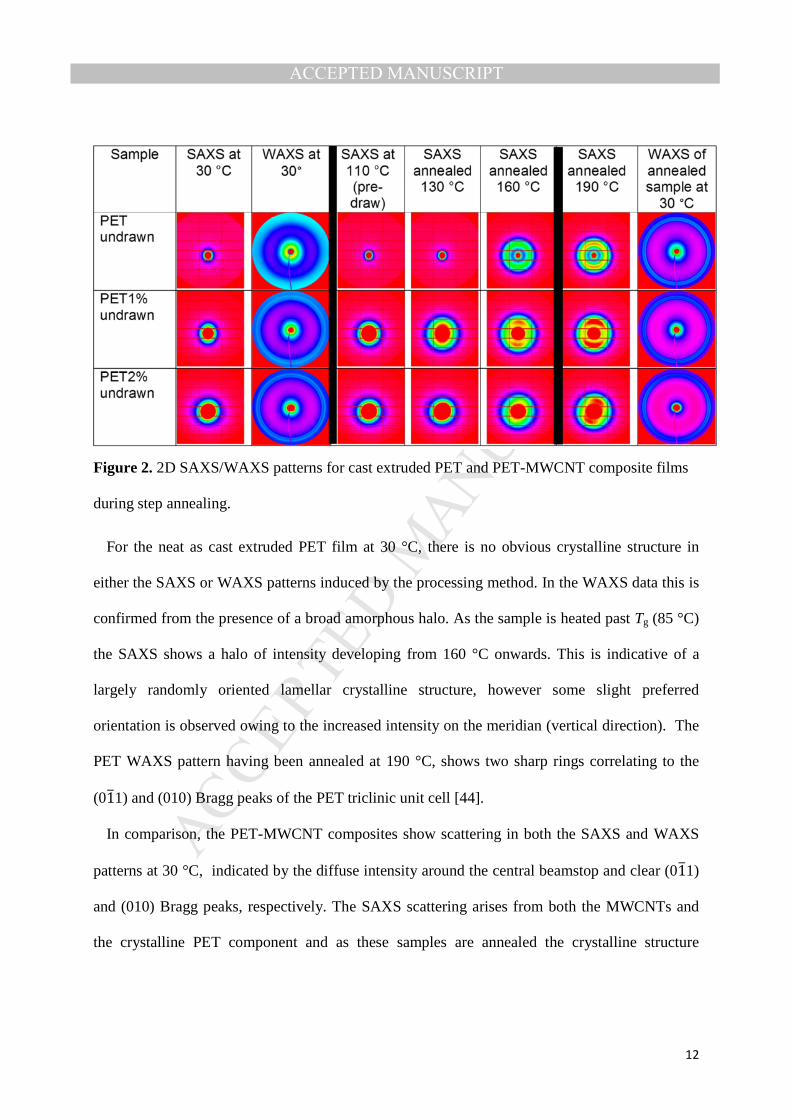
if any residual structure remained from the cast extrusion process. Figure 2, shows SAXS data
for the undrawn cast film at room temperature then step annealed up to 190 °C. WAXS data for
the cast film at 30 °C and post annealed at 190 ° C is given in the third and final columns
respectively.
MANUSCRIP
T
ACCEPTED
ACCEPTED MANUSCRIPT
12
Figure 2. 2D SAXS/WAXS patterns for cast extruded PET and PET-MWCNT composite films
during step annealing.
For the neat as cast extruded PET film at 30 °C, there is no obvious crystalline structure in
either the SAXS or WAXS patterns induced by the processing method. In the WAXS data this is
confirmed from the presence of a broad amorphous halo. As the sample is heated past Tg (85 °C)
the SAXS shows a halo of intensity developing from 160 °C onwards. This is indicative of a
largely randomly oriented lamellar crystalline structure, however some slight preferred
orientation is observed owing to the increased intensity on the meridian (vertical direction). The
PET WAXS pattern having been annealed at 190 °C, shows two sharp rings correlating to the
(01�1) and (010) Bragg peaks of the PET triclinic unit cell [44].
In comparison, the PET-MWCNT composites show scattering in both the SAXS and WAXS
patterns at 30 °C, indicated by the diffuse intensity around the central beamstop and clear (01�1)
and (010) Bragg peaks, respectively. The SAXS scattering arises from both the MWCNTs and
the crystalline PET component and as these samples are annealed the crystalline structure

MANUSCRIP
T
ACCEPTED
ACCEPTED MANUSCRIPT
13
continues to develop further. The SAXS shows some significant orientation of the crystalline
structure, which is evident from the scattering arcs in the pattern. The WAXS shows some
preferred orientation in the rings once annealed at 190 °C. A sharp WAXS peak corresponding to
the ordered arrangement of MWCNTs usually seen at 2θ = 26.1° (as previously reported in
Mayoral [11]). However this was not observed in the WAXS patterns in Figure 11, as this was
beyond the experimental detector range.
The observed structure in the as cast extruded film is likely to be an outcome of the extrusion
process, where for the PET-MWCNT composites, some oriented structure is locked in and does
not relax during the casting process as the MWCNTs hinder polymer chain dynamics, compared
to the neat PET. Similar residual structure has been seen in the extrusion of poly(ethylene) tapes,
where increased draw down of the tape elongates the polymer chains which leads to a fibril or
shish-kebab structure [45] rather than randomly oriented lamellae [46]. Hence, from the
SAXS/WAXS patterns it is apparent that the MWCNTs have a significant influence on this
residual orientation.
Figure 3. Azimuthal profiles from SAXS data of the undrawn step annealed (A) PET; (B)
PET1% and (C) PET2% samples.
To investigate the relative orientation, azimuthal profiles were taken of the SAXS patterns
which are shown in Figure 3, as the samples were annealed. The orientation in the PET and PET-

MANUSCRIP
T
ACCEPTED
ACCEPTED MANUSCRIPT
14
MWCNT composites increases with annealing temperature, indicated by the reduction in the
width of the two peaks as they develop. A quantitative analysis of the peak widths was made by
obtaining the average FWHM values where a fit was possible. Figure 4, shows the variation of
FWHM with temperature for the undrawn samples.
Figure 4. Change in FWHM for undrawn step annealed PET, PET1% and PET2% samples.
The relative orientation is seen to increase (FWHM decreases) in all samples with increasing
annealing temperature. However, a large difference is seen on addition of MWCNTs to the PET.
Both the PET1% and PET2% composites show increased orientation compared to neat PET
which starts to level off at 160 °C. Whilst the azimuthal scans indicate some preferred orientation
of the crystalline structure in the samples from the extrusion process, the arcing in the 2D SAXS
patters indicates that there is still a range of orientations in these samples.
Correlation function analysis was performed on the 1D SAXS profiles obtained from the 2D
SAXS patterns [39]. Figure 5A, shows 1D SAXS profiles of the undrawn annealed PET, PET1%
and PET2% samples at 190 °C and Figure 5B, the corresponding correlation functions. Figure
5B also indicates the extracted parameters; long period Lp, crystalline layer thickness Lc,

MANUSCRIP
T
ACCEPTED
ACCEPTED MANUSCRIPT
15
amorphous layer thickness La and bulk crystallinity Xc from the correlation function. The
extracted parameters are given in Table 2, for the undrawn annealed samples (note only data
from 160 °C and 190 °C 1D SAXS profiles gave good correlation functions so extracted
parameters could only be obtained from these fits with any reliability).
Figure 5. (A) 1D SAXS profiles for undrawn PET, PET1% and PET2% samples annealed at 190
°C and (B) corresponding correlation functions indicating extracted parameters: long period, Lp,
crystalline layer thickness Lc, amorphous layer thickness La (Lp – Lc) and bulk crystallinity Xc
(obtained from γmin/(γmin – γ*)).
The data in Table 2, shows some small differences in the extracted correlation function
parameters. The neat PET samples display the largest Lp and corresponding Lc values, but as the
annealing temperature increases there is little change in these values. In comparison, the PET1%
and PET2% samples have lower values of Lp and Lc at each annealing temperature, but Lp
increases slightly with annealing temperature. However, the values of Lc remain relatively
constant, whereas La, tends to increase. This indicates that some melting of the crystalline
regions probably in the crystal-amorphous interface is occurring during annealing. One

MANUSCRIP
T
ACCEPTED
ACCEPTED MANUSCRIPT
16
significant difference observed is that both PET1% and PET2% show lower bulk crystallinity,
PET2% being the lowest, compared to neat PET. Again this is mirrored in the reduced crystallite
thicknesses in these blends.
Table 2. Extracted data from the correlation function analysis of the 1D SAXS profiles for PET,
PET1% and PET2% undrawn step annealed samples.
Sample annealing temperature/°C
Lp/Å (± 4 Å)
Lc/Å (± 2 Å)
La/Å (± 2 Å)
Xc/% (± 2 %)
PET 160 93 27 66 25
PET 190 93 28 65 26
PET1% 160 88 21 67 18
PET1% 190 91 21 70 20
PET2% 160 86 19 67 14
PET2% 190 90 20 70 15
In this section we have detailed the structure development of the undrawn PET and PET-
MWCNT composites during step annealing. The SAXS/WAXS data and subsequent analysis has
shown that the cast extrusion process does induce some orientation and crystalline morphology
in all the samples. The PET-MWCNT composites show greater crystalline orientation
developing during annealing, but reduced crystallite size and bulk crystallinity compared to neat
PET. Hence, initial conclusions are that the MWCNTs hinder the relaxation of the PET
molecular chains during cast extrusion which later manifests as points for nucleation sites for
crystalline lamellae growth. However, the MWCNTs can also hinder the extent that these
crystalline regions grow and thicken, which is seen from the smaller crystallite thicknesses and
overall lower bulk crystallinity in comparison to the neat PET. We now extend these analyses to
MANUSCRIP
T
ACCEPTED
ACCEPTED MANUSCRIPT
17
determine the effects MWCNTs have on the morphology development of PET under uniaxial
deformation and subsequent annealing.
3.2 Uniaxially deformed PET and PET-MWCNT composites: mechanical properties.
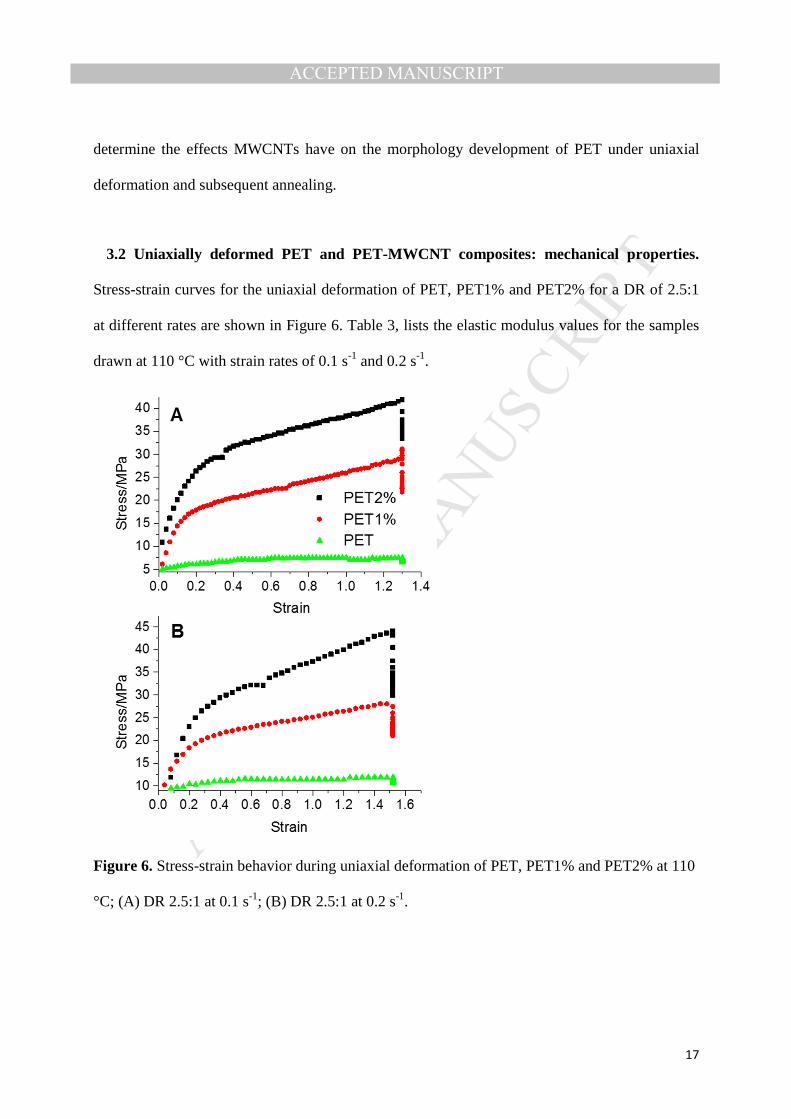
Stress-strain curves for the uniaxial deformation of PET, PET1% and PET2% for a DR of 2.5:1
at different rates are shown in Figure 6. Table 3, lists the elastic modulus values for the samples
drawn at 110 °C with strain rates of 0.1 s-1 and 0.2 s-1.
Figure 6. Stress-strain behavior during uniaxial deformation of PET, PET1% and PET2% at 110
°C; (A) DR 2.5:1 at 0.1 s-1; (B) DR 2.5:1 at 0.2 s-1.

MANUSCRIP
T
ACCEPTED
ACCEPTED MANUSCRIPT
18
All stress-strain curves show an elastic response initially followed by yield and strain
hardening which progresses until the end of the draw [11,15]. Following the end of the draw, the
sample relaxes as observed by the falling load at the maximum strain level attained.
Table 3. Elastic modulus of PET, PET1% and PET2% composite films uniaxially deformed at
110 °C.
Sample Strain rate/s-1
Young’s modulus/MPa
PET 0.1 7
PET 0.2 7
PET1% 0.1 121
PET1% 0.2 87
PET2% 0.1 132
PET2% 0.2 110
The addition of MWCNTs to the PET significantly changed the mechanical properties, even at
loadings as low as 1 wt%. From Figure 6, a dramatic increase in both the yield stress and the
stress experienced at maximum strain was observed for the PET-MWCNT composites. This can
be explained in two ways; supported by the data in in Table 1, and Figure 2, there is some
residual crystalline morphology and orientation in the PET-MWCNT composites from the initial
cast extrusion process which is not observed in the neat PET; furthermore the MWCNTs act as
ties between the crystalline regions causing significant mechanical property changes. Modulus
values rise from 7 MPa for the neat PET towards 100 MPa for the PET-MWCNT composites. It
is interesting to note that the modulus of the PET-MWCNT composites may be strain-rate
sensitive. At the higher strain-rate there is a drop in modulus which is somewhat counter-

MANUSCRIP
T
ACCEPTED
ACCEPTED MANUSCRIPT
19
intuitive. A possible explanation is that at the higher strain rate, there is increased load transfer to
the weaker amorphous regions leading to an overall reduction in mechanical properties.
3.3 X-ray analysis of uniaxially deformed PET and PET-MWCNT composites.
2D SAXS data for the uniaxial deformation and annealing of the PET and PET-MWCNT
composites were obtained to allow for a qualitative interpretation of the structure development to
be made. SAXS patterns for polymers which have been subjected to shear deformation can be
interpreted in terms of oriented lamellar or shish-kebab morphologies. Figure 7, shows some
frequently observed SAXS patterns and their related morphologies [43,45-47]. These range from
sharp spots for oriented lamellar type morphology to diffuse spots/arcs representing oriented
shish-kebab morphology. The SAXS patterns and corresponding morphologies can be used
interpret the developing morphology for the PET and PET-MWCNT composites, which are
shown in Figure 8.

MANUSCRIP
T
ACCEPTED
ACCEPTED MANUSCRIPT
20
Figure 7. 2D SAXS patterns for oriented polymer samples. (A) Sharp meridional spots: broad
parallel lamellae; (B) meridional arc: several orientations of narrow lamellae or shish-kebab
structures; (c) diffuse spots: oriented fibrils with narrow lamellae or shish-kebab structures; (D)
“four point” pattern: herringbone lamellar structure (adapted from Rober [45] and Heeley [46]).
The 2D SAXS patterns shown in Figure 8, include obvious differences in the morphology
development of the neat PET compared to the PET-MWCNT composites during processing and
annealing. The SAXS data post-draw at 110 °C and a strain rate of 0.1 s-1, shows that the neat
PET had very little initial structure, but as the sample is annealed a broad lamellar structure
develops indicated by sharp meridional spots (Figure 7(A)). In contrast, both the PET1% and
PET2% samples show significant diffuse post-draw scattering around the beamstop in the SAXS
patterns.

MANUSCRIP
T
ACCEPTED
ACCEPTED MANUSCRIPT
21
Figure 8. 2D SAXS patterns and associated morphology for the uniaxial deformation and
subsequent step annealing of PET, PET1% and PET2%. Samples were drawn at a DR of 2.5:1 at
a rate of 0.1 s-1 and 0.2 s-1.
This is mostly likely due to the presence of the MWCNT filler (as it is clearly absent in the
neat PET sample) and imperfect PET crystallites. As the PET-MWCNT samples are annealed,
the SAXS data showed the development of meridional arcs and diffuse spots, which can be
interpreted as narrow lamellae or shish-kebab structures with a variety of orientations around the
vertical draw direction [43,46,47].
For the neat PET, as the draw rate increased to 0.2 s-1, there is evidence of the initial formation
of a 4-point pattern in the post-draw SAXS pattern at 110 °C. This is typically seen in the

MANUSCRIP
T
ACCEPTED
ACCEPTED MANUSCRIPT
22
development of the triclinic PET structure and its lamellae interpretation is that of a herringbone
[48-50] or paracrystalline morphology [51] (Figure 7 (D)). The PET1% and PET2% composites
again show a fibril or shish-kebab type of structure, but still significant diffuse scattering is
observed in the SAXS patterns arising from the MWCNTs and imperfect PET crystallites.
Static 2D WAXS patterns of the drawn and annealed samples were taken at 30 °C and are
shown in Figure 9. The neat PET sample shows the development of the triclinic PET structure,
where the scattering reflections ((01�1) and (010)) are concentrated on the equator. This indicates
the PET chains are oriented in the draw direction and the crystalline structure becomes more
perfect with increasing draw rate (Figure 9 (A) and (B)), this is mirrored in the 2D SAXS.
Figure 9. 2D WAXS patterns for uniaxially deformed (DR 2.5:1) step annealed samples of PET,
PET1% and PET2%. (A) PET at 0.1 s-1; (B) PET at 0.2 s-1; (C) PET1% at 0.1 s-1; (D) PET1% at
0.2 s-1; (E) PET2% at 0.1 s-1; (F) PET2% at 0.2 s-1.
For the PET1% and PET2% composites, the 2D WAXS patterns again shows the triclinic
crystal cell structure developing, but the (01�1) and (010) reflections tend to be arc-like rather
than more spot-like as in the neat PET. This is again mirrored in the SAXS data were the shish-
kebab crystalline structure is less oriented than the lamellar structure of PET. The comparative

MANUSCRIP
T
ACCEPTED
ACCEPTED MANUSCRIPT
23
amount of orientation in the samples can be obtained from the azimuthal profiles of the 2D
SAXS patterns.
Figure 10. Azimuthal 1D SAXS profiles for PET post-draw (DR 2.5:1), during annealing at
draw rates of (A) 0.1 s-1 and (B) 0.2 s-1. (Scans offset in the vertical direction for clarity.)
Figure 10, shows the 1D azimuthal profiles for neat PET from the 2D SAXS patterns. The
profiles clearly illustrate the change from a well oriented lamellar structure (Figure 10 (A)) to an
oriented 4-point herringbone structure (Figure 10 (B)), as the draw rate was increased. It should
also be noted that there is no discernable equatorial scattering in the profiles (φ angles 150° -
200°) for the neat PET. Similarly, the 1D azimuthal profiles for PET1% and PET2% composites
are shown in Figure 11.

MANUSCRIP
T
ACCEPTED
ACCEPTED MANUSCRIPT
24
Figure 11. Azimuthal 1D SAXS profiles for PET1% and PET2% during annealing post-draw
(DR 2.5:1). (A) PET1% at 0.1 s-1; (B) PET1% at 0.2 s-1; (C) PET2% at 0.1 s-1; (D) PET2% at 0.2
s-1. (Profiles offset in the vertical direction for clarity.)
The azimuthal profiles in Figure 11, for the PET1% and PET2% composites show broader
peaks compared to neat PET (Figure 10). The profiles for PET1% (Figure 11 (A)) do show some
evidence of the herringbone structure with the double peak but a 4-point pattern was not clearly
defined in the 2D SAXS. With both the PET1% and PET2% composites there is distinct
equatorial scattering seen at φ angles 150° - 200° which tends to diminish as the samples are
annealed. This scattering can be attributed to the MWCNTs and imperfect PET crystalline and
amorphous components. As the sample is annealed infill crystallization of more randomly
oriented shish-kebab structures reduces the equatorial scattered intensity. The comparative
change in orientation from the FWHM is shown in Figure 12, for all samples.

MANUSCRIP
T
ACCEPTED
ACCEPTED MANUSCRIPT
25
Figure 12. Change in orientation (FWHM) for PET and PET-MWCNT composites post-draw, at
various annealing temperatures.
There is a significant difference in orientation between the neat PET and PET-MWCNT
composites as the samples are step annealed. The neat PET sample has the greatest orientation
over all annealing temperatures compared to the composites. The neat PET orientation increased
(decrease in FWHM) as the annealing temperature increased. This is confirmed in both the 2D
WAXS and SAXS patterns (Figures 8 and 9). Furthermore, for neat PET, the increase in draw
rate also resulted in increased orientation, this is most apparent at the highest annealing
temperature. This is not surprising as the higher stain rate would be expected to result in
increased molecular orientation of the polymer chains in the draw direction [52].
The PET-MWCNT composites show an opposite effect with respect to orientation as annealing
temperature was increased. The orientation does not change greatly when the samples were
annealed up to 160 °C, but there is a reduction of orientation at the annealing temperature of 190
°C for both the PET1% and PET 2% composites. Here, the reduction in orientation can be
explained by the crystallization of more shish-kebab structures but with greater variation in
orientations, which would reduce the average overall orientation in the draw direction. This was
observed also from the 2D SAXS data (Figure 8) where the meridional arcs become broader as

MANUSCRIP
T
ACCEPTED
ACCEPTED MANUSCRIPT
26
the annealing temperature was increased. From the data it can also be seen that increasing the
draw rate has little effect on the orientation for the PET-MWCNT composites.
To determine the changes in long period, crystallite size and crystallinity with annealing
temperature and draw rate, correlation functions were performed on the 1D SAXS profiles. The
change in long period Lp, and crystalline region Lc, with annealing temperature and draw rate for
all the samples are shown in Figure 13.
Figure 13. Change in (A) Lp and (B) Lc, for PET, PET1% and PET2% with annealing
temperature for a DR of 2.5:1 and draw rates of 0.1 s-1 and 0.2 s-1.
The Lp for the neat PET is greater than that for both PET1% and PET2% composites (Figure
13 (A)). Generally, Lp increases with annealing temperature is reflected in the increase in Lc
(Figure 13 (B)), for all samples. However, the greatest increase in crystalline region is seen in the
neat PET sample when annealed. The PET2% samples have the smallest Lc overall, regardless of
annealing temperature and draw rate. The change in bulk crystallinity with increasing annealing
temperature and draw rate for all samples is shown in Figure 14. Here, the data shows that the
neat PET has the greatest bulk crystallinity and the PET2% shows the lowest crystallinity,
although it should be noted that this behavior is strain-rate dependent [11].

MANUSCRIP
T
ACCEPTED
ACCEPTED MANUSCRIPT
27
Figure 14. Change in bulk crystallinity, Xc, for PET, PET1% and PET2% samples with
annealing temperature for a DR of 2.5:1 and draw rates of 0.1 s-1 and 0.2 s-1.
The results from the correlation function analysis show that the addition of MWCNTs to PET
can change the evolution of crystalline morphology significantly compared with the unfilled
homopolymer. The crystalline regions and bulk crystallinity are reduced in the PET-MWCNT
composites. Furthermore, from the FWHM analysis (Figure 12), the addition of MWCNTs to
PET contributes to a reduction in chain orientation. This result supports that seen in the 2D
SAXS/WAXS data. We see that the MWCNTs inhibit the development of a regular lamellar
morphology (as is the case for neat PET), and instead a shish-kebab structure is formed. As the
PET-MWCNT composites are annealed, new small crystallites are formed, but these can have
more random orientations which is seen by the increase in the FWHM. However, the thermal
behavior of PET and the PET-MWCNT composites (Table 1), suggests that the MWCNTs act as
nucleating agents when the PET is crystallized – shown by a significant increase in Tc and Xc for
the composites. To clarify the behavior described in this paper, thermal analysis was performed
on drawn and annealed samples at 190 °C to investigate the Tc and crystallinity. The DSC heat-
cool thermograms are shown in Figure 15.

MANUSCRIP
T
ACCEPTED
ACCEPTED MANUSCRIPT
28
Figure 15. DSC heat-cool thermograms of post-drawn (DR 2.5:1) and annealed PET, PET1%
and PET2% samples. (A) heat scan for samples at 0.1 s-1; (B) heat scan for samples at 0.2 s-1; (C)
cool scan for samples at 0.1 s-1; (D) cool scan for samples at 0.2 s-1.
Both the melting and crystallization temperatures, and percentage crystallinity for these
thermograms are collated in Table 4. The melting point of PET and PET-MWCNT composites
does not change significantly and is similar to those values quoted in Table 1, for the as extruded
cast films. The increased draw rate (0.1 s-1 to 0.2 s-1) also has little effect on the melting
temperature of PET. One interesting feature that is present in both the PET and PET-MWCNT
composite heating thermograms is the small melting endotherm at ~196 °C. This ‘double
melting’ peak of PET has been observed in uniaxially drawn and annealed PET films where the

MANUSCRIP
T
ACCEPTED
ACCEPTED MANUSCRIPT
29
lower temperature peak is attributed to the melting of imperfect small crystallites [53] and
similarly in the PET-MWCNT composites [18,19].
Table 4. Thermal data for PET and PET-MWCNT composites post-draw and annealed at 190
°C.
Sample Tc/°C Tm/°C Xc/%
Draw rate/s-1
0.1 0.2 0.1 0.2 0.1 0.2
PET 207.3 206.4 253.6 251.8 43 39
PET1% 224.1 224.0 255.3 254.8 41 38
PET2% 229.7 230.0 256.1 256.0 37 35
From Table 4, it can be seen that there is a considerable increase in the crystallization
temperature Tc, for the PET-MWCNT composites compared with the neat PET. This is expected
assuming the MWCNTs act as nucleating agents as was shown earlier for the thermal analysis of
the as extruded cast materials (Table 1). The crystallinity for the neat PET is greater than that for
the PET-MWCNT composites which is in contrast to the crystallinity of the as cast extruded
samples. The crystallinity is reduced in all samples with increasing draw rate. Thus, although the
MWCNTs in the drawn samples still nucleate crystal growth heterogeneously (i.e. crystallization
kinetics are increased) the final bulk crystalline component is reduced in comparison to neat
PET. This was also seen from the correlation function analysis where the crystallite size was
reduced and therefore the overall crystallinity. This is further confirmed from the 2D SAXS
showing the formation of a shish-kebab morphology rather than lamellar structure for neat PET.
The broadening of the crystallization peaks in the cooling thermograms for the PET-MWCNT

MANUSCRIP
T
ACCEPTED
ACCEPTED MANUSCRIPT
30
composite samples (Figure 5C and 5D), is again attributed to a range of imperfect crystallites
formed via heterogeneous nucleation.
From the results presented here for both the as cast extruded and uniaxially deformed samples,
it can be seen that MWCNTs do act as nucleating agents, increasing crystallization kinetics.
However, significant differences are seen in the evolution of the crystalline morphology during
uniaxial deformation. The PET-MWCNT composites have a prevalent shish-kebab structure,
where the MWCNTs inhibit crystallite growth and reduce the overall crystalline orientation.
Conversely, a regular well developed lamellar structure with significant orientation is seen for
the unfilled PET homopolymer under the same processing conditions.
The differences in PET morphology are undoubtedly due to the addition of MWCNTs. From
the published literature it has been argued [25-28] that CNTs act as the shish so that the PET
crystallites (kebabs) then grow expitaxially from these shish, thus the CNTs act as nucleating
points in this process. Therefore, the nanohybrid shish-kebab structure (NHSK) [25-30] proposed
for PE and iPP CNT composites is valid here with respect to our PET-MWCNT composites.
However, the MWCNTs tend to hinder PET chain orientation during deformation, which leads to
a more random orientation in the emerging crystallites, thus a reduction in orientation as
crystallization progresses. The MWCNTs also obstruct the thickening of the crystallites into a
full lamellar structure, like that described for the PET homopolymer. Therefore, it is probable
that some crystallites are initially nucleated by the MWCNTs acting as shish but as the annealing
temperature is increased, crystallites in the PET matrix also nucleate and grow. This scenario
would imply that PET crystallites result from both nucleation in the PET matrix and at the
surface of the MWCNTs [31].

MANUSCRIP
T
ACCEPTED
ACCEPTED MANUSCRIPT
31
The NHSK or MWCNT/matrix nucleation and subsequent crystal growth models for PET-
MWCNT composites are both credible mechanisms, but it is difficult to separate these
crystallization mechanisms even with the data presented here. As a result, the NHSK model
combined with polymer matrix nucleation and crystal grown mechanism provides an overall
plausible description of the crystallization mechanism observed here with PET-MWCNT
composites during uniaxial deformation at low strain rates.
4 CONCLUSIONS
Combined SAXS/WAXS, mechanical and thermal techniques have been employed to follow
the morphology evolution in a set of PET-MWCNT composites as cast extruded films and during
solid-state uniaxial deformation and subsequent annealing. The results revealed that following
cast extrusion, the PET-MWCNT films retained residual orientation and had increased
crystallinity due to the processing equipment used (related to the land length of the die used
during extrusion), whereas the neat PET did not. The PET-MWCNT composites once uniaxially
deformed at a DR of 2.5:1 at low strain rates, showed significantly improved mechanical
properties and a different crystalline morphology compared with neat unfilled PET. SAXS data
revealed a regular well developed lamellar structure with significant orientation for neat PET,
conversely the PET-MWCNT composites showed a shish-kebab morphology with reduced
orientation. The MWCNTs in the polymer composite increase nucleation events, but inhibit the
growth of crystallite structure and reduce the overall crystalline orientation. Once annealed, the
final crystallite thickness and bulk crystallinity is reduced in the composite samples. WAXS data
confirmed the orientation to be greater in the neat PET, but no change in the crystallite PET unit
cell was observed due to the addition of MWCNTs. Moreover, thermal analysis of the drawn and

MANUSCRIP
T
ACCEPTED
ACCEPTED MANUSCRIPT
32
annealed films showed that the MWCNTs act as nucleating agents, increasing the rate of
crystallization, but the final crystalline content in the composites is actually less than that for neat
PET.
The data has shown the definitive role MWCNTs have in the structural evolution in PET
during uniaxial deformation. Whilst the MWCNTs act as nucleating agents (increasing
crystallization kinetics), they form a shish-kebab morphology compared to the well-developed
lamellar structure seen for neat PET. The mechanism of the formation of this morphology is
attributed to the MWCNTs acting as shish for the epitaxial PET crystallites to grow out from,
that is, a nanohybrid shish-kebab structure (NHSK) is formed. Furthermore, nucleation and
crystal growth also occurs in the PET matrix, but the MWCNTs inhibit crystallite development
and hinder any perfection to a full lamellar structure.
The results here have provided a valuable insight into the role of MWCNTs as a functional
nanofiller for polymers. The improved mechanical properties can be linked to the MWCNTs
reinforcement and nucleating effects and thus the crystalline structure development when
processed. However, contrary to this MWCNTs then inhibit crystal growth of the polymer when
further processing occurs, reducing overall bulk crystallinity and orientation, in comparison with
the homopolymer itself. This could have wide-spread application in modifying polymers with
MWCNTs where the structure and physical properties can be tailored to function.
ACKNOWLEDGMENT
X-ray beam time at Diamond Light Source was provided under the experimental application SM-
11742. ESRF beamtime was provided under the experimental application 28-01/1127. We are
grateful for the assistance of all the Diamond I22 and ESRF BM28 (XMaS) beamline staff.

MANUSCRIP
T
ACCEPTED
ACCEPTED MANUSCRIPT
33
REFERENCES
[1] Grady, B. P. Carbon nanotube-polymer composites manufacture, properties, and
applications, 1st Ed. Wiley-Interscience: New York, 2011.
[2] Feldman, D. J. Macromol. Sci. A, 2015, 52, 648-658.
[3] Spitalsky, Z.; Tasis, D.; Papagelis, K.; Galiotis, C. Progress in polymer science, 2010, 35,
357-401.
[4] Breuer, O.; Sundararaj, U. Polymer composites 2004, 25, 630-645.
[5] Xie, X. L.; Mai, Y. W.; Zhou, X. P. Materials Science and Engineering: R: Reports, 2005,
49, 89-112.
[6] Coleman, J. N.; Khan, U.; Blau, W. J.; Gun’ko, Y. K. Carbon, 2006, 44, 1624-1652.
[7] McNally, T.; Pötschke, P. Polymer-carbon nanotube composites: Preparation, properties
and application, Cambridge United Kingdom: Woodhead Publishing, 2011.
[8] Pandey, G.; Thostenson, E. T. Polymer Reviews, 2012, 52, 355-416.
[9] Wernik, J. M.; Meguid, S. A. Appl. Mech. Rev., 2010, 63, 050801-050801-40.
[10] Kim, J. Y.; Kim. S. H. In High Performance PET/Carbon Nanotube Nanocomposites:
Preparation, Characterization, Properties and Applications, Nanocomposites - New Trends and
Developments, Ebrahimi, F., Ed.; InTech, 2012, Chap. 5. DOI: 10.5772/50413.
[11] Mayoral, B.; Hornsby, P. R.; McNally, T.; Schiller, T.L.; Jack, K.; Martin D.J. RSC Adv.
2013, 3, 5162-5183.

MANUSCRIP
T
ACCEPTED
ACCEPTED MANUSCRIPT
34
[12] McCrossan, K.; McClory, C.; Mayoral, B.; Thompson, D.; McNally, T.; Murphy, M.;
Nicholson, T.; Martin, D.; Halley, P. (2011). In Composites of poly(ethylene terephthlate) and
carbon nanotubes. Polymer-carbon nanotube composites: Preparation, properties and
application, McNally, T.; Pötschke, P; Eds, Cambridge United Kingdom: Woodhead Publishing,
2011; p 545.
[13] Cruz-Delgado, V.J.; Ávila-Orta, C. A.; Espinoza-Martínez, A. B.; Mata-Padilla, J. M.;
Solis-Rosales, S. G.;. Jalbout, A. F; Medellín-Rodríguez, F. J.; Hsiao. B. S. Polymer, 2014, 55,
642-650.
[14] Antoniadis, G.; Paraskevopoulos, K. M.; Bikiaris, D.; Chrissafis, K. J. Polym. Sci. B Polym.
Phys., 2009. 47, 1452-1466.
[15] Mazinani,S.; Ajji, A.; Dubois, C. Polym. Eng. Sci. 2010, 50, 1956-1968.
[16] Zaman, H. U.; Hun, P. D.; A. Khan, R. A., Yoon, K-B. Fullerenes, Nanotubes and Carbon
Nanostructures, 2013, 21, 701-711.
[17] Kim, J. Y.; Park, H. S.; Kim, S. H. J. Appl. Polym. Sci., 2007, 103, 1450–1457.
[18] Tzavalas, S.; Mouzakis, D. E.; Drakonakis, V.; Gregoriou, V. G. J. Polym. Sci. B Polym.
Phys. 2008, 46, 668-676.
[19] Tzavalas, S.; Drakonakis, V.; Mouzakis, D.E.; Fischer, D.; Gregoriou, V. G. Macromols,
2006, 39, 9150-9156.
[20] Anand, K. A.; Agarwal, U. S.; Joseph, R. Polymer, 2006, 47, 3976-3980.

MANUSCRIP
T
ACCEPTED
ACCEPTED MANUSCRIPT
35
[21] Vad, T.; Wulfhorst, J.; Pan, T-T.; Steinmann, W.; Dabringhaus, S.; Beckers, M.; Seide, G.;
Gries, T.; Sager, W. F. C.; Heidelmann, M.; Weirich. T. E. Macromols, 2013, 46, 5604-5613.
[22] Hur, J. W.; Yoo, H. J.; Cho, J. W.; Kim, K. H. J. Polym. Sci. Part B: Polym. Phys., 2015,
DOI: 10.1002/polb.23953.
[23] Chen, H.; Liu, Z.; Cebe, P. Polymer, 2009, 50, 872-880.
[24] Deng, H.; Bilotti, E.; Zhang, R.; Peijs, T. J. Appl. Polym. Sci., 2010, 118, 30-41.
[25] Laird, E. D.; Li, C. Y. Macromols, 2013, 46, 2877-2891.
[26] Li, C. Y., Li, L., Cai, W., Kodjie, S. L. and Tenneti, K. K. Adv. Mater., 2005, 17, 1198-
1202.
[27] Li, L.; Li, B.; Hood, M. A.; Li. C. Y. Polymer, 2009, 50, 953-965.
[28] Patil, P.; Balzano, L.; Portale, G.; Rastogi, S. Carbon, 2010, 48, 4116-4128.
[29] Liu, P.; White, K. L.; Sugiyama, H.; Xi, J.; Higuchi, T.; Hoshino, T.; Ishige, R.; Jinnai, H.;
Takahara, A.; Sue, H.J.; 2013.. Macromols, 2013, 46, 463-473.
[30] Chen, Y. H.; Zhong, G. J.; Lei, J.; Li, Z. M.; Hsiao, B. S. Macromols, 2011, 44, 8080-8092.
[31] Wurm, A.; Lellinger, D.; Minakov, A. A.; Skipa, T.; Pötschke, P.; Nicula, R.; Alig, I.;
Schick, C. Polymer, 2014, 55, 2220-2232.
[32] Metha, A.; Gaur, U.; Wunderlich, B. J. Polym. Sci., Polym.Phys. Ed., 1978, 16, 289-296.

MANUSCRIP
T
ACCEPTED
ACCEPTED MANUSCRIPT
36
[33] I22: Small Angle Scattering & Diffraction. http://www.diamond.ac.uk/Beamlines/Soft-
Condensed-Matter/small-angle/I22.html (Assessed 15/03/2016)
[34] Hughes, D. J.; Mahendrasingam, A.; Oatway, W. B.; Heeley, E. L., Martin, C.; Fuller, W.
Polymer, 1997, 38, 26, 6427-6430.
[35] Hughes. D. J.; Mahendrasingam, A.; Martin, C.; Oatway, W.B.; Heeley, E.L.; Bingham, S.
J.; Fuller, W. Rev. Sci. Instrum., 1999, 70, 4051-4054.
[36] XMaS: The UK Materials Science Facility at the ESRF.
http://www2.warwick.ac.uk/fac/cross_fac/xmas/ (Assessed 15/03/2016)
[37] Basham, M.; Filik, J.; Wharmby, M. T.; Chang, P. C. Y.; El Kassaby, B.; Gerring, M.;
Aishima, J.; Levik, K.; Pulford, B. C. A.; Sikharulidze, I.; Sneddon, D.; Webber, M.; Dhesi, S.
S.; Maccherozzi, F.; Svensson, O.; Brockhauser, S.; Náray, G,; Ashton, A. W. J. Synchrotron
Rad., 2015, 22, 853-858.
[38] FibreFix. http://www.diamond.ac.uk/Beamlines/Soft-Condensed-Matter/small-angle/SAXS-
Software/CCP13/FibreFix.html (Assessed 15/03/2016)
[39] Simple SAXS and WAXS Software written in Excel.
http://coecs.ou.edu/Brian.P.Grady/saxssoftware.html#Allprograms (Assessed 15/03/2016)
[40] Porod G, Kolloid Z, 1951, 124, 83-114.
[41] Baltá-Calleja, F.J,; Vonk ,G. G. X-ray scattering of synthetic polymers. Elsevier Science,
New York, 1989.

MANUSCRIP
T
ACCEPTED
ACCEPTED MANUSCRIPT
37
[42] Ryan, A. J. Fibre Diffr. Rev. 1994, 3, 25-29.
[43] Heeley, E. L.; Gough, T.; Hughes, D. J.; Bras, W.; Rieger, J. and Ryan, A. J. Polymer, 2013,
54, 6580-6588.
[44] Daubeny, R. de P,; Bunn, C. W. Proc. R. Soc. Lond. A, 1954, 226, 531-542.
[45] Rober, S,; Bosecke, P,; Zachmann, H. G. Makromol. Chem. Macromol. Symp.,
1988, 15, 295-310.
[46] Heeley, E. L.; Fernyhough, C. M.; Graham, R. S.; Olmsted, P. D.; Inkson, N. J.; Embery, J.;
Groves, D. J.; McLeish, T. C. B.; Morgovan, A. C.; Meneau, F.; Bras, W.; Ryan, A. J.
Macromols., 2006, 39, 5058-5071.
[47] Abou-Kandil, A, I.; Windle. A. H. Polymer, 2007, 48, 5069-5079.
[48] Mahendrasingam, A.; Blundell, D. J.; Wright, A. K.; Urban, V.; Narayanan, T.; Fuller, W.
Polymer, 2003, 44, 5915-5925.
[49] Uchiyama, T.; Suyama, M.; Alam, M. M.; Asano, T.; Henning, S.; Flores, A.; Baltá Calleja,
F. J.; Mina. M.F. Polymer, 2007, 48, 542-555.
[50] Asano, T.; Baltá Calleja, F. J.; Flores, A.; Tanigaki, M.; Mina, M. F.; Sawatari, C.; Itagaki,
H.; Takahashi, H.; Hatta. I. Polymer, 1999, 40, 6475-6484.
[51] Rule, R. J.; MacKerron, D. H.; Mahendrasingam, A.; Martin, C.; Nye. T. M. W.
Macromols., 1995, 28, 8517-8522.
[52] Blundell, D. J.; Mahendrasingam, A.; Martia, C.; Fuller, W.; MacKerron, D. H.; Harvie, J.
L.; Oldman, R. J.; Riekel. C. Polymer, 2000, 41, 7793-7802.

MANUSCRIP
T
ACCEPTED
ACCEPTED MANUSCRIPT
38
[53] Tongyin, Y.; Haishan, B.; Jiacong, H.; Wei, Z.; Qiaoying, G. Polymer communications,
1983, 1, 83-91.

MANUSCRIP
T
ACCEPTED
ACCEPTED MANUSCRIPT
Highlights
1. Morphology evolution and crystallinity of PET-MWCNT composite films was investigated.
2. Uniaxially deformed PET-MWCNT films displayed improved mechanical properties.
3. SAXS/WAXS data revealed a well oriented lamellar structure for unfilled PET films.
4. PET-MWCNT composites revealed a nanohybrid shish-kebab (NHSK) morphology.
5. The MWCNTs act as shish for the epitaxial growth of PET crystallites (kebabs).