open pdf journal
TRANSCRIPT

Database Systems Journal vol. IV, no. 2/2013 1
Database Systems Journal BOARD
Director Prof. Ion Lungu, PhD, University of Economic Studies, Bucharest, Romania
Editors-in-Chief Prof. Adela Bara, PhD, University of Economic Studies, Bucharest, Romania Prof. Marinela Mircea, PhD, University of Economic Studies, Bucharest, Romania
Secretaries Lect. Iuliana Botha, PhD, University of Economic Studies, Bucharest, Romania Lect. Anda Velicanu, PhD, University of Economic Studies, Bucharest, Romania
Editorial Board Prof. Ioan Andone, PhD, A.I.Cuza University, Iasi, Romania Prof. Anca Andreescu, PhD, University of Economic Studies, Bucharest, Romania Prof. Emil Burtescu, PhD, University of Pitesti, Pitesti, Romania Joshua Cooper, PhD, Hildebrand Technology Ltd., UK Prof. Marian Dardala, PhD, University of Economic Studies, Bucharest, Romania Prof. Dorel Dusmanescu, PhD, Petrol and Gas University, Ploiesti, Romania Prof. Marin Fotache, PhD, A.I.Cuza University, Iasi, Romania Dan Garlasu, PhD, Oracle Romania Prof. Marius Guran, PhD, University Politehnica of Bucharest, Bucharest, Romania Lect. Ticiano Costa Jordão, PhD-C, University of Pardubice, Pardubice, Czech Republic Prof. Brijender Kahanwal, PhD, Galaxy Global Imperial Technical Campus, Ambala, India Prof. Dimitri Konstantas, PhD, University of Geneva, Geneva, Switzerland Prof. Mihaela I.Muntean, PhD, West University, Timisoara, Romania Prof. Stefan Nithchi, PhD, Babes-Bolyai University, Cluj-Napoca, Romania Prof. Corina Paraschiv, PhD, University of Paris Descartes, Paris, France Davian Popescu, PhD, Milan, Italy Prof. Gheorghe Sabau, PhD, University of Economic Studies, Bucharest, Romania Prof. Nazaraf Shah, PhD, Coventry University, Coventry, UK Prof. Ion Smeureanu, PhD, University of Economic Studies, Bucharest, Romania Prof. Traian Surcel, PhD, University of Economic Studies, Bucharest, Romania Prof. Ilie Tamas, PhD, University of Economic Studies, Bucharest, Romania Silviu Teodoru, PhD, Oracle Romania Prof. Dumitru Todoroi, PhD, Academy of Economic Studies, Chisinau, Republic of Moldova Prof. Manole Velicanu, PhD, University of Economic Studies, Bucharest, Romania Prof. Robert Wrembel, PhD, University of Technology, Poznan, Poland
Contact Calea Dorobanţilor, no. 15-17, room 2017, Bucharest, Romania Web: http://dbjournal.ro E-mail: [email protected]

2 Database Systems Journal vol. IV, no. 2/2013
CONTENTS
ETL as a Necessity for Business Architectures ..................................................................... 3
Aurelian TITIRISCA
The Development of a Benchmark Tool for NoSQL Databases ........................................ 13
Ion LUNGU, Bogdan George TUDORICA
Retrieving Targeted Results from a Static File Repository using a Keyword matching Mechanism relying on a Cluster-based Algorithm ............................................................. 21
Mădălina ZURINI, Diana BUTUCEA
Enhancing ETL Performance with Warehouse Builder .................................................... 31
Manole VELICANU, Larisa COPCEA (TEOHARI)
A comparative Review of Extraction, Transformation and Loading Tools .................... 42
Amanpartap Singh PALL, Dr. Jaiteg Singh KHAIRA

Database Systems Journal vol. IV, no. 2/2013 3
ETL as a Necessity for Business Architectures
Aurelian TITIRISCA University of Economic Studies, Bucharest, Romania
[email protected] Today, the new trend that companies are following is to digitalize all data they have in order to reduce costs with physical space and better handle data volume. The new era, the era of bundling data sources and huge volumes of data continues this decade also. In all industries, companies are starting to understand and appreciate the value of data, the value that these volumes of data can produce. Companies are collecting huge volumes of data but not always the actual solution for business intelligence (BI) can handle these volumes. To obtain information, those volumes of data are analyzed with extract-transform-load (ETL) software solutions. Companies, in the current economic context, are finding hard to invest in improvements of BI process including in ETL process. In this paper I will demonstrate why this kind of investment is necessary and also I will demonstrate that ETL process must be included in BI and big data architectures. In the following pages I will refer to business architectures as BI and big data architectures. Keywords: ETL, business intelligence, Big Data, Internet, dataset
Introduction Today, companies are using World
Wide Web to promote themselves, to find huge data sources, to educate their staff and they are using it as a market (e-commerce). Internet has revolutionized the information domain: obtaining data from anywhere at lower cost, finding new data types, transporting the information where needed, analyze the input data and making decisions that in the end will offer more data to be analyzed. And we must not forget that Internet made possible online commerce and online transaction. The entire business intelligence infrastructure is based on the World Wide Web and most important BI is all about data and analyze data. The data volume that companies are collecting is growing exponentially. The firms can have access to a bundling number of data sources inside and outside their business. They need to capture the data (that in majority is form by not structured data), to organize it, to store it,
to transform and analyze data, to distribute the obtained information by users and their roles. This is the competitive advantage but also the challenge that companies must answer. In the current economic context, the survival of a company depends on the rapidity in recognizing a change in the dynamic business environment and the reaction to create a correct response to those changes. Every company to succeed in achieving goals must anticipate the market evolution, find and explore new trends in the market, reorganize the BI strategy and reallocate resources to have a competitive advantage over its competitors. All of this have as a basic layer the information and the value that can be obtain by it. BI architecture and big data architecture must include extract-transform-load (ETL) solution for manipulating volumes of data between source and data warehouse, between data warehouse and data marts.
1

4 ETL as a Necessity for Business Architectures
2. Business intelligence and big data with ETL solution The trend that companies followed in the last years is to digitalize all data that they have, entire document flows. This way they can reduce the cost with storing data but also increase the data volume from which the current BI solution is trying to retrieve valuable information. For example, in electricity domain, the companies from United States of America (SUA) estimate that in 2019 will install over 53 millions of devices for measuring the consumption. Those devices will send information in a time interval (once a week, twice a week, once a month, every six months or one year) and in the end the volume of data that needs to be processed will increase. I want to make a parenthesis to remind why BI is so important, and refer to reference [1]. BI helps economic agents to create synthesized information out of data sources, to use the obtained information in the decisional process and to accomplish business goals. In addition, BI helps economic agents to: 1) identify errors in the companies - accounting errors, errors in selling department, errors in the document flow; 2) discover new opportunities of growing - by studding the market and find those market sectors that the company could explore but it does not. For example, in the retail, we find that there is a demand for smart watches that the competition does not cover; 3) understanding competition: identify the competition, market position; 4) identify which departments are performing below average and why; 5) identify which departments are exceeding the performance and why; 6) identify consumer behavior - by analyzing sales records and by market polls;
7) define performance indicators - like employee score card, productivity, claims; 8) adapt BI process to the market needs - for example adapt the stocks to demand; 9) better understand the economic period and the market - in this case, in retail, the company can rise or lower prices depending on the customer revenue; 10) analyze historical data generated by the business process or from other data sources like national institutes of weather (climate changes), statistical data - by analyzing this data a retail company can find opportunities in the market, can over supply a store before floods. Another example, in the green energy segment, companies can identify the zones in which they can produce more energy from natural resources. BI solutions continue to evolve. When a company wishes to adopt a BI solution, I believe that the first step is to identify the data flow and the data sources that the company can access, identify possible data sources that can bring value to the company. Mike Ferguson in his paper work "Architecting A Big Data Platform for Analytics" [2], considers that big data contains huge volume of data and the IT solutions for handling those volumes of data. And I agree. It is the most basic principle, because basically we can only handle big data with the correct IT solution in order to obtain correct information fast. The IT companies that offer business consulting divide their solution in order to cover a bigger part of the volume of data offered by clients. Today, not all companies offer solutions for big data. Big data represents a huge volume of data, from different sources (like multimedia data, social data, emails, phone records, commands on email), a data that in majority is not structured. In my opinion, big data can be represented by volumes of data that companies cannot handle and from which it cannot obtain any information or obtaining information from

Database Systems Journal vol. IV, no. 2/2013 5
big data takes too long. From my practical experience, I can say that obtaining information in over 10 minutes from a relative large volume like terabyte is already too much and requires a new BI solution. From volumes of data we can obtain valuable information known also as business value added (BVA). BVA helps companies to reach their target because the volume of data grows every year in all domains and it is hard to analyze them with the current IT solution that the company has. From my point of view all architectural schemas of BI have to use a ETL solution to manipulate and aggregate data. A basic architectural schema can be describe in figure 1:
Fig 1. ETL in BI and big data architecture,
from my point of view. Usually an architecture has one or more data warehouse dedicated for collecting data (first level), another data warehouse or one or more data marts for storing the data after the ETL process (second level) and at a third level, data marts dedicated
for storing the obtained information. Between the second and third level we can have another ETL layer. ETL processes are used for the alimentation of data warehouse. Nowadays, BI is not a optional decision that companies could take but is a mandatory one that companies must choose in order to survive on the market, it is the way that they can obtain advantages and evolve on the market. From my point of view, managers that have access to accurate information and correct synthesized information have a bigger chance to create better decisions, to anticipate the market. Regardless of technological evolution, the most important value that BI can offer is information and the correct usage of the information is the most important competitive advantage. Today, on the market there are present a number of big data solutions, from which I will highlight an open source solution (Cloudera) and an IBM solution (Big Insights). Big data appears when the volume of data exceeds terabytes of data (petabytes, zetabytes, exabytes). Big data is the new challenge that IT domain are trying to solve. 3. Extract-Transform-Load data Unfortunately, the data quality from data sources is not at its best and definitely does not map on a metadata schema of a data warehouse. This is way we need ETL process for cleaning the input data that the business can access. ETL means extract-transform-load data. There are three steps in manipulating data. The first step is to extract all data from data sources. Because the extracted volume of data is unpredictable, it would be contra-productive and time-consuming to extract this volume each time that a superior step fails. This is why the volume of data should be stored into a binary file, internal file recognize by the ETL product. When extracting data, it is wise to define a perimeter for the input data. For example, we will treat all data received in a period of

6 ETL as a Necessity for Business Architectures
time. We can do this because a ETL product offers an operator called delta, that has the role for identifying new records, old records that have to be updated or records that need to be deleted. This operator works on keys: identifies if the key is in the target. If not, it creates it. If already exists, then it compares values for each attribute. If there are changes then we update the data in target. If one key (from the point of view of value) from target does not exist in key source then we delete the data from target. An important observation regarding the operator is that the input fluxes must be sorted and partitioned by key. The basic job design for data extraction is described in figure 2 below.
Fig 2. Basic job design
In the practical example, Infosphere Datastage uses personal binary files, called dataset. These files are kept on the Infosphere Information Server. Datasets are binary files that can hold metadata, keep sorting and partitioning of the data and data. And because it is a binary file, operations of writing and reading data from server are fast. Also this type of file can be used by any interface of a module, if the business requires it. For maintenance, modules are easy to be handled if the three steps are well identified at a interface level. The second step is for transforming data. In this step, we can do cleaning operations on data. The simplest operations are: character conversion, type conversion, normalizing data so we could map the data to the target metadata, define keys, treat null values,
conversions, access analytics function. At this level we can aggregate the data to obtain the desired information. At this step we can use the delta operator or the slowly changing dimensions which is similar to delta. It is important that the ETL maintains the integrity of the references so we can eliminate the risk of referring a table, a dimension that doesn't exist. ETL process must assure that the correct information is obtained and loaded into the data warehouse, from business logic point of view. From the point of view of Infosphere Datastage, the fastest way to load data into tables is with the option load truncate, because it executes two fast SQL operations: truncate data from the table and insert the new data into the table. From my point of view, before we can load data into the target table, target data mart or data warehouse it is important to verify that the new data fulfills the following conditions: 1) referential conditions: we must verify if the new data respects the architectural schema of the data warehouse; 2) join conditions: it is important that the joins respects the architectural schema and the business conditions; 3) unique conditions for attributes: identify witch attributes are keys or have unique values; 4) null conditions: verify witch attributes can receive null as a value and for which we treat nulls; 5) dropping and rebuild indexes, triggers on tables; 6) respect the specifications for developing and the mapping. The third step is dedicated to load the dates from step 2 into tables, data marts, data warehouse. When we load data into tables, the user for ETL must have roles that allow him full access to the target table. In this step it is necessary to treat the fail module condition: if a module for actualization of

Database Systems Journal vol. IV, no. 2/2013 7
data fails then it is important to delete the inserted data and reload the data. Although an ETL solution seems easy to be used, in practice is the other way around. Over 50% of the time is allocate to map the ETL process to business needs. 4. Code reuse in ETL products. Import-export operations in ETL In the last years, using of ETL has had a code reuse problem. When we refer at ETL, the term of code reuse cannot be used because each job that developers create is unique and treats in a unique way a business process. Every interface has its own specifications although this must not be confused with similarities between interfaces. From my point of view, when I create an interface I have in mind the specification, the unique metadata and unique names of the tables from witch I extract and load data. In addition, in practice the test for an interface are done individually because if, by absurd the interface is not unique in same way, it's like a single interface can treat all BI process and it will mean that the data warehouse contains one dimension. For example, in a retail, one business requirement says that a dimension of the data warehouses must not contain null values and must have all rows identify by a unique number. In order to solve the business need, the ETL developers need to develop the following modules: 1) a module for extracting the data: data is extracted from the data warehouse with a specific purpose; 2) a module for treating all nulls cases, for identifying actualization operations; 3) a module for each type of actualization of the target table.
From my point of view this particularity on modules instead of one big module is very useful for maintenance operations.
Observations in some ETL products, modules are referred as jobs. Also operators and operations are included in stages and stages functionality. A collection of grouped jobs form an interface. Actualization operations on a data warehouse refers to identify new data that doesn't exist in the target table, identify all data that need to be updated, data that need to be deleted from the target table or data that is copied into the target table. When comes to manipulate data throw ETL, there are two principles that parallel and sequential processing need: partitioning and collecting data. The collecting operation means that data from different nodes is collected into one output node. Collecting data in a specific order can improve performance and reduce sort operations. The partitioning operation means that data is distributed on the processing nodes by a predefined algorithm. Most use algorithms are: 1) round robin: distributes the data evenly on the nodes; 2) hash: distribute data on nodes by key or group of keys; 3) same: keeps data partitioning from previous stage.
Developers have created interfaces and modules from scratch. I consider that there is a way to reuse the code if the business rules in essence are almost the same for two or three target dimensions. Here I refer to the fact that two interfaces can have the same principles: extract the data into a file in the first module, treat the data for null values and then identify the actualization (similar business rules) operations on the target table and the last module for applying those operations on the target table. We can reuse those modules by creating copies of the models of the previous interface, reuse the operators and operations, parameters but we cannot use the same metadata, the same name for the jobs and the same intermediate files.

8 ETL as a Necessity for Business Architectures
Depending on the ETL product, we can have stages similar to global variables called global shared container. The shared container has the commune keys and fields of each interface and the same business rules. The rest of the columns are mapped for each interface. For example, Datastage uses shared container and for mapping the other columns that are not keys has a run time column propagation property (columns are past at run time). From my point of view, I consider code reuse in ETL products to be a double blade sword. It can be indicated, because it reduces time of developing, it can lead to identify errors from grammatically errors (for example wrong file name, wrong name of a stage variable, of a parameter) to calculation errors (some formulas or cases are not treated; the mapping of columns is wrong, one integer field is mapped to wrong field; the reject file does not contain the correct information). Another hand, if the developer is not paying attention he could propagate the error to more interfaces and the human error risk can grow. ETL programs can import and export code. Throw code I will include interfaces, modules, definitions files. Usually, an ETL program can export and import definitions files in internal format, for code protection and to prevent the client to choose another ETL solution. But there are ETL solutions, like Infosphere Datastage that can import and export files in internal format, called dsx, or xml files. A dsx file contains the interface or modules as precompiled code similar to C language and contains: metadata, operations grouped by stages, name of links, input and output files and number of nodes for process data.
5. Company motivation to update ETL solution ETL solutions are important for all BI process. They are a part of BI architecture. Although the cost of a ETL solution is not small it is a mandatory part for each BI process. Companies have to take into consideration the cost of the investment, the depreciation rate and the benefits of the ETL product. Normally, you cannot use a ETL without the proper training and that includes training cost or support team cost. ETL solutions evolves all the time from architectural point of view (execute modules from sequential to parallel), calculation power, scalability, real time support. IT companies sell license for old and new versions of the ETL tool. There is a challenge to convince clients to update the ETL version because this operation, in majority of cases, includes additional costs generated by incompatibility between versions and by clients needs in using new facilities. It needs a maintenance team to handle the migration process. The migration process is not a short term process because the team needs to analyze the impact that the new solution will have and solve the eventual errors. During the migration process both ETL versions will run in parallel until the migration is complete Customers are not always willing to pay license for both version and support. This is way investing in a evolution of a ETL product needs to be analyze correctly. Another reason that migration process needs a support team is that of architectural change of the newer version that will cause imported modules with join operations between tables to generate a false result. The trend in ETL solutions targets the need of developers to write code: the developer should not need to write code by himself, instead he should use the improvements of the new version. From my point of view the investment cost in a ETL solution should be very well supported. Companies must analyze the

Database Systems Journal vol. IV, no. 2/2013 9
impact, the benefit that the new solution brings to the BI process. There are cases in which the BI process requires a new feature like real time processing data that the old version does not support. Throw the research that I made, I will demonstrate why a investment in the evolution of ETL solution is required for the BI process. I analyzed two versions of the ETL - Infosphere Datastage: version 7.5.3 and version 8.5. To better understand this version and the capabilities, you can read references [3] and [4]. Infosphere Datastage is a ETL product own by IBM. Is a graphic program for analyzing and data manipulation. From the operating system point of view, the Infosphere Information Server runs on UNIX and the Infosphere Datastage client runs on Windows. At ETL level, exists the following jobs status: finished, aborted, not compiled, finished (see log). Datastage offers the following advantages: 1) parallel processing capability; 2) metadata manipulation; 3) support for data in real time; 4) support for BI rules with any grade of difficulty; 5) allows direct access to big volumes of data; 6) offers public support: IBM manuals, big community support; 7) export and import data throw xml files; 8) offers connectors for each database (DB2, Oracle, Netezza, Teradata); 9) offers access to modules logs after the execution; 10) can produce executable files throw the export options that he has; 11) can execute SQL queries; 12) allows metadata import from different sources with the exceptions of data types BLOB, CLOB. I will analyze the Oracle Connector stage from the points of: execution mode, data
type conversion and null conversion. In my example, I defined an Oracle table, PERSOANE with attributes: CREATE TABLE PERSOANE( IDI_PERS NUMBER(11) NOT NULL, COD_PERS NUMBER(11) NOT NULL, DAT_DERN_MAJ_ACTIV_CLI DATE, PERS_EMAIL CHAR(1 CHAR), DAT_MAJ_EMAIL DATE, PERS_EMAIL_PART CHAR(1 CHAR), DAT_MAJ_EMAIL_PART DATE, PERS_TEL_MOB CHAR(1 CHAR), DAT_MAJ_TEL_MOB DATE, DAT_HEUR_CREA_TECH DATE NOT NULL, DAT_HEUR_DERN_MODIF_TECH DATE NOT NULL, DAT_MAJ_TOP_CLI_MIGR DATE, )
On the canvas, I added a connector stage and a dataset file, like in figure 3, bellow.
Fig 3. Job designed by me in Datastage 7.5.3.
In Datastage 8.5, the job design is:
Fig 4. Job designed by me in Datastage 8.5
From execution point of view, the Oracle connector in Datastage 7.5.3 is set by default to run in sequential mode, shown by the figure 5 below in tag execution mode:
Fig 5. Oracle connector in 7.5.3 from execution
point of view

10 ETL as a Necessity for Business Architectures
In Datastage 8.5, the Oracle connector can is default set to run in parallel but without partitioned read method set to true, it runs in sequential as showed in the log and imagines below (figure 6). It can be forced to run in parallel by using the option: Enable partitioned reads set to yes and Partitioning read method set to yes.
Fig 6. The Oracle connector in 8.5
Fig 7. Configure read in parallel operation.
Without this configuration the Oracle connector, although it suppose to run in parallel, notify the user in job log that it will run in sequential mode:
Fig 8. Oracle connector needs the partitioned read option to be enabled
Fig 9. Oracle Connector extracts data in parallel. Each table includes an attribute that contains the row number. When we use Rowid Range method, the Oracle connector follows a execution plan: 1) the connector queries the DBA_EXTENTS dictionary to obtain information on the table; 2) connector then defines a ROWID value for each processing node based on the results obtain above; 3) at execution, each node runs a query with a personalized where clause. This method doesn't work if: 1) if the user cannot access the DBA_EXTENTS dictionary; 2) if the connector reads from an indexed table or view; 3) if the SQL script contains joins between tables. I will describe the results obtained in Datastage 7.5.3 and in Datastage 8.5 when I change the null ability of attribute DAT_MAJ_TOP_CLI_MIGR to no. The job does not extracts any data because null values cannot be inserted into a not null attribute. And both version will act in the same way as showed in the imagines below.

Database Systems Journal vol. IV, no. 2/2013 11
Fig 10. Log message in Datastage 7.5.3
Fig 11. Log message in Datastage 8.5 I will show the result obtained when we are trying to map a timestamp attribute from Oracle to a string attribute in Datastage. In version 7.5.3 this conversion is not done automatically and the developer must do it manually in a Transformer stage or Modify stage. Datastage 8.5 treats this conversion from timestamp to string automatically as showed in the below log messages.
Fig 12. Log message in Datastage 7.5.3.
See the red X from above that indicates that the job failed.
Fig 13. Log message in Datastage 8.5
I will show the result obtained when we are trying to map a timestamp attribute (in format DD/MM/YYY 00:00:00) from Oracle to a date attribute in Datastage.
Fig 14. Message log in Datastage 7.5.3 in the above case.
Fig 15. Message log in Datastage 8.5 In this case, the job was executed successful. I can say that my study shows the sensibility of the ETL tools at data types imported from Oracle.

12 ETL as a Necessity for Business Architectures
6. Conclusions The bellow table summarizes the obtained results:
Table 1. Comparative analyze ETL
version Parallel
execution Automatically
conversion from Null to Not Null
Automatically conversion from
Timestamp to string
Automatically conversion from
Timestamp to date Infosphere Datastage
7.5.3 NO NO NO NO
Infosphere Datastage
8.5 YES NO YES YES
When we import metadata from Oracle to Datastage there isn't 100% compatibility between those metadata types. As showed above, Datastage 7.5.3 doesn't automatically handle even the basic conversion from Date Oracle to date type in Datastage. Instead it see him as a timestamp type attribute. But Datastage 8.5 does the conversion automatically and helps the developer to not make the conversion manually. I can conclude that inverting in a update for a ETL solution is a good choice, even if this investment must be very well motivated. From my analyze, I can say that migrating from Datastage 7.5.3 to Datastage 8.5 is a step forward because most importantly allows data from sources to be read in parallel by each node of the ETL configuration.
In fact it reduces the processing time by the number of the nodes: New_Time=Old_Time divided by Number_Of_Processing_Nodes. I will add the real time features that I will treat in a future article. References [1] IBM Redbook; Chuck Ballard, Daniel
M. Farrell, Amit Gupta, Carlos Mazuela, Stanislav Vohnik; Dimensional Modeling: In a Business Intelligence Environment, March 2006
[2] Mike Ferguson, "Architecting A Big Data Platform for Analytics", October 2012
[3] IBM Redbook, Advance user guide for Datastage 7.5.3,2006
[4] IBM Redbook, Advance user guide for Datastage 8.5, 2010
Aurelian TITIRISCA (born 1988 in Romania) has graduated the Faculty of Cybernetics, Statistics and Economic Informatics of the Academy of Economic Studies in 2010 and also the Faculty of International Relations of the Christian University Dimitrie Cantemir in 2010. He graduated the Scientific Master Program (Economic Informatics) at the Faculty of Cybernetics, Statistics and Economic Informatics of the Academy of Economic Studies. Currently, he is pursuing his Ph.D. in the area of big data.

Database Systems Journal vol IV, no. 2/2013 13
The Development of a Benchmark Tool for NoSQL Databases
Ion LUNGU, Bogdan George TUDORICA
University of Economic Studies, Bucharest, Romania Petroleum-Gas University, Ploiesti, Romania
[email protected], [email protected]
The aim of this article is to describe a proposed benchmark methodology and software application targeted at measuring the performance of both SQL and NoSQL databases. These represent the results obtained during PhD research (being actually a part of a larger application intended for NoSQL database management). A reason for aiming at this particular subject is the complete lack of benchmarking tools for NoSQL databases, except for YCBS [1] and a benchmark tool made specifically to compare Redis to RavenDB. While there are several well-known benchmarking systems for classical relational databases (starting with the canon TPC-C, TPC-E and TPC-H), on the other side of databases world such tools are mostly missing and seriously needed. Keywords: NoSQL database, testing, benchmark
Introduction One of the tools needed by a database
administrator (and not only by this category) is a benchmarking tool, a tool which, if used well can give details on the machine performance, on the DBMS performance and (in some cases) on the optimization level (or lack of) of the queries made over that DBMS. In the last several years we’ve seen the advent of a new type of databases, the NoSQL ones [2]. The NoSQL databases are, in a certain point of view, the children of the Web 2.0 era (although the concept they are based on is a much older one). To eliminate any confusions, during this paper the term NoSQL is not used as the opposite of the SQL relational database but as a general label for any BASE database system (Basic Availability, Soft state, Eventual consistency). We should also remark that while in the relational databases faction a certain unification was achieved (while only on the general terms and concepts), in the NoSQL faction almost all solutions are
alien to each other, using different structures, concepts and technologies (a taxonomy given in [3] is containing five categories only for the “core” NoSQL systems). As such, any tool aimed at the NoSQL systems faces the difficulty of having to “speak” several “languages”. At this moment the only commercial tool capable (to a certain extent) of such a feat is Toad for Cloud Databases (able to interoperate with Amazon SimpleDB, Microsoft Azure Table Services, Microsoft SQL Azure, Apache Hbase, Apache Cassandra, Apache Hadoop HIVE, MongoDB and any ODBC-enabled relational database). Even tools aimed at a single NoSQL are scarce and usually far from functional maturity. As such, not only the benchmarking apps are not available but any other kind of administrative ones are lacking too. 2. Tools used for this project This project started as and administration software meant only for MongoDB. We chose MongoDB for a multitude of reasons exposed in [4]. Even before starting working
1

14 The Development of a Benchmark Tool for NoSQL Databases
on this administration application we worked with MongoDB for some other applications such as a web page parsing tool written in PHP (see [5]). MongoDB being the database of choice, there are plenty of programming languages usable for developing an application over MongoDB (C, C++, C# & .NET, ColdFusion, Erlang, Factor, Java, Javascript, PHP, Python, Ruby, and Perl). For this case, our selection was Visual C#, for ease of use, nice interoperability with the Microsoft Windows systems and better application performance than say, a PHP or Java software (for this particular reason, C and maybe C++ were the best possible choices but such a decision would have negated the other advantages). We used the 2008 version of the Visual C# environment as that was the most used at the moment we started the research (2010). On the DBMS side, at this moment we are using the 2.0.7-rc0-pre version of MongoDB (although there are some newer versions). Besides the DBMS and the development environment we are using the MongoDB CSharp driver version 1.4.2.4500-109-g8ac35a5 for connectivity between the MongoDB and Visual C#. Later, during the time we added benchmarking functionality to the application, we used MySQL Connector .Net, version 6.1.6 for connectivity between MySQL and Visual C#, MySQL Community version 5.6.12.1 as a second DBMS and finally MSChart .Net 3.5 add-on and MSChart Visual Studio 2008 add-on for charting. 3. Working methodology For the benchmarking operations we imagined the following three scenarios (inspired by [6], [7], [8] and [9]):
1. The tested databases are used for OLTP operations. This case presumes the following conditions: the number of read operations is of the same magnitude with
the number of write operations; the data from each atomic transaction / row operation has a size in the range of tens of kilobytes. To be more specific, for our application we chosen the following conditions: number of reads = number of writes; each row operations reads or writes a standard record having the following content: three 32-bit integer fields (acting as an id and two other integer fields), 3 float fields, 3 text fields of 100 chars each and 1 small blob field (corresponding to a small document or image file stored in the database). For the blob field we chose to make it of 32,438 bytes. The later size was chosen to make for a total size of the record of 32,768 bytes, permitting fast (even when done mentally) computations of the total transaction data size for various numbers of operations. As a consequence, 32 records mean 1 MB of data, 160 records mean 5 MB of data, 320 records mean 10 MB of data, 1600 records mean 50 MB of data, 3200 records mean 100 MB of data, 16000 records mean 500 MB of data and so on.
2. The tested databases are used for Web 2.0 operations. This case presumes the following conditions: the number of read operations is two to three orders of magnitude higher than the number of write operations (e.g. for YouTube, as per the latest statistics, the read to write size ratio is somewhere around 1389:1); the data from each atomic transaction / row operation has a size in the range of Megabytes (e.g. for YouTube is quite large, the average atomic transaction size is, depending on resolution and quality, of 20-150 Megabytes, but not all Web 2.0 services are data intensive). For our application we chosen the following conditions: number of reads = 500 * number of writes; each row operations reads or writes a standard record having the following content: one 32-bit integer fields (acting as an id), 5 text fields of 500 chars each and 1 large blob field (corresponding to media content stored in the database). For

Database Systems Journal vol IV, no. 2/2013 15
the blob field we gave it the size of 5,241,346 bytes. Again the blob size was chosen to make for a round size of the record (5,242,880 bytes = 5 MB), permitting fast computations of the total transaction data size for various numbers of operations.
3. The tested databases are used for OLAP operations. This case presumes the following conditions: the number of read operations is one to two orders of magnitude higher than the number of write operations; the data from each atomic transaction / row operation has a size in the range of fractions kilobytes. For our application we chosen the following conditions: number of reads = 100 * number of writes; each row operations reads or writes a standard record having the following content: ten 32-bit integer fields, ten float fields and 7 text fields of 132 chars each (again for the sake of a round record size – 1024 bytes = 1 kilobyte, permitting fast computations of the total transaction data size for various numbers of operations). 3. Preparations before testing As the operating system we worked our application over is Microsoft Windows XP, there are a few measures to take to compensate for the multi-core, multi-tasking, multi-threading, time-sharing character of such a system. First we took care to make the maximum amount of computing resources available for the application while preventing (as much as possible) other applications to interfere with the testing: using System.Diagnostics; using System.Threading; … Process.GetCurrentProcess().ProcessorAffinity = new IntPtr(2); //make the process use the second core or processor which is usually less loaded than the first
Process.GetCurrentProcess().PriorityClass = ProcessPriorityClass.High; //raise the priority of the process Thread.CurrentThread.Priority = ThreadPriority.Highest; //raise the priority of the thread
Second, before starting the test, we took care to “warm up” the CPU cache and pipelines: stopwatch.Reset(); stopwatch.Start(); while (stopwatch.ElapsedMilliseconds < 1500) //A period of 1500 ms for CPU cache and pipelines stabilization with a randomly chosen operation in it.
{ i = (i + 1) % 10; } stopwatch.Stop();
4. Data generation In the design stage we hypothesized that the content of the transaction data may have some influence over the transaction time so we decided not to use any pre-stored data but to generate it randomly instead at every benchmark run, in quantities and structures depending on the type and size of the run. Two distinct random generation methods were used for numbers and respectively for strings. For various format of numbers we used the Random class. To make sure that no data sequence is repeated between two runs, we took care to seed the random number generator with a different value (given by a small trick – we used the Guid class as a seed generator): Random rndNum = new Random(int.Parse(Guid.NewGuid().ToString().Substring(0, 8), System.Globalization.NumberStyles.HexNumber)); For integer field content we used directly the Random generator such us: id = rndNum.Next(0, 4000000);

16 The Development of a Benchmark Tool for NoSQL Databases
For float field content we used divisions of random values such us: val3 = (float)rndNum.Next(-2000000, 2000000) / (float)rndNum.Next(0, 4000000); For BLOB fields, we randomly generated ASCII codes which were later converted to chars / bytes. We also took the precaution to only generate chars from a small portion of the ASCII table to avoid a possible later invalidation of the queries containing the data caused by the apparition of a special character: for (j = 0; j < 32438; j++)
blob[j] = char.ConvertFromUtf32
(rndNum.Next(97, 122))[0];
On the other hand, for strings we used a different approach (again based on a programming trick) which seemed to be a bit faster that the char by char direct generation: Txt1 = ""; for (j = 0; j < 10; j++)
{ string piece =
Path.GetRandomFileName(); piece = piece.Substring(0,
10); txt1 = txt1 + piece; }
Finally, it is worth to be mentioned the fact that the data generation is highly time consuming (as we will see at the end of the fifth section of this paper) and as such, we took the measure to clock it separately than the rest of the test. 5. The benchmarking The benchmarking consists of cycles of “record” write operations followed by cycles of “record” read operations (the concept of record has actually no meaning in the NoSQL world; the closest concepts are the ones of document or the
one of key-value pair; see [3], [4], [10] and [11]). The number of cycles and the content of the “records” depend on the type of the intended benchmark (see section 3). The connections to the DBMS are made in the usual ways. Note: at this moment the benchmark application is capable of working only over MongoDB and MySQL but we intend for future developments to add Oracle database and MS SQL capabilities on the relational DBMS side and Redis and CouchDB on the NoSQL side. The basic write operations are looking like the following: • For MongoDB (repeated for every
“field”): var element = BsonElement.Create("id", BsonString.Create(id.ToString())); document.Add(element);
• For MySQL (one transaction for the entire record):
string mysql_query = "INSERT INTO oltpbenchmark_table (id, val1, val2, val3, val4, val5, val6, den1, den2, den3) VALUES(" + id.ToString() + ", " + val1.ToString() + ", " + val2.ToString() + ", " + val3.ToString() + ", " + val4.ToString() + ", " + val5.ToString() + ", \"" + blob_s + "\", \"" + txt1 + "\", \"" + txt2 + "\", \"" + txt3 + "\")"; MySqlCommand mysql_cmd = new MySqlCommand(mysql_query, mysql_connection); mysql_cmd.ExecuteNonQuery();
The basic read operations are looking like the following: • For MongoDB: foreach (var document in cursor)
{ id=document.GetElement(1).Valu
e.ToInt32(); …

Database Systems Journal vol IV, no. 2/2013 17
• For MySQL: string mysql_query2 = "SELECT * FROM oltpbenchmark_table"; MySqlCommand mysql_cmd2 = new MySqlCommand(mysql_query2, mysql_connection); MySqlDataReader mysql_dataReader = mysql_cmd2.ExecuteReader(); while (mysql_dataReader.Read())
{ id = mysql_dataReader.GetInt32(0); …
At the corresponding moments during the operations, several Stopwatch class objects are started, stopped and reset in
accordance with their purposes (clocking the times for data generation, the write operations for MongoDB, the write operations for MySQL, the read operations for MongoDB, the read operations for MySQL). We chose to use the Stopwatch class for clocking the operations because it gives for a pretty accurate measurement of time. Finally the results (given in milliseconds) are stored in a dataGridView and represented on a Chart for ease of lecture and interpretation.
The product of an OLTP benchmark run can be seen in Fig.1.
Fig. 1. The results of an OLTP benchmark run based on a 500 MB data chunk, with clocking at 1 MB,
5 MB, 10 MB, 50 MB, 100 MB and 500 MB

18 The Development of a Benchmark Tool for NoSQL Databases
In the Fig.1, the timings are given for data generation (first row of timings), MongoDB write operations (the second row), MySQL write operations (the third row), MongoDB read operations (the fourth row) and MySQL read operations (the fifth row). The conclusions of a single run of the test are the following: • The MySQL write operations require much higher times than all other types of operations (going as far as 20 times bigger) because they are the only ones which involve direct disk operations. All the other operations are more or less memory based (the data generation is made in memory, MongoDB is based on a RAM cache technology, also the MySQL reads are cached). • Even when taking into consideration only the read operations timings, MongoDB performance is better than the one of MySQL (which is to be expected, given the fact that all major NoSQL products are lighter, less complex and, as a consequence, they are supposed to be faster than their relational counterparts; see [1] and [3]). • The data generation consumes actually 2 to 5 times more time than the actual read or write operations (except for the MySQL writes). At the present moment we are considering this an issue and searching for an alternative approach. • The read operations are consistently faster than the write operations for both DBMS products, which is again to be expected. 6. Conclusions This paper presented an approach for a obtaining a benchmarking tool aimed at measuring the performance of various DBMS, be they relational or NoSQL. The used working methodology is far from perfect as it doesn’t take into account the expected statistical
fluctuations. From this point of view, a complete approach would consist of a large enough number of runs, with the extreme results disregarded and the other results taken into account on average. References [1] B. F. Cooper, A. Silberstein, E. Tam, R.
Ramakrishnan, and R. Sears, Benchmarking cloud serving systems with YCSB, Proceedings of the 1st ACM symposium on Cloud computing, ser. SoCC ’10. New York, NY, USA: ACM, 2010, pp. 143–154. ISBN: 978-1-4503-0036-0, doi: 10.1145/1807128.1807152
[2] Avrilia Floratou, Nikhil Teletia, David J. DeWitt, Jignesh M. Patel, Donghui Zhang, Can the elephants handle the NoSQL onslaught?, Proceedings of the VLDB Endowment, VLDB Endowment Hompage archive, Volume 5 Issue 12, August 2012, Pages 1712-1723
[3] Bogdan Tudorica, Bucur Cristian - A comparison between several NoSQL databases with comments and notes, The proceedings of „2011 - Networking in Education and Research” IEEE International Conference, June 23, 2011 – June 25, 2011, Alexandru Ioan Cuza University from Iasi.
[4] Bogdan Tudorica - Challenges for the NoSQL systems: Directions for Further Research and Development, The International Journal of Sustainable Economies Management (IJSEM), Volume 2: Issue 1 (2013), DOI: 10.4018/IJSEM.2013010106, ISSN: 2160-9659, EISSN: 2160-9667.
[5] Bucur Cristian, Bogdan Tudorica - A Research on Retrieving and Parsing of Multiple Web Pages for Storing Them in Large Databases, The Proceedings of the 19th International Economic Conference - IECS 2012, The Persistence of the Economic Crises: Causes, Implications, Solutions, 15 June, 2012, Sibiu, Romania.

Database Systems Journal vol IV, no. 2/2013 19
[6] Jim Gray, Benchmark Handbook: For Database and Transaction Processing Systems, Morgan Kaufmann Publishers Inc. San Francisco, CA, USA 1992, ISBN:1558601597
[7] Plale, B., Jacobs, C., Jensen, S., Ying Liu, Moad, C., Parab, R., Vaidya, P., Understanding Grid resource information management through a synthetic database benchmark / workload, IEEE International Symposium on Cluster Computing and the Grid, 2004 (CCGrid 2004), 19-22 April 2004, Page(s): 277 – 284, Print ISBN: 0-7803-8430-X, INSPEC Accession Number: 8198955, doi: 10.1109/CCGrid.2004.1336578
[8] Rim Moussa, TPC-H Benchmark Analytics Scenarios and Performances on Hadoop Data Clouds, Networked Digital Technologies Communications in Computer and Information Science Volume 293, 2012, pages 220-234
[9] Yingjie Shi, Xiaofeng Meng, Jing Zhao, Xiangmei Hu, Bingbing Liu, Haiping Wang, Benchmarking cloud-based data management systems, CloudDB '10 Proceedings of the second international workshop on Cloud data management, pages 47-54, ACM New York, NY, USA 2010, ISBN: 978-1-4503-0380-4, doi: 10.1145/1871929.1871938
[10] Ashok Joshi, Sam Haradhvala, Charles Lamb, Oracle NoSQL Database - Scalable, Transactional Key-value Store, IMMM 2012, The Second International Conference on Advances in Information Mining and Management, pages: 75-78, IARIA, 2012, ISBN: 978-1-61208-227-1, Venice, Italy, October 21, 2012 - October 26, 2012
[11] Rick Cattell, Scalable SQL and NoSQL data stores, ACM SIGMOD Record archive, Volume 39 Issue 4, December 2010, Pages 12-27, ACM New York, NY, USA, doi: 10.1145/1978915.1978919
Ion LUNGU is a Professor at the Economic Informatics Department at the Faculty of Cybernetics, Statistics and Economic Informatics from the Academy of Economic Studies of Bucharest. He has graduated the Faculty of Economic Cybernetics in 1974, holds a PhD diploma in Economics from 1983 and, starting with 1999 is a PhD coordinator in the field of Economic Informatics. He is the author of 22 books in the domain of economic informatics, 57 published articles (among which 2 articles ISI indexed) and
39 scientific papers published in conferences proceedings (among which 5 papers ISI indexed and 15 included in international databases). He participated (as director or as team member) in more than 20 research projects that have been financed from national research programs. He is a CNCSIS expert evaluator and member of the scientific board for the ISI indexed journal Economic Computation and Economic Cybernetics Studies and Research. He is also a member of INFOREC professional association and honorific member of Economic Independence academic association. In 2005 he founded the master program Databases for Business Support (classic and online), who’s manager he is. His fields of interest include: Databases, Design of Economic Information Systems, Database Management Systems, Decision Support Systems, Executive Information Systems.

20 The Development of a Benchmark Tool for NoSQL Databases
Bogdan George TUDORICA is a teaching assistant in the Modeling, Economic Analysis and Statistics department from the Petroleum-Gas University of Ploiesti, Romania. At this moment he is also a PhD student at the Bucharest University of Economic Studies, Romania. His field of study for the PhD thesis is the management of large data volumes.

Database Systems Journal vol. IV, no. 2/2013 21
Retrieving Targeted Results from a Static File Repository using a Keyword matching Mechanism relying on a Cluster-based Algorithm
Mădălina ZURINI, Diana BUTUCEA
University of Economic Studies, Bucharest, Romania [email protected], [email protected]
Due to the fact that the web based solutions designed for learning contain, among the compulsory functions, the uploading of didactic materials of the person doing the examining (on a regular basis this being the professor) and the possibility of accessing these by the examinee (on a regular basis this being the student), within this paper we have chosen to set the goal of finding a resolution that will enable the access of content relevant to the person being examined. Hereby we have suggested a prototype which will capacitate the singling out and grouping of documents depending on the keywords, which will be followed by a visual search depending on the distance between two documents, by the recurrence of the closest k documents to the one being the element of interest – reaching the optimal alternative in case of a performance oriented point of view. The algorithm needed for the extraction of this data is presented within the paper. An optimization model is proposed in order to reduce the time consuming component in regards to the minimization of differences in the quality of the documents resulted in the automatic search using a k Nearest Neighbour grid search engine. Keywords: e-learning, grid-based algorithm, keyword, kNN, automatic grid search optimization
Introduction The places and faces of information
have changed in dramatic ways since the birth of the Web. Over the past ten years, library-based research has been replaced by web-based research, just as libraries have shifted from book and journal repositories to learning commons and large-scale computer labs. Also, the rapid growth of information on the Web has clearly had major implications for the ways students identify the need for, locate, evaluate, use, and create information. The evolution of the Web, particularly the maturation of search engines and development of Web 2.0 technologies, has forever changed the information landscape. [1] Adopting advanced forms of information dissemination and information technology solutions has been the main driving force of vigorous development of e-learning. Nowadays, the popularization and application of Internet provides a
broad implementation space to distance education. From the point of view of development process of information technology, each step of Internet will bring new impact and positive effect to distance education model. [2] Introducing these as a starting point, we have developed an algorithm for automatic generation of documents’ keywods and a framework for determining the first k documents similar in terms of keywords to a given input document using and optimized searching algorithm based on k Nearest Neighbour algorithm with an integration of space reduction. In chapter 2 there is presented the e-learning application and the general activities flow. There is also described an automated algorithm for choosing keywords in each uploaded document. Chapter 3 contains the description of k Nearest Neighbour (KNN) general algorithm, the input data, the output form and the main steps. All these information is
1

22 Retrieving Targeted Results from a Static File Repository using a Keyword Matching Mechanism relying on a Cluster-based Algorithm.
gathered in a pseudocod that reveals the complexity level of the automatic search. For the optimization of this algorithm, in chapter 4 a grid based model is proposed in order to reduce the complexity, generating a lower time consuming component by reducing the searching space recursively within the grid cells neighbour to the cell from which the input document is part of. The empirical results are shown in Chapter 5, where a set of 900 bi-dimensional points are used for comparing the results obtained by kNN general algorithm and Grid based kNN proposed model. The comparison is done in terms of time consuming generated by the number of documents analysed using a metric of evaluation defined. The conclusions are drawn in Chapter 6, where the need of integration the proposed model is highlighted in the context of e-learning platforms.
2. E-learning application The learning application has been developed with the help of framework Laravel 4, based on PHP 5.3.7. language. We took into consideration the assurance of a high quality platform, this being one of the fastest working PHP full-featured framework. Using the head off offered advantages – expandable for a large number of users, ensures the stateful inspections and server cache for the Web – we have managed to integrate a product which presents a high level of security and the acceleration of network traffic. The documents will be uploaded on to the platform by the professor with the especially elaborated module. He can also upload the 5 representative keywords for the document in question. The general activities flow is shown in Figure 1.
Fig. 1. General Activities Flow
Since the application is used in an university, containing information for all the disciplines, the number of uploaded documents will easily reach a few thousands. In case the professor chooses not to set the keywords, we have introduced a possible algorithm that will define them in an authomathic manner. This is presented in Figure 2. All the words in the documents are counted and depending on the length and frequency found within the text, the 5
mentioned keywords will be witheld to be used further on, in this paper in the way it has been mentioned. In order to establish a good classification, we took into consideration the length of the text and we set a different minimum number of appearances in each case. In case a word appears in the title, the system places it in a superior position, since it is considered of higher importance. Also, in case of an equal number of appearances, alphabetical classification is applied.

Database Systems Journal vol. IV, no. 2/2013 23
Fig. 2. Algorithm for choosing keywords

24 Retrieving Targeted Results from a Static File Repository using a Keyword Matching Mechanism relying on a Cluster-based Algorithm.
3. KNN automatic search K Nearest Neighbour algorithm, also known as Closest Pair of Points Algorithm in computational geometry is the algorithm used for searching the closest k neighbours of an n-dimensional given point, neighbours that are part of an initial set of n-dimensional a priori known objects. This algorithm is used in the process of supervised classification and for automatic search. In the context of supervised classification, as a knowledge base a set of n-dimensional points a priori classified is used. In addition, a new object is used, also represented in the n-dimensional space, object that is used as input data in the classification process. K Nearest Neighbour algorithm is run with the input parameter k, the number of neighbours used in the analyses, the set of objects, X, and the new object unassigned to a class. Using a distance function, the algorithm returns the closest k objects in the context of distance function minimization from each object to the input object. According to the defined objective, the returned objects are then aggregated using an aggregation function based on vote majority with constant or variable weights. In the process of automatic search, the k returned objects are not aggregated, but used as output values. Also, the initial set of objects isn’t a priori classified into membership classes. In the context of metric space, the notation used for the initial set of n-dimensional objects is X:
where:
• m represents the cardinality of the set of objects X.
Each object is represented by the values of the analyzed characteristics that are
considered coordinate axes of the feature space.
where:
• is the value of the j characteristic
for the object i;
• is the total number of analyzed
characteristics. Let be the new n-dimensional object given as input for which the algorithm returns its closest objects. Let be the distance function used for the evaluation of similarity between two objects, with
. For the distance function, different distances can be used, such as: Euclidian distance, Manhattan, Canberra or Cosine. The general model of searching and identification of the objects that are closest to a specified object is visually presented in figure 3. The objects’ representation is done in the bi-dimensional space generated by two characteristics in which the red point represents the input point for which the neighbors are searched and the green objects are the results of the automatic search algorithm.
Fig. 3. General model of automatic search using kNN
The complexity level of the searching algorithm is equal to . The disadvantages are given by the parameter k and distance function choosing. Also, the

Database Systems Journal vol. IV, no. 2/2013 25
complexity level can be reduced by reducing the dimension of the feature space, using Principal Component Analysis, which generates a lower number of uncorrelated features. 4. Grid based optimized search Different optimization algorithms are proposed in [3], [4], [5], [6], using the reduction of searching area, with the help of searching, representing and computing in an optimized manner. The problem of optimization is applied in the context of high dimensional space having a large number of objects. Given the high complexity level of the searching algorithm using kNN, which depends of the dimension of the feature space, n, and the cardinality of the set of objects, m, new methods of comparing objects are proposed. The process of optimization of the searching using kNN is done by reducing the complexity level of the algorithm through the cardinality diminishing of the features and the space searching reducing by:
• dividing the causal space into cells and sequentially search within the neighbour cells from which object
is part of;
• the use of object clustering results of the initial objects from the X set and sequentially searching within the closest clusters.
The separation of the causal space within a matrix of cells starts from the concept of cell that is defined as being that zone from the feature space in which the objects assigned to it have the values of the characteristics in a predefined segment. For that, each value of the characteristics are retained and integrated in a transformation function for generating the cell of membership using the formula:
where:
• represents the result of the
assignation function of the f feature for the o object;
• represents the dimension for f
characteristic. The dimension for each characteristic represents the size of the separation cells for the coordination axes of feature f, using the amplitude reported to the number of desired cells
where:
• l represents the total number of segments in which the values are separated in.
Figure 4 reveals the manner of separation of a bi-dimensional feature space into cells. The numbering of the cells is done from left to right, from an inferior to a superior layer.
Fig. 4. Bi-dimensional space separation
The visual model of selecting the closest k neighbours using the optimization based on grid partitioning into cells is presented in figure 5. For the red object, the search is done only within the neighbour cells. The green points are the ones closest to the red

26 Retrieving Targeted Results from a Static File Repository using a Keyword Matching Mechanism relying on a Cluster-based Algorithm.
object. Not all the points are used in the sorting algorithm. After applying the formulas for each existing object, an assignation vector is loaded, . The manner of aggregation of the results of assignation of each feature is done using a linearization function, transforming a matrix into an array. For the bi-dimensional case, in which each object is characterized by two features, =i and =j , the assignation result of the o object into a cell is generated by . The objects being assigned, the input object is also allocated, .
Fig. 5. Visual model of selecting using grid partitioning
The optimized kNN algorithm uses only the objects that are part of the same cell with or from the neighbour cells with g cell. A vector of visited cells is initialized with 0, along with a parameter nr_obj, representing the number of objects found among the neighbour cells. An empty list of objects is initialized, that will contain all the candidate neighbours to the input object.
The pseudocode proposed for the optimized automatic search contains the following steps. P1. Determining the cell from which object
is part of, g. P2. If the cell isn’t visited yet, the number of objects within it is counted. The visited objects are introduced in the list of neighbour objects. P3. If the number of objects is less than k parameter, the search moves the one of the neighbour cells. For the bi-dimensional space, the labels of the neighbour cells to g one are g-1, g+1, g+l+1, g+l-1, g-l+1 and g-l-1. P4. Steps 2 and 3 are repeated until the number of identified objects is equal or greater than k. P5. The identified objects allocated as nodes within the list of objects are further used for calculating the distances between them and
object. After the sorting of the list, the first k objects are given as output. The exit point from the algorithm is reached when the number of neighbour points is equal or greater than k. The optimization is done with the help of the algorithm proposed, by the manipulation of a lower number of objects, using a sequentially search. Thereby, the new complexity level is , where m’ represents the size of the list of neighbor objects used in the sorting process. 5. Evaluation of the results For the evaluation of kNN algorithm in general version used as compare base with all the objects from the initial set of objects, a set formed out of 900 bi-dimensional randomly generated objects is used.

Database Systems Journal vol. IV, no. 2/2013 27
Fig. 6. Results of kNN algorithm
In figure 6 are presented the results obtained using the searching algorithm for k=50 bi-dimensional objects found closest to object from the initial set of n=900 objects. The distance function used the evaluation of the similarity between two objects is the Euclidian distance. From the complexity
point of view, after calculating the distances of each 900 objects to the input object, the sorting is applied and the first 50 objects are given as output. In the situation of optimized searching algorithm using grid based separation, the results are presented in figure 7.
Fig. 7. The search results using kNN grid based algorithm
28 Retrieving Targeted Results from a Static File Repository using a Keyword Matching Mechanism relying on a Cluster-based Algorithm.
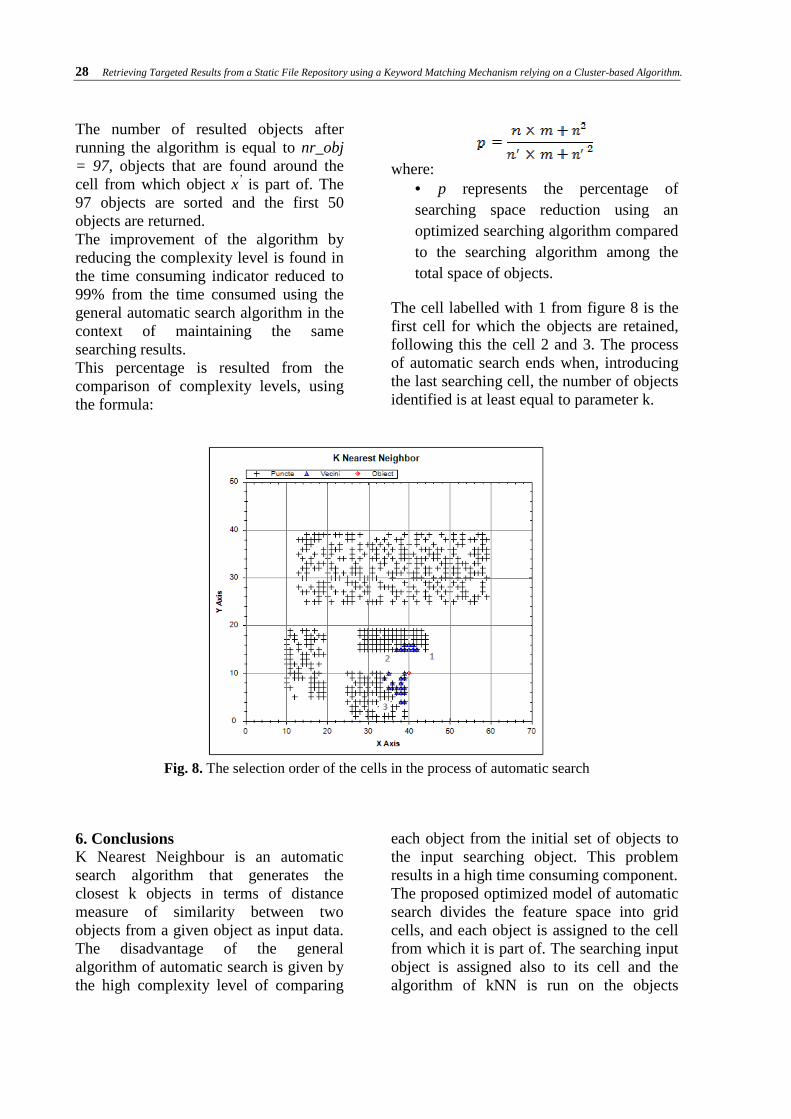
The number of resulted objects after running the algorithm is equal to nr_obj = 97, objects that are found around the cell from which object x’ is part of. The 97 objects are sorted and the first 50 objects are returned. The improvement of the algorithm by reducing the complexity level is found in the time consuming indicator reduced to 99% from the time consumed using the general automatic search algorithm in the context of maintaining the same searching results. This percentage is resulted from the comparison of complexity levels, using the formula:
where:
• p represents the percentage of searching space reduction using an optimized searching algorithm compared to the searching algorithm among the total space of objects.
The cell labelled with 1 from figure 8 is the first cell for which the objects are retained, following this the cell 2 and 3. The process of automatic search ends when, introducing the last searching cell, the number of objects identified is at least equal to parameter k.
Fig. 8. The selection order of the cells in the process of automatic search
6. Conclusions K Nearest Neighbour is an automatic search algorithm that generates the closest k objects in terms of distance measure of similarity between two objects from a given object as input data. The disadvantage of the general algorithm of automatic search is given by the high complexity level of comparing
each object from the initial set of objects to the input searching object. This problem results in a high time consuming component. The proposed optimized model of automatic search divides the feature space into grid cells, and each object is assigned to the cell from which it is part of. The searching input object is assigned also to its cell and the algorithm of kNN is run on the objects

Database Systems Journal vol. IV, no. 2/2013 29
found in the cells neighbour to the input cell until a stopping point is reached, representing the number of objects found in the cells analysed. The objects are then sorted in terms of distances between them and the searching object and the first k objects are returned as output. The algorithm is suitable for document searching, when for each document a set of keywords is assigned manually or automatically using the proposed model for keywords generator. The feature space is formed out of the unique keywords found for each document from the initial set of documents. The optimized algorithm reduces the time consuming, being analysed only the documents closest to the initial document using the grid cell analyser. For the experiment conducted, the time consuming is reduced with 99% from the time consumed using the general algorithm. Future work is related to different optimization models for generating the closest documents. Acknowledgments This work was cofinanced from the European Social Fund through Sectorial Operational Programme Human Resources Development 2007-2013, project number POSDRU/107/1.5/S/77213 „Ph.D. for a
career in interdisciplinary economic research at the European standards”. References [1] McClure, R., „Writing Research
Writing: The Semantic Web and the Future of the Research Project”, Computers and Composition, 28, 2011, 315–326
[2] Shi, Y., Wang, M., Qiao, Z., Mao, L., “Effect of Semantic Web technologies on Distance Education”, Procedia Engineering, 15, 2011, 4295 – 4299
[3] Kolbe, D., Zhu, Q., Pramanik, S., “Reducing non-determinism of k-NN searching in non-ordered discrete data space”, Information Processing Letters, 2010, 420-423
[4] Chen, Y.S., Hung, Y.P., Yen, T.F., Fuh, C.S., “Fast and versatile algorithm for nearest neighbor search based on a lower bound tree”, Pattern Recognition, 2007, 360-375
[5] Plaku, E., Kavraki, L.E., “Distributed computation of the knn graph for large high-dimensional point sets”, Journal of Parallel Distributed Computation, 2007, 346-359
[6] Lopez, V.F., Prieta, F., Ogihara, M., Wong, D.D., “A model for multi-label classification and ranking of learning objects”, Expert Systems with Applications, 2012, 8878-8884
Mădălina ZURINI is currently a PhD candidate in the field of Economic Informatics. She graduated the Faculty of Cybernetics, Statistics and Economic Informatics (2008) and a master in Computer Science, having her dissertation given in Implications of Bayesian classifications for optimizing spam filters (2010). She is also engaged in Pedagogical Program as part of the Department of Pedagogical Studies. Her fields of interest are data classification, artificial intelligence, data quality, algorithm analysis and
optimizations. She wants to pursue a pedagogical career.

30 Retrieving Targeted Results from a Static File Repository using a Keyword Matching Mechanism relying on a Cluster-based Algorithm.
Diana BUTUCEA graduated in 2008 from the Economic International Relations Department of the Academy of Economic Studies in Bucharest, in 2009 from the Faculty of Automatics and Applied Informatics of the Transylvania University of Brasov and in 2010 from the Economic Informatics masters at the Academy of Economic Studies in Bucharest. Her parallel interests, in economy and software engineering, are now merging
into her studies and researches since she is PhD student at the Academy of Economic Studies, Bucharest, studying integrated software systems, web technologies and e-learning platforms.

Database Systems Journal vol. IV, no. 2/2013 31
Enhancing ETL Performance with Warehouse Builder
Manole VELICANU, Larisa COPCEA (TEOHARI)
University of Economic Studies, Bucharest, Romania [email protected]; [email protected]
We live in a dynamic world, in a permanent move, were performance of information systems continually increases. Thus, the need of being informed, regardless of place or time, is very great using data warehouses solutions. Therefore, the need for efficient information systems is very high. The efficiency can be achieved by using various methods/techniques and technologies “to build” the data warehouse. The ones, we will present in our paper, are: methods of Enhancing ETL Performance with Warehouse Builder: the purpose of ETL strategies is to create an integrated, complex, coherent software solution; techniques of data warehouse optimization: in order to improve the performance of data warehouse processing can be applied several optimization techniques; and “in terms” of technology, we will consider: data warehouses (using Oracle Warehouse Builder). Keywords: performance, Oracle Warehouse Builder, efficiency of information systems, extraction, transformation, and loading (ETL), data warehouse optimization
Introduction Here we focus on what we can do
through Warehouse Builder, that is, performance configuration setting during ETL and schema design. Tips on configuring your database for optimized performance, we focus mainly on specific Warehouse Builder performance-related features to achieve optimal performance. Consider involving your organization’s data architect in the very first planning steps, well before Warehouse Builder is implemented. It is too late to start thinking about performance strategies at the point where you are using Warehouse Builder to create ETL mappings. As the data warehouse size is increasing and crossing terabytes limits, and as the query turnaround time is getting shorter, administrators have the additional overhead of monitoring the performance of the data warehouse system regularly. A major task of any data warehouse system is ETL, and it is essential that the ETL design be tuned for optimized
performance. There are multiple places in a Warehouse Builder implementation where an administrator can look for possible performance bottlenecks. These are: hardware, operating system, network, database, application (that is, Warehouse Builder). 2. ETL Design: Mappings Extraction, transformation, and loading in a production data warehouse can be very time consuming and take up a lot of your system resources. Yet, when implementing a warehouse, the focus is more on how to have a perfect dimensional model rather than how to create ETL logic with run-time performance in mind. It is important to know that a well designed ETL mapping can make all the difference in the performance of your data warehouse. Consider the Cost of Function Calls. For example, a simple replacement of a function operator with a join condition operator in the mapping can make huge difference in the time taken by the mapping
1

32 Enhancing ETL Performance with Warehouse Builder
to execute. This is because if you are including a function in a mapping, the function call will take the context out to the function and after the function completes, the control returns back into the mapping. So there is extra time taken. Or when joining from multiple tables, it is better to stage the results in a staging table and then apply a filter or a aggregate operator than doing it all on the fly. Hence, it is a good ETL design decision to keep the context switches to a minimum and make use of the various
mapping operators that Warehouse Builder provides to accomplish different tasks. You can review your mappings on some of the performance parameters. You need to answer questions such as: Which operating mode is better for the ETL logic you are using, or what will be the best commit strategy or will parallel DML enhance performance, and so on. If you are moving large volumes of data from remote source, will it be better to do an import/export or to use transportable modules. The below figure 1 shows a mapping created in Warehouse Builder to load the dimension customers.
Fig 1. Oracle Warehouse Builder mapping load dimension customers
Source: author

Database Systems Journal vol. IV, no. 2/2013 33
Fig. 2 Oracle Warehouse Builder design center for mappings Source: author
The above figure 2 shows the design center for mappings in Warehouse Builder. The “Set based” and “Row based” operating modes have their advantages and disadvantages. The "Set based" operating mode is the fastest way to process data. The rows are processed as a single dataset, with a single SQL statement that is either completed successfully for all the rows or fails if there is a problem with even one row. You cannot view details about which rows contain errors. The “Row based” operating mode gives more control to the user, both in terms of logging row-by- row processing information, as well as in terms of control
over the management of incorrect data. Warehouse Builder generates statements that process data row by row. The records can be extracted from the source one at a time, processed, and inserted in the target. If there is a problem with some rows, this is logged and the processing continues. Detailed logging of row-by-row processing information is available. The default operating mode you select depends upon the performance you expect, the amount of auditing data you require, and how you design the mapping. The following are the five operating modes, ranked by performance speed, with the fastest first: “Set based”, “Set based fail over to row based (target only)”, “Set based fail over to row based” (the default), “Row

34 Enhancing ETL Performance with Warehouse Builder
based (target only)” and “Row based” The default operating mode is “Set based fail over to row based,” in which mode Warehouse Builder will attempt to use the better-performing “Set based” operating mode, but will fall back to thes lower “Row based” mode if data errors are encountered. This mode allows the user to get the speed of "Set based" processing, but when an unexpected error occurs it allows you to log these errors. The “Row based (target only)” and “Set based fail over to row based (target only)” operating modes are a compromise between the “Set based” and the “Row based” modes. The “target only” modes will use a cursor to rapidly extract all the data from the source, but will then use the “Row based” mode to insert data into the target, where errors are more likely to occur. These modes should be used if there is a need to use the fast “Set based” mode to extract and transform the data as well as a need to extensively monitor the data errors. Warehouse Builder generates code for the specified default operating mode as well as for the unselected modes. Therefore, at run time, you can select to run in the default operating mode or any one of the other valid operating modes. The types of operators in the mapping may limit the operating modes you can select. As a general rule, mappings run in "Set based" mode can include any of the operators except for Match-Merge, Name-Address, and Transformations used as procedures [4]. 3. Commit Control and Audit Level within Warehouse Builder By default, Automatic is selected for the Commit Control run-time parameter. You may use the automatic commit when the consequences of multiple targets being loaded unequally are not great or are irrelevant because a mapping has multiple targets. Warehouse Builder
commits and rolls back each target separately and independently of other targets. For PL/SQL mappings you can override the default setting and control when and how Warehouse Builder commits data by using either Automatic Correlated or Manual. Automatic Correlated: If you want to populate multiple targets based on a common source, you may also want to ensure that every row from the source impacts all affected targets uniformly. When Automatic Correlated is selected, Warehouse Builder considers all targets collectively and commits or rolls back data uniformly across all targets. Correlated commit operates transparently with PL/SQL bulk processing code. The correlated commit strategy is not available for mappings run in any mode that is configured for Partition Exchange Loading or includes an Advanced Queue, Match-Merge, or Table Function operator. The role of the Commit frequency run-time parameter is to enable the user to decide how often data is committed. You should select a number that will not put too much strain on the rollback segments size. The default is set to 1,000 rows. Commit frequently! Use “Default audit level” to indicate the audit level used when executing the package. Audit levels dictate the amount of audit information captured in the run-time schema when the package is run. You can set it to NONE, ERROR DETAILS, STATISTICS, or COMPLETE. The default audit level will define how detailed the audit information collected during the load process will be. Running a mapping with the audit level set to Complete generates a large amount of diagnostic data, which may quickly fill the allocated tablespace and can impact performance. When you select STATISTICS, statistical auditing information is recorded at run time.

Database Systems Journal vol. IV, no. 2/2013 35
4. Additional Run-Time Parameters for Mappings You can configure additional run-time parameters for your mappings to tune performance as discussed below: A. “Bulk size” and “Bulk processing code”: If “Bulk processing code” is set to True, the “Row based” mode will process the rows in bulks instead of individual rows, which will improve the performance of the row-based mappings. In this case, the bulk size will be given by the “Bulk size” run-time parameter. It is recommended to keep the bulk size value around 50, which is the optimal value. B. “Maximum number of errors”: Use “Maximum number of errors” to indicate the maximum number of errors allowed when executing the package. Execution of the package terminates when the number of errors reached is greater than the “Maximum number of errors” value. The maximum number of errors is only relevant in the Row based operating mode. This parameter will set the limit of data errors that will be tolerated during the mapping run, before the mapping is stopped for too many errors. If the mapping is stopped due to this, the mapping ends in ERROR.
5. Partition Exchange Loading (PEL) in Warehouse Builder You can use Partition Exchange Loading (PEL) to load new data by exchanging it into a target table as a partition. This exchange process is a DDL operation with no actual data movement. PEL is patented technology specific to Warehouse Builder. Only Oracle has this technology. One major advantage is the ability to do parallel direct path loading. Before Oracle9i, if a table was partitioned to multiple partitions, the server could only serialize a load to one partition at a time. To solve that problem, PEL technology was created for OWB, allowing a non-partitioned staging table to hold the data. Another main advantage of PEL is the ability to load data while not locking the target table. The swapping of names and identities requires no time. The target table is not being touched. One minor advantage of using PEL is to avoid rebuilding the indexes and constraints in the big partitioned table—data is loaded, indexes created, and constraints maintained in the staging table (on the much smaller scale), and after the loading is completed, the staging table is rotated and replaces a big table partition in a single stroke [3].
Fig. 3 – Partition Exchange Loading
Source: [4] In this example from figure 3, only one financial period needs to be updated in a large target table with much historical data. Instead of issuing a SQL Delete
command, PEL uses data definition language (DDL) statements to swap partition assignments, without the data

36 Enhancing ETL Performance with Warehouse Builder
movement required of data manipulation language (DML) statements. Guidelines to achieve PEL for targets: • The large table must be partitioned by range, based on a single date field. • Partition names must respect a specific naming convention. • The staging table must contain data for the same date range as the partition it is going to replace. • Data and indexes must each be located in a single tablespace. (All the partitions and the staging table must be in a single “data” tablespace, while the indexes can be located on a single “index” tablespace.) • The structure of the staging table must be identical to the structure of the large partitioned table, and they have to have the same indexes and constraints. • All the indexes in the big partitioned table must be local indexes (pertaining to a single partition). There are two options for PEL: Direct and Indirect. Direct PEL: The user designs and maintains the staging table that is switched into the large partitioned table directly. This usually happens in a mapping that has a one-to-one correspondence between the source (the staging table) and the target (the large partitioned table). Direct PEL is convenient because it allows the user to physically separate the process of loading (when the staging table is loaded) from the process of publishing the data (when the data is swapped into the large partitioned table and made available to the query/reporting users). For example, the data loading into the staging table can be scheduled during the day, while the actual publishing of the data, which might be disruptive to the query/reporting users (front-end users),
can be scheduled during the night when there is little or no front-end activity. Another way to use direct PEL (which switches old data from the partition to the staging table) is to manage “dormant” data (data that is not often used by the analytical users, but needs to be available on short notice). In this case, empty staging tables can be swapped with the least-used partition data (usually the oldest data) making the oldest partition empty, but maintaining the actual data in the staging table. The data can then be switched online almost instantaneously by re-running the mapping. Indirect PEL: Warehouse Builder creates a temporary staging table behind the scenes, swaps the data with the partition, and deletes the table once the swap is completed. This kind of configuration will be necessary when the mapping loads the data into a target table from remote sources or by joining multiple source tables [4]. 6. Using Transportable Modules for Data Extraction from Remote Sources A very common occurrence in data loading is for the target processes to access data in remote sources. A problem here might be caused by the database link. Since a mapping is a single session, the database link will create a single communication channel between source and target, which will force the data to travel sequentially, thus creating a bottleneck in the data movement process. The solution here is to use transportable modules. Using transportable modules, you can copy large volumes of data and metadata, from an Oracle 9i database to another Oracle 9i database, and from an Oracle 10g database to another Oracle 10g database or 11g database. However, you cannot use transportable modules to copy from an Oracle 9i to an Oracle 10g database. If both versions are 10g, you can create transportable modules to copy data and metadata between Oracle databases on

Database Systems Journal vol. IV, no. 2/2013 37
different machine architectures and operating systems. For 10g and 11g databases, you specify either Data Pump or transportable tablespaces during configuration of the transportable module. In the case of 10g databases and Oracle Data Pump, you can transport tables without also transporting their tablespaces. For example, if your table is 100 KB and its tablespace size is 10 MB, you can deploy the table without deploying the entire tablespace. Furthermore, only Data Pump gives you the option to copy the entire schema. Benefits of Using Transportable Modules Previously, to transport data you relied on moving flat files containing raw data. These mechanisms required that data be unloaded or exported into files from the source database, and then these files were loaded or imported into the target database. Transportable modules entirely bypass the unload and reload steps and gives you access to the Transportable Tablespaces and Data Pump Oracle server technologies. The following are the benefits of using a transportable module [3]: • High performance data extraction: Transportable modules reduce the need for Warehouse Builder mappings to access data remotely. If you have large volumes of data on remote machines, use transportable modules to quickly replicate the sources onto the Oracle target database. • Distribute and archive data marts: Normally a central data warehouse handles ETL processing while dependent data marts are read-only. You can use transportable modules to copy from a read-only data mart to multiple departmental databases. In this way, you can use your central data warehouse to periodically publish new data marts and then replace old data marts simply by
dropping the old tablespace and importing a new one. • Archive sources: You can set your source tablespaces to read-only mode and then export them to a target. All the data files are copied creating a consistent snapshot of the source database at a given time. This copy can then be archived. The advantage of this method is that archived data is restorable both in the source and target databases. 7. Best Practices Tips: Factors That Impact Performance The following are a few simple ETL design practices that influence the performance of your mappings considerably: • Custom transformation impact: Transformation functions should be used sparingly on large tables. The reason is that the generated SQL statements containing the transformation function call will force the database engine to switch between the SQL engine (that interprets pure SQL statements) and PL/SQL engine (that interprets the procedural structures, such as functions). Whenever possible it is beneficial to replace simple PL/SQL functions with pure SQL expressions. • Loading type impact: This will determine which SQL statement will be used to update the target. It is worth noting that the INSERT statement is the least inefficient of the operations available, because it creates new data only, so the user should use INSERT whenever possible. Insert/Update and Update/Insert are slightly more inefficient (these load types will generate a MERGE statement when the mapping is configured as "Set based"). If the user expects most of the operations to be inserts, the user should choose the INSERT/UPDATE loading type and vice versa. Pure UPDATE and DELETE are inefficient and should be used sparingly. • External table vs. SQL Loader: Warehouse Builder still retains the possibility of using SQL Loader to rapidly load flat files into the

38 Enhancing ETL Performance with Warehouse Builder
database. When deciding whether to use external tables or SQL Loader mappings, the user should find the right trade-off between the conveniences of the external table (that can be used in any mapping operation as a normal read-only table) and the necessity to load the flat file data as fast as possible into a real database table. This might be a better solution for very large flat files, because external tables have a number of limitations (they cannot be indexed, keys cannot be created, etc.), which can make them inefficient when included in mappings with more complex operators (joins, filters, etc.). Warehouse Builder provides design capabilities for indexes, partitions, and allowing for detailed configuration of physical storage and sizing properties on objects. 7.1 Indexing Indexes are important for speeding queries by quickly accessing data processed in a warehouse. You can create indexes on one or more columns of a table to speed SQL statement execution on that table. You can create UNIQUE, B-tree, Bitmap (non-unique), Function-based, Composite, and Reverse indexes in Warehouse Builder. Bitmap indexes are primarily used for data warehousing applications to enable the querying of large amounts of data. These indexes use bitmaps as key values instead of a list of row IDs. Bitmap indexes can only be defined as local indexes to facilitate the best performance for querying large amounts of data. Bitmaps enable star query transformations, which are cost-based query transformations aimed at efficiently executing star queries. A prerequisite of the star transformation is that a bitmap index must be built on each of the foreign key columns of the cube or
cubes. When you define a bitmap index in Warehouse Builder, set its scope to LOCAL and partitioning to NONE. Local indexes are likely to be the preferred choice for data warehousing applications due to ease in managing partitions and the ability to parallelize query operations. Another widely used performance enhancement method is dropping the indexes of the target object before the loading process and recreating the indexes after the load is completed. This can significantly improve the performance, because indexes will not have to be maintained during the load. You need indexes only when using reporting tools to query the loaded data. There is no switch or check box option that can enable you to switch the indexes on or off as required. To achieve this, the user will have to create a pre-mapping that will invoke a PL/SQL function or procedure that drops the target indexes and a post-mapping process that will invoke PL/SQL code that will recreate these indexes. 7.2 Constraints Management Constraints management can also dramatically affect performance of "Set based" mappings. If the Enable Constraints property is checked, Warehouse Builder will leave the target object constraints (foreign keys or any other constraint) enabled during the load. This might make the load dramatically slower because the constraints will have to be checked against every row that is loaded into the target. If this property is unchecked, on the other hand, the target foreign key constraints will be disabled before the beginning of the load and re-enabled (in parallel) after the load is completed. This will make the load faster, but if rows that do not conform to the constraints are loaded, the affected rows in the target object will be marked as invalid during the constraint re-activation. The user will then have to manually correct these rows whose row IDs will be logged in the
Database Systems Journal vol. IV, no. 2/2013 39
run-time audit error table or, if specified, in an exceptions table. For “Row based” mappings, the constraints will be active no matter what the setting is for this parameter. 7.3 Partitions Partitions enable you to efficiently manage very large tables and indexes by dividing them into smaller, more manageable parts. Use partitions to enhance data access and improve overall application performance, especially for applications that access tables and indexes with millions of rows and many gigabytes of data [2]. Partitioning greatly enhances the manageability of the partitioning table by making the backups, restores, archives, etc. much easier to perform. Partitioning can also enhance the performance by giving the user more control on how to optimally configure the physical parameters of the table. If there is a single large table, it will physically reside in a single Oracle tablespace and probably in a single data file. The user will not have control over where this file is physically located on a disk or array of disks. If a parallel operation is performed on this table and the table resides on a single disk or mostly on a single disk, the disk and its controller will represent a bottleneck for any activity on this table. What use is it having several parallel processes trying to load data into the table if they all have to write or read sequentially through a single disk controller? You can define various types of partitions in Warehouse Builder. Range partitioning is the most common type of partitioning and is often used to partition data based on date ranges. For example, you can partition sales data into monthly partitions. When you design mappings using a table that is range partitioned on a date column, consider enabling Partition
Exchange Loading (PEL), already discussed earlier. Specifying Partition Tablespace Parameters If the table is partitioned, the user can assign every partition to a different tablespace and every tablespace to a different disk, spreading the data evenly across disks. This will make it possible for the server processes to balance the processing activity among themselves evenly, thus making the parallel execution much more efficient. If you neglect to specify partition tablespaces, Warehouse Builder uses the default tablespaces associated with the table and the performance advantage for defining partitions is not realized. You need to specify this when the partition type is one of the following: HASH BY QUANTITY, RANGE-LIST, RANGE-HASH, or RANGE-HASH BY QUANTITY. You can also specify the Overflow tablespace list. 7.4 Parallelism The Warehouse Builder run-time environment has been designed for parallel processing. This implies that users running the tool on a platform with more than two processors will benefit the most from parallel processing. If the object is configured as parallel, Warehouse Builder will make sure that when the object is deployed, it will be created for parallelism by adding the parallel option (which is checked by the database engine when a statement is run against the object) to the CREATE statement (during the first table deployment CREATE TABLE … PARALLEL… will be executed). For any query executed against this table, the database engine will attempt to launch multiple parallel processes to enhance query performance. Although this can significantly enhance query performance for the reporting users, the downside of this might be the possible extensive use of resources (especially memory) that parallel queries require in a multi-user, high-query-volume environment.

40 Enhancing ETL Performance with Warehouse Builder
With objects enabled for parallel access, you need to set the Enable Parallel DML option for the mappings to take full advantage of parallelism. For target objects in the mappings, Warehouse Builder by default adds the PARALLEL hint. If you enable Parallel DML, Warehouse builder will always generate the ALTER SESSION ENABLE PARALLEL DML statement in a PL/SQL mapping. The implication is that Warehouse Builder will always attempt to execute the mapping in parallel if the objects involved are enabled for parallelism. • If you have only one CPU, do not use Parallel DML. It will lower performance by launching multiple processes that share the same CPU, requiring process context switches that involve huge overhead. • If you have two CPUs, Parallel DML might be useful. • If you have a dual-core CPU, Oracle does not yet have a recommendation, as the implications are currently being studied. You can set tablespace properties (for indexes as well as objects) at various levels: • User level: If no tablespace is specified, the objects go into the tablespace assigned to the user you are deploying to. When you create your target users, you have the option of specifying the tablespaces to be used. • Module level: To allow overriding specification of the tablespaces (index and object) you can set this at module level, all generated objects will take this property unless overridden at the object level. In the Configuration Properties window for the specific module, you can set the Default Index Tablespaces and Default Object Tablespaces property. • Object level: Allows specific control per object for both indexes and objects. In the Configuration Properties window for the
specific object, you can set the Tablespace property. 8. Conclusion The complexity of the information systems used in a company has grown along with its expansion and increase in its volume of sales or along with the increase in their number of employees. So, the gathered information is useful only if it is of dependable quality and is delivered at the right time. In the same time, the need of software integration comes as a must for data that need to be integrated and the creation of complex, robust, efficient and finally, complete software solutions for data warehouses [1]. Configure your ETL and schema design performance parameters and use Warehouse Builder to create and configure indexes, partitions, and constrain are important matters to be applied for the data warehouse system performance. References [1] Manole Velicanu, Daniela Liţan, Larisa
Copcea (Teohari), Mihai Teohari, Aura-Mihaela Mocanu (Vîrgolici), Iulia Surugiu, Ovidiu Răduţă, Ways to increase the efficiency of information systems, The 10th WSEAS International Conference on Artificial Intelligence, Knowledge Engineering and Databases (AIKED ’11), University of Cambridge, UK, 2011, vol Recent Researches in Artificial Intelligence, Knowledge Engineering and DataBases, pp. 211-216, ISSN: 1792-8117/1792-8125, ISBN: 978-960-474-273-8, (ISI Thomson).
[2] N. T. Nguyen, M. T. Le, J. Swiatek, Intelligent Information and Database Systems, Springer-Verlag, Berlin Heidelberg, 2010.
[3] B. Griesemer, Oracle Warehouse Builder 11g Getting Started, Packt Publishing, 2009.
[4] www.otn.oracle.com

Database Systems Journal vol. IV, no. 2/2013 41
Manole VELICANU is a Professor at the Economic Informatics Department at the Faculty of Cybernetics, Statistics and Economic Informatics from the Academy of Economic Studies of Bucharest. He has graduated the Faculty of Economic Cybernetics in 1976, holds a PhD diploma in Economics from 1994 and starting with 2002 he is a PhD coordinator in the field of Economic Informatics. He is the author of 22 books in the domain of economic informatics, 64 published articles (among
which 2 articles ISI indexed), 55 scientific papers published in conferences proceedings (among which 5 papers ISI indexed and 7 included in international databases) and 36 scientific papers presented at conferences, but unpublished. He participated (as director or as team member) in more than 40 research projects that have been financed from national research programs. He is a member of INFOREC professional association, a CNCSIS expert evaluator and a MCT expert evaluator for the program Cercetare de Excelenta - CEEX (from 2006). From 2005 he is co-manager of the master program Databases for Business Support. His fields of interest include: Databases, Design of Economic Information Systems, Database Management Systems, Artificial Intelligence, Programming languages.
Larisa COPCEA (TEOHARI) has graduated the Academy of Economic Studies (Bucharest, Romania), Faculty of Cybernetics, Statistics and Economic Informatics in 2006. She holds a Master diploma in Databases - Support for business from 2008 and in present she is a Ph.D. Candidate in Economic Informatics with the Doctor’s Degree Thesis: Advanced management of information in data warehouses. Her research activity can be observed in the following achievements: 6
proceedings (papers ISI proceedings), among witch: • “Ways to Increase the Efficiency of Information Systems”, Proc. of the 10th WSEAS
International Conference on Artificial Intelligence, Knowledge Engineering and Databases (AIKED ’11, University of Cambridge), February 20-22, 2011, Cambridge, UK;
• „Some Information Technologies to Improve the Performance of an ERP System”, Proc. of the 5th WSEAS International Conference on Computer Engineering and Applications (CEA '11), January 29-31, 2011, Puerto Morelos, Mexico;
• “XML Authoring Tool”, Proc. of the 4th European Computing Conference (ECC'10,University Politehnica of Bucharest), April 20-22, 2010, Bucharest, Romania;
and 3 articles published in scientific reviews , among witch: • “Technologies for Development of the Information Systems: from ERP to e-Government”,
International Journal of Applied Mathematics and Informatics, issue 2, vol. 5, 2011. Her scientific fields of interest include: Data warehouse, Databases, Database Management Systems, High availability solutions, Information Systems and Economics.

42 A comparative Review of Extraction, Transformation and Loading Tools
A comparative Review of Extraction, Transformation and Loading Tools
Amanpartap Singh PALL, Dr. Jaiteg Singh KHAIRA
School of Information Technology, APJIMTC, Jalandhar Chitkara Institute of Engineering and Technology, Rajpura
[email protected], [email protected]
Business today forces the enterprises to run different but coexisting information systems. However, data warehousing enterprises have a dilemma of choosing the right ETL process and the right ETL tool for their organization as one wrong step or choice may lead to a series of losses both monetarily and by time, not to mention the amount of laborious work that the workers would put in. The organization can choose from a variety of ETL tools but without exploring or the knowledge of their features this would again result in a bad decision making process. In this paper, we have tried to present a comparative review of some of the leading ETL tools just to acquaint the users with its features and drawbacks. Keywords: ETL tools, tool comparison
Objective The purpose of our research paper is to
provide a comparative review of the various features of the leading ETL tools (Table 2). Furthermore, we are evaluating these ETL tools based on some criteria which we think are suitable for an ETL tool to have. Through this comparison we have tried to provide an upfront knowledge to the users as to what could be the alternatives amongst the market leaders. No doubt there are other tools also available, but we have chosen only the market leaders as per Gartner Report 2010. We have carefully chosen the market leaders, the challengers e.g. the Microsoft SQL Server IS and some open source products like Pentaho and CloverETL. Research Method To conduct our research we needed to create a framework of criteria (Table 1) which would allow us to compare the ETL tools against each other. We conducted research in different survey reports by leading groups, articles, journals and books and websites. Upon analysing these
Reports, whitepapers, journals, website we successfully revealed the criteria and its categories which will allow us to compare. Introduction Data integration involves practices, architectural techniques and tools for achieving consistent access to and delivery of data across a wide range of subject areas and structure types in an enterprise. Data integration capabilities are at the heart of the information-centric infrastructure and will power the frictionless sharing of data across all organizational and system boundaries. There is no doubt that the investment in data integration is increasing day by day and has started to be a part of the budget that the organization sets aside each year. Specifically, market demand is becoming more diversified, as buyers procure tools with intent to support multiple use-cases. The traditional focus of activity has been in support of business intelligence initiatives. While this remains the most significant use-case driving demand, many others have emerged. Further, synchronization of data between
1

Database Systems Journal vol. IV, no. 2/2013 43
operational applications and across enterprise boundaries (between trading partners or between on-premises and cloud-based applications) also represent areas of growth. These requirements have generally been met via point-to-point interfaces supported by data integration tools. With the on-going evolution of the data integration tools market, separate and distinct submarkets continue to converge, both at the vendor level and the technology level. This is being driven by buyers' demands. Specifically, organizations increasingly acknowledge a diversity of data integration problem types that are supported by equally diverse architectural styles and patterns for data delivery. It is also being driven by vendors' actions — specifically, vendors in individual data integration submarkets organically expanding their capabilities into neighbouring areas, and acquisition activity bringing vendors from multiple submarkets together. The result is a progressively maturing market for complete data integration tools that address a range of different data integration styles based on common design tooling, metadata and runtime architecture. Categories of ETL tools ETL tools may be categorized into two broad categories
a) Hand-Coded ETL Process: ETL tools that are in-house developed in Perl, COBOL, C, and PL/SQL to e extract data from multiple source files, transform the data, and load the target databases. The programs written using this method were lengthy and hard to document. The ETL developer has to use different programming languages to perform the ETL task, such as; Perl scripts for extracting the data from source systems, performing transformations, and SQL Loader and PL/SQL Bulk procedures were used to load the data in target warehouse.
Hand-Coded ETL tools have the advantage that the metadata created can be managed directly and they give the flexibility to the developer to manipulate to new needs and of-course unit testing is much easier. However, its limitations are also there, to cater to the continuous changes in the high volumes of data generated through various sources the programs need to be modified frequently which causes a burden on the overall project. And moreover, changes done at the metadata needs tables to be modified as well which in hand-coded is stored separately, so changes are done manually. And lastly the hand-coded ETL are generally slow in execution as they are single threaded whereas the modern tool-based tools are multiple threaded and run on high speed engines.
b)Tool-Based ETL: Since, the hand-coded tools involve overheads and are slow in execution hence many vendors developed these tools to be purchased by the organizations. These ETL tools started from simple extractions on mainframes to target database and now-a-days they are available in full GUI’s with added functionalities and performances. These are the ETL tools of today that provide transformation features, support multiple input or output database or flat files, multi-dimensional designs, surrogate key generation, various transformation functions and native database or O/S utility. They have internal metadata repositories that may be different from the data warehouse metadata repository. They eliminate the overhead of developing and maintaining the complex routines and transformations in ETL workflows. Also, these tools are providing user friendly GUI’s which enables the developer to work without under going through training. These tools also have the features such as monitoring, scheduling, bulk loading, incremental aggregation, etc.

44 A comparative Review of Extraction, Transformation and Loading Tools
The ETL tools today can further be classified into four subcategories
(i) Pure ETL tools: These products are independent of the database and the Business Intelligence tool with which it will be used. The companies do not rely on any other product for the functionalities offered by them and they also allow migration to different database without changing the integration process. (ii) Data base integrated: These products are supplied as an option when you buy the database software and some of the functionality is built into the database and not available separately in the ETL tool itself. (iii) Business Intelligence Integrated: These are the products from the same supplier as the BI software .In many cases these re separate products and the supplier
will claim that they can be used independently of the BI tool. (iv) Niche Product: These are the products that don’t fit well into any of the above mentioned groups, but still have considerable ETL functionality in them. Research Method The ETL tools selected for the comparative review are only the market leaders although there are so many tools, but selection of all of them would be done in a step by step manner since only peers should be compared with each other. To compare these tools a criteria or basis on which these are compared should be a universal one. To come to a universal one we reviewed various journals, articles, books and more importantly the reports that are generated from time to time to remove any bias.
Table 1. Various criteria for the comparative review
Sr. No Criteria
1 Sales in 2 Standalone or Integrated 3 Platforms 4 Version 5 Engine based or code generated 6 SaaS 7 Ease-of-use 8 Reusability 9 Debugging 10 Corrections to syntax errors 11 Compiler/ Validate 12 Separate Modules 13 Data mechanisms 14 joined tables as source 15 address information support 16 native connections 17 real time connections 18 Scheduler 19 Pivoting/de-pivoting 20 SMP 21 MPP 22 Grid

Database Systems Journal vol. IV, no. 2/2013 45
23 Partitioning 24 CWM support 25 Integration batch-real time 26 Package / enterprise applications
Source: The Data Integration & ETL Product Survey 2013, Passionned Group The comparative review has been done only for these tools:
Table 2. The products\tools for which the above criteria has been reviewed
Sr. No Organization Product Name Current Version
1 IBM Information Server 8.1
2 Informatica PowerCenter 9.5 3 Talend Talend Open Studio for Data
Integration 5.2
4 Oracle Data Integrator 11.1.1.5 5 Microsoft SQL Server Integrated Services 10 6 SAS Data Integration Studio V4.4 7 Kettle Pentaho Data Integration 4.1 8 CloverETL CloverETL 3.1.2
Comparative Review of the ETL tools
Table 3. Comparative review of leading ETL tools on different criteria
Criteria IBM
Information Server
Informatica PowerCenter
Talend Open Studio
Oracle Data
Integrator
SQL Server
Integration Services
SAS Data Integration
Studio Pentaho
Clover ETL
Sales in 1996 1996 2007 1999 1997 1996 2006 2005
Standalone or Integrated
Standalone Standalone Standalone Standalone Standalone Standalone Standalone Standalone
Platforms 6 5 7 6 1 8 4 7
Version 8.1 9.5 5.2 11.1.1.5 10 v4.21 3.2 2.9.2
Engine based or code generated
Both engine based code
generated code
generated Both
code generated
engine based
Engine based
SaaS Yes yes no yes - No not
standalone no
Ease-of-use high in logical orders
yes yes highly user
friendly Highly highly no no
Reusability Yes yes yes yes Yes yes yes yes
Debugging Yes yes yes yes Yes yes no no
Corrections Yes half yes yes - yes no yes

46 A comparative Review of Extraction, Transformation and Loading Tools
Criteria IBM
Information Server
Informatica PowerCenter
Talend Open Studio
Oracle Data
Integrator
SQL Server
Integration Services
SAS Data Integration
Studio Pentaho
Clover ETL
to syntax and field names Compiler/ Validate
Yes half yes half Yes yes yes yes
Separate Modules
No yes yes no
yes no yes
Data mechanisms
logging+triggers logging message
queuing + triggers
message queuing
+logging+ triggers
message queuing + logging + triggers
message queuing
no message queuing+ triggers
joined tables as source
Yes no yes yes No yes no no
address information support
All all all all
third party all
native connections
41 50 35 22 4 18 20 7
real time connections
2 6 3 3 2 3 3 3
Source: The Data Integration & ETL Product Survey 2013, Passionned Group
Table 4. Comparative review of leading ETL tools on different criteria
Criteria IBM
Information Server
Informatica PowerCenter
Talend Open Studio
Oracle Data
Integrator
SQL Server
Integration Services
SAS Data Integration
Studio Pentaho
CloverETL
Scheduler yes yes yes yes yes yes yes yes
Pivoting/de-pivoting
yes yes yes yes yes yes yes yes
SMP yes yes yes yes yes yes yes yes
MPP no no yes no no yes yes yes
Grid yes yes yes yes no yes yes yes
Partitioning yes yes no no yes yes yes yes
CWM support
half yes yes yes no yes no yes
Integration batch-real time
yes yes yes yes no yes half yes
Package / enterprise applications
8 7 9 8 1 5 2 0
Source: The Data Integration & ETL Product Survey 2013, Passionned Group
Database Systems Journal vol. IV, no. 2/2013 47
Description and Comparison Here, we have done the comparison on the criteria mentioned above and an overall description of the tools, this would bring out the clear picture as to which tool is best in which type of criteria while the criteria comparison would suggest which tool is the best in a particular criteria. The following are the description and the comparison: 1. Criteria-wise description and comparison
As can be seen from Table 1 companies whose sales started in 1996 like Information Center by IBM to some of the newer companies like Talend Open Studio have been included for the comparative analysis. Though all the ETL tools given above are standalone tools however they have they have their own scoring points. The comparative analysis by each criterion is given below: Platforms: This criteria signifies how many platforms are supported by the ETL product e.g Windows (all versions have been counted as one), Linux, Solaris etc. As can be seen Microsoft SQL Server has the least platform support i.e. Windows while SAS Data Integrator scores here by providing support to 8 different types of platforms which is indeed a plus point. Engine Based or Code generated: While Both Information Center and SQL Server are both engine based and code generated all others products are either code generated or engine based. SaaS: This criterion has been included to see whether or not the product is available as software as a service and it was found that while Information Center, PowerCentre and Oracle provide this facility others do not. This generally means these products can be a part of the cloud computing the latest facility being provided by organizations. This is a major plus point for these products and perhaps
one of the reasons that they are so widely being used today. Ease-of-Use: Ease of use includes how easy is it to use the product, how quickly can it be learnt, number of training days required for the developer and the user to learn the product , screen element designs , GUI interface , and most importantly does it work the way ETL tool should work. Oracle Data Integrator has been found to be the most users friendly followed by SQL Server and SAS Integrator. However, that does not mean that others are not user friendly it’s just that these three tools and Oracle Data Integrator in particular conforms to the above said criterion more than the others. Reusability: How are the components reused whether they are parameter driven, does it support user defined functions to be available to other programs. All the above tools are very much conforming to this criterion. Debugging: Apart from the Pentaho and CloverETL all others provide a good debugging facility either step by step or row by row. Corrections to syntax and field names: Pentaho, SQL Server and Informatica does not provide any automatic suggestions if there is an error in syntax or field names whereas this is available in all other tools. Compiler\validate: How easy it is to locate errors and if any are they highlighted in the code at a click. This facility is available with every tool. Separate Modules: Usually the tool is made up of at least two modules the real time module and the batch module. Now can they be bought separately? Informatica, Talend, SAS and CloverETL has got this provision whereas this is not the case with Oracle Data Integrator, IBM Information center, SQL Server and Pentaho. Data Mechanism: The data changes when its extracted and transformed .So the question is how is it recognized i.e. how is

48 A comparative Review of Extraction, Transformation and Loading Tools
the changed data recognized. IBM information Centre uses triggers and the logs and journal entries to recognize the changed data while Informatica does it with only the logs and journals. Talend and CloverETL do it with the message queuing and database triggers the Oracle Data Integrator and SQL Server leaves no options to neglect such changes as it incorporates all the three techniques. Pentaho stands out in this one as it does not provide this facility. Joined tables as source: Can you join two tables in a graphical manner letting the database execute the join as opposed to letting the ETL tool join the tables. Informatica PowerCenter, SQL Server Integration, Pentaho and CloverETL does not provide this which is a major drawback. Address information support: All types of address information are supported by all of the above tools. Native connections: How much and which native connections does the ETL tool support? (ODBC, OLE DB and flat files excluded).Informatica PowerCenter provides the maximum native connections to the various database sources thus extraction from these sources becomes much more efficient. The IBM Information Centre and Talend Open Studio is not lacking as it follows the Informatica very closely. SQL Server lags here as it can only provide only four types of native connections. Real time connections: How many and which type of message queuing products can the tool connect to? Here also the informatica PowerCenter takes the cake providing the maximum connections. Scheduler: whether or not there is an ability in the tool to schedule jobs based on interdependencies. Or in other words is the scheduler capable of handling dependencies. All the tools these days support scheduling functionality because it is regarded as a basic necessity for the ETL
tool to schedule jobs. The tools taken for comparison does not lack behind in this criteria as they all support it. Pivoting/de-pivoting: Is it possible to transform denormalised data, putting data in the column names, into rows and the other way around, transform (highly) normalised data to de-normalised data, putting data in the columns. Again this facility is available within each tool. SMP: Is Symmetric Multiprocessing supported? Standard in Windows NT and UNIX. The processors in SMP systems share their internal and external memory. SMP is available in all the above mentioned tools. MPP: Every processor in a MPP system has its own internal and external memory and database, allowing high performance to be achieved. These databases should be synchronized. From the ETL tools taken up for the review only Talend, SAS, Pentaho and CloverETL possess this functionality. Grid: Can an ETL process run on a ‘grid’ of computers or servers? Only SQL Server Integrated Services fails to provide the grid facility whereas all others do. Partitioning: Is it possible to partition based on, for example, product codes, to determine on which machine or processor the data has to be processed? Talend and Oracle does not let the partition to take place, all others does. CWM support: Is the ETL tool CWM-compliant, in other words does it support the Common Warehouse Meta Model? If you are looking for a common warehouse meta model then IBM Information Server, SQL Server Integrated Services and Pentaho do not provide you this facility. Integration batch-real time: Is it possible to define within the ETL tool process flows moving and transforming data in real-time and in batch? While the SQL Server Integrated Services does not provide this and the Pentaho provides this up to a certain extend all others provide full integration batch-real time support.

Database Systems Journal vol. IV, no. 2/2013 49
Package / enterprise applications: How many packages / enterprise applications can the tool read meta data from with one click of the mouse (for example SAP, Siebel, Peoplesoft, JD Edwards, Baan). Talend can read 9 which the maximum followed by IBM Information Server and Oracle Data Integrator which can read 8, followed closely by Informatica PowerCenter which can read 7 and poorest of all is the CloverETL and which can read 0 packages applications. 2. Tool-wise description
IBM Information Server It provides a great flexibility and is directed towards the market with a vision in mind with common metadata platform. The Information Server provides high level of satisfaction from clients and a variety of initiatives. Though it is easy to use but it becomes very heavy because of the data involved is in GBs and the version 8.x requires a lot of processing power. Informatica PowerCenter Informatics PowerCenter offers a so solid technology, straightforward learning curve, ability to address real-time data integration schemes and is highly specialized in ETL and Data Integration. It has a consistent track record with most substantial size and resources on the market of data integration tools vendors. Talend Talend is an open-source data integration tool but not a full BI suite. It uses a code-generating approach. Uses a GUI. It has data quality features: from its own GUI, writing more customised SQL queries and Java. Microsoft SQL Server Integration Services SQL Server Integration Services (SSIS) provides ease and speed of implementation with standardized data integration, real-time, message-based capabilities which are relatively low cost and provide an excellent support and distribution model.
However, it does not support non-Windows environments. Oracle Data Integrator There is no doubt as to why it is being regarded as one of the leaders in the ETL markets; it’s because of its tight connection to all Oracle data warehousing applications and the tendency to integrate all tools into one application and one environment. SAS Data Integrator SAS Data Integrator provides great support and most of all very powerful data integration tool with lots of multi-management features. It is great support for the business-class companies as well for those medium and minor ones. It can work on many operating systems and gather data through number of sources – very flexible. Pentaho(Kettle) Pentaho is a commercial open-source BI suite that has a product called Kettle for data integration. It uses an innovative meta-driven approach and has a strong and very easy-to-use GUI. It has a stand-alone java engine that processes the jobs and tasks for moving data between many different databases and files. CloverETL CloverETL provides data integration, Workflow automation through job flows. It can transform the data at ease. It is a visual tool that replaces everyday scripting and provides full control of the data flows and processes. Conclusion The research has given us a conclusion that without ETL products\ tools the analytical reports are not possible and ETL in itself is the basic foundation for any Business Intelligence (BI) tool used by the organization. Since, ETL involves three-part work that of extracting data from the source, transforming the data into a unified format and lastly loading this unified data into a data warehouse. In our comparison of ETL software tools we find that Oracle

50 A comparative Review of Extraction, Transformation and Loading Tools
Data Integrator and IB Information Server are the ones which satisfy needs of large enterprises and other tools mentioned here have their own aspects to be implemented. Most of the upcoming tools are slow and have very few functions to satisfy the needs of the larger organizations but, they can’t be ruled out for semi-large or small enterprises where the only compromise would be on speed and still one would get lots of other functionalities. Some of the aspects we have left out and have not included in our criteria one being the price. Since , every organization can only decide upon buying the product by evaluating the functionalities and the benefits expected to be reaped from it .Also not all products guarantee to provide all functionalities and its always a compromise as to what should work for one may not work for the other firm, so, although we have given our review and evaluation on these tools yet , the enterprise can decide by attaching a weight to the criteria and external variables that the enterprise feels are important and then decide which tool to go with. Limitations and Future Scope The research has been done by analysing reports, articles, journals and gathering information from the vendor websites. The research was not conducted by testing the products with real world data. We were not able to evaluate the tools in a “hands on” manner and so the criterion followed to evaluate the tools was based on the reports that we had gone through. We have based our criteria of evaluation of other market researchers because we don’t have a strong foundation in BI as yet and moreover the cost involved to do so goes into thousands of dollars. Also, ETL is only a part of the BI suite offered by the vendors. Price of the product was also not included because most of the organizations have not revealed its pricing to remain competitive and many solutions are tailored to fit an organization’s specific needs via quotes.
Many other criterions has been left out because of space constraints. Future scope involves giving weight to the criterions and then measuring and analysing the features of all the ETL products rather than just the leaders. References [1] Lombard, H., Sweiger, M., Madsen,
M., & Jimmy Langston, J. (2002). Clickstream Data Warehousing. John Wiley & Sons.
[2] Madsen, M. (2004, October). Criteria for ETL Product Selection. Retrieved 11 06, 2013, from InfoManagement Direct: http://www.information-management.com/infodirect/20041001/ 1011217-1.html?pg=1
[3] Larson, B. (2008). Delivering Business Intelligence with Microsoft SQL Server. New York:McGraw-Hill Osborne Media.
[4] Levin Jonathan (2008) Open Source ETL tools vs Commerical ETL tools retrieved on 10-6-2013 from http://www.jonathanlevin.co.uk/2008/03/open-source-etl-tools-vs-commerical-etl.html
[5] Friedman, T., Beyer, M. A., & Bitterer, A. (2008). Magic quadrant for data integration tools. Gartner RAS Core Research Note G, 207435
[6] Friedman, T., Beyer, M. A., & Bitterer, A. (2008). Magic quadrant for data integration tools. Gartner RAS Core Research Note G, 207435
[7] Gartner (2010) Friedman , Mark A. Beyer, Eric Thoo, Magic Quadrant for Data Integration Tools retrieved on 12 06 2013 from http://www.virtualtechtour.com/assets/GARTNER_DI_MQ_2010_magic_quadrant_for_data_inte_207435.pdf.
[8] Microsoft (2012) SQL Server Integration Services retrieved on 12 06 2013 from

Database Systems Journal vol. IV, no. 2/2013 51
http://msdn.microsoft.com/en-us/library/ms141026.aspx CloverETL http://www.cloveretl.com/products retrieved on 11 06 2013.
[9] IBM Information Server IBM InfoSphere Information Fast Track Your Information Server for Linux, Unix and Windows retrieved on 11 06 2013 http://www-01.ibm.com/software/in/data/integration/info_server/
[10] Oracle Data Integrator retrieved on 12 06 2013 from http://www.oracle.com/technetwork/middleware/data-integrator/overview/index.html
[11] Oracle Data Integrator retrieved on 12 06 2013 from http://www.oracle.com/us/products/middleware/data-integration/dataservice-integrator-ds-168223.pdf
[12] Passionned Group (2013) The Data Integration & ETL Product Survey 2013
[13] Pentaho Corporation (2013) Pentaho Data Integration retrieved on 12 06 2013 from http://www.pentaho.com/press-room/releases/20100210_pentaho_and_swissport_cuts_costs_of_flying/
[14] Zode, M. The Evolution of ETL. Retrieved on 6/06/2013from http://hosteddocs.ittoolbox.com/mz071807b.pdf
[15] Pentaho Corporation (2013) Pentaho Data Integration retrieved on 12 06 2013 from http://www.pentaho.com/explore/pentaho-data-integration/
[16] Pentaho Pentaho Data Integration (Kettle) retrieved on 12 06 2013 from http://kettle.pentaho.com/
[17] SAS Data Integration Studio SAS Products retrieved on 12 06 2013 from http://support.sas.com/software/products/etls/
[18] Talend Open Studio Talend Open Studio retrieved on 12 06 2013 from http://www.talend.com/products/talend-open-studio