open-file report 91-256-a
TRANSCRIPT

USGS-OFR-91 -256-A USGS-OFR-91 -256-A
U.S. DEPARTMENT OF THE INTERIOR
U.S. GEOLOGICAL SURVEY
PRINCIPAL FACTS FOR 133 GRAVITY STATIONS, WITH COLOR MAPSOF BOUGUER AND ISOSTATIC RESIDUAL GRAVITY ANOMALIES ON
THE WINNEMUCCA 1° BY 2° QUADRANGLE, NEVADA
By
Robert F. Sikora1
1991
91-256-A Principal facts documentation 91-256-B Gravity data on diskette
Open-File Report 91-256-A
This report is preliminary and has not been reviewed for conformity with U.S. Geological Survey editorial standards or with the North American Stratigraphic Code. Any use of trade, firm or product names is for descriptive purposes only and does not imply endorsement by the U.S. Government.
Menlo Park, California1991
1 Menlo Park, Calif. 94025

Copies of this Open-File Report
may be purchased from
U.S. Geological Survey
Books and Open-File Reports Section
Box 25425, Federal Center
Denver, CO 80225
PEPAYMENT IS REQUIRED
Price information will be published
in the monthly listing
New Publications of the Gelological Survey
FOR ADDITIONAL ORDERING INFORMATION
CALL: (303) 236-7476

Open-File Report 91-256-A
Principal facts for 133 gravity stations, with color maps of Bouguer and isostatic residual gravity anomalies on the Winnemucca 1° by 2°
quadrangle, Nevada
by
Robert F. Sikora
Part A of this report is a paper copy describing the base stations, datum, principal facts for 133 new gravity stations, reduction techniques, and references. Sixteen 30 minute by 30 minute plots of Bouguer and isostatic anomalies are included at a scale of 1:250,000. Page-size color contour maps of both Bouguer and isostatic anomalies accompany this report. (It does not list older data.) 40 p.
Open-File Report 91-256-B
Principal facts for gravity stations on the Winnemucca 1° by 2°quadrangle, Nevada
by
Robert F. Sikora
Part B is a 3 1/2 inch diskette, double-sided, high-density (1.44 MB), containing files in ASCII format. Requirements for part B: IBM PC or compatible, DOS v. 2.0 or higher, with a 3 1/2 inch disk drive or a MACINTOSH with a Super Drive and Apple File Exchange software to convert from PC to MAC. The three files contained on the diskette include:
1. readme.win - This file contains an explanation of the diskette format, including accuracy codes and a disclaimer statement.
2. new.iso - This file contains the principal facts for 133 gravity stations obtained in 1985.
3. old.iso - This file contains the principal facts of all the previous gravity stations on the Winnemucca 1 ° by 2° quadrangle.

Page Abstract ................................................... 1Introduction ............................................... 2Gravity meter and calibration .............................. 3Base stations .............................................. 4Gravity datum.............................................. 4Gravity reduction.......................................... 4Principal facts ............................................ 7Additional information..................................... 7Acknowledgments ............................................ 7References ................................................. 8Appendix (information about available diskette) ........... 40
ILLUSTRATIONSPage
FIGURE 1. Index map........................................ 22. Geographic areas map............................. 3
3A. Gravity base station - Winnemucca, Nevada. ....... 53B. Gravity base station - Battle Mountain, Nevada... 6 4. Index of gravity station location maps .......... 14
5A. Map of gravity station locations.in the SonomaRange ........................................... 15
5B. Map of gravity station locations in the EdnaMountain, Pumpernickle Valley, North Peak areas near Battle Mountain............................ 16
5C. Map of gravity station locations in the Fish Creek Mountain, Fish Creek Basin, and Reese River Valley .................................... 17
5D. Map of the gravity stations in the Reese RiverValley area ..................................... 18
5E. Map of the gravity station locations in theBoulder Valley and Tuscarora Mountains area..... 19
6. Index of Bouguer gravity anomaly maps ........... 207A-H. Bouguer gravity anomaly maps A-H............. 21-28
8. Index of isostatic residual gravity anomalymaps ............................................ 29
9A-H. Isostatic residual gravity anomaly maps A-H.. 30-3710. Complete Bouguer gravity anomaly map of Win-
nemucca 1° by 2° quadrangle [in color] .......... 3811. Isostatic residual gravity anomaly map of Win-
nemucca 1° by 2° quadrangle [in color] .......... 39
TABLESPage
TABLE 1. Gravity stations and their corresponding bases.... 42. Explanation of principal facts format ............ 103. Explanation of accuracy codes .................... 114. Principal facts for 133 Winnemucca gravity
stations......................................... 12
ABSTRACTIn September 1985, 133 new gravity measurements were made in the geographic area covered by the Winnemucca 1° lat. by 2° long, quadrangle, north-central Nevada. This quadrangle extends from 40° to 41° N lat. and from 116° to 118° W long. The purpose was to improve gravity coverage in the Sonoma Ranges, north slope of Battle Mountain, Fish Creek Basin, central Reese River Valley and eastern Boulder Valley. LaCoste and Romberg gravity meter G-161 was used to make the measurements. The data were reduced to complete Bougueranomaly values assuming a terrain density of 2.67 g/cm and terrain corrected to 166.7 km from the station. Isostatic reduced gravity anomaly values were computed assuming an Airy-Heiskanen isostatic model utilizing a crustal model with a sea-level thickness of 25 km, a crustal density of 2.67
3 3g/cm and a lower crust-mantle density contrast of 0.4 g/cm . The principal facts for each gravity station were included in a table and updated isostatic and Bouguer anomaly 30 minute by 30 minute maps at 2 mGal have been included showing loca tions of both new and previous gravity stations (1:250,000 scale). Page-size color contour maps of Bouguer gravity and isostatic residual gravity were also included.

INTRODUCTIONIn September 1985, 133 gravity stations were established on the Winnemucca 1° lat. by 2° long, quadrangle, Nevada, which ex tends from 40° to 41° lat. and from 116° to 118° long (figure 1) . This report is intended to document the principal facts, ac curacies, and locations as well as presenting updated complete Bouguer gravity and isostatic gravity maps.
Gravity coverage was added to the following geographic areas (fig ure 2) :
W=Winnemucca BM=Battle Mtn.
FIGURE 1. Index map (Wagini, me) (A.) Sonoma Range, Humboldt County.
Gravity measurements were added in this area to improve control of the isostatic residual gravity step from Grass Valley to the Sonoma Range (see figure 9A). The additional measurements helped to fill a rather extensive gap in coverage around the Sonoma Range and may be useful in better understanding the nature of the isostatic balance (figures 7A, 7B, 9A and 9B).
(B.) North slope of Battle Mountain (North Peak), Humboldt County.
Improved gravity coverage on the north slope of Battle Mountain should help determine the extension of a pediment below the surface, as well as improve the overall density of stations between North Peak and Antler Peak. Gravity mea surements were made at a number of locations of previous mea surements, which helped to confirm the quality of the previ ous gravity measurements (figures 7B and 9B).
(C.) Fish Creek Basin, Lauder County.Additional data in this area has helped control the
gravity anomaly over the Fish Creek Basin caldera which may assist geologists in their interpretations of the area (figures 7F and 9F).

(D.) Central Reese River Valley (south-southwest of the town of Battle Mountain), Lauder County.
New data has helped to fill a rather significant gap in gravity coverage ir this area (figures 7B, 7C, 1G, IF, 9B, 9C, 9G and 9F).
(E.) Eastern Boulder Valley (southwest of Carlin Mine), Eureka County.
The additional data collected in this region have helped control the negative anomaly and may assist geochemists and geologists in their investigations of the area (figures 7C,7D,9C and 9D).
These data supplement previously released data from the Win- nemucca quadrangle (Wagini, 1985; Wagini, 1986).
118° 00' 41° 00'
30-
40° 00'
30'
i nr Do- 30' 116T 00'
D
A » Sonoma Range B = north slope Battle Mtn. C = Fish Creek Basin D = Central Reese River Valley E » eastern Boulder Valley
FIGURE 2. Geographic areas map.
GRAVITY METER AND CALIBRATIONAll 133 gravity stations were obtained using LaCoste and Romberg geodetic gravity meter G-161. The factory calibration of G-161 was adjusted by a factor of 1.000573, based on mul tiple gravity measurements on calibration loops (Barnes and others, 1969; Ponce and Oliver, 1981).

BASE STATIONSAll new gravity stations were tied to two base stations. Base station ACIC 0474-1 is located at the Winnemucca Municipal Airport (fig. 3a) and base station ACIC 2344-2 is located at Battle Mountain Airport (fig. 3b) Both base stations are on the World Relative Gravity Reference Network described by Jablonski (Jablonski, 1974, p. 730 and p. 1134) . Table 1 specifies the base stations used for every gravity measure ment .
TABLE 1. Gravity stations and their corresponding bases.
Corresponding Base Gravity Stations
_____________________________I____________________ Battle Mountain ACIC 2344-2 | 85WIN101 - 85WIN117
I 85WIN125 - 85WIN140 I 85WIN152 - 85WIN233 I
Winnemucca ACIC 0474-1 I 85WIN118 - 85WIN124I 85WIN141 - 85WIN151 *
* These stations were tied to two bases instead of one.
GRAVITY DATUMTheoretical gravity is based on the Geodetic Reference System of 1967 (International Union of Geodesy and Geophysics, 1971), and observed base station and other gravity values are referenced to the International Gravity Standardization Net 1971 (IGSN 71) observed gravity datum described by Morelli (1974, p. 18).
GRAVITY REDUCTIONThe observed gravity values were reduced to complete Bouguer anomaly values after applying free-air, Bouguer, latitude, curvature, and terrain corrections. The inner (zones A-D) and outer (zones E-O) terrain corrections were computed by the Hayford-Bowie (1912) system. For zones A and B, 0 to 68 m from the gravity measurement location, the terrain corrections were estimated in the field using half-slope graphs derived from a program by V.W. Adams (Robbins, S.L. and Oliver, H.W., October 1970, written commun.) For zones C and D, 68 to 590 m, elevations of terrain were estimated for the Hayford-Bowie (1912) compartments from 1:62500/1:24000 scale topographic maps using clear glass circular templates based on Hayford's original system of zones (Swick, 1942, p. 66). The resulting terrain corrections for zones C and D were computed by a FORTRAN code called HANDTC (Spielman and Ponce, 1984). For zones E through O (590 to 166.7 km) the terrain correction was computed from a 1/4 minute lat. by 1/4 minute long, digital elevation model using a procedure by Plouff(1977). The terrain density was assumed to be 2.67 g/cm3 . The

GRAVITY BASE STATION ACIC 0*74-1NAME WINNEMUCCA STATE NEVADA
LATITUDE A0 * 54.23' LONGITUDE 117* 48.21'
ELEVATION 1310 meters
OBSERVED GRAVITY 979,810.48 mGal SB A
LOCATION DESCRIPTION
The station is at the Winnemucca Municipal Airport, (4 mi W. of town), near south wall of Air Service building on concrete sidewalk, 3 ft E. of phone booth, 3 f t W. of door. Site is raonumented with a "USFA Gravity Station" disc.
N
A
Hangar Admin. BMg.
X * X XWood Fence
Phone BoothGravity Base Station
Gas Island
Taxiway
Figure 8A. Gravity base station Wianemucca, Nevada (Wafini, 1986)
5

GRAVIT Y BASE STATION ACIC 2344-2NAME BATTLE MOUNTAIN
LATITUDE 40* 36.44'
STATE NEVADA
IONGITUDE 116* 52.43'
ELEVATION 1379 meters
OBSERVED GRAVITY 979,754.79 mGal SB A
LOCATION DESCRIPTION
Station is at the Battle Mountain Airport/ £. of town, at the SE. corner of the main hangar-office building, (W. of the fuel storage tanks). Site was mo numerated with a "USFA Gravity Station" disc (missing).
-O
Hangar
Wind Sock
o o
Office
^Gravity Base Station
Mix Plant
Fuel Storage Tanks
N
A o
Gas
Taxi Ramp
Figure *B, Gravity base station Battle Mountain, Nevada (Wafini, 1985)

Bouguer gravity values were reduced to the isostatic residual gravity values by applying an isostatic correction based on an Airy-Heiskanen isostatic model (Heiskanen and Vening Meinesz, 1958; Karki and others, 1961)). The isostatic correction was computed by a FORTRAN program, AIRYROOT (Simpson and others, 1984), using the Airy-Heiskanenparameters of 2.67 g/cm for the density of the topographic load, 25 km for the crustal thickness at sea-level, and 0.40g/cm for the density contrast between the lower-crust and the upper-mantle. Contoured plots were generated from 0.8 km grids.
PRINCIPAL FACTSThe principal facts explained in table 2 include station name, latitude,longitude, elevation, observed gravity, free air anomaly, simple Bouguer anomaly, inner-zone terrain cor rection, letter designation (D) of the outer-most zone of the inner-zone terrain corrections, total terrain correction, complete Bouguer anomaly, and isostatic residual gravity anomaly (Morin, 1987) . A listing of the principal facts is included in table 4. Maps of station locations are indexed in figure 4 and shown in figures 5A-E. Updated complete Bouguer anomaly maps with a screened topographic base are in dexed in figure 6 and shown in figures 7A-H. Isostatic residual gravity anomaly plots are indexed in figure 8 and displayed on top of a U.S. Geological Survey topographic base in figures 9A-H. Color contour maps of both complete Bouguer gravity anomaly and isostatic residual gravity anomaly for the Winnemucca 1° by 2° quadrangle are shown in figure 10 and 11, respectively.
ADDITIONAL INFORMATIONAn aeromagnetic map of the Winnemucca 1° by 2° quadrangle by Kirchoff-Stein (1988) covers the same geographic area as this gravity report. Also covering the same area is an extensive bibliography by Orris and others (1987) listing 1,530 geologic publications with indexing by county, commodity, mine name and mining districts. These may be helpful in interpreting the data included in this report.
ACKNOWLEDGMENTSI greatly appreciated the assistance of Robert L. Morin in the collection and planning of the field work. Special thanks to Tracy V. Bare for the many hours she spent doing terrain corrections and map digitization. Howard W. Oliver, supervisor of the project, provided helpful guidance and planning. Thanks to David A. Ponce and Carter W. Roberts for their technical assistance in the preparation of this report. Reviews by Howard W. Oliver and Steven F. Carle were very helpful.

REFERENCES
Barnes, D.F., Oliver, H.W., and Robbins, S.L., 1969, Standardization of gravimeter calibrations in the Geological Survey: EOS, Transactions, American Geophysical Union, v. 50, no. 10, p. 526- 527.
Hayford, John F., and Bowie, William, 1912, The effect of topography and isostatic compensation upon the intensity of gravity: U.S. Coast and Geodetic Survey Special Publication no. 10, 132 p.
Heiskanen, W.A., and Vening Meinesz, F.A., 1958, The Earth and its gravity field: New York, McGraw-Hill Book Company, Inc., 470 p.
International Union of Geodesy and Geophysics, 1971, Geodetic Reference System 1967: International Association of Geodesy Special Publication no. 3, 116 p.
Jablonski, H. M., 1974, World relative gravity reference network North America, Parts 1 and 2: U.S. Defense Mapping Agency Aerospace Center Reference Publication no. 25, originally published 1970, revised 1974, with supplement of IGSN 71 gravity datum values, 1261 p.
Karki, Penti, Kivioja, Lassi, and Heiskanen, W.A., 1961, Topographic- isostatic reduction maps for the world for Hayford Zones 18-1, Airy-Heiskanen system, T=30 km: International Association of Geodesy, Isostatic Institute, Helsinki, no. 35, 5 p. text, 20 maps, scale 1:22,000,000.
Kirchoff-Stein, K.S., 1988, Aeromagnetic map of Nevada, Winnemucca sheet, Nevada: Nevada Bureau of Mines and Geology Map 92, scale 1:250,000, 1 sheet.
Morelli, Carlo (Ed.), 1974, The International Gravity Standardization Net,1971: International Association of Geodesy Special Publication no. 4, 194 p.
Morin, R.L., 1987, Principal facts for new and reprocessed gravity data in and around the Westwater Canyon and Black Ridge Canyons areas, Utah and Colorado: U.S. Geological Survey Open-File Report 87-441, 13 p.
Orris, G.J., Bennett, P.C. and Theodore T.G., 1987, A bibliography for the Ninnemucca 1° by 2° quadrangle, Nevada, with indexing by county, commodity, mine name, mining district, and selected major topics: U.S. Geological Survey Open-File Report 87-89, 138 p.

Plouff, Donald, 1977, Preliminary documentation for a FORTRAN program to compute gravity terrain corrections based on topography digitized on a geographic grid: U.S.Geological Survey Open-File Report 77-535, 45 p.
Ponce, D. A., and Oliver, H. W., 1981, Charleston Peak gravity calibration loop, Nevada: U.S.Geological Survey Open-File Report 81-985, 20 p.
Robbins, S.L., Oliver, H.W., Holden, K.D., and Farewell, R.C., 1974, Principal facts, accuracies, and sources for 3046 gravity stations on the San Jose 1° by 2° quadrangle, California: U.S. Geological Survey Report, 106 p., National Technical Information Service (NTIS), U.S. Department of Commerce, Springfield, Va., NTIS-PB 232-728.
Simpson, R.W., Jachens, R.C., and Blakely, R.J., 1983, AIRYROOT: a FORTRAN program for calculating the gravitational attraction of an Airy isostatic root out to 166.7 km: U.S. Geological Survey Open-File Report 83-883, 66 p.
Spielman, J.B. and Ponce, D.A., 1984, Handtc, a FORTRAN program to calculate inner-zone terrain corrections: U.S. Geological Survey Open-File Report 84-777, 20 p.
Swick, C.H., 1942, Pendulum gravity measurements and isostatic reductions: U.S.Coast and Geodetic Survey Special Publication 232, 82 p.
U.S.Geological Survey, 1971, Winnemucca, Nevada Topographic Map: U.S. Geological Survey map series V502, number NK 11-11, scale 1:250,000, 1 sheet.
Wagini, Alexander, 1985, Principal facts, accuracies, and sources for 1951 gravity stations on the Winnemucca 1° by 2° Quadrangle, Nevada: U.S. Geological Survey Open-File Report, 74 p. available from National Technical Information Service, U.S. Department of Commerce, VA 22161, NTIS PB 85-235927, 74 p.
Wagini, Alexander, 1986, Bouguer and isostatic gravity maps of the Winnemucca 1° by 2° quadrangle, Nevada: U.S.Geological Survey Map GP-976, scale 1:250,000, 2 sheets.

TABLE 2.- Explanation of principal facts format
Item Explanation
STATION NAME.... An alphanumeric combination of up to 8 characters used foridentification of the gravity measurement location.
LAT..................... Latitude in degrees and minutes, to 0.01 minute.LON....................Longitude in degrees and minutes, to0.01 minute.ELEV...................Elevation, to 0.1 feet.OG...................... Observed gravity, to 0.01 mGal.AC...................... Four digit code describing the general location, elevation, latitude and
observed gravity accuracy.FAA....................Free-air anomaly, to 0.01 mGal.ITC .....................Inner-zone terrain correction from 0.0 to 0.59 km for a density of
2.67 g/cm3, to 0.01 mGal. Single letter code "D" indicates 0.59 km radius.
TC ......................Total terrain correction from 0.0 to 1.67 km for a density of 2.67g/cm3, to 0.01 mGal.
CBA.................... Complete Bouguer anomaly reduced for a density of 2.67 g/cm3, to0.01 mGal.
ISO..................... Isostatic residual gravity anomaly based on Airy-Heiskanen modelfor isostatic compensation, assumes sea-level crustal thickness of 25 km, density contrast of topographic load 2.67 g/cm3 , and lower- crust upper-mantle density contrast of 0.40 g/cm3, to 0.01 mGal.
10

TABLE 3.-Explanation of accuracy codes (modified from Morin, 1987) ______[NGS, National Geodetic Survey; NMD, National Mapping Division; USGS, U. S. Geological Survey]
Code Explanation
General elevation and location code-1'* digit
A Altimetry, good control PB On USGS or NGS level-line bench mark QC Contour line interpolation RD Destroyed or not found reference mark SE Near level-line bench mark other than USGS or NGS TF Map elevation, black or field checked UG Map elevation, brown or not field checked VH Near vertical angle bench mark WI Other special source XK Photogrammetry by other than USGS NMD YN Near USGS or NGS level-line bench mark ZM On level-line bench mark other than USGS or NGS
On or near surveyed markRiver gradient interpolationLake or reservoir elevation by levelingSea level elevationPhotogrammetry by USGS NMDUnknown elevation sourceOn vertical angle bench markMap elevation, blueOn or near boundary markerAltimetry, poor controlSpecial source (e.g. mobile elevation recorder)
Elevation code-2nd digitElevationaccuracy
(ft)
Approximate gravity effect
(mGal)
1 On bench mark 0.22 Near bench mark 0.33 Transit or good alidade survey 1.04 Vertical angle bench mark or black map elevation 2.05 Black map elevation on old map or good photogrammetry 4.06 Brown map elevation or good photogrammetry on 20 ft contour interval map 107 Brown map elevation on 80 ft contour interval map or good altimetry 208 Contour interpolation on 80 ft contour interval map 409 Contour interpolation on 200 ft contour interval map or poor altimetry 80
0.010.020.060.120.240.61.22.44.8
Latitude code-3rd digit (based at lat 37°)Latitudeaccuracy
(min)
Distanceaccuracy
(ft)
Approximategravity effect
(inGal)
1 Triangulation or special2 Location known to 0.043 0.10 in on 1:24,000 map4 0.21 in on 1:24,000 map5 0.42 in on 1:24,000 map6 0.40 in on 1:62,500 map7 0.80 in on 1:62,500 map8 1.60 in on 1:62,500 map9 4.00 in on 1:62,500 map
survey datain on 1:24,000 map (special care) or 0.04 in on 1:62,500 map or 0.08 in on 1:62,500 map or 0.16 in on 1:62,500 map or 0.1 in on 1:250,000 map or 0.2 in on 1:250,000 map or 0.4 in on 1:250,000 map or 1.0 in on 1:250,000 map
0.0070.0140.0350.070.140.350.71.43.5
4284
210420840
2,1004,2008,40021,000
0.010.020.050.10.20.51.02.05.0
Observed gravity code-4th digitApproximategravity effect
(mGal)
1 Local survey with special gravity meter 0.012 Multiple observations with LaCoste and Romberg gravity meter 0.023 Average LaCoste and Romberg or multiple observations with Worden gravity meter 0.054 LaCoste and Romberg observation with small vibrations or average Worden gravity meter 0.15 Data from loop with closure error this large 0.26 Data from loop with closure error this large 0.57 Data from loop with closure error this large 18 Data from loop with closure error this large 29 Data from loop with closure error this large 4
11

TABLE ^.-Principal Facts for 1S3 Gravity Stations
STATION NAME
85WIN10185WIN10286WIN10386WIN10486WIN10685WIN10686WIN10785 WIN 10885WIN10986WIN110
86WIN11186WIN11285WIN11386WIN11486WIN11686WIN1168BWIN11786WIN11886WIN11986WIN120
86WIN12185WIN12285WIN12386WIN12486WIN12586WIN12686WIN12786WIN12886WIN12986WIN130
85WIN13186WIN13285WIN13386WIN13486WIN13586WIN13686WIN13786WIN13886WIN13986WIN140
86WIN14185WIN14285WIN14385 WIN 14485 WIN 14685WIN14685WIN14786WIN14886WIN14986WIN160
86WIN1618BWIN15286WIN16386WIN15486WIN1BB8BWIN15686WIN16785WIN16886WIN16985 WIN 160
86WIN16185 WIN 16286 WIN 16385 WIN 16485 WIN 16686 WIN 16686WIN16786WIN16886WIN16986WIN170
LAT deg min
40 27.6940 27.0040 26.1340 28.6140 29.6340 29.3840 29.6640 29.9140 30.1840 30.46
40 31.0240 31.4640 29.7040 27.7940 28.0040 28.8240 29. B740 64.0640 64.5240 54.36
40 54.0040 53.3540 54.9340 56.2940 11.5940 13.5640 9.0040 12.3340 13.2440 13.97
40 11.5040 12.4340 12.4640 17.7240 46.0740 44.1740 43.6940 43.3140 44.1140 42.84
40 51.1240 49.6540 49.4840 49.7640 50.1440 49.3740 48.7740 47.5540 46.3640 49.92
40 51.4540 42.8140 42.9240 42.3240 41.8940 42.7240 41.1240 39.9840 39.3140 40.02
40 39.3940 38.6340 38.2240 38.1040 42.3240 42.3340 55.3640 53.9040 51.5340 51.52
LON deg min
117 3.59117 4.08117 4.67117 3.86117 6.67117 6.26117 6.83117 4.97117 4.27117 3.67
117 2.79117 1.07117 4.14117 2.28117 0.86117 0.44117 2.69117 44.36117 43.26117 42.48
117 40.61117 40.28117 41.32117 40.01117 10.46117 11.94117 16.64117 15.42117 16.14117 16.61
117 17.23117 18.76117 22.00117 20.61117 8.97117 10.26117 10.20117 8.99117 7.74117 8.29
117 43.83117 40.60117 38.12117 37.91117 36.67117 36.78117 36.82117 36.67117 36.66117 36.67
117 32.38117 10.67117 9.85117 10.67117 10.60117 12.12117 11.71117 11.10117 11.39117 10.40
117 9.78117 8.67117 7.80117 6.43117 13.17117 14.78116 28.91116 29.21116 29.91116 29.19
BLEV ft
4625.04639.04651.04621.04650.04705.04655.04622.04609.04608.0
4633.04597.04604.04631.04646.04605.04600.04551.04806.04980.0
5495.05823.06427.05351.05006.05560.05750.05385.05499.05630.0
5680.06151.06469.05055.04676.05002.05060.05113.04856.05564.0
4738.06276.08114.07900.08629.07369.07579.06788.05495.07283.0
6677.05331.06327.05495.06776.05348.05693.06016.07210.05955.0
6160.06520.06770.07139.05163.05055.04914.04835.04727.04728.0
OG mGal
979742.59979738.96979732.88979748.19979744.58979738.58979743.35979760.26979750.17979746.24
979749.86979748.48979749.76979736.22979731.66979733.09979748.80979800.18979784.56979774.67
979746.10979722.19979764.11979763.64979686.43979655.49979641.78979669.98979664.56979655.66
979663.76979621.65979606.97979709.92979790.13979762.26979767.31979763.63979770.34979723.69
979788.23979766.18979674.63979594.88979538.79979627.12979609.73979659.36979734.37979631.50
979737.36979739.33979739.30979727.09979708.61979736.81979716.26979690.26979611.69979693.54
979680.03979659.73979660.77979622.76979745.58979752.34979776.26979781.74979781.30979782.60
AC
B133F433F433B133F433F433F433F433F433F433
F433F433B133B133B133B133C633F433F433F433
C833C833F433F433F433C833F433F433F433F433
C833F433F433C733C733F433F433F433F433F433
F433F433F433F433F433F433F433F433C833C833
C833F433F433F433F433F433F433F433C833F433
C833C833C833F433F433F433F433F433N233F433
FAA mGal
-32.52-33.96-37.61-28.82-31.22-31.67-31.88-28.58-30.30-34.74
-29.61-35.02-30.46-39.62-42.09-46.74-31.60-21.33-13.68
-6.98
12.4021.2813.6313.98
-29.07-10.87
0.06-11.00-7.06-4.73
1.7312.6127.67
-10.09-7.72-2.13-0.900.86
-7.6714.12
-11.328.38
94.7794.49
106.3276.4880.6667.7813.0672.90
16.177.907.33
11.8120.18
7.1120.3727.4362.0524.91
31.6146.2761.4168.24-0.91-4.32
-13.08-12.84-19.90-18.60
SBA mGal
-190.26-192.18-196.24-186.43-189.82-192.16-190.65-186.23-187.60-191.90
-187.62-191.82-187.49-197.67-200.56-202.80-188.60-176.66-177.60-176.83
-176.02-177.32-171.47-168.53-199.81-200.60-196.06-194.66-194.61-196.76
-192.00-197.28-192.97-182.50-167.20-172.73-173.48-173.63-173.29-175.66
-172.92-171.67-181.98-174.96-187.99-174.51-177.84-173.74-174.36-176.50
-174.06-173.92-174.36-176.61-176.79-175.29-173.80-177.76-183.86-178.19
-178.49-176.11-169.49-175.26-177.00-176.73-180.68-177.75-181.13-179.85
ITC mGal
0.000.000.000.010.000.080.010.000.000.00
0.010.000.000.000.000.000.000.000.030.01
2.243.740.040.020.120.270.110.460.020.04
0.160.400.450.160.010.050.630.130.021.26
0.280.963.001.163.081.793.822.741.030.51
0.030.070.070.271.110.030.090.143.261.27
2.821.460.310.470.030.010.010.000.000.00
DDDDDDDDDD
DDDDDDDDDD
DDDDDDDDDD
DDDDDDDDDD
DDDDDDDDDD
DDDDDDDDDD
DDDDDDDDDD
TC mGal
0.290.260.230.340.600.590.600.610.580.52
0.480.360.460.320.400.400.331.281.702.39
8.8011.073.212.770.951.791.421.850.931.27
1.431.883.551.810.330.801.611.460.813.64
3.246.68
18.0012.0420.418.46
12.617.437.307.06
2.561.141.331.663.010.811.633.01
12.274.71
7.665.814.016.740.840.540.710.390.120.09
CBA 2.67
-191.33-193.28-197.38-187.46-190.58-192.93-191.41-186.98-188.28-192.74
-188.51-192.81-188.39-198.61-201.62-203.76-189.62-176.62-177.29-176.85
-167.68-167.74-169.72-167.20-200.27-200.18-196.12-194.26-196.14-196.95
-192.04-196.90-190.93-182.11-168.24-173.34-173.29-173.49-173.87-173.48
-171.06-166.33-165.44-164.40-168.99-167.66-166.73-167.82-168.52-169.95
-172.95-174.23-174.47-175.42-176.26-176.93-173.65-176.24-173.10-174.98
-172.36-171.81-167.00-171.02-177.69-177.60-181.37-178.76-182.38-181.14
ISO 2.67
-16.64-17.66-21.69-12.09-16.87-18.30-16.72-12.18-13.39-17.76
-13.49-17.62-13.36-22.66-26.26-27.63-14.13-13.63-14.08-12.41
-3.70-3.66-6.08-3.46
-22.41-23.33-19.60-18.32-19.64-21.42
-16.68-22.17-17.39-8.792.54
-2.42-2.26-2.19-2.52-1.96
-7.41-1.57-0.011.02
-3.35-1.83-0.89-1.76-2.22-4.04
-6.72-3.08-3.23-4.17-3.92-4.99-2.32-4.69-1.34-3.23
-0.370.515.561.81
-6.73-6.971.213.43
-0.840.65
12

TABLE 4. Principal Facts for 133 Gravity Stations-Continued
STATIONNAME
8BWIN1718BWIN17285 WIN 1738BWIN1748BWIN17B8BWIN17685WIN1778BWIN17885WIN1798B WIN 180
85WIN18185WIN1828BWIN18385WIN1848BWIN18B8BWIN18685WIN1878BWIN1888B WIN 18985 WIN 190
8BWIN1918BWIN19285WIN19385WIN1948BWIN1958B WIN 1968BWIN19785WIN19885 WIN 19985WIN200
8BWIN20185WIN2028BWIN2038BWIN2048BWIN20585WIN20685WIN2078 5 WIN 2088BWIN2098BWIN210
8BWIN2118BWIN21285WIN21385WIN21485WIN2158BWIN2168BWIN2178BWIN2188BWIN2198BWIN220
85WIN2218BWIN2228BWIN22385WIN22485WIN22B8B WIN 22685WIN22785WIN2288BWIN2298B WIN 230
85WIN2318BWIN2328BWIN233
LAT deg min
40 B1.8940 B2.1240 B2.8440 B3.1940 B3.7B40 B4.7640 B5.8040 B4.0740 51.9840 50.66
40 B0.8040 50.1240 51.5440 51.5340 51.0940 51.0840 50.3240 49.8440 50.2540 48.90
40 48.4940 48.0940 47.9840 47.9240 48.3640 47.1540 47.1440 46.2640 46.2640 46.81
40 48.1840 48.4640 48.8240 48.9540 51.1340 60.7440 48.4040 47.6640 46.5840 46.72
40 55.2840 54.8340 53.5840 63.9740 56.4840 56.8440 65.2640 54.3040 62.6740 61.66
40 50.0040 46.2140 45.6340 48.0940 48.5440 49.3040 47.4140 48.0340 47.9840 48.43
40 48.7140 47.5940 49.48
LON deg min
116 29.00116 28.62116 26.99116 26.21116 26.03116 23.45116 23.11116 22.78116 23.37116 22.86
116 23.69116 23.68116 24.84116 26.60116 26.58116 27.72116 26.57116 26.26116 26.84116 26.68
116 26.48116 26.29116 24.55116 24.16116 23.68116 23.67116 23.10116 24.82116 26.39116 26.24
116 26.84116 27.16116 28.80116 29.34116 29.92116 29.93116 29.94116 29.94116 29.96116 28.20
117 23.62117 23.74117 24.89117 23.74117 28.25117 29.32117 29.12117 29.12117 28.24117 28.22
117 28.49117 28.26117 28.79117 26.37117 25.00117 26.88117 30.26117 30.50117 30.92117 31.20
117 30.45117 33.69117 31.64
ELEV ft
4746.04748.04761.04732.04774.04926.06162.06001.04719.04707.0
4698.04712.04699.04709.04699.04709.04684.04674.04679.04681.0
4689.04702.04726.04748.04780.04773.04830.04712.04697.04679.0
4681.04659.04663.04662.04714.04699.04662.04644.04661.04660.0
6159.06204.06112.06476.04464.04441.04669.04688.04848.05013.0
5078.04645.04667.04671.04693.04923.05410.06377.06602.06646.0
5367.06736.05909.0
OG mGal
979782.11979782.64979785.92979786.44979786.04979780.07979769.64979774.30979788.09979788.31
979784.06979782.51979782.94979783.08979781.30979781.76979778.43979777.51979778.18979778.11
979777.87979777.73979778.77979779.33979779.68979781.14979779.24979781.17979779.98979780.88
979778.02979780.16979781.40979782.06979780.94979780.80979784.31979786.16979786.31979784.93
979786.19979780.27979718.04979761.78979815.96979823.87979805.68979800.80979789.62979776.69
979770.36979777.91979776.67979787.76979789.24979779.26979738.13979748.75979740.23979733.16
979751.53979659.61979720.78
AC
N233F433N233P433P233P433F433F433F433F433
F433N233F433F433F433F433F433F433F433F433
F433N233F433N233D233F433F433F433F433F433
F433F433F433F433F433F433F433F433F433C633
B233F433F433F433N233B133B134G633G633G633
F433F433G633G633G633C733F433F433F433F433
F433F433F433
FAA mGal
-17.93-17.67-14.98-16.77-16.06-7.252.85
-4.94-14.54-13.48
-18.78-17.99-20.91-19.82-21.88-20.48-25.01-26.15-26.62-23.60
-22.37-20.69-17.23-14.61-11.81-9.20-5.74
-13.68-16.18-17.80
-22.61-22.86-21.77-21.40-20.88-21.86-19.27-17.07-14.66-16.33
18.9918.9843.9527.33
-17.35-12.14-7.66-8.20-1.912.17
4.42-23.06-23.41-22.98-20.10-0.197.27
13.8717.1622.96
14.6953.0933.73
SBA mGal
-179.77-179.61-177.03-178.17-177.89-176.26-173.21-175.61-176.49-174.02
-179.01-178.71-181.18-180.43-182.16-181.09-184.77-186.67-186.21-183.16
-182.29-181.06-178.42-176.46-174.84-171.99-170.47-174.30-176.38-177.38
-182.16-181.76-180.81-180.41-181.67-182.12-177.94-176.47-173.29-174.93
-156.96-168.62-164.52-159.44-169.60-163.61-166.47-168.10-167.26-168.81
-168.78-181.49-182.26-178.89-176.75-168.10-177.25-169.63-170.49-169.61
-168.36-176.66-167.81
ITC mGal
0.000.000.000.000.000.030.080.030.000.00
0.000.000.000.000.000.000.000.000.000.00
0.000.000.000.000.000.010.010.000.000.00
0.000.000.000.000.000.000.000.000.000.00
0.020.061.550.200.010.010.020.030.040.03
0.020.010.020.010.020.140.050.010.060.03
0.050.080.04
DDDDDDDDDD
DDDDDDDDDD
DDDDDDDDDD
DDDDDDDDDD
DDDDDDDDDD
DDDDDDDDDD
DDD
TC mGal
0.110.110.190.300.430.820.890.920.690.66
0.410.350.280.120.110.070.090.100.130.11
0.110.120.170.210.260.310.390.210.150.07
0.090.040.010.010.090.070.000.00
-0.020.01
0.660.666.431.340.510.610.801.111.040.76
0.881.601.881.040.981.192.342.272.942.65
1.933.962.22
CBA 2.67
-181.04-180.78-178.22-179.24-178.84-176.85-173.75-176.00-176.17-174.74
-179.97-179.73-182.27-181.68-183.41-182.39-186.05-186.84-186.45-184.41
-183.56-182.31-179.63-177.62-176.97-173.07-171.47-175.46-177.61-178.68
-183.44-183.09-182.17-181.77-182.95-183.43-179.30-176.83-174.67-176.28
-167.84-169.29-169.59-169.66-170.43-164.33-167.04-168.36-167.61-169.47
-169.32-181.36-181.73-179.20-177.13-168.31-176.36-168.71-169.02-168.44
-167.88-174.22-167.08
ISO 2.67
0.871.334.543.854.778.64
10.988.487.719.09
3.593.751.021.00
-0.80-0.18-3.54-4.28-3.70-1.77
-0.900.373.306.437.29
10.1011.897.264.923.60
-0.94-1.00-0.69-0.36-1.47-2.011.864.286.385.34
9.237.827.547.67
-4.331.63
-0.90-2.07-0.89-2.67
-2.16-13.43-13.79-11.20-9.16-0.77-9.01-1.51-1.88-1.43
-0.80-7.53-0.34
13

11
8°0
0'
41°0
0'
45
'
30
'
15'
40
° 00'
118°0
0'
45'
30
'15
' 11
7° 0
0'
a a
a6
.B
5C
5D
0 D
oD
a
45
'
~T
~
+
30'
15'
117°0
0'
45'
D N
EW
GR
AV
ITY
STA
TIO
NS
30'
15'
116°0
0' 41°0
0'
45
'
30
'
15
'
40°
DO
-
15'
116°0
0'
SCALE
1:10
0000
0
0 5
10
15
20 MILES
FIG
UR
E A
. In
dex
of g
ravi
ty s
tatio
n lo
catio
n m
aps.

m° DO
SO'
UO°U5'117° 45'
85VINI 20
MO'
T
85WIN122
85WINH2
35'
O)oo3
COCD
85*IN' 45
B5WINH4
117°30'
D 85WIN230
85WIN232
00'
55'
D NEW GRAVITY STATIONS PREVIOUS GRAVITY STATIONS
35' 117° 30'
FIGURE 5A. Map of gravity station locations in the Sonoma Range.
SCALE l:l?5000
? 3 S MILES
0 I ? 3 U 5 6 7 KILOMETERS
15

ii7p so- ui" DO-
25'
B *'*,.
BO
MS-
35'
«40
° *** *
+
20'
=1-
7 P 30' 25'
D NEW GRAVITY STATIONS PREVIOUS GRAVITY STATIONS
20'
IS" 10' 5-
+ +
D */*,,,, North
'*'*/
Battle
+ Mountain
15'
ii7°ocr
D 8
HJsT
oo-
55'
so
40'
35'
40° 30'
10' 5' 117°00'
SCALE 1:250000
01 2 3 M 5 6 7 B 9 10 MILES
FIGURE 5B. Map of gravity station locations in the Edna Mountain, Pumper-nickle Valley, North Peak areas near Battle Mountain.
16

1 17° 30' 40° 30'
25'
20'
15'
10'
5'
40° 00'
25'
11 7° 30' 25'
20' 15 1
. t
85*INI 54
$~ FiSh D 85WINI30
O^ Creek 0 85WIN129B5WINI33 D B5WINI32 > 85WINI2B
BasinQ 85WINI3I
85WINI27
ID S' 7° DO-
400 30'
B B5WIN102
Q B5WINI05
See figure 5D
Q) ".
Q B5W1N126
Q B5W1NI25
20' 15' 5'
D NEW GRAVITY STATIONS PREVIOUS GRAVITY STATIONS
25'
20'
15'
ID
40° 00'
117°00'
FIGURE 5C. Map of gravity station locations in the Fish Creek Mountain, Fish Creek Basin, and Reese River Valley areas.
17
SCALE 1:250000
01 2 3)156789 10 MILES
0 I 2 3 q 5 6 7 8 9 10 11 12 13 II 15 KILOMETERS

117 fl
40° 30'
25'
20'
40" IB-
11 7°
15' 10' 5' 117°
° **>%
D *+Hto. *'*"« ° **, *"li os
a B:* ' E 83*n
"'»«><
0 e^//v, a os*t .' »<» **"
*»*,<*0
0
' D BSt,,.*'«tos
'+ ' '+ </* ' . + + ^
/<?
o
.
Q>Z>& £>Qr
" 0o
.' '.+ +0
o
"
0
B
o
. .
0
. .o
0
4 c . D NEW GRAVITY STATIONS 4 n . c . 1 1 "7° 1 -> PREVIOUS GRAVITY STATIONS 1 U -> 11'
00'
140° 30
*'»H6
13
25'
20'
40° 15 00'
SCALE 1:125000
0 1 2 3 t| 5 MJLES
FIGURE 5D. Map of the gravity station locations in the o i ? 3 « s 6 ? KILOMETERS
18

116° 3D'
m° DO-25'
+
°""°°' o o
50'
D O
00
O NEW GRAVITY STATIONSc -3rV NEW GRAVITY STATIONS -> c - JU . PREVIOUS GRAVITY STATIONS «-->
FIGURE 5E. Map of the gravity station locations in the Boulder Valley and Tuscarora Mountain areas
20'
COc
$ "c
D O
05
c0 CO
20'
116° 15'
m° oo-
55-
50'
116 C 15'
SCALE 1:135000
3 3 K 5 MILES
2 3 i| 5 6 7 K1LWCTERS
19

na
'ocr
m
°otv 30'
00
' 11
8° 0
0'
7E 4- «
*. * ****V*^^
*/*
15'
«*
7H
» *
. *
"'
. . / -
%*
** »»»
US-
IS'
in0 o
cr3
0'
15'
lie* oo* m°
ocr
30'
15'
MO
0 00'
116°0
0'
NE
W G
RA
VIT
Y S
TA
TIO
NS
P
RE
VIO
US
GR
AV
ITY
ST
AT
ION
SSC
ALE
1:1000000
0 5
10
15
20 MILES
FIG
UR
E 6.
Ind
ex o
f Bou
guer
gra
vity
ano
mal
y m
aps.

118° DO-
Base from U.S. Geological Survey. 1971
23156789 10 MILESI ' I I I »_J
S 6 7 6 9 10 II I? 13 II IS KILOMETERS
0 30'
US'
«iO°30'
IIB'OO'
FIGURE 7A. Bouguer gravity anomaly map A.
11 7° 30' NEW GRAVITY STATIONS PREVIOUS GRAVITY STATIONS
Gravity Contours contour interval 2 mGal. Hachured contours indicate areas of low gravity closure.
21

117*30' 41*00'
117°
MO* 30'
117*30- Base from U.S. Geological Survey. 1971
SCALE I:?SOOOO
fl HO'30'15'
9» 23156769 10 MILES1 I I I I I I I I «
0 I 2 3 « 5 6 7 6 9 10 II 12 13 I* IS KILOMETERS
FIGURE 7B. Bouguer gravity anomaly map B.
117*00'
m NEW GRAVITY STATIONS PREVIOUS GRAVITY STATIONS
Gravity Contours contour interval 2 mGal. Hachured contours indicate areas of low gravity closure.
22

116°30-
m°oo-
Base trom U.S. Geological Survey. 1971
0 I 23 4 M 56789 10 MILES
0 1 2 3. « 5 6 7 6 9 10 II 12 13 IH IS KILOMETERS
FIGURE 7C. Bouguer gravity anomaly map C.
NEW GRAVITY STATIONS PREVIOUS GRAVITY STATIONS
Gravity Contours contour interval 2 mGal. Hachured contours indicate areas
t of low gravity closure.
23

116*30'
u.i*oo'15'
45'
40*30'
116*00'
m*oo-
45-
116*30'
0
Base from U.S. Geological Survey. 1971
SCALE 1:250000
23NS678910 MILES
40* 3C
0 I 2 3 » 5 6 7 8 9 10 11 12 13 IV 15 KILOMETERS
FIGURE 7D. Bouguer gravity anomaly map D.
116*00'
NEW GRAVITY STATIONS PREVIOUS GRAVITY STATIONS
Gravity Contours contour interval 2 mQal. Hachured contours indicate areas
< of low gravity closure.

!!8°00'
«JO° SO
15' fc-'
00 Base from U.S. Geological Survey. 197
I 18" 00-SCALE 1:250000
01 ? 3 M S 6
«40°OCMS-
"0 MILES
OI?3HS67B9IO II I? 13 l< IS KILOMETERS
FIGURE 7E. Bouguer gravity anomaly map E.
1 7° 30'
NEW GRAVITY STATIONS PREVIOUS GRAVITY STATIONS
Gravity Contours - contour interval 2 mQal. Hachured contours indicate areas of low gravity closure.

117'30'
MO'30'
15'
MO'00'Base from U.S. Geological Survey. 1971
01 23KS6709IO MILES
117'DO'
40'30
15'
1*0*00117'DO'
NEW GRAVITY STATIONS PREVIOUS GRAVITY STATIONS
01 ? 3 « 5 6 7 8 9 10 II I? 13 IH IS KILOMETERS
FIGURE 7F. Bouguer gravity anomaly map F.
Gravity Contours - contour interval 2 mQal. Hachured contours indicate areas
* of low gravity closure.

117'OC 1
UC* 30'
MO'00'Base from U.S. Geological Survey. 1971
° I 2 3 » S 6 7 B 9 10 MILES
MO'00116" 30'
NEW GRAVITY STATIONS PREVIOUS GRAVITY STATIONS
0 1 2 3 1 S 6 7 e 9 10 11 12 13 IM IS KILOMETERS
FIGURE 7G. Bouguer gravity anomaly map G.
Gravity Contours contour Interval 2 mQal. Hachured contours indicate areas of low gravity closure.
27

116*30' 40*30-
15'
MO'00' '-
0 I ?3HS67B9IO MILES
116* DO-
40* 30'
IS'
40* DO-
116* DO'
NEW GRAVITY STATIONS PREVIOUS GRAVITY STATIONS
FIGURE 7H. Bouguer gravity anomaly map H.
Gravity Contours contour interval 2 mGal. Hachured contours indicate areas
' of low gravity closure.
28

VD
uroo
-
US-
30'
15
'
U0°
DO
'
"00-
US
' 3
"- ' 3 »
* *
. *
* *
***
* **
*\ +
\
* *
****
***
**\
*
v*
* *
,
* *
** *
ff
m,
* *
ajt
i
* *
* **
i
m *
* 4
* *
+ *
**
*.
* **
*: *
v*'*
**
**
*'>
s&r\ *
* *
* 4*^^^
^j^_
***
* * *»*
_i^^\
* * *
* *
* ***
*3*>
,.
±
4**
* -*
*
*
*
+
*
**
*
**
*
*
*
* *
*
*
*
*
*
*
*
*
*
*
*
*
*
*
*
+
*
* *^
*
*
- :
* +£*
****
* *
* *
*****
*******;
* *
* *
* *
j**
* ***
**T**^
*
* v
*:* *
*, *
*** *
** »**
* *
.-««,, .
j0
' 1
5'
117°
-^
f
**
+
*
*
t *
****
*!*
* *»
***
******
** *
'**
tfR
**
***
*-**
* *
****+
*/t
: >*
4:
* * ^
i** *
*4
*
+.
-f +
+
+
+ -f
* +
+
****
****
v*
*fv:
% :
******
:*
>i«
**v
::**
* *
* * *
*
* **
***
* ***
****
** *
* + *
* **
****
v*
*****
* **
^B
i ****** V
***..*..*^rf'"
r
*
i *
*~
|^B
_
**
* *
*
J**
*
**
*
*
***
M0B
****
* *
.******
*JP
* **
***-
* * *
* **
*k
>'.""
:- :
' :
.*
^^^*"^B
li.
4^.*
* *
*
+ ** ^ ^**A
* *^
**
*
* *
* *V
****
**i**
^*
* * *
*
*
+
+^
" *9
F**
;**n
*/*
*
r**
***
*J"
* 4
*
«c
* "
* *!*
»*
** *
****
* * /
********** *
*^*
t******
/*
**:
^ , .
*
*
00'
US
' 3
****
* *
****
* **
***
***
****
**
*»*»
*
*j*
***J
* * *
* o
c *
* !
* A
* + +
* i +
* * i
+ ^
+
. :
/ .-.
.*
. >
* *
* *
* *
* ** *: '*
-.
\*
* *
* +
**
*r
*.
* %
* H
+ *'*
" *
~ *
* *
*..
:
.
4-
+
+
+
-*
*
"*
* **
******
* *
* *
* 99
;* ;
* /*
* *
****
»**
*»'*
* *
*» * "
W*
* *
1 %
4. J
* 4*
^4,
* *
+***
*
******
^
%^
+**<
- ~
* ^
****
**1 t i 1 ±
D'
15
' H
6°(
' '*
*'
*
' *
* *
**
**
* **
: *
*4.
+
^v
*?* ******
^ L
"!
****
**F
*
* *
*'"rt*
**
Of)
***
**
"V
* ,*
****
*
* .'
:.
"
. .
.*
* *
** *
* *
+*
-» **
* *
* **
*
*****
* *
i-» k
* *
* »*-
i *<»
* *
* *
* **
*^**
*
*^
M
^^
* *
'*^**
*^
^
* *
+ *
* *
9H
- *
/* 4
-*n^
****
* **
*
* **
**
*
**.
* *
* **
***
* *
* *
*******
* *
****
* *
* **
'<
' '. :
* *
+ +
i **
**~
uroo
-
US
-
IS'
DO-
118°
DO
'U
S-3
0'
IS'
117°
00-
US'
30
'1
5'
116°0
0'
N
EW
GR
AV
ITY
ST
AT
ION
S+
PR
EV
IOU
S G
RA
VIT
Y S
TA
TIO
NS
SCAL
E 1:
1000
000
0 5
10
15
20 MILES
FIG
UR
E 8
. In
dex
of is
osta
tic r
esid
ual g
ravi
ty a
nom
aly
map
s.

118* 00" US- 7C 30'
m'
MO'30'
W^^^&^r/^ rSiCi^. v fcrV^^;^^«0*^
^ 3 ? ^': 3 ? '^wB^*^
Base from U.S. Geological Survey. 1971
SCALE I:?SOOOO
* 8 9 I" MILES
0 I 2 3 * 5 6 7 0 9 10 II 12 13 14 IS KILOMETERS
140*30'
FIGURE 9A. Isostatic residual gravity map A.
117*30'
NEW GRAVITY STATIONS PREVIOUS GRAVITY STATIONS
Gravity Contours - contour interval 2 mQal. Hachured contours indicate areas
< of low gravity closure.
30

117'3tr
Base from U.S. Geological Survey. 1971
01234S676910 MILES
it r oo- m'oo-
0 I 2 3 « 5 6 7 6 9 10 11 12 13 1*1 15 KILOMETERS
FIGURE 9B. Isostatic residual gravity map B.31
ii 7° otr NEW GRAVITY STATIONS PREVIOUS GRAVITY STATIONS
Gravity Contours - contour interval 2 mGal. Hachured contours indicate areas of low gravity closure.
U 7* DO- 116* 30'
00'
no*Base from U.S. Geological Survey. 1971
0 I Z3M5678910 MILES
116" 3CV
0 I 2 3 « 5 6 7 B 9 10 II 12 13 l« 15 KILOMETERS
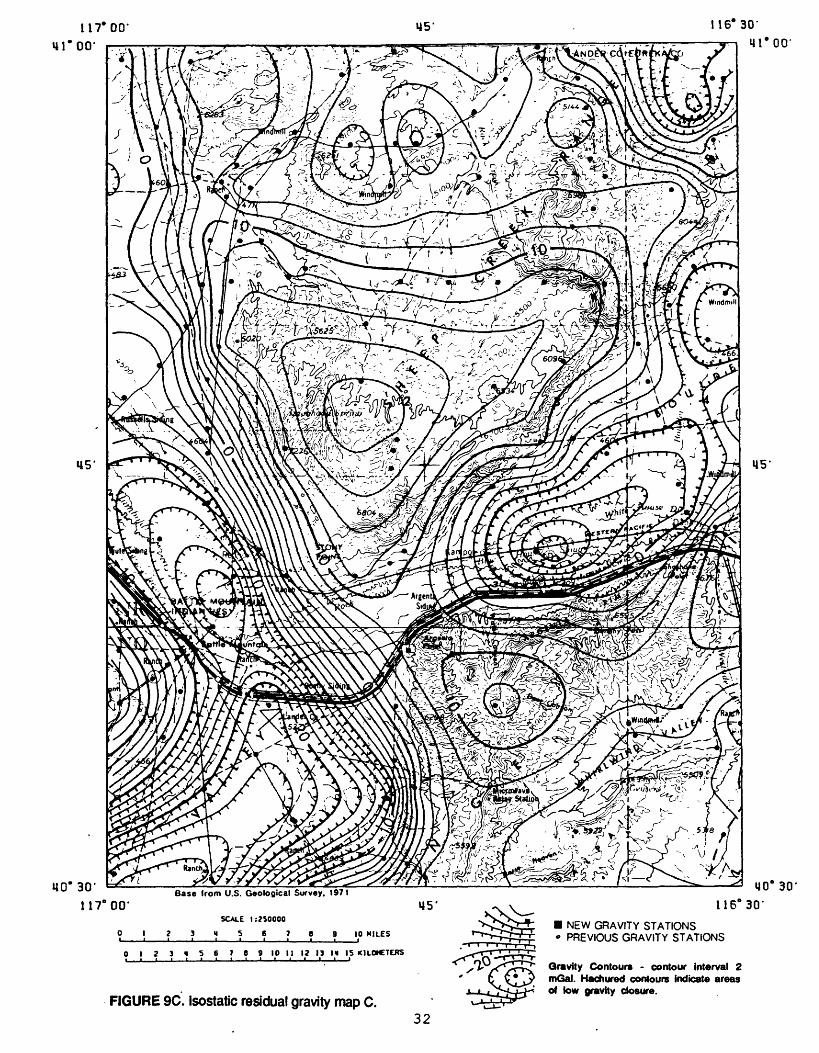
FIGURE 9C. Isostatic residual gravity map C.
NEW GRAVITY STATIONS PREVIOUS GRAVITY STATIONS
Gravity Contours - contour interval 2 mGal. Hachured contours indicate areas
:- of low gravity closure.
32

116* So l 6° 00'
a'oo- DO-
45'
HO'30-
116° 30'Base from U.S. Geological Survey. 1971
15SCALE 1:250000
> I 23-456789 JO MILES i , i i i »_J i i i
0 I ? 3 <l S 6 7 6 9 10 II 12 13 m IS KILOMETERS
FIGURE 9D. Isostatic residual gravity map D.
lie" oo-
NEW GRAVITY STATIONS PREVIOUS GRAVITY STATIONS
Gravity Contours - contour interval 2 mGal. Hachured contours indicate areas
< of low gravity closure.
33

118*00'
MO'30'
US'
HO'
117*30'
HO* 30
15'
qo'oo117*30'
NEW GRAVITY STATIONS PREVIOUS GRAVITY STATIONS
0 I 2 3 «l 5 6 7 8 9 10 II 12 13 U IS KILOMETERS
FIGURE 9E. Isostatic residual gravity map E.
<fr/ Gravity Contours contour interval 2 mQal. Hachured contours indicate areas
*' of low gravity closure.

11 7" 30'Base from U.S. Geological Survey. 1971 MO'OC
15'
SCALE l:?50000
)» 33*56769 10 MILES
0 I ? 3 » 5 6 78910111? 13 1« 15 KILOMETERS
FIGURE 9F. Isostatic residual gravity map F. 3 5
tn'otrNEW GRAVITY STATIONS PREVIOUS GRAVITY STATIONS
Gravity Contours - contour interval 2 mQal. Hachured contours indicate areas
t ' of low gravity closure.

in'oo-UO'30 1
UO'OO'Base from U.S. Geological Survey. 1971
°« '3156789 10 MILES
116'30'
40*30'
15 1
40° 00'
116*30-
NEW GRAVITY STATIONS PREVIOUS GRAVITY STATIONS
0 I 2 3 "I 5 6 7 8 9 10 11 12 13 It 15 KILOMETERS
FIGURE 9G. Isostatic residual gravity map G.
Gravity Contours - contour interval 2 mQal. Hachured contours indicate areas
< of low gravity closure.

116'30' 15' 116'OCT«40 e 30'
15'
MO'30'
15'
Base from U.S. Geological Survey. 19715" 30*
SCALE 1:250000
OI23M567B9IO MILES
0 1 2 3 « 5 6 7 0 9 10 II IZ 13 IM IS KILOMETERS
FIGURE 9H. Isostatic residual gravity map H.
u.0"116°00-
NEW GRAVITY STATIONS PREVIOUS GRAVITY STATIONS
<xr oO >^f^ Gravity Contours - contour interval 2: 7y mQal. Hachured contours indicate areasNi~^' of tew gravity closure.
37

00"
116"
00"
SCAL
E 1:945000
?. .
5
10
15
20 MILES
05
10
15 20 25
30 KI
LOME
TERS
116*
FIG
URE
10 .C
ompl
ete
Boug
uer g
ravi
ty a
nom
aly
map
of W
inne
muc
ca 1
° by
2° q
uadr
angl
e.

41"
001
CO vo
SCA
LE
1:9
45
00
0
05
\Q
IS
gq
MIL
ES
05
10
15
20
25
30
K
ILO
ME
TER
S
mG
al
25
20
15
10 5 0 -5 -10
-15
-20
-25
-30
FIG
UR
E 11
. Is
osta
tic r
esid
ual g
ravi
ty a
nom
aly
map
of W
inne
muc
ca 1
° by
2°
quad
rang
le.

APPENDIX
Information about available diskette
PRINCIPAL FACTS FOR GRAVITY STATIONS ON THE WINNEMUCCA 1° BY 2° QUADRANGLE, NEVADA
BY ROBERT F. SIKORA
Open-File Report 91-256-B
Part B of this report is a 3 1/2 inch disskette, double-sided, high-density (1.44 MB), containing the data files in ASCII format.
Requirements for part B: IBM PC or compatible, DOS v. 2.0 or higher, with a 3 1/2 inch disk drive or a Macintosh with a Super Drive and Apple File Exchange software to convert from PC to MAC.
Files contained on diskette:
readme.win - Description of diskette, principal facts format table, and explanation of accuracy codes.
new.iso- File containing the principal facts for 133 gravity stations obtained in 1985. The data are in Plouff format*.
old.iso- File containing the principal facts of all the previous gravity stations on the 1° by 2° quadrangle. Data are on the IGSN 71 datum and reduced using the GRS67 ellipsoid formula.
*(a8,f3.0,f4.2,f5.1 P f7.2,a4,f6.2,f6.2,f5.2,f5.2,a1 ,f6.2,f6.2)
40