open council work session
TRANSCRIPT

__________________________________________________
OPEN COUNCIL WORK SESSIONMUNICIPAL CENTER COUNCIL CHAMBERS
1616 HUMBOLDT AVENUE, WEST ST. PAUL, MN 55118MONDAY, AUGUST 9, 2021
5:30PMCall to Order
Roll Call
Review and Approve the OCWS Agenda
Review the Regular Meeting Consent Agenda
Agenda Item(s)
Fee Schedule
COUNCIL REPORT - 2022 FEE SCHEDULE.PDFCONDENSED 2022 FEE SCHEDULE -PROPOSED.PDF
Preliminary 22 Budget and Conceptual 23 Budget
COUNCIL REPORT - 2022-2023 PRELIMINARY BUDGETS.PDFCEP-CIP PLAN.PDF
Future OCWS Setting Discussion
COUNCIL REPORT - FUTURE OCWS SETTING DISCUSSION.PDFASI LOBBY CONFERENCE ROOM ESTIMATE.PDF
Adjourn
If you need an accommodation to participate in the meeting, please contact the ADA Coordinator at
651 -552-4108 or email [email protected] at least 5 business days prior to the meeting
www.wspmn.gov EOE/AA
1.
2.
3.
4.
5.
A.
Documents:
B.
Documents:
C.
Documents:
6.

Open Council Workshop
To: Mayor and City Council
Through: Nate Burkett, City Manager
From: Charlene Stark, Finance Director
Date: August 9, 2021
2022 Fee Schedule
BACKGROUND INFORMATION: Attached is the proposed changes to the 2022 fee schedule. Changes are in red.
Reduction to the Tattoo/Body Art- Business License to be more in line with neighboring cities.
Reduction to the ESCROW for Environmental Compliance-Single Family-Determined this amount will suffice.
Sewer fees per utility study of 2016 Storm water fees per utility study of 2016
FISCAL IMPACT:
STAFF RECOMMENDATION: Discussion of changes to the fees. Attachment Condensed Fee Schedule (Changes Only)
Amount Fund: Department: Account:

chan
ge
* statutory limitsBUSINESS LICENSE FEES
Tattoo/Body Art - Business 1,925.00 400.00 (1,525.00) 135.00 100.00
Late Payment of Application Fee50% of
Application Fee
50% of Application
Fee
Adopted in previous years-
not on fee schedule
Environmental ComplianceEnvironmental Permit - All construction requiring ground disturbance activity for residential, commercial, and industrial
$800 Per Acre ($250
Minimum)
$800 Per Acre ($250
Minimum)-
ESCROW for Environmental Compliance - Single Family (2 Units or Less) $2,000.00 $1,000.00 (1,000.00)
ESCROW for Environmental Compliance - Multi-Family (3 or more units), Commercial, Industrial
$3,000 Per Acre
$3,000 Per Acre -
UTILITY RATES-SEWERBase Rate 31.40 32.97 1.57 Volume Rates - Residential (per CEF)-Winter Qtr. Use 5.76 6.05 0.29 All Other-(per CEF) 6.67 7.00 0.33 City SAC admin fee Per SAC Unit 50.00 50.00 -
UTILITY RATES-STORMWATERFlat Rates Residential (per quarter) 13.39 14.06 0.67 All Other-(per month) 4.60 4.83 0.23
Inflation Factor - March 31st - Implicit Price Deflator (IPD), State and Local
Fee Description
2022
Pr
opos
ed
Fees
Back
grou
ndN
EW *
Back
grou
ndR
ENEW
AL
2021
Ado
pted
Fe
es

Open Council Workshop
To: Mayor and City Council
Through: Nate Burkett, City Manager
From: Char Stark, Finance Director
Date: August 9, 2021
Preliminary 2022 and Preliminary Conceptual 2023 Budget
BACKGROUND INFORMATION: Council please recall at the December 14 Council meeting the Conceptual budget of 2022 was accepted during the adoption of the 2021 Budget. Since then the City Management has been working on updating the Preliminary 2022 Proposed Budget as well as creating the Preliminary Conceptual Budget for 2023. Comparison of the Conceptual Budget and the current proposed 22 Budget is below: Final 2021 Conceptual 2022 Proposed
Preliminary 2022
Conceptual
2023 Total Budget $45,914,694 $36,955,847 $38,881,785 $37,164,867 Levy $17,744,425 $18,642,179 $18,567,222 $19,796,445 % Increase-2021 + 5.06% + 4.23% + 5.94% Tax Rate 69.426% 71.077% 69.515% 72.115%

Break down of 2022 Budget
Below is a detail of the 2022 budget by expense categories. Personnel Costs
Salaries budgeted with 3% increase, 4% lane changes and merit pay for Directors and managers.
Health insurance at 20% PERA no change from 2021. 7.5% for Coordinated, Police & Fire 17.7% and defined
Contribution @ 5%. New Requests:
o 2 officers hired in July o IT technician hired in April o Police administrative positions moved from 32 hours to 40 hours o Internal promotion of Marketing and Communications manager to Assistant City
Manager o Assistant Ice Arena from 32 hours to 40 hours o Additional Parks and Rec programmer hired in April
Other Charges for Services
5% increase to Fire contract 2% increase to DCC from actual 2021. (Budget was higher than needed in 2021.) Increases for maintenance agreements for City-wide applications New change in cell phone carriers from T Mobile to I-Net. New part-time cleaning services for City facilities. Continued allocation for neighborhood streets. Continued allocation for sidewalks and trails
Capital Outlay
City hall remodel on the administrative side Marthaler Park redevelopment plan 2022-2024 Increased budget for Park equipment replacement Increased budget for Technology replacements
o Increased security cameras o Data Center Licensing-2 year plan o Petro Van-Public Works o HVAC software-Public Works o Badge Printer o Plotter Printer o Portable projector and screens
Vehicle and Equipment
o Increase for squad change over costs o Replace Vehicle Counter/Radar
o Scenario Based Training Equipment o Secured cargo Storage for squads o Electronic Speed Signs o Our share of ladder truck for SMFD o Dump trucks (2) o Water tank o Plow o Diesel Mower 16’ o 60” Rider Mower o 44” Mower
Street Program
o Crusader o Oakdale/Thompson Round about (Dakota County led project)
Trails-Sidewalks
o Crusader o Bidwell (Safe Routes)
Breakdown of 2023 Conceptual Budget
Below is the detail breakdown of the 2023 conceptual budget
Personnel Costs Salaries budgeted with 3% increase, 4% lane changes. MV increase for salaried
employees with the elimination of the annual merit pay. Health insurance at 20% PERA no change from 2021. 7.5% for Coordinated, Police & Fire 17.7% and defined
Contribution @ 5%. New Requests:
o Building Inspector (grant funded for 2 years) o Communications/Grant writer o Public Works Park/Street Employee
Other Charges for Services
5% increase to Fire contract with added staff proposal 5% increase to DCC Increases for maintenance agreements for City-wide applications Continued part-time cleaning services for City facilities. Increased allocation for neighborhood streets. Continued allocation for sidewalks and trails.
Capital Outlay
Continued Marthaler Park redevelopment plan 2022-2024 Increased budget for Park equipment replacement Increased budget for Technology replacements
o Switch replacement on a regular replacement schedule o Council Chamber Retro Fit o SCADA upgrade

o 2nd year DATA Center Licensing o Digital signage for conference rooms o Digital signage for marketing in city facilities
Vehicle and Equipment
o Thermal heat/cool pump units (2) o 3rd Squad replacement o Electronic Speed Signs o Front Loader o Asphalt Hot Box o Trail Snow Removal Equipment o Utility Vehicle o 60” Mower o Cushman Mower
Street Program
o Annapolis (2 year) o Delaware Recon (County)
Trails-Sidewalks
o Oakdale/CSAH 73 After a review of the cash goals, some of the funds cash goal have been reevaluated. Since the policy has been in place for a while and the cash has been increasing a review was done to see if there was a need for some of the higher goals set a few years back. A chart below shows the new goals for the funds.

With the above changes implemented, there is $400,000 of LGA/Franchise fee revenues that have not been allocated for 2023. As part of the discussion at the OCWS, direction for this allocation is being requested. Allocation options to consider:
A Council directed project from the CIP plan o Arena Parking lot o Future Pool expansion o Sports Center conversion/Skate park
Increase street maintenance Increase Neighborhood street budget Increase trail/sidewalk budget Reduce the tax levy
Summary Staff is recommending this two-year budget; we feel the Council’s goals are being met with the budgets as presented.
Increase spending for street maintenance Increase spending for trails/sidewalks Maintaining City Infrastructure with the Park redevelopment of Marthaler and the
City hall remodel Tax rate remains steady for 2022.
FISCAL IMPACT:
STAFF RECOMMENDATION:
Discussion of the 22-23 Budgets. Proposed Budget/Levy
EDA Levy 2023 excess LGA/FF revenue Attachment: CIP-CEP Plan Graphs
Fund Department Account Amount

CAPITAL IMPROVEMENT AND EQUIPMENT PLAN
2022-2031
• Buildings• Park improvements: Parks, Arena, Pool, Dome• Street Improvements• Technology Improvements• Vehicle - Equipment• Sewer and Storm• Master Planning Documents and Definitions

City of West St. Paul 2022-2031 Capital Equipment (CEP) and Capital Improvement (CIP) Plan The CIP/CEP is a planning document that forecasts facilities and infrastructure future needs (CIP) and replacement of rolling stock and other equipment (CEP) over the next ten-year period. The CIP/CEP does not represent a spending commitment but instead it projects when capital expenditures are likely to occur should funding become available to complete current priorities. Funding derives from cash reserves, tax levies/property tax, Local Government Aids (LGA), MSA funds (state funding for municipal state aid streets), sales tax, utility franchise fees, benefit assessments, gifts and grants, and other available funds. Revenue sources are projected within this planning document. In those cases when projected revenues are not realized on schedule project delays should be expected. As the City plans for future infrastructure and facilities within the CIP/CEP City Council and staff weave together capital needs, those of the operating units, fiscal requirements of the organization and the delivery of services to the taxpayer, ratepayer and other stakeholders.
CIP/CEP Revenue Sources
Local Sales Tax At the 2018 general election, the voters authorized the City to request Legislative authority to adopt a ½-cent sales tax to fund future roadway infrastructure. The State did provide the authority and on June 24, 2019, the City Council adopted the sales tax to take effect on January 1, 2020. The sales tax authorization extends for a twenty-year period and is projected to raise $28 million in revenue over that period. The City would need to gain additional legislation to extend the tax beyond the 20-year authorization. The City has begun to receive the sales tax revenue on a monthly basis all throughout 2020. The COVID pandemic did not inhibit the City’s collection rate of this revenue. It is intended that 2020 revenues, and those received in subsequent years, provide the opportunity for the City to conduct major roadway rehabilitation and reconstruction projects on MSA, collector and other critical portions of the street system during the next twenty years. It is intended that this revenue source, along with allocations of utility franchise fee revenue, Local Government Aid (LGA), Municipal State Aid (MSA) allocations and benefit assessments provide the opportunity to conduct the annual street program on a cash basis.
1

Under the State sales tax authorization the City does have the option of using tax proceeds to cover debt payments for future infrastructure should the need arise. However, avoidance of additional borrowing for roadway projects until 2035 would allow the City to retire all existing debt currently in the portfolio. The Minnesota Department of Revenue is anticipating adoption of a new schedule of administrative fees against local revenues during 2020. These fees, to cover the cost of administering sales tax on our behalf is currently estimated at 2% of total sales tax paid within the community.
Local Government Aid Local Government Aid (LGA) is a general-purpose state aid that can be used for any lawful expenditure. Over the years, there have been shifts in how LGA is allocated by the City. Currently the preponderance of LGA is allocated toward CIP projects and debt retirement. The Department of Revenue certifies LGA for cities based on current LGA statutes, including any changes enacted during the most recent legislative session. LGA has not been a consistently reliable revenue source. In the years 2002-2004 and again between 2008 and 2011 the statewide LGA pool was reduced after aid levels had already been certified to cities in order to address State fiscal deficits in those years. Further, the LGA pool has declined as a percentage of City budgets since 2001 in which year total statewide LGA was at $607,826,080. In 2019, the pool was at $534,398,012, which was improved for 2020 to $560.4 million and 2021 to $564.4 million. Due to uncertainties of this revenue, the City attempts to allocate LGA conservatively.
Electric/Gas Utility Fees The City allows the electric and gas utility (Xcel) the opportunity to locate facilities within City rights of way under agreements approved as franchise ordinances. In exchange, the City charges the utility a fee, which the utility, in turn, levies against its customer base at 6% of electric bills and 3% of natural gas bills. For a typical residential customer the resulting charge is about $4.20/month on electric and $1.62/month of gas bills. The revenue generated is generally allocated toward CIP projects.
Municipal State Aid
Municipal State Aid (MSA) are funds allocated by the State to cities over 5,000 in population to assist with maintenance of larger collector/high volume streets designated as MSA roadways. Statewide there are 148 cities, which are allocated a pool (2020) of $192.4 million to supplement maintenance needs on 3,795 miles of roadways. The pool is allocated based upon a formula that includes population (50%) and construction needs (50%). The pool receives its funding from the Minnesota Highway Users Tax
2

Distribution Fund. The City can designate a portion of the allocation toward general street maintenance with the remaining portion toward construction projects. West St. Paul has typically reserved 80% of the annual allocation toward construction projects. Recent allocations are as follows:
Cell Tower Antennae Leases The City has had leases with wireless antennae companies for a number of years. It currently allocates lease revenues toward the general fund but for that portion which is due to leases of park property. In this case, 100% of the lease revenue is allocated to the Park Improvement Fund. One of the assets on which antennae leases are located is the Marie Avenue Water Tower. The City retains 50% of the gross revenue from these leases with St. Paul Regional Water, the owner of the tower, retaining the other 50%. The remaining leases are for antennae monopole sites.
Benefit Assessments As with most cities in the State, the City assigns benefit to abutting properties when a street that abuts that property receives a major maintenance improvement. The level of benefit is by adopted Council policy, which then is reviewed for each construction project by an appraiser to assure that benefit beyond that which is proposed for assessment is realized. Currently the City levies a benefit assessment at 25% of project costs for street reconstruction projects and 35% of project costs for mill and overlay projects. The property owner can pay resulting assessments within 30 days of conclusion of the assessment public hearing or the assessments will be levied on the property tax bill. Currently levied assessments accrue over a maximum of ten years at a rate of interest of 2% above the cost of borrowing of the City.
Grants and Third Party Funding
It has been the practice of the City to seek third party funding to leverage all other infrastructure project funding. Moreover, it is the current direction that receipt of significant grant dollars would be expected to move the project in question to the front of the line. It is also the direction that projects that are perceived as high value to Federal, State, or County funders likely will not proceed absent significant participation from these funders.
Fund Reserves It is the direction of the City that each enterprise and revenue fund and component unit of the City budget toward achieving target cash reserves. These reserves are intended, in part, to provide matching funds for grant approvals and resource flexibility sufficient to take advantage of opportunities or unforeseen occurrences.
3

Below is a revision of the cash goals for each of the cost centers below.
Cost Centers Government Facility Capital Fund In 2010, the City constructed a 49,931 square foot Public Works facility at 403 Marie Avenue. Between 2016 and 2020, the City conducted major maintenance on the 43,393 square foot 1968 City Hall, Police, and 1999-ca. Fire facility at 1616 Humboldt Avenue. Included was reconstruction of the parking lot, new roofing, HVAC on all but the Fire facility, new windows, and a remodel of 14,171
4

square foot police and lower level storage portions of the building and conference and storage facilities within the public portions of the building. In 2022, a proposed remodel of the administrative side of City Hall is being proposed in the 2022 budget. Upon completion City Hall will be completely remodeled and should provide time for the City to plan for the future of City Hall. A goal was established to grow a building fund in order to provide capacity for future major maintenance projects. The 2020-29 CIP projected a $250,000 annual budget allocation with a target reserve of $5 million. Creation of reserves have been proposed through the fund balance policy, which designates excess revenues, and annual designations of LGA/Franchise fee revenue toward this fund through the budget process. By 2030, the City will be near the need for major maintenance (roof etc.) at the Public Works facility. The City needs also to plan for updates to the 2600 square foot portion of the Fire facility allocated toward offices and the 7,520 square foot General Government portion of the City Hall within the next several years. To address each of these needs by 2030 an annual allocation of $400,000 would be required to assure funding is available for major facility maintenance on a reasonable schedule. This would reduce the cash target to $4 million by 2030. Parks Improvement Fund and Pool, Ice Arena and RAC (Sports Dome) Enterprise Funds Between 2012 and 2018 the City completed a number of improvements to the Park System including construction of the Sports Dome ($7.072M), and reconstruction of Harmon Park ($6.8M). Also completed was rehabilitation of the Sports Complex ($1.63M) and major rehabilitation of the Ice Arena in partnership with SD197 and the City of Mendota Heights ($1.866 M) all of which required debt issuance. Within this CIP, it is projected that the Park Capital Project fund be seeded with available Local Government Aid dollars (LGA) and utility franchise fees to allow for future improvements to the Park system, to include the Pool, Ice Arena, Sports Dome, and recreational trails while avoiding future debt issuance. The City completed the Marthaler Master Plan in 2018. This is the last of the community scale parks proposed for redevelopment. In past years, it had been anticipated that the City would issue debt to complete the $3.1 million in improvements projected in this plan. Within this document, as in the most recent plan, it is projected to both pursue only plan segments that are able to leverage third party funding and to accumulate cash reserves sufficient to provide for those plan elements while avoiding debt issuance. The Twin Cities YMCA currently operates the Outdoor Pool (ca. 1950; major renovations in 1985 and 1999) between June and August. The City is responsible, as the property owner, for maintenance and upkeep of the facility. Due to the identified need of about $400,000 in capital improvements, it is anticipated that this facility will require about $130,000 annually in taxpayer support over the next five years. It is anticipated that the City may be reviewing alternatives in operating models in coming years.
5

The Ice Arena (ca. 1972 with major renovations in 1997 and 2015-2017) provides indoor skating opportunities for School District 197 teams, for contracted Booster Club skating and open skate opportunities. In an averaged year, it is projected that WSP taxpayer support is at about $62,000. In 2015, the City entered a Joint Powers Agreement (JPA) with SD 197 and the City of Mendota Heights to jointly renovate the John V. Hoene Ice Arena located in West St. Paul. Each of these partners contributed $555,333 under the JPA. Through 2019, $1,926,276 in capital improvements have been made to the Arena associated with the JPA. Additional parking lot and HVAC improvements have been programmed within this CIP. Beyond these capital expenditures there are not additional projects currently programmed. However, there has been some discussion within the community to improve locker facilities and to add a dry floor practice area. Anything of that nature would be an undertaking outside of the current capital plan or funding ability of the City. The Regional Athletic Center (RAC) opened for business on November 19, 2012 at 1645 Livingston Avenue on property that had formerly been the location of the Public Works Department adjacent to City Hall. The RAC is operated by SFDMG under contract with the City. As part of the financing of the facility the City is required to set aside funds for turf replacement (projected in 2023) and replacement of the Dome fabric (projected in 2028). The annual taxpayer support of the RAC is projected at $231,820 per year due to levy support required for debt. This issue will be retired in 2026 after which principal payments on the non-taxable $2,560,000 abatement bond commence. That issue will retire in 2034. During 2020, an unbudgeted $400,000 replacement of four emergency exit stairwells will take place due to structural failures. Fund reserves will cover this expense. Cash reserve goals for the Park system are: Fund Goal Year End 2020 Park $1,000,000 (Revised) $1,240,220 Pool Incl. $ 262,158 Arena $1,300,000 $ 472,326 RAC $3,000,000 $4,223,317 (refunding of bonds took place at the end of the year in 2020) Cash reserves are anticipated through designation of LGA and Franchise fee revenues, through fund balance policy directing excess revenues and from budget allocations toward specific projects in advance of moving forward with individual projects. The metric for Park Improvements is 4-years of average capital needs. For Arena and RAC, the metric is one year of operations and long-term capital needs.
6

Street Improvement Fund Typical City allocation of resources toward the annual pavement management program (initiated in 2006) has been about $2.4 million (2008-2014) excepting the $46 million State Highway 3 project (2014-2017) which absorbed $26 million in local cash and debt issuance. 2017-18 projects totaled about $10.9 million in part due to County led projects with a local cost share. The 2021 improvement project is the Moreland street improvement. The project will utilize the sales tax collected in 2020 and 2021 as well as MSA and assessments. On July 23, 2018, the City adopted a prioritization of future street reconstruction and mill/overlay projects (referred to as the Pavement Management Program). Priority One streets (those with a Pavement Condition Index (PCI) below 46) totaled about $66 million with Priority 2 streets (PCI below 80) adding another $69 million in future road improvements. The City has typically funded street improvements from the property tax (or debt) supplemented by Minnesota State Aid (MSA) dollars ($836,045 in 2019 and $867,963 in 2020); utility funds if projects include improvements to those systems, benefit assessments, and grant funds. Beginning in 2021 the City will be able to use Sales Tax revenues toward critical collector roadway infrastructure as adopted by the State Legislature in 2019. This funding is allocated over the next twenty years toward the approximately $70 million in Priority One and Two collector street maintenance needs within the pavement management program. New within the 2021 CIP is a recognized need to address local and neighborhood roadways that have not had a funding source for the public portion of major maintenance projects beyond debt issuance. Proposed, starting in 2021 is a property tax levy to provide a non-debt approach toward major maintenance of the $64 million in neighborhood street maintenance needs within the pavement management program. The initial 2021-2022 levies are modest. However, it is proposed that as debt levy requirements are reduced in future years (through retirement of existing debt and avoidance of new debt) the neighborhood street levy grows in a corresponding fashion. Thus, the benefits of debt reduction accrues directly to residents realizing improved neighborhood streets within the community. The assessment policy, recognizing a unique benefit to properties abutting public improvements, was amended during 2018. For reconstructed streets, the cost burden upon benefitting properties continues at 25% of total project costs with pre-project sample benefit appraisals verifying benefit at least as great as proposed assessments, which in many cases are on a per lot basis. Mill/overlay projects are assessed at 35% of project costs. In 2019, the assessment policy was revised again concerning sidewalks. The City now funds through a tax levy new construction sidewalk projects. Replacement of existing sidewalk panels during a street improvement project continues as an assessable improvement.
7
Street Maintenance Fund In spite of strides being made on major street maintenance as noted above, the pavement management priority one and two projects are currently not on track for major maintenance sufficient to achieve an average PCI (pavement condition index) of 70, which has been the goal. A measure the City has used to extend pavement life has been application of temporary drive lane overlays. Pavement surface life can generally be extended for an additional five to seven years while the individual road segment gets in queue for a major rehabilitation or reconstruction project. It is from this fund that contractual and similar services have been expensed for Robert Street sidewalk snow removal, planting bed maintenance and trash and litter control. The fund also provides for citywide pavement crack sealing, seal coating and striping as a member of a consortium managed by the City of Burnsville. The fund also provides for street lighting and signal maintenance, signage, winter ice control salt, street patch materials, and right of way tree trimming. The goal for cash reserves within the street fund is two years of operations, which creates a metric of $700,000. Cash exceeds the goal but the fund is being deficit budgeted currently and demands on the budget are growing.
New in 2021, the City is splitting out all maintenance expenses of the Robert Street corridor. This move will assist the Council and public with a more complete understanding of the annual allocations directed toward the corridor. Cash Goal: $700,000 Cash Balance $1,178,616 Bikeways and Walkways Improvement Fund In 2011, the City endeavored to study its pedestrian and bicyclist facilities to provide a long term plan to improve from the existing condition. It contracted with the planning firm of Hoisington Koegler Group. The citizen participation portion of the planning project was from April to October after which the City Council accepted the Bicycle and Pedestrian Master Plan dated December 5, 2011. The plan is a “tool to guide the long term efforts (25 years or more) to physical projects, programs and policies that will support walking and biking in West St. Paul.” The priorities identified within the plan are the following routes with status as: • NURT (AKA River to River Regional Trail way)
Segment from Wentworth to Oakdale/Thompson; County awarded bid for Robert Street underpass July 2020 Segment through Marthaler/ Garlough Parks; County/City funded for design as a future joint County project Segment north of Oakdale/Thompson; County submitted federal grant request during 2020
• Charlton from Annapolis to Marie Walkway exists on at least one side of the road, some areas both sides
8
(Emerson to Butler and Arion to just north of Bernard) • Robert Street from Annapolis to Mendota Road
Completed as part of the 2014-2017 Robert Street Reconstruction • Livingston from Wentworth to Mendota Road
Completed in 2019 • Oakdale from Bernard to Emerson and from Thompson to Mendota Road
Segment from Mendota Road to Wentworth completed in 2019 Segment from Bernard to Emerson:
Emerson to West Chester Place no walk West Chester Place to Conver walk on west side Conver to Bernard walk on both sides
• Bidwell from Butler to Thompson Annual Safe Routes to School Grant funding request; not yet funded
• Marie from Delaware to Oakdale Final segment completed in 2019
• Butler from Delaware to Highway 52 Delaware to Smith no walk Smith to Manomin walk on north side only Manomin to Stassen walk on both sides Stassen to Hwy 52 no walk
Additionally, main routes were identified as • Delaware from Annapolis to Marie
Included in 2020-2029 City CIP as 2025 project; requires County and Mendota Heights approval • Wentworth from Delaware to South St. Paul
Segment from Delaware to Robert completed in 2019 Pedestrian Crossing at Marthaler Lane completed in 2020 Marthaler to Oakdale existing trail Oakdale to Meadows trail through Sports Complex Meadows to TH 52 trail on south side
• Mendota Road from Delaware to South St. Paul Delaware to Charlton no walk TH 62 intersection to Robert walk on north side Robert to Oakdale walk on south side (IGH)
9

Oakdale to TH 52 walk on both sides The City has been collaborating with Dakota County to facilitate construction of the final leg of the Regional River to River Trail by 2021. Dakota County awarded the Robert Street underpass project, located at Crawford Drive, on July 14, 2020. The partners are working on securing grant funding for additional legs of this important regional asset. Included is a “regionalism” of the Garlough/Marthaler Park segment which is under design and the segment through the former Thompson Oaks golf course property which has been conceptually designed. Also is the segment from Thompson/Oakdale to the north for which a third party grant request has been submitted. The City Council directed that a new cost center of the CIP be established with an annual property tax levy starting in 2021 to complete sidewalk/trail gaps identified within the Master Plan. This schedule is included within this CIP. This plan allocates a $500,000 annual levy directed primarily toward completion of sidewalk gaps for upcoming street pavement management projects and secondarily toward the local match of third party grant funded transportation trails. The street project coordination is the most cost efficient project approach and limits resident impacts to one co-terminus construction project. This approach also improves the opportunity to limit right-of-way acquisition and utility impacts if we are able to reduce drive surface widths in the process. Including neighborhood scale walkway projects, the projected level of annual expenditure need is beyond 30 years. Cash Goal: None Cash Balance (2020) $34,208 Technology Replacement Fund The Technology fund provides for ongoing PC replacement and other infrastructure needs projected, on average at about $55,000/year. Over the next five years, however, budgetary allocations are somewhat greater due to the planned replacement of servers and a new phone system. West St. Paul has a history of aggressively improving technology capabilities as a method of improving operational efficiencies and customer service delivery. Due to the importance of technology to the operation, the CEP allocates fixed transfers of LGA funds annually to the cost center. In order to maintain a reasonable replacement schedule the fund has a cash reserve target of two years of capital requirements. Cash Goal: $200,000 (revised) Cash Balance (2020) $215,478
10
Vehicle and Equipment Reserve Fund Over the next five years, it is proposed that utility franchise fees be allocated to the CEP (Capital Equipment Plan) to provide stability within the fund with targeted replacements averaging $800K/year. In order to maintain a reasonable replacement schedule the fund has a cash reserve target of at least two years of averaged capital replacement needs and thus a cash reserve target of $2 million. This metric provides flexibility to take advantage of pricing opportunities from time to time and provides for continued replacement of rolling stock in those instances where budget shortfalls may not otherwise allow for such. Cash Goal: $2,000,000 Cash Balance (2020) $1,110,733. Sanitary Sewer Enterprise Fund The City’s greatest and most critical infrastructure need at present is to update or replace the remaining aging lift stations and force mains within the community. Projected is reconstruction of Lift Stations 1 and 4, an upgrade of Lift Station 2 and replacement of the force mains associated with these stations as well as Lift Stations 3 and 6. Within our Capital Planning for the near term, these projects are the top priority. Much of the sanitary sewer infrastructure is beyond fifty years of age. Failure of lift stations or associated force mains can result in deleterious service delivery impacts to significant areas of the community including both homes and businesses. Hence, we see proceeding with the programmed projects as mandatory with completion by 2024. Additionally, we must continue forging ahead on meeting Metropolitan Council directed I&I goals (infiltration & inflow) to reduce storm water infiltration into the sanitary piping system (which is later treated at the Metro plants). The fund has a cash reserve target of infrastructure replacement needs plus one year of operations. Intended is creation of $4 million in cash reserves going forward. Cash Goal: $4,000,000 Cash Balance (2020) $1,048,097. Storm Water Enterprise Fund The Storm water utility was created in 2005 (for billings beginning February 2006) in order to respond to the 1972 Federal Clean Water Act and the National Pollutant Discharge Elimination System (NPDES) under a MS4 Phase II permit (municipal separate storm sewer system). These EPA directed programs receive local administration through the MN PCA and watershed districts and watershed management organizations (WMO). West St. Paul is wholly contained within the Lower Mississippi WMO along with that portion of St. Paul just to our north to the Mississippi River, Mendota Heights, South St. Paul, Sunfish Lake, and a portion each of Inver Grove Heights, Lillydale, and Mendota. The utility provides funding for the administration, planning, implementation and maintenance of the storm water management programs and projects. The utility charges each developed parcel of property within the community based upon a residential equivalency factor (REF). Each single-family property is charged one REF over the course of a year billed by the
11
St. Paul Regional Water Utility on behalf of West St. Paul. Other types of properties are charged a multiplier of an REF. For instance, commercial property is charged 7.9 REF’s/acre which is a multiplier created by the amount of storm water runoff anticipated from commercial rooftops and parking lots. In total, there are about 9600 REF’s across the community. Over the next five years, the CIP/CEP anticipates about $800,000 in projects and equipment replacement from this fund in addition to labor and other maintenance and administrative expense. The fund has a cash reserve target of at least capital needs plus one year of operations. There are significant storm water/wetland reclamation project is proposed on the former Thompson Oaks golf course property, which may absorb a significant portion of cash reserves. Cash Goal: $1,000,000 Cash Balance $1,848,226 Summary Within this document is the projected capital needs for each of the above cost centers laid out in Excel column fashion. The definition of the City of West St. Paul’s master plans is included in this plan for reference. Each year this document is updated and approved by the City Council during the budget process. This plan and policies provide direction and goal for the City Council and City staff for the next 10 years. This document should not be considered absolute and final but more of a fluid document while providing direction and financial stability for the next 10 years and beyond.
12

Blank Page
13

ALL CAPITAL PROJECTS BY YEAR AND PROJECT TYPE
Capital Equipment Plan 2022 2023 2024 2025 2026 2027 2028 2029 20302031 & Later
Years TOTAL ALL YEARSBuilding 10,000 3,000 3,000 14,700 1,000 1,000 1,000 1,000 ‐ 20,000 54,700 Technology (411) 108,119 156,119 67,500 261,000 207,000 75,800 78,000 70,000 273,000 73,000 1,369,538 Vehicle‐Equipment (401) 1,178,500 633,000 712,000 453,000 409,000 458,500 464,700 349,000 594,000 2,478,500 7,730,200 Total Parks & Park Facilities 65,000 82,500 42,500 60,000 ‐ ‐ ‐ ‐ ‐ ‐ 250,000 Sewer (602) 58,900 ‐ 4,100 550,000 70,000 60,000 ‐ 72,000 90,000 354,500 1,259,500 Storm (600) ‐ 260,000 ‐ ‐ ‐ ‐ ‐ ‐ ‐ ‐ 260,000 Total CEP‐ALL 1,420,519 1,134,619 829,100 1,338,700 687,000 595,300 543,700 492,000 957,000 2,926,000 10,923,938
Capital Improvement Plan
Building Capital Improvement ‐current 1,500,000 500,000 250,000 ‐ ‐ ‐ ‐ ‐ ‐ ‐ 2,250,000 Street Projects 1,643,250 3,410,000 2,890,000 4,040,000 3,280,000 1,760,000 2,190,000 4,000,000 2,000,000 15,659,611 40,872,861 Sidewalks/Trails (PED Plan) 750,000 410,925 400,000 ‐ 1,500,000 285,000 470,000 300,000 825,000 ‐ 4,940,925 Local Street Pavement Plan ‐ ‐ ‐ ‐ ‐ ‐ ‐ ‐ ‐ ‐ ‐ Total Parks & Park Facilities 1,705,500 1,684,000 2,418,700 517,000 247,500 222,500 153,000 138,000 1,033,500 13,500 8,133,200 Sewer 3,150,000 ‐ ‐ ‐ ‐ ‐ ‐ ‐ ‐ ‐ 3,150,000 Storm 150,000 ‐ 210,000 ‐ ‐ 220,500 ‐ ‐ 231,525 ‐ 812,025 Total CIP All 8,898,750 6,004,925 6,168,700 4,557,000 5,027,500 2,488,000 2,813,000 4,438,000 4,090,025 15,673,111 60,159,011
TOTAL CEP AND CIP 10,319,269 7,139,544 6,997,800 5,895,700 5,714,500 3,083,300 3,356,700 4,930,000 5,047,025 18,599,111 71,082,949 2022 2023 2024 2025 2026 2027 2028 2029 2030 2031
REVENUESBonds‐General Obligation bonds, Sewer Bonds 1,054,095 ‐ ‐ ‐ ‐ ‐ ‐ ‐ ‐ ‐ 1,054,095 Federal Funds 2,095,905 ‐ 178,750 1,480,250 ‐ ‐ ‐ ‐ ‐ ‐ 3,754,905 Grants‐Dakota Co, State, Met Council ‐ ‐ 1,955,200 ‐ ‐ ‐ ‐ ‐ ‐ ‐ 1,955,200 State Aid‐Street maint. MSA ‐ 1,440,000 1,350,000 ‐ 2,000,000 700,000 900,000 1,500,000 1,000,000 ‐ 8,890,000 Utility Franchise/LGA allocation 600,000 675,000 350,000 450,000 480,000 350,000 450,000 450,000 550,000 4,805,000 9,160,000 Utility Franchise/LGA allocation 1,050,000 950,000 712,651 902,400 723,000 652,428 750,000 550,000 1,050,000 2,617,500 9,957,979 Other Revenues 1,065,800 112,000 105,000 107,000 112,000 112,000 112,000 112,000 107,500 112,000 2,057,300 Arena Funds ‐ ‐ ‐ 10,000 ‐ ‐ ‐ ‐ ‐ ‐ 10,000 Dome Funds ‐ 1,005,500 ‐ 5,000 ‐ ‐ ‐ ‐ 600,000 ‐ 1,610,500 Sewer Funds 58,900 ‐ 4,100 550,000 70,000 60,000 ‐ 72,000 90,000 354,500 1,259,500 Storm Water Funds ‐ 260,000 210,000 ‐ ‐ 220,500 ‐ ‐ 231,525 ‐ 922,025 Special Assessments 322,500 81,500 132,000 239,250 328,000 220,000 328,500 700,000 ‐ 3,131,922 5,483,672 Abatements ‐ ‐ 40,000 40,000 40,000 40,000 40,000 40,000 40,000 ‐ 280,000 Local Sales Tax 1,313,000 1,326,130 1,339,391 1,352,785 1,366,313 1,379,976 1,393,776 1,407,714 1,421,791 13,659,611 25,960,487 LEVY REQUIREMENT 806,000 812,120 818,362 824,730 831,224 837,849 844,606 851,498 858,528 865,698 8,350,615 TOTAL REVENUES INCLUDING LEVY REQUIREMENT 8,366,200 6,662,250 7,195,455 5,961,415 5,950,537 4,572,753 4,818,882 5,683,212 5,949,344 25,546,232 80,706,278
(Use of Cash/Add to Cash (1,953,069) (477,294) 197,655 65,715 236,037 1,489,453 1,462,182 753,212 902,319 6,947,121 9,623,329
City Hall facility fund (1,000,000) 7,000 ‐ 240,300 284,000 259,000 354,000 354,000 350,500 4,735,000 5,583,800 Parks (370,200) (174,000) (187,000) (93,000) 161,500 86,500 206,000 171,000 125,500 245,500 171,800 Street Improvement (7,750) (562,370) 110,141 (967,715) 414,313 539,976 432,276 (392,286) 421,791 1,131,922 1,120,299 Technology (6,119) 20,881 34,500 (59,000) (5,000) 21,200 24,000 32,000 (71,000) (16,000) (24,538) Trails‐Sidewalks (250,000) 89,075 140,000 540,000 (960,000) 255,000 70,000 240,000 (285,000) 500,000 339,075 Vehicle and Equipment replacement fund (475,000) (170,000) (218,349) 80,400 10,000 (10,072) 31,300 (3,000) 2,000 (15,000) (767,721) Storm (150,000) ‐ ‐ ‐ ‐ ‐ ‐ ‐ ‐ ‐ (150,000)
‐ Total change in cash funds (1,953,069) (477,294) 197,655 65,715 236,037 1,489,453 1,462,182 753,212 902,319 6,947,121 9,623,329
14

Blank Page
15

BUILDINGSThis cost center accounts for the improvement/maintenance
expenses to the City Facilities: City Hall and Public Works Building
16

Capital Fund‐City Hall (CEP) 2022 2023 2024 2025 2026 2027 2028 2029 20302031 and future
yearsTOTAL ALL YEARS
Chairs 3,000 3,000 3,000 1,000 1,000 1,000 1,000 1,000 ‐ ‐ 17,000 CO & NO Gas Detector Sensor 7,000 ‐ ‐ 7,700 ‐ ‐ ‐ ‐ ‐ ‐ 14,700 Dumpster ‐ ‐ ‐ 6,000 ‐ ‐ ‐ ‐ ‐ ‐ 6,000 AC unit in Server room ‐ ‐ ‐ ‐ ‐ ‐ ‐ ‐ ‐ 20,000 20,000 Total CEP 10,000 3,000 3,000 14,700 1,000 1,000 1,000 1,000 ‐ 20,000 57,700
City Hall Admin remodel 1,500,000 500,000 250,000 ‐ ‐ ‐ ‐ ‐ ‐ ‐ 2,250,000 City Hall Savings Account 250,000
Total CIP 1,500,000 500,000 250,000 ‐ ‐ ‐ ‐ ‐ ‐ ‐ 2,500,000
Total CEP/CEP 1,510,000 503,000 253,000 14,700 1,000 1,000 1,000 1,000 ‐ 20,000 2,557,700
REVENUES
Utility Franchise/LGA allocation 500,000 500,000 250,000 250,000 280,000 255,000 350,000 350,000 350,000 4,750,000 8,085,000 Investment Income 10,000 10,000 3,000 5,000 5,000 5,000 5,000 5,000 500 5,000 53,500
TOTAL REVENUES 510,000 510,000 253,000 255,000 285,000 260,000 355,000 355,000 350,500 4,755,000 8,138,500
(Use of Cash/Add to Cash (1,000,000) 7,000 ‐ 240,300 284,000 259,000 354,000 354,000 350,500 4,735,000 5,580,800
Current Cash (2020) + TransferProjected Cash 95,856 102,856 102,856 343,156 627,156 886,156 1,240,156 1,594,156 1,944,656 6,329,156 Goal $5,000,000 for future CH needs
17

EQUIPMENTVEHICLE REPLACEMENT
This cost center accounts for the annual equipment and vehicle replacements for all departments
18

Capital Fund‐equipment/vehicle (CEP) Department 2022 2023 2024 2025 2026 2027 2028 2029 20302031 and future
yearsTOTAL ALL YEARS
Vehicle Code ‐ ‐ ‐ ‐ ‐ ‐ ‐ ‐ ‐ ‐ ‐ Vehicle Community Dev ‐ ‐ 30,000 30,000 30,000 30,000 30,000 ‐ ‐ ‐ 150,000 1/2 T Pick‐up Truck Engineering ‐ ‐ ‐ ‐ ‐ ‐ ‐ ‐ ‐ ‐ ‐ CO & NO Gas Detection Sensor Bldg. Maint. ‐ ‐ ‐ ‐ ‐ ‐ 7,700 ‐ ‐ 7,700 Salt Shed Roof Bldg. Maint. ‐ ‐ ‐ ‐ ‐ ‐ ‐ ‐ ‐ ‐ ‐ RPZ Valves‐annual‐operational Bldg. Maint. ‐ ‐ ‐ ‐ ‐ ‐ ‐ ‐ ‐ ‐ ‐ Thermal heat/cool pump units ceiling mounted (7) Public Works 8,000 16,000 ‐ ‐ ‐ ‐ ‐ ‐ ‐ ‐ 24,000 GEO Thermal Unit‐floor unit Public Works ‐ ‐ 33,000 ‐ ‐ ‐ ‐ ‐ ‐ ‐ 33,000 GEO Controller Public Works 12,000 ‐ ‐ ‐ ‐ ‐ ‐ ‐ ‐ ‐ 12,000 Vehicle Bldg. Inspections ‐ ‐ ‐ ‐ ‐ ‐ ‐ ‐ ‐ ‐ ‐ Comp Plan Update Community Dev ‐ ‐ ‐ ‐ ‐ ‐ ‐ ‐ ‐ ‐ ‐ Vehicle Planning ‐ ‐ ‐ ‐ ‐ ‐ ‐ ‐ ‐ ‐ ‐ Marked Squad Police 46,000 47,000 47,000 48,000 48,000 49,000 49,000 50,000 50,000 154,000 588,000 Marked Squad 2 Police 46,000 47,000 47,000 48,000 48,000 49,000 49,000 50,000 50,000 154,000 588,000 Marked Squad 3 Police ‐ 47,000 ‐ ‐ 48,000 ‐ ‐ 50,000 ‐ 52,000 197,000 Unmarked Squad Police 30,000 31,000 31,000 31,000 32,000 32,000 32,000 33,000 33,000 33,000 318,000 Car Change over Police 20,000 20,000 20,500 21,000 22,000 23,000 24,000 25,000 25,000 25,000 225,500 CSO Truck Police ‐ ‐ ‐ 42,000 ‐ ‐ ‐ ‐ ‐ ‐ 42,000 Radar Replacement Police 5,000 ‐ ‐ ‐ ‐ ‐ ‐ ‐ ‐ ‐ 5,000 Less Lethal Weapons Police 5,200 ‐ ‐ ‐ ‐ ‐ ‐ ‐ ‐ ‐ 5,200 Rifle Steel Targets Police ‐ ‐ ‐ ‐ ‐ ‐ ‐ ‐ ‐ ‐ ‐ Body Camera's Police ‐ ‐ ‐ ‐ ‐ ‐ ‐ ‐ ‐ ‐ ‐ Replacement of CBRN Masks Police ‐ ‐ ‐ ‐ ‐ ‐ ‐ ‐ ‐ ‐ ‐ Squad Video Replacement Police ‐ ‐ ‐ ‐ ‐ ‐ ‐ ‐ ‐ ‐ ‐ Squad Radios Police ‐ ‐ ‐ ‐ ‐ ‐ ‐ ‐ ‐ ‐ ‐ Taser Replacements Police ‐ ‐ ‐ 19,000 ‐ ‐ ‐ ‐ 20,000 ‐ 39,000 Voice Dictation Software & Equip Police ‐ ‐ 7,500 ‐ ‐ ‐ ‐ ‐ ‐ ‐ 7,500 Replacement of Tire Deflation Devices Police ‐ ‐ 5,000 ‐ ‐ ‐ ‐ ‐ ‐ ‐ 5,000 Scenario Based Training Equipment Police 4,000 ‐ ‐ ‐ ‐ ‐ ‐ ‐ 5,000 ‐ 9,000 Electronic Speed Signs Police 10,000 10,000 10,000 ‐ ‐ ‐ ‐ ‐ ‐ ‐ 30,000 Pole Mounted Surveillance Camera Police ‐ ‐ ‐ ‐ ‐ ‐ ‐ ‐ ‐ ‐ ‐ Secured Cargo Storage For Squads Police 15,000 ‐ ‐ ‐ ‐ ‐ ‐ ‐ ‐ ‐ 15,000 Ballistic Shield Replacement Police ‐ ‐ ‐ ‐ ‐ ‐ ‐ ‐ ‐ 15,000 15,000 1 T Dump Truck Street ‐ ‐ ‐ ‐ ‐ ‐ 87,000 ‐ 87,000 ‐ 174,000 Carbide Plow Cutting Edges Street ‐ ‐ 4,000 ‐ ‐ 4,500 ‐ ‐ 5,000 ‐ 13,500 Truck Tires Street 14,000 ‐ ‐ ‐ 18,000 ‐ ‐ ‐ 20,000 ‐ 52,000 Tire Changer Street ‐ ‐ ‐ ‐ ‐ ‐ ‐ ‐ ‐ ‐ ‐ Tool Box Street 10,000 ‐ ‐ ‐ ‐ ‐ ‐ ‐ ‐ ‐ 10,000 Tandem Dump Truck # 68‐15 yrs. Street ‐ ‐ ‐ ‐ ‐ ‐ ‐ ‐ ‐ 480,000 480,000 Paint Sprayer Street ‐ ‐ ‐ ‐ ‐ ‐ ‐ ‐ 8,000 ‐ 8,000 Pant Trailer Street ‐ ‐ ‐ ‐ ‐ ‐ ‐ ‐ 5,000 ‐ 5,000 1/2 T Pick‐up Truck Street ‐ ‐ ‐ ‐ ‐ ‐ ‐ ‐ ‐ 45,000 45,000 Compressor Street ‐ ‐ ‐ ‐ ‐ ‐ ‐ ‐ ‐ ‐ ‐ Dump Truck ‐ Single Axle s/b replaced in 2018‐may not pa Street ‐ ‐ ‐ ‐ ‐ ‐ ‐ ‐ ‐ 250,000 250,000 Fork Lift Street ‐ ‐ 40,000 ‐ ‐ ‐ ‐ ‐ ‐ ‐ 40,000 14" Asphalt Planer Street ‐ ‐ 18,000 ‐ ‐ ‐ ‐ ‐ ‐ ‐ 18,000 Dump Truck ‐ Single Axle‐15 yrs. Street 230,000 ‐ ‐ ‐ ‐ ‐ ‐ ‐ ‐ 250,000 480,000 Dump Truck ‐ Single Axle‐15 yrs. Street 230,000 ‐ 20,000 ‐ ‐ ‐ ‐ ‐ ‐ 235,000 485,000 Roller Trailer Street ‐ ‐ ‐ ‐ ‐ ‐ ‐ ‐ ‐ ‐ ‐ Water tank Street 20,000 ‐ ‐ ‐ ‐ ‐ ‐ ‐ ‐ ‐ 20,000 Asphalt Hot Box Street ‐ 70,000 ‐ ‐ ‐ ‐ ‐ ‐ ‐ ‐ 70,000 Front End Loader Street ‐ 140,000 ‐ ‐ ‐ ‐ ‐ ‐ ‐ 400,000 540,000 Snow Plow Attachment Loader Street ‐ ‐ 24,000 ‐ ‐ ‐ ‐ ‐ ‐ ‐ 24,000 1/2 T Pick‐up Truck Street ‐ ‐ 50,000 ‐ 45,000 50,000 ‐ ‐ ‐ ‐ 145,000 3/4 T Pick‐up Truck Street ‐ ‐ ‐ 50,000 ‐ ‐ ‐ ‐ ‐ ‐ 50,000 Paving Roller Street ‐ ‐ ‐ 35,000 ‐ ‐ ‐ ‐ ‐ 40,000 75,000
19

Chipper Street ‐ ‐ ‐ ‐ 50,000 ‐ ‐ ‐ ‐ ‐ 50,000 Brine Maker Street ‐ ‐ ‐ ‐ ‐ 16,000 ‐ ‐ ‐ ‐ 16,000 Loader Backhoe Street ‐ ‐ ‐ ‐ ‐ 160,000 ‐ ‐ ‐ ‐ 160,000 3" Wheel Saw Street ‐ ‐ ‐ ‐ ‐ ‐ ‐ 15,000 ‐ ‐ 15,000 Aerial Lift Truck Street ‐ ‐ ‐ ‐ ‐ ‐ ‐ ‐ ‐ 150,000 150,000 skid steer Street ‐ ‐ ‐ ‐ 60,000 ‐ ‐ ‐ ‐ ‐ 60,000 Snow Blower large Street ‐ ‐ ‐ ‐ ‐ ‐ ‐ ‐ ‐ 183,000 183,000 Street Paver Street ‐ ‐ ‐ ‐ ‐ ‐ ‐ ‐ 100,000 ‐ 100,000 Tenant Sweeper Street ‐ ‐ ‐ ‐ ‐ ‐ 30,000 ‐ ‐ ‐ 30,000 Street Light replacement to LED Street ‐ ‐ 220,000 ‐ ‐ ‐ ‐ ‐ ‐ ‐ 220,000 Trail Snow Removal Equipment Parks ‐ 85,000 ‐ ‐ ‐ ‐ ‐ ‐ ‐ ‐ 85,000 Plow Parks 7,300 ‐ ‐ ‐ ‐ ‐ ‐ ‐ ‐ ‐ 7,300 Fertilizer Sprayer Parks ‐ ‐ 60,000 ‐ ‐ ‐ ‐ ‐ ‐ ‐ 60,000 1 T Dump Truck Parks ‐ ‐ ‐ ‐ ‐ ‐ 87,000 83,000 ‐ ‐ 170,000 Grounds Sweeper Parks ‐ ‐ ‐ ‐ ‐ ‐ ‐ ‐ 41,000 ‐ 41,000 3/4 T Pick‐up Truck Parks ‐ ‐ ‐ 50,000 ‐ ‐ 60,000 ‐ 50,000 ‐ 160,000 48" Walk behind Mower Parks ‐ ‐ ‐ ‐ ‐ ‐ 9,000 ‐ ‐ ‐ 9,000 Skid steer Parks ‐ ‐ ‐ 19,000 ‐ ‐ ‐ ‐ 60,000 ‐ 79,000 Skid steer Snow Blower & Broom attachments Parks ‐ ‐ ‐ ‐ ‐ ‐ ‐ ‐ 16,000 ‐ 16,000 Skid steer Trailer Parks ‐ ‐ ‐ ‐ ‐ ‐ ‐ ‐ ‐ 12,500 12,500 Utility Mower Trailer 1 Parks ‐ ‐ ‐ ‐ ‐ ‐ ‐ ‐ 9,500 ‐ 9,500 Utility Mower Trailer 2 Parks ‐ ‐ ‐ ‐ ‐ ‐ ‐ ‐ 9,500 ‐ 9,500 Utility Vehicle Parks ‐ 35,000 ‐ ‐ ‐ ‐ ‐ 43,000 ‐ ‐ 78,000 Diesel Mower 16' Parks 120,000 ‐ ‐ ‐ ‐ ‐ ‐ ‐ ‐ ‐ 120,000 60" Mower‐Deism machine (Snow and Grass) Parks ‐ 60,000 ‐ 60,000 ‐ ‐ ‐ ‐ ‐ ‐ 120,000 60" Rider Mower Parks 13,000 ‐ ‐ ‐ ‐ ‐ ‐ ‐ ‐ ‐ 13,000 Park Mini Van Parks ‐ ‐ 45,000 ‐ 8,000 ‐ ‐ ‐ ‐ ‐ 53,000 Field Seeder Parks ‐ ‐ ‐ ‐ ‐ ‐ ‐ ‐ ‐ ‐ ‐ 1/2 T Pick‐up Truck Parks ‐ ‐ ‐ ‐ ‐ 45,000 ‐ ‐ ‐ ‐ 45,000 Mower 44" Parks 8,000 ‐ ‐ ‐ ‐ ‐ ‐ ‐ ‐ ‐ 8,000 Cushman Parks ‐ 25,000 ‐ ‐ ‐ ‐ ‐ ‐ ‐ ‐ 25,000 Ladder Truck Fire 325,000 ‐ ‐ ‐ ‐ ‐ ‐ ‐ ‐ ‐ 325,000 Total CEP 1,178,500 633,000 712,000 453,000 409,000 458,500 464,700 349,000 594,000 2,478,500 7,730,200
REVENUES
Utility Franchise/LGA allocation 657,500 417,000 447,651 487,400 373,000 402,428 450,000 300,000 550,000 2,417,500 6,502,479 Other Revenues 46,000 46,000 46,000 46,000 46,000 46,000 46,000 46,000 46,000 46,000 460,000
TOTAL REVENUES 703,500 463,000 493,651 533,400 419,000 448,428 496,000 346,000 596,000 2,463,500 6,962,479
(Use of Cash/Add to Cash (475,000) (170,000) (218,349) 80,400 10,000 (10,072) 31,300 (3,000) 2,000 (15,000) (767,721) 2022 2023 2024 2025 2026 2027 2028 2029 2030
Current Cash Balance + TransferProjected Cash Balance 1,240,534 1,070,534 852,185 932,585 942,585 932,513 963,813 960,813 962,813 945,813
20

PARKSThis cost center accounts for the improvement/maintenance
expenses to the: Parks, Arena, Pool, and Dome
21

Capital Fund‐Summary of Park Facilities (CEP 2022 2023 2024 2025 2026 2027 2028 2029 2030 2031 and
future years TOTAL ALL
YEARS
Arena ‐ ‐ ‐ 10,000 ‐ ‐ ‐ ‐ ‐ ‐ 10,000 Dome ‐ 5,500 ‐ ‐ ‐ ‐ ‐ ‐ ‐ ‐ 5,500 Pool 65,000 77,000 42,500 50,000 ‐ ‐ ‐ ‐ ‐ ‐ 300,000 Total CEP 65,000 82,500 42,500 60,000 ‐ ‐ ‐ ‐ ‐ 315,500
Arena 1,100,000 ‐ ‐ ‐ ‐ ‐ ‐ ‐ ‐ ‐ 2,400,000 Dome ‐ 1,000,000 ‐ 5,000 ‐ ‐ ‐ ‐ 600,000 ‐ 1,605,000 Parks 605,500 684,000 2,418,700 512,000 247,500 222,500 153,000 138,000 433,500 13,500 6,656,246 Total CIP 1,705,500 1,684,000 2,418,700 517,000 247,500 222,500 153,000 138,000 1,033,500 13,500 10,661,246
Total CEP/CEP 1,770,500 1,766,500 2,461,200 577,000 247,500 222,500 153,000 138,000 1,033,500 13,500 10,976,746
REVENUES
Grants‐Dakota Co, State, Met Council ‐ ‐ 1,955,200 ‐ ‐ ‐ ‐ ‐ ‐ ‐ 2,928,246 Utility Franchise/LGA allocation 392,500 533,000 265,000 415,000 350,000 250,000 300,000 250,000 500,000 200,000 3,669,388 Other Revenues 1,007,800 54,000 54,000 54,000 59,000 59,000 59,000 59,000 59,000 59,000 1,577,800 Arena Funds ‐ ‐ ‐ 10,000 ‐ ‐ ‐ ‐ ‐ ‐ 10,000 Dome Funds ‐ 1,005,500 ‐ 5,000 ‐ ‐ ‐ ‐ 600,000 ‐ 1,610,500 Third Party Revenues‐Donations/Grants ‐ ‐ ‐ ‐ ‐ ‐ ‐ ‐ ‐ ‐ 1,300,000
TOTAL REVENUES 1,400,300 1,592,500 2,274,200 484,000 409,000 309,000 359,000 309,000 1,159,000 259,000 11,095,934
(Use of Cash/Add to Cash (370,200) (174,000) (187,000) (93,000) 161,500 86,500 206,000 171,000 125,500 245,500 119,188
22

Capital Fund‐Arena (CEP) 2022 2023 2024 2025 2026 2027 2028 2029 20302031 and
future YearsTOTAL ALL YEARS
Electric Ice Edger ‐ ‐ ‐ ‐ ‐ ‐ ‐ ‐ ‐ ‐ ‐ Water Heater Replacement (2) ‐ ‐ ‐ ‐ ‐ ‐ ‐ ‐ ‐ ‐ ‐ Bathroom dividers ‐ ‐ ‐ ‐ ‐ ‐ ‐ ‐ ‐ ‐ ‐ Zamboni Batteries ‐ ‐ ‐ 10,000 ‐ ‐ ‐ ‐ ‐ ‐ 10,000 Furnace ‐ ‐ ‐ ‐ ‐ ‐ ‐ ‐ ‐ ‐ ‐ Dehumidification ‐ ‐ ‐ ‐ ‐ ‐ ‐ ‐ ‐ ‐ ‐ Doors ‐ ‐ ‐ ‐ ‐ ‐ ‐ ‐ ‐ ‐ ‐ Total CEP ‐ ‐ ‐ 10,000 ‐ ‐ ‐ ‐ ‐ ‐ 10,000
Locker rooms and fitness center 500,000 ‐ ‐ ‐ ‐ ‐ ‐ ‐ ‐ ‐ 500,000 Parking Lot 600,000 ‐ ‐ ‐ ‐ ‐ ‐ ‐ ‐ ‐ 600,000 Arena future improvements savings ‐ ‐ ‐ ‐ ‐ ‐ ‐ ‐ ‐ ‐ ‐
Total CIP 1,100,000 ‐ ‐ ‐ ‐ ‐ ‐ ‐ ‐ ‐ 1,100,000
TOTAL CEP AND CIP 1,100,000 ‐ ‐ 10,000 ‐ ‐ ‐ ‐ ‐ ‐ 1,110,000
REVENUESBonds ‐ ‐ ‐ ‐ ‐ ‐ ‐ ‐ ‐ ‐ Utility Franchise/LGA allocation 150,000 100,000 100,000 150,000 100,000 150,000 200,000 150,000 100,000 100,000 1,300,000 Other Revenues 953,800 ‐ ‐ ‐ ‐ ‐ ‐ ‐ ‐ 953,800 Arena Funds ‐ ‐ ‐ 10,000 ‐ ‐ ‐ ‐ ‐ 10,000 Third Party Resources‐Donations/Grant ‐ ‐ ‐ ‐ ‐ ‐ ‐ ‐ ‐ ‐ TOTAL REVENUES 1,103,800 100,000 100,000 160,000 100,000 150,000 200,000 150,000 100,000 100,000 2,263,800
2022 2023 2024 2025 2026 2027 2028 2029 2030 2031
(Use of Cash/Add to Cash 3,800 100,000 100,000 150,000 100,000 150,000 200,000 150,000 100,000 100,000 1,153,800
Current Arena Cash (2020)Projected Cash 411,175 511,175 611,175 761,175 861,175 1,011,175 1,211,175 1,361,175 1,461,175 1,461,175 Goal is 1,300,000
23

Capital Fund‐RAC‐Dome (CEP) 2022 2023 2024 2025 2026 2027 2028 2029 20302031 and
future yearsTOTAL ALL YEARS
VFD Motor Control ‐ 5,500 ‐ ‐ ‐ ‐ ‐ ‐ ‐ ‐ 5,500 Lacrosse Goals ‐ ‐ ‐ ‐ ‐ ‐ ‐ ‐ ‐ ‐ ‐ Controls ‐ ‐ ‐ ‐ ‐ ‐ ‐ ‐ ‐ ‐ ‐
Total CEP ‐ 5,500 ‐ ‐ ‐ ‐ ‐ ‐ ‐ ‐ 5,500
Turf ‐ 1,000,000 ‐ ‐ ‐ ‐ ‐ ‐ ‐ ‐ 1,000,000 Roof ‐ ‐ ‐ ‐ ‐ ‐ ‐ ‐ 600,000 ‐ 600,000 Lift ‐ ‐ ‐ 5,000 ‐ ‐ ‐ ‐ ‐ ‐ 5,000 Lights ‐ ‐ ‐ ‐ ‐ ‐ ‐ ‐ ‐ ‐ ‐ Total CIP ‐ 1,000,000 ‐ 5,000 ‐ ‐ ‐ ‐ 600,000 ‐ 1,605,000
TOTAL CEP AND CIP ‐ 1,005,500 ‐ 5,000 ‐ ‐ ‐ ‐ 600,000 ‐ 1,610,500
REVENUES
Dome Funds ‐ 1,005,500 ‐ 5,000 ‐ ‐ ‐ ‐ 600,000 ‐ 1,610,500
TOTAL REVENUES ‐ 1,005,500 ‐ 5,000 ‐ ‐ ‐ ‐ 600,000 ‐ 1,610,500
(Use of Cash/Add to Cash ‐ (1,005,500) ‐ (5,000) ‐ ‐ ‐ ‐ ‐ ‐ ‐
Current Cash Balance (2020) Adjusted*Projected Cash balance 1,913,317 1,157,817 1,407,817 1,652,817 1,902,817 2,152,817 2,402,817 2,652,817 2,902,817 3,152,817
24

Capital Fund‐Parks Improvement (CEP) 2022 2023 2024 2025 2026 2027 2028 2029 20302031 and
future yearsTOTAL ALL YEARS
‐ ‐ ‐ ‐ ‐ ‐ ‐ ‐ ‐ ‐ Total CEP ‐ ‐ ‐ ‐ ‐ ‐ ‐ ‐ ‐ ‐
Park Redevelopment‐Marthler Park 450,000 598,000 252,000 ‐ ‐ ‐ ‐ ‐ ‐ ‐ 1,450,000 Thompson County Park Master Plan ‐ ‐ 1,955,200 ‐ ‐ ‐ ‐ ‐ ‐ ‐ 2,928,246 New Warming House ‐ ‐ ‐ 150,000 ‐ 100,000 100,000 ‐ ‐ ‐ 350,000 Appurtenant Park Equipment 10,500 11,000 11,500 12,000 12,500 12,500 13,000 13,000 13,500 13,500 133,000 Park Courts ‐ 15,000 ‐ ‐ ‐ 27,000 ‐ ‐ 15,000 ‐ 77,000 Hockey Boards/Park Monument Sign/Shelters ‐ ‐ 200,000 ‐ ‐ 18,000 ‐ 50,000 80,000 ‐ 348,000
Park Trails 35,000 ‐ ‐ ‐ ‐ ‐ ‐ ‐ ‐ ‐ 35,000 Neighborhood park improvements ‐ ‐ ‐ 100,000 35,000 5,000 ‐ ‐ ‐ ‐ 140,000
Playground Equipment 110,000 60,000 ‐ ‐ ‐ 60,000 40,000 75,000 125,000 ‐ 545,000 Sport Center‐Horse shoe conversion/Skate park ‐ ‐ ‐ 250,000 ‐ ‐ ‐ ‐ 200,000 ‐ 450,000 Mud Lake ‐ ‐ ‐ ‐ 200,000 ‐ ‐ ‐ ‐ ‐ 200,000
Total CIP‐Adjusted 605,500 684,000 2,418,700 512,000 247,500 222,500 153,000 138,000 433,500 13,500 6,656,246 2022 2023 2024 2025 2026 2027 2028 2029 2030 2031
REVENUES
Grants‐Dakota Co, State, Met Council ‐ ‐ 1,955,200 ‐ ‐ ‐ ‐ ‐ ‐ 2,928,246 Utility Franchise/LGA allocation 177,500 356,000 100,000 200,000 250,000 100,000 100,000 100,000 400,000 100,000 2,097,388 Other Revenues 54,000 54,000 54,000 54,000 54,000 54,000 54,000 54,000 54,000 54,000 594,000
TOTAL REVENUES 231,500 410,000 2,109,200 254,000 304,000 154,000 154,000 154,000 454,000 154,000 5,619,634 2022 2023 2024 2025 2026 2027 2028 2029 2030 2031
(Use of Cash/Add to Cash (374,000) (274,000) (309,500) (258,000) 56,500 (68,500) 1,000 16,000 20,500 140,500 (1,036,612)
End of Year Parks Cash (2020) *Projected Cash 1,516,047 1,242,047 1,184,547 926,547 983,047 914,547 915,547 931,547 952,047 1,072,047

Capital Fund‐Pool (CEP) 2022 2023 2024 2025 2026 2027 2028 2029 20302031 and future
yearsTOTAL ALL YEARS
Bathroom dividers ‐ 3,000 ‐ ‐ ‐ ‐ ‐ ‐ ‐ ‐ 3,000 Building Gutters ‐ 8,000 ‐ ‐ ‐ ‐ ‐ ‐ ‐ ‐ 8,000 Chemical Probes (2) ‐ 700 ‐ ‐ ‐ ‐ ‐ ‐ ‐ ‐ 700 Chlorine Switches ‐ 2,000 ‐ ‐ ‐ ‐ ‐ ‐ ‐ ‐ 2,000 Landscaping @ Pool ‐ 2,500 ‐ ‐ ‐ ‐ ‐ ‐ ‐ ‐ 2,500 Pool Vacuum ‐ 5,000 ‐ ‐ ‐ ‐ ‐ ‐ ‐ ‐ 5,000 Water Heaters 15,000 ‐ ‐ ‐ ‐ ‐ ‐ ‐ ‐ ‐ 15,000 Epoxy Floor Coat ‐ ‐ ‐ ‐ ‐ ‐ ‐ ‐ ‐ ‐ 40,000 Skimmer Grates ‐ ‐ ‐ ‐ ‐ ‐ ‐ ‐ ‐ ‐ 15,500 Strainer Housings (2) ‐ ‐ ‐ ‐ ‐ ‐ ‐ ‐ ‐ ‐ 10,000 Rehab/Replace Play Features 50,000 ‐ ‐ ‐ ‐ ‐ ‐ ‐ ‐ ‐ 50,000 Re‐plaster Pool ‐ 30,000 ‐ ‐ ‐ ‐ ‐ ‐ ‐ ‐ 30,000 Chemical Pump ‐ 800 ‐ ‐ ‐ ‐ ‐ ‐ ‐ ‐ 800 New Chlorinators (4) ‐ 6,000 ‐ ‐ ‐ ‐ ‐ ‐ ‐ ‐ 6,000 New Manual Backwash System‐smaller pool ‐ 8,000 ‐ ‐ ‐ ‐ ‐ ‐ ‐ ‐ 8,000 Sealcoat and restripe parking lot ‐ 6,000 ‐ ‐ ‐ ‐ ‐ ‐ ‐ ‐ 6,000 New Pool Deck Chairs ‐ 5,000 ‐ ‐ ‐ ‐ ‐ ‐ ‐ ‐ 5,000 Repaint Building ‐ ‐ 12,500 ‐ ‐ ‐ ‐ ‐ ‐ ‐ 12,500 Water Slide rehab ‐ ‐ 12,000 ‐ ‐ ‐ ‐ ‐ ‐ ‐ 12,000 New Concession Equipment ‐ ‐ 5,000 ‐ ‐ ‐ ‐ ‐ ‐ ‐ 5,000 Replace Sound System ‐ ‐ 2,500 ‐ ‐ ‐ ‐ ‐ ‐ ‐ 2,500 Replace Eyewash Station ‐ ‐ 500 ‐ ‐ ‐ ‐ ‐ ‐ ‐ 500 New Picnic Tables, Benches & Trash Receptacles ‐ ‐ 10,000 ‐ ‐ ‐ ‐ ‐ ‐ ‐ 10,000 Add New Security ‐ ‐ ‐ 50,000 ‐ ‐ ‐ ‐ ‐ ‐ 50,000 Total CEP 65,000 77,000 42,500 50,000 ‐ ‐ ‐ ‐ ‐ ‐ 300,000
REVENUES
Utility Franchise/LGA allocation 65,000 77,000 65,000 65,000 ‐ ‐ ‐ ‐ ‐ ‐ 272,000
Other Revenues 5,000 5,000 5,000 5,000 5,000 5,000 5,000 5,000 5,000 5,000 50,000.00
TOTAL REVENUES 70,000 82,000 70,000 70,000 5,000 5,000 5,000 5,000 5,000 5,000 322,000
(Use of Cash/Add to Cash 5,000.00 5,000.00 27,500.00 20,000.00 5,000 5,000 5,000 5,000 5,000 5,000 22,000.0
Current Cash (2020)Projected Cash 267,158.00 272,158.00 299,658.00 319,658.00 324,658.00 329,658.00 334,658.00 339,658.00 344,658.00 349,658.00
26

Blank Page
27

STREET IMPROVEMENTSThis cost center accounts for the annual street improvement program.
28

Capital Fund‐Street Improvement ( 2022 2023 2024 2025 2026 2027 2028 2029 20302031 and future
yearsTOTAL ALL YEARS
Wentworth Improvements‐Dakota County Project ‐ ‐ ‐ ‐ ‐ ‐ ‐ ‐ ‐ ‐ ‐ Oakdale/Thompson Roundabout‐Dakota County Project 353,250 ‐ ‐ ‐ ‐ ‐ ‐ ‐ ‐ ‐ 353,250 Annual Street Project‐2021‐Moreland: From Delaware to Robert Street‐ reconstruction and utility work
‐ ‐ ‐ ‐ ‐ ‐ ‐ ‐ ‐ ‐ ‐ Annual Street Project‐2022‐Crusader: From Bidwell to Robert street‐reconstruction and utility work
1,290,000 ‐ ‐ ‐ ‐ ‐ ‐ ‐ ‐ ‐ 1,290,000 Annual Street Project‐2023‐Shared Cost with St. Paul for Annapolis: From Delaware to Robert Street‐includes sidewalks
‐ 3,260,000 ‐ ‐ ‐ ‐ ‐ ‐ 3,260,000 Annual Street Project‐2024‐Shared Cost with St. Paul for Annapolis: From Robert to Waterloo
‐ ‐ 2,640,000 ‐ ‐ ‐ ‐ ‐ 2,640,000
Annual Street Project‐2025‐Delaware: Dodd to Hwy 62 (12/5% our share) ‐ ‐ ‐ 3,190,000 ‐ ‐ ‐ ‐ ‐ ‐ 3,190,000
29

Annual Street Project‐2026‐Emerson: From Delaware to Charlton ‐ ‐ ‐ ‐ 3,280,000 ‐ ‐ ‐ ‐ ‐ 3,280,000
Annual Street Project‐2027‐Bernard: Stryker to Waterloo ‐ ‐ ‐ ‐ ‐ 1,760,000 ‐ ‐ ‐ ‐ 1,760,000
Annual Street Project‐2028‐Lothenbach: From Robert to Oakdale ‐ ‐ ‐ ‐ ‐ ‐ 2,190,000 ‐ ‐ 2,190,000
Annual Street Project‐2029‐Haskell‐Charlton to Waterloo ‐ ‐ ‐ ‐ ‐ ‐ ‐ 4,000,000 ‐ ‐ 4,000,000
Annual Street Project‐2030‐Dodd‐Smith to St. Paul 2,000,000 ‐ 2,000,000
Delaware‐Reconstruct (County) ‐ 150,000 250,000 850,000 ‐ ‐ ‐ ‐ ‐ ‐ 1,250,000 Marie Mill/Overlay ‐ ‐ ‐ ‐ ‐ ‐ ‐ ‐ ‐ ‐ ‐ Alley ‐ ‐ ‐ ‐ ‐ ‐ ‐ ‐ ‐ ‐ ‐
‐ ‐ ‐ ‐ ‐ ‐ ‐ ‐ ‐ 15,659,611 15,659,611 Total CIP 1,643,250 3,410,000 2,890,000 4,040,000 3,280,000 1,760,000 2,190,000 4,000,000 2,000,000 15,659,611 40,872,861
TOTAL CEP AND CIP 1,643,250 3,410,000 2,890,000 4,040,000 3,280,000 1,760,000 2,190,000 4,000,000 2,000,000 15,659,611 40,872,861
REVENUESFederal Funds (Oakdale/Thompson Roundab ‐ ‐ 178,750 1,480,250 ‐ ‐ ‐ ‐ ‐ ‐ 1,659,000 State Aid‐Street main. MSA ‐ 1,440,000 1,350,000 ‐ 2,000,000 700,000 900,000 1,500,000 1,000,000 ‐ 8,890,000 Special Assessments 322,500 81,500 132,000 239,250 328,000 220,000 328,500 700,000 ‐ 3,131,922 5,483,672 Special Sales Tax Revenue 1,313,000 1,326,130 1,339,391 1,352,785 1,366,313 1,379,976 1,393,776 1,407,714 1,421,791 13,659,611 25,960,487
TOTAL REVENUES 1,635,500 2,847,630 3,000,141 3,072,285 3,694,313 2,299,976 2,622,276 3,607,714 2,421,791 16,791,533 41,993,160
(Use of Cash/Add to Cash (7,750) (562,370) 110,141 (967,715) 414,313 539,976 432,276 (392,286) 421,791 1,131,922 1,120,299
Beginning Cash flow 1,940,000.00 572,250.00 9,880.00 120,021.30 (847,693.49) (433,380.42) 106,595.77 538,871.73 146,585.45 568,376.30 1,278,507.65
30

Capital Fund‐Local Streets (CIP) 2022 2023 2024 2025 2026 2027 2028 2029 20302031 and future
yearsTOTAL ALL YEARS
Annual Street Pavement Plan for local Streets ‐ ‐
‐ ‐ ‐ ‐ ‐ ‐ ‐ ‐ ‐ ‐
Total CIP ‐ ‐ ‐ ‐ ‐ ‐ ‐ ‐ ‐ ‐ ‐
TOTAL CEP AND CIP ‐ ‐ ‐ ‐ ‐ ‐ ‐ ‐ ‐ ‐ ‐
REVENUES
Special Assessments ‐ ‐ ‐ ‐ ‐ ‐ ‐ ‐ ‐ ‐ ‐ Levy 306,000 312,120 318,362 324,730 331,224 337,849 344,606 351,498 358,528 365,698 3,350,615
TOTAL REVENUES 306,000 312,120 318,362 324,730 331,224 337,849 344,606 351,498 358,528 365,698 3,350,615
(Use of Cash/Add to Cash 306,000 312,120 318,362 324,730 331,224 337,849 344,606 351,498 358,528 365,698 3,350,615
Beginning Cash flow + TransferProjected Year End Balance 1,053,817 1,365,937 1,684,299 2,009,029 2,340,253 2,678,102 3,022,708 3,374,206 3,732,733 3,739,904
31

TECHNOLOGYThis cost center accounts for the annual technology replacements.
32

Capital Fund‐ Technology (CEP) Department 2022 2023 2024 2025 2026 2027 2028 2029 2030
2031 and future years
TOTAL ALL YEARS
Annual PC & Laptop replacement Various 24,000 20,000 20,000 29,000 25,000 25,000 29,000 25,000 25,000 ‐ 222,000 Fiber Improvements City‐Wide 10,000 20,000 20,000 20,000 20,000 20,000 20,000 20,000 20,000 ‐ 170,000 Security Cameras Various 30,000 6,000 6,000 6,000 6,000 6,000 6,000 6,000 6,000 ‐ 78,000 Switch City‐Wide ‐ 12,000 12,000 ‐ ‐ 12,000 12,000 12,000 12,000 12,000 84,000 Wireless Access Points City‐Wide 4,000 4,000 4,000 4,000 4,000 4,000 4,000 4,000 4,000 ‐ 36,000 Dakota Broadband INET City‐Wide ‐ ‐ ‐ ‐ ‐ ‐ ‐ ‐ ‐ ‐ ‐ Council Chamber Retro Fit Admin ‐ 40,000 ‐ ‐ ‐ ‐ ‐ ‐ ‐ ‐ 40,000 Server Replacement IT ‐ ‐ ‐ 200,000 ‐ ‐ ‐ ‐ 200,000 ‐ 400,000 Phone System City‐Wide ‐ ‐ ‐ ‐ 125,000 ‐ ‐ ‐ ‐ ‐ 125,000 Dedicated Video Storage Police/PW ‐ ‐ ‐ ‐ 25,000 ‐ ‐ ‐ ‐ 25,000 50,000 Network switches City‐Wide ‐ ‐ ‐ ‐ ‐ ‐ ‐ ‐ ‐ ‐ ‐ SQL Server Version Upgrade City‐Wide ‐ 30,000 ‐ ‐ ‐ ‐ ‐ ‐ ‐ ‐ 30,000 Data Center Licensing City‐Wide 7,619 7,619 ‐ ‐ ‐ ‐ ‐ ‐ ‐ ‐ 15,238 Petrolane Public Work 6,000 ‐ ‐ ‐ ‐ 6,000 ‐ ‐ ‐ ‐ 12,000 HVAC software Public Work 18,000 ‐ ‐ ‐ ‐ ‐ ‐ ‐ ‐ 25,000 43,000 Digital signage for conference room City‐Wide ‐ 2,500 ‐ ‐ ‐ ‐ ‐ 3,000 ‐ ‐ 5,500 Badge Printer City‐Wide 2,500 ‐ ‐ ‐ ‐ ‐ 3,000 ‐ ‐ ‐ 5,500 Digital signage for Marketing in City Facilities City‐Wide ‐ 4,000 3,000 2,000 ‐ ‐ ‐ ‐ 3,000 7,000 19,000 Plotter Printer Engineering 3,000 ‐ ‐ ‐ ‐ ‐ 4,000 ‐ ‐ ‐ 7,000 Portable Projector and Screen City Wide 3,000 ‐ ‐ ‐ 2,000 ‐ ‐ ‐ ‐ 4,000 9,000 Public self check out kiosk City Wide ‐ ‐ 2,500 ‐ ‐ 2,800 ‐ ‐ 3,000 ‐ 8,300 SCADA upgrade Public Work ‐ 10,000 ‐ ‐ ‐ ‐ ‐ ‐ ‐ ‐ 10,000
Total CEP 108,119 156,119 67,500 261,000 207,000 75,800 78,000 70,000 273,000 73,000 1,262,238
REVENUESUtility Franchise/LGA allocation 100,000 175,000 100,000 200,000 200,000 95,000 100,000 100,000 200,000 55,000 1,325,000 Other Revenues 2,000 2,000 2,000 2,000 2,000 2,000 2,000 2,000 2,000 2,000 20,000
TOTAL REVENUES 102,000 177,000 102,000 202,000 202,000 97,000 102,000 102,000 202,000 57,000 1,345,000
(Use of Cash/Add to Cash (6,119) 20,881 34,500 (59,000) (5,000) 21,200 24,000 32,000 (71,000) (16,000) 82,762 2022 2023 2024 2025 2026 2027 2028 2029 2030 2031
Current Cash BalanceProjected Cash 214,360 235,241 269,741 210,741 205,741 226,941 250,941 282,941 211,941 195,941
33

PED-SIDEWALK/TRAILSThis cost center accounts for pedestrian sidewalks and trails.
1934

Capital Fund‐Sidewalks‐Trails (PED plan) (CIP) 2022 2023 2024 2025 2026 2027 2028 2029 20302031 and future
years
Total CEP ‐ ‐ ‐ ‐ ‐ ‐ ‐
River to River Grade Separated Crossing ‐ ‐ ‐ ‐ ‐ ‐ ‐ ‐ ‐ ‐ Marthaler Trailhead ‐ ‐ ‐ ‐ ‐ ‐ ‐ ‐ ‐ ‐ Moreland ‐ ‐ ‐ ‐ ‐ ‐ ‐ ‐ ‐ ‐ Crusader (sidewalk)\Bidwell Sidewalk 400,000 ‐ ‐ ‐ ‐ ‐ ‐ ‐ ‐ ‐ Bidwell (Safe Routes)‐sidewalk 350,000 ‐ ‐ ‐ ‐ ‐ ‐ ‐ ‐ ‐
‐ ‐ ‐ ‐ ‐ ‐ ‐ ‐ ‐ ‐ Annapolis ‐ ‐ 400,000 ‐ ‐ ‐ ‐ ‐ ‐ ‐ Delaware ‐ ‐ ‐ ‐ ‐ ‐ ‐ Emerson ‐ ‐ ‐ ‐ 1,500,000 ‐ ‐ ‐ ‐ Thompson Ave/County Rd 6: 2/3 mile dual trail. Viable route for bicyclists and pedestrians travelling from South St. Paul to the center of the Robert St commercial Corridor. (Dakota County led project.) ‐ ‐ ‐ ‐ ‐ ‐ ‐ ‐ ‐ ‐ Oakdale Ave/CSAH 73: .6 mile dual gap extends from Wentworth ( the River to River Greenway) to Butler Ave. (Dakota County led project.) ‐ 410,925 ‐ ‐ ‐ ‐ ‐ ‐ ‐ ‐ Butler Ave/CR 4: .2 mile dual gap extends from Dodd to Smith St. (Dakota County Led Project) ‐ ‐ ‐ ‐ ‐ 135,000 ‐ ‐ ‐ ‐ Butler Ave/CR 4‐Thompson Park: .9 mile dual gap extends from Sperl St to Concord St (TH 156). (Dakota County led project.) ‐ ‐ ‐ ‐ ‐ 150,000 ‐ ‐ ‐ ‐ Mendota Rd/CSAH 14: 1/2 mile gap extends from Robert St (TH 952) to Oakdale Ave (CSAH 73). (Dakota County led project.) ‐ ‐ ‐ ‐ ‐ ‐ ‐ 300,000 ‐ ‐ Lothenbach ‐ ‐ ‐ ‐ ‐ ‐ 470,000 ‐ ‐ ‐ Haskell 690,000 ‐ Dodd to Smith/St Paul ‐ ‐ ‐ ‐ ‐ ‐ ‐ ‐ 135,000 ‐
Total CIP 750,000 410,925 400,000 ‐ 1,500,000 285,000 470,000 300,000 825,000 ‐
TOTAL CEP AND CIP 750,000 410,925 400,000 ‐ 1,500,000 285,000 470,000 300,000 825,000 ‐
REVENUES
Grants‐Dakota Co, State, Met Council
Levy Requirement 500,000 500,000 500,000 500,000 500,000 500,000 500,000 500,000 500,000 500,000
Special Assessments ‐ ‐ ‐ ‐ ‐ ‐ ‐ ‐ ‐ ‐
Abatement ‐ ‐ 40,000 40,000 40,000 40,000 40,000 40,000 40,000 ‐
TOTAL REVENUES 500,000.00 500,000.00 540,000.00 540,000.00 540,000.00 540,000.00 540,000.00 540,000.00 540,000.00 500,000.00
(Use of Cash/Add to Cash (250,000) 89,075 140,000 540,000 (960,000) 255,000 70,000 240,000 (285,000) 500,000
Cash flow 105,000 194,075 334,075 874,075 (85,925) 169,075 239,075 479,075 194,075 694,075

UTILITY FUNDSThis cost center accounts for the Sewer and Storm water funds.
36

Capital Fund‐Sewer (CEP) 2022 2023 2024 2025 2026 2027 2028 2029 2030
2031 and future years
TOTAL ALL YEARS
Jet Truck Hose 3,900 ‐ 4,100 ‐ ‐ ‐ ‐ ‐ ‐ ‐ 8,000 1/2 Ton Pickup ‐ ‐ ‐ ‐ ‐ ‐ ‐ ‐ ‐ ‐ ‐ Camera trailer/Van instead of trailer ‐ ‐ ‐ ‐ ‐ ‐ ‐ ‐ ‐ ‐ ‐ Generator 50kW ‐ ‐ ‐ ‐ 70,000 ‐ ‐ ‐ 90,000 ‐ 160,000 1 Ton Pickup Truck 55,000 ‐ ‐ ‐ ‐ 60,000 ‐ ‐ ‐ ‐ 115,000 Jet Rodder Truck/Jet‐Vactor ‐ ‐ ‐ 550,000 ‐ ‐ ‐ ‐ ‐ ‐ 550,000 1/2 Ton Pickup Truck ‐ ‐ ‐ ‐ ‐ ‐ ‐ 45,000 ‐ ‐ 45,000 Generator 300dW ‐ ‐ ‐ ‐ ‐ ‐ ‐ ‐ ‐ 120,000 120,000 Lift Station 3 Motors and Pumps ‐ ‐ ‐ ‐ ‐ ‐ ‐ ‐ ‐ 30,000 30,000 Generator 150kW ‐ ‐ ‐ ‐ ‐ ‐ ‐ ‐ ‐ 200,000 200,000 Vehicle ‐ ‐ ‐ ‐ ‐ ‐ ‐ 27,000 ‐ ‐ 27,000 Sewer pump trailer ‐ ‐ ‐ ‐ ‐ ‐ ‐ ‐ ‐ 4,500.00 4,500 Total CEP 58,900 ‐ 4,100 550,000 70,000 60,000 ‐ 72,000 90,000 354,500 1,259,500
Lift station 1 ‐ ‐ ‐ ‐ ‐ ‐ ‐ ‐ ‐ ‐ ‐ Lift Station 4 Force main Replacement 900,000 ‐ ‐ ‐ ‐ ‐ ‐ ‐ ‐ ‐ 900,000 Lift Station 2 Upgrade & Force main ‐ ‐ ‐ ‐ ‐ ‐ ‐ ‐ ‐ ‐ ‐ Lift Station 3 and Force main 475,000 ‐ ‐ ‐ ‐ ‐ ‐ ‐ ‐ ‐ 475,000 Force main 6 Replacement 475,000 ‐ ‐ ‐ ‐ ‐ ‐ ‐ ‐ ‐ 475,000 Lift Station 4 1,100,000 ‐ ‐ ‐ ‐ ‐ ‐ ‐ ‐ ‐ 1,100,000 Sanitary Sewer for Delaware Ave Recon. 200,000 ‐ ‐ ‐ ‐ ‐ ‐ ‐ ‐ ‐ 200,000
‐ ‐ ‐ ‐ ‐ ‐ ‐ ‐ ‐ ‐ ‐ ‐ ‐ ‐ ‐ ‐ ‐ ‐ ‐ ‐ ‐ ‐ ‐ ‐ ‐ ‐ ‐ ‐ ‐ ‐ ‐ ‐ ‐
Total CIP 3,150,000 ‐ ‐ ‐ ‐ ‐ ‐ ‐ ‐ ‐ 3,150,000
TOTAL CEP AND CIP 3,208,900 ‐ 4,100 550,000 70,000 60,000 ‐ 72,000 90,000 354,500 4,409,500
REVENUESBonds 1,054,095 ‐ ‐ ‐ ‐ ‐ ‐ 1,054,095 CRA Fund (Federal) 2,095,905 ‐ ‐ ‐ ‐ ‐ ‐ ‐ ‐ 2,095,905 Sewer Funds 58,900 ‐ 4,100 550,000 70,000 60,000 ‐ 72,000 90,000 354,500 1,259,500 TOTAL REVENUES 3,208,900 ‐ 4,100 550,000 70,000 60,000 ‐ 72,000 90,000 354,500 4,409,500
(Use of Cash/Add to Cash ‐ ‐ ‐ ‐ ‐ ‐ ‐ ‐ ‐ ‐ ‐
37

Capital Fund‐Storm (CEP) Department 2022 2023 2024 2025 2026 2027 2028 2029 2030
2031 and future years
TOTAL ALL YEARS
Street Sweeper ‐ 260,000 ‐ ‐ ‐ ‐ ‐ ‐ ‐ ‐ 260,000
Total CEP ‐ 260,000 ‐ ‐ ‐ ‐ ‐ ‐ ‐ ‐ 260,000
Oak view Drainage Swale Improvements 150,000 ‐ ‐ ‐ ‐ ‐ ‐ ‐ ‐ ‐ 150,000 Storm water Pond Cleaning ‐ ‐ 210,000 ‐ ‐ 220,500 ‐ ‐ 231,525 ‐ 662,025
‐ ‐ ‐ ‐ ‐ ‐ ‐ ‐ ‐ ‐ ‐ Total CIP 150,000 ‐ 210,000 ‐ ‐ 220,500 ‐ ‐ 231,525 ‐ 812,025
TOTAL CEP AND CIP 150,000 260,000 210,000 ‐ ‐ 220,500 ‐ ‐ 231,525 ‐ 1,072,025
REVENUES
Storm Water Funds ‐ 260,000 210,000 ‐ ‐ 220,500 ‐ ‐ 231,525 ‐ 922,025
TOTAL REVENUES ‐ 260,000 210,000 ‐ ‐ 220,500 ‐ ‐ 231,525 ‐ 922,025
(Use of Cash/Add to Cash (150,000.00) ‐ ‐ ‐ ‐ ‐ ‐ ‐ ‐ ‐ (150,000.00)
38

Blank Page
39

MASTER PLANNING DOCUMENTS & DEFINITIONS
City Council-approved plans that impact the CEP-CIP
40

CIP Plans and Definitions
2040 Comprehensive Plan; Approved 9/15/2019 Every ten years the Metropolitan Council requires cities within the seven metro Counties to update their Comprehensive Land Use Plans. Major elements of these plans include Land Use, Transportation, Water Resources, Parks & Trails, Housing, Resilience, and Economic Competitiveness. These plans guide how the community will develop or redevelop during the subsequent decade.
Housing Plan; Received 8/12/2019
The plan serves to initiate and provide housing strategies, best practices, and recommendations to advance local initiatives and catalyze conversations and partnerships to address key housing goals/issues throughout the City. It explores alternatives for residential reinvestment and identifies goals to establish a vision intended to maintain and improve the community housing stock.
Pavement Management Plan; Approved 7/23/2018
The City is responsible for the maintenance of approximately xx miles of local roadways and xx miles of alleys. The PMP creates a ranking of priority and cost estimates for major maintenance (mill/overlay or reconstruction) of roadways within the community based upon their pavement condition index (PCI).
Marthaler Park Master Plan; Received 7/16/2018
Originally created in 2001 the Master Plan for this community scale park has been revisioned to enhance the value of this important asset to the community. It is a multi‐ facility plan including trails, playgrounds, sledding, tennis, and other amenities.
ADA Transition Plan; Approved 4/23/2018
The Transition Plan for Public Right of Way is a document that includes a detailed review of the City’s existing pedestrian infrastructure within city right of way and outlines a long‐term transition plan for how to achieve full compliance with the ADA regulations of this existing infrastructure. Historically, the city has reviewed these on a project‐by‐project basis. The county and state are responsible for plans in their respective right of way within West St. Paul.
41
Smith‐Dodd Small Area Plan; Approved 10/23/2017 In 2009, five entities joined in collaboration to lead the Smith Avenue Revitalization Initiative: the Riverview Economic Development Association (REDA), the Neighborhood Development Alliance (NeDA), West Side Citizens Organization (WSCO), City of Saint Paul’s Department of Planning and Economic Development (PED) and City of West Saint Paul. Together they set objectives and strategies for the economic, environmental and physical future of the Smith Avenue corridor, which stretches from Dodd Road in West Saint Paul north to the High Bridge in Saint Paul. The Smith Avenue Revitalization Plan (SARP) recommends a variety of action steps for the Smith Avenue corridor to guide its ongoing and future use and redevelopment. The revitalization plan includes the intersection of Smith Avenue South and Dodd Road. This intersection is located five blocks from the Mendota Heights border to the west, and two blocks from the Saint Paul border to the north. The City completed a small area plan (subset of the larger effort) which includes identification of planning priorities in the following areas: Future land use Building type, placement, parking and landscaping Streetscape and park improvements Realignment of the Smith/Dodd intersection Redevelopment of the city‐owned parcel at 1010 Dodd Road Traffic softening on the adjacent Manomin Avenue Bicycle traffic
Garlough Park Master Plan; Received 8/28/2017
This report assesses the feasibility of constructing a regional trail which meets Dakota County Regional Greenway Trail Standards and passes through both Garlough Park and Marthaler Park, ending at the corner of Humboldt Avenue and Wentworth Avenue. The intent of this trail segment is to connect with other local trails, a planned regional trail, public and recreational facilities, local businesses, public transportation, and surrounding residential neighborhoods.
Renaissance Plan; Received 6/21/2017
This Robert Street area plan is intended to guide future development of public and private spaces along the 2.5 mile mixed use corridor as an update of the original 2001 plan.
Sports Complex Master Plan; Received 5/18/2017 The Sports Complex is primarily a community athletic complex. The Master Plan is intended to guide redevelopment of the existing resources. This redevelopment has been occurring and likely will be completed during the timeframe of the 2021 Capital Improvements Plan.
42
R2R Master Plan; Received7/13/2015
This Dakota County regional trail way plan was developed in collaboration with Mendota Heights and West and South St. Paul. The Plan provides recommendations to improve the existing trail, including signage, design improvements, interpretive themes, gateways, as well as crossing recommendations.
Emerald Ash Borer Management Plan, Approve 1/15/2015
The EAB Management Plan was developed to provide a strategy on how best to deal with the Ash Tree infestation projected to dramatically affect Ash tree inventory throughout the state of Minnesota. Included are treatment, removal and replacement strategies, initially over a ten‐year period.
Pedestrian and Bicycle Plan, Approved 12/12/2011 This Pedestrian and Bicycle Master Plan is a tool to guide the long‐term efforts (25 years or more) to physical projects, programs and policies that will support walking and biking in West St. Paul to encourage healthy, active living and provide transportation choices.
43

City Council Report
To: Mayor and City Council
Through: Nate Burkett, City Manager
From: Dan Nowicki, Marketing and Communications Manager
Date: August 9, 2021
Future OCWS Setting Discussion
BACKGROUND INFORMATION: Prior to the pandemic, the City of West St. Paul conducted Open Council Work Sessions in the Lobby Conference Room. This setting allowed for less formal round-table type discussions, face-to-face interaction, and an atmosphere more conducive to exploring ideas that may not be ready to bring to the dais for official action. As the name suggests, these meetings were open to the public. However, they were not broadcast live or video recorded. Members of the public would regularly attend these meetings and the City Clerk would record the audio for their records. With the onset of COVID-19, and after a period of not holding OCWS, the virtual OCWS was born. In lieu of a physical space for transparency, staff worked out a system with Townsquare TV to broadcast these meetings on television and stream online, thus allowing the public to watch the OCWS from home. While we were eventually able to move back to in person meetings, we felt it best to continue to broadcast OCWS meetings as a way for the public to watch if they could not come to City Hall or didn’t feel safe in public settings. In order to accomplish this, the OCWS were relocated to the chambers where cameras were ready to broadcast. However, this formal setting with the council at the dais has the feel of a regular City Council Meeting which some feel hinders the exploration of ideas and open conversation. Staff was asked to explore options on how to get back to the previous atmosphere of OCWS. Options are below.
Option 1: Full Lobby Conference Investment Room: Lobby Conference Room Transparency: Full broadcast production quality – Live broadcast, stream and on-demand video. Overview: Essentially all the tech currently in the council chambers would be added to the Lobby Conference room. Articulating cameras, gooseneck mics, etc. but sitting at the roundtable. Townsquare TV would direct the production from the media room. Cost: See attachment: ~$54,000 with 3 Cameras (Which Townsquare Recommends) or ~$43,000 with 2 cameras (production would be significantly diminished with fewer angles and more panning and tilting) Pros: Top notch production quality in the ideal setting. Room is ready for other broadcast uses. Cons: Highest cost Option 2: Lobby Conference – Non-Broadcast Quality Video Room: Lobby Conference Transparency: Significantly less production value – only a single wide shot webcam for the entire meeting with a few omni-directional mics catching all audio.

Overview: Townsquare would not be producing this option as it is not up to their production standards. It’s basically bare bones. No live TV broadcast. Recording would be available the day after the meeting through WSP’s website. No close shots of subjects talking, just a single shot of the room. Cost: ~$1,000 - 2,000 Pros: Back to lobby conference room – Cheap Cons: No live broadcast, no graphics, no close ups, diminished audio. Essentially, staff will start a webcam to capture the meeting and post the video the next day. Option 3: Lobby Conference – No Video (audio only) Room: Lobby Conference Transparency: Audio only Overview: Back in the Lobby Conference Room. The clerk will use a recorder to capture audio and upload it on the website the following day. No video, but still open to the public Cost: $0 Pros: Zero cost, no installation necessary. Cons: No video Option 4: Stay the Course Room: Council Chambers Transparency: Full broadcast production quality – Live broadcast, stream and on-demand video. Overview: Continue to do OCWS as we have for the last few months. Council and staff at the dais. Cost: $0 Pros: No Cost – Excellent production quality, live and on-demand video Cons: Setting is not ideal for conversation and feels too formal for exploring ideas and back and forth organic discussion. Option 5: Council Chambers in the Audience Room: Council Chambers Transparency: Full broadcast production quality – Live broadcast, stream and on-demand video. Overview: This option uses the cameras that are currently in the chambers, however, due to limited space will need to take up a portion of the chamber’s audience in front of the lectern. This means the OCWS will have to end with enough time for staff to break down the tables, remove the mics, move a mixer and set up additional chairs before the council meeting can begin. This will also add to the clutter in the chambers as all of that hardware would need to stay off to the side. Also, with moving pieces, replacement will have to be done more frequently and staff will need to be trained. Cost: $8,000 - $10,000 Pros: Round table discussion setting. Don’t need additional cameras in another room. Cons: Lots of moving pieces by staff means more technical difficulties and wear and tear. Set up and breakdown time by staff. OCWS will have to end ~20 minutes before Council Meeting begins. Audience intrusion. Still a significant cost.
It is worth noting the IT Department had planned to spend about $40,000 for Council Meeting technology replacements/upgrades (PC, monitors, controller, speakers, and runs) in 2023. With the upcoming City Hall Administration remodel plans, staff could work OCWS needs into the remodeling budget to make changes this year and delay the planned tech upgrades until 2025. STAFF RECOMMENDATION: Discuss options and give staff direction to begin making accommodations for future OCWS.

P R O P O S A L
Front Lobby Conference Room
City of West St. Paul1616 Humboldt Ave
West St. Paul, Minnesota 55118 USA
Presented By:
Advanced Systems Integration, LLC
7/29/2021
w w w . a s i - a v . c o m
Modified:
Revision: 0
Quote provided by:
Brandon Carleton
763-732-2053 (mobile)
952-392-8903 (main office)

S C O P E O F W O R K
Local Video
ASI will remove the wall mounted short throw projector, screen, and video cabling from the room. The owner
furnished Samsung UN85TU8000 Display will be mounted in the same location. The owner furnished Logitech
Rally Camera will be installed on top of the display. The field of view will be adjusted on the camera once
installation is complete so the room is properly filled when sending video to the far end. An HDMI wall plate will
be installed directly below the display. A Liberty 15' HDMI cable has been provided for laptop inputs.
Broadcast Video
ASI will install three (3) Panasonic AW-UE150 PTZ camera's and wall mounts in the conference room. Location to
be verified with Town Square TV prior to installation. All cabling will run back to the video head end located in
the council chambers. Client to provide cable path as required for cabling. Town Square TV will provide one SDI
output that will feed back into the conference room that will be converted to USB for video conference
applications.
Audio
There will be two (2) Innovox Flex Focus vertical speakers wall mounted on both sides of the display that will be
used for presentation audio and video conference far end audio. The tables in the room need to stay mobile.
ASI has provided two (2) Shure XLR to Dante audio devices that will be mounted under two different tables.
Each Shure box has the ability to plug in four (4) Audio Technica MicroLine microphones. Two 25' CAT6 patch
cords have been provided to use with the Shure boxes. They will plug into the wall plate directly below the
display. This system will also have the ability to send audio and receive audio from the council chambers along
with future captioning.
Client will be responsible for providing and installing 110V duplex outlet behind the display location.
ASI will install a fan into the side of the cabinet to help with heat dissipation.
Rev. 0
Front Lobby Conference Room
Project No : DT-00061 7/29/2021Page 2 of 5
* Price Includes Accessories
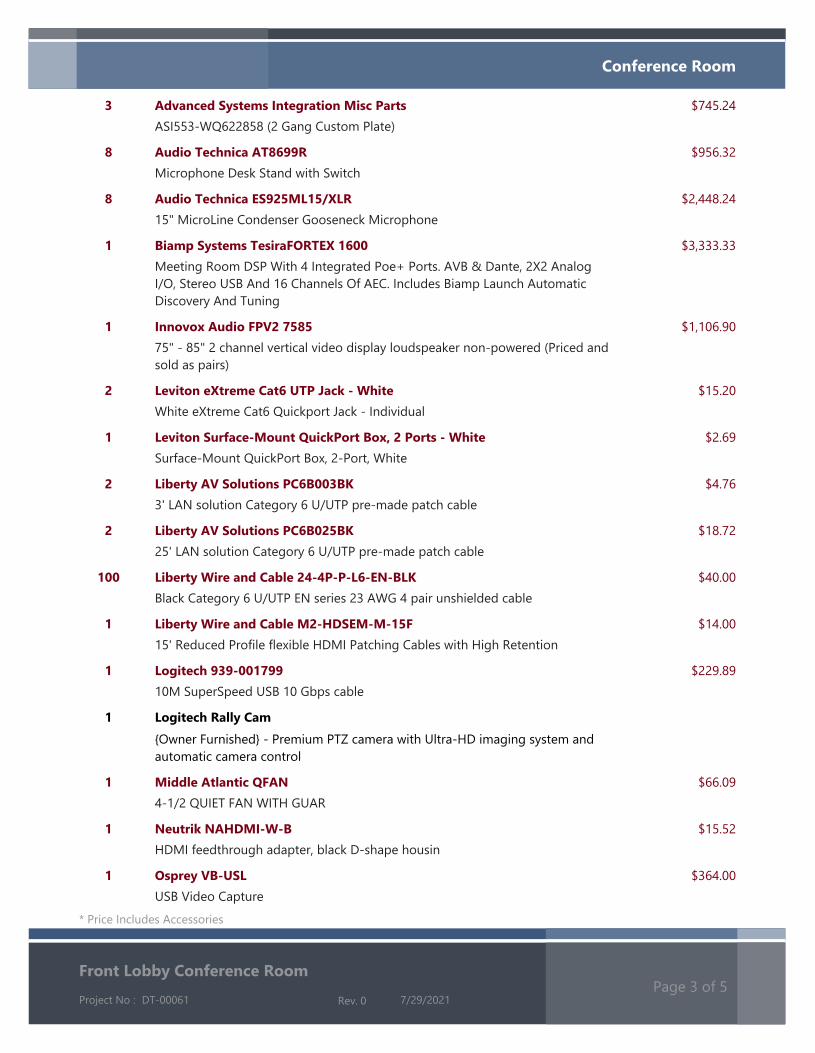
Conference Room
$745.24Advanced Systems Integration Misc Parts
ASI553-WQ622858 (2 Gang Custom Plate)
3
$956.32Audio Technica AT8699R
Microphone Desk Stand with Switch
8
$2,448.24Audio Technica ES925ML15/XLR
15" MicroLine Condenser Gooseneck Microphone
8
$3,333.33Biamp Systems TesiraFORTEX 1600
Meeting Room DSP With 4 Integrated Poe+ Ports. AVB & Dante, 2X2 Analog
I/O, Stereo USB And 16 Channels Of AEC. Includes Biamp Launch Automatic
Discovery And Tuning
1
$1,106.90Innovox Audio FPV2 7585
75" - 85" 2 channel vertical video display loudspeaker non-powered (Priced and
sold as pairs)
1
$15.20Leviton eXtreme Cat6 UTP Jack - White
White eXtreme Cat6 Quickport Jack - Individual
2
$2.69Leviton Surface-Mount QuickPort Box, 2 Ports - White
Surface-Mount QuickPort Box, 2-Port, White
1
$4.76Liberty AV Solutions PC6B003BK
3' LAN solution Category 6 U/UTP pre-made patch cable
2
$18.72Liberty AV Solutions PC6B025BK
25' LAN solution Category 6 U/UTP pre-made patch cable
2
$40.00Liberty Wire and Cable 24-4P-P-L6-EN-BLK
Black Category 6 U/UTP EN series 23 AWG 4 pair unshielded cable
100
$14.00Liberty Wire and Cable M2-HDSEM-M-15F
15' Reduced Profile flexible HDMI Patching Cables with High Retention
1
$229.89Logitech 939-001799
10M SuperSpeed USB 10 Gbps cable
1
Logitech Rally Cam
{Owner Furnished} - Premium PTZ camera with Ultra-HD imaging system and
automatic camera control
1
$66.09Middle Atlantic QFAN
4-1/2 QUIET FAN WITH GUAR
1
$15.52Neutrik NAHDMI-W-B
HDMI feedthrough adapter, black D-shape housin
1
$364.00Osprey VB-USL
USB Video Capture
1
Rev. 0
Front Lobby Conference Room
Project No : DT-00061 7/29/2021Page 3 of 5
* Price Includes Accessories

$33,316.68Panasonic AW-UE150WPJ
UHD 4K 20x PTZ Camera (White)
3
$756.32Powersoft Mezzo 322 AD
2 Channel Compact Install Amplifier with Dantetm/AES67
1
$908.04Shure ANI4OUT-XLR
4-Output, XLR connectors, Mic/Line Dante™ Audio Network Interface with PEQ
and Audio Summing
2
$76.28Startech USB3AAEXT5M
5m USB 3.0 Active Extension Cable - M/F
1
$668.91Vaddio 535-2000-223
Wall Mount Bracket For H700 HE120/130
3
$45,087.13Conference Room Total
Shipping:
$357.001 $357.00Shipping
$222.001 $222.00Shipping
$579.00Shipping Total:
Project Subtotal: $45,087.13
Rev. 0
Front Lobby Conference Room
Project No : DT-00061 7/29/2021Page 4 of 5
* Price Includes Accessories

P R O J E C T S U M M A R Y
$45,087.13Equipment:
$8,235.84Labor:
$579.00Shipping:
Grand Total: $53,901.97
Date
James Grommersch Date
Advanced Systems Integration, LLC
Client:
Contractor:
{Client_Signature} {Client_Signature_Date}
TS683832
Rev. 0
Front Lobby Conference Room
Project No : DT-00061 7/29/2021Page 5 of 5