open access microarray analysis of relative gene
TRANSCRIPT

Noriega et al. BMC Molecular Biology 2010, 11:47http://www.biomedcentral.com/1471-2199/11/47
Open AccessM E T H O D O L O G Y A R T I C L E
Microarray analysis of relative gene expression stability for selection of internal reference genes in the rhesus macaque brainNigel C Noriega*4, Steven G Kohama1 and Henryk F Urbanski1,2,3
AbstractBackground: Normalization of gene expression data refers to the comparison of expression values using reference standards that are consistent across all conditions of an experiment. In PCR studies, genes designated as "housekeeping genes" have been used as internal reference genes under the assumption that their expression is stable and independent of experimental conditions. However, verification of this assumption is rarely performed. Here we assess the use of gene microarray analysis to facilitate selection of internal reference sequences with higher expression stability across experimental conditions than can be expected using traditional selection methods.
We recently demonstrated that relative gene expression from qRT-PCR data normalized using GAPDH, ALG9 and RPL13A expression values mirrored relative expression using quantile normalization in Robust Multichip Analysis (RMA) on the Affymetrix® GeneChip® rhesus Macaque Genome Array.
Having shown that qRT-PCR and Affymetrix® GeneChip® data from the same hormone replacement therapy (HRT) study yielded concordant results, we used quantile-normalized gene microarray data to identify the most stably expressed among probe sets for prospective internal reference genes across three brain regions from the HRT study and an additional study of normally menstruating rhesus macaques (cycle study). Gene selection was limited to 575 previously published human "housekeeping" genes. Twelve animals were used per study, and three brain regions were analyzed from each animal. Gene expression stabilities were determined using geNorm, NormFinder and BestKeeper software packages.
Results: Sequences co-annotated for ribosomal protein S27a (RPS27A), and ubiquitin were among the most stably expressed under all conditions and selection criteria used for both studies. Higher annotation quality on the human GeneChip® facilitated more targeted analysis than could be accomplished using the rhesus GeneChip®. In the cycle study, multiple probe sets annotated for actin, gamma 1 (ACTG1) showed high signal intensity and were among the most stably expressed.
Conclusions: Using gene microarray analysis, we identified genes showing high expression stability under various sex-steroid environments in different regions of the rhesus macaque brain. Use of quantile-normalized microarray gene expression values represents an improvement over traditional methods of selecting internal reference genes for PCR analysis.
BackgroundQuantitative real-time reverse transcription polymerasechain reaction (qRT-PCR) [1,2] has been the technique ofchoice to confirm or refute interpretations of relative
gene expression derived from gene microarray data [3-6],but accurate interpretation requires the qRT-PCR geneexpression levels to be normalized against a stablyexpressed reference [7]. Genes such as Glyceraldehyde-3-phosphate dehydrogenase (GAPDH), β-actin (ACTB) and18S rRNA have been used as internal reference standardsfor qRT-PCR normalization mainly due to historical car-ryover, when they were used as references for semi-quan-
* Correspondence: [email protected] Department of Neurobiology Physiology and Behavior, Center for Neuroscience 1273, University of California, Davis, CA 95618, USAFull list of author information is available at the end of the article
© 2010 Noriega et al; licensee BioMed Central Ltd. This is an Open Access article distributed under the terms of the Creative CommonsAttribution License (http://creativecommons.org/licenses/by/2.0), which permits unrestricted use, distribution, and reproduction inany medium, provided the original work is properly cited

Noriega et al. BMC Molecular Biology 2010, 11:47http://www.biomedcentral.com/1471-2199/11/47
Page 2 of 24
titative procedures like Northern blots, RNAseprotection assays and conventional reverse transcriptasepolymerase chain reactions (RT-PCR) [8]. Howeverexpression of these genes is regulated according to cellu-lar conditions [9-15], and so their indiscriminate use asinternal reference genes is questionable. Many genes pre-viously adopted as standards for normalization of geneexpression data show variable expression accordingexperimental conditions [11,15], thus limiting their suit-ability. Increasingly, it is viewed as imperative that theexpression stability of prospective reference genes be ver-ified under each all experimental conditions specific to astudy [16-18]. Gene expression analysis using microar-rays facilitates use of an increasingly more completerange of sample variation criteria [19], and studies usinggene microarray analyses are an increasingly commonmeans of identifying experiment-specific internal refer-ence genes for use in PCR verification [20-24].
Few suitable reference genes have been identifiedwithin the rhesus macaque brain [25]. Normalizer datafor macaque brain tissues is sparse because the availabil-ity of genetic material from specific brain regions inproperly controlled groups of macaques is very rare anddifficult to obtain. To help overcome this problem, werecently used qRT-PCR and gene microarrays to examineexpression stability for genes regulating γ-aminobutyricacid (GABA) trafficking in response to variation in circu-lating levels of ovarian steroids in the arcuate nucleus ofthe medial basal hypothalamus (MBH), hippocampus(HPC) and amygdala (AMD) in a study designed forexamination of effects of hormone replacement therapyon gene expression (HRT study). In the aforementionedanalysis [26], we showed that qRT-PCR results normal-ized using genes showing high microarray expression sta-bility (GAPDH, ALG9 and RPL13A) mirrored relativemicroarray expression data normalized using the quantilemethod [27,28] as part of Robust Multichip Analysis(RMA) pre-processing [29] on the Affymetrix® GeneChip®rhesus Macaque Genome Array (rhesus GeneChip®) [26].
We now present further details of our qRT-PCR relativeexpression stability analyses using the software algorithmbundles: geNorm [30], NormFinder [31] and BestKeeper[32]. We compare these data with relative gene expressionstabilities from quantile-normalized RMA pre-processed(RMA-normalized) microarray results from the same(HRT) study examined using the rhesus GeneChip®. Inaddition we compare relative expression stabilities from aseparate study of normally cycling macaques (cycle study)where we conducted microarray analysis of the samebrain regions (MBH, HPC and AMD) using the Affyme-trix® GeneChip® Human Genome U133 Plus 2.0 microar-ray (human GeneChip®).
In order to maximize the likelihood of detecting genesequences that are stably expressed under a variety of
conditions (i.e., different brain regions and different sex-steroid environments), gene selection was limited to apublished set of 575 human genes expressed under allconditions tested [33], and expected to meet criteria for"housekeeping" genes. Our goal was to identify the mostappropriate normalizer or combination of normalizersfor gene expression comparisons, and we selected thesecriteria to limit inclusion of probe sets to those mostlikely to be good candidates under variable conditions[22,34]. The experiments conducted in the current studywere designed to test effects of variable ovarian hormoneexposure on the function of three brain areas, and weused menstrual cycle variation and hormone therapyeffects as two ways of independently assessing ovarianhormone effects.
ResultsThe results were obtained from two different experi-ments, which are described in the methods and depictedschematically in Figure 1. Previously qRT-PCR was con-ducted on samples from the HRT study in order to exam-ine the influence of hormone replacement on geneexpression of GABAergic system components [26]. qRT-PCR relative expression stabilities of the six GABAergiccomponents and three normalizers used in the priorqRT-PCR analysis were assessed in the current study, andwe compare analyses for these nine genes (Table 1) usedfor qRT-PCR to analyses of 575 housekeeping genesexamined using gene microarray data pre-processedusing Robust Multiarray Analysis (RMA normalization)[27,35,36]. Differences in annotation quality between therhesus and human microarray platforms facilitatedhigher discrimination in probe set selection using thehuman compared to the rhesus GeneChip®. Because thenature of the probe sets used can affect overall relativeexpression stability values [37], we conducted separateanalyses according to annotation-based on probe setselection criteria and present the gene microarray resultsaccording these selection methods. On both the humanand rhesus GeneChip® we compared: 1) all probe setsannotated for the housekeeping genes; and 2) probe setsannotated for "popular normalizers" (see methods). Inaddition to analysis of all probe sets annotated for house-keeping genes, the annotation quality of the humanGeneChip® facilitated selection of "most representative"probe sets (see methods) for the majority of the house-keeping genes as well as all of the popular normalizers.Use of the representative probe sets was intended toincrease the specificity of data used for analyses.
qRT-PCR. HRT GeNorm analysisFive of the original set of nine genes preselected for analy-sis showed initial expression stability (M) values [30]within the recommended range (M < 1.5) for consider-

Noriega et al. BMC Molecular Biology 2010, 11:47http://www.biomedcentral.com/1471-2199/11/47
Page 3 of 24
ation as a normalizer [34]. Where lower M indicateshigher expression stability, initial M-value ranks (data notshown) were as follows: ALG9 <GAPDH <RPL13A<GAD1 <GABRA4. Sequential stepwise exclusion of theleast stable reference genes resulted in final M-values of0.437 for ALG9 and RPL13A, indicating that either ofthese genes was equally suitable for selection as the moststably expressed gene (best normalizer) according to thegeNorm algorithm. Due to high variance introduced by asingle MBH sample, it was removed and reanalysis wasperformed. The only effect of this change on relative M-values was regarding relative ranks of GAD1 and GAPDHwith GAPDH showing higher stability after variationreduction (Figure 2). ALG9 and RPL13A remained themost stably expressed genes.
qRT-PCR. HRT NormFinder analysisALG9 showed the highest stability when all three brainregions were compared. When all nine genes were ana-lyzed, the five most stably expressed ones were identicallyranked whether or not they were grouped [37] by brainregion. The NormFinder algorithms work most efficientlywhen all genes used show high expression stability. Fromthese nine genes, the five most stably expressed ones wereselected. NormFinder algorithms were then applied tothese five genes in order to narrow down the three moststably expressed. Because use of stably expressed genes isimportant for NormFinder function, we used thissequential method to ensure selection of genes withexpression patterns that maximized the effectiveness ofthe NormFinder algorithm [37]. Where the top five gene
Figure 1 Study methodology schematic. Flowchart outlining organization and groupings for analyses of data from the HRT and cycle studies. Al-ternating black and red text color is used for association of headings (left column) with appropriate rows of flowchart boxes.The six GABAergic pathway genes and three predicted normalizers for qRT-PCR are detailed in the methods. Numbered designations (1a, 1b... 2c) refer to separate selections of sequences to be analyzed (detailed in methods), with HRT sequences from 1a to 1c, and cycle study sequences from 2a to 2c. AMD = amygdala; E2 = 17β-estradiol; E2+P4 = 17β-estradiol + progesterone; EF = early follicular (menstrual cycle phase); GABA = gamma-aminobu-tyric acid; HPC = hippocampus; LF = late follicular (menstrual cycle phase); MBH = arcuate nucleus of the medial basal hypothalamus; ML = mid luteal (menstrual cycle phase); OVX = ovariectomized; qRT-PCR = quantitative real-time polymerase chain reaction;
Study
Brain tissues examined
Gene expression assessment platform
Genes considered
Sequences evaluated for relative expression stability
Variables
HRT study
MBH, HPC, AMD
qRT-PCR Rhesus GeneChip®
575 Housekeepers
6 GABAergic pathway genes + 3
predicted normalizers
(total of 9 genes)
1a)9 genes (see above)
1b) All probe sets for
housekeepers
Hormone treatmentOVX, E2, E2 + P4
Cycle study
MBH, HPC, AMD
Human GeneChip®
575 Housekeepers
Groupings-Brain region, -Hormone treatment
-Brain region, -Hormone treatment
-Brain region, -Cycle phase
2a)All probe sets for
housekeepers
Menstrual cycle phaseEF, LF, ML
1d)Popular
normalizers
2c)Popular
normalizers
2b)Most representative
probe sets for housekeepers
1c)ExpressedProbe sets

Noriega et al. BMC Molecular Biology 2010, 11:47http://www.biomedcentral.com/1471-2199/11/47
Page 4 of 24
Table 1: Primer and TAMRA probe sequence information for qRT-PCR
Gene name Primer & probe sequences (5' to 3') Reference sequence Amplicon length
F-primer AACAGTGCCACAGAGCGAGAA
ALG9 R-primer CGATACCGCCTGGAGCACTA XM_001106042 100
probe ACTGTCTTCCTGTTCGGG
F-primer AAGGGCATCCTGGGCTACA
GAPDH R-primer GAAGAGTGGGTGTCGCTGTTG XM_001105471 66
probe TGAGCACCAGTGGTCTCCTCCGACT
F-primer TCACGAGGTTGGCTGGAAGT
RPL13A R-primer GATCTTGGCTTTCTCCTTCCTCTT XM_001115079 72
probe CCAGGCAGTGACAGCCACCTTGG
F-primer GGAAAATACACCGTGTTTTCCTAAA
GABRA1 R-primer AGGCAGGACCAAATCAAACAA BV208518 72
probe ACACCTTTCTTTTTACATGTGCTTC
F-primer TCCCTCTCTGCGTGTTTCAA
GABRD R-primer GCCGAGGCTTCCTCTTGTTT MMUGDNA.30046.1.S1_AT * 63
probe TGGGATGACAGTCGGCCACGG
F-primer GGCACTGGAACTTTGGCAAA
GABRE R-primer TGTCACAGGGCTATCATGAAGCT BV166270 70
probe CACCTTTGACAAATTGTGTCTATTTG
F-primer CTCCTCAACTATGTCCGCAAGA
GAD1 R-primer TCCAAGTTGAAGCCCTCCAT NM_013445 100
probe TTCCATCACCCACACCAGTTGCTGG
F-primer CTCGAAAGGCTTCAATTGCAT
GABRA4 R-primer CTTCCCAGTAGCCCCTATGGT NM_000809 100
probe TGCAATCTTGATCCAAACACGTGACGA
F-primer CACCATTGCCCGGAAATC
GABRG2 R-primer ACTCCACCAAAGCAGAGAAGACA NM_198904 100
probe TCACAGCGATGGATCTCTTTGTATC
F = forward, R = reverse. Reference sequence = NCBI accession except for GABRD.* = Probe set sequence using NetAffx annotation for the GeneChip® rhesus Macaque Genome Array http://www.affymetrix.com/analysis/index.affx

Noriega et al. BMC Molecular Biology 2010, 11:47http://www.biomedcentral.com/1471-2199/11/47
Page 5 of 24
candidates were considered separately, ALG9 was still themost stably expressed (stability value 0.255) and the moststable combination (stability value 0.150) was GAPDH +RPL13A (Table 2). Where only the three prospectiveinternal reference genes were considered, ALG9 wasagain the most stably expressed (0.204), and the most sta-ble combination (0.152) was GAPDH and ALG9.
In comparisons of inter-group and intra-group varia-tion (genes grouped by brain region) GAPDH showed thehighest variability in the MBH (Figures 3 and 4) withintra-group variation an order of magnitude higher thanthat observed for other genes.
qRT-PCR. HRT NormFinder test of separate brain regionsNormFinder analysis of inter-group and intra-group vari-ation highlighted the possibility that the most appropriateinternal reference gene would vary according to brainregion. For the MBH gene expression analysis, ALG9 wasranked as the most stably-expressed gene in all scenarios.i.e., when all nine genes were included, when only the fivemost stable genes were selected, or when selection wasrestricted to the three prospective internal referencegenes (three most stably expressed genes). For the HPCand AMD gene expression analysis, GAPDH was rankedas the most stably-expressed gene, with the most stablecombination being GAPDH and RPL13A. When only thethree prospective internal reference genes were consid-ered, GAPDH was again ranked as the most stably-expressed gene, with the best combination of GAPDHand ALG9 (Table 2).
qRT-PCR. HRT NormFinder deviant sample testCauses for observed differences in relative expression sta-bility of the most stably expressed genes in the MBHcompared to in the extra-hypothalamic regions (HPC andAMD) were elucidated by analysis of intra-group varia-tion (Figures 3 and 4). As previously described, we testedthe influence of this variation by omitting the samplecontributing the most to MBH gene expression variabil-
Table 2: NormFinder qRT-PCR expression stability analysis summary
Selection MBH + HPC + AMD MBH HPC + AMD
Optimal single gene
Optimal gene combo
Optimal single gene
Optimal gene combo
Optimal single gene
Optimal gene combo
From the five most stablyexpressed genes§
GAPDH GAPDH
ALG9 + ALG9 N/A GAPDH +
0.255 RPL13A 0.120 0.037 RPL13A
0.150 0.079
From the three most stably expressed
genes*
GAPDH GAPDH
ALG9 + ALG9 N/A GAPDH +
0.204 ALG9 0.120 0.092 ALG9
0.152 0.042
§ = ALG9, RPL13A, GAPDH, GABRA4 and GABRA1. * = ALG9, RPL13A and GAPDH
Figure 2 Relative gene expression stability in the rhesus ma-caque brain. GeNorm graphical output showing relative stability of genes expressed in three brain areas from three hormone replacement regimes. Stability values (M) are based on pairwise comparisons be-tween the gene of choice and all other genes under consideration. The chart shows final stability values resulting from sequential elimination of the least stable genes after each set of pairwise analyses [34]. There-fore, the ordinate value shown for each gene represents the M-value obtained from the iteration before the gene was eliminated from anal-ysis. Elimination sequence is shown from left to right. More stably ex-pressed genes have lower M scores. Here the sample responsible for greatest influence on MBH variation was omitted from the analysis. When this sample was included the rank order of GAPDH and GAD1 were reversed.

Noriega et al. BMC Molecular Biology 2010, 11:47http://www.biomedcentral.com/1471-2199/11/47
Page 6 of 24
ity. With this omission, GAPDH showed the highest over-all expression stability, and as before, stability rankingswere identical with and without regional grouping con-siderations. In the omission test, GAPDH was also themost stable (0.219) when the 5 most stable genes werecompared. The most stable combination was GAPDH +RPL13A (0.137). However, when group comparisons werelimited to prospective internal reference genes only, themost stable single gene was again ALG9 (0.171) with themost stable combination being GAPDH + ALG9 (0.106).
qRT-PCR. HRT BestKeeper analysisIn the analysis of all three brain regions, only the pre-dicted housekeeping genes GAPDH, RPL13A and ALG9met BestKeeper crossing point [38] standard deviationrecommendations ((std dev [± CP]) < 1) for considerationas stably expressed genes. RPL13A displayed the lowestindices of variation (Table 3). Aside from the three pro-
spective internal reference genes, GAD1 and GABRA4showed the next highest expression stability. In light offindings from the NormFinder analysis, the MBH wasanalyzed separately from the extra-hypothalamic regions.For the separate MBH gene expression analysis, fivegenes met BestKeeper recommendations based on CPstandard deviation for consideration as internal referencegenes. They were ranked as follows, from lowest-to-high-est variation (i.e., low variation indicates high stability):GABRA1, ALG9, RPL13A, GABRA4 and GABRD. How-
Figure 3 NormFinder analysis for the five most stably expressed genes (qRT-PCR). Graphs show intra-group and inter-group variation [37] where gene expression quantity values were grouped according to brain region. Non-ordinate numbers show stability values for the given gene or gene combination.
Figure 4 NormFinder analysis for qRT-PCR prospective internal reference genes (qRT-PCR). Graphs show intra-group and inter-group variation [37] where gene expression quantity values were grouped according to brain region. Non-ordinate numbers show sta-bility values for the given gene or gene combination.

Noriega et al. BMC Molecular Biology 2010, 11:47http://www.biomedcentral.com/1471-2199/11/47
Page 7 of 24
ever, when the most deviant MBH sample was omitted,ALG9 and RPL13A received highest (and equal) relativestability rankings followed by GABRA1, GABRA4 andGABRE. For the extra-hypothalamic HPC and AMDanalysis, the five genes with lowest crossing point stan-dard deviation from lowest to highest variation wereRPL13A, GAPDH, ALG9, GABRE and GABRD.
Rhesus GeneChip® HRT study. All probe sets grouped by regionOur search method (see methods) revealed 1444 probesets on the rhesus macaque GeneChip® annotated for thehousekeeping genes [33]. When data was grouped byregion, the most stably expressed probe set:MmugDNA.22897.1.S1_s_at (stability value 0.064) wasannotated for Homo sapiens putative translation initia-tion factor (SUI1), mRNA. The most stable combinationof probe sets was MmuSTS.4478.1.S1_at (multiple RefSeqIDs, annotated as "similar to guanine nucleotide bindingprotein, alpha stimulating activity polypeptide 1 isoformc") and MmugDNA.13670.1.S1_at (multiple RefSeq IDs)annotated for human aspartyl aminopeptidase (DNPEP).The range of stability values for all probe sets consideredwas 0.064-1.109, however expression levels for most ofthe most stably expressed probe sets were below levels ofdetection according to Microarray Suite version 5.0(MAS 5.0) [39] analysis (Table 4).
824 "expressed sequences" from the original 1444 ('1c'in the methods) showed gene expression levels above thelimits of detection (Table 5). When these were groupedby region the most stably expressed probe set:MmugDNA.22897.1.S1_s_at (stability value 0.065) wasthe same probe set that scored the highest expression sta-bility rating when all 1444 sequences were considered
(Tables 4 and 5). The most stably expressed combinationof two probe sets (stability value 0.041) wasMmugDNA.22897.1.S1_s_at and MmugDNA.33967.1.S1_at (not annotated). The range of stability values was0.065-1.124.
Rhesus GeneChip® HRT study. All probe sets grouped by treatmentUsing the 1444 probe sets annotated for housekeepinggenes, when data were grouped by treatment, the moststably expressed (stability value = 0.053) probe set(MmugDNA.4544.1.S1_at, RefSeq ID XR_010342) wasannotated for Rho guanine nucleotide exchange factor 7(ARHGEF7). The most stably expressed combination oftwo probe sets (0.038) was for MmugDNA.30089.1.S1_x_at [RefSeq: XR_010595]; similar to Soma-tostatin receptor type 5) and MmunewRS.652.1.S1_at(multiple RefSeq transcript IDs; similar to calmodulin 1).The range of stability values for all probe sets consideredwas 0.053-0.396, however, expression levels for manyprobe sets were below levels of detection using MAS 5.0analysis (Table 4).
When only the 824 "expressed sequences" from theoriginal 1444 were grouped by treatment ('1c' in themethods, Table 5), the most stably expressed sequencewas the same probe set, MmugDNA.22897.1.S1_s_at(stability value 0.059), that was most stably expressedwhen analysis grouping was done according to region.The most stably expressed combination of two probe sets(stability value 0.038) was the aforementionedMmugDNA.22897.1.S1_s_at and MmugDNA.18192.1.S1_at [RefSeq: XM_001099724], similar toNADH dehydrogenase (ubiquinone) flavoprotein 2, 24kDa). The range of stability values was 0.059-0.395.
Table 3: BestKeeper qRT-PCR descriptive statistics for internal reference genes
GAPDH RPL13A ALG9
n 36 36 36
geometric mean [CP] 22.65 25.31 27.72
arithmetic mean [CP] 22.70 25.32 27.73
min [CP] 20.72 23.89 26.30
max [CP] 30.73 28.62 30.97
std dev [± CP] 0.88 0.49 0.63
CV [% CP] 3.86 1.95 2.27
min [x-fold] -3.82 -2.42 -2.68
max [x-fold] 275.30 7.95 9.67
std dev [± x-fold] 1.84 1.41 1.55
n = number of samples; CP = Crossing point; std dev [± CP] = standard deviation of the CP; CV[% CP] = variance coefficient expressed as a percentage of the CP level.

Noriega et al. BMC Molecular Biology 2010, 11:47http://www.biomedcentral.com/1471-2199/11/47
Page 8 of 24
Table 4: 20 most stably expressed probe sets across brain regions of macaques in HRT study
HRT: brain region
rank/1444 stability value descriptor "GEN = " gene symbol probe set ID exp
1 0.064 SUI1 --- MmugDNA.22897.1.S1_s_at +++
2 0.066 VEGFB LOC722115 MmugDNA.8259.1.S1_at -
3 0.073 1? --- MmugDNA.15979.1.S1_at -
4 0.073 RPS14 LOC697734 MmugDNA.3842.1.S1_at -
5 0.074 SDC3 LOC704374 MmugDNA.32966.1.S1_at -
6 0.074 RPS27A/ubiquitin LOC697620/LOC701770 MmugDNA.43194.1.S1_at -
7 0.074 2? LOC693803 MmugDNA.23776.1.S1_at -
8 0.076 MAPKAPK2 MAPKAPK2 MmugDNA.37463.1.S1_at -
9 0.076 RPS14 LOC697734/LOC710901 MmugDNA.3842.1.S1_s_at ++++
10 0.076 TADA3L TADA3L MmugDNA.35773.1.S1_at -
11 0.078 ACVRL1 ACVRL1 MmugDNA.35470.1.S1_at -
12 0.078 CALM1 --- MmugDNA.30276.1.S1_s_at -
13 0.079 STK24 --- MmugDNA.42176.1.S1_at -
14 0.080 GPAA1 GPAA1 MmugDNA.10539.1.S1_s_at +
15 0.080 COL6A1 --- MmugDNA.15324.1.S1_at -
16 0.080 EEF1A1 LOC702809/LOC703715/LOC704199/LOC704438/LOC709017/LOC715351
MmuSTS.4277.1.S1_at -
17 0.080 HIST1H2BC LOC696506 MmunewRS.953.1.S1_x_at -
18 0.080 COX7C LOC693275/LOC702058/LOC706698 MmugDNA.43583.1.S1_x_at +
19 0.081 RAD9A LOC712345 MmugDNA.26624.1.S1_at -
20 0.081 API5 API5 MmugDNA.34847.1.S1_at -
HRT: treatment
rank/1444 stability value descriptor "GEN = " gene symbol probe set ID exp
1 0.053 ARHGEF7 ARHGEF7 MmugDNA.4544.1.S1_at -
2 0.054 RPS27A/ubiquitin LOC697620/LOC701770 MmugDNA.43194.1.S1_at -
3 0.056 API5 API5 MmugDNA.34847.1.S1_at -
4 0.057 HPCAL1 --- MmugDNA.15147.1.S1_at -
5 0.058 GRIK5 --- MmugDNA.24126.1.S1_at -
6 0.059 RPS25 LOC719947 MmugDNA.41046.1.S1_at -
7 0.062 PFDN1 LOC697795 MmugDNA.2620.1.S1_at +++
8 0.062 ATP5S LOC710290 MmugDNA.29002.1.S1_at -
9 0.062 EEF1A1 LOC702809/LOC703715/LOC704199/LOC704438/LOC709017/LOC715351
MmuSTS.4277.1.S1_at -
10 0.062 FLJ10808 LOC711751 MmugDNA.6835.1.S1_at -
11 0.063 GPAA1 GPAA1 MmugDNA.10539.1.S1_s_at +
12 0.063 HSP? LOC708240/LOC709412 Mmu.13079.1.S1_at -
13 0.064 MCM3APAS --- MmugDNA.7848.1.S1_at -
14 0.064 RPL37 --- MmugDNA.8209.1.S1_at -
15 0.064 dJ612B15.1 LOC698967 MmunewRS.398.1.S1_at ++++
16 0.064 SARS --- MmugDNA.37510.1.S1_at -
17 0.064 YWHAE LOC720295 MmugDNA.14868.1.S1_at -
Noriega et al. BMC Molecular Biology 2010, 11:47http://www.biomedcentral.com/1471-2199/11/47
Page 9 of 24
Human GeneChip® cycle study. All probe sets grouped by brain regionOur search method (see methods) revealed 1433 probesets annotated for housekeeping genes on the humanGeneChip®. When all probe sets were compared by brainregion, the most stably expressed (stability value = 0.041)was probe set 213214_x_at [RefSeq: NM_001614], whichrepresented actin, gamma 1 (ACTG1). The most stablyexpressed combination of probe sets, was 216295_s_atwith multiple RefSeq transcript IDs for clathrin, lightchain (CLTA) together with 202021_x_at, [RefSeq:NM_005801] representing eukaryotic translation initia-tion factor 1 (EIF1). The range of stability values was0.041-0.987. Four probe sets annotated for ACTG1 wereamong the top 20 most stably expressed of the 1433evaluated, and all four of these showed high expression(Table 6).
Human GeneChip® cycle study. All probe sets grouped by cycle phaseUsing the 1433 probe sets annotated for housekeepinggenes, when all probe sets were grouped for comparisonaccording to menstrual cycle phase, the most stablyexpressed (stability value = 0.024) probe set was216295_s_at, which had multiple RefSeq transcript IDannotations for clathrin, light chain (CLTA). The moststable combination of probe sets (stability value = 0.017)was the aforementioned 216295_s_at combined with221607_x_at [RefSeq: NM_001614], which representedactin, gamma 1 (ACTG1). The range of stability values forthe 1433 evaluated probe sets was 0.024-0.373. Five probesets annotated for ACTG1 were among the top 20 moststably expressed of the 1433 evaluated, and all four ofthese showed high expression (Table 6).
Human GeneChip® cycle study. Most representative probe sets grouped by brain regionUsing criteria described in the methods for representa-tive probe set selection, our search method revealed 544probe sets. When comparisons were made across brain
regions, the most stably expressed sequence (stabilityvalue 0.053) was a probe set (207243_s_at, NCBI repre-sentative public ID NM_001743) representing Homosapiens calmodulin 2 (phosphorylase kinase, delta)(CALM2), mRNA and annotated as calmodulin 1-3(CALM1 /CALM2 /CALM3) on NetAffx. Sequences rep-resenting the most stably expressed combination of twogenes (stability value = 0.030) were probe sets201405_s_at [RefSeq: NM_006833] and 200633_at [Ref-Seq: NM_018955] which represent COP9 constitutivephotomorphogenic homolog subunit 6 (COPS6) andubiquitin B (UBB) respectively The latter probe set,200633_at, was also annotated for ribosomal protein S27a(RPS27A) and ubiquitin C (UBC) (Table 7).
Human GeneChip® cycle study. Most representative probe sets grouped by cycle phaseUsing the 544 "most representative" probe sets, whencomparisons were made across phases of the menstrualcycle, the most stably expressed sequence (stability value= 0.026) was a probe set, 201390_s_at [RefSeq:NM_001320], representing casein kinase 2, beta polypep-tide (CSNK2B) and annotated for lymphocyte antigen 6complex, locus G5B (LY6G5B). The most stablyexpressed combination of two genes (stability value =0.019) was represented by the aforementioned CSNK2Bprobe set (201390_s_at) and a probe set, 200633_at [Ref-Seq:NM_018955] representing ubiquitin B (UBB) andannotated for ribosomal protein S27a (RPS27A), andubiquitin C (UBC) (Table 7). Thirteen probe sets amongthe 20 most stably ranked across cycle phase were alsoamong the 20 most stably ranked across brain region.
Human GeneChip® cycle study. Most representative probe sets: comparison between popular normalizersWe refer to the "popular normalizers" as the thirteenwidely used normalizers http://www.compugen.co.il/supp_info/Housekeeping_genes.html in addition toAsparagine-linked glycosylation protein 9 homolog(ALG9) and Ribosomal protein L13a (RPL13A). When the
18 0.064 RPS24 LOC701477/LOC702961/LOC704054/LOC705596/LOC707085/LOC711145/LOC715668/LOC717801
MmugDNA.6998.1.S1_at ++++
19 0.064 HIST1H2BC LOC696506 MmunewRS.953.1.S1_at -
20 0.064 ATP6V1F LOC705175 MmugDNA.5612.1.S1_at -
1444 probe sets annotated for genes in the independently verified set were analyzed. Probe sets in the table are in order of most stably expressed to least stably expressed within the top 20. "descriptor" is the gene symbol most closely representing annotation at the time of table creation. Here "GEN = " annotations were prioritized. "---" = no gene symbol listed. "exp" = gene expression represented by hybridization signal intensity [52]."+" and "-" symbols represent signal intensity values averaged across all animals and obtained using Affymetrix® GCOS analysis, and global scaling to an average target intensity of 200. (-) = "undetectable", (+) = "signal intensity < 500", (++) = "signal intensity 500-1500", (+++) = "signal intensity 1501-10000". (++++) = "signal intensity > 10000".
Table 4: 20 most stably expressed probe sets across brain regions of macaques in HRT study (Continued)

Noriega et al. BMC Molecular Biology 2010, 11:47http://www.biomedcentral.com/1471-2199/11/47
Page 10 of 24
Table 5: 20 most stably expressed probe sets detected in MAS 5.0 analysis of HRT study
HRT: brain region
rank/824 stability value descriptor "GEN = " gene symbol probe set ID exp
1 0.065 SUI1 --- MmugDNA.22897.1.S1_s_at +++
2 0.072 B4GALT3 LOC719920 MmugDNA.396.1.S1_at +
3 0.086 RPL13A LOC698713 MmugDNA.16774.1.S1_s_at ++++
4 0.086 LDHB LDHB MmugDNA.24833.1.S1_s_at ++++
5 0.088 RPS14 LOC697734/LOC710901 MmugDNA.3842.1.S1_s_at ++++
6 0.091 RUVBL2 --- MmugDNA.33967.1.S1_at +
7 0.092 EIF4A2 EIF4A2 MmugDNA.25666.1.S1_at +++
8 0.093 RRAGA BRI3 MmugDNA.15747.1.S1_at +++
9 0.096 NDUFA1 NDUFA1 MmugDNA.13559.1.S1_at +++
10 0.099 SNRPA SNRPA MmugDNA.6187.1.S1_at +
11 0.100 PFDN1 LOC697795 MmugDNA.2620.1.S1_at +++
12 0.100 PRPF8 PRPF8 MmugDNA.21692.1.S1_at ++
13 0.102 EMR2 EMR2 MmuSTS.3377.1.S1_at +
14 0.104 similar to calmodulin LOC715270/LOC717686 MmunewRS.652.1.S1_at ++++
15 0.105 CCND3 CCND3 MmuSTS.1979.1.S1_at +
16 0.106 PSMD2 LOC712473 MmuSTS.2326.1.S1_at +++
17 0.106 similar to ACTG1 LOC713687 Mmu.5709.1.S1_x_at ++++
18 0.106 UQCRQ UQCRQ MmugDNA.18513.1.S1_s_at +++
19 0.106 NUDT3 LOC718568 MmugDNA.22176.1.S1_at ++
20 0.107 ARL2 LOC722013 MmugDNA.11257.1.S1_s_at +++
HRT: treatment
rank/824 stability value descriptor "GEN = " gene symbol probe set ID exp
1 0.059 SUI1 --- MmugDNA.22897.1.S1_s_at +++
2 0.063 RUVBL2 --- MmugDNA.33967.1.S1_at +
3 0.068 TMED9 LOC702446 MmugDNA.32101.1.S1_s_at ++
4 0.071 PSMD2 LOC712473 MmuSTS.2326.1.S1_at +++
5 0.072 SARS LOC695046 MmugDNA.33979.1.S1_at +++
6 0.073 AHSA1 AHSA1 MmugDNA.13760.1.S1_at +++
7 0.074 RAD23A LOC720675 MmugDNA.4491.1.S1_s_at ++
8 0.074 TCFL1 VPS72 MmuSTS.798.1.S1_at +
9 0.074 TALDO1 LOC720828 MmugDNA.14258.1.S1_s_at +++
10 0.075 NDUFA7 LOC711212 MmugDNA.17832.1.S1_at ++
11 0.077 RRAGA BRI3 MmugDNA.15747.1.S1_at +++
12 0.077 RPS14 LOC697734///LOC710901 MmugDNA.3842.1.S1_s_at ++++
13 0.077 AKR1A1 AKR1A1 MmugDNA.35875.1.S1_at ++
14 0.077 CYB5R1 LOC704519 MmuSTS.4187.1.S1_at ++
15 0.077 COX7A2L LOC707203 MmugDNA.24749.1.S1_at +
16 0.077 COX7A2L LOC707203 MmugDNA.24749.1.S1_at +
17 0.078 UBB LOC697557 MmugDNA.35404.1.S1_at ++++
18 0.078 NDUFS5 NDUFS5 MmugDNA.29879.1.S1_at +++

Noriega et al. BMC Molecular Biology 2010, 11:47http://www.biomedcentral.com/1471-2199/11/47
Page 11 of 24
most representative probe sets for the popular normaliz-ers were compared, the probe set 200017_at [Ref-Seq:NM_002954], representing ribosomal protein S27a(RPS27A) was the most stably expressed (Table 8). Thisfinding was consistent when comparisons were madeacross brain region or phase of the menstrual cycle. Thisprobe set was also annotated for ubiquitin B (UBB) andubiquitin C (UBC). In the analysis grouped by brainregion, seven probe sets in the top 20 showed expressionbelow limits of detection, whereas with the phase group-ing, expression levels for one probe set out of 20 werebelow limits of detection (Table 8).
Findings common to both (HRT and cycle) studiesIn both studies, frequency distributions of expression sta-bility data for the housekeeping gene probe sets wereskewed toward the more stably expressed sequences (Fig-ure 5), failing Kolmogorov-Smirnov (P < 0.001) and Sha-piro-Wilks (P < 0.001) tests for normality. For the popularnormalizers in both studies, probe sets for RPS27Atended to clump according to expression stability amongthe most stably expressed in the collective set (Table 8).
In six of the analyses conducted between the two exper-iments, 31 gene annotations were found to be common tomultiple analyses, and 12 annotations were common toboth experiments (Table 9). Probe sets annotated forRPS27A/ubiquitin were the most commonly observedstably expressed sequences in all analyses between thetwo studies.
DiscussionqRT-PCRUsing three popular algorithms, we assessed relative geneexpression stability across the three brain regions, toidentify genes that met or exceeded criteria commonlyused for selection of internal reference genes used forqRT-PCR normalization [8,16]. In each case the prospec-tive internal reference genes RPL13A, GAPDH and ALG9were found to be more reliable normalizers than theselected genes for GABAergic system components [26],with the exception was GAD1, which was ranked as beingmore stably expressed than GAPDH using geNorm. We
suspected that this stems from the variation in GAPDHexpression in the MBH, which the NormFinder intra-group analysis showed to be an order of magnitudehigher than the variation in the expression of other exam-ined genes. Reduction of sample variance, by removal ofthe most deviant MBH value produced a geNorm rankingwhere GAPDH was more highly ranked than GAD1.
The finding that higher gene expression variabilityoccurred in the MBH compared to the extra-hypotha-lamic regions (HPC and AMD) was consistent with find-ings from a principal components (statistical) analysis ofgene expression during phases of the rhesus macaquemenstrual cycle [40] under conditions of the currentstudy.
Microarray evaluationProbe sets annotated for RPS27A/ubiquitin were stablyexpressed in both studies and provide basis for compar-ing results in the human and rhesus GeneChips®. Notethat in analysis of cycle study data grouped by region,probe sets for RPS27A/ubiquitin do not appear in the top20 most stably expressed probe sets when all probe setswere considered (Table 6). However the RPS27A/ubiq-uitin probe set '200633_at' appears as the 26th most stablyexpressed of the 1433 probe sets tested, and wasextremely highly expressed with a rating of "++++" (datanot shown). Comparatively, in the HRT study using therhesus GeneChip®, the probe set 'MmugDNA.43194.1.S1_at' was annotated as "similar to ubiquitin andribosomal protein S27A", and showed expression levelsbelow MAS 5.0 analysis detection limits (Table 8). How-ever another similarly annotated probe set (MmugDNA.26506.1.S1_at) was highly expressed, had a regionalexpression stability of 0.15 (rank = 453/1444) and a treat-ment expression stability of 0.069 (rank = 46/1444) (Datanot shown). The rhesus macaque annotations for both ofthese probe sets are based on a Macaca fascicularissequence annotated by comparison to the humansequence listed under RefSeq ID [NM_002954.3].
A detailed examination of the NetAffx annotation didnot clarify if these probe sets interrogate the RPS27Asequence solely, or the RPS27A/ubiquitin fusion
19 0.079 COX4I1 LOC714951 MmugDNA.39322.1.S1_s_at +++
20 0.080 PFDN1 LOC697795 MmugDNA.2620.1.S1_at +++
824 probe sets were selected from the 1444 HRT probe sets annotated for housekeeping genes based on MAS 5.0 signal intensity and detection call metrics. Probe sets in the table are in order of most stably expressed to least stably expressed within the top 20. "descriptor" is the gene symbol most closely representing annotation at the time of table creation. Here "GEN = " annotations were prioritized. "---" = no gene symbol listed. "exp" = gene expression represented by hybridization signal intensity [52]."+" and "-" symbols represent signal intensity values averaged across all animals and obtained using Affymetrix® GCOS analysis, and global scaling to an average target intensity of 200. (-) = "undetectable", (+) = "signal intensity < 500", (++) = "signal intensity 500-1500", (+++) = "signal intensity 1501-10000". (++++) = "signal intensity > 10000".
Table 5: 20 most stably expressed probe sets detected in MAS 5.0 analysis of HRT study (Continued)

Noriega et al. BMC Molecular Biology 2010, 11:47http://www.biomedcentral.com/1471-2199/11/47
Page 12 of 24
Table 6: most stably expressed probe sets across brain regions of normally menstruating macaques
Cycle study: brain region
rank/1433 stability value gene symbol probe set ID exp
1 0.041 ACTG1 213214_x_at +++
2 0.048 ACTG1 221607_x_at ++++
10 0.062 ACTG1 224585_x_at ++++
17 0.066 ACTG1 201550_x_at +++
4 0.054 CALM1/CALM2/CALM3 207243_s_at ++++
19 0.067 CLTA 216295_s_at +++
8 0.060 COX7C 201134_x_at ++
9 0.060 DIAPH1 1560080_at -
16 0.065 EIF1 212227_x_at +++
5 0.056 GPX4 201106_at +++
15 0.063 H6PD 221892_at +
20 0.067 LDHB 213564_x_at +++
13 0.062 MVK 36907_at ++
12 0.062 NACAP1 211445_x_at +++
6 0.059 POLR2A 217420_s_at -
7 0.059 RAC1 1567457_at -
11 0.062 SAFB 213635_s_at -
18 0.067 TCF25 221495_s_at -
3 0.052 YWHAH 236559_at -
14 0.063 ZNF592 227507_at -
Cycle study: cycle phase
rank/1433 stability value gene symbol probe set ID exp
2 0.025 ACTG1 221607_x_at ++++
4 0.026 ACTG1 213214_x_at +++
9 0.029 ACTG1 224585_x_at ++++
15 0.030 ACTG1 212988_x_at +++
16 0.030 ACTG1 201550_x_at +++
11 0.029 ARHGEF7 236416_at -
1 0.024 CLTA 216295_s_at +++
8 0.028 CLTA 200960_x_at +++
17 0.031 COPS6 201405_s_at +++
10 0.029 COX7C 201134_x_at ++
6 0.028 CSNK2B/LY6G5B 201390_s_at +++
18 0.031 EEF2 200094_s_at +++
3 0.026 EIF1 202021_x_at +++
7 0.028 EIF1 212130_x_at +++
12 0.029 EIF1 212227_x_at +++
19 0.031 GPAA1 215690_x_at ++
13 0.030 HINT1 207721_x_at +++

Noriega et al. BMC Molecular Biology 2010, 11:47http://www.biomedcentral.com/1471-2199/11/47
Page 13 of 24
sequence. Note that ubiquitin is covalently bound to pro-teins targeted for posttranslational modification or degra-dation, and influences the intracellular localization andstability of proteins. The ubiquitin gene can be fused to aribosomal protein gene, and this fusion gene may be ref-erenced by RPS27A probe sets in the on the Affymetrix®arrays.
Affymetrix® arrays contain redundant probe sets thatinterrogate different regions of the same gene [41], andreflect differential regulation of alternative script produc-tion based on alternative splicing or polyadenylation [42].Screening using qualitative present vs. absent calls fromMAS5.0 analysis can improve reliability of evaluationamong redundant probe sets [41,43,44].
Probe sets for the same gene commonly show differ-ences in expression levels [41,43-45]. For well annotatedgenes like ACTB, these probe set sequences are likely tobe accurate, and microarray analysis may be detectingvariations in expression stability along different portionsof the same sequence [44,46]. Although annotation ofrhesus GeneChip® probe sets are based on sequencesdefined using the human GeneChip® as a template [47],annotation of many probe sets for the rhesus GeneChip®are inferred and are frequently separated from verifiedsequences by more levels of interpretation than is thecase for the human GeneChip® [48]. For the rhesusmacaque, annotation reliability of the subset of the rhesusGeneChip® probe sets that have been verified using rhe-sus macaque tissues may exceed the reliability of probesets annotated on the human GeneChip®. However fullannotation of the rhesus GeneChip® is still a work inprogress [44] and to date, large numbers of functionalrhesus macaque transcripts may be more reliably interro-gated using the human GeneChip®.
Robust normalizers identified by microarray analysisIn the cycle study, the occurrence of four highlyexpressed, well annotated ACTG1 probe sets rankedamong the top 20 most stably expressed sequences inboth analytical groupings, causes ACTG1 to meet criteriafor what we propose to call a "robust normalizer". i.e.,
multiple segments of the same gene [44,46] show highexpression stability across all experimental conditions.
Identification of a robust normalizer (ACTG1) wasaccomplished using the human but not the rhesusGeneChip®. In contrast, probe sets annotated for RPS27Ashowed high stability across all tissues and conditionsused in both experiments (Tables 7, 8 and 9). However,annotation on the rhesus GeneChip® was insufficient forexploration of robustness as a potential normalizer.
Twelve annotations from among the various selectionsof "20 most stably expressed" were common to bothexperiments (Table 9). Within the cycle study, multipleprobe sets for the clathrin light chain (CLTA) wereobserved among the 20 most stably expressed under twomethods of probe set selection, and were robustlyexpressed using MAS 5.0 detection (Tables 6 and 9).
Popular normalizersIn both studies, the expression stabilities of popular nor-malizers were spread across much of the range observedin the overall pool of housekeeping genes. As a group, thepopular normalizers did not show tendencies to be morestably expressed than the larger pool of housekeepinggenes (See ranks in Table 8).
Probe sets for RPS27A and RPL11 showed high stabilityrankings among the popular normalizers for all analysesin both studies (Table 8). In analysis of the most represen-tative probe sets for the cycle study, the appearance ofclusters (by rank) of probe sets for popular normalizersRPS27A, RPL13A, ARHGDIA, ACTB and GAPDH show-ing high expression stability (Figure 6) under bothregional and phase-based analyses prompted us to iden-tify these genes as robust normalizers among the subsetof popular normalizers.
Probe sets for ACTB and GAPHD are well annotatedand used as controls on the rhesus GeneChip® [44], how-ever probe sets for these genes show a high range ofexpression stabilities (Figure 7). The significance of vari-able expression among well annotated probe sets for thesame gene is under evaluation [41,44]. Possibly related tothis probe set variability in expression and expression sta-
14 0.030 PPP2CB 201375_s_at +++
5 0.027 RPS27A/UBB/UBC 200633_at ++++
20 0.031 SNX3 208781_x_at +++
1433 probe sets annotated for genes in the independently verified set were analyzed. Probe sets in the table are presented here in alphabetical groupings by annotation irrespective of rank within the top 20. "exp" = gene expression represented by hybridization signal intensity [52]."+" and "-" symbols represent signal intensity values averaged across all animals and obtained using Affymetrix® GCOS analysis, and global scaling to an average target intensity of 200. (-) = "undetectable", (+) = "signal intensity < 500", (++) = "signal intensity 500-1500", (+++) = "signal intensity 1501-10000". (++++) = "signal intensity > 10000".
Table 6: most stably expressed probe sets across brain regions of normally menstruating macaques (Continued)

Noriega et al. BMC Molecular Biology 2010, 11:47http://www.biomedcentral.com/1471-2199/11/47
Page 14 of 24
Table 7: 20 most stably expressed of the "most representative" probe sets for housekeeping genes across brain regions of normally menstruating macaques
Cycle study: brain region
rank/544 stability value gene symbol probe set ID exp
1 0.053 CALM1/CALM2/CALM3 207243_s_at ++++
2 0.060 GPX4 201106_at +++
3 0.064 COX7C 201134_x_at ++
4 0.068 COPS6 201405_s_at +++
5 0.069 NDUFS5/RPL10 201757_at ++
6 0.071 VPS72 202261_at ++
7 0.071 RPS27A/UBB/UBC 200633_at ++++
8 0.073 ATP6V1F 201527_at +++
9 0.074 SSR2 200652_at ++
10 0.075 PPP2CB 201375_s_at +++
11 0.076 HINT1 207721_x_at +++
12 0.076 CSNK2B/LY6G5B 201390_s_at +++
13 0.078 PFDN5 207132_x_at +++
14 0.078 SPAG7 200053_at ++
15 0.078 RPL10 200725_x_at +++
16 0.078 GP2 206681_x_at -
17 0.080 RPLP1 200763_s_at +++
18 0.081 UQCRH 202233_s_at +++
19 0.081 COX7A2L 201256_at +++
20 0.083 ATF4 200779_at ++
Cycle study: cycle phase
rank/544 stability value gene symbol probe set ID exp
1 0.026 CSNK2B/LY6G5B 201390_s_at +++
2 0.027 RPS27A/UBB/UBC 200633_at ++++
3 0.027 HINT1 207721_x_at +++
4 0.027 COPS6 201405_s_at +++
5 0.028 PPP2CB 201375_s_at +++
6 0.028 COX7C 201134_x_at ++
7 0.029 ATP6V1F 201527_at +++
8 0.030 HAX1 201145_at ++
9 0.031 GPX4 201106_at +++
10 0.031 CALM1/CALM2/CALM3 207243_s_at ++++
11 0.031 SPAG7 200053_at ++
12 0.031 GPAA1 201618_x_at +
13 0.032 PSMD2 200830_at +++
14 0.032 COX7A2L 201256_at +++
15 0.033 CLTA 204050_s_at +++
16 0.033 NDUFA2 209224_s_at +++
17 0.033 SSR2 200652_at ++
Noriega et al. BMC Molecular Biology 2010, 11:47http://www.biomedcentral.com/1471-2199/11/47
Page 15 of 24
bility, we found sequences for ACTB and GAPDH to beproblematic in qRT-PCR normalization of the HRT study(unpublished data).
Comparison between qRT-PCR and microarray dataUnder all selection criteria used in the current study, weindentified probe sets for genes more stably expressedthan probe sets for genes (RPL13A, ALG9 and GAPDH)that we showed to be well suited for qRT-PCR normaliza-tion based on high concordance with microarray results,as well as relative expression stability comparisons usingthree algorithms designed for this purpose [26]. Interest-ingly, when all rhesus GeneChip® probe sets wererestricted to those for popular normalizers, RPL13A andGAPDH were among the more highly ranked (stablyexpressed) and showed high expression (Table 8). Addi-tional genes may be open for consideration given thatmany probe sets on the rhesus GeneChip® were more sta-bly expressed than the probe sets for RPL13A, ALG9 andGAPDH. In addition, the probes used for qRT-PCR werederived from the same NCBI sequences as the rhesusGeneChip® probe sets. The noticeable rank separation ofALG9 from RPL13A and GAPDH in the HRT studyemphasizes the importance of considering that all genesincluded in the NormFinder analysis influence systemicvariation which affects relative ranking [37].
Note that how representative we considered a probe setto be was based on the cumulative record of annotationhistory associated with the probe set. Other investigatorsperforming gene expression comparisons using approxi-mately 500 genes showed high correlation betweenresults from multiple microarray platforms (Affymetrix,Agilent, Illumina, GE Healthcare and NCI) and TaqMan®qRT-PCR results. In addition, high correlations betweenqRT-PCR and microarray results using RMA-normalizedlog 2-transformed data in nonhuman primates have beendemonstrated elsewhere [49]. The use of publicly avail-able microarray data provides a selection method that isindependent of the microarray platform or normalizationmethodology, and is able to cope with gene lists that over-lap only partially [22]. We considered genes showing both
low and high expression in addition to high expressionstability because the data range between the minimumand maximum expression levels could have a profoundinfluence on normalizer calibration. Although pairwisegene expression stability measures account for effects oflarge differences in expression levels [34], having a smallrange of control gene expression values can skew com-parative detection sensitivity.
It is important to note that other methods would likelydetect stably expressed genes from the current studywhich are not included in the published set of 575 humanhousekeepers. However, our goal was for current study toidentify candidates likely enough to be stably expressedover experimental variation so as to allow us to best man-age PCR for future macaque studies involving these brainregions, where additional microarray analysis may not befeasible.
ConclusionsUsing gene microarray analysis of two experiments, weranked expression stability of sequences for 575 pub-lished housekeeping genes under six sex-steroid environ-ments in three regions of the rhesus macaque brain.Sequences for popularly used normalizing genes did nottend to be more stably expressed than sequences from theoverall pool of housekeeping genes, and probe set expres-sion stability values for multiple genes frequently over-lapped. Although annotation quality of the rhesusGeneChip® was not sufficient to facilitate detection ofrobust normalizers, comparisons of relative expressionstability values for the same genes between the rhesusand human GeneChips® were possible. Robust normalizercandidates were identified using the human GeneChip®.For example, in the cycle study, multiple probe sets forACTG1 were stably expressed under all conditions in allbrain regions at levels allowing easy detection. Thereforewe recommend ACTG1 as a robust normalizer for exami-nation of MBH, HPC and AMD under changing ovarianhormonal conditions. Comparatively, in both studies,probe sets for RPS27A were stably expressed under allconditions in all three brain regions at levels allowing
18 0.034 TTC1 201434_at ++
19 0.034 RPLP1 200763_s_at +++
20 0.034 INPP5K 202782_s_at -
Probe sets are listed according to rank. Higher rank indicates greater expression stability. Note that selection was narrowed to 544 probe sets likely to be most representative of genes of interest."exp" = gene expression represented by hybridization signal intensity [52]."+" and "-" symbols represent signal intensity values averaged across all animals and obtained using Affymetrix® GCOS analysis, and global scaling to an average target intensity of 200. (-) = "undetectable", (+) = "signal intensity < 500", (++) = "signal intensity 500-1500", (+++) = "signal intensity 1501-10000". (++++) = "signal intensity > 10000".
Table 7: 20 most stably expressed of the "most representative" probe sets for housekeeping genes across brain regions of normally menstruating macaques (Continued)

Noriega et al. BMC Molecular Biology 2010, 11:47http://www.biomedcentral.com/1471-2199/11/47
Page 16 of 24
Table 8: Most stably expressed probe sets annotated for popular normalizing genes
Cycle study: brain region HRT: brain region
rank/544 stability value
annotation target
probe set ID
exp rank/1444 stabilityvalue
annotation target
probe set ID exp
76 0.109 RPS27A 200017_at ++++ 6 0.074 RPS27A MmugDNA.43194.1.S1_at -
182 0.141 RPL11 200010_at +++ 23 0.082 RPL13A MmugDNA.16774.1.S1_s_at ++++
216 0.151 ALG9 228817_at + 62 0.091 RPL32 MmugDNA.25831.1.S1_s_at ++++
217 0.152 RPL19 200029_at +++ 187 0.112 LDHA MmugDNA.40348.1.S1_at -
233 0.159 ARHGDIA 201168_x_at ++ 350 0.135 ACTB AFFX-Mmu-actin-3_s_at ++++
236 0.160 ACTB 200801_x_at ++++ 382 0.140 GAPDH AFFX-Mmu-gapdh-3_x_at ++++
261 0.169 RPS18 201049_s_at ++++ 383 0.140 PGK1 MmugDNA.17381.1.S1_at -
281 0.178 RPL13A 200716_x_at ++++ 535 0.161 RPL19 MmugDNA.25770.1.S1_at +++
333 0.201 GAPDH 212581_x_at ++++ 628 0.182 ARHGDIA MmugDNA.2575.1.S1_at -
352 0.211 HSPCB 200064_at ++++ 825 0.231 HSPCB MmugDNA.32274.1.S1_at +++
363 0.220 RPL32 200674_s_at ++++ 842 0.235 RPS18 MmugDNA.43260.1.S1_at ++++
389 0.240 PGK1 200737_at ++ 934 0.262 ALG9 MmugDNA.30425.1.S1_at +
454 0.293 NONO 200057_s_at +++ 1129 0.329 NONO MmugDNA.18264.1.S1_at ++
456 0.294 ALDOA 200966_x_at +++ 1271 0.410 RPL11 MmugDNA.25225.1.S1_at +
464 0.302 LDHA 200650_s_at ++
Cycle study: cycle phase HRT: treatment
rank/544 stability value
annotation target
probe set ID exp rank/1444 stability value annotation target
probe set ID exp
41 0.039 RPS27A 200017_at ++++ 2 0.054 RPS27A MmugDNA.43194.1.S1_at -
87 0.045 RPL11 200010_at +++ 25 0.066 RPL32 MmugDNA.25831.1.S1_s_at ++++
110 0.048 RPL19 200029_at +++ 143 0.078 GAPDH AFFX-Mmu-gapdh-3_x_at ++++
123 0.049 ACTB 200801_x_at ++++ 164 0.079 RPL13A MmugDNA.16774.1.S1_s_at ++++
150 0.051 ARHGDIA 201168_x_at ++ 215 0.082 ACTB AFFX-Mmu-actin-3_s_at ++++
182 0.053 RPL13A 200716_x_at ++++ 294 0.086 PGK1 MmugDNA.17381.1.S1_at -
204 0.056 RPS18 201049_s_at ++++ 350 0.089 RPL19 MmugDNA.25770.1.S1_at +++
253 0.060 ALG9 228817_at + 463 0.095 ARHGDIA MmugDNA.2575.1.S1_at -
338 0.068 GAPDH 212581_x_at ++++ 568 0.099 RPS18 MmugDNA.43260.1.S1_at ++++
347 0.069 HSPCB 200064_at ++++ 571 0.099 HSPCB MmugDNA.34686.1.S1_at +++
361 0.073 RPL32 200674_s_at ++++ 607 0.102 LDHA MmugDNA.8511.1.S1_at -
436 0.090 ALDOA 200966_x_at +++ 668 0.105 ALG9 MmugDNA.30425.1.S1_at +
437 0.090 NONO 200057_s_at +++ 1212 0.168 RPL11 MmugDNA.25225.1.S1_at +
478 0.104 LDHA 200650_s_at ++ 1346 0.218 NONO MmugDNA.770.1.S1_at +
492 0.112 PGK1 200737_at ++
Probe sets are listed according to rank. Higher rank indicates greater expression stability. Denominator in the rank column indicates the number of probe sets analyzed using criteria described in methods. Note that selection was narrowed to the 544 probe sets likely to be most representative of genes of interest where menstruating macaques were examined using the human GeneChip®. All 1444 probe sets that were annotated for genes of interest on the rhesus GeneChip® are represented in the table."exp" = gene expression represented by hybridization signal intensity [52]."+" and "-" symbols represent signal intensity values averaged across all animals and obtained using Affymetrix® GCOS analysis, and global scaling to an average target intensity of 200. (-) = "undetectable", (+) = "signal intensity < 500", (++) = "signal intensity 500-1500", (+++) = "signal intensity 1501-10000". (++++) = "signal intensity > 10000"

Noriega et al. BMC Molecular Biology 2010, 11:47http://www.biomedcentral.com/1471-2199/11/47
Page 17 of 24
easy detection, and may be the normalizer of choice forMBH, HPC and AMD comparison between both experi-ments. However, further examination of probe set anno-tation quality for this gene is recommended.
In summary, we identified multiple genes that weremore stably expressed across more experimental condi-tions and showed less probe set expression variabilitythan popularly used genes meeting typical requirementsfor qRT-PCR normalization. These findings demonstrateuses for well annotated gene microarray data in address-ing widely documented problems associated with theselection of experimentally specific internal referencegenes.
MethodsOverview (Figure 1)Tissue from the arcuate nucleus of the medial basal hypo-thalamus (MBH), hippocampus (HPC) and amygdala(AMD) of rhesus macaques Macaca mulatta were col-lected for examination in two separates studies. Onestudy was designed to assess effects of three hormonereplacement therapy (HRT) conditions on gene expres-sion in the three brain regions collected, and this geneexpression was examined using the rhesus GeneChip®. Inthe HRT study qRT-PCR was conducted on all tissues inaddition to microarray analysis. In a second study (cyclestudy), gene expression in the three brain regions duringearly follicular (EF) late follicular (LF) and mid luteal(ML) phases of the menstrual cycles of normally men-struating macaques was examined using the humanGeneChip®.
In the gene microarray analyses for both the HRT andcycle studies, comparisons of the relative expression sta-bilities of probe sets annotated for independentlyassessed human housekeeping genes [33] were conductedusing NormFinder [31] algorithms equipped to processdata from microarrays. Because the reliability of theNormFinder algorithm is dependent on the expressionstability of the sequences examined [37], the most widelyused normalizers from the list of housekeeping geneshttp://www.compugen.co.il/supp_info/Housekeeping_genes.html, as well as RPL13A and ALG9(the latter two considered noteworthy based on our priorresults [26] and considered here as part of the "popularnormalizer" group) were examined in a separate analyses.Again, in efforts to compare probe sets best suited for usein the NormFinder analysis, in the cycle study we desig-nated probe sets as "most representative" according tocriteria described later in the current methods sectionand analyzed these probe sets separately as well.
All analyses from both experiments (Figure 1) are sum-marized as follows:
1a) HRT study - qRT-PCR: GABAergic component genes, ALG9, GAPDH and RPL13A expression vari-ability compared using geNorm, NormFinder and BestKeeper algorithms.1b) HRT study - gene microarray -general probe set selection: NormFinder relative expression stability assessments of 1444 rhesus GeneChip® probe sets annotated for housekeeping genes, grouped by brain region or hormone treatment.1c) HRT study - gene microarray - "expressed sequences" from the general probe set selection: NormFinder relative expression stability assessments of 824 probe sets showing above average signal inten-sity and receiving "present" calls in MAS 5.0 analysis.1d) HRT study - gene microarray - probe set selection for popular normalizers: NormFinder relative expres-sion stability assessments of all rhesus GeneChip®
probe sets annotated for 15 "popular normalizers", grouped by brain region or hormone treatment.2a) Cycle study - gene microarray - general probe set selection: NormFinder relative expression stability assessments of 1433 human GeneChip® probe sets annotated for housekeeping genes, grouped by brain region or cycle phase.2b) Cycle study - gene microarray - most representa-tive probe set selection: NormFinder relative expres-sion stability assessments of 544 human GeneChip®
probe sets selected for the highest annotation quality among the 1433 probe sets annotated for housekeep-ing genes, grouped by brain region or cycle phase.2c) Cycle study - gene microarray - popular normal-izer probe set selection from among the most repre-
Figure 5 Frequency distributions of relative expression stability values. Histograms show counts on the ordinate axis and expression stability values on the abscissa. Histograms are arranged according to study (first word) and analysis grouping scheme (second word). 1433 and 1444 probe set were used in the cycle and HRT studies respective-ly to represent genes likely to be reliably expressed under multiple conditions (housekeeping genes). Red lines show average expression stability values.

Noriega et al. BMC Molecular Biology 2010, 11:47http://www.biomedcentral.com/1471-2199/11/47
Page 18 of 24
Table 9: Gene annotations common across multiple experiments and analysis groupings
HRT study: 20 most stably expressed Cycle study: 20 most stably expressed
gene annotation 1b: all probe sets (1444)
1c: "expressed" probe sets (824)
2a: all probe sets (1433)
2b: representative probe sets (544)
brain region
hormone trt
brain region
hormone trt
brain region
cycle phase
brain region
cycle phase
ACTG1 √† √ √
API5 √ √
ARHGEF7 √ √
ATP6V1F √ √ √
BRI3/RRAGA √ √
CALM1/CALM2/CALM3 √* √† √ √ √
CLTA √ √ √
COPS6 √ √ √
COX7A2L √ √ √
COX7C √ √ √ √ √
CSNK2B/LY6G5B √ √ √
EEF1A1 √ √
EIF1 √ √
GPAA1 √ √ √ √
GPX4 √ √ √
HINT1 √ √ √
HIST1H2BC √ √
LDHB √ √
NDUFS5 √ √
PFDN1 √ √ √
PPP2CB √ √ √
PSMD2 √ √ √
RPLP1 √ √
RPS14 √ √ √
RPS27A/ubiquitin √ √ √# √ √ √
RUVBL2 √ √
SARS √ √
SPAG7 √ √
SSR2 √ √
SUI1 √ √ √
VPS72 √ √
Numbers in parentheses show the total number of probe sets in the group under consideration. Check marks (√) show studies (HRT vs. cycle), probe set selection methods ("all ", "expressed", or "most representative" probe sets annotated for housekeeping genes) and analysis groupings (brain region, hormone treatment or cycle phase) under which the listed gene annotation appears.* = CALM1 only. # = UBB only. † = "Similar to".
Noriega et al. BMC Molecular Biology 2010, 11:47http://www.biomedcentral.com/1471-2199/11/47
Page 19 of 24
sentative probe sets: NormFinder relative expression stability assessments of most representative human GeneChip® probe sets annotated for 15 "popular nor-malizers", grouped by brain region or cycle phase.
AnimalsAdult (age range 9-12 years) female rhesus macaques(Macaca mulatta) were cared for in accordance withIACUC regulations and the National Research Council'sGuide for the Care and Use of Laboratory Animals by theDivision of Animal Resources at the Oregon National Pri-mate Research Center (ONPRC). All procedures wereethically and legally approved by these overseeing bodies.Twelve animals were used per study, and were housed in
a temperature-controlled environment where PrimateChow (Purina Mills Inc., St. Louis, MO) was made avail-able to the animals twice daily, at 8:00 h and again at 15:00h. This diet was supplemented with fresh fruit and vege-tables, and the animals had continuous access to drinkingwater.
The animals were euthanized using sodium pentobar-bital (25-30 mg/kg i.v.) and exsanguinated following pro-cedures recommended by the American VeterinaryMedical Association's Panel on Euthanasia. In all cases,necropsies were performed within a narrow window oftime (1000-1300 h). Various postmortem tissues werecollected and made available to other investigators
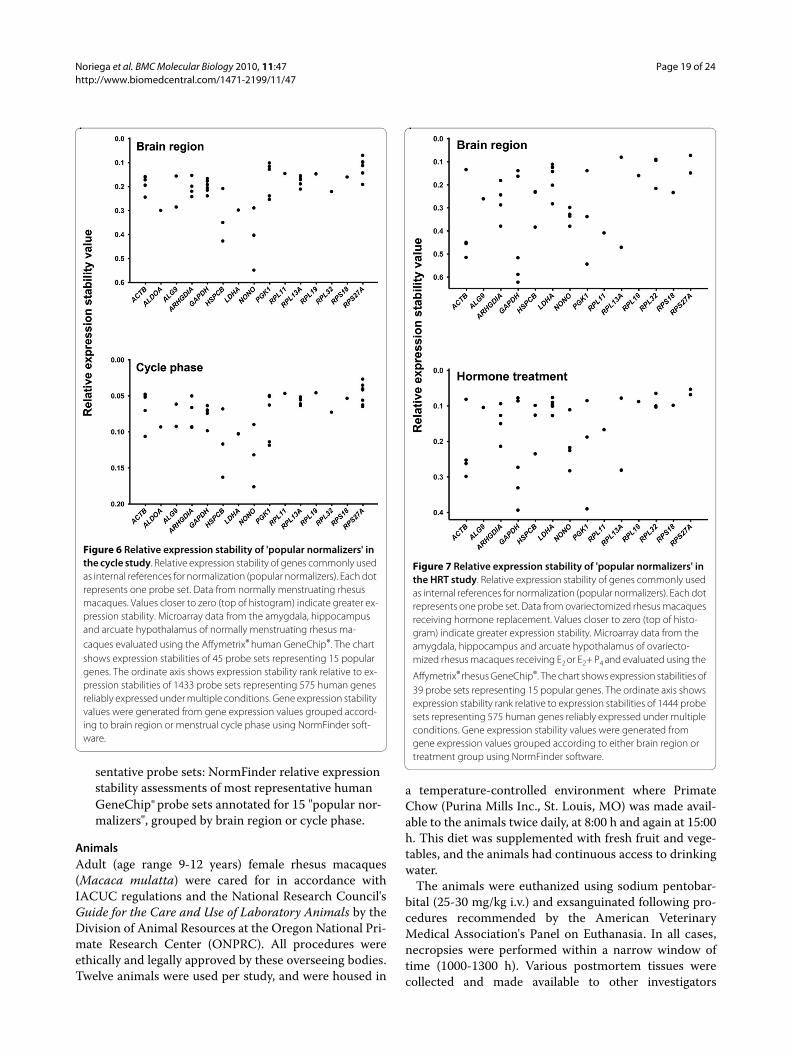
Figure 6 Relative expression stability of 'popular normalizers' in the cycle study. Relative expression stability of genes commonly used as internal references for normalization (popular normalizers). Each dot represents one probe set. Data from normally menstruating rhesus macaques. Values closer to zero (top of histogram) indicate greater ex-pression stability. Microarray data from the amygdala, hippocampus and arcuate hypothalamus of normally menstruating rhesus ma-caques evaluated using the Affymetrix® human GeneChip®. The chart shows expression stabilities of 45 probe sets representing 15 popular genes. The ordinate axis shows expression stability rank relative to ex-pression stabilities of 1433 probe sets representing 575 human genes reliably expressed under multiple conditions. Gene expression stability values were generated from gene expression values grouped accord-ing to brain region or menstrual cycle phase using NormFinder soft-ware.
Figure 7 Relative expression stability of 'popular normalizers' in the HRT study. Relative expression stability of genes commonly used as internal references for normalization (popular normalizers). Each dot represents one probe set. Data from ovariectomized rhesus macaques receiving hormone replacement. Values closer to zero (top of histo-gram) indicate greater expression stability. Microarray data from the amygdala, hippocampus and arcuate hypothalamus of ovariecto-mized rhesus macaques receiving E2 or E2+ P4 and evaluated using the
Affymetrix® rhesus GeneChip®. The chart shows expression stabilities of 39 probe sets representing 15 popular genes. The ordinate axis shows expression stability rank relative to expression stabilities of 1444 probe sets representing 575 human genes reliably expressed under multiple conditions. Gene expression stability values were generated from gene expression values grouped according to either brain region or treatment group using NormFinder software.
Noriega et al. BMC Molecular Biology 2010, 11:47http://www.biomedcentral.com/1471-2199/11/47
Page 20 of 24
through the ONPRC Tissue Distribution Program. Aftera transcardial flush with 1 liter of 0.9% saline, the brainswere immediately removed, cut into blocks, and pre-served in RNAlater® (Ambion, Austin, TX). Areas ofinterest (MBH, HPC and AMD) were subsequently dis-sected from tissue blocks, resulting in a total of 36 indi-vidual samples per study.
As previously described [26], all animals in the HRTstudy were ovariectomized (OVX). Untreated ovariecto-mized animals served as controls (OXV), whereas othersreceived subcutaneous SILASTIC implants containingeither 17β-estradiol (E2), or E2 and progesterone (E2+P4).
In the cycle study, daily menstrual records were estab-lished for each female based on close inspection of themonkey's perineum and cage pan for signs of menstrualbleeding. All females were determined to have regularmonthly cycles of approximately 28 days. Only dataobtained from healthy monkeys, as determined by theONPRC veterinary staff, were included in the statisticalanalyses. Serum E2 levels and serum P4 levels were ana-lyzed to assist in establishing an animal's menstrual cyclephase. Using menstrual cycle monitoring, tissue wastimed for collection during the early follicular stage ("EF"= low E2 and P4), late follicular ("LF" = declining E2 afterovulation, low P4) and mid luteal ("ML" = low E2 high P4).Four animals were identified for each of the three phasesof the cycle (total = 12). Average values for EF were E2 =64.8 pg/ml, P4 = 0.18 ng/ml; for LF, E2 = 71 pg/ml, P4 =0.52 ng/ml; for ML, E2 = 39 pg/ml, P4 = 4.92 ng/ml. Atnecropsy, menstrual stage was also verified using histo-logical examination of the endometrium, with EF = thinendometrium, ciliated oviduct; LF = thin, proliferativeendometrium with ciliated and fully secretory oviduct;ML = thickened endometrium.
qRT-PCRQuantitative real-time RT-PCR (qRT-PCR) and data col-lection were conducted using the 7900HT Fast Real-TimePCR thermal cycler and sequence detection systems(Software version 2.2.1) from Applied Biosystems (FosterCity, CA). No-template (negative) controls were includedfor each gene analysis. Four-point standard curves wereconstructed using cDNA pooled equally from all brainregions and all animals. The curves were constructedfrom serial 5- fold dilutions and covered a cDNA dilutionrange of 0.2 to 0.0016 (larger fold dilutions producedunacceptably high cycle times for some genes in thestudy).
qRT-PCR reactions for unknowns were conducted insealed 384-well optical plates in a total volume of 5 μl perwell, using 1.0 μl of 1:5-diluted cDNA, and final concen-trations of 0.25 μM Taqman® TAMRA probe and 0.3 μMeach of forward and reverse primers. Reactions were con-
ducted using thermal cycler conditions of: 2 min at 50°C,10 min at 95°C and 50 cycles of 15 s at 95°C (DNA melt-ing) and 1 min at 60°C (primer annealing/extension).Baseline and threshold levels for amplification plots weredetermined automatically using the ABI sequence detec-tion systems software version 2.2.1.
We examined expression of prospective internal refer-ence genes (ALG9, GAPDH and RPL13A), as well as genesencoding GABA receptor subunits (GABRA1, GABRA4,GABRG2, GABRD and GABRE) and a GABA-synthesiz-ing enzyme (GAD1). We compared expression stabilityacross three conditions of ovarian steroid exposure in thethree brain regions examined (MBH, HPC and AMD).These comparisons were initially made in an investiga-tion of hormone effects on expression of GABAergiccomponents [26], but we describe the qRT-PCR results inmore detail here for further comparison against resultsfrom gene microarray analyses.
qRT-PCR primers and probesPrimers and probes for prospective internal referencegenes ALG9, GAPDH and RPL13A as well as GABA sub-unit receptors GABRA1, GABRA4, GABRG2, GABRDand GABRE and the enzyme GAD1 were designed usingPrimer Express 2.0 software (Applied Biosystems, FosterCity, CA) from sequence sources listed in Table 1. Rhesusmacaque sequences for GAPDH and RPL13A were con-firmed in-house using RT-PCR primers against sourcesequences to amplify rhesus macaque hippocampalcDNA pooled from several individuals. These PCR prod-ucts were sequenced using an ABI 3730×l DNAsequencer (Applied Biosystems) according to manufac-turer's instructions.
1a. qRT-PCR GeNorm analysisQuantity values calculated using the standard curvemethod [50] were entered into the geNorm version 3.5VBA applet for Windows [30] and used to calculate thegene-stability measure (M) defined as the average pair-wise variation of a given gene with all other consideredgenes. The least stable gene was then eliminated and sta-bility based on pairwise comparisons recalculated to pro-duce a new ranking. This sequential elimination process[34] was continued until no stability differences weredetected between genes. Because one of the MBH OVXsamples introduced a high level of variation in geneexpression, the analysis was repeated with this sampleomitted, in order to test the effects of variation in thisgroup on relative gene expression stability output.
1a. qRT-PCR NormFinder analysisQuantity values calculated using the standard curvemethod [50] were evaluated using the model-based vari-ance estimation approach facilitated by the "NormFinder"

Noriega et al. BMC Molecular Biology 2010, 11:47http://www.biomedcentral.com/1471-2199/11/47
Page 21 of 24
Visual Basic application [31] for Microsoft Excel, avail-able from the Molecular Diagnostics Laboratory (AarhusUniversity, Denmark). Samples were grouped accordingto brain region and stability was estimated with and with-out group identifiers. For each of the three brain regions,intra-group and inter-group variation [37] was calculatedfor each gene. Three rounds of analysis were conductedas follows: 1) All nine genes were included in order to testthe stability of GABA receptor subunit genes; 2) The fivemost stable genes (ALG9, GAPDH, RPL13A GAD1 andGABRA4) were analyzed in attempts to maximize thequality of variation estimation methodology based onsample size; 3) Only the three predicted normalizers,ALG9, GAPDH and RPL13A, were analyzed to maximizeestimation quality based on removal of systematic varia-tion [37]. As described for the geNorm analysis, all testswere repeated with and without the single MBH OVXsample responsible for most of the MBH variation omit-ted. High gene expression variation in the MBH alsoprompted additional stability analysis where the MBHwas considered separately from the HPC and AMD.
1a. qRT-PCR BestKeeper analysisCrossing point values [38] were examined using the Best-Keeper [32]Excel-based tool [51]. Standard curves wereused to calculate amplification efficiency (EA) accordingto the convention EA = 10(-1/slope). All samples were ana-lyzed together, and in light of NormFinder analysis resultshighlighting GAPDH expression variation in the MBH,the MBH was analyzed separately from the AMD andHPC.
Gene microarraysRNA extraction and preparation of cDNA from MBH,HPC and AMD was conducted as previously described[26,52]. Both RMA and Affymetrix® Microarray Suite ver-sion 5.0 (MAS 5.0) [39] analyses were conducted usingmethods previously described [26,52]. RMA-normalizedresults were analyzed using the NormFinder Visual Basicapplication [31] where identifiers were used to conducttwo analyses (according to grouping) in each study. In theHRT study, expression values were grouped according to1) brain region and 2) hormone treatment. For the cyclestudy, expression values were grouped according to 1)brain region and 2) to phase of the menstrual cycle.
1b. Microarray general probe set selection from the rhesus GeneChip®A publicly available list of 575 human genes expressedunder all conditions tested, and derived from publiclyavailable microarray results, http://www.compugen.co.il/supp_info/Housekeeping_genes.html,
was used to identify genes with high likelihood of meet-ing criteria required to be considered as appropriate
housekeeping genes [33]. NetAffx build number 28(March 11, 2009) for the Affymetrix® GeneChip® rhesusMacaque Genome Array was used to select rhesusmacaque probe sets with RefSeq mRNA transcript IDsmatching genes from the publicly available list of 575 pro-posed human housekeeping genes [33]. Where nomatches were found, probe sets were selected if genesymbols for housekeeping genes of interest were includedin their annotation. If RefSeq mRNA transcript and genesymbol annotations for probe sets could not be found, theannotation build was searched by gene name.
1c. Microarray selection of "expressed" probe sets from the rhesus GeneChip®Because many of the sequences obtained from the gen-eral probe set selection were poorly annotated or showedlow expression, a second pair of NormFinder relativeexpression stability assessments, grouped by brain regionor hormone treatment, was made using only probe setswith average expression levels meeting detection criteriausing MAS 5.0 analysis. Probe sets meeting "expressed"criteria (824 probe sets in total) showed average signaldetection of 200 (global scaling target intensity) or higher,and had present calls [43] in more than 50% of the ani-mals.
2a. Microarray general probe set selection from the human GeneChip®Using annotations from HG-U133 Plus 2.0 NetAffx buildnumber 28 (March 11, 2009), RefSeq record numbers formature mRNA transcripts, indicated by the prefix"NM_"[53], from the housekeeping gene list were used toidentify probe sets on the Affymetrix® U133 Plus 2.0GeneChip® [54] representative of the genes in question.
2b. Microarray most representative probe set selection from the Human GeneChip®Probe set selection using this approach was designed tomaximize accuracy while minimizing redundancy in thedata used to compare gene expression stability. To maxi-mize annotation consistency between the probe setsequences and the genes listed in the public database of575 housekeeping genes, probe sets with representativepublic IDs matching those in the public database list wereprioritized. However, if no public ID match was found,RefSeq Transcript ID listings were used. If multiple tran-script IDs were listed, or multiple probe sets had the sametranscript ID, where possible, we eliminated probe setswith "x" and "s" suffixes [55] where probes in the probeset may have matched transcripts from different genes. Ingeneral we selected final probe sets with the highestannotation grade (A), however, to ensure consistencywith original mRNA record numbers, probe sets with B-grade annotations were selected in rare instances. Where

Noriega et al. BMC Molecular Biology 2010, 11:47http://www.biomedcentral.com/1471-2199/11/47
Page 22 of 24
probe sets appeared equivalent, we selected the set withthe most complete mRNA coding sequence (cds), ormore recent submission. If complete cds sequences over-lapped then sets with the embedded sequence wereselected. Where annotation was unclear, the gene was notincluded.
1d and 2c. Microarray probe sets from "popular normalizers"Thirteen genes from the publicly available list of house-keeping genes were designated "in popular use as refer-ence in real-time PCR" http://www.compugen.co.il/supp_info/Housekeeping_genes.html. These 13 genestogether with ALG9 and RPL13A are referred to as the"popular normalizers" in this manuscript. Because therelative expression stability values calculated by theNormFinder algorithm can be argued to be more accu-rate when more stably expressed genes are used, we con-ducted separate analyses using only the popularnormalizers for comparison with the larger publicly avail-able group. Probe sets used in analyses of the popularnormalizers were selected using the "general" and "repre-sentative" methods described above.
AbbreviationsACTB: gene encoding actin, beta; ACTG1: gene encoding actin, gamma 1;ACVRL1: gene encoding activin A receptor type II-like 1; AHSA1: gene encodingactivator of heat shock 90 kDa protein ATPase homolog 1; AKR1A1: geneencoding aldo-keto reductase family 1, member A1; ALDOA: gene encodingaldolase A, fructose-bisphosphate; ALG9: gene encoding asparagine-linked gly-cosylation 9 homolog; AMD: amygdala; API5: gene encoding apoptosis inhibi-tor 5; ARHGDIA: gene encoding Rho GDP dissociation inhibitor (GDI) alpha;ARHGEF7: gene encoding Rho guanine nucleotide exchange factor (GEF) 7;ARL2: gene encoding ADP-ribosylation factor-like 2; ATF4: gene encoding acti-vating transcription factor 4 (tax-responsive enhancer element B67); ATP5S:gene encoding ATP synthase, H+ transporting, mitochondrial F0 complex, sub-unit s (factor B); ATP6V1F: gene encoding ATPase, H+ transporting, lysosomal 14kDa, V1 subunit F; B4GALT3: gene encoding UDP-Gal:betaGlcNAc beta 1,4-galactosyltransferase, polypeptide 3; BRI3: gene encoding Brain protein I3;CALM1/CALM2/CALM3: gene encoding calmodulin 1/2/3 (phosphorylasekinase, delta); CCND3: gene encoding cyclin D3; CLTA: gene encoding clathrin,light chain (Lca); COL6A1: gene encoding collagen alpha-1(VI) chain; COPS6:gene encoding COP9 constitutive photomorphogenic homolog subunit 6(Arabidopsis); COX4I1: gene encoding cytochrome c oxidase subunit IV isoform1; COX7A2L: gene encoding polypeptide 2-like cytochrome c oxidase subunitVIIa; COX7C: gene encoding cytochrome c oxidase subunit VIIc; CP: crossingpoint; CSNK2B/LY6G5B: gene encoding casein kinase 2, beta polypeptide/lym-phocyte antigen 6 complex, locus G5B; Ct: cycle threshold; CYB5R1: geneencoding cytochrome b5 reductase 1; DIAPH1: gene encoding diaphanoushomolog 1 (Drosophila); E2: 17β-estradiol; E2+P4: 17β-estradiol + progesterone;EA: PCR Amplification efficiency; EEF1A1: gene encoding eukaryotic translationelongation factor 1 alpha 1; EEF2: gene encoding eukaryotic translation elon-gation factor 2; EF: early follicular (menstrual cycle phase); EIF1: gene encodingeukaryotic translation initiation factor 1; EIF4A2: gene encoding eukaryotictranslation initiation factor 4A, isoform 2 e encoding protein; GABA: gamma-aminobutyric acid; GABRA1: gene encoding GABAA receptor subunit alpha 1;GABRA4: gene encoding GABAA receptor subunit alpha 4; GABRD: gene encod-ing GABAA receptor subunit delta; GABRE: gene encoding GABAA receptorsubunit epsilon; GABRG2: gene encoding GABAA receptor subunit gamma 2;GAD1: gene encoding glutamic acid decarboxylase 1 (67 kDa); GAPDH: geneencoding glyceraldehyde 3-phosphate dehydrogenase; GAPDH: gene encod-ing Glyceraldehyde-3-phosphate dehydrogenase; GP2: gene encoding glyco-protein 2 (zymogen granule membrane); GPAA1: gene encodingglycosylphosphatidylinositol anchor attachment protein 1; GPX4: gene encod-
ing glutathione peroxidase 4 (phospholipid hydroperoxidase); GRIK5: geneencoding glutamate receptor, ionotropic kainate 5; H6PD: gene encodinghexose-6-phosphate dehydrogenase (glucose 1-dehydrogenase); HAX1: geneencoding HCLS1 associated protein X-1; HINT1: gene encoding histidine triadnucleotide binding protein 1; HIST1H2BC: gene encoding histone H2B 291B;HPC: hippocampus; HPCAL1: gene encoding hippocalcin-like protein 1; HSPCB:gene encoding heat shock protein 90kDa alpha (cytosolic), class B member 1;INPP5K: gene encoding inositol polyphosphate-5-phosphatase K; LDHA: geneencoding lactate dehydrogenase A; LDHB: gene encoding lactate dehydroge-nase B; LF: late follicular (menstrual cycle phase); MAPKAPK2: gene encodingmitogen-activated protein kinase-activated protein kinase 2; MBH: arcuatenucleus of the medial basal hypothalamus; ML: mid luteal (menstrual cyclephase); MVK: gene encoding mevalonate kinase; NACAP1: gene encodingnascent-polypeptide-associated complex alpha polypeptide pseudo gene 1;NDUFA2: gene encoding NADH dehydrogenase (ubiquinone) 1 alpha subcom-plex, 2, 8kDa; NDUFS5: gene encoding NADH dehydrogenase (ubiquinone) Fe-S protein 5, 15kDa (NADH-coenzyme Q reductase); NONO: gene encodingnon-POU domain containing, octamer-binding protein; NUDT3: gene encod-ing nudix (nucleoside diphosphate linked moiety X)-type motif 3; OVX: ovariec-tomized; P4: progesterone; PFDN1: gene encoding prefoldin subunit 1; PFDN5:gene encoding prefoldin subunit 5; PGK1: gene encoding phosphoglyceratekinase 1; POLR2A: gene encoding polymerase (RNA) II (DNA directed) polypep-tide A, 220kDa; PPP2CB: gene encoding protein phosphatase 2 (formerly 2A),catalytic subunit, beta isoform; PRPF8: gene encoding PRP8 pre-mRNA process-ing factor 8 homolog (S. cerevisiae); PSMD2: gene encoding proteasome(prosome, macropain) 26S subunit, non-ATPase, 2; qRT-PCR: quantitative real-time polymerase chain reaction; RAC1: gene encoding ras-related C3 botuli-num toxin substrate 1; RAD23A: gene encoding RAD23 homolog A (S. cerevi-siae); RAD9A: gene encoding RAD9 homolog; RPL10: gene encoding ribosomalprotein L10; RPL11: gene encoding ribosomal protein L11; RPL13A: gene encod-ing ribosomal protein L13a; RPL19: gene encoding ribosomal protein L19;RPL32: gene encoding ribosomal protein L32; RPL37: gene encoding ribosomalprotein L37; RPLP1: gene encoding ribosomal protein, large, P1; RPS14: geneencoding ribosomal protein S14; RPS18: gene encoding ribosomal protein S18;RPS24: gene encoding ribosomal protein S24; RPS25: gene encoding 40S ribo-somal protein S25; RPS27A/UBB/UBC: gene encoding ribosomal protein S27a/ubiquitin B/ubiquitin C; RPS27A: gene encoding ribosomal protein S27a;RRAGA: gene encoding Ras-related GTP binding A; RUVBL2: gene encodingRuvB-like 2 protein (E. coli) SAFB: gene encoding Hsp27 ERE-TATA-binding pro-tein (HET); SARS: gene encoding seryl-tRNA synthetase; SDC3: gene encodingsimilar to Syndecan-3 (SYND3); SNRPA: gene encoding small nuclear ribonu-cleoprotein polypeptide A; SNX3: gene encoding sorting nexin 3; SPAG7: geneencoding sperm associated antigen 7; SSR2: gene encoding signal sequencereceptor, beta (translocon-associated protein beta); STK24: gene encoding ser-ine/threonine kinase 24; SUI1: gene encoding putative translation initiation fac-tor TADA3L: gene encoding transcriptional adaptor 3 (NGG1 homolog, yeast)-like; TCF25: gene encoding transcription factor 25 (basic helix-loop-helix);TCFL1: gene encoding vacuolar protein sorting 72 homolog (S. cerevisiae);TMED9: gene encoding transmembrane emp24 protein transport domain con-taining 9; TTC1: gene encoding tetratricopeptide repeat domain 1; UBB: geneencoding ubiquitin B; UBC: gene encoding ubiquitin C; UQCRH: gene encodingubiquinol-cytochrome c reductase hinge protein; UQCRQ: gene encodingubiquinol-cytochrome c reductase, complex III subunit VII, 9.5kDa; VEGFB: geneencoding vascular endothelial growth factor B; VPS72: gene encoding vacuolarprotein sorting 72 homolog (S. cerevisiae); YWHAH: gene encoding 14-3-3nprotein; ZNF592: gene encoding zinc finger protein 592.
Competing interestsThe authors declare that they have no competing interests.
Authors' contributionsSGK and HFU designed and conducted animal treatment regimes, collectedand processed brain tissues. NCN performed real-time RT-PCR, conductedgeNorm, NormFinder and BestKeeper analyses and wrote the manuscript. Allauthors read, corrected and approved the final manuscript.
AcknowledgementsThis work was supported by National Institutes of Health grants: AG026472, AG029612, HD029186 and RR000163. Gene microarray assays were performed in the Affymetrix Microarray Core of the Gene Microarray Shared Resource facil-ity at OHSU.

Noriega et al. BMC Molecular Biology 2010, 11:47http://www.biomedcentral.com/1471-2199/11/47
Page 23 of 24
Author Details1Division of Neuroscience, Oregon National Primate Research Center, 505 NW 185th Avenue, Beaverton, OR 97006, USA, 2Department of Behavioral Neuroscience, Oregon Health and Science University, 3181 SW Sam Jackson Park Road, Portland, OR 97239, USA, 3Department of Physiology and Pharmacology, Oregon Health and Science University, 3181 SW Sam Jackson Park Road, Portland, OR 97239, USA and 4Department of Neurobiology Physiology and Behavior, Center for Neuroscience 1273, University of California, Davis, CA 95618, USA
References1. Gibson UE, Heid CA, Williams PM: A novel method for real time
quantitative RT-PCR. Genome Res 1996, 6:995-1001.2. Heid CA, Stevens J, Livak KJ, Williams PM: Real time quantitative PCR.
Genome Res 1996, 6:986-994.3. Mutch DM, Berger A, Mansourian R, Rytz A, Roberts MA: Microarray data
analysis: a practical approach for selecting differentially expressed genes. Genome Biol 2001, 2:preprint0009.0001-0009.0029.
4. Mutch DM, Berger A, Mansourian R, Rytz A, Roberts MA: The limit fold change model: a practical approach for selecting differentially expressed genes from microarray data. BMC Bioinformatics 2002, 3:17.
5. Wurmbach E, Yuen T, Sealfon SC: Focused microarray analysis. Methods 2003, 31:306-316.
6. Provenzano M, Mocellin S: Complementary techniques: validation of gene expression data by quantitative real time PCR. Adv Exp Med Biol 2007, 593:66-73.
7. Bustin SA, Nolan T: Pitfalls of quantitative real-time reverse-transcription polymerase chain reaction. J Biomol Tech 2004, 15:155-166.
8. Huggett J, Dheda K, Bustin S, Zumla A: Real-time RT-PCR normalisation; strategies and considerations. Genes Immun 2005, 6:279-284.
9. Tanaka S, Furukawa T, Plotkin SA: Human cytomegalovirus stimulates host cell RNA synthesis. J Virol 1975, 15:297-304.
10. Raff T, van der Giet M, Endemann D, Wiederholt T, Paul M: Design and testing of beta-actin primers for RT-PCR that do not co-amplify processed pseudogenes. Biotechniques 1997, 23:456-460.
11. Zhong H, Simons JW: Direct comparison of GAPDH, beta-actin, cyclophilin, and 28S rRNA as internal standards for quantifying RNA levels under hypoxia. Biochem Biophys Res Commun 1999, 259:523-526.
12. Goidin D, Mamessier A, Staquet MJ, Schmitt D, Berthier-Vergnes O: Ribosomal 18S RNA prevails over glyceraldehyde-3-phosphate dehydrogenase and beta-actin genes as internal standard for quantitative comparison of mRNA levels in invasive and noninvasive human melanoma cell subpopulations. Anal Biochem 2001, 295:17-21.
13. Zhu G, Chang Y, Zuo J, Dong X, Zhang M, Hu G, Fang F: Fudenine, a C-terminal truncated rat homologue of mouse prominin, is blood glucose-regulated and can up-regulate the expression of GAPDH. Biochem Biophys Res Commun 2001, 281:951-956.
14. Selvey S, Thompson EW, Matthaei K, Lea RA, Irving MG, Griffiths LR: Beta-actin--an unsuitable internal control for RT-PCR. Mol Cell Probes 2001, 15:307-311.
15. Glare EM, Divjak M, Bailey MJ, Walters EH: beta-Actin and GAPDH housekeeping gene expression in asthmatic airways is variable and not suitable for normalising mRNA levels. Thorax 2002, 57:765-770.
16. Dheda K, Huggett JF, Bustin SA, Johnson MA, Rook G, Zumla A: Validation of housekeeping genes for normalizing RNA expression in real-time PCR. Biotechniques 2004, 37:112-114, 116, 118-119.
17. Dheda K, Huggett JF, Chang JS, Kim LU, Bustin SA, Johnson MA, Rook GA, Zumla A: The implications of using an inappropriate reference gene for real-time reverse transcription PCR data normalization. Anal Biochem 2005, 344:141-143.
18. Sellars MJ, Vuocolo T, Leeton LA, Coman GJ, Degnan BM, Preston NP: Real-time RT-PCR quantification of Kuruma shrimp transcripts: a comparison of relative and absolute quantification procedures. J Biotechnol 2007, 129:391-399.
19. Folkersen L, Kurtovic S, Razuvaev A, Agardh HE, Gabrielsen A, Paulsson-Berne G: Endogenous control genes in complex vascular tissue samples. BMC Genomics 2009, 10:516.
20. Hoerndli FJ, Toigo M, Schild A, Gotz J, Day PJ: Reference genes identified in SH-SY5Y cells using custom-made gene arrays with validation by quantitative polymerase chain reaction. Anal Biochem 2004, 335:30-41.
21. Nieto PA, Covarrubias PC, Jedlicki E, Holmes DS, Quatrini R: Selection and evaluation of reference genes for improved interrogation of microbial transcriptomes: case study with the extremophile Acidithiobacillus ferrooxidans. BMC Mol Biol 2009, 10:63.
22. Popovici V, Goldstein DR, Antonov J, Jaggi R, Delorenzi M, Wirapati P: Selecting control genes for RT-QPCR using public microarray data. BMC Bioinformatics 2009, 10:42.
23. Stamova BS, Apperson M, Walker WL, Tian Y, Xu H, Adamczy P, Zhan X, Liu DZ, Ander BP, Liao IH, et al.: Identification and validation of suitable endogenous reference genes for gene expression studies in human peripheral blood. BMC Med Genomics 2009, 2:49.
24. Walker CG, Meier S, Mitchell MD, Roche JR, Littlejohn M: Evaluation of real-time PCR endogenous control genes for analysis of gene expression in bovine endometrium. BMC Mol Biol 2009, 10:100.
25. Ahn K, Huh JW, Park SJ, Kim DS, Ha HS, Kim YJ, Lee JR, Chang KT, Kim HS: Selection of internal reference genes for SYBR green qRT-PCR studies of rhesus monkey (Macaca mulatta) tissues. BMC Mol Biol 2008, 9:78.
26. Noriega NC, Eghlidi DH, Garyfallou VT, Kohama SG, Kryger SG, Urbanski HF: Influence of 17beta-estradiol and progesterone on GABAergic gene expression in the arcuate nucleus, amygdala and hippocampus of the rhesus macaque. Brain Res 2010, 1307:28-42.
27. Irizarry RA, Hobbs B, Collin F, Beazer-Barclay YD, Antonellis KJ, Scherf U, Speed TP: Exploration, normalization, and summaries of high density oligonucleotide array probe level data. Biostatistics 2003, 4:249-264.
28. Boes T, Neuhauser M: Normalization for Affymetrix GeneChips. Methods Inf Med 2005, 44:414-417.
29. Affymetrix: Affymetrix Expression Console™ Software Version 1.0 -- User Guide. 2006.
30. geNorm Software [http://medgen.ugent.be/~jvdesomp/genorm/]31. NormFinder Software [http://www.mdl.dk/
publicationsnormfinder.htm]32. BestKeeper software [http://gene-quantification.com/bestkeeper.html]33. Eisenberg E, Levanon EY: Human housekeeping genes are compact.
Trends Genet 2003, 19:362-365.34. Vandesompele J, De Preter K, Pattyn F, Poppe B, Van Roy N, De Paepe A,
Speleman F: Accurate normalization of real-time quantitative RT-PCR data by geometric averaging of multiple internal control genes. Genome Biol 2002, 3:research0034.0031-0034.0011.
35. Bolstad BM, Irizarry RA, Astrand M, Speed TP: A comparison of normalization methods for high density oligonucleotide array data based on variance and bias. Bioinformatics 2003, 19:185-193.
36. Irizarry RA, Wu Z, Jaffee HA: Comparison of Affymetrix GeneChip expression measures. Bioinformatics 2006, 22:789-794.
37. Andersen CL, Jensen JL, Orntoft TF: Normalization of real-time quantitative reverse transcription-PCR data: a model-based variance estimation approach to identify genes suited for normalization, applied to bladder and colon cancer data sets. Cancer Res 2004, 64:5245-5250.
38. Rasmussen R: Quantification on the LightCycler instrument. In Rapid Cycle Real-Time PCR: Methods and Applications Edited by: Meuer S, Wittwer C, Nakgawara K. Heidelberg: Springer-Verlag Press; 2001:21-34.
39. Hubbell E, Liu WM, Mei R: Robust estimators for expression analysis. Bioinformatics 2002, 18:1585-1592.
40. Urbanski HF, Noriega NC, Lemos DR, Kohama SG: Gene expression profiling in the rhesus macaque: experimental design considerations. Methods 2009, 49:26-31.
41. Cui X, Loraine AE: Consistency analysis of redundant probe sets on affymetrix three-prime expression arrays and applications to differential mRNA processing. PLoS ONE 2009, 4:e4229.
42. D'Mello V, Lee JY, MacDonald CC, Tian B: Alternative mRNA polyadenylation can potentially affect detection of gene expression by affymetrix genechip arrays. Appl Bioinformatics 2006, 5:249-253.
43. McClintick JN, Edenberg HJ: Effects of filtering by Present call on analysis of microarray experiments. BMC Bioinformatics 2006, 7:49.
44. Noriega NC, Kohama SG, Urbanski HF: Gene expression profiling in the rhesus macaque: methodology, annotation and data interpretation. Methods 2009, 49:42-49.
Received: 9 March 2010 Accepted: 21 June 2010 Published: 21 June 2010This article is available from: http://www.biomedcentral.com/1471-2199/11/47© 2010 Noriega et al; licensee BioMed Central Ltd. This is an Open Access article distributed under the terms of the Creative Commons Attribution License (http://creativecommons.org/licenses/by/2.0), which permits unrestricted use, distribution, and reproduction in any medium, provided the original work is properly cited.BMC Molecular Biology 2010, 11:47

Noriega et al. BMC Molecular Biology 2010, 11:47http://www.biomedcentral.com/1471-2199/11/47
Page 24 of 24
45. Cui X, Loraine A: Global correlation analysis between redundant probe sets using a large collection of Arabidopsis ath1 expression profiling data. Comput Syst Bioinformatics Conf 2006:223-226.
46. Stalteri MA, Harrison AP: Interpretation of multiple probe sets mapping to the same gene in Affymetrix GeneChips. BMC Bioinformatics 2007, 8:13.
47. Spindel ER, Pauley MA, Jia Y, Gravett C, Thompson SL, Boyle NF, Ojeda SR, Norgren RB Jr: Leveraging human genomic information to identify nonhuman primate sequences for expression array development. BMC Genomics 2005, 6:160.
48. Tay SK, Blythe J, Lipovich L: Global discovery of primate-specific genes in the human genome. Proc Natl Acad Sci USA 2009, 106:12019-12024.
49. Karssen AM, Her S, Li JZ, Patel PD, Meng F, Bunney WE Jr, Jones EG, Watson SJ, Akil H, Myers RM, et al.: Stress-induced changes in primate prefrontal profiles of gene expression. Mol Psychiatry 2007, 12:1089-1102.
50. Larionov A, Krause A, Miller W: A standard curve based method for relative real time PCR data processing. BMC Bioinformatics 2005, 6:62.
51. Pfaffl MW, Tichopad A, Prgomet C, Neuvians TP: Determination of stable housekeeping genes, differentially regulated target genes and sample integrity: BestKeeper--Excel-based tool using pair-wise correlations. Biotechnol Lett 2004, 26:509-515.
52. Noriega NC, Garyfallou VT, Kohama SG, Urbanski HF: Glutamate receptor subunit expression in the rhesus macaque locus coeruleus. Brain Res 2007, 1173:53-65.
53. NCBI reference sequence (RefSeq): Definitions: Accession Format [http://www.ncbi.nlm.nih.gov/RefSeq/key.html#accessions]
54. Array Design for the GeneChip® Human Genome U133 Set. .55. Technical Note: Design and Performance of the GeneChip® Human
Genome U133 Plus 2.0 and Human Genome U133A 2.0 Arrays. .
doi: 10.1186/1471-2199-11-47Cite this article as: Noriega et al., ?Microarray analysis of relative gene expression stability for selection of internal reference genes in the rhesus macaque brain BMC Molecular Biology 2010, 11:47