open access - github pages · 2004yeoet al.volume 5, issue 10, article r74research open access ......
TRANSCRIPT

com
ment
reviews
reports
deposited research
refereed researchinteractio
nsinfo
rmatio
n
Open Access2004Yeoet al.Volume 5, Issue 10, Article R74ResearchVariation in alternative splicing across human tissuesGene Yeo¤*†, Dirk Holste¤*, Gabriel Kreiman† and Christopher B Burge*
Addresses: *Department of Biology, Center for Biological and Computational Learning, Massachusetts Institute of Technology, Cambridge, MA 02319, USA. †Department of Brain and Cognitive Sciences, Center for Biological and Computational Learning, Massachusetts Institute of Technology, Cambridge, MA 02319, USA.
¤ These authors contributed equally to this work.
Correspondence: Christopher B Burge. E-mail: [email protected]
© 2004 Yeo et al.; licensee BioMed Central Ltd. This is an Open Access article distributed under the terms of the Creative Commons Attribution License (http://creativecommons.org/licenses/by/2.0), which permits unrestricted use, distribution, and reproduction in any medium, provided the original work is properly cited.Variation in alternative splicing across human tissues<p>Alternative pre-mRNA splicing (AS) is widely used by higher eukaryotes to generate different protein isoforms in specific cell or tissue types. To compare AS events across human tissues, we analyzed the splicing patterns of genomically aligned expressed sequence tags (ESTs) derived from libraries of cDNAs from different tissues.</p>
Abstract
Background: Alternative pre-mRNA splicing (AS) is widely used by higher eukaryotes to generatedifferent protein isoforms in specific cell or tissue types. To compare AS events across humantissues, we analyzed the splicing patterns of genomically aligned expressed sequence tags (ESTs)derived from libraries of cDNAs from different tissues.
Results: Controlling for differences in EST coverage among tissues, we found that the brain andtestis had the highest levels of exon skipping. The most pronounced differences between tissueswere seen for the frequencies of alternative 3' splice site and alternative 5' splice site usage, whichwere about 50 to 100% higher in the liver than in any other human tissue studied. Quantifyingdifferences in splice junction usage, the brain, pancreas, liver and the peripheral nervous system hadthe most distinctive patterns of AS. Analysis of available microarray expression data showed thatthe liver had the most divergent pattern of expression of serine-arginine protein andheterogeneous ribonucleoprotein genes compared to the other human tissues studied, possiblycontributing to the unusually high frequency of alternative splice site usage seen in liver. Sequencemotifs enriched in alternative exons in genes expressed in the brain, testis and liver suggest specificsplicing factors that may be important in AS regulation in these tissues.
Conclusions: This study distinguishes the human brain, testis and liver as having unusually highlevels of AS, highlights differences in the types of AS occurring commonly in different tissues, andidentifies candidate cis-regulatory elements and trans-acting factors likely to have important rolesin tissue-specific AS in human cells.
BackgroundThe differentiation of a small number of cells in the develop-ing embryo into the hundreds of cell and tissue types presentin a human adult is associated with a multitude of changes ingene expression. In addition to many differences between tis-
sues in transcriptional and translational regulation of genes,alternative pre-mRNA splicing (AS) is also frequently used toregulate gene expression and to generate tissue-specificmRNA and protein isoforms [1-5]. Between one-third andtwo-thirds of human genes are estimated to undergo AS [6-
Published: 13 September 2004
Genome Biology 2004, 5:R74
Received: 19 April 2004Revised: 1 June 2004Accepted: 27 July 2004
The electronic version of this article is the complete one and can be found online at http://genomebiology.com/2004/5/10/R74
Genome Biology 2004, 5:R74

R74.2 Genome Biology 2004, Volume 5, Issue 10, Article R74 Yeo et al. http://genomebiology.com/2004/5/10/R74
11] and the disruption of specific AS events has been impli-cated in several human genetic diseases [12]. The diverse andimportant biological roles of alternative splicing have led tosignificant interest in understanding its regulation.
Insights into the regulation of AS have come predominantlyfrom the molecular dissection of individual genes (reviewedin [1,12]). Prominent examples include the tissue-specificsplicing of the c-src N1 exon [13], cancer-associated splicingof the CD44 gene [14] and the alternative splicing cascadeinvolved in Drosophila melanogaster sex determination [15].Biochemical studies of these and other genes have describedimportant classes of trans-acting splicing-regulatory factors,implicating members of the ubiquitously expressed serine/arginine-rich protein (SR protein) and heterogeneous nuclearribonucleoprotein (hnRNP) families, and tissue-specific fac-tors including members of the CELF [16] and NOVA [17] fam-ilies of proteins, as well as other proteins and protein families,in control of specific splicing events. A number of cis-regula-tory elements in exons or introns that play key regulatoryroles have also been identified, using a variety of methodsincluding site-directed mutagenesis, systematic evolution ofligands by exponential enrichment (SELEX) and computa-tional approaches [18-22]. In addition, DNA microarrays andpolymerase colony approaches have been developed forhigher-throughput analysis of alternative mRNA isoforms[23-26] and a cross-linking/immunoprecipitation strategy(CLIP) has been developed for systematic detection of theRNAs bound by a given splicing factor [27]. These new meth-ods suggest a path towards increasingly parallel experimentalanalysis of splicing regulation.
From another direction, the accumulation of large databasesof cDNA and expressed sequence tag (EST) sequences hasenabled large-scale computational studies, which haveassessed the scope of AS in the mammalian transcriptome[3,8,10,28]. Other computational studies have analyzed thetissue specificity of AS events and identified sets of exons andgenes that exhibit tissue-biased expression [29,30]. However,a number of significant questions about tissue-specific alter-native splicing have not yet been comprehensively addressed.Which tissues have the highest and lowest proportions ofalternative splicing? Do tissues differ in their usage of differ-ent AS types, such as exon skipping, alternative 5' splice sitechoice or alternative 3' splice site choice? Which tissues aremost distinct from other tissues in the spectrum of alternativemRNA isoforms they express? And to what extent do expres-sion levels of known splicing factors explain AS patterns indifferent tissues?
Here, we describe an initial effort to answer these questionsusing a large-scale computational analysis of ESTs derivedfrom about two dozen human tissues, which were aligned tothe assembled human genome sequence to infer patterns ofAS occurring in thousands of human genes. Our results dis-tinguish specific tissues as having high levels and distinctive
patterns of AS, identify pronounced differences between theproportions of alternative 5' splice site and alternative 3'splice site usage between tissues, and predict candidate cis-regulatory elements and trans-acting factors involved in tis-sue-specific AS.
Results and discussionVariation in the levels of alternative splicing in different human tissuesAlternative splicing events are commonly distinguished interms of whether mRNA isoforms differ by inclusion or exclu-sion of an exon, in which case the exon involved is referred toas a 'skipped exon' (SE) or 'cassette exon', or whether iso-forms differ in the usage of a 5' splice site or 3' splice site, giv-ing rise to alternative 5' splice site exons (A5Es) or alternative3' splice site exons (A3Es), respectively (depicted in Figure 1).These descriptions are not necessarily mutually exclusive; forexample, an exon can have both an alternative 5' splice siteand an alternative 3' splice site, or have an alternative 5' splicesite or 3' splice site but be skipped in other isoforms. A fourthtype of alternative splicing, 'intron retention', in which twoisoforms differ by the presence of an unspliced intron in onetranscript that is absent in the other, was not considered inthis analysis because of the difficulty in distinguishing trueintron retention events from contamination of the EST data-bases by pre-mRNA or genomic sequences. The presence ofthese and other artifacts in EST databases are importantcaveats to any analysis of EST sequence data. Therefore, weimposed stringent filters on the quality of EST to genomicalignments used in this analysis, accepting only about one-fifth of all EST alignments obtained (see Materials andmethods).
To determine whether differences occur in the proportions ofthese three types of AS events across human tissues, weassessed the frequencies of genes containing skipped exons,alternative 3' splice site exons or alternative 5' splice siteexons for 16 human tissues (see Figure 1 for the list of tissues)for which sufficiently large numbers of EST sequences wereavailable. Because the availability of a larger number of ESTsderived from a gene increases the chance of observing alter-native isoforms of that gene, the proportion of AS genesobserved in a tissue will tend to increase with increasing ESTcoverage of genes [10,31]. Since the number of EST sequencesavailable differs quite substantially among human tissues (forexample, the dbEST database contains about eight timesmore brain-derived ESTs than heart-derived ESTs), in orderto compare the proportion of AS in different tissues in anunbiased way, we used a sampling strategy that ensured thatall genes/tissues studied were represented by equal numbersof ESTs.
It is important to point out that our analysis does not makeuse of the concept of a canonical transcript for each genebecause it is not clear that such a transcript could be chosen
Genome Biology 2004, 5:R74

http://genomebiology.com/2004/5/10/R74 Genome Biology 2004, Volume 5, Issue 10, Article R74 Yeo et al. R74.3
com
ment
reviews
reports
refereed researchdepo
sited researchinteractio
nsinfo
rmatio
n
objectively or that this concept is biologically meaningful.Instead, AS events are defined only through pairwise compar-ison of ESTs.
Our objective was to control for differences in EST abundanceacross tissues while retaining sufficient power to detect a rea-sonable fraction of AS events. For each tissue we consideredgenes that had at least 20 aligned EST sequences derived
from human cDNA libraries specific to that tissue ('tissue-derived' ESTs). For each such gene, a random sample of 20 ofthese ESTs was chosen (without replacement) to representthe splicing of the given gene in the given human tissue. Forthe gene and tissue combinations included in this analysis,the median number of EST sequences per gene was not dra-matically different between tissues, ranging from 25 to 35(see Additional data file 1). The sampled ESTs for each gene
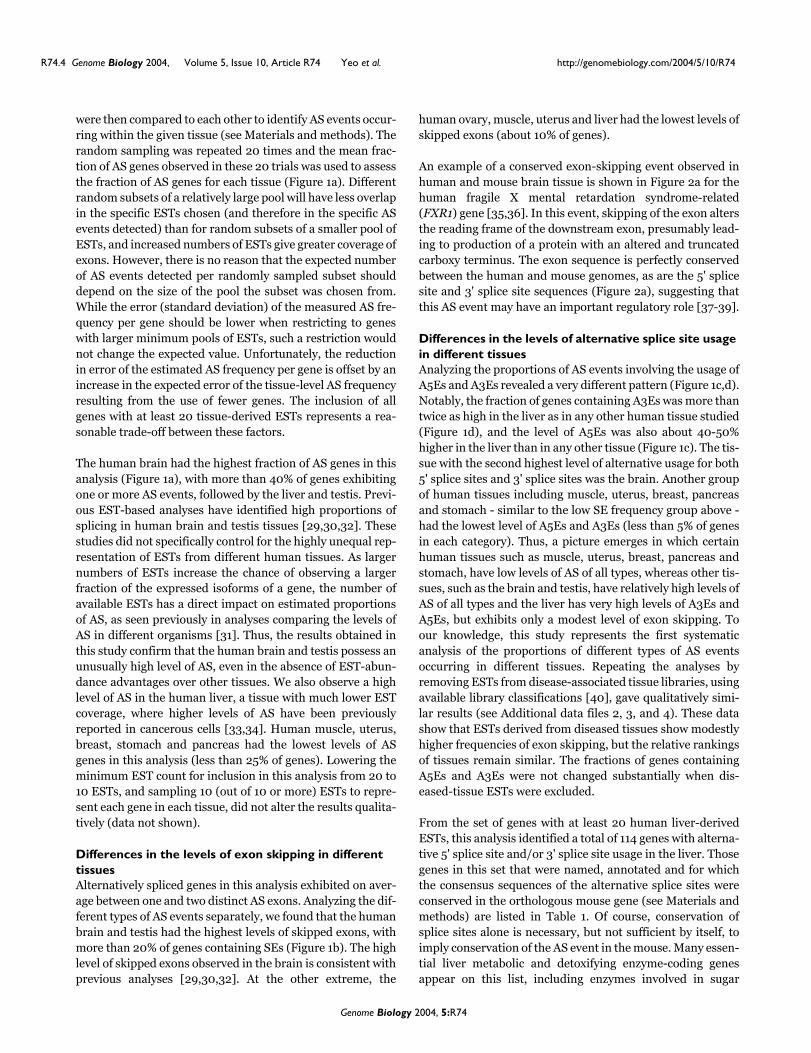
Levels of alternative splicing in 16 human tissues with moderate or high EST sequence coverageFigure 1Levels of alternative splicing in 16 human tissues with moderate or high EST sequence coverage. Horizontal bars show the average fraction of alternatively spliced (AS) genes of each splicing type (and estimated standard deviation) for random samplings of 20 ESTs per gene from each gene with ≥ 20 aligned EST sequences derived from a given human tissue. The different splicing types are schematically illustrated in each subplot. (a) Fraction of AS genes containing skipped exons, alternative 3' splice site exons (A3Es) or 5' splice site exons (A5Es), (b) fraction of AS genes containing skipped exons, (c) fraction of AS genes containing A3Es, (d) fraction of AS genes containing A5Es.
0 20 40 60ovary
muscle
uterus
liver
pancreas
stomach
breast
skin
kidney
colon
prostate
placenta
eye retina
lung
testis
brain
Proportion of genes with skipped exon [%]
Proportion of genes with alt. 5’ss exon [%]Proportion of genes with alternative
3′ splice-site exons (%)Proportion of genes with alternative
5′ splice-site exons (%)
0 10 20 30 40 50
muscleuterusbreast
stomachpancreas
ovaryprostate
colonskin
eye_retinaplacenta
kidneylung
testisliver
brain
Proportion of alternatively spliced genes [%]
BrainLiver
TestisLung
kidneyPlacenta
Eye-retinaSkin
ColonProstate
OvaryPancreasStomach
BreastUterusMuscle
0
10 20 30 40 50
ovarymuscleuterus
liverpancreas
breaststomach
skinkidney
prostatecolon
placentaeye_retina
lungtestisbrain
Proportion of genes with skipped exons [%]
BrainTestisLung
Eye-retinaPlacenta
ColonProstate
KidneySkin
StomachBreast
PancreasLiver
UterusMuscleOvary
0 10 20 30 40 50
breastuterus
musclepancreasstomach
colonkidney
placentalung
prostateeye_retina
testisovary
skinbrainliver
Proportion of genes with alternative 3’ss exons [%]
LiverBrainSkin
OvaryTestis
Eye-retinaProstate
LungPlacenta
KidneyColon
StomachPancreas
MuscleUterusBreast
LiverBrain
TestisKidney
PlacentaOvary
SkinProstate
ColonLung
Eye-retinaBreast
PancreasStomach
UterusMuscle
0 30 3020 2010 40 4050 500 10
0 302010 40 50 0 302010 40 50
Proportion of AS genes (%) Proportion of genes with skipped exons (%)
(a) (b)
(c) (d)
Genome Biology 2004, 5:R74
R74.4 Genome Biology 2004, Volume 5, Issue 10, Article R74 Yeo et al. http://genomebiology.com/2004/5/10/R74
were then compared to each other to identify AS events occur-ring within the given tissue (see Materials and methods). Therandom sampling was repeated 20 times and the mean frac-tion of AS genes observed in these 20 trials was used to assessthe fraction of AS genes for each tissue (Figure 1a). Differentrandom subsets of a relatively large pool will have less overlapin the specific ESTs chosen (and therefore in the specific ASevents detected) than for random subsets of a smaller pool ofESTs, and increased numbers of ESTs give greater coverage ofexons. However, there is no reason that the expected numberof AS events detected per randomly sampled subset shoulddepend on the size of the pool the subset was chosen from.While the error (standard deviation) of the measured AS fre-quency per gene should be lower when restricting to geneswith larger minimum pools of ESTs, such a restriction wouldnot change the expected value. Unfortunately, the reductionin error of the estimated AS frequency per gene is offset by anincrease in the expected error of the tissue-level AS frequencyresulting from the use of fewer genes. The inclusion of allgenes with at least 20 tissue-derived ESTs represents a rea-sonable trade-off between these factors.
The human brain had the highest fraction of AS genes in thisanalysis (Figure 1a), with more than 40% of genes exhibitingone or more AS events, followed by the liver and testis. Previ-ous EST-based analyses have identified high proportions ofsplicing in human brain and testis tissues [29,30,32]. Thesestudies did not specifically control for the highly unequal rep-resentation of ESTs from different human tissues. As largernumbers of ESTs increase the chance of observing a largerfraction of the expressed isoforms of a gene, the number ofavailable ESTs has a direct impact on estimated proportionsof AS, as seen previously in analyses comparing the levels ofAS in different organisms [31]. Thus, the results obtained inthis study confirm that the human brain and testis possess anunusually high level of AS, even in the absence of EST-abun-dance advantages over other tissues. We also observe a highlevel of AS in the human liver, a tissue with much lower ESTcoverage, where higher levels of AS have been previouslyreported in cancerous cells [33,34]. Human muscle, uterus,breast, stomach and pancreas had the lowest levels of ASgenes in this analysis (less than 25% of genes). Lowering theminimum EST count for inclusion in this analysis from 20 to10 ESTs, and sampling 10 (out of 10 or more) ESTs to repre-sent each gene in each tissue, did not alter the results qualita-tively (data not shown).
Differences in the levels of exon skipping in different tissuesAlternatively spliced genes in this analysis exhibited on aver-age between one and two distinct AS exons. Analyzing the dif-ferent types of AS events separately, we found that the humanbrain and testis had the highest levels of skipped exons, withmore than 20% of genes containing SEs (Figure 1b). The highlevel of skipped exons observed in the brain is consistent withprevious analyses [29,30,32]. At the other extreme, the
human ovary, muscle, uterus and liver had the lowest levels ofskipped exons (about 10% of genes).
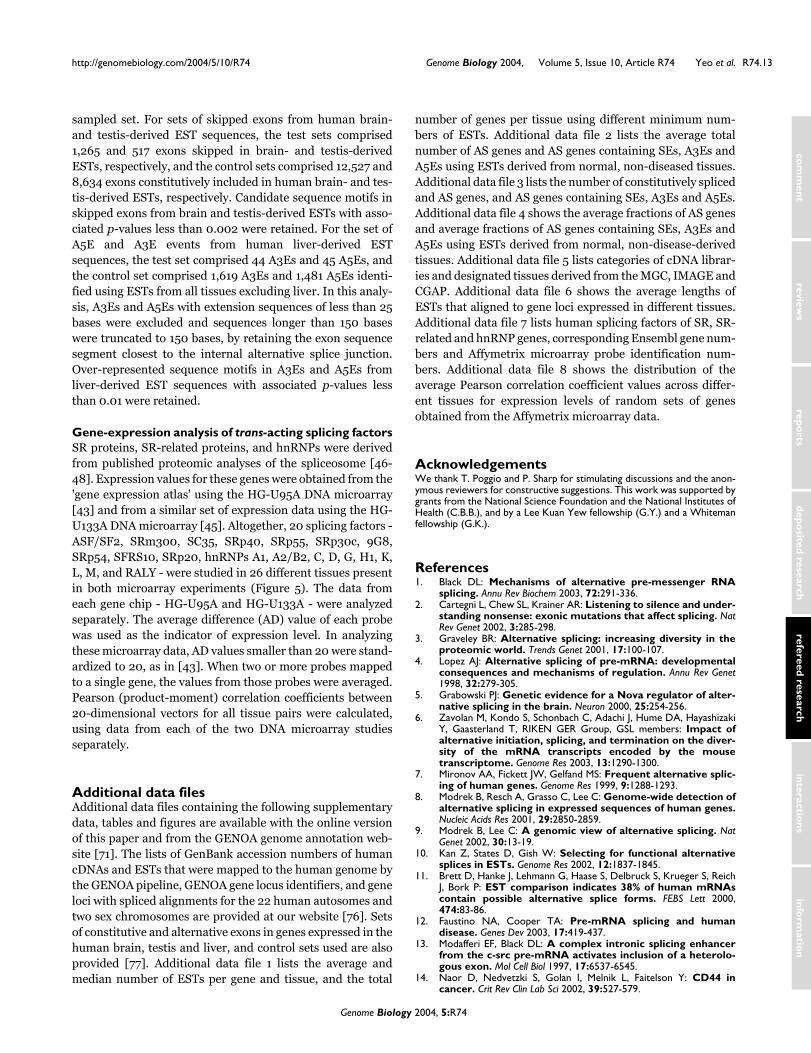
An example of a conserved exon-skipping event observed inhuman and mouse brain tissue is shown in Figure 2a for thehuman fragile X mental retardation syndrome-related(FXR1) gene [35,36]. In this event, skipping of the exon altersthe reading frame of the downstream exon, presumably lead-ing to production of a protein with an altered and truncatedcarboxy terminus. The exon sequence is perfectly conservedbetween the human and mouse genomes, as are the 5' splicesite and 3' splice site sequences (Figure 2a), suggesting thatthis AS event may have an important regulatory role [37-39].
Differences in the levels of alternative splice site usage in different tissuesAnalyzing the proportions of AS events involving the usage ofA5Es and A3Es revealed a very different pattern (Figure 1c,d).Notably, the fraction of genes containing A3Es was more thantwice as high in the liver as in any other human tissue studied(Figure 1d), and the level of A5Es was also about 40-50%higher in the liver than in any other tissue (Figure 1c). The tis-sue with the second highest level of alternative usage for both5' splice sites and 3' splice sites was the brain. Another groupof human tissues including muscle, uterus, breast, pancreasand stomach - similar to the low SE frequency group above -had the lowest level of A5Es and A3Es (less than 5% of genesin each category). Thus, a picture emerges in which certainhuman tissues such as muscle, uterus, breast, pancreas andstomach, have low levels of AS of all types, whereas other tis-sues, such as the brain and testis, have relatively high levels ofAS of all types and the liver has very high levels of A3Es andA5Es, but exhibits only a modest level of exon skipping. Toour knowledge, this study represents the first systematicanalysis of the proportions of different types of AS eventsoccurring in different tissues. Repeating the analyses byremoving ESTs from disease-associated tissue libraries, usingavailable library classifications [40], gave qualitatively simi-lar results (see Additional data files 2, 3, and 4). These datashow that ESTs derived from diseased tissues show modestlyhigher frequencies of exon skipping, but the relative rankingsof tissues remain similar. The fractions of genes containingA5Es and A3Es were not changed substantially when dis-eased-tissue ESTs were excluded.
From the set of genes with at least 20 human liver-derivedESTs, this analysis identified a total of 114 genes with alterna-tive 5' splice site and/or 3' splice site usage in the liver. Thosegenes in this set that were named, annotated and for whichthe consensus sequences of the alternative splice sites wereconserved in the orthologous mouse gene (see Materials andmethods) are listed in Table 1. Of course, conservation ofsplice sites alone is necessary, but not sufficient by itself, toimply conservation of the AS event in the mouse. Many essen-tial liver metabolic and detoxifying enzyme-coding genesappear on this list, including enzymes involved in sugar
Genome Biology 2004, 5:R74

http://genomebiology.com/2004/5/10/R74 Genome Biology 2004, Volume 5, Issue 10, Article R74 Yeo et al. R74.5
com
ment
reviews
reports
refereed researchdepo
sited researchinteractio
nsinfo
rmatio
n
metabolism (for example, ALDOB, IDH1), protein and aminoacid metabolism (for example, BHMT, CBP2, TDO2, PAH,GATM), detoxification or breakdown of drugs and toxins (forexample, GSTA3, CYP3A4, CYP2C8).
Sequences and splicing patterns for two of these genes forwhich orthologous mouse exons/genes and transcripts couldbe identified - the genes BHMT and CYP2C8 - are shown indetail in Figure 2b,c. In the event depicted for BHMT, theexons involved are highly conserved between the human andmouse orthologs (Figure 2b), consistent with the possibilitythat the splicing event may have a (conserved) regulatoryrole. This AS event preserves the reading frame of down-stream exons, so the two isoforms are both likely to producefunctional proteins, differing by the insertion/deletion of 23amino acids. In the event depicted for CYP2C8, usage of analternative 3' splice site removes 71 nucleotides, shifting thereading frame and leading to a premature termination codonin the exon (Figure 2c). In this case, the shorter alternativetranscript is a potential substrate for nonsense-mediateddecay [41,42] and the AS event may be used to regulate thelevel of functional mRNA/protein produced.
Differences in splicing factor expression between tissuesTo explore the differences in splicing factor expression in dif-ferent tissues, available mRNA expression data was obtainedfrom two different DNA microarray studies [43-45]. For thistrans-factor analysis, we obtained a list of 20 splicing factorsof the SR, SR-related and hnRNP protein families from pro-teomic analyses of the human spliceosome [46-48] (see Mate-rials and methods for the list of genes). The variation insplicing-factor expression between pairs of tissues was stud-ied by computing the Pearson (product-moment) correlationcoefficient (r) between the 20-dimensional vectors of splic-ing-factor expression values between all pairs of 26 human
Figure 2
E15E14 E17
81 bp
GAGCTGAGTCTCAGAGCAGACAAAGAAACCTCCCAAGGGAAACTTTGGCTAAAAA
TCACAGTTGCAGATTATATTTCTA
CGGGAAACTTTGGCTAAAAACAAGAAAGAAATG
E16
TAA92 bp TAA
E16...
||||||||||||||||||||||||Human:
Mouse:
GAGCTGAGTCTCAGAGCAGACAAAGAAACCTCCCAA...E16...
GGGAAACTTTGGCTAAAAA|||||||||||||||||||||||||||||||||||||||||||||||||||||||
...E16CGGGAAACTTTGGCTAAAAACAAGAAAGAAATG|||||||||||||||||||||||||||||||||
TCACAGTTGCAGATTATATTTCTA...tttttctcatctttaacag |||||||||||||||||||...tttttctcatctttaacag
...intron 15
gtaaggagaatttaacctg...|||||||||||||||||||gtaaggagaatttaacctg...
intron 16...
FXR1
E5E3 E4a E4b
69 bp123 bp
...E4a...
GGCAAGTGGCTGATGAAGGAGACGCTTTGGTTGCAGGAGGCGTGAGCCAGACGCCTTCATACCTTAG
GACAAGTGGCTGATGAAGGAGATGCTTTGGTAGCAGGAGGAGTGAGTCAGACACCTTCATACCTTAG
GTCAAAAAAGTATTTCTGCAACAGTTAGAGGTCTTTATGAAGAAGAACE4b......E4a
CTGCAAGAGTGAAACTGAA
...E4b
GTGGACTTCTTGATTGCAGAGgtaaagaaagatgtggtgaaagataagacaaatac...
intron 4...
...ta-tactcacccattttagGGGCAGGAAGTCAATGAAGCTGCTTGCGACATCGCCC
...ccctacttacccactttagGGGCAGAAAGTCAACGAAGCTGCTTGTGACATTGCAC
Human:
Mouse:
GTGAAAAAGATATTTCGCCAACAGCTAGAGGTGTTCATGAAGAAGAACCTGCAAGAGTGAGGTAGAA|||||||||||| ||||| ||||| |||||| |||||| ||||||| || ||||||||||||
GTGGACTTCCTCATTGCAGAGgtgagcaaggg--------aaatccattcagaaag...||||||||| | ||||||||||| | || | || | || | |
| |||||||||||||||||||| |||||||| |||||||| ||||| ||||| ||||||||||||||
|||| ||||| ||||||||||||||||||||||||||||||||||||||||||
...intron 3 E4a...
BHMT
E4a E4b
90 bp71 bp
E3 E5
...intron 3
ACTTTCATCCTGGGCTGTGCTCCCTGCAATGTGATCTGCTCCGTTGTTTTCCAG
ACATTCATTCTGAGCTGTGCTCCATGCAATGTCATCTGCTCCATTATTTTCCAG
...E4a...
GATCGTTTTGATTATAAGGATAAAGATTTTCTTATGCTCATGGAAAAACTAAAT
AAACGATTTGATTATAAAGATCAGAATTTTCTCACCCTGATGAAAAGATTCAATE4b...
E4a...
GAGAATGTCAAGATTCTGAGCTCCCCATGGTTGCAG
...E4b
gtgaagtcaagaatg...
Mouse:
Human:
GCTCACCTTGTGACCCC...ttctaattattttctcaatcttcag
|| ||||| ||| |||||||||| |||||||| ||||||||| || ||||||||
GAAAACTTCAGGATTCTGAACTCCCCATGGATCCAGgtaaggccaagattt...
...tttttaaaaatttttaaatctttag CTTCACCCTGTGATCCC || | | | ||| | |||||| || |||||| ||||| ||
| || ||||||||||| ||| | ||||||| | || ||| ||| | | |||
|| || ||| |||||||| |||||||||| | ||||| | | ||||| |
intron 4...
TGA
CYP2C8
(a)
(b)
(c)
Examples of tissue-specific AS events in human genes with evidence of splice conservation in orthologous mouse genesFigure 2Examples of tissue-specific AS events in human genes with evidence of splice conservation in orthologous mouse genes. (a) Human fragile X mental retardation syndrome-related (FXR1) gene splicing detected in brain-derived EST sequences. FXR1 exhibited two alternative mRNA isoforms differing by skipping/inclusion of exons E15 and E16. Exclusion of E16 creates a shift in the reading-frame, which is predicted to result in an altered and shorter carboxy terminus. The exon-skipping event is conserved in the mouse ortholog of the human FXR1 gene, and both isoforms were detected in mouse brain-derived ESTs. (b) Human betaine-homocysteine S-methyltransferase (BHMT) gene splicing detected in liver-derived ESTs. BHMT exhibited two alternative isoforms differing by alternative 5' splice site usage in exon E4. Sequence comparisons indicate that the exon and splice site sequences involved in both alternative 5' splice site exon events are conserved in the mouse ortholog of the human BHMT gene. (c) Human cytochrome P450 2C8 (CYP2C8) gene splicing. CYP2C8 exhibited two alternative mRNA isoforms differing in the 3' splice site usage for exon E4 (detected in ESTs derived from several tissues), where the exclusion of a 71-base sequence creates a premature termination codon in exon E4b. Exons and splice sites involved in the AS event are conserved in the mouse ortholog of CYP2C8.
Genome Biology 2004, 5:R74

R74.6 Genome Biology 2004, Volume 5, Issue 10, Article R74 Yeo et al. http://genomebiology.com/2004/5/10/R74
tissues. The DNA microarray studies analyzed 10 tissues inaddition to the 16 previously studied (Figure 3). A low valueof r between a pair of tissues indicates a low degree of con-cordance in the relative mRNA expression levels across thisset of splicing factors, whereas a high value of r indicatesstrong concordance.
While most of the tissues examined showed a very highdegree of correlation in the expression levels of the 20 splic-ing factors studied (typically with r > 0.75; Figure 3), thehuman adult liver was clearly an outlier, with low concord-ance in splicing-factor expression to most other tissues (typi-cally r < 0.6, and often much lower). The unusual splicing-
Table 1
Human genes expressed in the liver with alternative 3' splice site exons (A3Es) or alternative 5' splice site exons (A5Es)
Splicing type Ensembl gene ID Gene name Exon numbers Fold-change above median expression, HG-U95A
Fold-change above median expression, MG-U74A
A5E;A3E 091513 Serotransferrin precursor, TF 8, 9; 4 100 100
A5E;A3E 115414 Fibronectin precursor, FN1 36; 31 10 -
A5E;A3E 117601 Antithrombin-III precursor, SERPINC1
5; 4 100 100
A5E;A3E 136872 Fructose-bisphosphate aldolase, ALDOB
3, 8; 4 100 10
A5E;A3E 140833 Haptoglobin-related protein precursor, HPR
3 100 10
A5E;A3E 151790 Tryptophan 2,3-dioxygenase, TDO2 3, 5; 4 10 100
A5E;A3E 171759 Phenylalanine-4-hydroxylase, PAH 6; 4,10 - 100
A5E 047457 Ceruloplasmin precursor, CP 14, 16 3 -
A5E 055957 Inter-alpha-trypsin inhibitor heavy chain H1 precursor, ITIH1
21 100 10
A5E 111275 Aldehyde dehydrogenase, ALDH2 12 3 3
A5E 132386 Pigment epithelium-derived factor precursor, SERPINF1
4 10 10
A5E 138356 Aldehyde oxidase, AOX1 27, 29 3 3
A5E 138413 Isocitrate dehydrogenase, IDH1 3 1 -
A5E 145692 Betaine-homocysteine S-methyltransferase, BHMT
4 10 100
A5E 160868 Cytochrome P450, CYP3A4 5 10 10
A5E 171766 Glycine amidinotransferase, GATM 8 3 3
A3E 080618 Carboxypeptidase, CBP2 10 - -
A3E 080824 Heat shock protein HSP 90-alpha, HSPCA
8 - -
A3E 096087 Glutathione S-transferase, GSTA2 4, 6 10 10
A3E 106927 Protein precursor, AMBP 5, 9 100 100
A3E 110958 Telomerase-binding protein P23, TEBP
5 <1 1
A3E 134240 Hydroxymethylglutaryl-CoA synthase, HMGCS2
8 10 -
A3E 138115 Cytochrome P450, CYP2C8 4 100 10
A3E 145192 Alpha-2-HS-glycoprotein precursor, AHSG
6 100 100
A3E 163631 Serum albumin precursor, ALB 9 100 100
A3E 171557 Fibrinogen gamma chain precursor, FGG
4 100 100
A3E 174156 Glutathione S-transferase, GSTA3 4, 6 10 10
Examples of human AS genes found to exhibit A3E and/or A5E splicing with both isoforms detected in liver-derived ESTs. AS types are listed in the first column, followed by the last six digits of the Ensembl gene number, the gene name and alternative exon numbers. The last two columns list expression levels in human liver and mouse liver tissues, respectively, expressed in terms of the fold-change relative to the median expression level in other tissues (from the DNA microarray data of [43] and [45], respectively).
Genome Biology 2004, 5:R74

http://genomebiology.com/2004/5/10/R74 Genome Biology 2004, Volume 5, Issue 10, Article R74 Yeo et al. R74.7
com
ment
reviews
reports
refereed researchdepo
sited researchinteractio
nsinfo
rmatio
n
factor expression in the human liver was seen consistently indata from two independent DNA microarray studies usingdifferent probe sets (compare the two halves of Figure 3). Thelow correlation observed between liver and other tissues insplicing factor expression is statistically significant even rela-tive to arbitrary collections of 20 genes (see Additional datafile 8). Examining the relative levels of specific splicingfactors in the human adult liver versus other tissues, the rela-tive level of SRp30c message was consistently higher in theliver and the relative levels of SRp40, hnRNP A2/B2 andSrp54 messages were consistently lower. A well establishedparadigm in the field of RNA splicing is that usage of alterna-tive splice sites is often controlled by the relative concentra-tions of specific SR proteins and hnRNP proteins [49-52].This functional antagonism between particular SR andhnRNP proteins is often due to competition for binding ofnearby sites on pre-mRNAs [49,53,54]. Therefore, it seemslikely that the unusual patterns of expression seen in thehuman adult liver for these families of splicing factors maycontribute to the high level of alternative splice site usageseen in this tissue. It is also interesting that splicing-factorexpression in the human fetal liver is highly concordant withmost other tissues, but has low concordance with the adultliver (Figure 3). This observation suggests that substantial
changes in splicing-factor expression may occur duringhuman liver development, presumably leading to a host ofchanges in the splicing patterns of genes expressed in humanliver. Currently available EST data were insufficient to allowsystematic analysis of the patterns of AS in fetal relative toadult liver.
An important caveat to these results is that the DNA microar-ray data used in this analysis measure mRNA expression lev-els rather than protein levels or activities. The relationbetween the amount of mRNA expressed from a gene and theconcentration of the corresponding protein has been exam-ined previously in several studies in yeast as well as in humanand mouse liver tissues [55-58]. These studies have generallyfound that mRNA expression levels correlate positively withprotein concentrations, but with fairly wide divergences for asignificant fraction of genes.
Over-represented motifs in alternative exons in the human brain, testis and liverThe unusually high levels of alternative splicing seen in thehuman brain, testis and liver prompted us to search for can-didate tissue-specific splicing regulatory motifs in AS exons ingenes expressed in each of these tissues. Using a proceduresimilar to Brudno et al. [59], sequence motifs four to six baseslong that were significantly enriched in exons skipped in ASgenes expressed in the human brain relative to constitutiveexons in genes expressed in the brain were identified. Thesesequences were then compared to each other and groupedinto seven clusters, each of which shared one or two four-basemotifs (Table 2). The motifs in cluster BR1 (CUCC, CCUC)resemble the consensus binding site for the polypyrimidinetract-binding protein (PTB), which acts as a repressor ofsplicing in many contexts [60-63]. A similar motif (CNCUC-CUC) has been identified in exons expressed specifically inthe human brain [29]. The motifs in cluster BR7 (containingUAGG) are similar to the high-affinity binding site UAGGG[A/U], identified for the splicing repressor protein hnRNP A1by SELEX experiments [64]. The consensus sequences for theremaining clusters BR2 to BR6 (GGGU, UGGG, GGGA,CUCA, UAGC, respectively), as well as BR7, all resembledmotifs identified in a screen for exonic splicing silencers(ESSs) in cultured human cells (Z. Wang and C.B.B., unpub-lished results), suggesting that most or all of the motifs BR1 toBR7 represent sequences directly involved in mediating exonskipping. In particular, G-rich elements, which are known toact as intronic splicing enhancers [65,66], may function assilencers of splicing when present in an exonic context.
A comparison of human testis-derived skipped exons to exonsconstitutively included in genes expressed in the testis identi-fied only a single cluster of sequences, TE1, which share thetetramer UAGG. Enrichment of this motif, common to thebrain-specific cluster BR7, suggests a role for regulation ofexon skipping by hnRNP A1 - or a trans-acting factor withsimilar binding preferences - in the testis.
Correlation of mRNA expression levels of 20 known splicing factors (see Materials and methods) across 26 human tissues (lower diagonal: data from Affymetrix HU-133A DNA microarray experiment [45]; upper diagonal: data from Affymetrix HU-95A DNA microarray experiment [43])Figure 3Correlation of mRNA expression levels of 20 known splicing factors (see Materials and methods) across 26 human tissues (lower diagonal: data from Affymetrix HU-133A DNA microarray experiment [45]; upper diagonal: data from Affymetrix HU-95A DNA microarray experiment [43]). Small squares are colored to represent the extent of the correlation between the mRNA expression patterns of the 20 splicing factor genes in each pair of tissues (see scale at top of figure).
CerebellumWhole brainCaudate nucleusAmygdalaThalamusSpinal cordWhole bloodTestesPancreasPlacentaPituitary glandThyroidProstateOvaryUterusDRGSalivary glandTracheaLungThymusAdrenal glandKidneyFetal liverLiverHeart
HG-U13
3
HG-U950 0.25 0.5 0.75 1
Fet
al b
rain
Cer
ebel
lum
Who
le b
rain
Cau
date
nuc
leus
Am
ygda
laT
hala
mus
Spi
nal c
ord
Who
le b
lood
Test
esP
ancr
eas
Pla
cent
aP
ituita
ry g
land
Thy
roid
Pro
stat
eO
vary
Ute
rus
DR
GS
aliv
ary
glan
dTr
ache
aLu
ngT
hym
usA
dren
al g
land
Kid
ney
Fet
al li
ver
Live
rH
eart
Fetal brain
Genome Biology 2004, 5:R74

R74.8 Genome Biology 2004, Volume 5, Issue 10, Article R74 Yeo et al. http://genomebiology.com/2004/5/10/R74
Table 2
Sequence motifs enriched in skipped exons (SEs) and alternative 5' splice site exons (A5Es)
AS type /tissue (motif name) Oligonucleotides Occurrences Consensus (% of exons containing)
SE/brain (BR1) CUCCUG 169 CUCC (45.3)
CUCCU 323
CUCCC 264
CUCC 945
CCUCCC 137 CCUC (41.0)
CCUCC 363
CCUC 1021
GCCUCC 136
GCCUC 375
GCCUCA 122
GGCCUC 118
UGCCUC 108
SE/brain (BR2) GGGUU 97 GGGU (25.6)
GGGU 411
AGGGU 116
SE/brain (BR3) UGGGA 324 UGGG (47.2)
UGGG 948
CUGGG 426
CCUGGG 171
SE/brain (BR4) GGGAUU 58 GGGA (45.5)
GGGAU 176
GGGA 840
SE/brain (BR5) CUCA 925 CUCA (46.5)
CUCAC 206
GCCUCA 122
GGCUCA 102
GCUCAC 79
CUCAGC 126
SE/brain (BR6) UAGC 269 UAGC (18.0)
UAGCU 106
GUAGC 96
GUAGCU 51
AGUAGC 47
UAGCUG 54
SE/brain (BR7) UAGG 186 UAGG (13.8)
UUAGG 63
UUAGGG 24
SE/testis (TE1) UAGG 99 UAGG (16.6)
UUAGG 33
Genome Biology 2004, 5:R74

http://genomebiology.com/2004/5/10/R74 Genome Biology 2004, Volume 5, Issue 10, Article R74 Yeo et al. R74.9
com
ment
reviews
reports
refereed researchdepo
sited researchinteractio
nsinfo
rmatio
n
Alternative splice site usage gives rise to two types of exonsegments - the 'core' portion common to both splice formsand the 'extended' portion that is present only in the longerisoform. Two clusters of sequence motifs enriched in the coresequences of A5Es in genes expressed in the liver relative tothe core segments of A5Es resulting from alignments of non-liver-derived ESTs were identified - LI1 and LI2. Both areadenosine-rich, with consensus tetramers AAAC and UAAA,respectively. The former motif matches a candidate ESEmotif identified previously using the computational/experi-mental RESCUE-ESE approach (motif 3F with consensus[AG]AA [AG]C) [19]. The enrichment of a probable ESE motifin exons exhibiting alternative splice site usage in the liver isconsistent with the model that such splicing events are oftencontrolled by the relative levels of SR proteins (which bindmany ESEs) and hnRNP proteins. Insufficient data wereavailable for the analysis of motifs in the extended portions ofliver A5Es (which tend to be significantly shorter than thecore regions) or for the analysis of liver A3Es.
A measure of dissimilarity between mRNA isoformsTo quantify the differences in splicing patterns betweenmRNAs or ESTs derived from a gene locus, a new measurecalled the splice junction difference ratio (SJD) was devel-oped. For any pair of mRNAs/ESTs that align to overlappingportions of the same genomic locus, the SJD is defined as theproportion of splice junctions present in both transcripts thatdiffer between them, including only those splice junctionsthat occur in regions of overlap between the transcripts (Fig-ure 4). The SJD varies between zero and one, with a value ofzero for any pair of transcripts that have identical splice junc-tions in the overlapping region (for example, transcripts 2and 5 in Figure 4, or for two identical transcripts), and has avalue of 1.0 for two transcripts whose splice junctions arecompletely different in the regions where they overlap (forexample, transcripts 1 and 2 in Figure 4). For instance, tran-scripts 2 and 3 in Figure 4 differ in the 3' splice site used in thesecond intron, yielding an SJD value of 2/4 = 0.5, whereastranscripts 2 and 4 differ by skipping/inclusion of an
alternative exon, which affects a larger fraction of the intronsin the two transcripts and therefore yields a higher SJD valueof 3/5 = 0.6.
The SJD value can be generalized to compare splicing pat-terns between two sets of transcripts from a gene - for exam-ple, to compare the splicing patterns of the sets of ESTsderived from two different tissues. In this case, the SJD isdefined by counting the number of splice junctions that differbetween all pairs of transcripts (i, j), with transcript i comingfrom set 1 (for example, heart-derived ESTs), and transcript jcoming from set 2 (for example, lung-derived ESTs), anddividing this number by the total number of splice junctionsin all pairs of transcripts compared, again considering onlythose splice junctions that occur in regions of overlapbetween the transcript pairs considered. Note that this defini-tion has the desirable property that pairs of transcripts thathave larger numbers of overlapping splice junctions contrib-ute more to the total than transcript pairs that overlap less. Asan example of the splice junction difference between two setsof transcripts, consider the set S1, consisting of transcripts(1,2) from Figure 4, and set S2, consisting of transcripts (3,4)from Figure 4. Using the notation introduced in Figure 4,SJD(S1,S2) = d(S1,S2) / t(S1,S2) = [d(1,3) + d(1,4) + d(2,3) +d(2,4)]/ [t(1,3) +t(1,4) + t(2,3) + t(2,4)] = [3 + 4 + 2 + 3]/ [3+ 4 + 4 + 5] = 12/16 = 0.75, reflecting a high level ofdissimilarity between the isoforms in these sets, whereas theSJD falls to 0.57 for the more similar sets S1 = transcripts(1,2) versus S3 = transcripts (2,3). Note that in cases wheremultiple similar/identical transcripts occur in a given set, theSJD measure effectively weights the isoforms by their abun-dance, reflecting an average dissimilarity when comparingrandomly chosen pairs of transcripts from the two tissues.For example, the SJD computed for the set S4 = (1,2,2,2,2),that is, one transcript aligning as transcript 1 in Figure 4 andfour transcripts aligning as transcript 2, and the set S5 =(2,2,2,2,3) is 23/95 = 0.24, substantially lower than the SJDvalue for sets S1 versus S3 above, reflecting the higher frac-tion of identically spliced transcripts between sets S4 and S5.
Core A5E/liver (LI1) AAAC 42 AAAC (53.3)
AAAAC 18
Core A5E/liver (LI2) UAAA 29 UAAA (40.0)
UAAACC 5
Sequence motifs of length four to six bases that are significantly over-represented (p < 0.002) in SEs relative to constitutively spliced exons from brain- or testis-derived ESTs are shown, followed by the number of occurrences in SEs in these tissues. Sequence motifs are grouped/aligned by similarity, and shared tetramers are shown in bold and listed in the last column, followed by the fraction of SEs that contain the given tetramer. Sequence motifs significantly over-represented (p < 0.01) in the core of A5Es from human liver-derived ESTs are shown at the bottom, followed by the number of A5E occurrences and the fraction of A5Es that contain the given tetramer. Statistical significance was evaluated as described in Materials and methods.
Table 2 (Continued)
Sequence motifs enriched in skipped exons (SEs) and alternative 5' splice site exons (A5Es)
Genome Biology 2004, 5:R74

R74.10 Genome Biology 2004, Volume 5, Issue 10, Article R74 Yeo et al. http://genomebiology.com/2004/5/10/R74
Global comparison of splicing patterns between tissuesTo make a global comparison of patterns of splicing betweentwo different human tissues, a tissue-level SJD value wascomputed by comparing the splicing patterns of ESTs from allgenes for which at least one EST was available from cDNAlibraries representing both tissues. The 'inter-tissue' SJDvalue is then defined as the ratio of the sum of d(SA,SB) valuesfor all such genes, divided by the sum of t(SA,SB) values for allof these genes, where SA and SB refer to the set of ESTs for agene derived from tissues A and B, respectively, and d(SA,SB)and t(SA,SB) are defined in terms of comparison of all pairs ofESTs from the two sets as described above. This analysis usesall available ESTs for each gene in each tissue (rather thansamples of a fixed size). A large SJD value between a pair oftissues indicates that mRNA isoforms of genes expressed inthe two tissues tend to be more dissimilar in their splicingpatterns than is the case for two tissues with a smaller inter-tissue SJD value. This definition puts greater weight on thosegenes for which more ESTs are available.
The SJD values were then used to globally assess tissue-leveldifferences in alternative splicing. A set of 25 human tissuesfor which at least 20,000 genomically aligned ESTs wereavailable was compiled for this comparison (see Materialsand methods) and the SJD values were then computedbetween all pairs of tissues in this set (Figure 5a). A clusteringof human tissues on the basis of their inter-tissue SJD values
(Figure 5b) identified groups of tissues that cluster togethervery closely (for example, the ovary/thyroid/breast cluster,the heart/lymph cluster and the bone/B-cell cluster), whileother tissues including the brain, pancreas, liver, peripheralnervous system (PNS) and placenta occur as outgroups.These results complement a previous clustering analysisbased on data from microarrays designed to detect exon skip-ping [24]. Calculating the mean SJD value for a given tissuewhen compared to the remaining 24 tissues (Figure 5c) iden-tified a set of human tissues including the ovary, thyroid,breast, heart, bone, B-cell, uterus, lymph and colon that have'generic' splicing patterns which are more similar to mostother tissues. As expected, many of these tissues with genericsplicing patterns overlap with the set of tissues that have lowlevels of AS (Figure 1). On the other hand, another group oftissues including the human brain, pancreas, liver andperipheral nervous system, have highly 'distinctive' splicingpatterns that differ from most other tissues (Figure 5c). Manyof these tissues were identified as having high proportions ofAS in Figure 1. Taken together, these observations suggestthat specific human tissues such as the brain, testis and liver,make more extensive use of AS in gene regulation and thatthese tissues have also diverged most from other tissues in theset of spliced isoforms they express. Although we are notaware of reliable, quantitative data on the relative abundanceof different cell types in these tissues, a greater diversity ofcell types is likely to contribute to higher SJD values for manyof these tissues.
ConclusionsThe systematic analysis of transcripts generated from thehuman genome is just beginning, but promises to deepen ourunderstanding of how changes in the program of gene expres-sion contribute to development and differentiation. Here, wehave observed pronounced differences between human tis-sues in the set of alternative mRNA isoforms that theyexpress. Because our approach normalizes the EST coverageper gene in each tissue, there is higher confidence that thesedifferences accurately reflect differences in splicing patternsbetween tissues. As human tissues are generally made up of amixture of cell types, each of which may have its own uniquepattern of gene expression and splicing, it will be important inthe future to develop methods for systematic analysis of tran-scripts in different human cell types.
Understanding the mechanisms and regulatory consequencesof AS will require experimental and computational analysesat many levels. At its core, AS involves the generation ofalternative transcripts mediated by interactions between cis-regulatory elements in exons or introns and trans-actingsplicing factors. The current study has integrated these threeelements, inferring alternative transcripts from EST-genomicalignments, identifying candidate regulatory sequence motifsenriched in alternative exons from different tissues, and ana-lyzing patterns of splicing-factor expression in different
Computation of splice junction difference ratio (SJD)Figure 4Computation of splice junction difference ratio (SJD). The SJD value for a pair of transcripts is computed as the number of splice junctions in each transcript that are not represented in the other transcript, divided by the total number of splice junctions in the two transcripts, in both cases considering only those splice junctions that occur in portions of the two transcripts that overlap (see Materials and methods for details). SJD value calculations for different combinations of the transcripts shown in the upper part of the figure are also shown.
d(i,j) Number of splice junctions that differ between transcripts i,jt(i,j) Total number of splice junctions in transcripts i,j
1
2
3
4
5
E1
E3
E5a
E2 E5b
E4 Transcript
TranscriptsSJD (i,j)i j
1 2 3/3 = 12 3 2/4 = 0.52 4 3/5 = 0.61 4 4/4 = 12 5 0/4 = 0SJD(i,j) = d (i,j)/t(i,j)
Genome Biology 2004, 5:R74

http://genomebiology.com/2004/5/10/R74 Genome Biology 2004, Volume 5, Issue 10, Article R74 Yeo et al. R74.11
com
ment
reviews
reports
refereed researchdepo
sited researchinteractio
nsinfo
rmatio
n
tissues. Our results emphasize differences in the frequenciesof exon skipping versus alternative splice site usage in differ-ent tissues and highlight the liver, brain and testis as havingparticularly high levels of AS, supporting the idea that tissue-regulated AS plays important roles in the differentiation ofthese tissues. The high levels of alternative splice site usage inthe liver may relate to the unusual patterns of splicing-factorexpression observed in the adult liver, suggesting aspects ofdevelopmental regulation of AS at the tissue level. Obtaininga more comprehensive picture of AS will require the integra-tion of additional types of data upstream and downstream ofthese core interactions. Upstream, splicing factors them-selves may be differentially regulated in different tissues or inresponse to different stimuli at the level of transcription,splicing, or translation, and are frequently regulated by post-translational modifications such as phosphorylation, so sys-tematic measurements of splicing factor levels and activitieswill be required. Downstream, AS may affect the stability ofalternative transcripts (for example, in cases of messages sub-ject to nonsense-mediated mRNA decay), and frequentlyalters functional properties of the encoded proteins, so sys-tematic measurements of AS transcript and protein isoformsand functional assays will also be needed to fully understandthe regulatory consequences of AS events. Ultimately, it willbe important to place regulatory events involving AS into thecontext of regulatory networks involving control at the levelsof transcription, translation and post-translationalmodifications.
Materials and methodsData and resourcesChromosome assemblies of the human genome (hg13) wereobtained from public databases [67]. Transcript databasesincluded approximately 94,000 human cDNA sequencesobtained from GenBank (release 134.0, gbpri and gbhtc cate-gories), and approximately 5 million human expressedsequence tags (ESTs) from dbEST (repository 02202003).Human ESTs were designated according to their cDNAlibrary source (in total about 800) into different tissue types.Pertinent information about cDNA libraries and the corre-sponding human tissue or cell line was extracted from dbESTand subsequently integrated with library informationretrieved from the Mammalian Gene Collection Initiative(MGC) [68], the Integrated Molecular Analysis of GeneExpression Consortium (IMAGE) [69] and the Cancer
Figure 5
0 1 2 3 4 5
ovarythyroidbreastheartlymphkidneycolonuterusboneb celleye retinalungheadbloodgermskinstomachprostatetestismuscleplacentanervousliverpancreasbrain
SJR (x 10 3)
BrainPancreas
LiverPNS
PlacentaMuscleTestis
ProstateStomach
SkinGermBlood
Head-neckLung
Eye-RetinaB-cellBone
UterusColon
KidneyLymphHeart
BreastThyroid
Ovary
BrainPancreas
LiverPNS
PlacentaMuscleTestis
ProstateStomach
SkinGermBlood
Head-neckLung
Eye-retinaB-cellBone
UterusColon
KidneyLymphHeart
BreastThyroid
Ovary
BrainPancreas
LiverPNS
PlacentaMuscleTestis
ProstateStomach
SkinGermBlood
Head-neckLung
Eye-retinaB-cellBone
UterusColon
KidneyLymphHeart
BreastThyroid
Ovary
Bra
inP
ancr
eas
Live
rP
NS
Pla
cent
aM
uscl
eT
estis
Pro
stat
eS
tom
ach
Ski
nG
erm
Blo
odH
ead-
neck
Lung
Eye
-ret
ina
β-ce
llB
one
Ute
rus
Col
onK
idne
yLy
mph
Hea
rtB
reas
tT
hyro
idO
vary
10
9
8
7
6
5
4
3
2
1
0
Mean SJD (x 10−3)
SJD (x 10−3)
SJD versus other tissues (x 10−3)
0 1 2 3 4 5
0 1 2 3 4 5
(a)
(b)
(c)
Comparison of alternative mRNA isoforms across 25 human tissuesFigure 5Comparison of alternative mRNA isoforms across 25 human tissues. (a) Color-coded representation of SJD values between pairs of tissues (see Figure 4 and Materials and methods for definition of SJD). (b) Hierarchical clustering of SJD values using average-linkage clustering. Groups of tissues in clusters with short branch lengths (for example, thyroid/ovary, B-cell/bone) have highly similar patterns of AS. (c) Mean SJD values (versus other 24 tissues) for each tissue.
Genome Biology 2004, 5:R74

R74.12 Genome Biology 2004, Volume 5, Issue 10, Article R74 Yeo et al. http://genomebiology.com/2004/5/10/R74
Genome Anatomy Project (CGAP) [70]. Library informationobtained from MGC, IMAGE and CGAP is provided in Addi-tional data file 5.
Genome annotation by alignment of spliced transcriptsThe GENOA genome annotation script [71] was used to alignspliced cDNA and EST sequences to the human genome.GENOA uses BLASTN to detect significant blocks of identitybetween repeat-masked cDNA sequences and genomic DNA,and then aligns cDNAs to the genomic loci identified byBLASTN using the spliced-alignment algorithm MRNAVS-GEN [71]. This algorithm is similar in concept to SIM4 [72]but was developed specifically to align high-quality cDNAsrather than ESTs and thus requires higher alignment quality(at least 93% identity) and consensus terminal dinucleotidesat the ends of all introns (that is, GT..AG, GC..AG or AT..AC).EST sequences were aligned using SIM4 to those genomicregions that had aligned cDNAs. Stringent alignment criteriawere imposed: ESTs were required to overlap cDNAs (so thatall the genes studied were supported by at least one cDNA-genomic alignment); the first and last aligned segments ofESTs were required to be at least 30 nucleotides in length,with at least 90% sequence identity; and the entire ESTsequence alignment was required to extend over at least 90%of the length of the EST with at least 90% sequence identity.
In total, GENOA aligned about 85,900 human cDNAs andabout 890,300 ESTs to the human genome. The relatively lowfraction of aligned ESTs (about 18%), and average alignedlength of about 550 bases (the average lengths were not sig-nificantly different between different tissues, see Additionaldata file 6), reflect the stringent alignment-quality criteriathat were imposed so as to be as confident as possible in theinferred splicing patterns. The aligned sequences yieldedabout 17,800 gene regions with more than one transcriptaligned that exhibited a multi-exon structure. Of these, about60% exhibited evidence of alternative splicing of internalexons. Our analysis did not examine differences in 3'-termi-nal and 5'-terminal exons, inclusion of which is frequentlydictated by alternative polyadenylation or alternative tran-scription start sites and therefore does not represent 'pure' AS[73,74]. The EST alignments were then used to categorize allinternal exons as: constitutive exons; A3Es, A5Es, skippedexons, multiply alternatively spliced exons (for example,exons that exhibited both skipping and alternative 5' splicesite usage), and exons that contained retained introns. Aninternal exon present in at least one transcript was identifiedas a skipped exon if it was precisely excluded in one or moreother transcripts, such that the boundaries of both the 5' and3' flanking exons were the same in the transcripts thatincluded and skipped the exon (for example, exon E3 in Fig-ure 1). Similarly, an internal exon present in at least one tran-script was identified as an A3E or A5E if at least one othertranscript contained an exon differing in length by the use ofan alternative 3' splice site or 5' splice site. The 'core' of anA3E or A5E is defined as the exon portion that is common to
all transcripts used to infer the AS event. The extension of analternatively spliced exon is the exon portion added to thecore region by the use of an alternative 3' splice site or 5' splicesite) that is present in some, but not all transcripts used toinfer the AS event. Pairs of inferred A3Es or A5Es differing byfewer than six nucleotides were excluded from further analy-sis, as in [8], because of the possibility that such small differ-ences might sometimes result from EST sequencing oralignment errors. As the frequency of insertion-deletionserrors greater than three bases using modern sequencingtechniques is vanishingly small (P. Green, personal commu-nication), a six-base cutoff should exclude the vast majority ofsuch errors. Alternatively spliced exons/genes identified inspecific tissues are available for download from the GENOAwebsite [71].
Quantifying splice junction differences between alternative mRNA isoformsTo quantify the difference in splicing patterns betweenmRNAs or ESTs derived from a gene locus, the splice junctiondifference ratio (SJD) was calculated. For any pair ofmRNAs/ESTs that have been aligned to overlapping portionsof a genomic locus, the SJD is defined as the fraction of thesplice junctions that occur in overlapping portions of the twotranscripts that differ in one or both splice sites. A sample cal-culation is given in Figure 4. The SJD measure was calculatedby taking the ratio of the number of 'valid' splice junctionsthat differ between two sequences over the total number ofsplice junctions, when comparing a pair of ESTs across allsplice junctions present in overlapping portions of the twotranscripts. A splice junction was considered valid if: the 5'splice site and the 3' splice site satisfied either the GT..AG orthe GC..AG dinucleotide sequences at exon-intron junctions;and if the splice junction was observed at least twice in differ-ent transcripts.
Identification of candidate splicing regulatory motifsOver-represented sequence motifs (k-mers) were identifiedby comparing the number of occurrences of k-mers (for k inthe range of 4 to 6 bases) in a test set of alternative exonsversus a control set. In this analysis, monomeric tandemrepeats (for example, poly(A) sequences) were excluded. Theenrichment score of candidate k-mers in the test set versusthe control set was evaluated by computing χ2 (chi-squared)values with a Yates correction term [75], using an approachsimilar in spirit to that described by Brudno et al. [59]. Werandomly sampled 500 subsets of the same size as the test setfrom the control set. The enrichment scores for k-mers over-represented in the sampled subset versus the remainder ofthe control set were computed as above. The estimated p-value for observing the given enrichment score (χ2-value)associated with an over-represented sequence motif of lengthk was defined as the fraction of subsets that contained any k-mer with enrichment score (χ2-value) higher than the testedmotif. Correcting for multiple testing is not required as the p-value was defined relative to the most enriched k-mer for each
Genome Biology 2004, 5:R74
http://genomebiology.com/2004/5/10/R74 Genome Biology 2004, Volume 5, Issue 10, Article R74 Yeo et al. R74.13
com
ment
reviews
reports
refereed researchdepo
sited researchinteractio
nsinfo
rmatio
n
sampled set. For sets of skipped exons from human brain-and testis-derived EST sequences, the test sets comprised1,265 and 517 exons skipped in brain- and testis-derivedESTs, respectively, and the control sets comprised 12,527 and8,634 exons constitutively included in human brain- and tes-tis-derived ESTs, respectively. Candidate sequence motifs inskipped exons from brain and testis-derived ESTs with asso-ciated p-values less than 0.002 were retained. For the set ofA5E and A3E events from human liver-derived ESTsequences, the test set comprised 44 A3Es and 45 A5Es, andthe control set comprised 1,619 A3Es and 1,481 A5Es identi-fied using ESTs from all tissues excluding liver. In this analy-sis, A3Es and A5Es with extension sequences of less than 25bases were excluded and sequences longer than 150 baseswere truncated to 150 bases, by retaining the exon sequencesegment closest to the internal alternative splice junction.Over-represented sequence motifs in A3Es and A5Es fromliver-derived EST sequences with associated p-values lessthan 0.01 were retained.
Gene-expression analysis of trans-acting splicing factorsSR proteins, SR-related proteins, and hnRNPs were derivedfrom published proteomic analyses of the spliceosome [46-48]. Expression values for these genes were obtained from the'gene expression atlas' using the HG-U95A DNA microarray[43] and from a similar set of expression data using the HG-U133A DNA microarray [45]. Altogether, 20 splicing factors -ASF/SF2, SRm300, SC35, SRp40, SRp55, SRp30c, 9G8,SRp54, SFRS10, SRp20, hnRNPs A1, A2/B2, C, D, G, H1, K,L, M, and RALY - were studied in 26 different tissues presentin both microarray experiments (Figure 5). The data fromeach gene chip - HG-U95A and HG-U133A - were analyzedseparately. The average difference (AD) value of each probewas used as the indicator of expression level. In analyzingthese microarray data, AD values smaller than 20 were stand-ardized to 20, as in [43]. When two or more probes mappedto a single gene, the values from those probes were averaged.Pearson (product-moment) correlation coefficients between20-dimensional vectors for all tissue pairs were calculated,using data from each of the two DNA microarray studiesseparately.
Additional data filesAdditional data files containing the following supplementarydata, tables and figures are available with the online versionof this paper and from the GENOA genome annotation web-site [71]. The lists of GenBank accession numbers of humancDNAs and ESTs that were mapped to the human genome bythe GENOA pipeline, GENOA gene locus identifiers, and geneloci with spliced alignments for the 22 human autosomes andtwo sex chromosomes are provided at our website [76]. Setsof constitutive and alternative exons in genes expressed in thehuman brain, testis and liver, and control sets used are alsoprovided [77]. Additional data file 1 lists the average andmedian number of ESTs per gene and tissue, and the total
number of genes per tissue using different minimum num-bers of ESTs. Additional data file 2 lists the average totalnumber of AS genes and AS genes containing SEs, A3Es andA5Es using ESTs derived from normal, non-diseased tissues.Additional data file 3 lists the number of constitutively splicedand AS genes, and AS genes containing SEs, A3Es and A5Es.Additional data file 4 shows the average fractions of AS genesand average fractions of AS genes containing SEs, A3Es andA5Es using ESTs derived from normal, non-disease-derivedtissues. Additional data file 5 lists categories of cDNA librar-ies and designated tissues derived from the MGC, IMAGE andCGAP. Additional data file 6 shows the average lengths ofESTs that aligned to gene loci expressed in different tissues.Additional data file 7 lists human splicing factors of SR, SR-related and hnRNP genes, corresponding Ensembl gene num-bers and Affymetrix microarray probe identification num-bers. Additional data file 8 shows the distribution of theaverage Pearson correlation coefficient values across differ-ent tissues for expression levels of random sets of genesobtained from the Affymetrix microarray data.Additional data file 1The average and median number of ESTs per gene and tissue, and the total number of genes per tissue using different minimum num-bers of ESTsThe average and median number of ESTs per gene and tissue, and the total number of genes per tissue using different minimum num-bers of ESTsClick here for additional data fileAdditional data file 2The average total number of AS genes and AS genes containing SEs, A3Es and A5Es using ESTs derived from normal, non-diseased tissuesThe average total number of AS genes and AS genes containing SEs, A3Es and A5Es using ESTs derived from normal, non-diseased tissuesClick here for additional data fileAdditional data file 3The number of constitutively spliced and AS genes, and AS genes containing SEs, A3Es and A5EsThe number of constitutively spliced and AS genes, and AS genes containing SEs, A3Es and A5EsClick here for additional data fileAdditional data file 4The average fractions of AS genes and average fractions of AS genes containing SEs, A3Es and A5Es using ESTs derived from normal, non-disease-derived tissuesThe average fractions of AS genes and average fractions of AS genes containing SEs, A3Es and A5Es using ESTs derived from normal, non-disease-derived tissuesClick here for additional data fileAdditional data file 5Categories of cDNA libraries and designated tissues derived from the MGC, IMAGE and CGAPCategories of cDNA libraries and designated tissues derived from the MGC, IMAGE and CGAPClick here for additional data fileAdditional data file 6The average lengths of ESTs that aligned to gene loci expressed in different tissuesThe average lengths of ESTs that aligned to gene loci expressed in different tissuesClick here for additional data fileAdditional data file 7Human splicing factors of SR, SR-related and hnRNP genes, corre-sponding Ensembl gene numbers and Affymetrix microarray probe identification numbersHuman splicing factors of SR, SR-related and hnRNP genes, corre-sponding Ensembl gene numbers and Affymetrix microarray probe identification numbersClick here for additional data fileAdditional data file 8The distribution of the average Pearson correlation coefficient val-ues across different tissues for expression levels of random sets of genes obtained from the Affymetrix microarray dataThe distribution of the average Pearson correlation coefficient val-ues across different tissues for expression levels of random sets of genes obtained from the Affymetrix microarray datatClick here for additional data file
AcknowledgementsWe thank T. Poggio and P. Sharp for stimulating discussions and the anon-ymous reviewers for constructive suggestions. This work was supported bygrants from the National Science Foundation and the National Institutes ofHealth (C.B.B.), and by a Lee Kuan Yew fellowship (G.Y.) and a Whitemanfellowship (G.K.).
References1. Black DL: Mechanisms of alternative pre-messenger RNA
splicing. Annu Rev Biochem 2003, 72:291-336.2. Cartegni L, Chew SL, Krainer AR: Listening to silence and under-
standing nonsense: exonic mutations that affect splicing. NatRev Genet 2002, 3:285-298.
3. Graveley BR: Alternative splicing: increasing diversity in theproteomic world. Trends Genet 2001, 17:100-107.
4. Lopez AJ: Alternative splicing of pre-mRNA: developmentalconsequences and mechanisms of regulation. Annu Rev Genet1998, 32:279-305.
5. Grabowski PJ: Genetic evidence for a Nova regulator of alter-native splicing in the brain. Neuron 2000, 25:254-256.
6. Zavolan M, Kondo S, Schonbach C, Adachi J, Hume DA, HayashizakiY, Gaasterland T, RIKEN GER Group, GSL members: Impact ofalternative initiation, splicing, and termination on the diver-sity of the mRNA transcripts encoded by the mousetranscriptome. Genome Res 2003, 13:1290-1300.
7. Mironov AA, Fickett JW, Gelfand MS: Frequent alternative splic-ing of human genes. Genome Res 1999, 9:1288-1293.
8. Modrek B, Resch A, Grasso C, Lee C: Genome-wide detection ofalternative splicing in expressed sequences of human genes.Nucleic Acids Res 2001, 29:2850-2859.
9. Modrek B, Lee C: A genomic view of alternative splicing. NatGenet 2002, 30:13-19.
10. Kan Z, States D, Gish W: Selecting for functional alternativesplices in ESTs. Genome Res 2002, 12:1837-1845.
11. Brett D, Hanke J, Lehmann G, Haase S, Delbruck S, Krueger S, ReichJ, Bork P: EST comparison indicates 38% of human mRNAscontain possible alternative splice forms. FEBS Lett 2000,474:83-86.
12. Faustino NA, Cooper TA: Pre-mRNA splicing and humandisease. Genes Dev 2003, 17:419-437.
13. Modafferi EF, Black DL: A complex intronic splicing enhancerfrom the c-src pre-mRNA activates inclusion of a heterolo-gous exon. Mol Cell Biol 1997, 17:6537-6545.
14. Naor D, Nedvetzki S, Golan I, Melnik L, Faitelson Y: CD44 incancer. Crit Rev Clin Lab Sci 2002, 39:527-579.
Genome Biology 2004, 5:R74

R74.14 Genome Biology 2004, Volume 5, Issue 10, Article R74 Yeo et al. http://genomebiology.com/2004/5/10/R74
15. MacDougall C, Harbison D, Bownes M: The developmental con-sequences of alternate splicing in sex determination and dif-ferentiation in Drosophila. Dev Biol 1995, 172:353-376.
16. Ladd AN, Charlet N, Cooper TA: The CELF family of RNA bind-ing proteins is implicated in cell-specific anddevelopmentally regulated alternative splicing. Mol Cell Biol2001, 21:1285-1296.
17. Jensen KB, Dredge BK, Stefani G, Zhong R, Buckanovich RJ, OkanoHJ, Yang YY, Darnell RB: Nova-1 regulates neuron-specificalternative splicing and is essential for neuronal viability. Neu-ron 2000, 25:359-371.
18. Lim LP, Burge CB: A computational analysis of sequence fea-tures involved in recognition of short introns. Proc Natl Acad SciUSA 2001, 98:11193-11198.
19. Fairbrother WG, Yeh RF, Sharp PA, Burge CB: Predictive identifi-cation of exonic splicing enhancers in human genes. Science2002, 297:1007-1013.
20. Liu HX, Zhang M, Krainer AR: Identification of functional exonicsplicing enhancer motifs recognized by individual SRproteins. Genes Dev 1998, 12:1998-2012.
21. Schaal TD, Maniatis T: Selection and characterization of pre-mRNA splicing enhancers: identification of novel SR protein-specific enhancer sequences. Mol Cell Biol 1999, 19:1705-1719.
22. Tian H, Kole R: Strong RNA splicing enhancers identified by amodified method of cycled selection interact with SRprotein. J Biol Chem 2001, 276:33833-33839.
23. Zhu J, Shendure J, Mitra RD, Church GM: Single molecule profil-ing of alternative pre-mRNA splicing. Science 2003,301:836-838.
24. Johnson JM, Castle J, Garrett-Engele P, Kan Z, Loerch PM, ArmourCD, Santos R, Schadt EE, Stoughton R, Shoemaker DD: Genome-wide survey of human alternative pre-mRNA splicing withexon junction microarrays. Science 2003, 302:2141-2144.
25. Hu GK, Madore SJ, Moldover B, Jatkoe T, Balaban D, Thomas J, WangY: Predicting splice variant from DNA chip expression data.Genome Res 2001, 11:1237-1245.
26. Clark TA, Sugnet CW, Ares M Jr: Genome-wide analysis ofmRNA processing in yeast using splicing-specificmicroarrays. Science 2002, 296:907-910.
27. Ule J, Jensen KB, Ruggiu M, Mele A, Ule A, Darnell RB: CLIP identi-fies Nova-regulated RNA networks in the brain. Science 2003,302:1212-1215.
28. Clark F, Thanaraj TA: Categorization and characterization oftranscript-confirmed constitutively and alternatively splicedintrons and exons from human. Hum Mol Genet 2002,11:451-464.
29. Stamm S, Zhu J, Nakai K, Stoilov P, Stoss O, Zhang MQ: An alterna-tive-exon database and its statistical analysis. DNA Cell Biol2000, 19:739-756.
30. Xu Q, Modrek B, Lee C: Genome-wide detection of tissue-spe-cific alternative splicing in the human transcriptome. NucleicAcids Res 2002, 30:3754-3766.
31. Brett D, Pospisil H, Valcarcel J, Reich J, Bork P: Alternative splicingand genome complexity. Nat Genet 2002, 30:29-30.
32. Lee CJ, Irizarry K: Alternative splicing in the nervous system:an emerging source of diversity and regulation. Biol Psychiatry2003, 54:771-776.
33. Wang Z, Lo HS, Yang H, Gere S, Hu Y, Buetow KH, Lee MP: Com-putational analysis and experimental validation of tumor-associated alternative RNA splicing in human cancer. CancerRes 2003, 63:655-657.
34. Hui L, Zhang X, Wu X, Lin Z, Wang Q, Li Y, Hu G: Identificationof alternatively spliced mRNA variants related to cancers bygenome-wide ESTs alignment. Oncogene 2004, 23:3013-3023.
35. Kirkpatrick LL, McIlwain KA, Nelson DL: Alternative splicing inthe murine and human FXR1 genes. Genomics 1999, 59:193-202.
36. Kirkpatrick LL, McIlwain KA, Nelson DL: Comparative genomicsequence analysis of the FXR gene family: FMR1, FXR1, andFXR2. Genomics 2001, 78:169-177.
37. Sugnet CW, Kent WJ, Ares M Jr, Haussler D: Transcriptome andgenome conservation of alternative splicing events inhumans and mice. In Biocomputing 2004: Pac Symp Biocomput Editedby: Altman RB, Dunker AK, Hunter L, Jung TA, Klein TE. Singapore:World Scientific; 2004:66-77.
38. Sorek R, Ast G: Intronic sequences flanking alternativelyspliced exons are conserved between human and mouse.Genome Res 2003, 13:1631-1637.
39. Kaufmann D, Kenner O, Nurnberg P, Vogel W, Bartelt B: In NF1,
CFTR, PER3, CARS and SYT7, alternatively included exonsshow higher conservation of surrounding intron sequencesthan constitutive exons. Eur J Hum Genet 2004, 12:139-149.
40. Megy K, Audic S, Claverie JM: Positional clustering of differen-tially expressed genes on human chromosomes 20, 21 and22. Genome Biol 2003, 4:P1.
41. Hillman RT, Green RE, Brenner SE: An unappreciated role forRNA surveillance. Genome Biol 2004, 5:R8.
42. Green RE, Lewis BP, Hillman RT, Blanchette M, Lareau LF, GarnettAT, Rio DC, Brenner SE: Widespread predicted nonsense-mediated mRNA decay of alternatively-spliced transcripts ofhuman normal and disease genes. Bioinformatics 2003, 19(Suppl1):I118-I121.
43. Su AI, Cooke MP, Ching KA, Hakak Y, Walker JR, Wiltshire T, OrthAP, Vega RG, Sapinoso LM, Moqrich A, et al.: Large-scale analysisof the human and mouse transcriptomes. Proc Natl Acad Sci USA2002, 99:4465-4470.
44. Gene Expression Atlas [http://expression.gnf.org]45. Su AI, Wiltshire T, Batalov S, Lapp H, Ching KA, Block D, Zhang J,
Soden R, Hayakawa M, Kreiman G, et al.: A gene atlas of themouse and human protein-encoding transcriptomes. ProcNatl Acad Sci USA 2004, 101:6062-6067.
46. Zhou Z, Licklider LJ, Gygi SP, Reed R: Comprehensive proteomicanalysis of the human spliceosome. Nature 2002, 419:182-185.
47. Jurica MS, Moore MJ: Pre-mRNA splicing: awash in a sea ofproteins. Mol Cell 2003, 12:5-14.
48. Rappsilber J, Ryder U, Lamond AI, Mann M: Large-scale proteomicanalysis of the human spliceosome. Genome Res 2002,12:1231-1245.
49. Hanamura A, Caceres JF, Mayeda A, Franza BR Jr, Krainer AR: Reg-ulated tissue-specific expression of antagonistic pre-mRNAsplicing factors. RNA 1998, 4:430-444.
50. Bai Y, Lee D, Yu T, Chasin LA: Control of 3' splice site choice invivo by ASF/SF2 and hnRNP A1. Nucleic Acids Res 1999,27:1126-1134.
51. Eperon IC, Makarova OV, Mayeda A, Munroe SH, Caceres JF, Hay-ward DG, Krainer AR: Selection of alternative 5' splice sites:role of U1 snRNP and models for the antagonistic effects ofSF2/ASF and hnRNP A1. Mol Cell Biol 2000, 20:8303-8318.
52. Kamma H, Portman DS, Dreyfuss G: Cell type-specific expressionof hnRNP proteins. Exp Cell Res 1995, 221:187-196.
53. Caputi M, Mayeda A, Krainer AR, Zahler AM: hnRNP A/B proteinsare required for inhibition of HIV-1 pre-mRNA splicing.EMBO J 1999, 18:4060-4067.
54. Caputi M, Zahler AM: SR proteins and hnRNP H regulate thesplicing of the HIV-1 tev-specific exon 6D. EMBO J 2002,21:845-855.
55. Anderson L, Seilhamer J: A comparison of selected mRNA andprotein abundances in human liver. Electrophoresis 1997,18:533-537.
56. Futcher B, Latter GI, Monardo P, McLaughlin CS, Garrels JI: A sam-pling of the yeast proteome. Mol Cell Biol 1999, 19:7357-7368.
57. Griffin TJ, Gygi SP, Ideker T, Rist B, Eng J, Hood L, Aebersold R:Complementary profiling of gene expression at thetranscriptome and proteome levels in Saccharomycescerevisiae. Mol Cell Proteomics 2002, 1:323-333.
58. Kawamoto S, Matsumoto Y, Mizuno K, Okubo K, Matsubara K:Expression profiles of active genes in human and mouselivers. Gene 1996, 174:151-158.
59. Brudno M, Gelfand MS, Spengler S, Zorn M, Dubchak I, Conboy JG:Computational analysis of candidate intron regulatory ele-ments for tissue-specific alternative pre-mRNA splicing.Nucleic Acids Res 2001, 29:2338-2348.
60. Chou MY, Underwood JG, Nikolic J, Luu MH, Black DL: MultisiteRNA binding and release of polypyrimidine tract bindingprotein during the regulation of c-src neural-specific splicing.Mol Cell 2000, 5:949-957.
61. Chan RC, Black DL: The polypyrimidine tract binding proteinbinds upstream of neural cell-specific c-src exon N1 torepress the splicing of the intron downstream. Mol Cell Biol1997, 17:4667-4676.
62. Grabowski PJ: Splicing regulation in neurons: tinkering withcell-specific control. Cell 1998, 92:709-712.
63. Wollerton MC, Gooding C, Wagner EJ, Garcia-Blanco MA, SmithCW: Autoregulation of polypyrimidine tract binding proteinby alternative splicing leading to nonsense-mediated decay.Mol Cell 2004, 13:91-100.
64. Burd CG, Dreyfuss G: RNA binding specificity of hnRNP A1:
Genome Biology 2004, 5:R74

http://genomebiology.com/2004/5/10/R74 Genome Biology 2004, Volume 5, Issue 10, Article R74 Yeo et al. R74.15
com
ment
reviews
reports
refereed researchdepo
sited researchinteractio
nsinfo
rmatio
n
significance of hnRNP A1 high-affinity binding sites in pre-mRNA splicing. EMBO J 1994, 13:1197-1204.
65. Sirand-Pugnet P, Durosay P, Brody E, Marie J: An intronic (A/U)GGG repeat enhances the splicing of an alternative intronof the chicken beta-tropomyosin pre-mRNA. Nucleic Acids Res1995, 23:3501-3507.
66. McCullough AJ, Berget SM: G triplets located throughout a classof small vertebrate introns enforce intron borders and regu-late splice site selection. Mol Cell Biol 1997, 17:4562-4571.
67. UCSC Genome Browser [http://genome.ucsc.edu]68. Mammalian Gene Collection (MGC) Initiative [http://
mgc.nci.nih.gov]69. The I.M.A.G.E. Consortium [http://image.llnl.gov/image]70. The Cancer Gene Anatomy Project [http://cgap.nci.nih.gov]71. GENOA file server [http://genes.mit.edu/genoa]72. Florea L, Hartzell G, Zhang Z, Rubin GM, Miller W: A computer
program for aligning a cDNA sequence with a genomic DNAsequence. Genome Res 1998, 8:967-974.
73. Berget SM: Exon recognition in vertebrate splicing. J Biol Chem1995, 270:2411-2414.
74. Majewski J, Ott J: Distribution and characterization of regula-tory elements in the human genome. Genome Res 2002,12:1827-1836.
75. Glantz SA: Primer of Biostatistics 4th edition. New York: McGraw-Hill;1997.
76. Burge lab: Additional data directory 1 [http://genes.mit.edu/burgelab/Supplementary/yeo_holste04/Add_Datadir_1/]
77. Burge lab: Additional data directory 2 [http://genes.mit.edu/burgelab/Supplementary/yeo_holste04/Add_Datadir_2/]
Genome Biology 2004, 5:R74