open access estimating fish densities from single fish
TRANSCRIPT
The Open Ocean Engineering Journal, 2009, 2, 17-32 17
1874-835X/09 2009 Bentham Open
Open Access
Estimating Fish Densities from Single Fish Echo Traces
Magnar Aksland*
University of Bergen, Department of Biology, P.O. Box 7800, N-5020 Bergen, Norway
Abstract: Estimating mean fish density per unit area has been done by counting single fish echo traces with a split beam
echo sounder system in the open sea. A data program has been written that scans the acoustic signals for echo peaks and
classify these into echo traces. The program counts the number of echo traces from fish that cross the beam within given
distances from the acoustic axis over a known sailing distance, and gives an absolute estimate of fish density. This is ob-
tained by using the off acoustic axis angles of fish that generate resolved echoes to compute the athwartship distance from
the vertical acoustic axis to the fish. The program is described and demonstrated on selected files of raw data recorded by
the SIMRAD EK 60 split beam system. Estimated fish densities for these files are also obtained by the echo integration
method, and the echo trace method gives estimates that agree well with these estimates under sufficiently “good condi-
tions”.
INTRODUCTION
Underwater acoustics has a wide area of applications, such as underwater communication, mapping the bottom topography, Doppler speed measurements and so on. Use of sonar and echo sounder to detect fish and map the distribu-tion of fish populations started before the world war 2, [1]. Acoustic abundance estimation of fish followed and started by the echo counting method [2-4], but this was replaced early on by echo integration, a method that has developed further since then and became the standard method of acous-tic abundance estimation. The most important reason for this is that the echo integration method has few restrictions on the within-beam fish density. The physical reason that many fish species are easily detected acoustically is because they have swim bladder that account for around 90 percent of their back scattering strength [5]. A theoretical foundation for the echo integration method is given in [6], and a modern software system based on echo integration is described in [7].
The present paper presents a method to estimate fish den-sity by counting single fish echo traces, which is the collec-tion of echoes received from the same target, such as a fish, when it crosses the sound beam of a split beam echo sounder.
There are few references about the use of echo trace methods, or echo tracking, for the purpose of abundance estimation in the literature. In [8], echo traces from salmon and herring was counted in rivers by means of stationary sidescan sonar based on a method given in [9]. This method was further developed by [10]. The actual computer algo-rithm used is given in [11]. However, detecting echo traces from a moving acoustic platform with a down looking echo sounder in the open sea is not quite the same as using a sta-tionary side scan sonar in rivers.
*Address correspondence to this author at the University of Bergen, De-partment of Biology, PO Box 7800, N-5020 Bergen, Norway; E-mail: [email protected]
Otherwise, echo traces have been detected for purposes other than abundance estimation. Several studies involving echo traces with the split beam systems have been done in Japan, e.g. [12-14] and others.
In Norway a method using stationary split beam systems to study fish behavior has been developed and applied. The method is called target tracking and involves the detection of single fish positions during each ping when the fish are within the beam. Both this method and the echo trace method presented in this paper require the classification of echoes in the echo signal into groups of echoes that come from the same target. For description and use of the target tracking method see [15, 16] and references therein.
Estimating fish abundance or density by counting echo traces by a down looking transducer requires a moving acoustic platform where the acoustic beam moves over fish in a straight line. As long as the number of pings transmitted during the fish crossing time is high enough, and echoes from several targets do not overlap seriously, the estimation method based on counting traces may be used in theory.
Although the principles behind the echo trace method us-ing a split beam system are simple, a good program that clas-sifies the echoes in the echo signals into single fish echo traces is a challenge to write. This is because echo parame-ters observed within a trace often deviate more or less from that expected. The computer program presented here is writ-ten from the basis without using the techniques given in [11]. Reasons for this are given in the Discussion.
The method requires sufficiently low within beam fish density so that a “sufficient fraction” of the received echoes are “at least partly” resolved. In addition, the average num-ber of echoes in the traces cannot be too small because then many traces from the beam crossing fish may not be ob-served. If there is a fraction of fish from which only one echo is received, these are not counted. Suitable values for the sailing speed and ping repetition rate are also required. Although a slow sailing speed will generate traces with many echoes, the sailing speed must be significantly bigger

18 The Open Ocean Engineering Journal, 2009, Volume 2 Magnar Aksland
than the swimming speeds of the detected fish to avoid the formation of many traces that are fractions of long traces. This happens if the echo parameters from a target change too much relative to that expected from a stationary target.
The purpose of this study was to try the echo trace esti-mation method in practice and find out more about condi-tions for successful use.
MATERIAL AND METHODS
Egil Ona at the Institute of Marine Research (IMR), Ber-gen, Norway, provided the files of acoustic raw data used to develop this method. These files were recorded on cod and contain a large fraction of resolved echoes.
Recordings from a complete acoustic survey in Lofoten, Northern Norway, were available. The survey was performed in March/April 2004 with the new R/V G. O. Sars. During the survey modern scientific echo sounders operated simul-taneously at the five frequencies 18, 38, 70, 120 and 200 kHz, all with split beam transducers mounted close together. All beams were near circular symmetric. The half power beam width was 10.7 degrees for 18 kHz and close to 7 de-grees for the other frequencies. All echo sounders used the same pulse length of 1 ms, and the rectified and smoothed echo signal was sampled each 0.256 ms giving roughly 4-6 samples over one echo pulse. The working principles for the split beam echo sounder system are given by [17].
Principles for a Trace Program
The program described below is written in standard C, and works with 40 logR TVG (Time Varied Gain) digital echo signals. A flow chart of the program is given in Appen-dix A.
Detection of echo peaks in the trace program is simple. If there is a value in the digitized echo signal where both neighbor values are smaller, the biggest value is taken to be the peak value of a possible echo. This is then subject to tests and calculations for being a candidate echo in a trace. The reason for using a simple test to detect possible echo peaks is to avoid losing too many echoes in the first place.
To avoid echoes with very imprecise parameters, echoes to be used must come from a target that is not too far out in the beam, and the beam-compensated peak value should ex-ceed a threshold that must be set by the user. No test is done on echo shape. This means that partly overlapping echoes as well as echoes that partly overlap with the bottom echo are used as possible trace candidates if their peaks appear as local maximums in the echo signal.
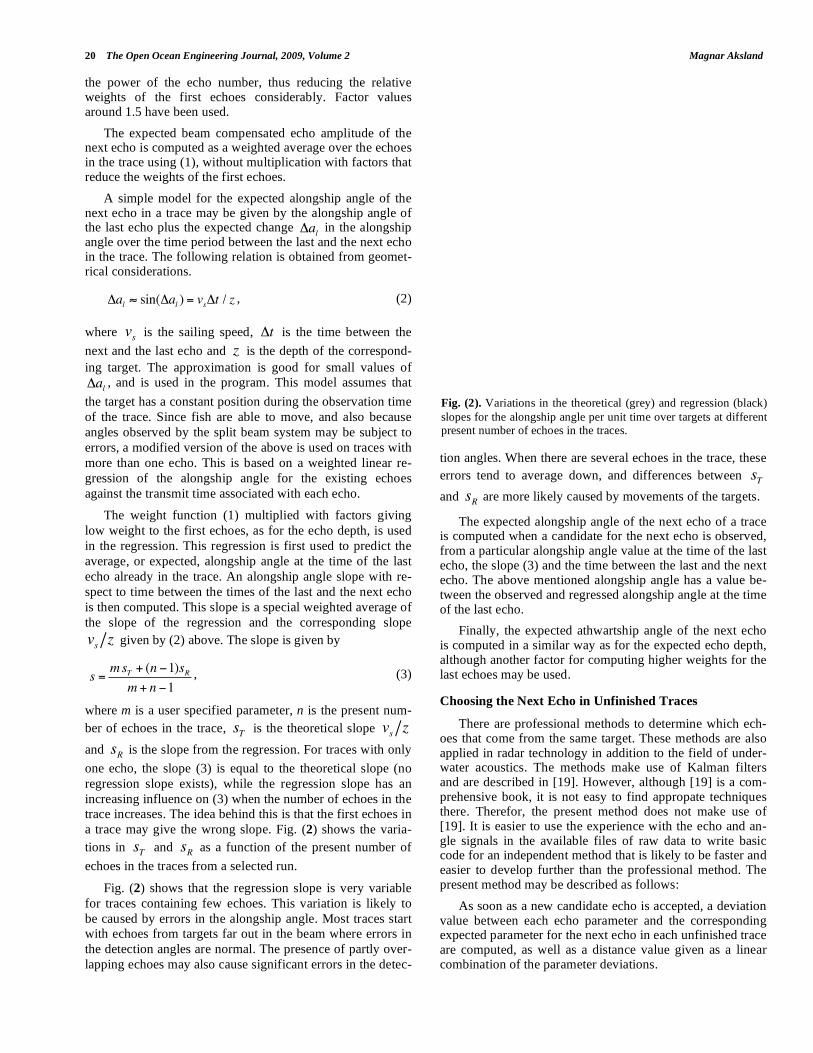
The echo parameters Ping number, Echo depth, Along-ship angle and Athwartship angle are used to test whether an accepted echo belongs to some unfinished echo trace. In ad-dition to these parameters, the program also computes meas-ures of the stability of the alongship and athwartship angles. These parameters depends on the variation of the values of the phase angles within one echo, and express something about how accurately the off axis angles of an echo are measured by the split beam system. They are used during the computation of weighted average values. The program uses several average values over the echoes of a trace, and these are computed by using higher weights for echoes with pre-
cise parameters than the weights of echoes with imprecise parameters.
To decide which of the echoes in a new ping that belong to which of the unfinished traces, the echo parameters of each new echo are compared with the expected echo parame-ters of the next echo in each trace. These expected parameter values are computed from the parameters of the echoes al-ready in the trace, the sailing speed of the ship, as well as the transmit time of the ping where the candidate echo is found. For each new accepted candidate echo, a “distance” from the expected parameters of the next echo is computed for every unfinished trace. This distance is simply a linear function of the absolute deviations between the expected echo parame-ters and the observed parameters of a new echo.
A new echo is taken to belong to it’s closest trace if the distance to this trace is less than a given value, and if the deviations of each single parameter are also less than particu-lar given values. This trace is updated with the new echo if the distance test is passed. If the distance test for a given new echo fails, or if there are no traces containing echoes, the echo is accepted as the first echo of a new trace provided that the corresponding target is not too far behind in the beam.
Setting of proper values for the maximum distance to a trace as well as the maximum values for each parameter de-viation are important for the program to work satisfactorily. It was necessary to run the program with different values of these variables to find favorable values.
It may happen that more than one echo in the next ping has the same trace as the closest. In that case the echo with the closest distance is taken as the next echo in the trace. The next closest echo is then checked against the other unfin-ished traces, and if it is the closest echo to another trace, it is taken as the next echo there instead of the echo that was computed as the closest in the first instance.
All unfinished traces are tested for being finished before each new ping, that is, if the difference between the present ping number and the ping number of the last echo in the trace exceeds a given value. As soon as a trace is finished, the weighted average depth and athwartship angle of the target generating the trace are computed. These values are then used to compute the athwartship distance between the target and the vertical acoustic axis. The purpose is to be able to count the number of traces, or targets, within differ-ent athwartship distances to the acoustic axis. The weighted average echo amplitude over the trace echoes is also com-puted.
Selected echo parameters of the echoes in an echo trace are shown graphically in Fig. (1). As this method will work with any chosen level of the digitized echo signal, the axis for Echo amplitude has no numeric labels.
The sailing speed was 6.8 m/s, and the variations in the echo parameter values are likely to be caused by movements of the target.
The echo parameters of each echo in two selected traces are shown in Appendix B.
Expected Parameter Values for the Next Echo in a Trace
The depths of the echoes in a trace should ideally be con-stant, but in practice there is always some variation. The ab-


Counting Echo Traces The Open Ocean Engineering Journal, 2009, Volume 2 25
DISCUSSION
The split beam echo trace method is built on simple prin-
ciples but has restrictions on the within-beam fish density. To decide whether the method is likely to work well on a
recording, assessment of echograms is necessary. With the
common split beam systems on research vessels with hull-mounted transducers, many dense recordings of fish at some
depth are unsuitable for the method. However, if use of
acoustic platforms on remotely operated underwater vehicles becomes more common, the range of observation can be
chosen. This is also the case for acoustic platforms on towed
underwater bodies. For such systems the echo trace method may be used for most recordings.
The echo trace program described here has been devel-
oped over some time, and has been upgraded several times. Although Xie (see [11]) has developed an algorithm that
sorts the echoes into fish traces, there are several reasons for
not using his ideas here. Xie has not implemented a tech-nique to filter away traces from smaller fish and plankton.
Instead he uses a fixed echo peak voltage threshold as well
as an echo width test to select candidate echoes. The fact that he does not use partly overlapping echoes is one reason why
his method does not work under as high fish density as the
method presented here. Although the present method is still a prototype, the present level of the program shows that this
method is promising. In contrast to the echo integration
method, the echo trace method does not require knowledge of fish target strength. Target strength obtained “in situ” is,
however, used for trace echoes in this paper, but other signal
levels giving values that are proportional to target strength may be used as well.
It is concluded both in [11] and [14] that a good signal to noise ratio is required to analyze echo traces with a split
beam system. However, not all echoes in a trace need to be
observed in this application. It is sufficient that a trace repre-sents one fish at a reasonably accurate athwartship distance.
Also, all fish within some range of athwartship distances
have to be observed by several trace echoes.
For the selected files, the trace program has given esti-
mates that are consistent with the echo integration estimates.
Many other files have also been tried, but most of these con-tain a mixture of different species including plankton that
made it difficult to choose corresponding threshold values
for echo integration and trace estimation. Some had also schools and patches that were too dense to generate trace
echoes, and some had too much variation in the sailing
speed.
For the chosen files, there were no difficult overlaps in
the echo-amplitudes of the big and small individuals.
Use of the distance function (see Fig. 4d) is better than
counting the number of traces within some fixed athwartship
distance. It was apparent that the echo sounder usually did not “see” echoes equally far on either side of the two ath-
wartship sides of the vertical acoustic axis. The method of
fitting a straight line to the “linear” part of the distance func-tion is independent of this phenomenon, which may be
caused by different strengths and directions of side wind.
The subjective fitting of a straight line to the distance func-
tion seems to work well in most cases. An automatic, more
objective, line-fitting routine may be developed, but this was
not given priority here.
Sources of Bias
There are several potential sources of bias with the echo
trace method. If the test for accepting a new echo to a trace is
too strict, some traces may be divided into two or more
shorter traces, thus causing overestimation of fish density. If
the test is too open, echoes not belonging to the trace may be
accepted. However, alien echoes in traces will not cause any
bias unless they change the number of counted traces.
There is always a chance that two echoes from different
sources, such as a plankton patch or overlapping echoes from
other smaller organisms, may be accepted by chance to be
the first two echoes in a new trace. Therefore, it is likely that
a fraction of false two-echo traces will be generated, as well
as a considerably smaller fraction of false three-echo traces.
Another way in which additional short traces may be gener-
ated is when the first couple of echoes in a trace have similar
big errors in echo parameter values while the following ech-
oes have accurate parameter values. Then the trace of the
first echoes may be ended as a short trace. It is evident from
the distribution of trace lengths that extra short traces may
form, in particular when there are many overlapping echoes.
Fig. (9) is from a recording that shows a mixture of big
fish with smaller fish and plankton, as seen from the distri-
bution of integrated single echoes. This recording has gener-
ated many false short traces. The sailing speed was between
1.4 and 2.4 m per second.
When trace lengths of more than 10 echoes are observed,
there are normally very few real traces spanning over only
two or three successive ping numbers. The trace length dis-
tributions in Fig. (9) are thus a strong indication of overesti-
mated number of short traces. It can be seen from the differ-
ence between the two lower distributions that short traces in
number of echoes are distributed over different trace lengths
in number of pings. These distributions would have been
identical if the echoes in all ping numbers of a trace had been
detected.
It can be seen that a few very long traces have been ob-
served. By inspecting the average change in alongship angle
per ping, these traces can only have been made by fish that
were swimming in the same direction as the acoustic plat-
form during the slowest sailing speed. Trace length patterns
with long, thin right-hand tails are often observed when the
sailing speed is moderate. Then the fish movements may
affect the trace length distribution considerably. The fact that
fish are attracted to slow-moving ships and tend to actively
stay under the ship has been reported in [22].
If a false echo peak is accepted as the first echo in a new
trace, the program will, as long as the next echo has not been
found, test whether echoes in the following five pings satisfy
the requirement for the next echo. Therefore, false two-echo
traces may span up to 6 ping numbers. False traces contain-
ing more than two echoes may span even bigger ranges of
ping numbers.

Counting Echo Traces The Open Ocean Engineering Journal, 2009, Volume 2 27
than strong single echoes are lost when the fish density is high. The conversion factor between integrator value and fish density will then be too big, causing fish density to be underestimated. The degree of this effect here is not clear, but if present, the trace estimate is also too small caused by too high within beam fish density.
Likely Problems with Noise
The applications in this paper were obtained under a rather good signal to noise ratio. During a worse noise level, e.g. during application on deeper recordings, the first prob-lem will be big errors in the detected off axis angles. When this happens many traces may split into shorter traces, and at even higher noise levels many traces are not observed at all. Although a few of the available files of raw data contained recordings at depths down to 400-500 m, this was not enough to study the behavior of the echo trace program at different critical noise levels.
If the trace program is to be used with higher noise level, it may work better on low fish density if the maximal dis-tances between the echo parameters of a new echo and the expected parameters of the next echo are bigger. When the errors in the off axis angles are big, valid traces may then be formed without splitting traces. This is an argument for hav-ing these distance values as input parameters to the program. It would be an easy update.
Further Development
Further development of the trace program will be neces-sary for different reasons. Reduction of known defects is obvious, but adaptation to future and hopefully better ver-sions of the split beam echo sounder system is also neces-sary. The present program reads the echo signals sequen-tially without going back to any previous ping.
An alternative way to build traces would be to start with strong echoes more centrally in the beam and search for ac-companying trace echoes in pings both backward and for-ward in time. This has not been tried here, but it may be a way to build traces without many extra short traces.
CONCLUSIONS
Estimates of fish density are obtained by software that
counts echo traces. Most of these are consistent with corre-
sponding estimates obtained by echo integration.
The trace method is often encumbered with overesti-
mated numbers of short traces, in particular two echo traces.
To get rid of these false traces, counting of traces with 3 or
more, or 4 or more, echoes is recommended.
When the trace lengths are small, usually when all traces
contain less than 10 echoes, the trace method tends to under-
estimate fish density.
Advantages with the trace method are that it represents a
method by which echo integration estimates may be com-
pared, that it can be used on species with unknown Target
Strengths and that it can be used without calibrated echo
sounders, although with approximately known beam func-
tions.
At present, it is not found any situation where the trace
method is definitely better than the echo integration method.
However, such situations may be found in the future.
ACKNOWLEDGEMENTS
I want to thank Egil Ona, Institute of Marine Research
(IMR), Bergen, Norway, for providing the files of acoustic
raw data used to develop this method.
APPENDIX A
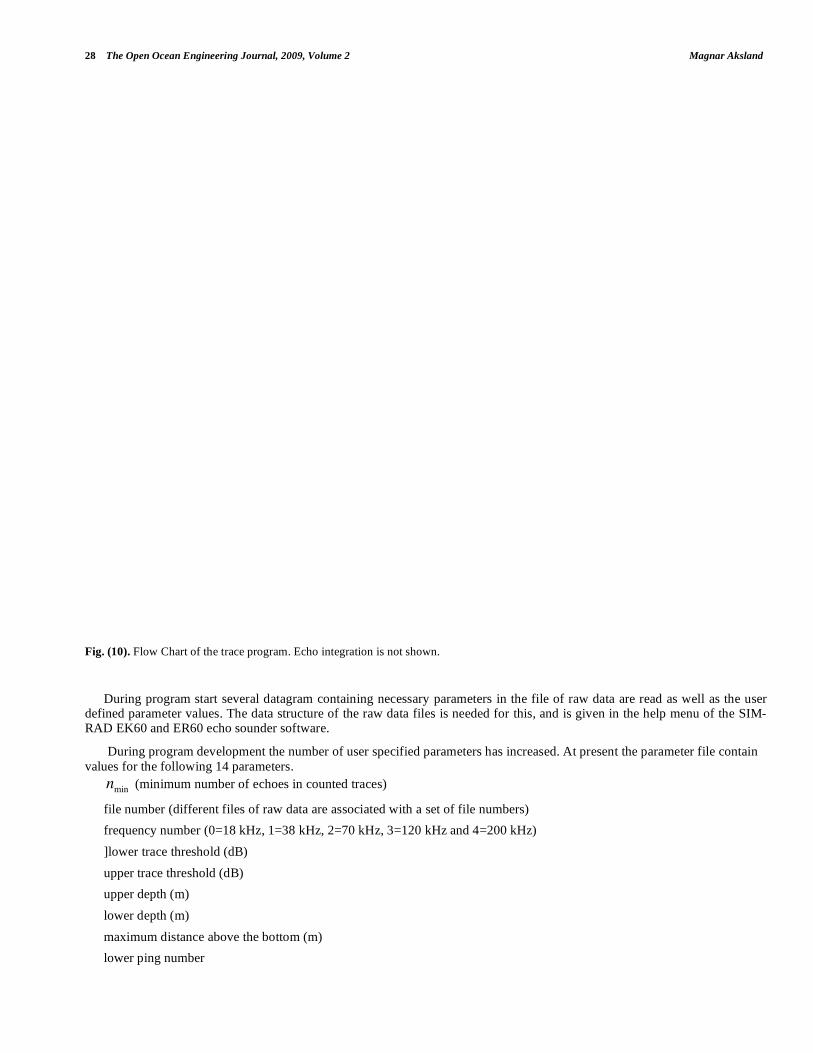
A Flow Chart and Some Technical Information About the Program
The program is structured in terms of four main subroutines. “ReadPing” reads the next ping, computes the echo signal data with both 40 and 20 logR TVG and computes the associated phase angle data.
“ScanPing” scans the echo signal for echo peaks and test whether the associated echoes belong to some unfinished traces, or are the first echo of a new trace.
“PutTrace” updates each unfinished trace with new echoes from the last ping, and create new traces with a first echo if nec-essary.
“EndTrace” test each existing trace structure for being finished. For traces that satisfy the condition for being finished the routine computes average trace parameters such as the echo depth, the echo amplitude, the athwartship angle and the athwart-ship distance between the vertical acoustic axis and the target.
A simple Flow Chart describing the trace program is shown in Fig. (10).

30 The Open Ocean Engineering Journal, 2009, Volume 2 Magnar Aksland
APPENDIX B
Example of traces with Echo Parameters Generated by the Trace Program
A section of a file containing the echo parameters within each trace is shown in Table 2.
Table 2. The Parameters of Two Echo Traces. The Echo Amplitudes are Here Expressed in Some Absolute Unit Giving High Values.
The Unit v2 Means Proportional to Peak Voltage Squared. Beam Compensation is Without Dimension.
Trace 1
Mean athwartship angle: -3.4576
Distance from acoustic axis: -4.1864
Mean echo amplitude: 120808
Number of echoes: 18
Ping
Number
Echo
Depth
m
Bottom
Depth
m
Echo
Ampl.
v2
Beam
comp.
Alongship
Angle
Degrees
Instability
Index
Degrees
Athwartship
Angle
Degrees
Instability
Index
Degrees
Speed
m/s
3060 69.69 77.33 20812 81.82 6.0 0.45 -3.2 1.18 3.35
3061 69.50 77.52 41706 81.82 5.7 0.17 -3.7 0.13 3.34
3062 69.59 77.52 110840 81.82 5.4 0.04 -3.0 0.00 3.33
3063 69.41 77.52 136057 81.82 5.1 0.06 -3.3 0.04 3.33
3064 69.46 77.52 275079 81.82 4.6 0.04 -3.4 0.04 3.33
3065 69.53 77.52 180754 19.74 3.9 0.06 -3.4 0.04 3.33
3066 69.39 77.71 87803 11.26 3.4 0.09 -3.2 0.00 3.33
3067 69.41 77.90 74637 11.26 3.1 0.06 -3.3 0.04 3.33
3068 69.44 77.71 109729 6.94 2.4 0.04 -3.4 0.04 3.33
3069 69.28 77.71 79481 4.58 2.0 0.06 -3.3 0.04 3.33
3070 69.28 77.90 146164 4.58 1.5 0.04 -3.5 0.00 3.33
3071 69.29 77.90 131873 4.58 0.9 0.00 -3.5 0.00 3.33
3072 69.30 78.09 91814 3.20 0.6 0.04 -3.4 0.00 3.33
3073 69.12 78.09 83215 3.20 0.1 0.06 -3.4 0.04 3.33
3074 69.09 77.90 148027 4.58 -0.5 0.04 -3.7 0.00 3.33
3075 69.04 78.09 203087 6.94 -1.2 0.00 -4.2 0.00 3.33
3076 69.08 78.09 82257 4.58 -1.3 0.04 -3.7 0.00 3.33
3077 68.91 78.09 51585 4.58 -1.5 0.09 -3.4 0.21 3.33


32 The Open Ocean Engineering Journal, 2009, Volume 2 Magnar Aksland
[7] R. J. Korneliussen, “The Bergen echo integrator post processing
system, with focus on recent improvements”, Fish. Res., vol. 68, pp. 159-169, 2004.
[8] M.V. Trevorrow, D.M. Farmer, and B. Pedersen, “Shallow-water salmon and herring detection using 100-kHz sidescan sonars”, J.
Acoust. Soc. Am., vol. 103, pp. 2939-2939, 1998. [9] T. Mulligan, and R. Kieser, “A split-beam echo counting model for
riverine use”, ICES J. Mar. Sci., vol. 53, pp. 403-406, 1996. [10] T. J. Mulligan, and D. G. Chen, “A split-beam echo counting
model: development of statistical procedures”, ICES J. Mar. Sci., vol. 55, pp. 905-917, 1998.
[11] Y. Xie, “A range-dependent echo-association algorithm and its application in split-beam sonar tracking of migratory salmon in the
Fraser River watershed”, IEEE J. Oceanic Eng., vol. 25, no. 3, pp. 387-398, 2000.
[12] K. Sawada, Y. Miyanohana, H. Takahashi, and Y. Takao, “Obser-vation of fish length and behaviour of an individual fish using echo
trace analysis”, J. Acoust. Soc. Am., vol.109, p. 2939, 2001. [13] K. Abe, Y. Takao, K. Sadayasu, K. Sawada, and K. Amakasu,
“Target strength and behavior of swimming juvenile southern blue-fin tuna in a cage estimated by echo-trace analysis”, J. Acoust. Soc.
Am., vol. 120, p. 3106, 2006.
[14] M. Furusawa, and K. Amakasu, “Robust analysis of single echo
traces obtained by split beam sounder”, J. Acoust. Soc. Am., vol. 120, p. 3060, 2006.
[15] N. O. Handegard, R. Patel, and V. Hjellvik, “Tracking individual fish from a moving platform using a split-beam transducer”, J.
Acoust. Soc. Am., vol. 118, pp. 2210-2223, 2005. [16] N. O. Handegard, “Observing individual fish behavior in fish ag-
gregations: tracking in dense fish aggregations using a split-beam echosounder”, J. Acoust. Soc. Am., vol. 122, pp. 177-187, 2007.
[17] P. Reynisson, “Split-beam method”, in Methodology for Target-Strength Measurements (with Special Reference to In Situ Tech-
niques for Fish and Mikro-nekton) (ch. 6), Ed. E. Ona. ICES Coop-erative Research Report. 235 pp., 1999.
[18] O. Nakken, and K. Olsen, “Target strength measurements of fish”, Rapp. P. –v. Cons. Int. Explor. Mer., vol. 170, pp. 52-69, 1977.
[19] S. S. Blackman and R. Popoli, Design and analysis of modern tracking systems. Artech House, Massachusetts, 1999.
[20] M. Aksland, “Basic echo-trace-length statistics”, ICES C.M. 1985/B:32 Sess. Y., 7 pp., 1985.
[21] M. Aksland, “Applying an alternative method of echo-integration”, ICES J. Mar. Sci., vol. 63, pp. 1438-1452, 2006.
[22] A. Røstad, S. Kaartvedt, T. A. Klevjer, and W. Melle, “Fish are attracted to vessels”, ICES J. Mar. Sci., vol. 63, pp. 1431-1437,
2006.
Received: November 07, 2008 Revised: May 11, 2009 Accepted: May 13, 2009
© Magnar Aksland; Licensee Bentham Open.
This is an open access article licensed under the terms of the Creative Commons Attribution Non-Commercial License
(http://creativecommons.org/licenses/by-nc/3.0/) which permits unrestricted, non-commercial use, distribution and reproduction in any medium, provided the
work is properly cited.