ontinuing our timeless excellence - exoserv.com corporate... · ontinuing our timeless excellence...
TRANSCRIPT

annual report 2014 1
continuing our timeless excellence
ontinuing Our Timeless Excellence
annual report 2014

2
Financial HigHligHts
Message FroM aMbassador alFonso t. YucHengco
aMbassador alFonso t. YucHengco’s aFFiliations
Message to sHareHolders
Financial review
consolidated assets
insurance risk portFolio
Financial reports
board oF directors
principal oFFicers
directorY oF subsidiaries, oFFices and brancHes
products and services
vision, Mission and core values
table of contents
the cover
34
56
11141516
134137142144145
This year’s consolidated annual report theme, “continuing our timeless excellence”, illustrates the company’s proven legacy of service excellence. like a precious gem, this valuable mark of excellence is passed on to every generation of the company’s leaders, and this legacy is one of the Malayan group’s greatest contributions to the non-life insurance industry.

annual report 2014 3
continuing our timeless excellence
Mico equities, inc. and subsidiaries
Financial highlights
in us dollars in philippine pesos
at Year end at Year end
premiums earned
net underwriting income
investments and other income
general expenses
provision for income tax
net income
premiums earned
net underwriting income
investments and other income
general expenses
provision for income tax
net income
premiums earned
net underwriting income
investments and other income
general expenses
provision for income tax
net income
premiums earned
net underwriting income
investments and other income
general expenses
provision for income tax
net income
$63,816,244
13,878,847
16,640,728
24,264,576
3,345,809
2,909,190
p2,833,096,635
616,145,855
738,758,477
1,077,216,132
148,535,859
129,152,342
$ 56,921,451
5,339,802
18,394,671
21,364,419
788,076
1,581,978
p2,527,005,044
237,058,380
816,624,068
948,464,815
34,986,339
70,231,294
2014 20142013 2013
total assets
stockholders’ equity
unearned premiums
reserve for losses and loss expenses
investments
total assets
stockholders’ equity
unearned premiums
reserve for losses and loss expenses
investments
total assets
stockholders’ equity
unearned premiums
reserve for losses and loss expenses
investments
total assets
stockholders’ equity
unearned premiums - gross
reserve for losses and loss expenses-gross
investments
$694,682,431
253,918,664
77,966,576
243,252,770
258,187,995
p31,066,198,325
11,355,242,671
3,486,665,287
10,878,263,854
11,546,167,136
$686,615,229
237,942,462
79,837,899
238,426,820
255,014,534
p30,705,433,038
10,640,786,905
3,570,350,842
10,662,447,404
11,404,249,979
conversion ratesbalance sHeet accounts p 44.720 = us$ 1.00 | proFit and loss accounts p 44.3946 = us$ 1.00
12%
160%
-10%
14%
325%
84%
12%
160%
-10%
14%
325%
84%
1%
7%
-2%
2%
1%
1%
7%
-2%
2%
1%
in us dollars (%)Increase (Decrease)
in philippine pesos (%)Increase (Decrease)
at Year end (%)Increase (Decrease)
at Year end (%)Increase (Decrease)

4
Message FroM Ambassador Alfonso T. Yuchengco
we are in tHe Midst oF continued econoMic optiMisM – a blessing aMidst tHe various cHallenges tHat we experienced in 2014. during tHis Year in review, we saw tHe pHilippines’ overall econoMic ranking rise, inFlation reMained Moderate, and tHe countrY was recognized For its HigH growtH potential and Favorable business environMent.
such a progressive outlook can only inspire industries and businesses to strive for greater growth, and Malayan insurance is no exception to this. Though our overall performance was modest, our income rose by 5 percent (5%) from 2013, while direct insurance premiums increased by 17 percent (17%) from previous year.
as Malayan approaches its 85th year in service to Filipino businesses and families, there is definitely no holding us back from attaining more. our 2018 vision aims to map out a clear direction towards securing our number one position in the industry, a place that we have held every year since 1970.
alongside this, we continue to solidify our partnerships with both local and foreign businesses. our long history of forging business alliances has strengthened our confidence to steer Malayan towards success and our dedication to continuously pursue mutual growth opportunities. we continue to reward the sterling individuals that push our products and services to our markets, knowing fully that our success is a direct result of our focus on people and their careers.
our history is also a testament to our investments in innovation and our encouragement of positive change. we have put in place several clearly defined strategies that generally involve the expansion of our retail lines, coming up with a more customer-centric organizational structure, and other investments aimed at maintaining our growth and our leadership status.
as the asean economic integration gets underway, we will continually assess what it will take to remain relevant to our customers for decades to come.
i thank all our stakeholders – our customers, our people, our business partners, our shareholders and the communities in which we live and work – for their continued support. we at Malayan insurance assure you that we will continue to invest significantly in our businesses to secure the timeless legacy of business excellence that we have worked hard to establish over the past 85 years.
“our long history of forging business alliances has strengthened our confidence to steer Malayan towards success and our dedication to continuously pursue mutual growth opportunities.”
ambassador alfonso t. YuchengcocHairMan, Mico equities, inc.
ambassador alfonso t. YuchengcocHairMan, Mico equities, inc.

annual report 2014 5
continuing our timeless excellence
AffiliationsaMBassador alFonso t. YuchenGcocHairMan, Mico equities, inc.
GovernMent positions
under the administration of president gloria Macapagal arroyo• Presidential Adviser on Foreign
affairs with cabinet rank (January 19, 2004 – June 2010)• Member, Consultative Commission
to propose revision to the 1987 constitution (august 2005 – March 2006)
• Philippine Permanent Representative to the united nations with the rank of ambassador (november 2001 – december 2002)
• Presidential Special Envoy to Greater china, Japan and korea (2001)
under the administration of president Joseph ejercito estrada• Presidential Assistant on APEC Matter
with cabinet rank (1998-2000)
under the administration of president Fidel v. ramos• Ambassador Extraordinary &
plenipotentiary of the republic of the philippines to Japan (1995-1998)
• Chairman, Council of Private Sector advisers to the philippine government on the spratly issue (Marine and archipelagic development policy task group) (1995-1998)
• Member, Philippine Centennial commission (1998)
under the administration of president corazon c. aquino• Ambassador Extraordinary &
plenipotentiary of the republic of the philippines to the people’s republic of china (proc) (1986-1988)
aFFiliations – private sectors• Bachelor of Science in Commerce
Far eastern university, philippines (1946)
• Certified Public Accountant (CPA) (1947)
• Master of Science – Columbia university, new York (2007)
• Pan Malayan Management and investment corporation (pMMic) chairman of the board and chief executive officer
• Rizal Commercial Banking Corporation Honorary chairman of the board
• MICO Equities, Inc. (holding company of Malayan group of insurance companies) chairman of the board
• Malayan Insurance Co., Inc. Member of the board of directors
• Malayan Insurance Co. (HK) Ltd. chairman of the board
• Malayan Securities Corporation Member of the board of directors
• GPL Holdings, Inc. chairman of the board
• Sunlife Grepa Financial, Inc. Member of the board of directors
• House of Investments, Inc. Member of the board of directors
• Malayan Colleges, Inc. chairman of the board of trustees
• Malayan Colleges Laguna Inc. chairman of the board
• EEI Corporation chairman of the board of trustees
• RCBC Realty Corporation chairman of the board
• RCBC Land, Inc. Member of the board of directors
• AY Foundation chairman of the board
• Philippine Integrated Advertising agency, inc. (piaa) chairman of the board
• Yuchengco Center, De La Salle university, philippines chairman of the board
• Yuchengco Museum chairman of the board
• Y Realty Corporation chairman of the board
• YGC Corporate Services, Inc. chairman of the board
• Waseda Institute for Asia Pacific studies Member of the international advisory board
• Ritsumeikan Asia Pacific University Member of the advisory board
• University of Alabama Member, international business advisory board
• Culverhouse College of Commerce & Business Administration
• University of San Francisco, (Mclaren school of business), usa trustee emeritus
• Columbia University, Business School, new York, usa Member, board of overseers
• Asian Bankers Association chairman emeritus
• Master of Business Administration (Mba) – Juris doctor (Jd) dual degree program of de la salle university professional schools, inc. graduate school of business and Far eastern university institute of law, chairman of the board
• University of St. La Salle, Roxas City Member, board of trustees
• Pacific Forum, Honolulu, Hawaii Member, board of governors
• International Insurance Society (IIS) Member of the board of directors and Former chairman of the board
• Bantayog ng mga Bayani (pillars of Heroes Foundation) chairman of the board
• Philippine Constitutional Association (pHilconsa) chairman emeritus
• Blessed Teresa of Calcutta Awards vice-chairman of the board of Judges
• Bayanihan Foundation (Bayanihan Folk arts Foundation, inc.) philippine women’s university chairman of the board of trustees
• Confederation of Asia-Pacific chambers of commerce and industries (cacci) chairman, advisory board and Former chairman of the board
• The Asia Society, New York trustee emeritus
• Honda Cars Kalookan, Inc. chairman of the board
• Enrique T. Yuchengco, Inc. chairman of the board
• Luisita Industrial Park Corporation chairman of the board
• Compania Operatta ng Pilipinas, Inc. (philippine opera company) Honorary chairman of the board
GovernMent awards:
distinguisHed service award department of Foreign affairs (February 24, 2012)
pHilippine legion oF Honor witH tHe degree oF grand coMMander presented by president gloria Macapagal-arroyo (June 29, 2010)
First recipient oF tHe order oF lakandula witH tHe rank oF baYani (grand cross) presented by president gloria Macapagal-arroyo republic of the philippines (november 20, 2003)
order oF sikatuna witH tHe rank oF datu presented by president Fidel v. ramos republic of the philippines (1998)
grand cordon oF tHe order oF tHe rising sun presented by His Majesty, the emperor of Japan. The highest honor ever given by the emperor to a foreigner (1998)
knigHt grand oFFicer oF rizal presented by the knights of rizal republic of the philippines (1998)
order oF tHe sacred treasure, gold and silver star awarded by His Majesty, The emperor of Japan (1993)
outstanding Manilan in diploMacY city of Manila (1995)
outstanding citizen in tHe Field oF business city of Manila (1976)
non-GovernMent awards
outstanding laM-an townMates award philippine lam-an association inc. (november 19, 2012)
icons oF tHe industrY philippine insurers and reinsurers association (pira, inc.) (october 18, 2012)
business icons oF tHe decade award presented by biz news asia (november 25, 2011)
rizal award presented by aliw awards (november 8, 2011)
distinguisHed service award presented by the confederation of asia-pacific chambers of commerce and industry (october 23, 2011)
First recipient oF tHe F.a.i.r. Hall oF FaMe presented by the Federation of afro-asian Insurers & Reinsurers (FAIR) (october 5, 2011)
leadersHip award presented by the philippine constitution association (pHilconsa) (september 26, 2011)
liFetiMe acHieveMent award asia insurance industry awards (october 17, 2010)
pHilconsa MaHarlika award presented by the philippine constitution association (2010)
Hall oF FaMe awardee Far eastern university (december 13, 2003)
outstanding aluMni awardee Far eastern university (May 2003)
liFetiMe acHieveMent award dr. Jose p. rizal awards for excellence (June 2002)
knp pillar award kaluyagan nen palaris, pangasinan (december 2006)
parangal san Mateo philippine institute of certified public accountants Foundation, inc. (october 2001)
tHe outstanding Filipino awardee toFil 2000
gold Medallion confederation of asia-pacific Chambers of Commerce & Industry (cacci) (2000)
First asean to be elected to tHe “insurance Hall oF FaMe” international insurance society, inc. (1997)
First recipient oF tHe global insurance HuManitarian award university of alabama (usa) (2008)
Hall oF FaMe award philippine institute of certified public accountants (picpa) (1997)
outstanding certiFied public accountant (cpa) in international relations philippine institute of certified public accountants (picpa) (1996)
ceo excel award international association of business communicators (2009)
Medal oF Merit philippines-Japan society (1995)
outstanding service to CHURCH & NATION de la salle university (1993)
ManageMent Man oF tHe Year Management association of the philippines (1992)
distinguisHed la sallian award FOR INSURANCE & FINANCE de la salle university (1981)
First asian to receive international insurance societY (iis) Founders’ gold Medal award oF excellence international insurance society (1979)
presidential Medal oF Merit Far eastern university (1978)
Most outstanding Jci senator in tHe Field oF business and econoMics xxxiii Jaycee chamber international (Jci) world congress (1978)
insurance Man oF tHe Year business writers association of the philippines (1955)
Most distinguisHed aluMnus Far eastern university (1955)

6
Message to Shareholders
over tHe last Five Years, tHe pHilippines Has Maintained a positive econoMic MoMentuM despite tHe instabilitY oF tHe global econoMic environMent. driven bY tHe advantages oF a strengtHened econoMY, tHe countrY Has been reacHing gross doMestic product (gdp) targets since 2010, recording an average growtH rate oF 6.3 percent (6.3%) in a period oF tHree (3) Years.
in 2014, the philippines demonstrated positive performance amid the twin effects of super typhoon Yolanda and the devastating earthquake in central visayas that happened in the previous year. The recorded real gdp of 6.1 percent (6.1%) made the country the best-performing economy in the association of southeast asian nations (asean) region. This positive performance was fittingly validated by the upgraded and sustained investment and credit ratings from international rating agencies standard and poor’s, Moody’s, and Fitch credit rating. in addition, the country continued to improve its ranking on cross-over country surveys of institutional quality, the result of the government’s emphasis on good governance. 2014 was not just a robust year for the country but for the Malayan group as well. although it was a period of recovery for the philippine non-life insurance industry, we are pleased to report that the Malayan group closed 2014 with good results —new partnerships, revitalized organization, affirmed credit ratings, and a positive outlook for the next four years.
The recorded real gdp made the country the best-performing economy in the association of southeast asian nations
(asean) region.
total industry net premium written (npw) in the same period
was valued at php 31.1 billion, up 15.64% from the 2013 figure
of php 26.9 billion
The group’s net income grew by 84% to php 129.15 million
and gross premiums written (gpw) was maintained on the
php 7 billion threshold.
Dear FellowShareholders,
MarketHigHligHts
6.1%
15.64%
84%
helen Y. deecHairperson
Gdp

annual report 2014 7
continuing our timeless excellence
0
5
10
15
20
25
30
lead company Malayan insurance co., inc.’s net income grew by 145 percent (145%) to php 290.04 million and gross premiums written (gpw) was maintained within the php 7 billion threshold. upward trend was also evident in terms of total and net underwriting income, which were at php 2.981 billion and php 597 million, respectively. Moreover, Malayan insurance, together with major partner tokio Marine Holdings, inc., has been hard at work to meet the challenges of the industry. in the following sections, we will report the challenges we are facing and the opportunities that come with this unprecedented growth in our economy.
the challenGesone of the major challenges of the non-life insurance sector is the impending asean economic community, a financial integration mechanism for the economies of southeast asia resulting in a single market and production base that will facilitate the free movement of goods, services, investments, skilled labor, and capital among the member countries. This integration thus calls for the forging of strategic alliances to increase current market players’ capital, to tap uncharted markets and opportunities, to become better equipped against heightened competition, and to cushion impact against external shocks. The insurance commission (ic) has also been campaigning for a higher insurance penetration and a more active industry, noting that capitalization in the insurance sector remains to be the lowest in the region.
total assets
Gross preMiuM written
investMent & other incoMe
2014
2014
2014
2013
2013
2013
Yvonne s. Yuchengcopresident
31.07B
7.84B
738.8M
30.71B
7.59B
816.6M
0
1
2
3
4
5
6
7
8
0
100
200
300
400
500
600
700
800

8
in preparation for the integration, the department of Finance and ic crafted a strategy and corresponding work program to provide safeguard measures for the sub-sectors that are scheduled to be liberalized in 2020. The philippine insurance industry is expected to go into substantial liberalization by the said year. The ic is also studying a new risk-based capital (rbc) framework that takes into account new risks undertaken by insurance companies under the amended insurance code, such as new investments and new products. once the new rbc framework is drafted, it will be tested throughout 2015 and will be officially adopted by 2016. Moreover, in partnership with the international Finance corporation, the ic is studying a framework for compulsory catastrophe risk insurance targeted for homeowners and small-and-medium enterprises that will cover earthquake, typhoon, and flood. possible modes of implementation are through regulation in real estate transactions requiring property buyers and owners to buy catastrophe cover, and catastrophe insurance as a pre-requisite for opening of utility accounts such as water or electricity. under this framework, all private general insurance companies can provide direct insurance covers with reinsurance facilities or arrangements via a pool.
continuinG the leGacYThrough the years, Malayan insurance has demonstrated strong dedication to innovation, service excellence, honoring commitments, and paying it forward to the community since its founding in 1930. in a bid to streamline operations and make it more responsive to market opportunities and challenges, the Malayan group’s organizational structure was revitalized in 2014. The internal capital Model, as part of enterprise risk Management, was developed to help Malayan measure the amount of capital needed to cover various risks, to assist in strategic planning, and to optimize reinsurance among others. The development of an internal capital Model was initially focused on the underwriting risk component. The models for Fire and Motor lines, which account for the two biggest shares of Malayan’s risk portfolio, were completed in 2014. The models for the other lines as well as the other business risks will follow.
as an intrinsic tool for risk identification and assessment, the risk Management database was updated by all the business units of the Malayan group of companies. The group heads, together with the business unit heads, monitor the implementation of the risk mitigation strategies to manage the risks within their units. From the risk Management database entries, the top enterprise-wide risks were identified by the executive Management committee and were presented to the risk Management committee. updates on these top risks continue to be provided to the risk Management committee during their regular meetings. Moreover, to better deliver services to our clients, Malayan has also embarked on a total review of the business continuity and resiliency plan (bcrp), which is spearheaded by the executive Management committee. The bcrp includes an updated it recovery plan and crisis communication protocols to ensure the delivery of services during unforeseen events. in december 2014, Malayan insurance co., inc. also developed the Malayan 2018 vision, with the goal of solidifying our position, improving our profitability in the medium term, strengthening customer service, and broadening our reach. This vision includes sustaining our leading position in the non-life sector in terms of gross premiums written (gpw); driving down our combined ratio, which is the measure of profitability in insurance operation; and delivering return on equity of 12 percent (12%). Moreover, we envision our company to be a customer-centric organization and be the employer of choice among non-life insurance companies in the country with a fully-engaged workforce. with a business environment that is rapidly changing, and major trends in technology, media, and distribution serving as disruptors in the traditional ways of doing insurance business, the new organization is adopting deliberate steps to remain as the preferred non-life insurer in the philippine market. over the next four years, strategic initiatives are being undertaken to realize our 2018 vision and make the Malayan insurance brand synonymous with non-life insurance. in terms of corporate social responsibility, the Malayan group actively participates in nationwide

annual report 2014 9
continuing our timeless excellence
assistance programs of the aY Foundation, the Yuchengco group’s philanthropic arm, which regularly holds medical and dental missions, and relief operations. Malayan has also shown unrelenting support in other Yuchengco group projects such as the buhay rizal values campaign, which is centered on promoting the values espoused by national Hero dr. Jose p. rizal, and the earth care program, which seeks to raise the level of awareness on the need for environment protection.
reapinG our successreflecting on the year in review, we are pleased with the accomplishments that our company has achieved and the momentum built towards increased customer engagement. world’s most authoritative insurance rating institution a.M. best retained Malayan insurance’s issuer credit rating of “bbb+” and its financial strength rating of b++ (good) with stable outlook. our investment portfolio was an important source of income as it consistently posted satisfactory investment results that delivered a net profit every year during the past five years. our efforts in providing pioneering products, meeting customer needs, addressing regulatory requirements to enhance customer satisfaction, and seeking out continuous quality improvement were also fittingly rewarded as our iso 9001:2008 certification was re-affirmed. in 2014, Malayan insurance also launched several affinity tie-ups and various programs for e-commerce, contributing to the growth of our retail business. tokio Marine also acquired additional shares in Malayan insurance through its wholly-owned subsidiary tokio
Marine asia pte., ltd. This increase in equity raises tokio Marine’s interest in Malayan to 20 percent (20%) from 11 percent (11%), signifying increased confidence in the philippine non-life insurance sector. The Malayan group also diversified its retail distribution through channel expansion in microinsurance and the overseas Filipino workers (oFw) market, and strengthened bancassurance footprints through cross-selling agreements and referral arrangements with banking partners. The foregoing are affirmations that we are on the right track in realizing our goals. These should not, however, allow us to rest on our laurels. instead, we should take these as cues to serve better, grow stronger, and reach farther.
the proMiseone of the major reasons for our milestones over the last few years is the Malayan group’s conscious effort to continuously strengthen and deepen the foundations we have built over the last 85 years. with our solid financial footing and proven reputation, we are optimistic that the upcoming years will allow us to expand our reach and provide better service and products to our agents, brokers, reinsurers, and business partners. as Malayan insurance takes on the challenges ahead and focuses on putting in place all our plans, we promise to continue our invaluable legacy of service excellence and honoring commitments, achieving what has always been our bigger purpose—contributing to nation-building for a better and more progressive philippines.
helen Y. deecHairperson
MalaYan insurance co., inc.
Yvonne s. Yuchengcopresident
MalaYan insurance co., inc.

10
php2.83B
php616.15Mphp11.36B
net preMiuMs
earned
netunderwritinG
incoMestockholders’equitY
Malayan, Tokio Marine celebrate 50 years of partnership
Malayan Agents Awardees during the Gabi ng Parangal 2014
Malayan Sales Team and Frontliners during a Customer Service Seminar

annual report 2014 11
continuing our timeless excellence
Financial Review
MalaYan insurance continues to post satisFactorY results in 2014 witH double digit growtH experienced in its direct business, wHere it recorded pHp 5.83 billion in direct preMiuMs written, sHowing a growtH rate oF seventeen percent (17%) over tHe pHp 4.96 billion gained in 2013.
This increase in earnings could be attributed to the Management’s focus on several key initiatives to drive up its operational results, which included a management reorganization that helped improve and increase the company’s underwriting and sales results. Malayan’s support units also made lasting contributions in ensuring that clients and business partners were served well, even as the company continued to strengthen its menu of retail offerings and forged more partnerships as channels for distribution of its insurance product line. all these initiatives, together with a more sustained zeal for excellence from all areas of operation – from the underwriting, sales and support groups – created a robust environment that paved the way for the good results of 2014, when Malayan realized net premiums earned (npe) of php 2.59 billion, twelve percent (12%) higher than the php 2.3 billion recorded in 2013. The increase in npe was due to a 22 percent (22%) boost in Malayan’s net premiums retained – from php 2.19 billion (2013) to php 2.67 billion (2014) – due to an increase in retail business and a decrease in excess of loss reinstatement premiums. There was also an increase of php 102 million – from php 288 million to php 390 million or 35 percent (35%) up – in reinsurance commissions earned in 2014. Malayan’s net underwriting income of php 597 million in 2014 was 143 percent (143%) more than the php 246 million recorded in the previous year. in terms of the company’s overall gross premiums written (gpw), the gains in direct business were affected by the cancellation of unprofitable foreign treaties. Thus, the company’s gpw was flat at php 7.3 billion as opposed to php 7.4 billion achieved in 2013. in 2014, there were no big catastrophic claims paid by the company unlike in 2013 when the country was hit by super typhoon Yolanda and ravaged by the earthquake that hit bohol and cebu in the visayas.
This favourable business climate contributed to the remarkable year of Malayan where it posted a more than double profits from the year-ago figures. Malayan’s php 290 million net income was 145 percent (145%) more than the php 118 million made in 2013. in terms of the company’s assets, Malayan is up seven percent (7%) to php 26.7 billion from php 25.1 billion, while its net worth of php 8 billion is 5 percent (5%) up from the php 7.7 billion recorded in 2013.
ForGinG For the Future
Malayan insurance has been continuously improving itself. its results in 2014 were a good indication of its strength and stability, and more so, it is a portent of good things to come. The philippine non-life insurance industry is undergoing regulatory changes as a result of the passage of republic act 10607, otherwise known as the new insurance code, during the second half of 2013. new capital requirements placed importance on a company’s net worth instead of paid-up capital, unimpaired surplus, and valuation assets. The requirement for minimum net worth for a non-life insurance company is php 550 million by year 2016. Malayan insurance’s actual net worth in 2014 is already at php 8.09 billion. paid-up capital minimum requirement is php 250 million, according to the new insurance code. Malayan insurance’s actual paid-up capital is at php 845 million in 2014. Malayan insurance received its certificate of authority from the insurance commission (ic) on July 1, 2014, marking eight and a half decades of non-life insurance business. to sustain underwriting profitability, the company has embarked on an enterprise risk Management system in accepting business. This is to ensure that Malayan’s operation remained competitive and stable, with optimized returns for its investment portfolio. This strategy will further strengthen Malayan’s bottomline since it will guarantee that the company’s operation will continue to be viable, even when catastrophic events occur. in 2014, the international standards organization (iso) has again affirmed Malayan’s certification for quality management system with the iso 9001:2008.

12
Malayan first gained quality management certification in 2009 with the awarding of the iso 9001:2000. in 2011, Malayan insurance shifted to iso 9001:2008 in order to adopt the latest standard for a well-planned quality management system, and provide the foundation for a disciplined and well-controlled systems processes to help achieve customer satisfaction and continual improvement. Malayan is also one of the most stable non-life insurers in the country as affirmed by the latest ratings of a.M. best, covering the fiscal year 2014. in its report, best affirmed Malayan’s financial strength rating of b++ (good) and its issuer credit rating is retained at “bbb+” with a stable outlook for both categories.
GivinG Back
in 2014, Malayan insurance continued to support various causes as part of the company’s corporate social responsibility (csr) program. The company has actively supported the Yuchengco group of companies (Ygc) Forest program wherein Malayan sends its representatives to the mountains of sierra Madre, in tanay, rizal, for a
quarterly ocular visit. This has been undertaken with representatives of the other Ygc companies to check the trees planted by Ygc volunteers since 2011. Malayan’s csr initiatives also cover health and nutrition through the Handog project. every year since 2013, Malayan’s employee and Ygc volunteers have gone to brg. san andres, tanay, rizal to offer free medical and dental checkups, and distribute much needed medicines and other supplies. Malayan’s successful year was further highlighted by the equally impressive results achieved by its subsidiaries. the First nationwide assurance corporation (Fnac)
Fnac performed well in the year in review even as the company recorded a 14.5 percent (14.5%) growth in its net premiums earned (npe), from php 113.45 million in 2013 to php 129.90 million in 2014. The increase in npe was mainly due to the growth of Fnac’s fire business (20%) and public utility consortium business (25%). while the company’s net income increased, its net insurance contract benefits and claims and other
MICO San Pablo Branch 35th Anniversary
MICO settles claim of Pryce Water Malayan settles claim of Euromed

annual report 2014 13
continuing our timeless excellence
FNAC rewards top referrors with a trip to Misibis Bay BAC teams up with BPI Globe BanKo
underwriting expenses decreased by php 3.4 million and php 1.1 million respectively, mainly due to lower expenses paid on its public utility consortium business. Fnac’s general and administrative expenses increased by 25.6 percent (25.6%) or php 14.3 million, mainly due to increased marketing activities in 2014. investments made in 2014 yielded positive results which saw the company’s investment and other income up by 6.5 percent (6.5%) or php 2.3 million. amidst these financial highlights, Fnac’s gpw contracted by 5 percent (5%), from php 136 million in 2014 versus php 143 million in 2013. despite this contraction in the topline, Fnac’s direct and bancassurance business grew 17 percent (17%) as premium production from its bank partners increased. taken altogether, the company’s net income of php 15.58 million is 28.75 percent (28.75%) higher than the php 12.1 million recorded in 2013. as a result, Fnac’s 2014 financial position was stronger at the end of 2014 with total assets registering an increase of 2.6 percent (2.6%) up from the php 1.237 billion in 2013 to php 1.269 billion at year end.
Bankers assurance corporation (Bac)
bankers assurance corporation (bac) made a remarkable run in 2014, breaching the hundred-million-peso mark by posting a 63 percent (63%) growth performance in its gross premiums written (gpw). bac ’s gpw of php 107.86 million was php 41.7 million higher compared to the actual premium production of php 66.16 million recorded in the prior year.
This growth was mainly attributed to the overseas Filipino workers (oFw) pinoy assist business, which was launched in 2013, but only gained more traction in 2014 as bac vigorously expanded its sales channels. new partnerships were also forged with numerous Microfinance institutions (MFis) and Mutual benefit associations (Mbas), which generated microinsurance business for bac in 2014. Microinsurance is a key advocacy of the insurance commission (ic) and with strong collaborations between the public sector and commercial insurers such as bac, microinsurance in the philippines presently has an outreach of 27 million low income Filipinos placing it at the forefront in the east asian region. about 19 insurers and 17 Mbas drive the country’s microinsurance sector, with 80 various microinsurance products approved by the ic as of 2014. a number of co-branded products for microinsurance partnerships were developed by bac to address the risk priorities of microinsurance clients and members of these partner organizations. due to these strategies, bac ’s premiums earned for 2014 posted an even larger increase of php 61.54 million or a 4290 percent (4290%) increase compared to php -1.47 million recorded in 2013.

14
consolidated assets
Mico equities, inc. and subsidiaries
insurance receivables
investMent properties
otHer assets
casH and sHort terMs investMent
Financial assets
54%
1%2%
4%
39%
14

annual report 2014 15
continuing our timeless excellence
insurance risk portfolio
Mico equities, inc. and subsidiaries
Fire
Marine
personal accident
bonds
engineering
Motor
casualtY
50.4%
8.6%
10.4%
1.8%
7.0%
15.5%
6.3%
annual report 2014 15

16
Mico equities, inc. and suBsidiaries
Statement of Management Responsibility for Financial Statement
Independent Auditors’ Report
The management of Mico equities, inc. and subsidiaries is responsible for the preparation and fair presentation
of the consolidated financial statements for the years ended december 31, 2014 and 2013, including the additional
components attached therein, in accordance with philippine Financial reporting standards. This responsibility includes
designing and implementing internal controls relevant to the preparation and fair presentation of the consolidated
financial statements that are free from material misstatement, whether due to fraud or error, selecting and applying
appropriate accounting policies, and making accounting estimates that are reasonable in the circumstances.
The board of directors reviews and approved the consolidated financial statements and submits the same to the
stockholders.
SyCip, Gorres, Velayo & Co., the independent auditors, appointed by the stockholders has examined the consolidated
financial statements of the company in accordance with philippine standard on auditing, and in its report to the
stockholders, has expressed its opinion on the fairness of presentation upon completion of such examination.
helen Y. deechairperson
Frederick p. pinedachief Financial officer
Yvonne s. YuchenGcopresident
aleGria r. castrocontroller

annual report 2014 17
continuing our timeless excellence
Mico equities, inc. and suBsidiaries
Independent Auditors’ Report
The stockholders and the board of directors
Mico equities, inc.
4th Floor, Yuchengco building
484 quintin paredes street
binondo, Manila
we have audited the accompanying consolidated financial statements of Mico equities, inc. and subsidiaries, which
comprise the consolidated statements of financial position as at december 31, 2014 and 2013, and the consolidated
statements of income, statements of comprehensive income, statements of changes in equity and statements of cash
flows for the years then ended, and a summary of significant accounting policies and other explanatory information.
Management’s Responsibility for the Consolidated Financial Statements
Management is responsible for the preparation and fair presentation of these consolidated financial statements in
accordance with philippine Financial reporting standards, and for such internal control as management determines
is necessary to enable the preparation of consolidated financial statements that are free from material misstatement,
whether due to fraud or error.
Auditors’ Responsibility
our responsibility is to express an opinion on these consolidated financial statements based on our audits. we conducted
our audits in accordance with philippine standards on auditing. Those standards require that we comply with ethical
requirements and plan and perform the audit to obtain reasonable assurance about whether the consolidated financial
statements are free from material misstatement.
an audit involves performing procedures to obtain audit evidence about the amounts and disclosures in the consolidated
financial statements. The procedures selected depend on the auditor’s judgment, including the assessment of the risks
of material misstatement of the consolidated financial statements, whether due to fraud or error. in making those risk
assessments, the auditor considers internal control relevant to the entity’s preparation and fair presentation of the
consolidated financial statements in order to design audit procedures that are appropriate in the circumstances, but
not for the purpose of expressing an opinion on the effectiveness of the entity’s internal control. an audit also includes
evaluating the appropriateness of accounting policies used and the reasonableness of accounting estimates made by
management, as well as evaluating the overall presentation of the consolidated financial statements.
we believe that the audit evidence we have obtained is sufficient and appropriate to provide a basis for our audit
opinion.

18
Opinion
in our opinion, the consolidated financial statements present fairly, in all material respects, the financial position of
Mico equities, inc. and subsidiaries as at december 31, 2014 and 2013, and their financial performance and their cash
flows for the years then ended in accordance with philippine Financial reporting standards.
This report is intended solely for the information and use of the stockholders, board of directors and management
of Mico equities, inc. and subsidiaries and is not intended to be and should not be used by anyone other than these
specified parties.
SYCIP GORRES VELAYO & CO.
Michael c. sabado
partner
cpa certificate no. 89336
sec accreditation no. 0664-ar-2 (group a),
March 26, 2014, valid until March 25, 2017
tax identification no. 160-302-865
bir accreditation no. 08-001998-73-2015,
February 27, 2015, valid until February 26, 2018
ptr no. 4751320, January 5, 2015, Makati city
June 26, 2015
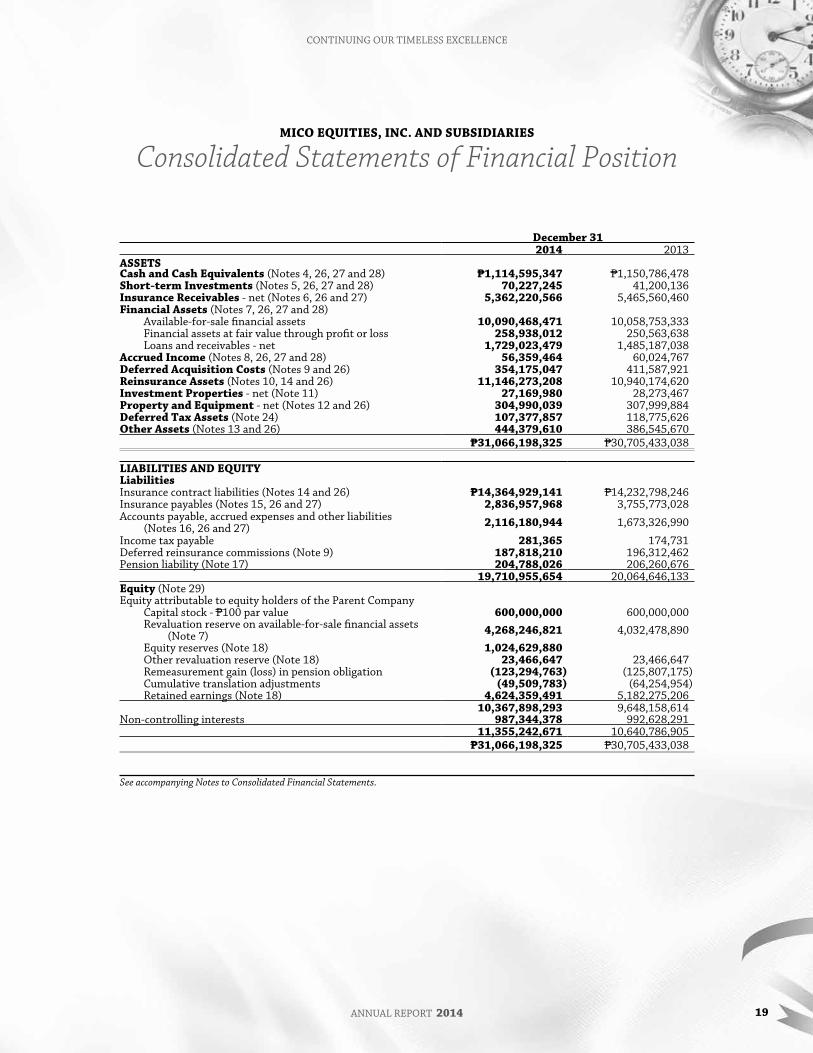
Consolidated Statements of Financial Position
annual report 2014 19
continuing our timeless excellence
Mico equities, inc. and suBsidiaries
Consolidated Statements of Financial Position
december 312014 2013
assetscash and cash equivalents (notes 4, 26, 27 and 28) p1,114,595,347 p1,150,786,478short-term investments (notes 5, 26, 27 and 28) 70,227,245 41,200,136insurance receivables - net (notes 6, 26 and 27) 5,362,220,566 5,465,560,460Financial assets (notes 7, 26, 27 and 28) available-for-sale financial assets 10,090,468,471 10,058,753,333 Financial assets at fair value through profit or loss 258,938,012 250,563,638 loans and receivables - net 1,729,023,479 1,485,187,038accrued income (notes 8, 26, 27 and 28) 56,359,464 60,024,767deferred acquisition costs (notes 9 and 26) 354,175,047 411,587,921reinsurance assets (notes 10, 14 and 26) 11,146,273,208 10,940,174,620investment properties - net (note 11) 27,169,980 28,273,467property and equipment - net (notes 12 and 26) 304,990,039 307,999,884deferred tax assets (note 24) 107,377,857 118,775,626other assets (notes 13 and 26) 444,379,610 386,545,670
p31,066,198,325 p30,705,433,038
liaBilities and equitYliabilitiesinsurance contract liabilities (notes 14 and 26) p14,364,929,141 p14,232,798,246insurance payables (notes 15, 26 and 27) 2,836,957,968 3,755,773,028accounts payable, accrued expenses and other liabilities
(notes 16, 26 and 27) 2,116,180,944 1,673,326,990
income tax payable 281,365 174,731deferred reinsurance commissions (note 9) 187,818,210 196,312,462pension liability (note 17) 204,788,026 206,260,676
19,710,955,654 20,064,646,133equity (note 29)equity attributable to equity holders of the parent company
capital stock - p100 par value 600,000,000 600,000,000revaluation reserve on available-for-sale financial assets (note 7) 4,268,246,821 4,032,478,890equity reserves (note 18) 1,024,629,880other revaluation reserve (note 18) 23,466,647 23,466,647remeasurement gain (loss) in pension obligation (123,294,763) (125,807,175)cumulative translation adjustments (49,509,783) (64,254,954)retained earnings (note 18) 4,624,359,491 5,182,275,206
10,367,898,293 9,648,158,614non-controlling interests 987,344,378 992,628,291
11,355,242,671 10,640,786,905p31,066,198,325 p30,705,433,038
See accompanying Notes to Consolidated Financial Statements.

20
Mico equities, inc. and suBsidiaries
Consolidated Statements of Income Consolidated Statements of Comprehensive Income
Years ended december 312014 2013
incoMegross premiums earned p7,926,085,860 p7,057,609,476reinsurers’ share of gross premiums earned 5,092,989,225 4,530,604,433net premiums earned (notes 14 and 19) 2,833,096,635 2,527,005,043
investment and other income - net (note 20) 784,388,825 843,285,394commission income (note 9) 385,203,764 275,137,883other income 1,169,592,589 1,118,423,277total income 4,002,689,224 3,645,428,320
BeneFits, claiMs and eXpensesgross insurance contract benefits and claims paid
(notes 14 and 21) 4,037,246,750 2,778,620,370reinsurers’ share of gross insurance contract benefits
and claims paid (notes 14 and 21) (2,471,028,579) (1,282,950,798)gross change in insurance contract liabilities (note 21) 215,816,450 5,165,992,550reinsurers’ share of gross change in insurance contract
liabilities (note 21) (353,698,147) (5,137,960,922)net insurance contract benefits and claims 1,428,336,474 1,523,701,200commission expense (note 9) 1,032,981,646 926,841,984general and administrative expenses (note 22) 1,077,216,132 948,464,814other underwriting expense (note 9) 140,836,423 114,541,363investment and other expense (note 20) 45,630,348 26,661,325other expenses 2,296,664,549 2,016,509,486total benefits, claims and other expenses 3,725,001,023 3,540,210,686
incoMe BeFore incoMe taX 277,688,201 105,217,634
provision For incoMe taX (note 24) 148,535,859 34,986,340
net incoMe (note 25) p129,152,342 p70,231,294
attributable to: equity holders of the parent company p92,084,285 p64,693,686 non-controlling interests 37,068,057 5,537,608
p129,152,342 p70,231,294
See accompanying Notes to Consolidated Financial Statements.
annual report 2014 21
continuing our timeless excellence
Mico equities, inc. and suBsidiaries
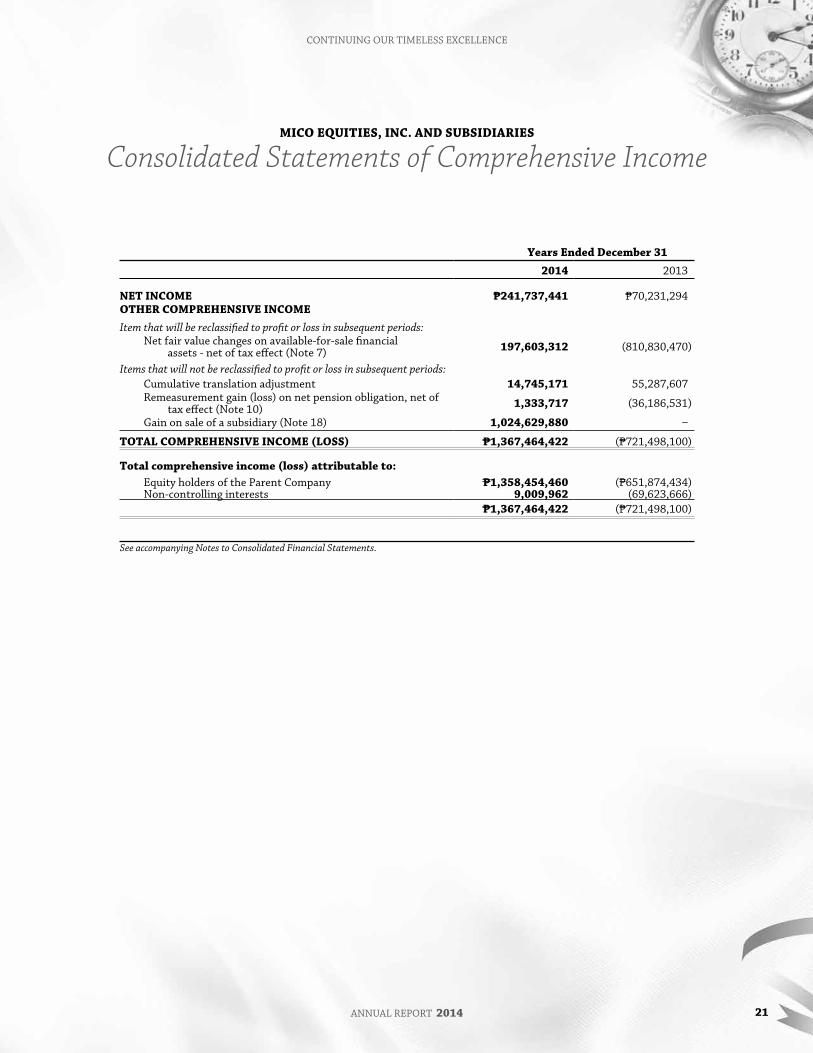
Consolidated Statements of Comprehensive Income
Years ended december 312014 2013
net incoMe p241,737,441 p70,231,294other coMprehensive incoMeItem that will be reclassified to profit or loss in subsequent periods: net fair value changes on available-for-sale financial
assets - net of tax effect (note 7) 197,603,312 (810,830,470)
Items that will not be reclassified to profit or loss in subsequent periods: cumulative translation adjustment 14,745,171 55,287,607 remeasurement gain (loss) on net pension obligation, net of
tax effect (note 10) 1,333,717 (36,186,531)
gain on sale of a subsidiary (note 18) 1,024,629,880 ‒
total coMprehensive incoMe (loss) p1,367,464,422 (p721,498,100)
total comprehensive income (loss) attributable to: equity holders of the parent company p1,358,454,460 (p651,874,434) non-controlling interests 9,009,962 (69,623,666)
p1,367,464,422 (p721,498,100)
See accompanying Notes to Consolidated Financial Statements.
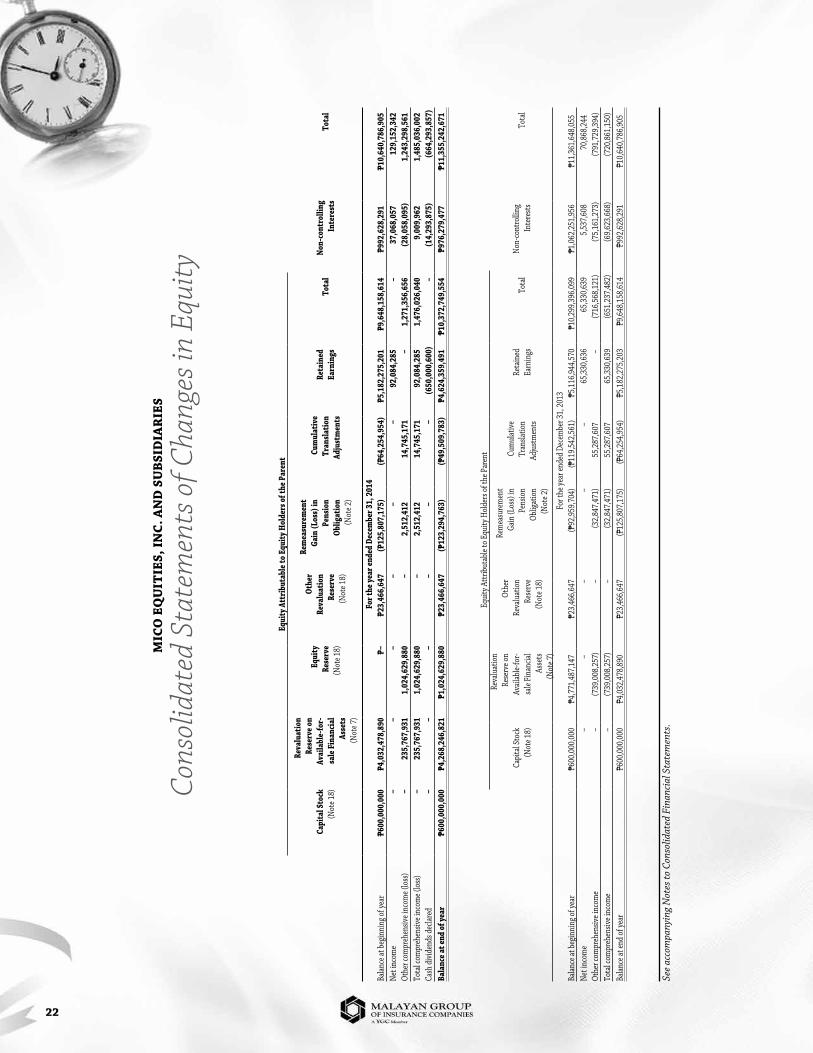
22
Mic
o e
qu
itie
s, in
c. a
nd
su
Bsi
dia
rie
s
Cons
olid
ated
Sta
tem
ents
of C
hang
es in
Equ
ity
equi
ty a
ttrib
utab
le to
equ
ity h
olde
rs of
the p
aren
t
capi
tal s
tock
(not
e 18)
reva
luat
ion
rese
rve o
nav
aila
ble-
for-
sale
Fina
ncia
las
sets
(n
ote 7
)
equi
ty
rese
rve
(not
e 18)
othe
r re
valu
atio
n re
serv
e (n
ote 1
8)
rem
easu
rem
ent
Gain
(los
s) in
pe
nsio
n ob
ligat
ion
(not
e 2)
cum
ulat
ive
tran
slatio
nad
just
men
ts
reta
ined
earn
ings
tota
lno
n-co
ntro
lling
inte
rest
sto
tal
For t
he ye
ar en
ded
dece
mbe
r 31,
201
4ba
lance
at be
ginni
ng of
year
p 600
,000
,000
p4,0
32,4
78,8
90p‒
p23,
466,
647
(p12
5,80
7,17
5)(p
64,2
54,9
54)
p5,1
82,2
75,2
01p9
,648
,158
,614
p992
,628
,291
p10,
640,
786,
905
net i
ncom
e‒
‒‒
‒‒
‒92
,084
,285
–37
,068
,057
129,
152,
342
othe
r com
preh
ensiv
e inc
ome (
loss
)‒
235,
767,
931
1,02
4,62
9,88
0‒
2,51
2,41
214
,745
,171
‒1,
271,
356,
656
(28,
058,
095)
1,24
3,29
8,56
1to
tal c
ompr
ehen
sive i
ncom
e (lo
ss)
‒23
5,76
7,93
11,
024,
629,
880
‒2,
512,
412
14,7
45,1
7192
,084
,285
1,47
6,02
6,04
09,
009,
962
1,48
5,03
6,00
2ca
sh di
viden
ds de
clare
d‒
‒‒
‒‒
‒(6
50,0
00,6
00)
–(1
4,29
3,87
5)(6
64,2
93,8
57)
Bala
nce a
t end
of ye
arp 6
00,0
00,0
00p4
,268
,246
,821
p1,0
24,6
29,8
80p2
3,46
6,64
7(p
123,
294,
763)
(p49
,509
,783
)p4
,624
,359
,491
p10,
372,
749,
554
p976
,279
,477
p11,
355,
242,
671
equi
ty a
ttrib
utab
le to
equ
ity H
olde
rs of
the p
aren
t
capi
tal s
tock
(n
ote 1
8)
reva
luat
ion
rese
rve o
n av
ailab
le-fo
r- sa
le Fi
nanc
ial
asse
ts
(not
e 7)
othe
r re
valu
atio
n re
serv
e(n
ote 1
8)
rem
easu
rem
ent
gain
(los
s) in
pe
nsio
nob
ligat
ion
(not
e 2)
cum
ulat
ive
tran
slatio
n ad
just
men
ts
reta
ined
ea
rnin
gsto
tal
non-
cont
rolli
ng
inte
rest
sto
tal
For t
he ye
ar en
ded d
ecem
ber 3
1, 2
013
balan
ce at
begin
ning
of ye
arp 6
00,0
00,0
00p4
,771
,487
,147
p23,
466,
647
(p92
,959
,704
)(p
119,
542,
561)
p5,1
16,9
44,5
70p1
0,29
9,39
6,09
9p1
,062
,251
,956
p11,
361,
648,
055
net i
ncom
e–
––
––
65,3
30,6
3665
,330
,639
5,53
7,60
870
,868
,244
othe
r com
preh
ensiv
e inc
ome
–(7
39,0
08,2
57)
–(3
2,84
7,47
1)55
,287
,607
–(7
16,5
68,1
21)
(75,
161,
273)
(791
,729
,394
)to
tal c
ompr
ehen
sive i
ncom
e –
(739
,008
,257
)–
(32,
847,
471)
55,2
87,6
0765
,330
,639
(651
,237
,482
)(6
9,62
3,66
8)(7
20,8
61,1
50)
balan
ce at
end o
f yea
rp6
00,0
00,0
00p4
,032
,478
,890
p23,
466,
647
(p12
5,80
7,17
5)(p
64,2
54,9
54)
p5,1
82,2
75,2
03p9
,648
,158
,614
p992
,628
,291
p10,
640,
786,
905
See
acco
mpa
nyin
g N
otes
to C
onso
lidat
ed F
inan
cial
Sta
tem
ents
.
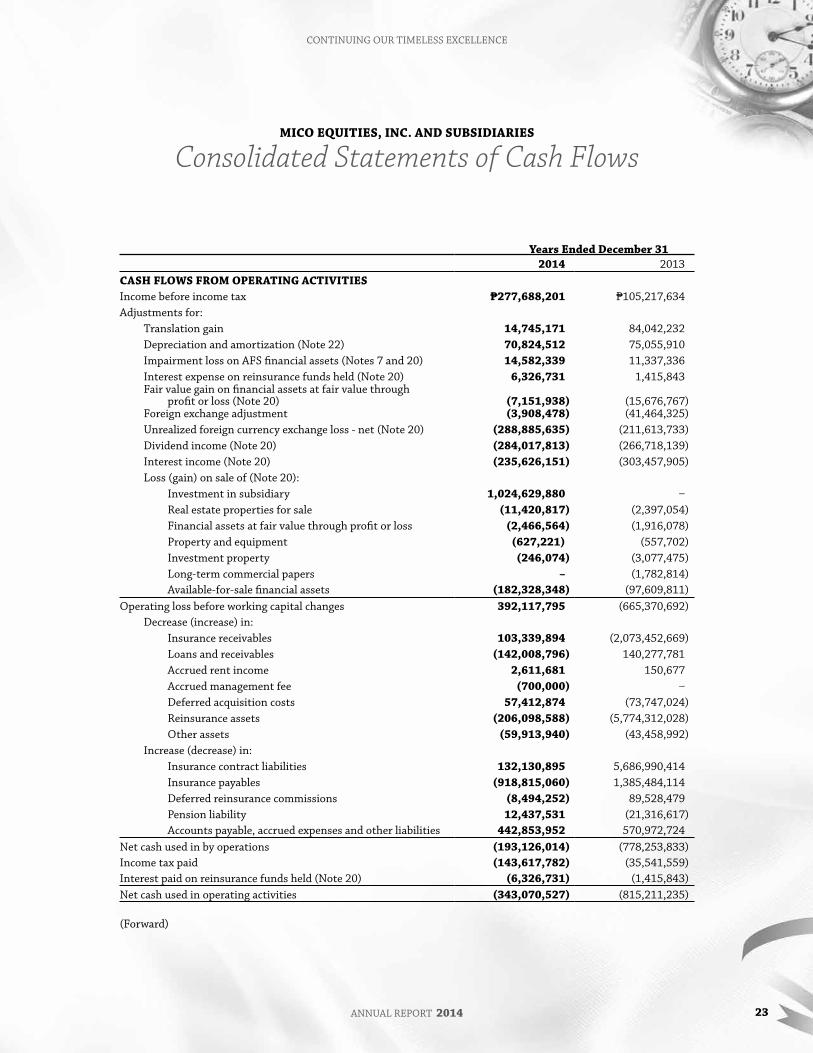
Consolidated Statements of Cash Flows
annual report 2014 23
continuing our timeless excellence
Mico equities, inc. and suBsidiaries
Consolidated Statements of Cash Flows
Years ended december 312014 2013
cash Flows FroM operatinG activitiesincome before income tax p277,688,201 p105,217,634adjustments for: translation gain 14,745,171 84,042,232 depreciation and amortization (note 22) 70,824,512 75,055,910 impairment loss on aFs financial assets (notes 7 and 20) 14,582,339 11,337,336 interest expense on reinsurance funds held (note 20) 6,326,731 1,415,843 Fair value gain on financial assets at fair value through profit or loss (note 20) (7,151,938) (15,676,767) Foreign exchange adjustment (3,908,478) (41,464,325) unrealized foreign currency exchange loss - net (note 20) (288,885,635) (211,613,733) dividend income (note 20) (284,017,813) (266,718,139) interest income (note 20) (235,626,151) (303,457,905) loss (gain) on sale of (note 20):
investment in subsidiary 1,024,629,880 ‒real estate properties for sale (11,420,817) (2,397,054)
Financial assets at fair value through profit or loss (2,466,564) (1,916,078) property and equipment (627,221) (557,702) investment property (246,074) (3,077,475) long-term commercial papers – (1,782,814)
available-for-sale financial assets (182,328,348) (97,609,811)operating loss before working capital changes 392,117,795 (665,370,692) decrease (increase) in: insurance receivables 103,339,894 (2,073,452,669) loans and receivables (142,008,796) 140,277,781 accrued rent income 2,611,681 150,677 accrued management fee (700,000) ‒ deferred acquisition costs 57,412,874 (73,747,024) reinsurance assets (206,098,588) (5,774,312,028)
other assets (59,913,940) (43,458,992) increase (decrease) in: insurance contract liabilities 132,130,895 5,686,990,414 insurance payables (918,815,060) 1,385,484,114 deferred reinsurance commissions (8,494,252) 89,528,479 pension liability 12,437,531 (21,316,617) accounts payable, accrued expenses and other liabilities 442,853,952 570,972,724net cash used in by operations (193,126,014) (778,253,833)income tax paid (143,617,782) (35,541,559)interest paid on reinsurance funds held (note 20) (6,326,731) (1,415,843)net cash used in operating activities (343,070,527) (815,211,235)
(Forward)

24
Years ended december 312013 2012
cash Flows FroM investinG activitiesproceeds from sale or maturities of: available-for-sale financial assets (note 7) p1,426,270,926 p1,917,213,735 Financial assets at fair value through profit or loss (note 7) 67,878,821 188,826,462 long-term commercial papers (note 7) 62,300,000 99,480,979 investment properties (note 11) 1,242,824 95,010,191 short-term investments 41,200,136 38,021,248
real estate properties for sale 13,500,817 2,962,054 property and equipment (note 12) 2,718,462 945,123interest received 248,611,049 298,456,078dividends received 280,254,738 267,058,637acquisitions of: available-for-sale financial assets (note 7) (896,724,943) (1,682,261,776) long-term commercial papers (note 7) (164,127,645) (445,995,508) Financial assets at fair value through profit or loss (note 7) (64,793,753) (190,843,805) property and equipment (note 12) (69,798,850) (62,775,804) short-term investments (70,227,245) (41,200,136) investment properties (note 11) ‒ (11,411,830)
computer software (note 13) ‒ (1,765,290)net cash provided by (used in) investing activities 878,305,337 471,720,358cash Flows FroM FinancinG activitiespayments of dividends (note 18) (607,096,150) ‒cash used in financing activities (607,096,150) ‒eFFect oF eXchanGe rate chanGes on cash and cash
equivalents 35,670,209 24,920,410net decrease in cash and cash equivalents (36,191,131) (318,570,467)cash and cash equivalents at BeGinninG oF Year
(note 4) 1,150,786,478 1,469,356,945cash and cash equivalents at end oF Year p1,114,595,347 p1,150,786,478
See accompanying Notes to Consolidated Financial Statements.
Notes to Consolidated Financial Statements
annual report 2014 25
continuing our timeless excellence
Mico equities, inc. and suBsidiaries
Notes to Consolidated Financial Statements
1. corporate information
Mico equities, inc. (the parent company) is a domestic corporation which was incorporated and registered with the philippine securities and exchange commission (sec) on June 28, 1972 to invest in nonlife insurance companies.
The parent company’s ultimate parent is pan Malayan Management and investment corporation (pMMic) with registered office address at 48th Floor, Yuchengco tower, rcbc plaza, 6819 ayala avenue, Makati city.
The consolidated financial statements comprise the financial statements of the parent company and the following wholly and majority-owned subsidiaries:
place of percentage of ownershipincorporation 2014 2013
Malayan insurance co., inc. (Mico) and subsidiaries: philippines 80.0% 88.7% bankers assurance corporation (bac) philippines 100.0 100.0 The First nationwide assurance corporation (Fnac) philippines 54.7 54.7Malayan international insurance corporation, limited (Miic)
and subsidiaries: bahamas 100.0 100.0
Malayan insurance company (H.k.) limited Hong kong 100.0 100.0asia-pac reinsurance company, limited british virgin islands 100.0 100.0Fnac philippines 45.3 45.3Malayan securities corporation (Msc) philippines 100.0 100.0
Mico and subsidiaries is engaged in the nonlife insurance business dealing with all kinds of insurance such as fire, marine, bond, motor car, personal accident, miscellaneous casualty and engineering, except life insurance.
Miic and subsidiaries and asia-pac reinsurance company, limited are engaged in the reinsurance of nonlife insurance business.
Msc is incorporated to invest in equity and debt securities.
pursuant to a special resolution passed on the special board of director’s meeting of the parent company, on september 18, 2014, the parent company is authorized to sell its 737,600 common shares of stock in Malayan insurance company, inc. to tokio Marine asia pte, ltd. reducing the percentage of ownership to 80% without loss of control.
The accompanying consolidated financial statements of Mico equities, inc. and subsidiaries (the group) were approved and authorized for issue by the board of directors (bod) on June 26, 2015.
2. summary of significant accounting policies
basis of preparationThe accompanying consolidated financial statements of the group have been prepared on a historical cost basis, except for available-for-sale (aFs) financial assets which have been measured at fair value. The consolidated financial statements are measured in philippine peso (p), which is also the group’s functional and presentation currency. all values are rounded off to the nearest philippine peso values, unless otherwise indicated.
statement of complianceThe accompanying consolidated financial statements of the group have been prepared in compliance with philippine Financial reporting standards (pFrs).
basis of consolidationThe consolidated financial statements comprise the financial statements of the group as at and for the years ended december 31, 2014 and 2013.
subsidiaries are fully consolidated from the date of acquisition, being the date on which the group obtains control, and continue to be consolidated until the date when such control ceases. The financial statements of the subsidiaries are prepared for the same reporting period as the parent company, using consistent accounting policies. all intra-group balances, transactions, unrealized gains and losses resulting from intra-group transactions and dividends are eliminated in full.
non-controlling interests (ncis) pertains to the equity in a subsidiary not attributable, directly or indirectly to the parent company. any equity instruments issued by a subsidiary that are not owned by the parent company are ncis.

26
ncis represent the portion of profit or loss and net assets in subsidiaries not wholly-owned and are presented separately in the consolidated statements of income, consolidated statements of comprehensive income, consolidated statements of changes in equity and consolidated statements of financial position, separately from the parent company’s equity.
losses within a subsidiary are attributed to the nci even if that results in a deficit balance.
a change in the ownership interest of a subsidiary, without a loss of control, is accounted for as an equity transaction. any difference between the amount by which the ncis are adjusted and the fair value of the consideration paid or received is recognized directly in equity as “equity reserve” and attributed to the owners of the parent company.
if the parent company loses control over a subsidiary it:
· derecognizes the assets (including goodwill) and liabilities of the subsidiary· derecognizes the carrying amount of any non-controlling interest· derecognizes the cumulative translation differences recorded in equity· recognizes the fair value of the consideration received· recognizes the fair value of any investment retained· recognizes any surplus or deficit in profit or loss· reclassifies the parent’s share of components previously recognized in other comprehensive income to profit or loss or
retained earnings, as appropriate.
changes in accounting policiesThe accounting policies adopted are consistent with those of the previous financial years except for the adoption of the following new and amended philippine Financial reporting standards (pFrs) and philippine interpretations of international Financial reporting interpretation committee (iFric) interpretations which became effective beginning January 1, 2014. except as otherwise stated, the adoption of these new and amended standards and philippine interpretations did not have any impact on the consolidated financial statements.
· investment entities (amendments to pFrs 10, Consolidated Financial Statements, pFrs 12, Disclosure of Interests in Other Entities, and pas 27, Separate Financial Statements)
These amendments provided an exception to the consolidation requirement for entities that meet the definition of an investment entity under pFrs 10. The exception to consolidation requires investment entities to account for subsidiaries at fair value through profit or loss. The amendments must be applied retrospectively, subject to certain transition relief. These amendments have no impact to the group’s financial position or performance.
· pas 32, Financial Instruments: Presentation - Offsetting Financial Assets and Financial Liabilities These amendments clarified the meaning of ‘currently has a legally enforceable right to set-off’ and the criteria for non-
simultaneous settlement mechanisms of clearing houses to qualify for offsetting and are applied retrospectively. The amendments affect presentation only and have no impact on the group’s financial position or performance.
· pas 39, Financial instruments: Recognition and Measurement - Novation of Derivatives and Continuation of Hedge Accounting (Amendments)
These amendments provided relief from discontinuing hedge accounting when novation of a derivative designated as a hedging instrument meets certain criteria and retrospective application is required. These amendments have no impact on the group as the group has no derivatives during the current or prior periods.
· pas 36, Impairment of Assets - Recoverable Amount Disclosures for Non-Financial Assets (Amendments) These amendments removed the unintended consequences of pFrs 13, Fair Value Measurement, on the disclosures required
under pas 36. in addition, these amendments required disclosure of the recoverable amounts for assets or cash-generating units (cgus) for which impairment loss has been recognized or reversed during the period. The application of these amendments has no impact on the group’s consolidated financial statements.
· philippine interpretation iFric 21, Levies philippine interpretation iFric 21 clarified that an entity recognizes a liability for a levy when the activity that triggers
payment, as identified by the relevant legislation, occurs. For a levy that is triggered upon reaching a minimum threshold, the interpretation clarifies that no liability should be anticipated before the specified minimum threshold is reached. retrospective application is required for philippine interpretation iFric 21. This philippine interpretation has no impact on the group as it has applied the recognition principles under pas 37, Provisions, Contingent Liabilities and Contingent Assets, consistent with the requirements of philippine interpretation iFric 21 in prior years.
· Annual Improvements to PFRSs (2010 - 2012 cycle) in the 2010 - 2012 annual improvements cycle, seven amendments to six standards were issued, which included an amendment
to pFrs 13, Fair Value Measurement. The amendment to pFrs 13 is effective immediately and it clarified that short-term receivables and payables with no stated interest rates can be measured at invoice amounts when the effect of discounting is immaterial. This amendment has no impact on the group’s consolidated financial statements.

annual report 2014 27
continuing our timeless excellence
· Annual Improvements to PFRSs (2011 - 2013 cycle) in the 2011 - 2013 annual improvements cycle, four amendments to four standards were issued, which included an amendment
to pFrs 1, First-time Adoption of Philippine Financial Reporting Standards–First-time Adoption of PFRS. The amendment to pFrs 1 is effective immediately. it clarified that an entity may choose to apply either a current standard or a new standard that is not yet mandatory, but permits early application, provided either standard is applied consistently throughout the periods presented in the entity’s first pFrs financial statements. This amendment has no impact on the group as it is not a first-time pFrs adopter.
Future changes accounting policiesThe group will adopt the following new and amended standards and philippine interpretations enumerated below when these become effective. except as otherwise indicated, the group does not expect the adoption of these new and amended pFrs and philippine interpretations to have significant impact on the consolidated financial statements.
· pFrs 9, Financial Instruments: Classification and Measurement pFrs 9 (2010 version) reflects the first phase on the replacement of pas 39 and applies to the classification and measurement
of financial assets and liabilities as defined in pas 39, Financial Instruments: Recognition and Measurement. pFrs 9 requires all financial assets to be measured at fair value at initial recognition. a debt financial asset may, if the fair value option (Fvo) is not invoked, be subsequently measured at amortized cost if it is held within a business model that has the objective to hold the assets to collect the contractual cash flows and its contractual terms give rise, on specified dates, to cash flows that are solely payments of principal and interest on the principal outstanding. all other debt instruments are subsequently measured at fair value through profit or loss. all equity financial assets are measured at fair value either through other comprehensive income (oci) or profit or loss. equity financial assets held for trading must be measured at fair value through profit or loss. For Fvo liabilities, the amount of change in the fair value of a liability that is attributable to changes in credit risk must be presented in oci. The remainder of the change in fair value is presented in profit or loss, unless presentation of the fair value change in respect of the liability’s credit risk in oci would create or enlarge an accounting mismatch in profit or loss. all other pas 39 classification and measurement requirements for financial liabilities have been carried forward into pFrs 9, including the embedded derivative separation rules and the criteria for using the Fvo. The adoption of the first phase of pFrs 9 will have an effect on the classification and measurement of the group’s financial assets, but will potentially have no impact on the classification and measurement of financial liabilities.
pFrs 9 (2010 version) is effective for annual periods beginning on or after January 1, 2015. This mandatory adoption date was moved to January 1, 2018 when the final version of pFrs 9 was adopted by the philippine Financial reporting standards council (Frsc). such adoption, however, is still for approval by the board of accountancy (boa).
· philippine interpretation iFric 15, agreements for the construction of real estate This philippine interpretation covers accounting for revenue and associated expenses by entities that undertake the
construction of real estate directly or through subcontractors. The interpretation requires that revenue on construction of real estate be recognized only upon completion, except when such contract qualifies as construction contract to be accounted for under pas 11 or involves rendering of services in which case revenue is recognized based on stage of completion. contracts involving provision of services with the construction materials and where the risks and reward of ownership are transferred to the buyer on a continuous basis will also be accounted for based on stage of completion. The sec and the Frsc have deferred the effectivity of this interpretation until the final revenue standard is issued by the international accounting standards board (iasb) and an evaluation of the requirements of the final revenue standard against the practices of the philippine real estate industry is completed.
The following new standards and amendments issued by the international accounting standards board (“iasb”) were already adopted by the Frsc but are still for approval of the boa:
Effective in 2015
· pas 19, Employee Benefits - Defined Benefit Plans: Employee Contributions (Amendments) pas 19 requires an entity to consider contributions from employees or third parties when accounting for defined benefit
plans. where the contributions are linked to service, they should be attributed to periods of service as a negative benefit. These amendments clarify that, if the amount of the contributions is independent of the number of years of service, an entity is permitted to recognize such contributions as a reduction in the service cost in the period in which the service is rendered, instead of allocating the contributions to the periods of service. This amendment is effective for annual periods beginning on or after January 1, 2015. it is not expected that this amendment would be relevant to the group, since it has no defined benefit plans with contributions from employees or third parties.
annual improvements to pFrss 2010 - 2012 cycleThe annual improvements to pFrss (2010 - 2012 cycle) are effective for annual periods beginning on or after January 1, 2015 and are not expected to have a material impact on the group.
· pFrs 2, Share-based Payment – Definition of Vesting Condition This improvement is applied prospectively and clarifies various issues relating to the definitions of performance and service
conditions which are vesting conditions, including:

28
• a performance condition must contain a service condition• a performance target must be met while the counterparty is rendering service• a performance target may relate to the operations or activities of an entity, or to those of another entity in the same group• a performance condition may be a market or non-market condition• if the counterparty, regardless of the reason, ceases to provide service during the vesting period, the service condition is
not satisfied.
· pFrs 3, Business Combinations – Accounting for Contingent Consideration in a Business Combination The amendment is applied prospectively for business combinations for which the acquisition date is on or after July 1, 2014.
it clarifies that a contingent consideration that is not classified as equity is subsequently measured at fair value through profit or loss whether or not it falls within the scope of pas 39, Financial Instruments: Recognition and Measurement (or pFrs 9, Financial Instruments, if early adopted). The group shall consider this amendment for future business combinations.
· pFrs 8, Operating Segments – Aggregation of Operating Segments and Reconciliation of the Total of the Reportable Segments’ Assets to the Entity’s Assets
The amendments are applied retrospectively and clarify that:· an entity must disclose the judgments made by management in applying the aggregation criteria in the standard, including
a brief description of operating segments that have been aggregated and the economic characteristics (e.g., sales and gross margins) used to assess whether the segments are ‘similar’.
· The reconciliation of segment assets to total assets is only required to be disclosed if the reconciliation is reported to the chief operating decision maker, similar to the required disclosure for segment liabilities.
· pas 16, Property, Plant and Equipment, and pas 38, Intangible Assets – Revaluation Method – Proportionate Restatement of Accumulated Depreciation and Amortization
The amendment is applied retrospectively and clarifies in pas 16 and pas 38 that the asset may be revalued by reference to the observable data on either the gross or the net carrying amount. in addition, the accumulated depreciation or amortization is the difference between the gross and carrying amounts of the asset.
· pas 24, Related Party Disclosures – Key Management Personnel The amendment is applied retrospectively and clarifies that a management entity, which is an entity that provides key
management personnel services, is a related party subject to the related party disclosures. in addition, an entity that uses a management entity is required to disclose the expenses incurred for management services.
annual improvements to pFrss 2011 - 2013 cycleThe annual improvements to pFrss (2011 - 2013 cycle) are effective for annual periods beginning on or after January 1, 2015 and are not expected to have a material impact on the group.
· pFrs 3, Business Combinations - Scope Exceptions for Joint Arrangements The amendment is applied prospectively and clarifies the following regarding the scope exceptions within pFrs 3:
· Joint arrangements, not just joint ventures, are outside the scope of pFrs 3.· This scope exception applies only to the accounting in the financial statements of the joint arrangement itself.
· pFrs 13, Fair Value Measurement - Portfolio Exception The amendment is applied prospectively and clarifies that the portfolio exception in pFrs 13 can be applied not only to
financial assets and financial liabilities, but also to other contracts within the scope of pas 39.
· pas 40, Investment Property The amendment is applied prospectively and clarifies that pFrs 3, and not the description of ancillary services in pas 40, is
used to determine if the transaction is the purchase of an asset or business combination. The description of ancillary services in pas 40 only differentiates between investment property and owner-occupied property (i.e., property, plant and equipment).
Effective in 2016
· pas 16, Property, Plant and Equipment, and pas 38, Intangible Assets – Clarification of Acceptable Methods of Depreciation and Amortization (amendments)
The amendments clarify the principle in pas 16 and pas 38 that revenue reflects a pattern of economic benefits that are generated from operating a business (of which the asset is part) rather than the economic benefits that are consumed through use of the asset. as a result, a revenue-based method cannot be used to depreciate property, plant and equipment and may only be used in very limited circumstances to amortize intangible assets. The amendments are effective prospectively for annual periods beginning on or after January 1, 2016, with early adoption permitted. These amendments are not expected to have any impact to the group since it has no intangible assets.
· pas 16, Property, Plant and Equipment, and pas 41, Agriculture – Bearer Plants (amendments) The amendments change the accounting requirements for biological assets that meet the definition of bearer plants. under
the amendments, biological assets that meet the definition of bearer plants will no longer be within the scope of pas 41. instead, pas 16 will apply. after initial recognition, bearer plants will be measured under pas 16 at accumulated cost (before

annual report 2014 29
continuing our timeless excellence
maturity) and using either the cost model or revaluation model (after maturity). The amendments also require that produce that grows on bearer plants will remain in the scope of pas 41 measured at fair value less costs to sell. For government grants related to bearer plants, pas 20, Accounting for Government Grants and Disclosure of Government Assistance, will apply. The amendments are retrospectively effective for annual periods beginning on or after January 1, 2016, with early adoption permitted. These amendments are not expected to have any impact to the group as the group does not have any bearer plants.
· pas 27, Separate Financial Statements – Equity Method in Separate Financial Statements (amendments) The amendments will allow entities to use the equity method to account for investments in subsidiaries, joint ventures and
associates in their separate financial statements. entities already applying pFrs and electing to change to the equity method in its separate financial statements will have to apply that change retrospectively. For first-time adopters of pFrs electing to use the equity method in its separate financial statements, they will be required to apply this method from the date of transition to pFrs. The amendments are effective for annual periods beginning on or after January 1, 2016, with early adoption permitted. These amendments will not have any impact on the group’s consolidated financial statements.
· pFrs 10, Consolidated Financial Statements and pas 28, Investments in Associates and Joint Ventures – sale or contribution of assets between an investor and its associate or Joint venture
These amendments address an acknowledged inconsistency between the requirements in pFrs 10 and those in pas 28 (2011) in dealing with the sale or contribution of assets between an investor and its associate or joint venture. The amendments require that a full gain or loss is recognized when a transaction involves a business (whether it is housed in a subsidiary or not). a partial gain or loss is recognized when a transaction involves assets that do not constitute a business, even if these assets are housed in a subsidiary. These amendments are effective from annual periods beginning on or after 1 January 2016.
· pFrs 11, Joint Arrangements – Accounting for Acquisitions of Interests in Joint Operations (amendments) The amendments to pFrs 11 require that a joint operator accounting for the acquisition of an interest in a joint operation,
in which the activity of the joint operation constitutes a business must apply the relevant pFrs 3 principles for business combinations accounting. The amendments also clarify that a previously held interest in a joint operation is not remeasured on the acquisition of an additional interest in the same joint operation while joint control is retained. in addition, a scope exclusion has been added to pFrs 11 to specify that the amendments do not apply when the parties sharing joint control, including the reporting entity, are under common control of the same ultimate controlling party.
The amendments apply to both the acquisition of the initial interest in a joint operation and the acquisition of any additional interests in the same joint operation and are prospectively effective for annual periods beginning on or after January 1, 2016, with early adoption permitted. These amendments are does not have any impact to the group.
· pFrs 14, Regulatory Deferral Accounts pFrs 14 is an optional standard that allows an entity, whose activities are subject to rate-regulation, to continue applying
most of its existing accounting policies for regulatory deferral account balances upon its first-time adoption of pFrs. entities that adopt pFrs 14 must present the regulatory deferral accounts as separate line items on the statement of financial position and present movements in these account balances as separate line items in the consolidated statement of profit or loss and other comprehensive income. The standard requires disclosures on the nature of, and risks associated with, the entity’s rate-regulation and the effects of that rate-regulation on its financial statements. pFrs 14 is effective for annual periods beginning on or after January 1, 2016. since the group is an existing pFrs preparer, this standard would not apply.
annual improvements to pFrss 2012 - 2014 cycleThe annual improvements to pFrss (2012 - 2014 cycle) are effective for annual periods beginning on or after January 1, 2016 and are not expected to have a material impact on the group.
· pFrs 5, Non-current Assets Held for Sale and Discontinued Operations – Changes in Methods of Disposal The amendment is applied prospectively and clarifies that changing from a disposal through sale to a disposal through
distribution to owners and vice-versa should not be considered to be a new plan of disposal, rather it is a continuation of the original plan. There is, therefore, no interruption of the application of the requirements in pFrs 5. The amendment also clarifies that changing the disposal method does not change the date of classification.
· pFrs 7, Financial Instruments: Disclosures – Servicing Contracts pFrs 7 requires an entity to provide disclosures for any continuing involvement in a transferred asset that is derecognized in
its entirety. The amendment clarifies that a servicing contract that includes a fee can constitute continuing involvement in a financial asset. an entity must assess the nature of the fee and arrangement against the guidance in pFrs 7 in order to assess whether the disclosures are required. The amendment is to be applied such that the assessment of which servicing contracts constitute continuing involvement will need to be done retrospectively. However, comparative disclosures are not required to be provided for any period beginning before the annual period in which the entity first applies the amendments.
· pFrs 7 - Applicability of the Amendments to PFRS 7 to Condensed Interim Financial Statements This amendment is applied retrospectively and clarifies that the disclosures on offsetting of financial assets and financial
liabilities are not required in the condensed interim financial report unless they provide a significant update to the information reported in the most recent annual report.

30
· pas 19, Employee Benefits – regional market issue regarding discount rate This amendment is applied prospectively and clarifies that market depth of high quality corporate bonds is assessed based on
the currency in which the obligation is denominated, rather than the country where the obligation is located. when there is no deep market for high quality corporate bonds in that currency, government bond rates must be used.
· pas 34, Interim Financial Reporting – disclosure of information ‘elsewhere in the interim financial report’ The amendment is applied retrospectively and clarifies that the required interim disclosures must either be in the interim
consolidated financial statements or incorporated by cross-reference between the interim financial statements and wherever they are included within the greater interim financial report (e.g., in the management commentary or risk report).
Effective in 2018
· pFrs 9, Financial Instruments – Hedge accounting and amendments to pFrs 9, pFrs 7 and pas 39 (2013 version) pFrs 9 (2013 version) already includes the third phase of the project to replace pas 39 which pertains to hedge accounting.
This version of pFrs 9 replaces the rules-based hedge accounting model of pas 39 with a more principles-based approach. changes include replacing the rules-based hedge effectiveness test with an objectives-based test that focuses on the economic relationship between the hedged item and the hedging instrument, and the effect of credit risk on that economic relationship; allowing risk components to be designated as the hedged item, not only for financial items but also for non-financial items, provided that the risk component is separately identifiable and reliably measurable; and allowing the time value of an option, the forward element of a forward contract and any foreign currency basis spread to be excluded from the designation of a derivative instrument as the hedging instrument and accounted for as costs of hedging. pFrs 9 also requires more extensive disclosures for hedge accounting.
pFrs 9 (2013 version) has no mandatory effective date. The mandatory effective date of January 1, 2018 was eventually set when the final version of pFrs 9 was adopted by the Frsc. The adoption of the final version of pFrs 9, however, is still for approval by boa.
The adoption of pFrs 9 is not expected to have any significant impact on the group’s consolidated financial statements.
· pFrs 9, Financial Instruments (2014 or final version) in July 2014, the final version of pFrs 9, Financial Instruments, was issued. pFrs 9 reflects all phases of the financial
instruments project and replaces pas 39, Financial Instruments: Recognition and Measurement, and all previous versions of pFrs 9. The standard introduces new requirements for classification and measurement, impairment, and hedge accounting. pFrs 9 is effective for annual periods beginning on or after January 1, 2018, with early application permitted. retrospective application is required, but comparative information is not compulsory. early application of previous versions of pFrs 9 is permitted if the date of initial application is before February 1, 2015.
The adoption of pFrs 9 will have an effect on the classification and measurement of the group’s financial assets and impairment methodology for financial assets, but will have no impact on the classification and measurement of the group’s financial liabilities. The group is currently assessing the impact of adopting this standard.
New Standard Issued By The IASB But Has Not Yet Been Adopted By The FRSC
iFrs 15, Revenue from Contracts with CustomersiFrs 15 was issued in May 2014 and establishes a new five-step model that will apply to revenue arising from contracts with customers. under iFrs 15 revenue is recognized at an amount that reflects the consideration to which an entity expects to be entitled in exchange for transferring goods or services to a customer. The principles in iFrs 15 provide a more structured approach to measuring and recognizing revenue. The new revenue standard is applicable to all entities and will supersede all current revenue recognition requirements under iFrs. either a full or modified retrospective application is required for annual periods beginning on or after 1 January 2017 with early adoption permitted. The group is currently assessing the impact of iFrs 15 and plans to adopt the new standard on the required effective date once adopted locally.
product classificationinsurance contracts are those contracts where the group (the insurer) has accepted significant insurance risk from another party (the policyholders) by agreeing to compensate the policyholders if a specified uncertain future event (the insured event) adversely affects the policyholders. as a general guideline, the group determines whether it has significant insurance risk, by comparing benefits paid with benefits payable if the insured event did not occur. insurance contracts can also transfer financial risk.
once a contract has been classified as an insurance contract, it remains an insurance contract for the remainder of its lifetime, even if the insurance risk reduces significantly during this period, unless all rights and obligations are extinguished or have expired.
Fair value measurementThe group measures financial instruments at fair value at each reporting date. also, fair values of financial instruments measured at amortized cost and non-financial assets such as investment property carried at cost are disclosed in note 27.

annual report 2014 31
continuing our timeless excellence
Fair value is the price that would be received to sell an asset or paid to transfer a liability in an orderly transaction between market participants at the measurement date. The fair value measurement is based on the presumption that the transaction to sell the asset or transfer the liability takes place either:
· in the principal market for the asset or liability, or
· in the absence of a principal market, in the most advantageous market for the asset or liability
The principal or the most advantageous market must be accessible to the group.
The fair value of an asset or a liability is measured using the assumptions that market participants would use when pricing the asset or liability, assuming that market participants act in their economic best interest.
a fair value measurement of a non-financial asset takes into account a market participant’s ability to generate economic benefits by using the asset in its highest and best use or by selling it to another market participant that would use the asset in its highest and best use.
The group uses valuation techniques that are appropriate in the circumstances and for which sufficient data are available to measure fair value, maximizing the use of relevant observable inputs and minimizing the use of unobservable inputs.
all assets and liabilities for which fair value is measured or disclosed in the consolidated financial statements are categorized within the fair value hierarchy, described as follows, based on the lowest level input that is significant to the fair value measurement as a whole:
· Level 1 - quoted (unadjusted) market prices in active markets for identical assets or liabilities· Level 2 - valuation techniques for which the lowest level input that is significant to the fair value measurement is directly or
indirectly observable· Level 3 - valuation techniques for which the lowest level input that is significant to the fair value measurement is unobservable
For assets and liabilities that are recognized in the consolidated financial statement on a recurring basis, the group determines whether transfers have occurred between levels in the hierarchy by re-assessing categorization (based on the lowest level input that is significant to the fair value measurement as a whole) and at the end of each reporting period.
cash and cash equivalentscash includes cash on hand and in banks. cash equivalents are short-term, highly liquid investments that are readily convertible to known amounts of cash with original maturities of three months or less from dates of placement and that are subject to an insignificant risk of changes in value.
short-term investmentsshort-term investments are short-term, highly liquid investments that are readily convertible to known amounts of cash with original maturities of more than three months but less than one year from dates of placement. These earn interests at the respective short-term investment rates.
insurance receivablespremium receivables (due from policyholders, agents and brokers and due from ceding companies) are recognized on policy inception dates and measured on initial recognition at the fair value of the consideration receivable for the period of coverage. subsequent to initial recognition, insurance receivables are measured at amortized cost. The carrying value of insurance receivables is reviewed for impairment whenever events or circumstances indicate that the carrying amount may not be recoverable, with the impairment loss recorded in profit or loss.
Financial instrumentsDate of recognitionFinancial instruments are recognized in the consolidated statement of financial position when the group becomes a party to the contractual provisions of the instrument. purchases or sales of financial assets that require delivery of assets within the time frame established by regulation or convention in the marketplace are recognized on the trade date.
Initial recognition of financial instrumentsFinancial instruments are initially recognized at fair value of the consideration given (in case of an asset) or received (in case of a liability). except for financial instruments at fair value through profit or loss (Fvpl), the initial measurement of financial assets includes transaction costs. The group classifies its financial assets in the following categories: held-to-maturity (HtM) investments, aFs investments, Fvpl investments and loans and receivables. The group classifies its financial liabilities into financial liabilities at Fvpl and other financial liabilities.
The classification depends on the purpose for which the investments were acquired and whether they are quoted in an active market. Management determines the classification of its investments at initial recognition and, where allowed and appropriate, re-evaluates such designation at every end of the reporting period.

32
as of december 31, 2014 and 2013, the group’s financial instruments are in the nature of aFs financial assets, loans and receivables and other financial liabilities.
Day 1 differencewhere the transaction price in a non-active market is different from the fair value from other observable current market transactions in the same instrument or based on a valuation technique whose variables include only data from observable market, the group recognizes the difference between the transaction price and fair value (a ‘day 1’ difference) in profit or loss unless it qualifies for recognition as some other type of asset. in cases where an unobservable data is used, the difference between the transaction price and model value is only recognized in profit or loss when the inputs become observable or when the instrument is derecognized. For each transaction, the group determines the appropriate method of recognizing the ‘day 1’ difference amount.
Financial assets and liabilities at FVPLFinancial assets and financial liabilities at Fvpl include financial assets and liabilities held-for-trading and financial assets and liabilities designated upon initial recognition as at Fvpl.
Financial assets and liabilities are classified as held-for-trading if they are acquired for purposes of selling and repurchasing in the near term. derivatives, including any separated embedded derivatives, are also classified as financial assets or financial liabilities at Fvpl, unless these are designated as hedging instruments in an effective hedge.
Financial assets and liabilities at Fvpl are recorded in the consolidated statement of financial position at fair value. subsequent changes in fair value are recognized in ”investment and other income” in the consolidated statement of income. interest earned or incurred is recorded as interest income or expense, respectively, while dividend income is recorded as other income when the right to receive the payment has been established.
Derivative instrumentsThe group uses derivatives such as non-deliverable forward contracts as a means of reducing its foreign exchange exposure. derivative instruments (including bifurcated embedded derivatives) are initially recognized at fair value on the date on which the derivative contract is entered into and are subsequently remeasured at fair value. derivatives are carried as assets when the fair value is positive and as liabilities when the fair value is negative. any gain or loss arising from changes in fair value of derivatives that do not qualify for hedge accounting is recognized in “investment and other income” in the consolidated statement of income.
Embedded derivativesan embedded derivative is a component of a hybrid (combined) instrument that also includes non-derivative host contract with the effect that some of the cash flows of the combined instrument vary in a way similar to stand-alone derivative.
embedded derivatives are bifurcated from their host contracts, when the following conditions are met:a) the entire hybrid contracts (composed of both the host contract and the embedded derivative) are not accounted for as
financial assets and liabilities at Fvpl;b) when their economic risks and characteristics are not closely related to those of their respective host contracts; andc) a separate instrument with the same terms as the embedded derivative would meet the definition of a derivative.
The group assesses whether embedded derivatives are required to be separated from the host contract when it first becomes party to the contract. reassessment only occurs if there is a change in the terms of the contract that significantly modifies the cash flows that would otherwise be required.
AFS financial assetsaFs investments are those which are designated as such or do not qualify to be classified as designated at Fvpl, HtM or loans and receivables. They are purchased and held indefinitely, and may be sold in response to liquidity requirements or changes in market conditions.
after initial measurement, aFs investments are subsequently measured at fair value. The effective yield component of aFs debt securities, as well as the impact of restatement on foreign currency-denominated aFs debt securities, is reported in earnings. interest earned on holding aFs investments are reported as interest income using the effective interest rate. dividends earned on holding aFs investments are recognized in profit or loss when the right to receive the payment has been established. The unrealized gains and losses arising from the fair valuation of aFs investments are reported as ‘revaluation reserve on available-for-sale financial assets’ in other comprehensive income. The losses arising from impairment of such investments are recognized in profit or loss. when the security is disposed of, the cumulative gain or loss previously recognized in other comprehensive income is recognized as realized gains or losses in profit or loss. when the group holds more than one investment in the same security, the cost is determined using the weighted average method.
when the fair value of aFs investments cannot be measured reliably because of lack of reliable estimates of future cash flows and discount rates necessary to calculate the fair value of unquoted equity instruments, these investments are carried at cost.

annual report 2014 33
continuing our timeless excellence
Loans and receivablesloans and receivables are financial assets with fixed or determinable payments and fixed maturities that are not quoted in an active market. They are not entered into with the intention of immediate or short-term resale and are not classified as financial assets held for trading, designated as aFs or Fvpl. This accounting policy relates to the consolidated statement of financial position captions: (a) “cash and cash equivalents”, (b) “short-term investments”, (c) “insurance receivables”, (d) “loans and receivables” and (e) “accrued income”.
after initial measurement, the loans and receivables are subsequently measured at amortized cost using the effective interest rate method, less allowance for impairment. amortized cost is calculated by taking into account any discount or premium on acquisition and fees that are an integral part of the effective interest rate. The amortization is included in the investment and other income account in profit or loss. The losses arising from impairment of such loans and receivables are recognized in profit or loss.
Other financial liabilitiesissued financial instruments or their components, which are not designated at Fvpl are classified as other financial liabilities, where the substance of the contractual arrangement results in the group having an obligation either to deliver cash or another financial asset to the holder, or to satisfy the obligation other than by the exchange of a fixed amount of cash or another financial asset for a fixed number of own equity shares.
after initial measurement, other financial liabilities are subsequently measured at amortized cost using the effective interest rate method. amortized cost is calculated by taking into account any discount or premium on the issue and fees that are an integral part of the effective interest rate. any effects of restatement of foreign currency-denominated liabilities are recognized in the consolidated statement of income.
This accounting policy applies primarily to the group’s insurance payables and accounts payable, accrued expenses and other liabilities that meet the above definition (other than liabilities covered by other accounting standards, such as pension liability and income tax payable).
impairment of Financial assetsThe group assesses at each end of the reporting period whether there is objective evidence that a financial asset or a group of financial assets is impaired. a financial asset or a group of financial assets is deemed to be impaired if, and only if, there is ob-jective evidence of impairment as a result of one or more events that has occurred after the initial recognition of the asset (an incurred ‘loss event’) and that loss event (or events) has an impact on the estimated future cash flows of the financial asset or the group of financial assets that can be reliably estimated.
evidence of impairment may include indications that the borrower or a group of borrowers is experiencing significant financial difficulty, default or delinquency in interest or principal payments, the probability that they will enter bankruptcy or other fi-nancial reorganization and where observable data indicate that there is measurable decrease in the estimated future cash flows, such as changes in arrears or economic conditions that correlate with defaults.
AFS investments carried at fair valuein case of equity investments classified as aFs, impairment indicators would include a significant or prolonged decline in the fair value of the investments below its cost. where there is evidence of impairment, the cumulative loss - measured as the difference between the acquisition cost and the current fair value, less any impairment loss on that financial asset previously recognized in the consolidated statement of income is removed from other comprehensive income and recognized in profit or loss. impairment losses on equity investments are not reversed through profit or loss. increases in fair value after impairment are recognized directly in other comprehensive income.
in the case of debt instruments classified as aFs financial assets, impairment is assessed based on the same criteria as financial assets carried at amortized cost. Future interest income is based on the reduced carrying amount and is accrued based on the rate of interest used to discount future cash flows for the purpose of measuring impairment loss. such accrual is recorded as part of “interest income” in profit or loss. if, in subsequent year, the fair value of a debt instrument increases and the increase can be objectively related to an event occurring after the impairment loss was recognized in profit or loss, the impairment loss is reversed through profit or loss.
AFS investments carried at costif there is an objective evidence that an impairment loss on an unquoted equity instrument that is not carried at fair value because its fair value cannot be reliably measured, or on a derivative asset that is linked to and must be settled by delivery of such unquoted equity instrument has been incurred, the amount of the loss is measured as the difference between the asset’s carrying amount and the present value of estimated future cash flows discounted at the current market rate of return for a similar financial asset.

34
Loans and ReceivablesFor loans and receivables carried at amortized cost, the group first assesses whether objective evidence of impairment exists for financial assets that are individually significant, or collectively for financial assets that are not individually significant. if the group determines that no objective evidence of impairment exists for individually assessed financial asset, whether significant or not, it includes the asset in a group of financial assets with similar credit risk characteristics and collectively assesses for impairment.
assets that are individually assessed for impairment and for which an impairment loss is, or continues to be, recognized are not included in a collective assessment for impairment.
if there is objective evidence that an impairment loss has been incurred, the amount of the loss is measured as the difference between the asset’s carrying amount and the present value of the estimated future cash flows (excluding future credit losses that have not been incurred) discounted at the financial asset’s original effective interest rate. The carrying amount of the asset is reduced through the use of an allowance account and the amount of loss is charged against profit or loss. receivables, together with the associated allowance accounts, are written off when there is no realistic prospect of future recovery and all collateral has been realized. if, in a subsequent period, the amount of the estimated impairment loss decreases because of an event occurring after the impairment was recognized, the previously recognized impairment loss is reversed. any subsequent reversal of an impairment loss is recognized in profit or loss, to the extent that the carrying value of the asset does not exceed its amortized cost at the reversal date.
time value is generally not considered when the effect of discounting is not material. if a loan has a variable interest rate, the discount rate for measuring any impairment loss is the current effective interest rate, adjusted for the original credit risk premium. The calculation of the present value of the estimated future cash flows of a collateralized financial asset reflects the cash flows that may result from foreclosure less costs for obtaining and selling the collateral, whether or not foreclosure is probable.
For the purpose of a collective evaluation of impairment, financial assets are grouped on the basis of credit risk characteristics such as past-due status and term.
Future cash flows in a group of financial assets that are collectively evaluated for impairment are estimated on the basis of historical loss experience for assets with credit risk characteristics similar to those in the group. Historical loss experience is ad-justed on the basis of current observable data to reflect the effects of current conditions that did not affect the period on which the historical loss experience is based and to remove the effects of conditions in the historical period that do not exist currently. The methodology and assumptions used for estimating future cash flows are reviewed regularly by the group to reduce any difference between loss estimates and actual loss experience.
offsetting of Financial instrumentsFinancial assets and financial liabilities are offset and the net amount is reported in the consolidated statement of financial position if, and only if, there is a currently enforceable legal right to offset the recognized amounts and there is an intention to settle on a net basis, or to realize the asset and settle the liability simultaneously.
derecognition of Financial assets and liabilitiesFinancial Asset a financial asset (or, where applicable a part of a financial asset or part of a group of similar financial assets) is derecognized where:
· the rights to receive cash flows from the asset have expired;· the group retains the right to receive cash flows from the asset, but has assumed an obligation to pay them in full without
material delay to a third party under a ‘pass-through’ arrangement; or· the group has transferred its rights to receive cash flows from the asset and either (a) has transferred substantially all the
risks and rewards of the asset, or (b) has neither transferred nor retained substantially all the risks and rewards of the asset, but has transferred control of the asset.
where the group has transferred its right to receive cash flows from an asset and has neither transferred nor retained substantially all the risks and rewards of the asset nor transferred control of the asset, the asset is recognized to the extent of the group’s continuing involvement in the asset.
Financial Liabilitya financial liability is derecognized when the obligation under the liability is discharged or cancelled or has expired. where an existing financial liability is replaced by another from the same lender on substantially different terms, or the terms of an existing liability are substantially modified, such an exchange or modification is treated as a derecognition of the original liability and the recognition of a new liability, and the difference in the respective carrying amounts is recognized in profit or loss.

annual report 2014 35
continuing our timeless excellence
reinsuranceThe group cedes insurance risk in the normal course of business. reinsurance assets represent balances due from reinsurance companies for its share on the unpaid losses incurred by the group. recoverable amounts are estimated in a manner consistent with the outstanding claims provision and are in accordance with the reinsurance contract. reinsurance recoverable on paid losses are included as part of insurance receivables.
reinsurance assets are reviewed for impairment at each end of the reporting period or more frequently when an indication of impairment arises during the reporting year. impairment occurs when objective evidence exists that the group may not recover outstanding amounts under the terms of the contract and when the impact on the amounts that the group will receive from the reinsurer can be measured reliably. The impairment loss is recorded in the statement of income.
ceded reinsurance arrangements do not relieve the group from its obligations to policyholders.
The group also assumes reinsurance risk in the normal course of business for insurance contracts. premiums and claims on assumed reinsurance are recognized in profit or loss as income and expenses in the same manner as they would be if the reinsurance were considered direct business, taking into account the product classification of the reinsured business. reinsurance liabilities represent balances due to reinsurance companies. amounts payable are estimated in a manner consistent with the associated reinsurance contract.
premiums and claims are presented on a gross basis for both ceded and assumed reinsurance.
reinsurance assets or liabilities are derecognized when the contractual rights are extinguished or expired or when the contract is transferred to another party.
when the group enters into a proportional treaty reinsurance agreement for ceding out its insurance business, the group initially recognizes a liability at transaction price. subsequent to initial recognition, the portion of the amount initially recognized as a liability which is presented as insurance payables in the liabilities section of the consolidated statement of financial position will be withheld and recognized as Funds held for reinsurers and included as part of the insurance payables in the liabilities section of the consolidated statement of financial position. The amount withheld is generally released after a year. Funds held by ceding companies are accounted for in the same manner.
deferred acquisition costs (dac)commissions and other acquisition costs incurred during the financial period that vary with and are related to securing new insurance contracts and or renewing existing insurance contracts, but which relates to subsequent financial periods, are deferred to the extent that they are recoverable out of future revenue margins. other acquisition costs include referral fee of Fnac which is classified under other underwriting expense. all other acquisition costs are recognized as expense when incurred.
subsequent to initial recognition, these costs are amortized on a straight-line basis using the 24th method over the life of the contract except for the marine cargo where commissions for the last two months of the year are recognized as expense the following year. amortization is charged against the profit or loss. The unamortized acquisition costs are shown as deferred acquisition costs in the assets section of the consolidated statement of financial position.
an impairment review is performed at each end of the reporting period or more frequently when an indication of impairment arises. The carrying value is written down to the recoverable amount. The impairment loss is charged to profit or loss. dac is also considered in the liability adequacy test for each end of the reporting period.
investment propertiesproperties held for rental yields and for capital appreciation or both rather than for use in the production or supply of goods and services or for administrative purposes or sale in the ordinary course of business is classified as investment property.
investment properties are measured initially at cost, including transaction costs.
investment properties consist of land, buildings and construction in progress. The land is carried at cost. The buildings are carried at cost, less accumulated depreciation and amortization and any accumulated impairment losses.
construction in-progress is carried at cost and transferred to the related property and equipment account when the construction and related activities to prepare the property for its intended use are complete, and the property is ready for occupation. construction in-progress is not depreciated until such time that the relevant assets are completed and put into operational use.
depreciation and amortization is computed using the straight-line method over the estimated useful life of 40 years. The estimated useful life and depreciation and amortization method are reviewed periodically to ensure that the period and method of depreciation and amortization are consistent with the expected pattern of economic benefits from items of investment property.

36
investment properties are derecognized either when they have been disposed of, or when the investment property is permanently withdrawn from use and no future benefit is expected from its disposal. any gains or losses on the retirement or disposal of an investment property are recognized in the profit or loss in the year of retirement or disposal.
transfers are made to investment property when, and only when, there is a change in use, evidenced by the end of owner-occupation and commencement of an operating lease to another party. transfers are made from investment property when, and only when, there is a change in use, evidenced by commencement of owner-occupation or commencement of development with a view to sale.
property and equipmentproperty and equipment, except for land, are stated at cost, net of accumulated depreciation and amortization and any impairment in value. land is stated at cost less any impairment losses.
The initial cost of property and equipment comprises its purchase price, including nonrefundable taxes and any directly attributable costs of bringing the asset to its working condition and location for its intended use. subsequent costs are included in the asset’s carrying amount or recognized as a separate asset, as appropriate, only when it is probable that future economic benefits associated with the item will flow to the group and the cost of the item can be measured reliably. all other repairs and maintenance are charged to the statement of income during the financial period in which they are incurred.
depreciation and amortization are computed using the straight-line method over the estimated useful lives of the properties as follows:
Yearsbuilding and improvements 40building equipment 5office furniture, fixtures and equipment 5transportation equipment 5
leasehold improvements are amortized over the term of the lease or estimated useful life of 5 years, whichever is shorter.
The estimated useful lives and depreciation and amortization method are reviewed periodically to ensure that the period and method of depreciation and amortization are consistent with the expected pattern of economic benefits from items of property and equipment.
when property and equipment are retired or otherwise disposed of, the cost and the related accumulated depreciation and amortization and accumulated provision for impairment losses, if any, are removed from the accounts. any gain or loss arising on derecognition of the assets, which is calculated as the difference between the net disposal proceeds and the carrying amount of the asset, is included in the consolidated statement of income in the year the asset is derecognized.
creditable withholding taxes (cwts)creditable withholding pertains to the indirect tax paid by the group that is withheld by its counterparty for the payment of its expenses and other purchases. These cwts are initially recorded at cost as an asset under “other assets” account.
at each end of the tax reporting deadline, these cwts may either be offset against future tax income payable or be claimed as a refund from the taxation authorities at the option of the group. if these cwts are claimed as a refund, these will be recorded as a receivable under “loans and receivables” account.
at each end of the reporting period, an assessment for impairment is performed as to the recoverability of these cwts.
computer softwarecosts associated with the acquisition of computer software are capitalized only if the asset can be reliably measured, will generate future economic benefits, and there is an ability to use or sell the asset.
computer software is carried at cost less accumulated amortization. computer software cost is amortized over the expected useful life of the asset, but not to exceed five (5) years. all computer software components are amortized over five (5) years. amortization commences when the asset is available for use or when it is in the location and condition necessary for it to be capable of operating in the manner intended by the group.
impairment of nonfinancial assetsThe group assesses at each end of the reporting period whether there is an indication that investment properties, property and equipment and computer software may be impaired. if any such indication exists, or when annual impairment testing for an asset is required, the group makes an estimate of the asset’s recoverable amount. an asset’s recoverable amount is the higher of an asset’s or cash-generating unit’s fair value less costs to sell and its value in use and is determined for an individual asset,

annual report 2014 37
continuing our timeless excellence
unless the asset does not generate cash inflows that are largely independent of those from other assets or groups of assets. where the carrying amount of an asset exceeds its recoverable amount, the asset is considered impaired and is written down to its recoverable amount. in assessing value in use, the estimated future cash flows are discounted to their present value using a pre-tax discount rate that reflects current market assessments of the time value of money and the risks specific to the asset.
an assessment is made at each end of the reporting period as to whether there is any indication that previously recognized impairment losses may no longer exist or may have decreased. if such indication exists, the recoverable amount is estimated. a previously recognized impairment loss is reversed only if there has been a change in the estimates used to determine the asset’s recoverable amount since the last impairment loss was recognized. if that is the case, the carrying amount of the asset is increased to its recoverable amount. That increased amount cannot exceed the carrying amount that would have been determined, net of depreciation, had no impairment loss been recognized for the asset in prior years. such reversal is recognized in profit or loss unless the asset is carried at revalued amount, in which case, the reversal is treated as a revaluation increase. after such reversal the depreciation charge is adjusted in future periods to allocate the asset’s revised carrying amount, less any residual value, on a systematic basis over its remaining useful life.
value-added tax (vat)The input value added tax pertains to the 12% indirect tax paid by the group in the course of the group’s trade or business on local purchase of goods or services.
output vat pertains to the 12% tax due on the sale of insurance policies and other goods or services by the group.
if at the end of any taxable month, the output vat exceeds the input vat, the outstanding balance is included under “accounts payable and accrued expenses” account. if the input vat exceeds the output vat, the excess shall be carried over to the succeeding months and included under “other assets” account.
real estate properties for salereal estate properties for sale are measured at the lower of cost and net realizable value (nrv). nrv is the estimated selling price in the ordinary course of business, based on market prices at the reporting date, less estimated costs of completion and the estimated costs to sell. The cost of inventory recognized in profit or loss on disposal is determined with reference to the specific costs incurred on the property.
insurance contract liabilitiesProvision for Unearned PremiumsThe proportion of written premiums, gross of commissions payable to intermediaries, attributable to subsequent periods or to risks that have not yet expired is deferred as provision for unearned premiums. premiums from short-duration insurance contracts are recognized as revenue over the period of the contracts using the 24th method except for the marine cargo where premiums for the last two months are considered earned the following year. The portion of the premiums written that relate to the unexpired periods of the policies at end of the reporting period are accounted for as provision for unearned premiums as part of insurance contract liabilities and presented in the liabilities section of the consolidated statement of financial position. The change in the provision for unearned premiums is taken to profit or loss in order that revenue is recognized over the period of risk. Further provisions are made to cover claims under unexpired insurance contracts which may exceed the unearned premiums and the premiums due in respect of these contracts.
Claims Provision and Incurred But Not Reported (IBNR) LossesThese liabilities are based on the estimated ultimate cost of all claims incurred but not settled at the end of the reporting period together with related claims handling costs and reduction for the expected value of salvage and other recoveries. delays can be experienced in the notification and settlement of certain types of claims, therefore the ultimate cost of which cannot be known with certainty at the end of the reporting period. The liability is not discounted for the time value of money and includes provision for ibnr losses. The liability is derecognized when the contract is discharged, cancelled or has expired.
Liability Adequacy Testat each end of the reporting period, liability adequacy tests are performed, to ensure the adequacy of insurance contract liabilities, net of related dac assets. in performing the test, current best estimates of future cash flows, claims handling and policy administration expenses are used. changes in expected claims that have occurred, but which have not been settled, are reflected by adjusting the liability for claims and future benefits. any inadequacy is immediately charged to the consolidated statement of income by establishing an unexpired risk provision for losses arising from the liability adequacy tests. The provision for unearned premiums is increased to the extent that the future claims and expenses in respect of current insurance contracts exceed future premiums plus the current provision for unearned premiums.
insurance payablesinsurance payables are recognized when due and measured on initial recognition at the fair value of the consideration received less attributable transaction cost. subsequent to initial recognition, they are measured at amortized cost using the effective interest rate method.

38
insurance payables are derecognized when the obligation under the liability is settled,cancelled or expired.
pension costThe net defined benefit liability or asset is the aggregate of the present value of the defined benefit obligation at the end of the reporting period reduced by the fair value of plan assets (if any), adjusted for any effect of limiting a net defined benefit asset to the asset ceiling. The asset ceiling is the present value of any economic benefits available in the form of refunds from the plan or reductions in future contributions to the plan.
The cost of providing benefits under the defined benefit plans is actuarially determined using the projected unit credit method.
defined benefit costs comprise the following:· service cost· net interest on the net defined benefit liability or asset· remeasurements of net defined benefit liability or asset
service costs which include current service costs, past service costs and gains or losses on non-routine settlements are recognized as expense in profit or loss. past service costs are recognized when plan amendment or curtailment occurs. These amounts are calculated periodically by independent qualified actuaries.
net interest on the net defined benefit liability or asset is the change during the period in the net defined benefit liability or asset that arises from the passage of time which is determined by applying the discount rate based on government bonds to the net defined benefit liability or asset. net interest on the net defined benefit liability or asset is recognized as expense or income in profit or loss.
remeasurements comprising actuarial gains and losses, return on plan assets and any change in the effect of the asset ceiling (excluding net interest on defined benefit liability) are recognized immediately in other comprehensive income in the period in which they arise. remeasurements are not reclassified to profit or loss in subsequent periods.
plan assets are assets that are held by a long-term employee benefit fund or qualifying insurance policies. plan assets are not available to the creditors of the group, nor can they be paid directly to the group. Fair value of plan assets is based on market price information. when no market price is available, the fair value of plan assets is estimated by discounting expected future cash flows using a discount rate that reflects both the risk associated with the plan assets and the maturity or expected disposal date of those assets (or, if they have no maturity, the expected period until the settlement of the related obligations). if the fair value of the plan assets is higher than the present value of the defined benefit obligation, the measurement of the resulting defined benefit asset is limited to the present value of economic benefits available in the form of refunds from the plan or reductions in future contributions to the plan.
The group’s right to be reimbursed of some or all of the expenditure required to settle a defined benefit obligation is recognized as a separate asset at fair value when and only when reimbursement is virtually certain.
equitycapital stock is recognized as issued when the stock is paid for or subscribed under a binding subscription agreement and is measured at par value.
capital in excess of par value includes any premiums received in excess of par value on the issuance of capital stock.
contributed surplus represents the original contribution of the stockholders of the parent company, in addition to the paid-in capital stock, in order to comply with the pre-licensing requirements as provided under the insurance code (the code).
contingency surplus pertains to capital infusion of shareholders in order to comply with Margin of solvency (Mos) deficiency as a result of the examination made by the insurance commission (ic).
other revaluation reserve pertains to the appraisal increment on building relating to the parent company’s previously held interest in tokio Marine Malayan insurance co., inc. (tMMic) at the time of the business combination. The balance of the other revaluation reserve will be transferred to retained earnings when the building is disposed or derecognized.
retained earnings include all the accumulated earnings of the group, net of dividends declared.
revenue recognitionrevenue is recognized to the extent that it is probable that the economic benefits will flow to the group and the revenue can be reliably measured. The following specific recognition criteria must also be met before revenue is recognized:
Premiums Revenuegross insurance written premiums comprise the total premiums receivable for the whole period of cover provided by contracts

annual report 2014 39
continuing our timeless excellence
entered into during the accounting period and are recognized on the date on which the policy incepts. premiums include any adjustments arising in the accounting period for premiums receivable in respect of business written in prior periods.
premiums from short-duration insurance contracts are recognized as revenue over the period of the contracts using the 24th method except for the marine cargo where premiums for the last two months are considered earned the following year. The portion of the premiums written that relate to the unexpired periods of the policies at end of the reporting period are accounted for as provision for unearned premiums as part of insurance contract liabilities and presented in the liabilities section of the consolidated statements of financial position. The related reinsurance premiums ceded that pertains to the unexpired periods at end of the reporting period are accounted for as deferred reinsurance premiums and shown as part of reinsurance assets in the consolidated statements of financial position. The net changes in these accounts between each end of reporting periods are recognized in profit or loss.
Reinsurance Commissionscommissions earned from short-duration insurance contracts are recognized as revenue over the period of the contracts using the 24th method except for the marine cargo where the deferred reinsurance commissions for the last two months of the year are considered earned the following year. The portion of the commissions that relate to the unexpired periods of the policies at end of the reporting period are accounted for as deferred reinsurance commissions and presented in the liabilities section of the consolidated statement of financial position.
Dividend incomedividend income is recognized when the shareholders’ right to receive the payment is established.
Interest incomeFor all financial instruments measured at amortized cost and interest-bearing financial instruments, interest income is recorded at the effective interest rate, which is the rate that exactly discounts estimated future cash receipts through the expected life of the financial instrument or a shorter period, where appropriate, to the net carrying amount of the financial asset. The calculation takes into account all contractual terms of the financial instrument (for example, prepayment options), includes any fees or incremental costs that are directly attributable to the instrument and are an integral part of the effective interest rate, but not future credit losses. The adjusted carrying amount is calculated based on the original effective interest rate. The change in carrying amount is recorded as interest income.
once the recorded value of a financial asset or a group of similar financial assets has been reduced due to an impairment loss, interest income continues to be recognized using the original effective interest rate applied to the new carrying amount.
Rental incomerental income from investment properties are recognized on a straight-line basis over the term of the lease.
Management feesManagement fees are recognized as income when services are rendered.
Other incomeincome from other sources is recognized when earned.
expense recognitionexpenses are decreases in economic benefits during the accounting period in the form of outflows or depletions of assets or incurrence of liabilities that result in decrease in equity, other than those relating to distribution to equity participants.
Benefits and Claimsbenefits and claims consists of benefits and claims paid to policyholders, which includes changes in the valuation of insurance contract liabilities, except for changes in the provision for unearned premiums which are recorded in insurance revenue. it further includes internal and external claims handling costs that are directly related to the processing and settlement of claims. amounts receivable in respect of salvage and subrogation are also considered. general insurance claims are recorded on the basis of notifications received.
Commission Expensecommissions are recognized as expense over the period of the contracts using the 24th method. The portion of the commissions that relates to the unexpired periods of the policies at the end of the reporting period is accounted for as “deferred acquisition cost” in the assets section of the consolidated statement of financial position.
Other underwriting expenseother underwriting expense pertains to the costs incurred by the group prior to the issuance of policies to its policyholders. These costs include expenses for technical inspections, actuarial reviews and other work that is deemed necessary to determine whether or not to accept the risks to be written. These costs are recognized as expense as they are incurred.

40
Expensesgeneral and administrative expense and other investment expense, except for lease agreements, are recognized as expense as they are incurred.
interest expenseinterest expense is charged against operations as they are incurred.
leasesThe determination of whether an arrangement is, or contains a lease, is based on the substance of the arrangement and requires an assessment of whether the fulfillment of the arrangement is dependent on the use of a specific asset or assets and the arrangement conveys a right to use the asset. a reassessment is made after inception of the lease only if one of the following applies:
a. There is a change in contractual terms, other than a renewal or extension of the arrangement;b. a renewal option is exercised or extension granted, unless that term of the renewal or extension was initially included in
the lease term;c. There is a change in the determination of whether fulfillment is dependent on a specified asset or;d. There is a substantial change to the asset.
where a reassessment is made, lease accounting shall commence or cease from the date when the change in circumstances gave rise to the reassessment for scenarios a, c or d above, and at the date of renewal or extension period for scenario (b).
Group as a lessorleases where the group does not transfer substantially all the risks and benefits of ownership of the assets are classified as operating leases. lease payments received are recognized as an income in the consolidated statement of income on a straight-line basis over the lease term. initial direct costs incurred in negotiating operating leases are added to the carrying amount of the leased asset and recognized over the lease term on the same basis as the rental income.
Group as a lesseeleases where the lessor retains substantially all the risks and benefits of ownership of the asset are classified as operating leases. Fixed lease payments are recognized as an expense in the consolidated statement of income on a straight-line basis.
Foreign exchange transactionsThe functional and presentation currency of the group is the philippine peso (p). transactions in foreign currencies are initially recorded in the functional currency rate ruling at the date of the transaction. Monetary assets and liabilities denominated in foreign currencies are translated at the functional currency rate of exchange ruling at the end of the reporting period. nonmonetary items that are measured in terms of historical cost in a foreign currency are translated using the exchange rate as at the date of the initial transaction and are not subsequently restated. nonmonetary items measured at fair value in a foreign currency are translated using the exchange rate at the date when the fair value was determined. all foreign exchange differences are taken to profit or loss, except where it relates to equity securities where gains or losses are recognized directly in other comprehensive income.
provisions and contingencies provisions are recognized when the group has a present obligation (legal or constructive) as a result of a past event and it is probable that an outflow of resources embodying economic benefits will be required to settle the obligation and a reliable estimate can be made of the amount of the obligation. where the group expects some or all of a provision to be reimbursed, for example, under an insurance contract, the reimbursement is recognized as a separate asset but only when the reimbursement is virtually certain. The expense relating to any provision is presented in profit or loss, net of any reimbursement. if the effect of the time value of money is material, provisions are determined by discounting the expected future cash flows at a pre-tax rate that reflects current market assessments of the time value of money and, where appropriate, the risks specific to the liability. where discounting is used, the increase in the provision due to the passage of time is recognized as an interest expense.
contingent liabilities are not recognized in the consolidated financial statements but are disclosed unless the possibility of an outflow of resources embodying economic benefits is remote. contingent assets are not recognized but are disclosed in the consolidated financial statements when an inflow of economic benefits is probable.
income taxCurrent taxcurrent tax assets and liabilities for the current and prior periods are measured at the amount expected to be recovered from or paid to the taxation authorities. The tax rates and tax laws used to compute the amount are those that are enacted or substantively enacted at the end of the reporting period.
Deferred taxdeferred tax is provided, using the liability method, on all temporary differences at the end of the reporting period between the tax bases of assets and liabilities and their carrying amounts for financial reporting purposes.

annual report 2014 41
continuing our timeless excellence
deferred tax liabilities are recognized for all taxable temporary differences, including asset revaluations. deferred tax assets are recognized for all deductible temporary differences, carryforward of unused tax credits from the excess of minimum corporate income tax (Mcit) over the regular income tax, and unused net operating loss carryover (nolco), to the extent that it is probable that sufficient taxable profit will be available against which the deductible temporary differences and carryforward of unused tax credits from Mcit and unused nolco can be utilized. deferred tax, however, is not recognized on temporary differences that arise from the initial recognition of an asset or liability in a transaction that is not a business combination and, at the time of the transaction, affects neither the accounting income nor taxable income or loss.
The carrying amount of deferred tax assets is reviewed at each end of the reporting period and reduced to the extent that it is no longer probable that sufficient taxable profit will be available to allow all or part of the deferred tax asset to be utilized. unrecognized deferred tax assets are reassessed at each end of the reporting period and are recognized to the extent that it has become probable that future taxable profit will allow the deferred tax asset to be recovered.
deferred tax assets and liabilities are measured at the tax rates that are applicable to the period when the asset is realized or the liability is settled, based on tax rates (and tax laws) that have been enacted or substantively enacted at the end of the reporting period. Movements in the deferred tax assets and liabilities arising from changes in tax rates are charged against or credited to income for the period.
current tax and deferred tax relating to items recognized as other comprehensive income is also recognized in the consolidated statement of other comprehensive income.
deferred tax assets and deferred tax liabilities are offset if a legally enforceable right exists to set off current tax assets against current tax liabilities and deferred taxes related to the same taxable entity and the same taxation authority.
events after end of the reporting periodany post year-end events that provide additional information about the group’s position at the end of the reporting period (adjusting event) are reflected in the consolidated financial statements. post year-end events that are not adjusting events, if any, are disclosed in the consolidated financial statements when material.
3. significant accounting Judgments and estimates
The preparation of the accompanying consolidated financial statements in accordance with pFrs requires the group to make judgments and estimates that affect the amounts reported in the consolidated financial statements and accompanying notes. The estimates and assumptions used in the accompanying consolidated financial statements are based upon management’s evaluation of relevant facts and circumstances as of the date of the consolidated financial statements. actual results could differ from such estimates.
Judgmentsin the process of applying the group’s accounting policies, management has made the following judgments, apart from those involving estimations, which have the most significant effect on the amounts recognized in the consolidated financial statements:
Product classificationThe significance of insurance risk is dependent on both the probability of an insured event and the magnitude of its potential effect. as a general guideline, the group defines significant insurance risk as the possibility of having to pay benefits on the occurrence of an insured event that are at least 5% more than the benefits payable if the insured event did not occur.
The group has determined that the insurance policies it issues have significant insurance risks and therefore meet the definition of insurance contracts and should be accounted for as such.
Functional Currencybased on the economic substance of the underlying circumstances relevant to the group, the functional currency of the group has been determined to be the philippine peso. The philippine peso is the currency of the primary economic environment in which the group operates. it is the currency that mainly influences the revenue and costs of the group operations.
Operating lease commitments - Group Company as lessorThe group entered into commercial property leases on its investment properties. The group determined that it retains all the significant risks and rewards of ownership of the property, thus accounts for them as operating lease.
Operating lease commitments - Group as lesseeThe group entered into various property leases with various lessors. The group determined that the lessors retain all the significant risks and rewards of ownership of the leased properties thus accounts for them as operating leases.

42
Distinction between investment properties and owner-occupied propertiesThe group determines whether a property qualifies as investment property. in making this judgment, the group considers whether the property generates cash flows largely independent of the other assets held by an entity. owner-occupied properties generate cash flows that are attributable not only to property but also to the other assets used in the production or supply process.
when properties comprise a portion that is held to earn rentals or for capital appreciation and another portion is held for use in the production or supply of goods or services or for administrative purpose, and these portions cannot be sold separately, the property is accounted for as investment property only if an insignificant portion is held for use in the production or supply of goods or services or for administrative purposes. Judgment is applied in determining whether ancillary services are so significant that a property does not qualify as investment property. The group considers each property separately in making this judgment.
Management’s use of estimatesThe key assumptions concerning the future and other key sources of estimation uncertainty at each reporting date, that have a significant risk of causing a material adjustment to the carrying amounts of assets and liabilities within the next financial year are discussed below.
Fair values of financial assetsThe group carries certain financial assets at fair value, which requires extensive use of accounting estimates and judgments. Fair value determinations for financial assets are based generally on listed or quoted market prices. if prices are not readily determinable or if liquidating positions is reasonably expected to affect market prices, fair value is based on either internal valuation models or management’s estimate of amounts that could be realized under current market conditions, assuming an orderly liquidation over a reasonable period of time. while significant components of fair value were determined using verifiable objective evidence (i.e., foreign exchange rates, interest rates, volatility rates), the amount of changes in fair value of these financial assets and liabilities would affect the statement of other comprehensive income.
The carrying value of aFs financial assets is p10.09 billion and p10.06 billion as of december 31, 2014 and 2013, respectively (see note 7).
Valuation of insurance contract liabilitiesestimates have to be made both for the expected ultimate cost of claims reported and for the expected ultimate cost of claims ibnr at the end of reporting period. it can take a significant period of time before the ultimate claims cost can be established with certainty.
The primary technique adopted by management in estimating the cost of notified and claims ibnr, is that of using past claims settlement trends to predict future claims settlement trends. at each reporting date, prior year claims estimates are assessed for adequacy and changes made are charged to provision. insurance contract liabilities are not discounted for the time value of money.
as of december 31, 2014 and 2013, the carrying values of provision for claims reported and ibnr amounted to p10.88 billion and p10.66 billion, respectively (see note 14).
Estimation of allowance for impairment lossesThe group maintains allowance for impairment losses at a level considered adequate to provide for potential uncollectible receivables. The level of this allowance is evaluated by management on the basis of factors that affect the collectability of the accounts. These factors include, but are not limited to, age of balances, financial status of counterparties, and legal opinion on recoverability in case of legal disputes. The group reviews the age and status of receivables, and identifies accounts that are to be provided with allowance on a regular basis.
The amount and timing of recorded expenses for any period would differ if the group made different judgments or utilized different estimates. an increase in allowance for impairment losses would increase recorded expenses and decrease the related asset accounts.
The carrying value of insurance receivables, net of impairment losses amounted to p5.36 billion and p5.47 billion as of december 31, 2014 and 2013, respectively. The related allowance for impairment losses amounted to p150.36 million and p157.68 million as of december 31, 2014 and 2013 respectively (see note 6).
as of december 31, 2014 and 2013, the carrying value of loans and receivables amounted to p1.73 billion and p1.49 billion, respectively. as of december 31, 2014 and 2013, the related allowance for impairment losses amounted to p3.75 million and p3.70 million, respectively (see note 7).
Impairment of AFS equity financial assetsThe group determines that aFs equity financial assets are impaired when there has been a significant or prolonged decline in the fair value below its cost. The determination of what is significant or prolonged requires judgment. The group treats ‘significant’ generally as 20% or more and ‘prolonged’ as continuous decline for a period of six (6) months or more. in making this judgment, the group evaluates among other factors, the normal volatility in share price for quoted securities. in addition, impairment may

annual report 2014 43
continuing our timeless excellence
be appropriate when there is evidence of deterioration in the financial health of the investee, industry and sector performance, changes in technology, and operational and financing cash flows.
as of december 31, 2014 and 2013, the carrying value of the group’s aFs equity financial assets amounted to p7.56 billion and p7.07 billion, respectively (see note 7).
impairment loss recognized on group’s aFs equity financial assets amounted to p14.58 million and p11.34 million in 2014 and 2013, respectively (see note 7).
Estimation of useful lives of computer software, investment properties and property and equipmentThe group reviews annually the estimated useful lives of computer software, investment properties and property and equipment, based on the period over which the assets are expected to be available for use. it is possible that future results of operations could be materially affected by changes in these estimates. a reduction in the estimated useful lives of computer software, investment properties and property and equipment would increase recorded depreciation and amortization expense and decrease the related asset accounts.
as of december 31, 2014 and 2013, the carrying value of the investment properties amounted to p27.17 million and p28.27 million, respectively (see note 11).
as of december 31, 2014 and 2013, the carrying value of the property and equipment amounted to p304.99 million and p308.00 million, respectively (see note 12).
as of december 31, 2014 and 2013, the carrying value of the computer software amounted to nil and p0.30 million, respectively (see note 13).
Evaluation of net realizable value of real estate properties for salereal estate properties for sale are valued at the lower of cost and nrv. This requires the group to make an estimate of the real estate properties’ estimated selling price in the ordinary course of business, cost of completion and costs necessary to make a sale to determine the nrv. The group adjusts the cost of its real estate properties to net realizable value based on its assessment of the recoverability of its real estate properties for sale. in determining the recoverability of its real estate properties for sale, management considers whether its real estate properties for sale are damaged or if their selling prices have declined.
likewise, management also considers whether the estimated costs of completion or the estimated costs to be incurred to make the sale have increased. in the event that nrv is lower than the cost, the decline is recognized as an expense. The amount and timing of recorded expenses for any period would differ if different judgments were made or different estimates were utilized. see note 13 for the related balances.
Impairment of nonfinancial assetsThe group assesses the impairment of its nonfinancial assets (i.e., investment properties, property and equipment and computer software) whenever events or changes in circumstances indicate that the carrying amount of the asset may not be recoverable. The factors that the group considers important which could trigger an impairment review include the following:
· significant underperformance relative to expected historical or projected future operating results;· significant changes in the manner of use of the assets; and· significant negative industry or economic trends.
The group recognizes an impairment loss whenever the carrying amount of an asset exceeds its recoverable amount. recoverable amounts are estimated for individual asset or, if it is not possible, for the cash-generating unit to which the asset belongs.
as of december 31, 2014 and 2013, the group has not recognized any impairment losses on its nonfinancial assets. see notes 11, 12 and 13 for related balances.
Recognition of deferred tax assetsdeferred tax assets are recognized for all deductible temporary differences to the extent that it is probable that taxable income will be available against which these can be utilized. significant management judgment is required to determine the amount of deferred tax assets that can be recognized. These assets are periodically reviewed for realization. periodic reviews cover the nature and amount of deferred income and expense items, expected timing when assets will be used or liabilities will be required to be reported, reliability of historical profitability of businesses expected to provide future earnings and tax planning strategies which can be utilized to increase the likelihood that tax assets will be realized. see note 24 for the related balances.
Estimating pension obligation and other retirement benefitsThe determination of pension obligation and cost of pension is dependent on the selection of certain assumptions used in calculating such amounts. Those assumptions include, among others, discount rates and salary increase rates.
due to the long-term nature of this plan, such estimates are subject to significant uncertainty.

44
The assumed discount rates were determined using the market yields on philippine government bonds with terms consistent with the expected employee benefit payout as of the reporting date. in accordance with pas 19, actual results that differ from the group’s assumptions are recognized immediately in other comprehensive income in the period in which they arise. while the group believes that the assumptions are reasonable and appropriate, significant differences in the actual experience or significant changes in the assumptions may materially affect the pension obligations.
as of december 31, 2014 and 2013, the carrying value of net pension obligation amounted to p204.79 million and p206.26 million, respectively (see note 17).
ContingenciesThe group is currently involved in various legal proceedings. The estimate of probable costs for the resolution of these claims has been developed in consultation with the legal counsels and based upon analysis of potential results. The group does not believe that these proceedings will have a material adverse effect on the group’s financial position.
4. cash and cash equivalents
This account consists of:
2014 2013cash on hand: petty cash fund p1,006,523 p1,044,702cash in banks: commercial banks and trust company (note 28) 819,422,436 800,077,900 Thrift banks, rural banks and cooperatives 5,304,095 3,688,829short-term deposits (note 28) 288,862,293 345,975,047
p1,114,595,347 p1,150,786,478
cash in banks earns annual interest at the respective bank rates.
short-term deposits are placed for varying periods of up to three (3) months depending on the immediate cash requirements of the group.
The range of annual interest rates of the short-term deposits follows:
2014 2013philippine peso 1.135% to 1.25% 0.25% to 4.50%us dollar 0.02% to 1.13% 0.09% to 1.35%
as of december 31, 2014 and 2013, time deposits amounting to p40,343,281 and p40,074,701, respectively, are held in the name of the insurance authority account of Miic and subsidiaries imposed by the Hong kong insurance authority (Hkia) pursuant to Hong kong insurance companies ordinance (cap. 41). These deposits shall be kept free from any liens, charges encumbrances, equities, or third party rights and cannot be released without the permission of the Hkia and that the account could only be operated by the designated authorized officers of the Hkia.
5. short-term investments
This account consists of time deposits with maturity of more than three months but less than one year from dates of placement and earns interest with annual rates ranging from 0.50% to 4.25% and 1.00% to 4.25% in 2014 and 2013, respectively.
interest earned on short-term investments amounted to p0.03 million and p0.13 million in 2014 and 2013, respectively (see note 20).
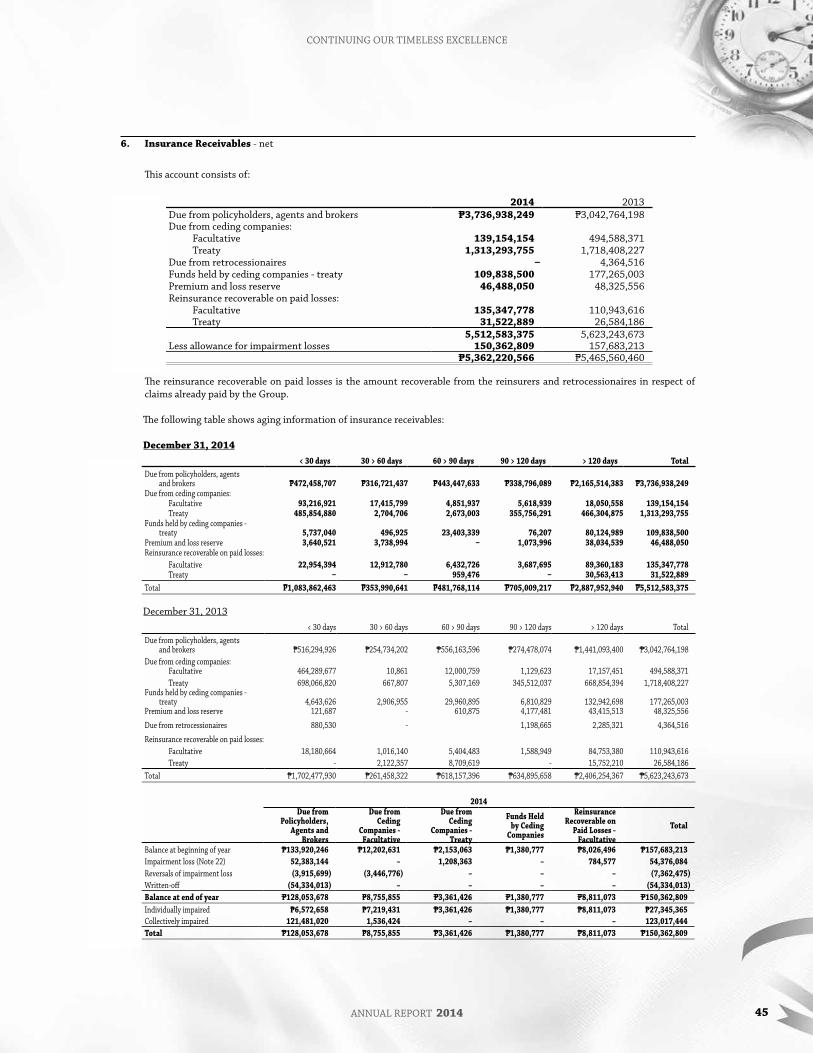
annual report 2014 45
continuing our timeless excellence
6. insurance receivables - net
This account consists of:
2014 2013due from policyholders, agents and brokers p3,736,938,249 p3,042,764,198due from ceding companies: Facultative 139,154,154 494,588,371 treaty 1,313,293,755 1,718,408,227due from retrocessionaires ‒ 4,364,516Funds held by ceding companies - treaty 109,838,500 177,265,003premium and loss reserve 46,488,050 48,325,556reinsurance recoverable on paid losses: Facultative 135,347,778 110,943,616 treaty 31,522,889 26,584,186
5,512,583,375 5,623,243,673less allowance for impairment losses 150,362,809 157,683,213
p5,362,220,566 p5,465,560,460
The reinsurance recoverable on paid losses is the amount recoverable from the reinsurers and retrocessionaires in respect of claims already paid by the group.
The following table shows aging information of insurance receivables:
december 31, 2014< 30 days 30 > 60 days 60 > 90 days 90 > 120 days > 120 days total
due from policyholders, agents and brokers p472,458,707 p316,721,437 p443,447,633 p338,796,089 p2,165,514,383 p3,736,938,249
due from ceding companies:Facultative 93,216,921 17,415,799 4,851,937 5,618,939 18,050,558 139,154,154treaty 485,854,880 2,704,706 2,673,003 355,756,291 466,304,875 1,313,293,755
Funds held by ceding companies - treaty 5,737,040 496,925 23,403,339 76,207 80,124,989 109,838,500
premium and loss reserve 3,640,521 3,738,994 ‒ 1,073,996 38,034,539 46,488,050reinsurance recoverable on paid losses:
Facultative 22,954,394 12,912,780 6,432,726 3,687,695 89,360,183 135,347,778treaty ‒ ‒ 959,476 ‒ 30,563,413 31,522,889
total p1,083,862,463 p353,990,641 p481,768,114 p705,009,217 p2,887,952,940 p5,512,583,375
december 31, 2013< 30 days 30 > 60 days 60 > 90 days 90 > 120 days > 120 days total
due from policyholders, agents and brokers p516,294,926 p254,734,202 p556,163,596 p274,478,074 p1,441,093,400 p3,042,764,198
due from ceding companies:Facultative 464,289,677 10,861 12,000,759 1,129,623 17,157,451 494,588,371treaty 698,066,820 667,807 5,307,169 345,512,037 668,854,394 1,718,408,227
Funds held by ceding companies - treaty 4,643,626 2,906,955 29,960,895 6,810,829 132,942,698 177,265,003
premium and loss reserve 121,687 - 610,875 4,177,481 43,415,513 48,325,556
due from retrocessionaires 880,530 - 1,198,665 2,285,321 4,364,516
reinsurance recoverable on paid losses:Facultative 18,180,664 1,016,140 5,404,483 1,588,949 84,753,380 110,943,616treaty - 2,122,357 8,709,619 - 15,752,210 26,584,186
total p1,702,477,930 p261,458,322 p618,157,396 p634,895,658 p2,406,254,367 p5,623,243,673
2014due from
policyholders,agents and
Brokers
due fromceding
companies -Facultative
due fromceding
companies -treaty
Funds heldby ceding
companies
reinsurance recoverable on
paid losses -Facultative
total
balance at beginning of year p133,920,246 p12,202,631 p2,153,063 p1,380,777 p8,026,496 p157,683,213impairment loss (note 22) 52,383,144 – 1,208,363 – 784,577 54,376,084reversals of impairment loss (3,915,699) (3,446,776) – – – (7,362,475)written-off (54,334,013) – – – – (54,334,013)Balance at end of year p128,053,678 p8,755,855 p3,361,426 p1,380,777 p8,811,073 p150,362,809individually impaired p6,572,658 p7,219,431 p3,361,426 p1,380,777 p8,811,073 p27,345,365collectively impaired 121,481,020 1,536,424 – – – 123,017,444total p128,053,678 p8,755,855 p3,361,426 p1,380,777 p8,811,073 p150,362,809
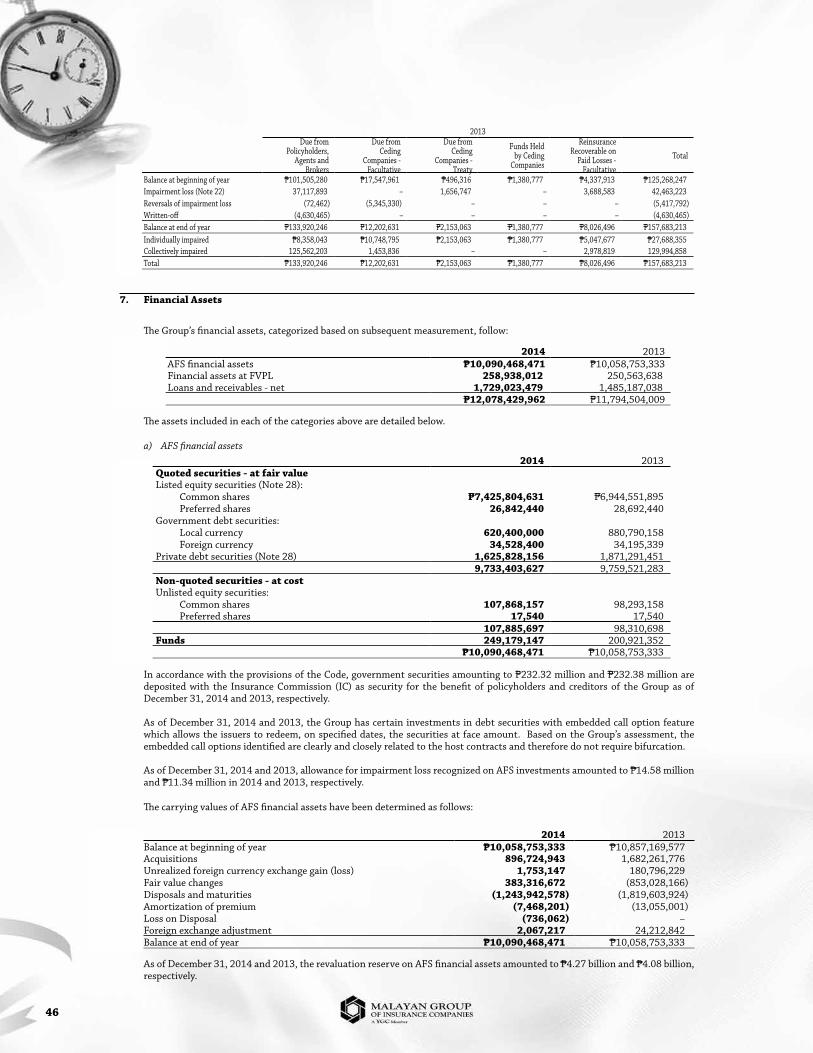
46
2013due from
policyholders,agents and
brokers
due fromceding
companies -Facultative
due fromceding
companies -treaty
Funds Heldby ceding
companies
reinsurance recoverable on
paid losses -Facultative
total
balance at beginning of year p101,505,280 p17,547,961 p496,316 p1,380,777 p4,337,913 p125,268,247impairment loss (note 22) 37,117,893 – 1,656,747 – 3,688,583 42,463,223reversals of impairment loss (72,462) (5,345,330) – – – (5,417,792)written-off (4,630,465) – – – – (4,630,465)balance at end of year p133,920,246 p12,202,631 p2,153,063 p1,380,777 p8,026,496 p157,683,213individually impaired p8,358,043 p10,748,795 p2,153,063 p1,380,777 p5,047,677 p27,688,355collectively impaired 125,562,203 1,453,836 – – 2,978,819 129,994,858total p133,920,246 p12,202,631 p2,153,063 p1,380,777 p8,026,496 p157,683,213
7. Financial assets
The group’s financial assets, categorized based on subsequent measurement, follow:
2014 2013aFs financial assets p10,090,468,471 p10,058,753,333Financial assets at Fvpl 258,938,012 250,563,638loans and receivables - net 1,729,023,479 1,485,187,038
p12,078,429,962 p11,794,504,009
The assets included in each of the categories above are detailed below.
a) AFS financial assets2014 2013
quoted securities - at fair valuelisted equity securities (note 28): common shares p7,425,804,631 p6,944,551,895 preferred shares 26,842,440 28,692,440government debt securities: local currency 620,400,000 880,790,158 Foreign currency 34,528,400 34,195,339private debt securities (note 28) 1,625,828,156 1,871,291,451
9,733,403,627 9,759,521,283non-quoted securities - at costunlisted equity securities: common shares 107,868,157 98,293,158 preferred shares 17,540 17,540
107,885,697 98,310,698Funds 249,179,147 200,921,352
p10,090,468,471 p10,058,753,333
in accordance with the provisions of the code, government securities amounting to p232.32 million and p232.38 million are deposited with the insurance commission (ic) as security for the benefit of policyholders and creditors of the group as of december 31, 2014 and 2013, respectively.
as of december 31, 2014 and 2013, the group has certain investments in debt securities with embedded call option feature which allows the issuers to redeem, on specified dates, the securities at face amount. based on the group’s assessment, the embedded call options identified are clearly and closely related to the host contracts and therefore do not require bifurcation.
as of december 31, 2014 and 2013, allowance for impairment loss recognized on aFs investments amounted to p14.58 million and p11.34 million in 2014 and 2013, respectively.
The carrying values of aFs financial assets have been determined as follows:
2014 2013balance at beginning of year p10,058,753,333 p10,857,169,577acquisitions 896,724,943 1,682,261,776unrealized foreign currency exchange gain (loss) 1,753,147 180,796,229Fair value changes 383,316,672 (853,028,166)disposals and maturities (1,243,942,578) (1,819,603,924)amortization of premium (7,468,201) (13,055,001)loss on disposal (736,062) –Foreign exchange adjustment 2,067,217 24,212,842balance at end of year p10,090,468,471 p10,058,753,333
as of december 31, 2014 and 2013, the revaluation reserve on aFs financial assets amounted to p4.27 billion and p4.08 billion, respectively.

annual report 2014 47
continuing our timeless excellence
The rollforward analysis of the revaluation reserve on aFs financial assets follow:
2014 2013balance at beginning of year p4,076,183,430 p5,281,376,878Fair value gain (loss) credited to (charged against) equity 383,316,672 (853,028,166)impairment loss (note 20) 14,582,339 11,337,676realized gain transferred to profit or loss (182,706,665) (362,031,799)tax effect of net fair value losses (gains) (note 24) (9,140,521) 25,435,155Foreign exchange adjustment 12,890,966 1,211,358
p4,295,126,221 p4,104,301,102
attributable to: equity holders of the parent company p4,268,246,821 p4,032,478,890 non-controlling interests 26,879,400 71,822,212
p4,295,126,221 p4,104,301,102
b) Financial assets at FVPLThis account consists of foreign currency-denominated securities with details as follow:
2014 2013Held for tradingequity securities:
listed p177,467,608 p162,507,162Designated as at FVPL on initial recognitionprivate debt securities 81,470,404 80,974,349investment funds ‒ 4,826,881listed equity securities ‒ 2,255,246
81,470,404 88,056,476p258,938,012 p250,563,638
The fair value gain on financial assets at Fvpl recognized in the consolidated statements of income amounted to p7.15 million and p15.68 million in 2014 and 2013, respectively (see note 20).
The carrying values of financial assets at Fvpl have been determined as follows:
2014 2013balances at beginning of year p250,563,638 p217,541,191acquisitions 64,793,752 190,843,805Fair value gain (note 20) 7,151,939 15,676,768disposals and maturities (65,412,257) (190,742,540)Foreign exchange adjustment 1,840,940 17,244,414balance at end of year p258,938,012 p250,563,638
c) Loans and receivables - net
This account consists of:2014 2013
long-term commercial papers (note 28) p1,196,760,653 p1,094,933,008notes receivable (note 28) 297,114,526 293,932,031accounts receivable 169,869,528 26,988,454creditable withholding tax 62,677,478 62,677,478due from related party (note 28) 3,629,034 450,806cash advances 1,566,577 3,065,893claims recoverable 811,250 6,500,000security fund 342,294 342,294
1,732,771,340 1,488,889,964less allowance for impairment losses 3,747,861 3,702,926
p1,729,023,479 p1,485,187,038
long-term commercial papers pertain to the group’s investments in unquoted private debt securities and corporate notes with terms of 2 to 15 years and bear annual interest rates ranging from 1.13% to 9.00% in 2014 and from 3.25% to 9.33% in 2013.
The group provides for the 50% of the cost of the car and motor plans extended to its managers and officers as part of their benefits. The employee’s share is recorded as notes receivable which is collected through salary deductions for a period of five (5) years with annual interest rates of 8.00% for car loans and 8.50% for motor loans.
as of december 31, 2014 and 2013, accounts and notes receivable with carrying value of p3.75 million and p3.70 million, respectively, was specifically determined as impaired and was fully provided with allowance. The group recognized additional allowance of p0.05 million in 2014.
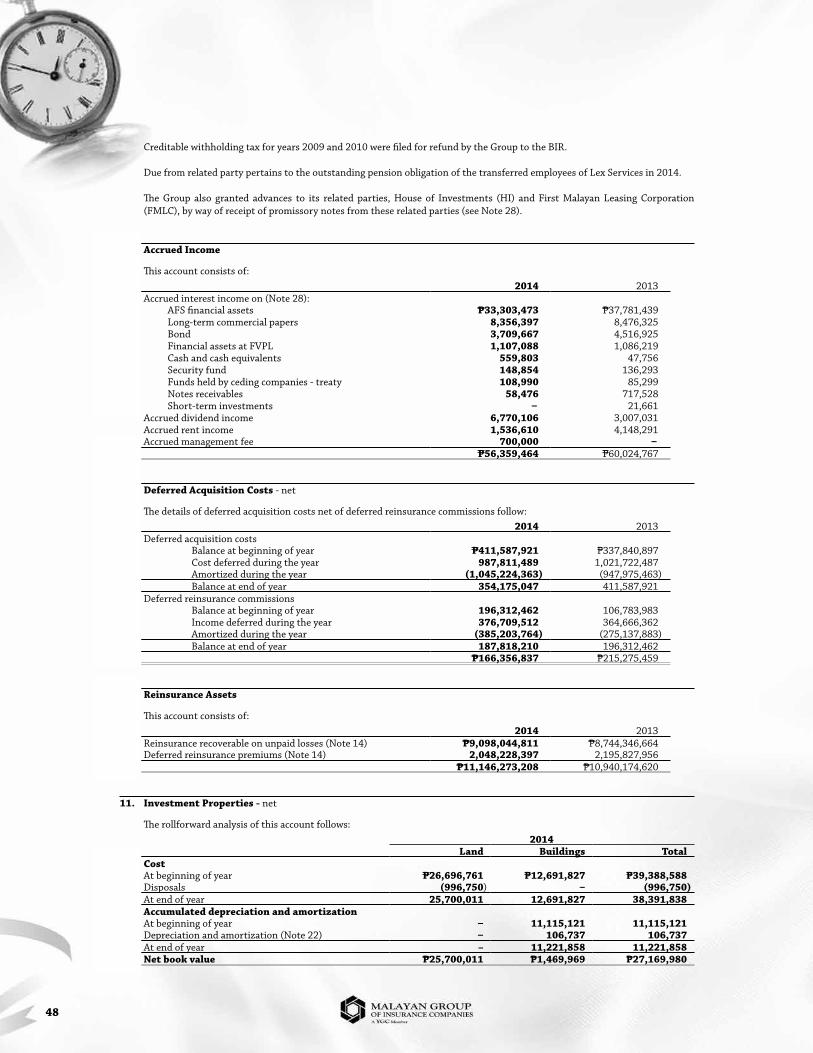
48
creditable withholding tax for years 2009 and 2010 were filed for refund by the group to the bir.
due from related party pertains to the outstanding pension obligation of the transferred employees of lex services in 2014.
The group also granted advances to its related parties, House of investments (Hi) and First Malayan leasing corporation (FMlc), by way of receipt of promissory notes from these related parties (see note 28).
8. accrued income
This account consists of:2014 2013
accrued interest income on (note 28):aFs financial assets p33,303,473 p37,781,439long-term commercial papers 8,356,397 8,476,325bond 3,709,667 4,516,925Financial assets at Fvpl 1,107,088 1,086,219cash and cash equivalents 559,803 47,756security fund 148,854 136,293Funds held by ceding companies - treaty 108,990 85,299notes receivables 58,476 717,528short-term investments ‒ 21,661
accrued dividend income 6,770,106 3,007,031accrued rent income 1,536,610 4,148,291accrued management fee 700,000 ‒
p56,359,464 p60,024,767
9. deferred acquisition costs - net
The details of deferred acquisition costs net of deferred reinsurance commissions follow:2014 2013
deferred acquisition costs balance at beginning of year p411,587,921 p337,840,897 cost deferred during the year 987,811,489 1,021,722,487 amortized during the year (1,045,224,363) (947,975,463) balance at end of year 354,175,047 411,587,921deferred reinsurance commissions balance at beginning of year 196,312,462 106,783,983
income deferred during the year 376,709,512 364,666,362amortized during the year (385,203,764) (275,137,883)
balance at end of year 187,818,210 196,312,462p166,356,837 p215,275,459
10. reinsurance assets
This account consists of:2014 2013
reinsurance recoverable on unpaid losses (note 14) p9,098,044,811 p8,744,346,664deferred reinsurance premiums (note 14) 2,048,228,397 2,195,827,956
p11,146,273,208 p10,940,174,620
11. investment properties - net
The rollforward analysis of this account follows:2014
land Buildings totalcostat beginning of year p26,696,761 p12,691,827 p39,388,588disposals (996,750) ‒ (996,750)at end of year 25,700,011 12,691,827 38,391,838accumulated depreciation and amortizationat beginning of year ‒ 11,115,121 11,115,121depreciation and amortization (note 22) ‒ 106,737 106,737at end of year – 11,221,858 11,221,858net book value p25,700,011 p1,469,969 p27,169,980

annual report 2014 49
continuing our timeless excellence
2013
land buildings construction in-progress total
costat beginning of year p29,023,039 p12,691,827 p78,194,608 p119,909,474additions – – 11,411,830 11,411,830disposals (2,326,278) – (89,606,438) (91,932,716)at end of year 26,696,761 12,691,827 – 39,388,588accumulated depreciation and
amortizationat beginning of year – 11,008,384 – 11,008,384depreciation and amortization
(note 22) – 106,737 – 106,737at end of year – 11,115,121 – 11,115,121net book value p26,696,761 p1,576,706 p– p28,273,467
rental income from investment properties recognized in the consolidated statement of income amounted to p22.51 million and p27.66 million in 2014 and 2013, respectively (see note 20). direct operating expenses arising from investment properties amounted to p16.40 million and p9.38 million in 2014 and 2013, respectively (see note 23).
on october 1, 2009, Mico, rcbc savings bank, inc. (rsb), rizal commercial banking corporation (rcbc), bankard inc., great pacific life assurance corporation (grepalife) and Hexagonland corporation signed a Joint venture agreement for the construction and development of a twenty seven (27)-storey, high-rise mixed used commercial/office building to be known as the “rcbc savings bank building project”.
The total construction period is estimated at thirty-nine (39) months and the total cost is estimated at p2.20 billion, of which Mico shall contribute 4.47% in cash contributions.
on october 2, 2012, Mico, rsb, rcbc, bankard, inc. and grepalife executed a Memorandum of understanding (Mou) agreeing in principle to cancel or revoke the Jva, subject to the approval of the bangko sentral ng pilipinas (bsp). in the said Mou, rcbc was allowed to continue the construction and completion of the building project by purchasing the land from rsb and returning the cash contributions of rsb, bankard, inc. and Mico.
on March 13, 2013, through Monetary board (Mb) resolution no. 405 dated March 7, 2013, the bsp confirmed the acquisition of rcbc of the land contributed by rsb, as well as the rights and interests of Mico, rsb, bankard, inc. and grepalife to the building project.
on april 11, 2013, Mico received its share in contribution to rsb building project amounting to p89.60 million with interest amounting to p7.69 million.
buildings with book value of p1.47 million and p1.58 million have fair value amounting to p5.14 million and p3.36 million as of december 31, 2014 and 2013, respectively. parcels of land with book value of p25.7 million and p26.70 million have fair value amounting to p328.16 million and p451.32 million as of december 31, 2014 and 2013, respectively. The fair values of the investment properties were determined by independent professionally qualified appraisers.
The fair value of the land and buildings were arrived at using the Market Data Approach. in this approach, the value of the land and buildings are based on sales and listings of comparable property registered within the vicinity. The technique of this approach requires the establishment of comparable property by reducing reasonable comparative sales and listings to a common denominator. This is done by adjusting the differences between the subject property and those actual sales and listings regarded as comparable. The properties used as basis of comparison are situated within the immediate vicinity of the subject property.
The group’s highest and best use is consistent with its current use.
depreciation and amortization expense pertaining to investment properties amounted to p0.11 million in 2014 and 2013 (see note 22).
50
12. property and equipment - net
The rollforward analysis of this account as of december 31, 2014 and 2013 follows:
2014
land
Building,Building
equipment andimprovements
officeFurniture,
Fixtures andequipment
transportationequipment
leaseholdimprovements total
costat beginning of year p1,013,187 p211,702,405 p487,925,254 p82,695,523 p60,080,387 p843,416,756additions ‒ 6,469,564 22,715,852 19,708,525 20,904,909 69,798,850disposals ‒ (3,245,934) (10,683) (6,504,736) (12,596,570) (22,357,923)Foreign exchange adjustment ‒ ‒ 4,686 ‒ ‒ 4,686at end of year 1,013,187 214,926,035 510,635,109 95,899,312 68,388,726 890,862,369accumulated depreciation and amortizationat beginning of year ‒ 74,983,403 365,568,006 48,842,456 46,023,007 535,416,872depreciation and amortization (note 22)
‒ 8,631,711 39,620,722 11,606,542 10,858,800 70,717,775
disposals ‒ (3,245,932) (5,697) (4,418,483) (12,596,570) (20,266,682)Foreign exchange adjustment ‒ ‒ 4,365 ‒ ‒ 4,365at end of year ‒ 80,369,182 405,187,396 56,030,515 44,285,237 585,872,330net book value p1,013,187 p134,556,853 p105,447,713 p39,868,797 p24,103,489 p304,990,039
2013
land
building,building
equipment andimprovements
officeFurniture,
Fixtures andequipment
transportationequipment
leaseholdimprovements total
costat beginning of year p1,013,187 p207,739,594 p352,351,730 p80,382,130 p59,737,437 p701,224,078additions 3,962,811 51,649,617 6,820,426 342,950 62,775,804transfers 83,950,377 ‒ ‒ 83,950,377disposals (76,091) (4,507,033) ‒ (4,583,124)Foreign exchange adjustment 49,621 ‒ ‒ 49,621at end of year 1,013,187 211,702,405 487,925,254 82,695,523 60,080,387 843,416,756accumulated depreciation and amortizationat beginning of year – 66,438,847 304,007,442 48,408,067 39,478,806 458,333,162transfers ‒ ‒ 19,342,688 ‒ ‒ 19,342,688depreciation and amortization (note 22) ‒ 8,544,556 42,234,299 4,571,116 6,544,201 61,894,172
disposals ‒ ‒ (58,976) (4,136,727) ‒ (4,195,703)Foreign exchange adjustment ‒ ‒ 42,553 ‒ ‒ 42,553at end of year – 74,983,403 365,568,006 48,842,456 46,023,007 535,416,872net book value p1,013,187 p136,719,002 p122,357,248 p33,853,067 p14,057,380 p307,999,884
depreciation and amortization expense charged against operations amounted to p70.72 million and p61.89 million 2014 and 2013, respectively (see note 22).
13. other assets
This account consists of:
2014 2013creditable withholding taxes p294,113,007 p242,346,423real estate properties for sale - at cost 90,374,300 92,454,300prepayments 9,363,229 5,884,677refundable deposits 8,888,739 22,782,240Forms and supplies inventory 6,242,183 9,478,417computer software - net ‒ 302,376Miscellaneous assets 35,398,152 13,297,237
p444,379,610 p386,545,670
creditable withholding tax pertains to the group’s tax withheld at source by its customers and is creditable against the income tax liability of the group.
annual report 2014 51
continuing our timeless excellence
real estate properties for sale consist of investments in Malayan plaza condominium units and memorial lots. as of december 31, 2014 and 2013, amounts of the real estate properties for sale are as follows:
2014 2013Malayan plaza condominium units p83,294,300 p83,294,300Memorial lots 7,080,000 9,160,000
p90,374,300 p92,454,300
cost of real estate properties disposed in 2014 and 2013 amounted to p2.08 million and p0.57 million, respectively.
Miscellaneous assets pertain to documentary stamp tax inventory, input vat, deferred input vat and the group’s share in its employees’ car and motor plans.
14. insurance contract liabilities and reinsurance assets
short-term insurance contract liabilities and reinsurers’ share of liabilities may be analyzed as follows:
2014 2013
insurancecontract
liabilities
reinsurers’share of
liabilities(see note 10)
netinsurance
contractliabilities
reinsurers’share of
liabilities(see note 10)
net
provision for claims reported and loss adjustment p10,494,792,641 p8,839,351,730 p1,655,440,911 p10,282,365,075 p8,486,873,391 p1,795,491,683
provision for ibnr losses 383,471,213 258,693,081 124,778,132 380,082,329 257,473,273 122,609,056total claims reported and ibnr 10,878,263,854 9,098,044,811 1,780,219,043 10,662,447,404 8,744,346,664 1,918,100,740provision for unearned premiums 3,486,665,287 2,048,228,397 1,438,436,890 3,570,350,843 2,195,827,956 1,374,522,887total insurance contract liabilities p14,364,929,141 p11,146,273,208 p3,218,655,933 p14,232,798,247 p10,940,174,620 p3,292,623,627
provisions for claims reported by policyholders and claims ibnr may be analyzed as follows:
2014 2013
insurancecontract
liabilities
reinsurers’ share of
liabilities(see note 10)
netinsurance
contractliabilities
reinsurers’share of
liabilities(see note 10)
net
balance at beginning of year p10,662,447,404 p8,744,346,663 p1,918,100,741 p5,496,454,856 p3,606,385,741 p1,890,069,115claims incurred during the year 4,234,063,200 2,824,726,727 1,409,336,473 7,648,327,636 6,130,634,903 1,517,692,733increase in ibnr 19,000,000 ‒ 19,000,000 296,285,282 290,276,818 6,008,464total claims reported and claims ibnr 14,915,510,604 11,569,073,390 3,346,437,214 13,441,067,774 10,027,297,462 3,413,770,312claims paid during the year (note 21) (4,037,246,750) (2,471,028,579) (1,566,218,171) (2,778,620,370) (1,282,950,799) (1,495,669,571)balance at end of year p10,878,263,854 p9,098,044,811 p1,780,219,043 p10,662,447,404 p8,744,346,663 p1,918,100,741
provision for unearned premiums may be analyzed as follows:
2014 2013
insurancecontract
liabilities
reinsurers’ share of
liabilities(see note 10)
netinsurance
contractliabilities
reinsurers’share of
liabilities(see note 10)
net
balance at beginning of year p3,570,350,842 p2,195,827,957 p1,374,522,885 p3,041,799,036 p1,559,476,852 p1,482,322,184new policies written during the year
(note 19) 7,842,400,305 4,945,389,665 2,897,010,640 7,586,161,283 5,166,955,536 2,419,205,747
premiums earned during the year (note 19) (7,926,085,860) (5,092,989,225) (2,833,096,635) (7,057,609,477) (4,530,604,431) (2,527,005,046)
balance at end of year p3,486,665,287 p2,048,228,397 p1,438,436,890 p3,570,350,842 p2,195,827,957 p1,374,522,885
15. insurance payables
This account consists of:
2014 2013due to reinsurers p2,293,390,994 p2,374,185,839Funds held for reinsurers 543,566,974 1,381,587,189
p2,836,957,968 p3,755,773,028
52
The rollforward analysis of insurance payables follows:
due toreinsurers
Funds heldfor reinsurers total
at January 1, 2013 p1,797,539,157 p572,749,756 p2,370,288,913arising during the year 1,240,458,944 920,507,635 2,160,966,579paid during the year (663,812,262) (111,670,202) (775,482,464)at december 31, 2013 2,374,185,839 1,381,587,189 3,755,773,028arising during the year 3,354,350,911 362,801,869 3,717,152,780paid during the year (3,435,145,756) (1,200,822,084) (4,635,967,840)at december 31, 2014 p2,293,390,994 p543,566,974 p2,836,957,968
16. accounts payable, accrued expenses and other liabilities
This account consists of:
2014 2013accounts payable p890,218,761 p695,224,632commissions payable 477,463,519 304,824,160deferred output value-added tax (vat) 280,104,943 220,880,003accrued expenses 150,422,981 142,518,221accrued taxes 146,552,932 111,520,034dividends payable 57,197,725 ‒surety deposits 49,282,432 32,455,278documentary stamp taxes payable 22,201,182 126,625,122output vat 15,645,850 28,117,240deposits payable 7,132,247 4,133,104others 19,958,372 7,029,196
p2,116,180,944 p1,673,326,990
all accounts payable and accrued expenses are due within one year.
accounts payable pertain to unpaid purchases of goods and services from suppliers.
commissions payable are unpaid commissions on the group’s direct business, payable to agents and brokers which are due upon collection of the related premiums receivables.
accrued expenses pertain to accrual of monthly expenditures of the group. This includes expenses for utilities, allocated common expenses for the use of Y tower 1 and 2 and other expenses that are necessary to carry out the operations of the group.
accrued taxes include tax withheld, fringe benefit tax, local government tax, fire service tax and premiums tax.
17. pension
The group has a defined benefit plan, covering substantially all of its employees, which requires contribution to be made to administered funds. The plan is administered by a local bank as trustee. The group’s trustee bank is rcbc. The transactions of the fund are being approved by the president of the group.
The following tables summarize the components of net pension benefit expense recognized in the consolidated statements of income and the funded status and amounts recognized in the consolidated statements of financial position for the retirement plan.
The net pension benefit expense recognized in the consolidated statements of income, under employee benefits (see note 22), follows:
2014 2013current service cost p47,740,918 p38,586,701interest cost 8,945,333 8,002,164net benefit expense p56,686,251 p46,588,865actual return on plan assets p20,385,764 p2,821,334

annual report 2014 53
continuing our timeless excellence
The remeasurement effects recognized in the consolidated statements of comprehensive income follows:
2014 2013actuarial loss p20,475,695 p36,981,474return on assets (excluding amount included in net interest cost) (4,671,230) 12,743,624
total amount recognized in oci p15,804,465 p49,725,098
The net pension obligation of the group follows:2014 2013
present value of pension benefit obligation p501,259,343 p512,663,620Fair value of plan assets (296,471,317) (306,402,944)
p204,788,026 p206,260,676
The reconciliation of the present value of the pension benefit obligation follows:
2014 2013balance at beginning of year p512,663,620 p454,588,535current service cost 44,652,122 38,586,701interest cost 25,260,729 23,567,122actuarial loss 8,379,109 36,981,474present value of obligation of transferred employee 3,041,671 409,016benefits paid (92,737,908) (41,469,228)
p501,259,343 p512,663,620
The reconciliation of the fair value of the plan assets follows:
2014 2013balance at beginning of year p306,402,944 p299,916,273interest income 9,304,714 15,564,958contributions by employer 62,420,517 45,134,565actuarial loss (gain) 11,081,050 (12,743,624)benefits paid (92,737,908) (41,469,228)balance at end of year p296,471,317 p306,402,944
The distribution of the plan assets as of december 31, 2014 and 2013 follows:
2014 2013cash p53,675,133 p61,806,617receivables 7,652,198 8,921,389investments in: equity securities 122,747,027 107,587,310 government securities 25,815,158 50,365,505 other securities and debt instruments 88,016,019 78,904,897
297,905,535 307,585,718less accrued trust fees and other payables 1,434,218 1,182,774
p296,471,317 p306,402,944
The following presents the transactions of the group’s retirement fund with related parties:
2014 2013category Balance balance terms conditionsOther related parties RCBC
savings deposits p23,804 p1,694 interest rate at 0.25% to 4.50% p.a
unsecured; no impairment
time deposits 2,115,455 ‒ ‒ unsecured; no impairment
corporate bonds ‒ 14,805,715interest rates at 0%to 3.25%: terms of
3.5 to 5.5 years
unsecured; no impairment
common stocks 12,639,456 11,191,185 ‒unsecured; no
impairment HI
common stocks 2,417,258 2,429,049 ‒ unsecured; no impairment
FMLC
common stocks ‒ 2,547,990 ‒ unsecured; no impairment

54
The principal actuarial assumptions used in determining plan assets and obligations are as follows:
2014 2013salary increase rate 5.00% 5.00%discount rate 4.48% to 4.68% 4.48% to 5.27%
The overall expected return on plan assets is determined based on the market expectations prevailing as of december 31, 2014 and 2013 applicable to the period over which the obligation is to be settled.
The group expects to contribute p43.19 million to the retirement fund in 2015.
SensitivitiesThe sensitivity analysis below has been determined based on reasonably possible changes of each significant assumption on the defined benefit obligation as of the end of the reporting period, assuming all other assumptions were held constant:
2014
change in variables
impact on present value of defined benefit obligation
increase (decrease)
percentage change
discount rate +0.5% (p375,307,749) 6.35%–0.5% 399,432,305 (0.33%)
salary increase rate +1.0% p415,824,329 3.76%–1.0% (367,907,050) (8.20%)
2013
change in variables
impact on present value of defined benefit obligation
increase (decrease)
percentage change
discount rate +0.5% p389,764,941 (6.49%)–0.5% 419,518,690 0.65%
salary increase rate +1.0% p439,288,689 5.39%–1.0% (383,059,767) (8.10%)
The average future working years of service is 20 to 27 years.
The maturity analysis of the undiscounted benefit payments as of december 31, 2013 based on normal retirements (retirement age of 60 only) is as follows:
Year of retirement no. of retirees total Benefit2014 4 p47,669,7342015 21 66,282,5382016 50 265,554,9142017 94 409,315,2362018 79 510,116,738after 2018 491 3,003,667,742
18. cash dividends and other revaluation reserve
The company’s capital stock consists of:
2014 2013shares amount shares amount
authorized: common stock =100 par value 10,000,000 p1,000,000,000 10,000,000 p1,000,000,000
issued and outstanding: at beginning of year 6,000,000 p600,000,000 6,000,000 p600,000,000 at end of the year 6,000,000 p600,000,000 6,000,000 p600,000,000
retained earningsretained earnings include the accumulated equity in undistributed net earnings of consolidated subsidiaries amounting to p4,102,493,353 and p4,998,559,754, respectively, as of december 31, 2014 and 2013 which are not available for dividend declaration by the parent company.

annual report 2014 55
continuing our timeless excellence
Other Revaluation Reserveon april 10, 2008, Mico’s bod and stockholders approved the articles of merger and plan of merger between tMMic and Mico. tMMic is a 50-50 joint venture company owned by Mico and tokio Marine asia pte., ltd. (tokio Marine). on July 2, 2008, the sec approved the articles and plan of merger. The effects of the merger were reckoned from January 1, 2008. The merger was accounted for as a business combination in accordance with pFrs 3. tMMic and Mico became a single corporation, with Mico as the surviving corporation. tMMic ceased to exist and its legal personality was terminated. as at the date of acquisition, the identifiable assets and liabilities of tMMic have been measured at fair value resulting in a difference of p46,933,294 against its carrying values. The difference between the carrying value and fair value pertains mainly to the increase in the appraised value of the building. Mico recorded the appraisal increase amounting to p23,466,647 pertaining to its previously held interest as “other revaluation reserve” in the equity section of the consolidated statement of financial position.
equity reserveon november 7, 2014, the parent company sold to tokyo Marine asia 737,660 shares or 8.7% shares for p1.03 billion that resulted to a gain of p1.02 billion.
19. net premiums earned
gross premiums earned and reinsurers’ share of gross premiums earned consist of the following:
2014 2013gross premiums on insurance contracts
(see note 14) p7,842,400,305 p7,586,161,283gross change in provision for unearned premiums 83,685,555 (528,551,807)Gross premiums earned (see note 14) 7,926,085,860 7,057,609,476reinsurers’ share of gross premiums on insurance contracts
(see note 14) 4,945,389,665 5,166,955,537
reinsurers’ share of gross change in provision for unearned premiums 147,599,560 (636,351,104)
reinsurers’ share of gross premiums earned on insurance contacts (see note 14) 5,092,989,225 4,530,604,433
net premiums earned p2,833,096,635 p2,527,005,043
20. investment and other income and investment and other expense
Investment and other income
This account consists of:2014 2013
dividend income (note 28) p284,017,813 p266,718,139interest income (note 28): aFs financial assets 159,429,839 192,106,906 long-term commercial papers 61,673,900 54,780,166 cash and cash equivalents 16,427,724 28,167,072 Financial assets at Fvpl 2,815,705 ‒ notes receivables 832,824 15,288,862 Funds held by ceding companies 520,199 1,448,640 short-term investments (note 5) 28,034 134,691 others 1,366,128 11,531,568gain on sale of: aFs financial assets (note 7) 182,328,348 97,809,343 real estate for sale 11,420,817 2,397,054 Financial assets at Fvpl 2,466,564 ‒ property and equipment (note 12) 627,221 557,702 investment property 246,074 3,077,475
long-term commercial paper ‒ 1,782,814rental income (notes 11 and 28) 22,507,064 27,660,986Foreign currency exchange gains 22,283,800 119,410,727Fair value gains on financial assets at Fvpl (note 7) 7,151,939 15,676,768others 8,244,832 4,736,481
p784,388,825 p843,285,394

56
Investment and other expense
This account consists of the following
2014 2013investment expense p24,721,278 p11,792,536impairment loss on aFs (note 7) 14,582,339 11,337,336interest expense on reinsurance funds held 6,326,731 1,415,843loss on sale of financial assets at Fvpl ‒ 2,115,610
p45,630,348 p26,661,325
as of december 31, 2014 and 2013, the foreign exchange gain from non-deliverable foreign exchange forward contracts entered into by the parent company to hedge its exposure on foreign currency risk amounted to p16.5 million and p69.57 million, respectively. in 2014 and 2013, the weighted average rate of exchange rate of these forward currency contracts are p44.48 and p42.16, respectively.
The unrealized foreign exchange loss as of december 31, 2014 and 2013 amounted to p35.78 million and p209.57 million, respectively.
21. insurance contract Benefits and claims paid
gross insurance contract benefits and claims paid consist of:2014 2013
gross insurance contract benefitsand claims paid: direct insurance p3,438,534,098 p1,960,183,452 assumed reinsurance 598,712,652 818,436,918total gross insurance contract benefitsand claims paid (see note 14) p4,037,246,750 p2,778,620,370
reinsurers’ share of gross insurance contract benefits and claims paid consist of:2014 2013
reinsurers’ share of insurance contract benefitsand claims paid:direct insurance p2,349,317,096 p1,092,481,662assumed reinsurance 121,711,483 190,469,136
total reinsurers’ share of gross insurancecontract benefits and claims paid (see note 14) p2,471,028,579 p1,282,950,798
gross change in insurance contract liabilities consist of:
2014 2013change in provision for claims reported: direct insurance (p601,331,431) p2,053,857,711 assumed reinsurance 798,147,881 2,815,849,557change in provision for ibnr 19,000,000 296,285,282 total gross change in insurance contract liabilities
(see note 14) p215,816,450 p5,165,992,550
reinsurers’ shares of gross change in insurance contract liabilities consist of:
2014 2013reinsurers’ share of gross insurance contract liabilities: direct insurance (p474,305,288) p2,133,910,305 assumed reinsurance 828,003,435 2,713,773,799change in provision for ibnr – 290,276,818total reinsurers’ share of gross change in insurance
contract liabilities (see note 14) p353,698,147 p5,137,960,922
annual report 2014 57
continuing our timeless excellence
22. General and administrative expenses
This account consists of:
2014 2013
salaries, wages and allowances (note 28) p548,583,791 p502,200,993depreciation and amortization (notes 11, 12 and 13) 70,824,512 62,000,909rent, light and water (notes 23 and 28) 60,730,763 53,584,333professional fees 64,466,216 51,490,556transportation and travel 49,537,329 45,882,303provisions for impairment loss - net of reversals (notes 6) 47,013,609 37,045,431advertising and promotions 39,729,735 36,666,970postage, telephone and cable 43,879,473 33,832,518printing and office supplies 33,662,551 23,667,082entertainment, amusement and recreation 35,674,677 22,385,492repairs and maintenance 21,974,746 12,439,614business development 9,505,070 9,051,457taxes, licenses and fees 4,378,120 6,917,867Membership and association dues 3,860,560 3,622,036Management fees 1,830,079 1,756,670donations and contributions 1,329,573 1,215,784insurance 1,208,161 922,227others 39,027,167 43,782,572
p1,077,216,132 p948,464,814
23. leases
operating leases - group as lessor
The group entered into various lease agreements for its office spaces. These leases generally have terms of one year, renewable every year.
operating leases - group as lessee
The group entered into various property leases with various lessors for office space of its head office and local and provincial branches. These leases generally have terms of one year, renewable every year.
24. income tax
The provision for income tax consists of:2014 2013
Final p133,123,511 p28,141,611current 10,600,905 7,441,100deferred 4,811,443 (596,371)
p148,535,859 p34,986,340
The group’s net deferred tax assets (liabilities) consist of:2014 2013
deferred tax assets: excess of provision for unearned premiums
per books over tax basis p204,882,979 p820,235,548 deferred reinsurance commissions 55,218,341 59,392,388 allowance for impairment losses 44,086,391 46,742,722 provision for ibnr losses 33,570,027 28,433,622 unamortized past service costs 22,142,294 20,368,113
nolco 6,703,731 6,703,731 pension obligation 5,799,941 5,269,659 accrual for short-term benefits 4,192,766 4,192,766
376,596,470 991,338,549deferred tax asset through equity: pension obligation 56,274,649 53,809,759deferred tax liabilities: deferred reinsurance premiums (114,172,795) (701,502,462) deferred acquisition costs (105,113,744) (123,574,906)
excess of provision for unearned premiums per books over tax basis (1,291,322) (4,080,445)
unrealized foreign exchange gains (60,765,038) (62,871,123)(281,342,899) (892,028,936)
deferred tax liability through equity: net unrealized gain on aFs financial assets (44,150,363) (34,343,746)
p107,377,857 p118,775,626
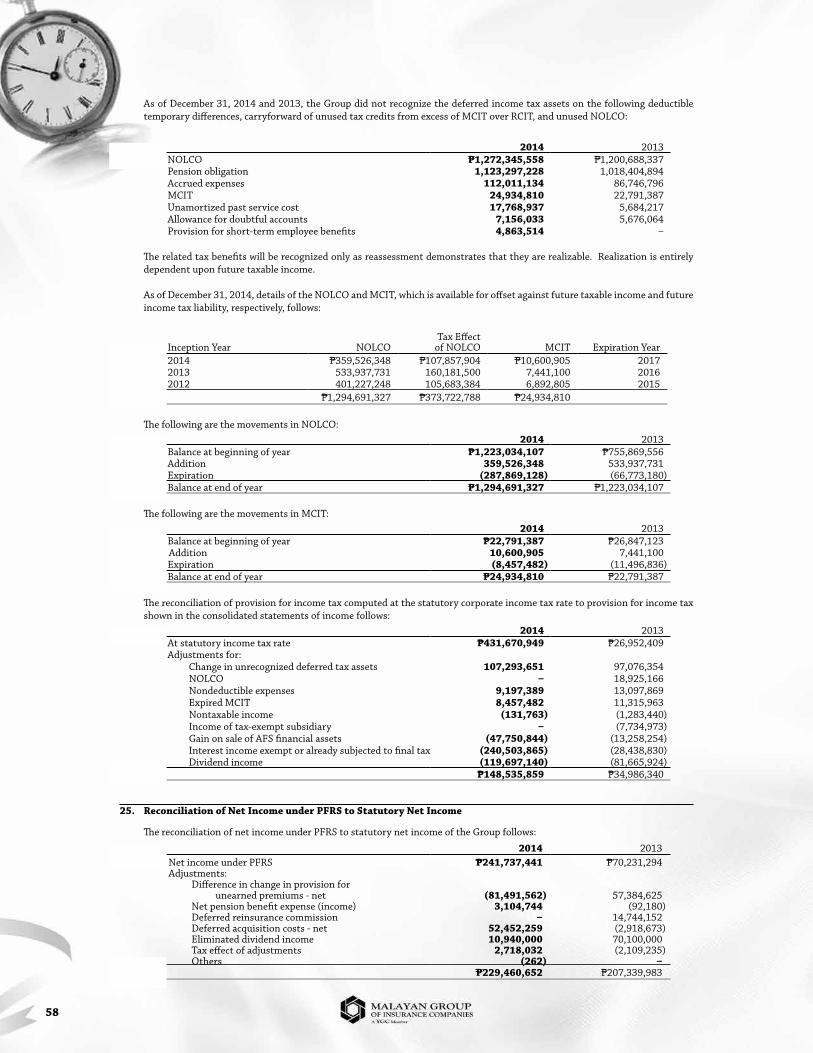
58
as of december 31, 2014 and 2013, the group did not recognize the deferred income tax assets on the following deductible temporary differences, carryforward of unused tax credits from excess of Mcit over rcit, and unused nolco:
2014 2013nolco p1,272,345,558 p1,200,688,337pension obligation 1,123,297,228 1,018,404,894accrued expenses 112,011,134 86,746,796Mcit 24,934,810 22,791,387unamortized past service cost 17,768,937 5,684,217allowance for doubtful accounts 7,156,033 5,676,064provision for short-term employee benefits 4,863,514 ‒
The related tax benefits will be recognized only as reassessment demonstrates that they are realizable. realization is entirely dependent upon future taxable income.
as of december 31, 2014, details of the nolco and Mcit, which is available for offset against future taxable income and future income tax liability, respectively, follows:
inception Year nolcotax effect
of nolco Mcit expiration Year2014 p359,526,348 p107,857,904 p10,600,905 20172013 533,937,731 160,181,500 7,441,100 20162012 401,227,248 105,683,384 6,892,805 2015
p1,294,691,327 p373,722,788 p24,934,810
The following are the movements in nolco:2014 2013
balance at beginning of year p1,223,034,107 p755,869,556addition 359,526,348 533,937,731expiration (287,869,128) (66,773,180)balance at end of year p1,294,691,327 p1,223,034,107
The following are the movements in Mcit:2014 2013
balance at beginning of year p22,791,387 p26,847,123addition 10,600,905 7,441,100expiration (8,457,482) (11,496,836)balance at end of year p24,934,810 p22,791,387
The reconciliation of provision for income tax computed at the statutory corporate income tax rate to provision for income tax shown in the consolidated statements of income follows:
2014 2013at statutory income tax rate p431,670,949 p26,952,409adjustments for: change in unrecognized deferred tax assets 107,293,651 97,076,354 nolco ‒ 18,925,166 nondeductible expenses 9,197,389 13,097,869 expired Mcit 8,457,482 11,315,963 nontaxable income (131,763) (1,283,440) income of tax-exempt subsidiary ‒ (7,734,973) gain on sale of aFs financial assets (47,750,844) (13,258,254) interest income exempt or already subjected to final tax (240,503,865) (28,438,830) dividend income (119,697,140) (81,665,924)
p148,535,859 p34,986,340
25. reconciliation of net income under pFrs to statutory net income
The reconciliation of net income under pFrs to statutory net income of the group follows:
2014 2013net income under pFrs p241,737,441 p70,231,294adjustments: difference in change in provision for
(81,491,562) 57,384,625 unearned premiums - net net pension benefit expense (income) 3,104,744 (92,180)
deferred reinsurance commission ‒ 14,744,152 deferred acquisition costs - net 52,452,259 (2,918,673)
eliminated dividend income 10,940,000 70,100,000 tax effect of adjustments 2,718,032 (2,109,235) others (262) ‒
p229,460,652 p207,339,983

annual report 2014 59
continuing our timeless excellence
26. insurance and Financial risk Management
insurance riskThe principal risk the group faces under insurance contracts is that the actual claims and benefit payments or the timing thereof, differ from expectations. This is influenced by the frequency of claims, severity of claims, actual benefits paid and subsequent development of claims. Therefore, the objective of the group is to ensure that sufficient reserves are available to cover these liabilities.
The above risk exposure is mitigated by diversification across a large portfolio of insurance contracts and geographical areas. The variability of risks is also improved by careful selection and implementation of underwriting strategy guidelines, as well as the use of reinsurance arrangements.
The group purchases reinsurance as part of its risks mitigation program. reinsurance ceded is placed on both a proportional and non-proportional basis with retention limits varying by product line and territory. The majority of proportional reinsurance is quota-share reinsurance which is taken out to reduce the overall exposure of the group to certain classes of business. non-proportional reinsurance is primarily excess-of-loss reinsurance designed to mitigate the group’s net exposure to catastrophe losses. retention limits for the excess-of-loss reinsurance vary by product line and territory.
amounts recoverable from reinsurers are estimated in a manner consistent with the outstanding claims provision and are in accordance with the reinsurance contracts. although the group has reinsurance arrangements, it is not relieved of its direct obligations to its policyholders and thus a credit exposure exists with respect to ceded insurance, to the extent that any reinsurer is unable to meet its obligations assumed under such reinsurance agreements.
The group’s placement of reinsurance is diversified such that it is neither dependent on a single reinsurer nor are the operations of the group substantially dependent upon any single reinsurance contract.
The group principally issues the following types of general insurance contracts: fire, motorcar, personal accident, marine, engineering, bonds and miscellaneous casualty. The most significant risks arise from climate changes and natural disasters. These risks do not vary significantly in relation to the location of the risk insured by the group, type of risk insured and by industry.
to further reduce the risk exposure, the group requires strict claim review policies to assess all new and ongoing claims, regular detailed review of claims handling procedures and frequent investigation of possible fraudulent claims.
The group further enforces a policy of actively managing and prompt pursuing of claims, in order to reduce its exposure to unpredictable future developments that can negatively impact the group.
The group also has limited its exposure level by imposing maximum claim amounts on certain contracts as well as the use of reinsurance arrangements in order to limit exposure to catastrophic events. The purpose of these underwriting and reinsurance strategies is to limit exposure to catastrophes to a predetermined maximum amount based on the group’s risk appetite as decided by management.
The tables below set out the concentration of the claims liabilities by type of contract (see note 14).
2014Gross reinsurers’ share net
Fire p8,079,336,149 p7,292,901,809 p786,434,340Miscellaneous casualty 219,797,302 66,115,324 153,681,978bonds 712,027,244 414,791,744 297,235,500engineering 939,198,794 879,490,154 59,708,640Marine cargo 516,046,883 432,650,870 83,396,013Motor 354,315,821 12,086,440 342,229,381others 57,541,661 8,470 57,533,191
p10,878,263,854 p9,098,044,811 p1,780,219,043
2013Gross reinsurers’ share net
Fire p7,330,340,307 p6,574,407,022 p755,933,285Miscellaneous casualty 817,722,802 596,133,001 221,589,801bonds 741,651,018 594,497,563 147,153,455engineering 631,992,312 597,125,395 34,866,917Marine cargo 489,006,503 363,505,567 125,500,936Motor 460,379,205 18,664,134 441,715,071others 191,355,256 13,982 191,341,274
p10,662,447,403 p8,744,346,664 p1,918,100,739

60
The tables below set out the geographical concentration of the group’s claims liabilities based on the countries where the insurance business is written.
2014Gross reinsurers’ share net
philippines p10,798,610,994 p9,098,044,811 p1,700,566,183greece 72,822,916 – 72,822,916others 6,829,944 – 6,829,944
p10,878,263,854 p9,098,044,811 p1,780,219,043
2013gross reinsurers’ share net
philippines p10,526,368,277 p8,744,346,664 p1,782,021,613greece 128,355,905 – 128,355,905others 7,723,221 – 7,723,221
p10,662,447,403 p8,744,346,664 p1,918,100,739
Key AssumptionsThe principal assumption underlying the liability estimates is the group’s future claims development will follow a similar pattern to past claims development experience. This includes assumptions in respect of average claim costs, claims handling costs, claims inflation factors and claim numbers for each accident year. additional qualitative judgments are used to assess the extent to which past trends may not apply in the future, for example once-off occurrence, changes in market factors such as public attitude to claiming, economic conditions, as well as internal factors such as portfolio mix, policy conditions and claims handling procedures. Judgment is further used to assess the extent to which external factors such as judicial decisions and government legislation affect the estimates.
other key assumptions include variations in interest, delays in settlement and changes in foreign currency rates.
SensitivitiesThe insurance claims provision is sensitive to the above key assumptions. because of delays that arise between occurrence of a claim and its subsequent notification and eventual settlement, the outstanding claim provisions are not known with certainty at the reporting dates.
The table below shows the impact of changes in certain important assumptions in general insurance business while other assumptions remain unchanged. The correlation of assumptions will have a significant effect in determining the claims but to demonstrate the impact due to changes in assumptions, assumptions had to be changed on individual basis.
2014
change inassumptions %
impact onGross insurance
contract liabilities increase
(decrease)
impact onnet insurance
contractliabilities
increase (decrease)
impact onincome Before
income tax increase
(decrease)average claim costs +5% p137,986,136 p44,192,187 (p44,192,187)average number of claims +5% 126,250,368 40,405,762 (40,405,762)
2013
change inassumptions %
impact ongross insurance
contract liabilities increase
(decrease)
impact onnet insurance
contractliabilities
increase (decrease)
impact onincome before
income tax increase
(decrease)average claim costs +5% p179,467,339 p53,122,875 (p53,122,875)average number of claims +5% 195,327,587 57,817,556 (57,817,556)
Claims Development TableThe following tables reflect the cumulative incurred claims, including both claims notified and ibnr for each successive accident year at each reporting dates, together with cumulative payments to date.
The group aims to maintain strong reserves in respect of its insurance business in order to protect against adverse future claims experience and developments. as claims develop and the ultimate cost of claims becomes more certain, adverse claims experiences are eliminated which results in the release of reserves from earlier accident years. in order to maintain strong reserves, the group transfers much of this release to current accident year reserves when the development of claims is less mature and there is much greater uncertainty attaching to the ultimate cost of claims.
The risks vary significantly in relation to the location of the risk insured by the group, type of risks insured and in respect of commercial and business interruption insurance by industry.

annual report 2014 61
continuing our timeless excellence
Gro
ss in
sura
nce
cont
ract
liab
ilit
ies
in 2
014
acc
iden
t yea
r20
05 a
nd p
rior
2006
2007
2008
2009
2010
2011
2012
2013
2014
tota
l
acc
iden
t yea
rp 7
,033
,157
,544
p4,8
50,9
17,5
03p2
,154
,031
,020
p3,4
54,8
04,0
95p4
,559
,381
,129
p5,0
24,0
33,8
61p2
,332
,756
,271
p3,8
09,4
78,9
58p7
,673
,030
,018
p7,1
04,7
57,2
34p7
,104
,757
,234
one
yea
r la
ter
7,21
1,48
2,10
46,
805,
336,
003
2,70
2,86
8,68
53,
081,
954,
264
4,06
4,46
3,97
24,
937,
831,
700
2,63
5,33
2,15
64,
070,
255,
529
9,98
9,38
2,16
79,
989,
382,
167
two
year
s la
ter
7,27
0,83
7,80
46,
141,
362,
933
3,30
9,28
8,41
73,
045,
807,
229
4,12
3,59
4,78
34,
896,
331,
677
2,57
4,05
8,64
33,
722,
274,
100
–3,
722,
274,
100
Thre
e ye
ars
late
r7,
280,
263,
333
6,21
1,82
2,14
93,
238,
220,
388
3,05
4,34
0,56
64,
002,
725,
582
5,03
5,77
8,65
82,
570,
649,
247
––
2,57
0,64
9,24
7
Four
yea
rs la
ter
7,32
1,31
0,33
76,
109,
296,
498
3,21
8,22
5,23
53,
050,
278,
500
4,00
1,65
5,25
85,
040,
473,
533
––
–5,
040,
473,
533
Five
yea
rs la
ter
7,20
4,20
4,82
66,
119,
695,
906
3,23
6,69
6,94
03,
037,
930,
350
3,81
2,40
4,79
0–
––
–3,
812,
404,
790
six
year
s la
ter
7,19
4,46
2,94
56,
115,
761,
614
3,23
8,96
8,33
03,
053,
080,
403
––
––
–3,
053,
080,
403
seve
n ye
ars
late
r7,
151,
552,
079
6,11
5,33
9,53
03,
254,
408,
887
––
––
––
3,25
4,40
8,88
7
eigh
t yea
rs la
ter
7,13
8,74
1,36
26,
133,
959,
028
––
––
––
–6,
133,
959,
028
nin
e ye
ars
late
r7,
240,
416,
167
7,24
0,41
6,16
7cu
rren
t est
imat
e of
cu
mul
ativ
e cl
aim
s7,
240,
416,
167
6,13
3,95
9,02
83,
254,
408,
887
3,05
3,08
0,40
33,
812,
404,
790
5,04
0,47
3,53
32,
570,
649,
247
3,72
2,27
4,10
09,
989,
382,
167
7,10
4,75
7,23
451
,921
,805
,556
cum
ulat
ive
paym
ents
to
dat
e6,
912,
749,
106
5,96
0,60
0,18
13,
241,
772,
834
2,53
2,82
8,62
43,
389,
684,
747
4,87
0,20
5,55
12,
613,
444,
864
3,01
2,46
0,16
72,
596,
455,
953
3,10
6,83
8,24
438
,237
,040
,271
liab
ilit
yre
cogn
ized
p3
27,6
67,0
61p1
73,3
58,8
47p1
2,63
6,05
3p5
20,2
51,7
79p4
22,7
20,0
43p1
70,2
67,9
82(p
42,7
95,6
17)
p709
,813
,933
p7,3
92,9
26,2
14p3
,997
,918
,990
p13,
684,
765,
285
net
insu
ranc
e co
ntra
ct li
abil
itie
s in
201
4a
ccid
ent y
ear
2005
and
pri
or20
0620
0720
0820
0920
1020
1120
1220
1320
14to
tal
acc
iden
t yea
rp 3
,085
,614
,472
p1,2
42,3
78,7
49p1
,431
,258
,014
p1,9
52,1
83,3
87p1
,125
,272
,584
p2,2
40,9
75,2
90p1
,583
,382
,381
p1,4
75,5
63,2
86p1
,359
,427
,844
p1,9
79,8
13,6
66p1
,979
,813
,666
one
yea
r la
ter
3,22
6,42
7,20
91,
567,
045,
893
1,42
4,54
1,61
21,
920,
769,
319
1,15
2,61
9,67
42,
318,
440,
573
1,89
8,37
1,91
71,
468,
621,
770
1,03
0,40
8,00
71,
030,
408,
007
two
year
s la
ter
3,25
4,19
2,23
71,
616,
864,
780
1,94
1,14
7,71
21,
976,
729,
680
1,21
6,04
1,80
72,
306,
407,
482
1,87
0,31
1,60
61,
291,
254,
200
–1,
291,
254,
200
Thre
e ye
ars
late
r3,
278,
762,
812
1,62
6,29
3,38
61,
902,
396,
647
1,94
4,57
8,88
71,
202,
979,
855
2,44
1,61
7,12
21,
869,
280,
941
––
1,86
9,28
0,94
1
Four
yea
rs la
ter
3,27
1,63
0,63
71,
622,
788,
908
1,88
2,84
5,85
71,
946,
399,
063
1,33
6,79
3,70
32,
444,
462,
528
––
–2,
444,
462,
528
Five
yea
rs la
ter
3,04
2,76
4,56
81,
636,
820,
607
1,87
8,43
3,99
41,
932,
031,
864
224,
754,
249
––
––
224,
754,
249
six
year
s la
ter
2,75
4,57
6,46
81,
635,
768,
393
1,88
0,62
6,40
71,
931,
450,
543
––
––
–1,
931,
450,
543
seve
n ye
ars
late
r2,
728,
578,
301
1,63
5,76
8,28
41,
895,
791,
162
––
––
––
1,89
5,79
1,16
2
eigh
t yea
rs la
ter
2,71
2,89
4,47
81,
654,
188,
012
––
––
––
–1,
654,
188,
012
nin
e ye
ars
late
r2,
716,
353,
491
2,71
6,35
3,49
1
curr
ent e
stim
ate
of
cum
ulat
ive
clai
ms
2,71
6,35
3,49
11,
654,
188,
012
1,89
5,79
1,16
21,
931,
450,
543
224,
754,
249
2,44
4,46
2,52
81,
869,
280,
941
1,29
1,25
4,20
01,
030,
408,
007
1,97
9,81
3,66
617
,037
,756
,799
cum
ulat
ive
paym
ents
to
dat
e2,
626,
568,
574
1,64
2,52
8,49
61,
895,
923,
060
1,89
7,51
6,10
126
2,45
6,09
52,
335,
379,
647
2,00
0,13
8,56
01,
228,
527,
805
596,
330,
772
860,
337,
085
15,3
45,7
06,1
95
net
liab
ilit
y re
cogn
ized
p8
9,78
4,91
7p1
1,65
9,51
6(p
131,
898)
p33,
934,
442
(p37
,701
,846
)p1
09,0
82,8
81(p
130,
857,
619)
p62,
726,
395
p434
,077
,235
p1,1
19,4
76,5
81p1
,692
,050
,604
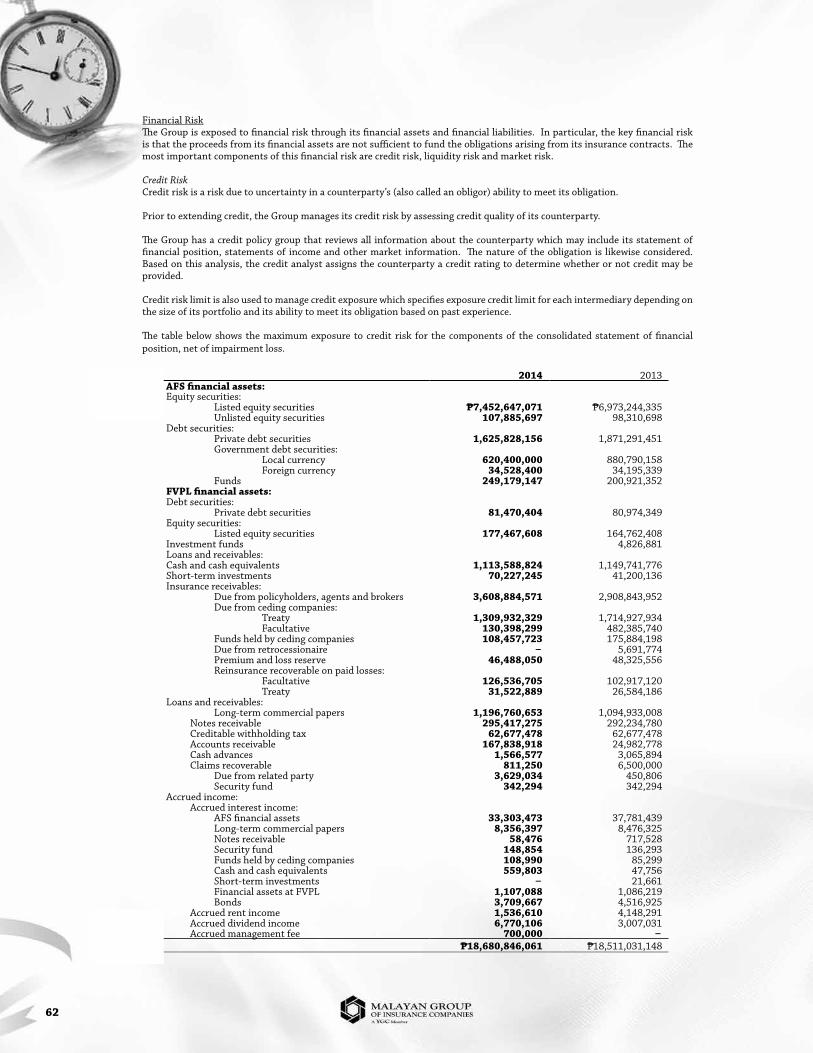
62
Financial riskThe group is exposed to financial risk through its financial assets and financial liabilities. in particular, the key financial risk is that the proceeds from its financial assets are not sufficient to fund the obligations arising from its insurance contracts. The most important components of this financial risk are credit risk, liquidity risk and market risk.
Credit Riskcredit risk is a risk due to uncertainty in a counterparty’s (also called an obligor) ability to meet its obligation.
prior to extending credit, the group manages its credit risk by assessing credit quality of its counterparty.
The group has a credit policy group that reviews all information about the counterparty which may include its statement of financial position, statements of income and other market information. The nature of the obligation is likewise considered. based on this analysis, the credit analyst assigns the counterparty a credit rating to determine whether or not credit may be provided.
credit risk limit is also used to manage credit exposure which specifies exposure credit limit for each intermediary depending on the size of its portfolio and its ability to meet its obligation based on past experience.
The table below shows the maximum exposure to credit risk for the components of the consolidated statement of financial position, net of impairment loss.
2014 2013aFs financial assets:equity securities: listed equity securities p7,452,647,071 p6,973,244,335 unlisted equity securities 107,885,697 98,310,698debt securities: private debt securities 1,625,828,156 1,871,291,451 government debt securities: local currency 620,400,000 880,790,158 Foreign currency 34,528,400 34,195,339 Funds 249,179,147 200,921,352Fvpl financial assets:debt securities: private debt securities 81,470,404 80,974,349equity securities: listed equity securities 177,467,608 164,762,408investment funds 4,826,881loans and receivables:cash and cash equivalents 1,113,588,824 1,149,741,776short-term investments 70,227,245 41,200,136insurance receivables: due from policyholders, agents and brokers 3,608,884,571 2,908,843,952 due from ceding companies: treaty 1,309,932,329 1,714,927,934 Facultative 130,398,299 482,385,740 Funds held by ceding companies 108,457,723 175,884,198 due from retrocessionaire ‒ 5,691,774 premium and loss reserve 46,488,050 48,325,556 reinsurance recoverable on paid losses: Facultative 126,536,705 102,917,120 treaty 31,522,889 26,584,186loans and receivables: long-term commercial papers 1,196,760,653 1,094,933,008
notes receivable 295,417,275 292,234,780creditable withholding tax 62,677,478 62,677,478accounts receivable 167,838,918 24,982,778cash advances 1,566,577 3,065,894claims recoverable 811,250 6,500,000
due from related party 3,629,034 450,806 security fund 342,294 342,294accrued income:
accrued interest income:aFs financial assets 33,303,473 37,781,439long-term commercial papers 8,356,397 8,476,325notes receivable 58,476 717,528security fund 148,854 136,293Funds held by ceding companies 108,990 85,299cash and cash equivalents 559,803 47,756short-term investments ‒ 21,661Financial assets at Fvpl 1,107,088 1,086,219bonds 3,709,667 4,516,925
accrued rent income 1,536,610 4,148,291accrued dividend income 6,770,106 3,007,031accrued management fee 700,000 ‒
p18,680,846,061 p18,511,031,148

annual report 2014 63
continuing our timeless excellence
The following tables provide information regarding the credit risk exposure of the group by classifying the financial assets according to the group’s credit ratings of the counter parties.
2014neither past due nor impaired past due but individually
high Grade Medium Grade not impaired impaired totalaFs financial assets:equity securities: listed equity securities p7,334,673,564 p117,973,507 p‒ p‒ p7,452,647,071 unlisted equity securities ‒ 107,885,697 ‒ ‒ 107,885,697debt securities:
private debt securities 398,919,192 1,226,908,964 ‒ ‒ 1,625,828,156government debt securities: local currency 620,400,000 ‒ ‒ ‒ 620,400,000 Foreign currency 34,528,400 ‒ ‒ ‒ 34,528,400
Funds 249,179,147 ‒ ‒ ‒ 249,179,147Fvpl financial assets:debt securities:
private debt securities ‒ 81,470,404 ‒ ‒ 81,470,404equity securities: listed equity securities ‒ 177,467,608 ‒ ‒ 177,467,608investment Fundsloans and receivables:cash and cash equivalents 1,114,595,347 ‒ ‒ ‒ 1,114,595,347short-term investments 70,227,245 ‒ ‒ ‒ 70,227,245insurance receivables: due from policyholders, agents, and
brokers 809,287,596 545,273,737 2,375,804,258 6,572,658 3,736,938,249 due from ceding companies: Facultative 102,975,631 10,658,998 18,300,094 7,219,431 139,154,154 treaty 375,827,340 3,178,977 930,926,014 3,361,426 1,313,293,757 Funds held by ceding companies 71,828,974 30,380,755 6,247,993 1,380,777 109,838,499 premium and loss reserve 46,488,050 ‒ ‒ ‒ 46,488,050 reinsurance recoverable on paid losses: Facultative 64,766,862 61,769,843 ‒ 8,811,073 135,347,778 treaty ‒ ‒ 31,522,889 ‒ 31,522,889accrued income: accrued interest: aFs financial assets 33,303,473 ‒ ‒ ‒ 33,303,473 long-term commercial papers 8,356,397 ‒ ‒ ‒ 8,356,397 notes receivable 58,476 58,476
security fund 148,854 ‒ ‒ ‒ 148,854 Funds held by ceding companies 92,895 16,095 ‒ ‒ 108,990 cash and cash equivalents 559,803 ‒ ‒ ‒ 559,803 Financial assets at Fvpl 1,107,088 ‒ ‒ ‒ 1,107,088 bonds 3,709,667 ‒ ‒ ‒ 3,709,667 accrued rent income 1,536,610 ‒ ‒ ‒ 1,536,610 accrued dividend income 6,770,106 ‒ ‒ ‒ 6,770,106 accrued management fee 700,000 ‒ ‒ ‒ 700,000loans and receivables:
long-term commercial papers 1,176,760,653 20,000,000 ‒ ‒ 1,196,760,653 notes receivable 295,417,275 ‒ ‒ 1,697,251 297,114,526 creditable withholding tax 62,677,478 ‒ ‒ ‒ 62,677,478
accounts receivable 93,259,564 74,559,354 ‒ 2,050,610 169,869,528 cash advances 1,566,577 ‒ ‒ ‒ 1,566,577 claims recoverable 811,250 ‒ ‒ ‒ 811,250 due from related party 10,429,321 ‒ ‒ ‒ 10,429,321
security fund 342,294 ‒ ‒ ‒ 342,294p12,991,305,129 p2,457,543,939 p3,362,801,248 p31,093,226 p18,842,743,542
2013neither past due nor impaired past due but individually
High grade Medium grade not impaired impaired totalaFs financial assets:equity securities: listed equity securities p6,816,537,267 p82,687,019 p– p74,020,049 p6,973,244,335 unlisted equity securities – 98,310,698 – – 98,310,698debt securities:
private debt securities 728,215,310 1,143,076,141 – – 1,871,291,451government debt securities: local currency 880,790,158 – – – 880,790,158 Foreign currency 34,195,339 – – – 34,195,339
Funds 200,921,352 – – – 200,921,352Fvpl financial assets:debt securities:
private debt securities – 80,974,349 – – 80,974,349equity securities: listed equity securities 1,426,988 163,335,420 – – 164,762,408investment Funds 4,826,881 – – – 4,826,881loans and receivables:cash and cash equivalents 1,146,052,947 3,688,829 – – 1,149,741,776short-term investments 41,200,136 – – – 41,200,136insurance receivables: due from policyholders, agents, and
brokers 1,301,020,819 6,908,540 1,726,476,796 8,358,043 3,042,764,198
(Forward)

64
2013neither past due nor impaired past due but individually
High grade Medium grade not impaired impaired total
due from ceding companies: Facultative p475,265,583 p1,035,715 p7,538,278 p10,748,795 p494,588,371 treaty 1,132,143,388 7,768,264 575,016,283 2,153,063 1,717,080,998 due from retrocessionaire 5,691,774 – – – 5,691,774 premium and loss reserve 48,325,556 – – – 48,325,556 Funds held by ceding companies 51,790,604 533,197 124,941,201 – 177,265,002 reinsurance recoverable on paid losses: Facultative 2,217,147 22,261,414 81,417,378 5,047,677 110,943,616 treaty 26,584,185 – ‒ – 26,584,185accrued income: accrued interest: aFs financial assets 23,433,980 14,347,459 – – 37,781,439 long-term commercial papers 8,476,325 – – – 8,476,325 notes receivable 717,528 – – – 717,528
security fund 136,293 – – – 136,293 Funds held by ceding companies 29,976 160 55,163 – 85,299 cash and cash equivalents 47,756 – – – 47,756 short-term investments 21,661 – – – 21,661 Financial assets at Fvpl 1,086,218 – – – 1,086,218 bonds 4,516,925 – – – 4,516,925 accrued rent income 4,148,291 – – – 4,148,291 accrued dividend income 3,007,031 – – – 3,007,031loans and receivables:
long-term commercial papers 1,094,933,008 – – – 1,094,933,008 notes receivable 292,234,780 – – 1,697,251 293,932,031 creditable withholding tax 62,677,478 – – – 62,677,478
accounts receivable 24,982,779 – – 2,005,675 26,988,454 cash advances 3,065,894 – – – 3,065,894 claims recoverable 6,500,000 – – – 6,500,000 due from related party 450,806 – – – 450,806
security fund 342,294 – – – 342,294p14,428,014,457 p1,624,927,205 p2,515,445,099 p104,030,553 p18,672,417,314
The credit rating is based on the following:
a) Cash and cash equivalents, short-term investments and related accrued income High grade pertains to those deposited, placed or invested in foreign and local banks belonging to the top banks in the
philippines in terms of resources and profitability, while medium grade pertains to those deposited, placed or invested in thrift banks and rural banks in the philippines.
b) Insurance receivables, loans and receivables, accrued rent income and dividend income For insurance receivables and loans and receivables except due from ceding companies, Funds held by ceding companies, and
long-term commercial papers, the group uses a credit rating concept based on the borrowers and counterparties’ overall creditworthiness. High grade is given to borrowers and counterparties who possess strong to very strong capacity to meet its obligations. Medium grade is given to borrowers and counterparties who possess above average capacity to meet its obligations. These counterparties are somewhat susceptible to adverse changes in business and economic conditions.
For due from ceding companies and Funds held by ceding companies from local sources, the group uses a credit rating concept based on the debt-to-equity ratios of the borrowers and counterparties. High grade is given to borrowers and counterparties with debt-to-equity ratio of less than or equal to 2:1, while medium grade is given to borrowers and counterparties with debt-to-equity ratio of more than 2:1.
For Due from ceding companies and Funds held by ceding companies from foreign sources, the Group uses Standard & Poor’s (S&P) and A.M. Best’s credit rating of insurance companies. High grade pertains to insurance companies rated by S&P and a.M. best as higher than bb+, which means that the insurance company has good to strong financial security characteristics, but may be affected by adverse business conditions. Medium grade pertains to insurance companies that are ungraded and rated by S&P and A.M. Best as lower than BB+, which means that the insurance company has marginal financial security characteristics. positive attributes exist, but adverse business conditions could lead to insufficient ability to meet financial commitments.
c) Equity securities listed equity securities are classified as high grade. unlisted equity securities are classified as medium grade.
d) Debt securities, long-term commercial papers, and related accrued income These are based on the credit ratings by the international rating agency, Standard & Poors (S&P), and by Philippine Ratings
services corporation (philratings), the only domestic credit rating services in the philippines accredited by bangko sentral ng Pilipinas (BSP) and SEC, in cases where an S&P rating is not available. High grade pertains to investments rated by S&P as bbb- and higher, which means that the counterparties have extremely strong to adequate capacity of paying interest and repaying principal, as well as investments in securities issued by the philippine government. Medium grade pertains to investments rated as Baa and higher by Philratings, as well as investments rated by S&P as BB+ to B- (except Philippine Government Securities). The Group’s holdings under this category are rated either BB- by S&P (due to sovereign credit rating ceiling) or aaa by philratings which is defined by philratings to mean that the obligor’s capacity to meet its financial commitment on the obligation is extremely strong.

annual report 2014 65
continuing our timeless excellence
e. Notes receivables
receivables from related entities are considered as high grade.
The following shows the aging analysis of financial assets:
2014
<30 days > 30 days
total past due but not
impairedloans and receivables: due from policyholders, agents and brokers p338,796,089 p2,037,008,169 p2,375,804,258 due from ceding companies: Facultative 5,618,939 12,681,155 18,300,094 treaty 5,722,029 925,203,985 930,926,014 Funds held by ceding companies - treaty ‒ 6,247,993 6,247,993 reinsurance recoverable on paid losses: treaty ‒ 31,522,889 31,522,889
p350,137,057 p3,012,664,191 p3,362,801,248
2013
<30 days > 30 days
total past due but not
impairedloans and receivables: due from policyholders, agents and brokers p274,478,075 p1,451,998,721 p1,726,476,796 due from ceding companies: Facultative 6,866,624 671,654 7,538,278 treaty 1,522,130 573,494,153 575,016,283 Funds held by ceding companies – treaty 6,689,142 118,252,059 124,941,201 reinsurance recoverable on paid losses: Facultative 1,588,949 79,828,429 81,417,378accrued income: Funds held by ceding companies - treaty 121 55,042 55,163
p291,145,041 p2,224,300,058 p2,515,445,099
Liquidity Riskliquidity or funding risk is the risk that an entity will encounter difficulty in raising funds to meet commitments associated with financial instruments. liquidity risk may result from either the inability to sell financial assets quickly at their fair values; or counterparty failing on repayment of a contractual obligation; or insurance liability falling due for payment earlier than expected; or inability to generate cash inflows as anticipated.
an institution may suffer from a liquidity problem when its credit rating falls. The group is also exposed to liquidity risk if markets on which it depends on are subject to loss of liquidity. The major liquidity risk faced by the group is the potential daily calls on its available cash resources in respect of claims from insurance contracts.
The group manages liquidity through a management team which determines liquidity risk for the group by identifying events that would trigger liquidity problems, providing contingency plans, identifying potential sources of funds and monitoring compliance of liquidity risk policy.
The tables below analyze financial assets and financial liabilities of the group into their relevant maturity groups based on the remaining period at the reporting date to their contractual maturities or expected repayment dates.
2014
up to a year* 1-3 years More than3 years no term total
cash and cash equivalents p1,114,595,347 p‒ p‒ p‒ p1,114,595,347short-term investments 70,227,245 ‒ ‒ ‒ 70,227,245insurance receivables 5,512,583,375 ‒ ‒ ‒ 5,512,583,375aFs financial assets 24,907,841 198,024,118 1,904,974,074 7,962,562,438 10,090,468,471Financial assets at Fvpl ‒ ‒ ‒ 258,938,012 258,938,012loans and receivables 1,630,058,014 37,167,884 61,000,000 797,581 1,729,023,479accrued income 41,388,645 10,154,064 ‒ 4,816,755 56,359,464reinsurance recoverable on
unpaid losses 9,098,044,811 ‒ ‒ ‒ 9,098,044,811total financial assets p17,491,805,278 p245,346,066 p1,965,974,074 p8,227,114,786 p27,930,240,204insurance contract liabilities p10,878,263,854 p‒ p‒ p‒ p10,878,263,854insurance payables 2,836,957,968 ‒ ‒ ‒ 2,836,957,968accounts payable, accrued
expenses and other liabilities 2,116,180,944 ‒ ‒ ‒ 2,116,180,944
total financial liabilities p15,831,402,766 p– p– p– p15,831,402,766
*Up to a year are all commitments which are either due within one year or are payable in demand.

66
2013
up to a year* 1-3 yearsMore than
3 years no term totalcash and cash equivalents p1,150,786,478 p– p– p– p1,150,786,478short-term investments 41,200,136 – – – 41,200,136insurance receivables 5,623,243,673 – – – 5,623,243,673aFs financial assets 80,282,588 880,559,232 1,825,435,128 7,272,476,385 10,058,753,333Financial assets at Fvpl – 28,654,131 52,320,262 169,589,245 250,563,638loans and receivables 447,788,733 142,580,790 903,336,632 – 1,493,706,155accrued income 54,413,416 – – – 54,413,416reinsurance recoverable on
unpaid losses 8,623,772,716 – – – 8,623,772,716total financial assets p16,021,487,740 p1,051,794,153 p2,781,092,022 p7,442,065,630 p27,296,439,545insurance contract liabilities p10,662,447,403 p– p– p– p10,662,447,403insurance payables 3,755,773,028 – – – 3,755,773,028accounts payable, accrued
expenses and other liabilities 1,182,051,489 – – – 1,182,051,489
total financial liabilities p15,600,271,920 p– p– p– p15,600,271,920
*Up to a year are all commitments which are either due within one year or are payable in demand.
in 2014 and 2013, certain insurance receivables, aFs securities and loans and receivables have been provided with allowance for impairment.
The table below analyzes nonfinancial assets and liabilities of the group into amounts expected to be recovered or settled within 12 months (current) and beyond 12 months (noncurrent).
2014 2013current noncurrent current noncurrent
deferred acquisition costs p345,175,047 p‒ p411,587,921 p–deferred reinsurance premiums 2,048,228,397 – 2,195,827,956 –investment properties – 27,169,980 – 28,273,467property and equipment – 304,990,039 – 307,999,884deferred tax assets – 107,377,857 – 118,775,626other assets 71,146,708 373,232,902 63,913,991 322,631,679total nonfinancial assets p2,464,550,152 p812,770,778 p2,671,329,868 p777,680,656provision for unearned premiums p3,486,665,287 p– p3,570,350,843 p–deferred reinsurance commissions 187,818,210 – 196,312,462 –pension liability – 204,788,026 – 206,260,676income tax payable 281,365 – 174,741 –other liabilities 483,594,502 – 491,275,503 –total nonfinancial liabilities p4,158,359,364 p204,788,026 p4,258,113,549 p206,260,676
it is unusual for the group primarily transacting insurance business to predict the requirements of funding with absolute certainty as theory of probability is applied on insurance contracts to ascertain the likely provision and the time period when such liabilities will require settlement. The amounts and maturities in respect of insurance liabilities are thus based on management’s best estimate based on past experience.
Market RiskMarket risk is the risk of change in fair value of financial instruments from fluctuations in foreign exchange rates (currency risk), market interest rates (interest rate risk) and market prices (price risk), whether such change in price is caused by factors specific to the individual instrument or its issuer or factors affecting all instruments traded in the market.
Market risk is the risk to an institution’s financial condition from volatility in the price movements of the assets contained in a portfolio. Market risk represents what the group would lose from price volatilities. Market risk can be measured as the potential gain or loss in a position or portfolio that is associated with a price movement of a given probability over a specified time horizon.
The group manages market risk by evenly distributing capital among investment instruments, sectors and geographical areas.
The group structures levels of market risk it accepts through a sound market risk policy based on specific guidelines set by an investment committee. This policy constitutes certain limits on exposure of investments mostly with top-rated banks, which are selected on the basis of the bank’s credit ratings, capitalization and quality servicing being rendered to the group. also, the said policy includes diversification benchmarks of investment portfolio to different investment types duly approved by the ic, asset allocation and portfolio limit structure.
Moreover, control of relevant market risks can be addressed through compliance reporting of market risk exposures, regular monitoring and review of the group’s investment performance and upcoming investment opportunities for pertinence and changing environment.
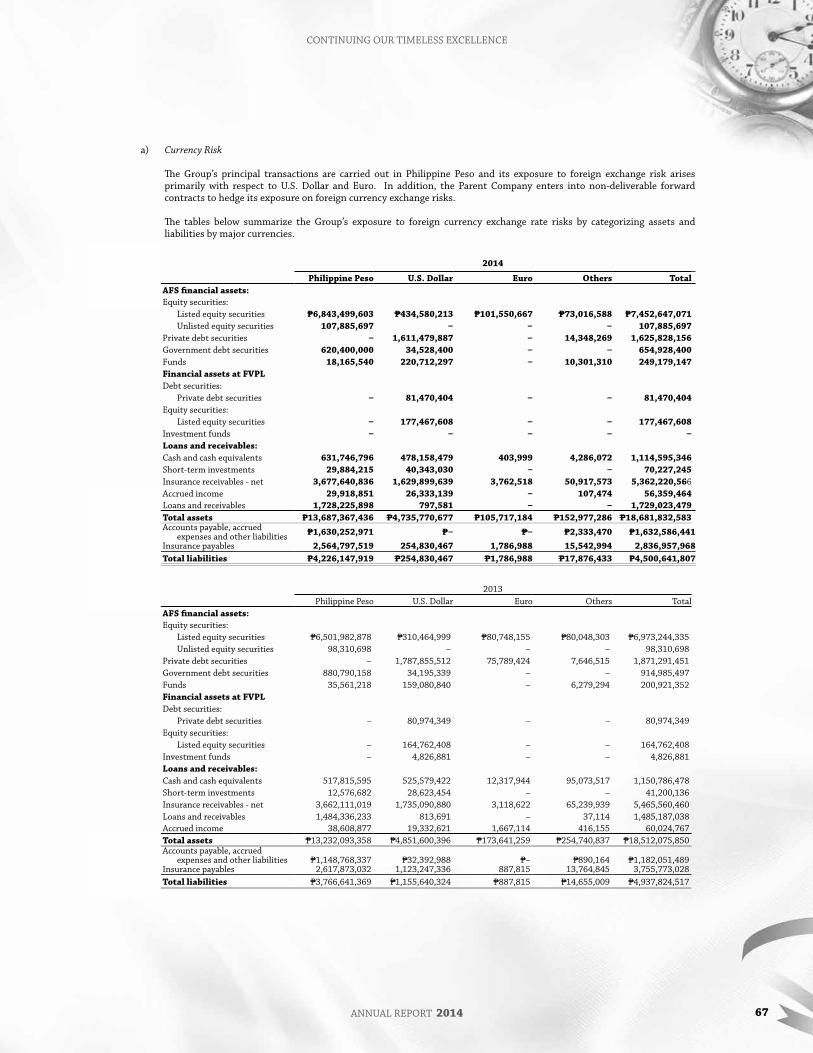
annual report 2014 67
continuing our timeless excellence
a) Currency Risk
The group’s principal transactions are carried out in philippine peso and its exposure to foreign exchange risk arises primarily with respect to u.s. dollar and euro. in addition, the parent company enters into non-deliverable forward contracts to hedge its exposure on foreign currency exchange risks.
The tables below summarize the group’s exposure to foreign currency exchange rate risks by categorizing assets and liabilities by major currencies.
2014
philippine peso u.s. dollar euro others totalaFs financial assets:equity securities: listed equity securities p6,843,499,603 p434,580,213 p101,550,667 p73,016,588 p7,452,647,071 unlisted equity securities 107,885,697 ‒ ‒ ‒ 107,885,697private debt securities ‒ 1,611,479,887 ‒ 14,348,269 1,625,828,156government debt securities 620,400,000 34,528,400 ‒ ‒ 654,928,400Funds 18,165,540 220,712,297 ‒ 10,301,310 249,179,147Financial assets at Fvpldebt securities: private debt securities ‒ 81,470,404 ‒ ‒ 81,470,404equity securities: listed equity securities ‒ 177,467,608 ‒ ‒ 177,467,608investment funds ‒ ‒ ‒ ‒ ‒loans and receivables:cash and cash equivalents 631,746,796 478,158,479 403,999 4,286,072 1,114,595,346short-term investments 29,884,215 40,343,030 ‒ ‒ 70,227,245insurance receivables - net 3,677,640,836 1,629,899,639 3,762,518 50,917,573 5,362,220,566accrued income 29,918,851 26,333,139 ‒ 107,474 56,359,464loans and receivables 1,728,225,898 797,581 ‒ ‒ 1,729,023,479total assets p13,687,367,436 p4,735,770,677 p105,717,184 p152,977,286 p18,681,832,583 accounts payable, accrued
expenses and other liabilities p1,630,252,971 p‒ p‒ p2,333,470 p1,632,586,441insurance payables 2,564,797,519 254,830,467 1,786,988 15,542,994 2,836,957,968total liabilities p4,226,147,919 p254,830,467 p1,786,988 p17,876,433 p4,500,641,807
2013philippine peso u.s. dollar euro others total
aFs financial assets:equity securities: listed equity securities p6,501,982,878 p310,464,999 p80,748,155 p80,048,303 p6,973,244,335 unlisted equity securities 98,310,698 – – – 98,310,698private debt securities – 1,787,855,512 75,789,424 7,646,515 1,871,291,451government debt securities 880,790,158 34,195,339 – – 914,985,497Funds 35,561,218 159,080,840 – 6,279,294 200,921,352Financial assets at Fvpldebt securities: private debt securities – 80,974,349 – – 80,974,349equity securities: listed equity securities – 164,762,408 – – 164,762,408investment funds – 4,826,881 – – 4,826,881loans and receivables:cash and cash equivalents 517,815,595 525,579,422 12,317,944 95,073,517 1,150,786,478short-term investments 12,576,682 28,623,454 – – 41,200,136insurance receivables - net 3,662,111,019 1,735,090,880 3,118,622 65,239,939 5,465,560,460loans and receivables 1,484,336,233 813,691 – 37,114 1,485,187,038accrued income 38,608,877 19,332,621 1,667,114 416,155 60,024,767total assets p13,232,093,358 p4,851,600,396 p173,641,259 p254,740,837 p18,512,075,850 accounts payable, accrued
expenses and other liabilities p1,148,768,337 p32,392,988 p– p890,164 p1,182,051,489insurance payables 2,617,873,032 1,123,247,336 887,815 13,764,845 3,755,773,028total liabilities p3,766,641,369 p1,155,640,324 p887,815 p14,655,009 p4,937,824,517
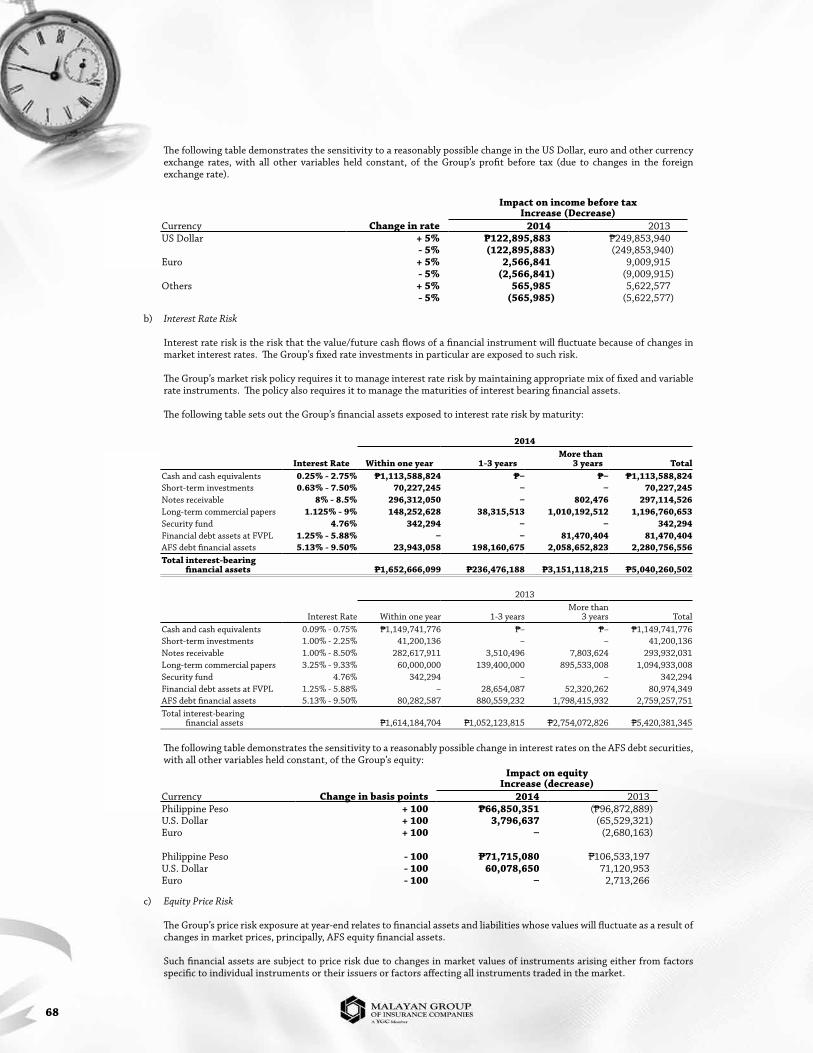
68
The following table demonstrates the sensitivity to a reasonably possible change in the us dollar, euro and other currency exchange rates, with all other variables held constant, of the group’s profit before tax (due to changes in the foreign exchange rate).
impact on income before tax increase (decrease)
currency change in rate 2014 2013us dollar + 5% p122,895,883 p249,853,940
- 5% (122,895,883) (249,853,940)euro + 5% 2,566,841 9,009,915
- 5% (2,566,841) (9,009,915)others + 5% 565,985 5,622,577
- 5% (565,985) (5,622,577)
b) Interest Rate Risk
interest rate risk is the risk that the value/future cash flows of a financial instrument will fluctuate because of changes in market interest rates. The group’s fixed rate investments in particular are exposed to such risk.
The group’s market risk policy requires it to manage interest rate risk by maintaining appropriate mix of fixed and variable rate instruments. The policy also requires it to manage the maturities of interest bearing financial assets.
The following table sets out the group’s financial assets exposed to interest rate risk by maturity:
2014
interest rate within one year 1-3 yearsMore than
3 years totalcash and cash equivalents 0.25% - 2.75% p1,113,588,824 p‒ p‒ p1,113,588,824short-term investments 0.63% - 7.50% 70,227,245 ‒ ‒ 70,227,245notes receivable 8% - 8.5% 296,312,050 ‒ 802,476 297,114,526long-term commercial papers 1.125% - 9% 148,252,628 38,315,513 1,010,192,512 1,196,760,653security fund 4.76% 342,294 ‒ ‒ 342,294Financial debt assets at Fvpl 1.25% - 5.88% ‒ ‒ 81,470,404 81,470,404aFs debt financial assets 5.13% - 9.50% 23,943,058 198,160,675 2,058,652,823 2,280,756,556total interest-bearing
financial assets p1,652,666,099 p236,476,188 p3,151,118,215 p5,040,260,502
2013
interest rate within one year 1-3 yearsMore than
3 years totalcash and cash equivalents 0.09% - 0.75% p1,149,741,776 p– p– p1,149,741,776short-term investments 1.00% - 2.25% 41,200,136 – – 41,200,136notes receivable 1.00% - 8.50% 282,617,911 3,510,496 7,803,624 293,932,031long-term commercial papers 3.25% - 9.33% 60,000,000 139,400,000 895,533,008 1,094,933,008security fund 4.76% 342,294 – – 342,294Financial debt assets at Fvpl 1.25% - 5.88% – 28,654,087 52,320,262 80,974,349aFs debt financial assets 5.13% - 9.50% 80,282,587 880,559,232 1,798,415,932 2,759,257,751total interest-bearing
financial assets p1,614,184,704 p1,052,123,815 p2,754,072,826 p5,420,381,345
The following table demonstrates the sensitivity to a reasonably possible change in interest rates on the aFs debt securities, with all other variables held constant, of the group’s equity:
impact on equity increase (decrease)
currency change in basis points 2014 2013philippine peso + 100 p66,850,351 (p96,872,889)u.s. dollar + 100 3,796,637 (65,529,321)euro + 100 ‒ (2,680,163)
philippine peso - 100 p71,715,080 p106,533,197u.s. dollar - 100 60,078,650 71,120,953euro - 100 ‒ 2,713,266
c) Equity Price Risk
The group’s price risk exposure at year-end relates to financial assets and liabilities whose values will fluctuate as a result of changes in market prices, principally, aFs equity financial assets.
such financial assets are subject to price risk due to changes in market values of instruments arising either from factors specific to individual instruments or their issuers or factors affecting all instruments traded in the market.

annual report 2014 69
continuing our timeless excellence
The group’s market risk policy requires it to manage such risks by setting and monitoring objectives and constraints on investments; diversification plan; limits on investment in each country, sector and market; and careful and planned use of derivative instruments. The price risk on investments securities is also actively managed through the use of derivative financial instruments to mitigate the risk of adverse market movements.
The following table shows the equity impact of reasonably possible change of philippine stock exchange index (psei),
Morgan stanley capital international (Msci) euro, dow Jones euro stoxx 50 (sx5e index) and Hang seng index (His index):
impact on equityincrease (decrease)
change in equity prices psei dJ stoxx His index
2014 +(11%-15%) p937,843,966 p18,765,019 p‒-(11%-15%) (937,843,966) (18,765,019) ‒
2013 +15% p954,047,676 p20,842,959 p359,777-15% (954,047,676) (20,842,959) (359,777)
26. Financial assets and liabilities
The table below presents a comparison by category of carrying amounts and estimated fair values of all the group’s financial instruments.
2014 2013carrying value Fair value carrying value Fair value
aFs financial assets:listed equity securities: common shares p7,425,804,631 p7,425,804,631 p6,944,551,895 p6,944,551,895 preferred shares 26,842,440 26,842,440 28,692,440 28,692,440unlisted equity securities: common shares 107,868,157 107,868,157 98,293,158 98,293,158 preferred shares 17,540 17,540 17,540 17,540private debt securities 1,625,828,156 1,625,828,156 1,871,291,451 1,871,291,451government debt securities: local currency 620,400,000 620,400,000 880,790,158 880,790,158 Foreign currency 34,528,400 34,528,400 34,195,339 34,195,339Funds 249,179,147 249,179,147 200,921,352 200,921,352Financial assets at Fvpl:debt securities: private debt securities 81,470,404 81,470,404 80,974,349 80,974,349equity securities: listed equity securities 177,467,608 177,467,608 164,762,408 164,762,408Money market fund, unlistedinvestment funds ‒ ‒ 4,826,881 4,826,881loans and receivables:cash and cash equivalents 1,114,595,347 1,114,595,347 1,150,786,478 1,150,786,478short-term cash investments 70,227,245 70,227,245 41,200,136 41,200,136insurance receivables: due from policyholders, agents
and brokers3,608,884,571 3,608,884,571 2,908,843,952 2,908,843,952
due from ceding companies: Facultative 130,398,299 130,398,299 482,385,740 482,385,740 treaty 1,309,932,329 1,309,932,329 1,714,927,934 1,714,927,934 due from retrocessionaire ‒ ‒ 5,691,774 5,691,774 premium and loss reserve 46,488,050 46,488,050 48,325,556 48,325,556 reinsurance recoverable on paid
losses: Facultative 126,536,705 126,536,705 102,917,120 102,917,120 treaty 31,522,889 31,522,889 26,584,186 26,584,186 Funds held by ceding companies 108,457,723 108,457,723 175,884,198 175,884,198accrued income: aFs financial assets 33,303,473 33,303,473 37,781,439 37,781,439 long-term commercial papers 8,356,397 8,356,397 8,476,325 8,476,325 notes receivable 58,476 58,476 717,528 717,528 security fund 148,854 148,854 136,293 136,293 Funds held by ceding companies 108,990 108,990 85,299 85,299 cash and cash equivalents 559,803 559,803 47,756 47,756 short-term cash investments ‒ ‒ 21,661 21,661 Financial assets at Fvpl 1,107,088 1,107,088 1,086,219 1,086,219 bonds 3,709,667 3,709,667 4,516,925 4,516,925(Forward)

70
2014 2013carrying value Fair value carrying value Fair value
accrued dividend income p6,770,106 p6,770,106 p3,007,031 p3,007,031accrued rent income 1,536,610 1,536,610 4,148,291 4,148,291accrued management income 700,000 700,000 ‒ ‒loans and receivables: long-term commercial papers 1,196,760,653 1,298,956,565 1,094,933,008 1,224,797,234 notes receivable 295,417,275 295,417,275 292,234,780 292,944,300 creditable withholding tax 62,677,478 62,677,478 62,677,478 62,677,478 due from related party 10,429,321 10,429,321 450,806 450,806
account receivable 167,838,918 167,838,918 24,982,779 24,982,779claims receivable 811,250 811,250 6,500,000 6,500,000
cash advances 1,566,577 1,566,577 3,065,894 3,065,894 security fund 342,294 342,294 342,294 342,294total financial assets p18,688,652,871 p18,790,848,783 p18,512,075,851 p18,642,649,597other financial liabilitiesinsurance payables due to reinsurers and ceding
companies p2,293,390,994 p2,293,390,994 p2,374,185,839 p2,374,185,839 Funds held for reinsurers 543,566,974 543,566,974 1,381,587,189 1,381,587,189accounts payable, accrued expenses
and other liabilities:accounts payable 890,218,761 890,218,761 695,224,632 695,224,632commissions payable 477,463,519 477,463,519 304,824,160 304,824,160accrued expenses 150,422,981 150,422,981 111,520,034 111,520,034surety deposits 49,282,432 49,282,432 32,455,278 32,455,278due to related parties 35,097 35,097 ‒ ‒others 19,958,372 19,958,372 7,029,196 7,029,196
total financial liabilities p4,424,339,130 p4,424,339,130 p4,906,826,328 p4,906,826,328
Fair values of financial assets are estimated as follows:
Cash and cash equivalents, short-term investments - the fair value approximates the carrying amounts at initial recognition due to their short term nature.
Debt securities - the fair values are based on quoted market prices.
Quoted equity securities - the fair values are generally based on quoted market prices.
Unquoted equity securities - these are carried at cost less allowance for impairment losses because fair value cannot be measured reliably due to lack of reliable estimates of future cash flows and discount rates necessary to calculate the fair value. There is no active market for the equity securities. The group intends to dispose the securities through selling to a willing buyer in arms length transactions.
Insurance receivables, accrued income, short-term loans and receivables (including notes receivable, long-term investments and security fund), insurance payables, accounts payable and accrued expenses - the fair values approximate the carrying amounts due to the short-term nature of the transactions.
Long-term commercial papers - fair values are based on present value of future cash flows discounted using risk-free rates that ranged from 2.43% to 3.08% and 1.08% to 1.29% in 2014 and 2013, respectively.
Fair value HierarchyThe following table provides the fair value measurement hierarchy of the group’s assets and liabilities:

annual report 2014 71
continuing our timeless excellence
december 31, 2014
quoted prices in
active markets (level 1)
significant observable
inputs (level 2)
significant unobservable
inputs (level 3) total
assets measured at fair value:aFs financial assets listed equity securities: common shares p7,425,804,631 p‒ p‒ p7,425,804,631 preferred shares 26,842,440 ‒ ‒ 26,842,440 private debt securities 1,625,828,156 ‒ ‒ 1,625,828,156 government debt securities: local currency 620,400,000 ‒ ‒ 620,400,000 Foreign currency 34,528,400 ‒ ‒ 34,528,400 Funds 249,179,147 ‒ ‒ 249,179,147Financial assets at Fvpl: debt securities: private debt securities 81,470,404 ‒ ‒ 81,470,404 equity securities: listed equity securities 177,467,608 ‒ ‒ 177,467,608
10,241,520,786 – – 10,241,520,786assets for which fair values are
disclosed: loans and receivables long-term commercial papers – 1,298,956,565 – 1,298,956,565 notes receivables ‒ 297,193,537 ‒ 297,193,537
– 1,596,150,102 – 1,596,150,102p10,241,520,786 p1,596,150,102 p– p11,837,670,888
december 31, 2013
quoted prices in
active markets (level 1)
significant observable
inputs (level 2)
significant unobservable
inputs (level 3)
total
assets measured at fair value:aFs financial assets listed equity securities: common shares p6,944,551,895 p– p– p6,944,551,895 preferred shares 28,692,440 – – 28,692,440 private debt securities 1,871,291,451 – – 1,871,291,451 government debt securities: local currency 880,790,158 – – 880,790,158 Foreign currency 34,195,339 – – 34,195,339 Funds 200,921,352 – – 200,921,352Financial assets at Fvpl: debt securities: private debt securities 80,974,349 – – 80,974,349 equity securities: listed equity securities 164,762,408 – – 164,762,408 Money market fund, unlisted investment funds 4,826,881 – – 4,826,881
10,211,006,273 – – 10,211,006,273assets for which fair values are disclosed: loans and receivables long-term commercial papers – 1,224,797,234 – 1,224,797,234 notes receivables – 292,944,300 – 292,944,300
– 1,517,741,534 – 1,517,741,534p10,211,006,273 p1,517,741,534 p– p11,728,747,807
The group uses the following hierarchy for determining and disclosing the fair values of financial instruments by valuation technique:
level 1: quoted (unadjusted) prices in active markets for identical assets or liabilitieslevel 2: other techniques for which all inputs which have a significant effect on the recorded fair value are observable, either
directly or indirectlylevel 3: techniques which uses inputs which have a significant effect on the recorded fair value that are not based on observable
market data

72
during the reporting period ended december 31, 2014 and 2013, there were no transfers between level 1 and level 2 fair value measurements, and no transfers into and out of level 3 fair value measurements.
28. related party transactions
parties are considered to be related if one party has the ability, directly or indirectly, to control the other party, or exercise significant influence over the other party in making financial and operating decisions. parties are also considered to be related if they are subject to common control or common significant influence.
outstanding balances as of year-end are unsecured and to be settled in cash. There have been no guarantees provided or received for any related party receivables or payables. in 2013 and 2012, the group has not recorded any impairment of receivables relating to amounts owed by related parties. This assessment is undertaken each financial year by examining the financial position of the related party and the market in which the related party operates.
significant transactions with related parties include:
2014 2013
category amount / volume
outstanding receivable
(payable) amount / volume
outstanding receivable
(payable) terms conditions
Other related partiesa. Y Realty Corporation
rent expense p8,689,131 p8,689,131 p14,319,473 p14,319,473non-interest
bearing; on demand
unsecured; no impairment
b. RCBC Bankard
shared expenses 1,175,370 1,175,370 1,953,565 1,953,565non-interest
bearing; on demand
unsecured; no impairment
c. HI
notes receivable – – (200,000,000) –interest at 5%
p.a.; due within one year
unsecured; no impairment
interest income – – 15,421,875 – interest at 5% p.a. unsecured; no impairment
investment in aFs equity securities – 124,174,586 – 235,766,697 – unsecured; no
impairment dividend income 1,103,678 – 2,094,048 – – unsecured; no
impairment
d. FMLC
notes receivable 280,000,000 280,000,000 280,000,000 280,000,000
due within one year; interest at 4.75% to 6.00%
p.a.
unsecured; no impairment
interest income 11,956,458 11,956,458 14,386,354 467,528 interest at 5% p.a. unsecured; no impairment
e. Grepalife
shared expenses 35,332 35,332 93,199 59,181non-interest
bearing; on demand
unsecured; no impairment
f. RCBC
cash in bank 464,037,685 106,754,450 21,174,463 381,146,564interest rate at
0.25% to 4.50% p.a.
unsecured; no impairment
short-term deposits 48,794,136 56,872,183 9,437,397,639 190,135,8132 to 35-day term,
interest at 0.50% - 4.50% p.a.
unsecured; no impairment
investment in aFs
debt securities 479,424,543 519,742,619 27,856,818 559,529,511
Maturing in 2016 and 2017; interest
rate at 5.25% to 9.88%
unsecured; no impairment
stocks 665,787,377 1,107,285,381 78,748,424 2,270,525,271 – unsecured; no impairment
long-term commercial papers 130,000,000 130,000,000 2,000,000 45,000,000
Maturing in 2019 and 2027; interest
rate at 5.25% to 7.00%
unsecured; no impairment
interest and dividend incomecash in bank 2,414,382 2,414,382 2,079,539 – interest at 0.25% -
4.25% p.a.unsecured; no
impairment
short-term deposits 1,617 10,399,172 58,9412 to 35-day term,
interest at 0.50% - 4.50% p.a.
unsecured; no impairment
(Forward)
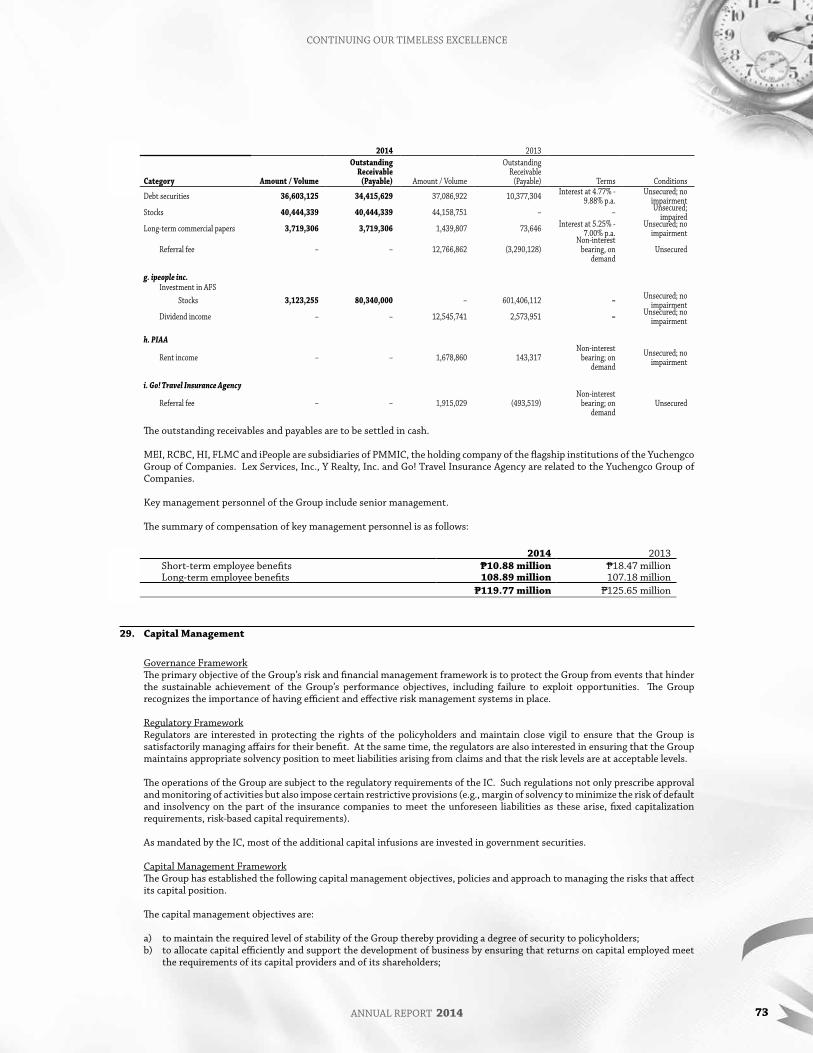
annual report 2014 73
continuing our timeless excellence
2014 2013
category amount / volume
outstanding receivable
(payable) amount / volume
outstanding receivable
(payable) terms conditions
debt securities 36,603,125 34,415,629 37,086,922 10,377,304 interest at 4.77% - 9.88% p.a.
unsecured; no impairment
stocks 40,444,339 40,444,339 44,158,751 – – unsecured; impaired
long-term commercial papers 3,719,306 3,719,306 1,439,807 73,646 interest at 5.25% - 7.00% p.a.
unsecured; no impairment
referral fee – – 12,766,862 (3,290,128)non-interest
bearing, on demand
unsecured
g. ipeople inc.investment in aFs
stocks 3,123,255 80,340,000 – 601,406,112 – unsecured; no impairment
dividend income – – 12,545,741 2,573,951 – unsecured; no impairment
h. PIAA
rent income – – 1,678,860 143,317non-interest
bearing; on demand
unsecured; no impairment
i. Go! Travel Insurance Agency
referral fee – – 1,915,029 (493,519)non-interest
bearing; on demand
unsecured
The outstanding receivables and payables are to be settled in cash.
Mei, rcbc, Hi, FlMc and ipeople are subsidiaries of pMMic, the holding company of the flagship institutions of the Yuchengco group of companies. lex services, inc., Y realty, inc. and go! travel insurance agency are related to the Yuchengco group of companies.
key management personnel of the group include senior management.
The summary of compensation of key management personnel is as follows:
2014 2013short-term employee benefits p10.88 million p18.47 millionlong-term employee benefits 108.89 million 107.18 million
p119.77 million p125.65 million
29. capital Management
governance FrameworkThe primary objective of the group’s risk and financial management framework is to protect the group from events that hinder the sustainable achievement of the group’s performance objectives, including failure to exploit opportunities. The group recognizes the importance of having efficient and effective risk management systems in place.
regulatory Frameworkregulators are interested in protecting the rights of the policyholders and maintain close vigil to ensure that the group is satisfactorily managing affairs for their benefit. at the same time, the regulators are also interested in ensuring that the group maintains appropriate solvency position to meet liabilities arising from claims and that the risk levels are at acceptable levels.
The operations of the group are subject to the regulatory requirements of the ic. such regulations not only prescribe approval and monitoring of activities but also impose certain restrictive provisions (e.g., margin of solvency to minimize the risk of default and insolvency on the part of the insurance companies to meet the unforeseen liabilities as these arise, fixed capitalization requirements, risk-based capital requirements).
as mandated by the ic, most of the additional capital infusions are invested in government securities.
capital Management FrameworkThe group has established the following capital management objectives, policies and approach to managing the risks that affect its capital position.
The capital management objectives are:
a) to maintain the required level of stability of the group thereby providing a degree of security to policyholders;b) to allocate capital efficiently and support the development of business by ensuring that returns on capital employed meet
the requirements of its capital providers and of its shareholders;

74
c) to retain financial flexibility by maintaining strong liquidity and access to a range of capital markets;d) to align the profile of assets and liabilities taking account of risks inherent in the business;e) to maintain financial strength to support new business growth and to satisfy the requirements of the policyholders,
regulators and stakeholders; andf) to maintain strong credit ratings and healthy capital ratios in order to support the group’s business objectives and maximize
shareholders’ value.
The operations of the group are also subject to regulatory requirements within the jurisdictions where it operates. such regulations not only prescribe approval and monitoring of activities, but also impose certain restrictive provisions (e.g. capital adequacy) to minimize the risk of default and insolvency on the part of the insurance companies to meet unforeseen liabilities as these arise.
The group has met all of these requirements throughout the financial year.
The group’s capital management policy for its insurance and non-insurance business is to hold sufficient capital to cover the statutory requirements based on the ic directives, including any additional amounts required by the regulator.
The group seeks to optimize the structure and sources of capital to ensure that it consistently maximizes returns to the shareholders and policyholders. The group’s approach to managing capital involves managing assets, liabilities and risks in a coordinated way, assessing shortfalls between reported and required capital levels (by each regulated entity) on a regular basis and taking appropriate actions to influence the capital position of the group in the light of changes in economic conditions and risk characteristics. an important aspect of the group’s overall capital management process is the setting of target risk adjusted rates of return which are aligned to performance objectives and ensure that the group is focused on the creation of value for shareholders.
Fixed capitalization requirementson august 15, 2013, the president of the philippines approved republic act no. 10607 to be known as the “new insurance code” which provides the new capitalization requirements for all existing insurance companies based on net worth on a staggered basis starting June 30, 2013 up to december 31, 2022. The following presents the amount of required net worth and the schedule of compliance per new insurance code:
networth compliance datep250,000,000 June 30, 2013
550,000,000 december 31 ,2016900,000,000 december 31, 2019
1,300,000,000 december 31, 2022
on January 13, 2015, the ic issued the circular letter (cl) no. 2015-02-a which provides for the clarification of minimum capital requirements under sections 194, 197, 200 and 289 of the new insurance code. The said circular supersedes the department order nos. 27-06 and 15-2012 and cl nos. 22-2008 and 26-2008.
unimpaired capital requirementinsurance Memorandum circular (iMc) 22-2008 provided that for purposes of determining compliance with the law, rules and regulations requiring that the paid-up capital should remain intact and unimpaired at all times, the statement of financial position should show that the net worth or equity is at least equal to the actual paid-up capital.
30. contingencies
The group operates in the insurance industry and has various contingent liabilities arising in the ordinary conduct of business, which are either pending decision by the courts or being contested, the outcome of which are not presently determinable. in the opinion of management and its legal counsel, the eventual liability under these lawsuits or claims, if any, will not have a material or adverse effect on the group’s financial position and results of operations.

annual report 2014 75
continuing our timeless excellence
MalaYan insurance co., inc. and suBsidiaries
Statement of Management Responsibility for Financial Statement
The management of Malayan insurance co., inc. and subsidiaries is responsible for the preparation and fair presentation
of the consolidated financial statements for the years ended december 31, 2014 and 2013, including the additional
components attached therein, in accordance with philippine Financial reporting standards. This responsibility includes
designing and implementing internal controls relevant to the preparation and fair presentation of the consolidated
financial statements that are free from material misstatement, whether due to fraud or error, selecting and applying
appropriate accounting policies, and making accounting estimates that are reasonable in the circumstances.
The board of directors reviews and approved the consolidated financial statements and submits the same to the
stockholders.
SyCip, Gorres, Velayo & Co., the independent auditors, appointed by the stockholders has examined the consolidated
financial statements of the company in accordance with philippine standard on auditing, and in its report to the
stockholders, has expressed its opinion on the fairness of presentation upon completion of such examination.
helen Y. deechairperson
Frederick p. pinedachief Financial officer
Yvonne s. YuchenGcopresident
aleGria r. castrocontroller
76
MalaYan insurance co., inc. and suBsidiaries
Independent Auditors’ Report
The stockholders and the board of directors
Malayan insurance co., inc.
4th Floor, Yuchengco building
484 quintin paredes street
binondo, Manila
we have audited the accompanying consolidated financial statements of Malayan insurance co., inc. and subsidiaries,
which comprise the consolidated statements of financial position as at december 31, 2014 and 2013, and the consolidated
statements of income, statements of comprehensive income, statements of changes in equity and statements of cash
flows for the years then ended, and a summary of significant accounting policies and other explanatory information.
Management’s Responsibility for the Consolidated Financial Statements
Management is responsible for the preparation and fair presentation of these consolidated financial statements in
accordance with philippine Financial reporting standards, and for such internal control as management determines
is necessary to enable the preparation of consolidated financial statements that are free from material misstatement,
whether due to fraud or error.
Auditors’ Responsibility
our responsibility is to express an opinion on these consolidated financial statements based on our audits. we conducted
our audits in accordance with philippine standards on auditing. Those standards require that we comply with ethical
requirements and plan and perform the audit to obtain reasonable assurance about whether the consolidated financial
statements are free from material misstatement.
an audit involves performing procedures to obtain audit evidence about the amounts and disclosures in the consolidated
financial statements. The procedures selected depend on the auditor’s judgment, including the assessment of the risks
of material misstatement of the consolidated financial statements, whether due to fraud or error. in making those risk
assessments, the auditor considers internal control relevant to the entity’s preparation and fair presentation of the
consolidated financial statements in order to design audit procedures that are appropriate in the circumstances, but
not for the purpose of expressing an opinion on the effectiveness of the entity’s internal control. an audit also includes
evaluating the appropriateness of accounting policies used and the reasonableness of accounting estimates made by
management, as well as evaluating the overall presentation of the consolidated financial statements.
we believe that the audit evidence we have obtained is sufficient and appropriate to provide a basis for our audit
opinion.

annual report 2014 77
continuing our timeless excellence
Opinion
in our opinion, the consolidated financial statements present fairly, in all material respects, the financial position of
Malayan insurance co., inc. and subsidiaries as at december 31, 2014 and 2013, and their financial performance and
their cash flows for the years then ended in accordance with philippine Financial reporting standards.
SYCIP GORRES VELAYO & CO.
Michael c. sabado
partner
cpa certificate no. 89336
sec accreditation no. 0664-ar-2 (group a),
March 26, 2014, valid until March 25, 2017
tax identification no. 160-302-865
bir accreditation no. 08-001998-73-2015,
February 27, 2015, valid until February 26, 2018
ptr no. 4751320, January 5, 2015, Makati city
March 31, 2015
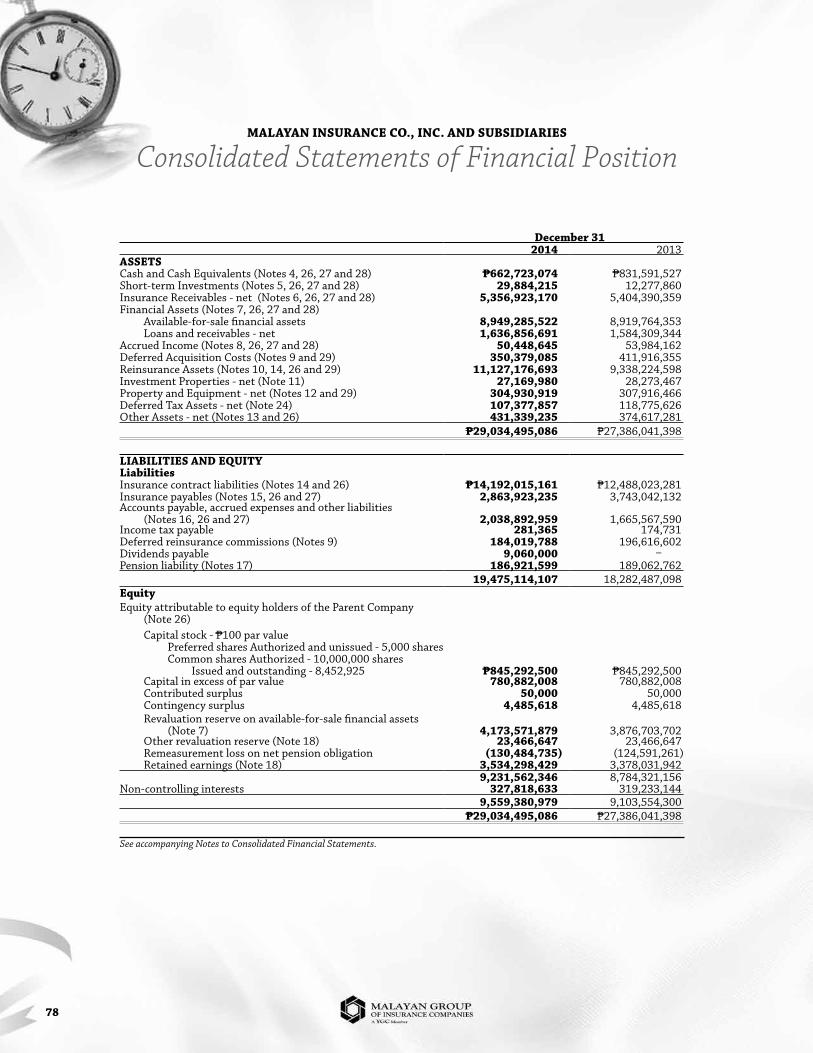
78
MalaYan insurance co., inc. and suBsidiaries
Consolidated Statements of Financial Position
december 312014 2013
assetscash and cash equivalents (notes 4, 26, 27 and 28) p662,723,074 p831,591,527short-term investments (notes 5, 26, 27 and 28) 29,884,215 12,277,860insurance receivables - net (notes 6, 26, 27 and 28) 5,356,923,170 5,404,390,359Financial assets (notes 7, 26, 27 and 28) available-for-sale financial assets 8,949,285,522 8,919,764,353 loans and receivables - net 1,636,856,691 1,584,309,344accrued income (notes 8, 26, 27 and 28) 50,448,645 53,984,162deferred acquisition costs (notes 9 and 29) 350,379,085 411,916,355reinsurance assets (notes 10, 14, 26 and 29) 11,127,176,693 9,338,224,598investment properties - net (note 11) 27,169,980 28,273,467property and equipment - net (notes 12 and 29) 304,930,919 307,916,466deferred tax assets - net (note 24) 107,377,857 118,775,626other assets - net (notes 13 and 26) 431,339,235 374,617,281
p29,034,495,086 p27,386,041,398
liaBilities and equitYliabilitiesinsurance contract liabilities (notes 14 and 26) p14,192,015,161 p12,488,023,281insurance payables (notes 15, 26 and 27) 2,863,923,235 3,743,042,132accounts payable, accrued expenses and other liabilities (notes 16, 26 and 27) 2,038,892,959 1,665,567,590income tax payable 281,365 174,731deferred reinsurance commissions (notes 9) 184,019,788 196,616,602dividends payable 9,060,000 – pension liability (notes 17) 186,921,599 189,062,762
19,475,114,107 18,282,487,098equityequity attributable to equity holders of the parent company
(note 26) capital stock - p100 par value preferred shares authorized and unissued - 5,000 shares common shares authorized - 10,000,000 shares issued and outstanding - 8,452,925 p845,292,500 p845,292,500 capital in excess of par value 780,882,008 780,882,008 contributed surplus 50,000 50,000 contingency surplus 4,485,618 4,485,618 revaluation reserve on available-for-sale financial assets
(note 7) 4,173,571,879 3,876,703,702 other revaluation reserve (note 18) 23,466,647 23,466,647 remeasurement loss on net pension obligation (130,484,735) (124,591,261) retained earnings (note 18) 3,534,298,429 3,378,031,942
9,231,562,346 8,784,321,156non-controlling interests 327,818,633 319,233,144
9,559,380,979 9,103,554,300p29,034,495,086 p27,386,041,398
See accompanying Notes to Consolidated Financial Statements.
Consolidated Statements of Income
annual report 2014 79
continuing our timeless excellence
MalaYan insurance co., inc. and suBsidiaries
Consolidated Statements of Income
Years ended december 312014 2013
incoMegross premiums earned p7,606,010,846 p6,934,474,871reinsurers’ share of gross premiums earned (4,823,465,587) (4,500,754,325)net premiums earned (notes 14 and 19) 2,782,545,259 2,433,720,546
investment and other income (note 20) 732,508,684 783,597,660commission income (note 9) 388,531,867 288,098,800other income 1,121,040,551 1,071,696,460total income 3,903,585,810 3,505,417,006
BeneFits, claiMs and eXpensesgross insurance contract benefits and claims paid
(notes 14 and 21) 4,061,809,777 3,002,090,676reinsurers’ share of gross insurance contract benefits
and claims paid (notes 14 and 21) (2,530,583,410) (1,540,261,911)gross change in insurance contract liabilities (note 21) 1,787,677,435 3,298,082,960reinsurers’ share of gross change in insurance contract
liabilities (note 21) (1,953,585,996) (3,280,324,845)net insurance contract benefits and claims 1,365,317,806 1,479,586,880commission expense (note 9) 1,031,068,080 924,908,829other underwriting expenses (note 9) 141,234,773 112,770,309general and administrative expenses (note 22) 999,287,507 875,930,540investment and other expense (note 20) 24,721,278 21,955,364interest expense on reinsurance funds held 6,443,360 1,666,473other expenses 2,202,754,998 1,937,231,515
total benefits, claims and other expenses 3,568,072,804 3,416,818,395
incoMe BeFore incoMe taX 335,513,006 88,598,611
provision For incoMe taX (note 24) 46,027,306 34,112,879
net incoMe (note 25) p289,485,700 p54,485,732
attributable to: equity holders of the parent company p283,060,362 p49,005,371 non-controlling interests 6,425,338 5,480,361
p289,485,700 p54,485,732
See accompanying Notes to Consolidated Financial Statements.

80
MalaYan insurance co., inc. and suBsidiaries
Consolidated Statements of Comprehensive Income
Years ended december 312014 2013
net incoMe p289,485,700 p54,485,732
other coMprehensive incoMe (loss)Item that will be reclassified to profit or loss in subsequent periods: net change on fair values of available-for-sale
financial assets - net of tax effect (note 7) 308,153,397 (654,186,114)Item that will not be reclassified to profit or loss in subsequent periods: remeasurement gain (loss) on pension obligation - net of tax effect (5,958,543) (30,161,438)
total coMprehensive incoMe (loss) p591,680,554 (p629,861,820)
attributable to: equity holders of the parent company p574,035,065 (p616,138,637) non-controlling interests 17,645,489 (13,723,183)
p591,680,554 (p629,861,820)
See accompanying Notes to Consolidated Financial Statements.

annual report 2014 81
continuing our timeless excellence
Ma
laYa
n in
sur
an
ce c
o.,
inc
. an
d s
uB
sid
iar
ies
Cons
olid
ated
Sta
tem
ents
of C
hang
es in
Equ
ity
capi
tal
stoc
k
capi
tal i
n ex
cess
of
par v
alue
cont
ribut
ed
surp
lus
cont
inge
ncy
surp
lus
reva
luat
ion
rese
rve o
n av
aila
ble-
fo
r-sa
le
Fina
ncia
l as
sets
(not
e 7)
othe
r re
valu
atio
n re
serv
e (n
ote 1
8)
rem
easu
rem
ent
loss
on
pens
ion
oblig
atio
n
reta
ined
ea
rnin
gs
(not
e 18)
tota
lno
n-co
ntro
lling
in
tere
sts
tota
lFo
r the
Year
end
ed d
ecem
ber 3
1, 2
014
balan
ce at
begi
nnin
g of y
ear
p845
,292
,500
p780
,882
,008
p50,
000
p4,4
85,6
18p3
,876
,703
,702
p23,
466,
647
(p12
4,59
1,26
1)p3
,378
,031
,942
p8,7
84,3
21,1
56p3
19,2
33,1
44p9
,103
,554
,300
net i
ncom
e–
––
––
–28
3,06
0,36
228
3,06
0,36
26,
425,
338
289,
485,
700
othe
r com
preh
ensiv
e inc
ome
––
––
296,
868,
177
–(5
,893
,474
)–
290,
974,
703
11,2
20,1
5130
2,19
4,85
4to
tal c
ompr
ehen
sive i
ncom
e–
––
–29
6,86
8,17
7–
(5,8
93,4
74)
283,
060,
362
574,
035,
065
17,6
45,4
8959
1,68
0,55
4ca
sh di
vide
nds d
eclar
ed–
––
––
––
(126
,793
,875
)(1
26,7
93,8
75)
(9,0
60,0
00)
(135
,853
,875
)Ba
lanc
e at e
nd of
year
p 845
,292
,500
p780
,882
,008
p50,
000
p4,4
85,6
18p4
,173
,571
,879
p23,
466,
647
(p13
0,48
4,73
5)p3
,534
,298
,429
p9,2
31,5
62,3
46p3
27,8
18,6
33p9
,559
,380
,979
For t
he Ye
ar e
nded
dec
embe
r 31,
201
3ba
lance
at be
ginn
ing o
f yea
r84
5,29
2,50
078
0,88
2,00
850
,000
4,48
5,61
84,
512,
298,
509
23,4
66,6
47(9
5,04
2,06
0)3,
329,
026,
571
9,40
0,45
9,79
334
4,28
1,32
79,
744,
741,
120
net i
ncom
e–
––
––
––
49,0
05,3
7149
,005
,371
5,48
0,36
154
,485
,732
othe
r com
preh
ensiv
e los
s–
––
–(6
35,5
94,8
07)
–(2
9,54
9,20
1)–
(665
,144
,008
)(1
9,20
3,54
4)(6
84,3
47,5
52)
tota
l com
preh
ensiv
e los
s–
––
–(6
35,5
94,8
07)
–(2
9,54
9,20
1)49
,005
,371
(616
,138
,637
)(1
3,72
3,18
3)(6
29,8
61,8
20)
cash
divi
dend
s dec
lared
––
––
––
––
–(1
1,32
5,00
0)(1
1,32
5,00
0)Ba
lanc
e at e
nd of
year
p 845
,292
,500
p780
,882
,008
p50,
000
p4,4
85,6
18p3
,876
,703
,702
p23,
466,
647
(p12
4,59
1,26
1)p3
,378
,031
,942
p8,7
84,3
21,1
56p3
19,2
33,1
44p9
,103
,554
,300
See
acco
mpa
nyin
g N
otes
to C
onso
lidat
ed F
inan
cial
Sta
tem
ents
.

82
MalaYan insurance co., inc. and suBsidiaries
Consolidated Statements of Cash Flows
Years ended december 312014 2013
cash Flows FroM operatinG activitiesincome before income tax p335,513,006 p88,598,611adjustments for: dividend income (note 20) (267,810,303) (247,818,277) interest income (note 20) (230,963,048) (292,081,431) depreciation and amortization (note 22) 70,797,076 61,975,536 interest expense on reinsurance funds held 6,443,360 1,666,473 unrealized foreign currency exchange loss - net (note 20) 923,674 (224,678,293) impairment loss on aFs financial assets (notes 7 and 20) ‒ 9,963,296 gain on sale of (note 20):
available-for-sale financial assets (170,155,505) (84,178,240)
real estate properties for sale (11,420,817) (2,397,054) investment properties (246,074) (3,077,475) property and equipment (627,221) (557,702) long-term commercial papers ‒ (1,782,814) loss on sale available-for-sale financial assets (note 20) ‒ 199,532operating loss before working capital changes (267,545,852) (694,167,838) decrease (increase) in: loans and receivables (108,090,668) (299,708,624) insurance receivables 47,467,189 (2,059,232,769) accrued rent income 2,611,681 150,677 deferred acquisition costs 61,537,270 (74,075,458) reinsurance assets (1,788,952,095) (4,025,071,880) other assets (58,167,097) (44,715,212) increase (decrease) in: insurance contract liabilities 1,703,991,880 3,957,323,333 insurance payables (879,118,897) 1,398,790,800 deferred reinsurance commissions (12,596,814) 83,325,883 pension liability (14,917,260) 1,478,618 dividends payable 9,060,000 ‒ accounts payable, accrued expenses and other liabilities 373,432,003 566,855,466net cash used in operations (931,288,660) (1,189,047,004)income tax paid (41,882,492) (35,302,458)interest paid on reinsurance funds held (6,443,360) (1,666,473)net cash used in operating activities (979,614,512) (1,226,015,935)
cash Flows FroM investinG activitiesproceeds from sale or maturities of: available-for-sale financial assets (note 7) 1,102,986,116 1,754,592,226 long-term commercial papers (note 7) 62,300,000 99,480,979 real estate properties for sale 13,500,817 2,962,054 short-term investments 12,277,860 11,245,787 property and equipment (note 12) 2,718,462 944,865 investment properties (note 11) 1,242,824 95,010,191
(Forward)

annual report 2014 83
continuing our timeless excellence
Years ended december 312014 2013
dividends received p263,918,732 p248,158,777interest received 243,246,656 299,915,722acquisitions of: non-trade notes receivable (note 7) 100,000,000 390,000,000 available-for-sale financial assets (note 7) (650,036,809) (1,486,107,000) long-term commercial papers (note 7) (103,127,645) (445,995,508) property and equipment (note 12) (69,796,033) (62,772,918) short-term investments (29,884,215) (12,277,860) investment properties (note 11) ‒ (11,411,830)net cash provided by investing activities 949,346,765 883,745,485
cash Flows FroM FinancinG activitYdividends paid (note 18) (135,853,875) (11,325,000)
eFFect oF eXchanGe rate chanGes on cash and cash equivalents (2,746,831) 22,874,625
net decrease in cash and cash equivalents (168,868,453) (330,720,825)
cash and cash equivalents at BeGinninG oF Year (note 4) 831,591,527 1,162,312,352
cash and cash equivalents at end oF Year p662,723,074 p831,591,527
See accompanying Notes to Consolidated Financial Statements.
84
MalaYan insurance co., inc. and suBsidiaries
Notes to Consolidated Financial Statements
1. corporate information
Malayan insurance co., inc. (the parent company) is a domestic corporation, which was registered with the philippine securities and exchange commission (sec) on February 16, 1949. The parent company is engaged in the nonlife insurance business dealing with all kinds of insurance such as fire, marine, bond, motor car, personal accident, miscellaneous casualty, and engineering, except life insurance.
on october 22, 2001, the sec approved the amended articles of incorporation extending the parent company’s existence to another 50 years from February 16, 1999.
The consolidated financial statements comprise the financial statements of the parent company and the following wholly and majority-owned subsidiaries:
place of percentage of ownershipincorporation 2014 2013
bankers assurance corporation (bac) philippines 100.0 100.0The First nationwide assurance corporation (Fnac) philippines 54.7 54.7
The parent company’s parent is Mico equities, inc. (Mei). The registered office address of the parent company is 4th Floor, Yuchengco building, 484 quintin paredes street, binondo, Manila. The parent company’s ultimate parent is pan Malayan Management and investment corporation (pMMic) with registered office address at 48th Floor, Yuchengco tower, rcbc plaza, 6819 ayala avenue, Makati city.
The accompanying consolidated financial statements of Malayan insurance co., inc. and subsidiaries (the group) were approved and authorized for issue by the board of directors (bod) on March 31, 2015.
2. summary of significant accounting policies
basis of preparation The accompanying consolidated financial statements of the group have been prepared on a historical cost basis, except for
available-for-sale (aFs) financial assets which have been measured at fair value. The consolidated financial statements are measured in philippine peso (p), which is also the group’s functional and presentation currency. all values are rounded off to the nearest philippine peso values, unless otherwise indicated.
statement of compliance The accompanying consolidated financial statements of the group have been prepared in compliance with philippine Financial
reporting standards (pFrs).
basis of consolidation The consolidated financial statements comprise the financial statements of the group as at and for the years ended december
31, 2014 and 2013.
subsidiaries are fully consolidated from the date of acquisition, being the date on which the group obtains control, and continue to be consolidated until the date when such control ceases. The financial statements of the subsidiaries are prepared for the same reporting period as the parent company, using consistent accounting policies. all intra-group balances, transactions, unrealized gains and losses resulting from intra-group transactions and dividends are eliminated in full.
non-controlling interests (ncis) pertains to the equity in a subsidiary not attributable, directly or indirectly to the parent company. any equity instruments issued by a subsidiary that are not owned by the parent company are ncis.
ncis represent the portion of profit or loss and net assets in subsidiaries not wholly-owned and are presented separately in the
consolidated statements of income, consolidated statements of comprehensive income, consolidated statements of changes in equity and consolidated statements of financial position, separately from the parent company’s equity.
losses within a subsidiary are attributed to the nci even if that results in a deficit balance.

annual report 2014 85
continuing our timeless excellence
a change in the ownership interest of a subsidiary, without a loss of control, is accounted for as an equity transaction. any difference between the amount by which the ncis are adjusted and the fair value of the consideration paid or received is recognized directly in equity as “equity reserve” and attributed to the owners of the parent company.
if the parent company loses control over a subsidiary it:
• Derecognizes the assets (including goodwill) and liabilities of the subsidiary • Derecognizes the carrying amount of any non-controlling interest • Derecognizes the cumulative translation differences recorded in equity • Recognizes the fair value of the consideration received • Recognizes the fair value of any investment retained
• Recognizes any surplus or deficit in profit or loss• Reclassifies the parent’s share of components previously recognized in other comprehensive income to profit or loss or
retained earnings, as appropriate.
changes in accounting policies The accounting policies adopted are consistent with those of the previous financial years except for the adoption of the following
new and amended philippine Financial reporting standards (pFrs) and philippine interpretations of international Financial reporting interpretation committee (iFric) interpretations which became effective beginning January 1, 2014. except as otherwise stated, the adoption of these new and amended standards and philippine interpretations did not have any impact on the consolidated financial statements.
• Investment Entities (Amendments to PFRS 10, Consolidated Financial Statements, pFrs 12, Disclosure of Interests in Other Entities, and pas 27, Separate Financial Statements)
These amendments provided an exception to the consolidation requirement for entities that meet the definition of an investment entity under pFrs 10. The exception to consolidation requires investment entities to account for subsidiaries at fair value through profit or loss. The amendments must be applied retrospectively, subject to certain transition relief. These amendments have no impact to the group’s financial position or performance.
• PAS 32, Financial Instruments: Presentation - Offsetting Financial Assets and Financial Liabilities These amendments clarified the meaning of ‘currently has a legally enforceable right to set-off’ and the criteria for non-
simultaneous settlement mechanisms of clearing houses to qualify for offsetting and are applied retrospectively. The amendments affect presentation only and have no impact on the group’s financial position or performance.
• PAS 39, Financial Instruments: Recognition and Measurement - Novation of Derivatives and Continuation of Hedge Accounting (Amendments)
These amendments provided relief from discontinuing hedge accounting when novation of a derivative designated as a hedging instrument meets certain criteria and retrospective application is required. These amendments have no impact on the group as the group has no derivatives during the current or prior periods.
• PAS 36, Impairment of Assets - Recoverable Amount Disclosures for Non-Financial Assets (Amendments) These amendments removed the unintended consequences of pFrs 13, Fair value Measurement, on the disclosures required
under pas 36. in addition, these amendments required disclosure of the recoverable amounts for assets or cash-generating units (cgus) for which impairment loss has been recognized or reversed during the period. The application of these amendments has no impact on the group’s consolidated financial statements.
• Philippine Interpretation IFRIC 21, Levies philippine interpretation iFric 21 clarified that an entity recognizes a liability for a levy when the activity that triggers
payment, as identified by the relevant legislation, occurs. For a levy that is triggered upon reaching a minimum threshold, the interpretation clarifies that no liability should be anticipated before the specified minimum threshold is reached. retrospective application is required for philippine interpretation iFric 21. This philippine interpretation has no impact on the group as it has applied the recognition principles under pas 37, Provisions, Contingent Liabilities and Contingent Assets, consistent with the requirements of philippine interpretation iFric 21 in prior years.
• Annual Improvements to PFRSs (2010 - 2012 cycle) in the 2010 - 2012 annual improvements cycle, seven amendments to six standards were issued, which included an
amendment to pFrs 13, Fair Value Measurement. The amendment to pFrs 13 is effective immediately and it clarified that short-term receivables and payables with no stated interest rates can be measured at invoice amounts when the effect of discounting is immaterial. This amendment has no impact on the group’s consolidated financial statements.
• Annual Improvements to PFRSs (2011 - 2013 cycle) in the 2011 - 2013 annual improvements cycle, four amendments to four standards were issued, which included an amendment
to pFrs 1, First-time Adoption of Philippine Financial Reporting Standards–First-time Adoption of PFRS. The amendment to pFrs 1 is effective immediately. it clarified that an entity may choose to apply either a current standard or a new standard that is not yet mandatory, but permits early application, provided either standard is applied consistently throughout the periods presented in the entity’s first pFrs financial statements. This amendment has no impact on the group as it is not a first-time pFrs adopter.

86
Future changes accounting policies The group will adopt the following new and amended standards and philippine interpretations enumerated below when these
become effective. except as otherwise indicated, the group does not expect the adoption of these new and amended pFrs and philippine interpretations to have significant impact on the consolidated financial statements.
• PFRS 9, Financial Instruments: Classification and Measurement pFrs 9 (2010 version) reflects the first phase on the replacement of pas 39 and applies to the classification and measurement
of financial assets and liabilities as defined in pas 39, Financial Instruments: Recognition and Measurement. pFrs 9 requires all financial assets to be measured at fair value at initial recognition. a debt financial asset may, if the fair value option (Fvo) is not invoked, be subsequently measured at amortized cost if it is held within a business model that has the objective to hold the assets to collect the contractual cash flows and its contractual terms give rise, on specified dates, to cash flows that are solely payments of principal and interest on the principal outstanding. all other debt instruments are subsequently measured at fair value through profit or loss. all equity financial assets are measured at fair value either through other comprehensive income (oci) or profit or loss. equity financial assets held for trading must be measured at fair value through profit or loss. For Fvo liabilities, the amount of change in the fair value of a liability that is attributable to changes in credit risk must be presented in oci. The remainder of the change in fair value is presented in profit or loss, unless presentation of the fair value change in respect of the liability’s credit risk in oci would create or enlarge an accounting mismatch in profit or loss. all other pas 39 classification and measurement requirements for financial liabilities have been carried forward into pFrs 9, including the embedded derivative separation rules and the criteria for using the Fvo. The adoption of the first phase of pFrs 9 will have an effect on the classification and measurement of the group’s financial assets, but will potentially have no impact on the classification and measurement of financial liabilities.
pFrs 9 (2010 version) is effective for annual periods beginning on or after January 1, 2015. This mandatory adoption date was moved to January 1, 2018 when the final version of pFrs 9 was adopted by the philippine Financial reporting standards council (Frsc). such adoption, however, is still for approval by the board of accountancy (boa).
• Philippine Interpretation IFRIC 15, Agreements for the Construction of Real Estate This philippine interpretation covers accounting for revenue and associated expenses by entities that undertake the
construction of real estate directly or through subcontractors. The interpretation requires that revenue on construction of real estate be recognized only upon completion, except when such contract qualifies as construction contract to be accounted for under pas 11 or involves rendering of services in which case revenue is recognized based on stage of completion. contracts involving provision of services with the construction materials and where the risks and reward of ownership are transferred to the buyer on a continuous basis will also be accounted for based on stage of completion. The sec and the Frsc have deferred the effectivity of this interpretation until the final revenue standard is issued by the international accounting standards board (iasb) and an evaluation of the requirements of the final revenue standard against the practices of the philippine real estate industry is completed.
The following new standards and amendments issued by the international accounting standards board (“iasb”) were already adopted by the Frsc but are still for approval of the boa:
Effective in 2015
• PAS 19, Employee Benefits - Defined Benefit Plans: Employee Contributions (Amendments) pas 19 requires an entity to consider contributions from employees or third parties when accounting for defined benefit
plans. where the contributions are linked to service, they should be attributed to periods of service as a negative benefit. These amendments clarify that, if the amount of the contributions is independent of the number of years of service, an entity is permitted to recognize such contributions as a reduction in the service cost in the period in which the service is rendered, instead of allocating the contributions to the periods of service. This amendment is effective for annual periods beginning on or after January 1, 2015. it is not expected that this amendment would be relevant to the group, since it has no defined benefit plans with contributions from employees or third parties.
annual improvements to pFrss 2010 - 2012 cycle The annual improvements to pFrss (2010 - 2012 cycle) are effective for annual periods beginning on or after January 1, 2015
and are not expected to have a material impact on the group.
• PFRS 2, Share-based Payment – Definition of Vesting Condition This improvement is applied prospectively and clarifies various issues relating to the definitions of performance and service
conditions which are vesting conditions, including:• A performance condition must contain a service condition• A performance target must be met while the counterparty is rendering service• A performance target may relate to the operations or activities of an entity, or to those of another entity in the same group• A performance condition may be a market or non-market condition• If the counterparty, regardless of the reason, ceases to provide service during the vesting period, the service condition is
not satisfied.

annual report 2014 87
continuing our timeless excellence
• PFRS 3, Business Combinations – Accounting for Contingent Consideration in a Business Combination The amendment is applied prospectively for business combinations for which the acquisition date is on or after July 1, 2014.
it clarifies that a contingent consideration that is not classified as equity is subsequently measured at fair value through profit or loss whether or not it falls within the scope of pas 39, Financial Instruments: Recognition and Measurement (or pFrs 9, Financial Instruments, if early adopted). The group shall consider this amendment for future business combinations.
• PFRS 8, Operating Segments – Aggregation of Operating Segments and Reconciliation of the Total of the Reportable Segments’ Assets to the Entity’s Assets
The amendments are applied retrospectively and clarify that:• An entity must disclose the judgments made by management in applying the aggregation criteria in the standard, including
a brief description of operating segments that have been aggregated and the economic characteristics (e.g., sales and gross margins) used to assess whether the segments are ‘similar’.
• The reconciliation of segment assets to total assets is only required to be disclosed if the reconciliation is reported to the chief operating decision maker, similar to the required disclosure for segment liabilities.
• PAS 16, Property, Plant and Equipment, and pas 38, Intangible Assets – Revaluation Method – Proportionate Restatement of Accumulated Depreciation and Amortization
The amendment is applied retrospectively and clarifies in pas 16 and pas 38 that the asset may be revalued by reference to the observable data on either the gross or the net carrying amount. in addition, the accumulated depreciation or amortization is the difference between the gross and carrying amounts of the asset.
• PAS 24, Related Party Disclosures – Key Management Personnel The amendment is applied retrospectively and clarifies that a management entity, which is an entity that provides key
management personnel services, is a related party subject to the related party disclosures. in addition, an entity that uses a management entity is required to disclose the expenses incurred for management services.
annual improvements to pFrss 2011 - 2013 cycle The annual improvements to pFrss (2011 - 2013 cycle) are effective for annual periods beginning on or after January 1, 2015
and are not expected to have a material impact on the group.
• PFRS 3, Business Combinations - Scope Exceptions for Joint Arrangements• The amendment is applied prospectively and clarifies the following regarding the scope exceptions within PFRS 3: Joint
arrangements, not just joint ventures, are outside the scope of pFrs 3.• This scope exception applies only to the accounting in the financial statements of the joint arrangement itself.
• PFRS 13, Fair Value Measurement - Portfolio Exception The amendment is applied prospectively and clarifies that the portfolio exception in pFrs 13 can be applied not only to
financial assets and financial liabilities, but also to other contracts within the scope of pas 39.
• PAS 40, Investment Property The amendment is applied prospectively and clarifies that pFrs 3, and not the description of ancillary services in pas 40,
is used to determine if the transaction is the purchase of an asset or business combination. The description of ancillary services in pas 40 only differentiates between investment property and owner-occupied property (i.e., property, plant and equipment).
Effective in 2016
• PAS 16, Property, Plant and Equipment, and pas 38, Intangible Assets – Clarification of Acceptable Methods of Depreciation and Amortization (amendments)
The amendments clarify the principle in pas 16 and pas 38 that revenue reflects a pattern of economic benefits that are generated from operating a business (of which the asset is part) rather than the economic benefits that are consumed through use of the asset. as a result, a revenue-based method cannot be used to depreciate property, plant and equipment and may only be used in very limited circumstances to amortize intangible assets. The amendments are effective prospectively for annual periods beginning on or after January 1, 2016, with early adoption permitted. These amendments are not expected to have any impact to the group since it has no intangible assets.
• PAS 16, Property, Plant and Equipment, and pas 41, Agriculture – Bearer Plants (amendments) The amendments change the accounting requirements for biological assets that meet the definition of bearer plants. under
the amendments, biological assets that meet the definition of bearer plants will no longer be within the scope of pas 41. instead, pas 16 will apply. after initial recognition, bearer plants will be measured under pas 16 at accumulated cost (before maturity) and using either the cost model or revaluation model (after maturity). The amendments also require that produce that grows on bearer plants will remain in the scope of pas 41 measured at fair value less costs to sell. For government grants related to bearer plants, pas 20, Accounting for Government Grants and Disclosure of Government Assistance, will apply. The amendments are retrospectively effective for annual periods beginning on or after January 1, 2016, with early adoption permitted. These amendments are not expected to have any impact to the group as the group does not have any bearer plants.

88
• PAS 27, Separate Financial Statements – Equity Method in Separate Financial Statements (amendments) The amendments will allow entities to use the equity method to account for investments in subsidiaries, joint ventures and
associates in their separate financial statements. entities already applying pFrs and electing to change to the equity method in its separate financial statements will have to apply that change retrospectively. For first-time adopters of pFrs electing to use the equity method in its separate financial statements, they will be required to apply this method from the date of transition to pFrs. The amendments are effective for annual periods beginning on or after January 1, 2016, with early adoption permitted. These amendments will not have any impact on the group’s consolidated financial statements.
• PFRS 10, Consolidated Financial Statements and pas 28, Investments in Associates and Joint Ventures – sale or contribution of assets between an investor and its associate or Joint venture
These amendments address an acknowledged inconsistency between the requirements in pFrs 10 and those in pas 28 (2011) in dealing with the sale or contribution of assets between an investor and its associate or joint venture. The amendments require that a full gain or loss is recognized when a transaction involves a business (whether it is housed in a subsidiary or not). a partial gain or loss is recognized when a transaction involves assets that do not constitute a business, even if these assets are housed in a subsidiary. These amendments are effective from annual periods beginning on or after 1 January 2016.
• PFRS 11, Joint Arrangements – Accounting for Acquisitions of Interests in Joint Operations (amendments) The amendments to pFrs 11 require that a joint operator accounting for the acquisition of an interest in a joint operation,
in which the activity of the joint operation constitutes a business must apply the relevant pFrs 3 principles for business combinations accounting. The amendments also clarify that a previously held interest in a joint operation is not remeasured on the acquisition of an additional interest in the same joint operation while joint control is retained. in addition, a scope exclusion has been added to pFrs 11 to specify that the amendments do not apply when the parties sharing joint control, including the reporting entity, are under common control of the same ultimate controlling party.
The amendments apply to both the acquisition of the initial interest in a joint operation and the acquisition of any additional interests in the same joint operation and are prospectively effective for annual periods beginning on or after January 1, 2016, with early adoption permitted. These amendments are does not have any impact to the group.
• PFRS 14, Regulatory Deferral Accounts pFrs 14 is an optional standard that allows an entity, whose activities are subject to rate-regulation, to continue applying
most of its existing accounting policies for regulatory deferral account balances upon its first-time adoption of pFrs. entities that adopt pFrs 14 must present the regulatory deferral accounts as separate line items on the statement of financial position and present movements in these account balances as separate line items in the consolidated statement of profit or loss and other comprehensive income. The standard requires disclosures on the nature of, and risks associated with, the entity’s rate-regulation and the effects of that rate-regulation on its financial statements. pFrs 14 is effective for annual periods beginning on or after January 1, 2016. since the group is an existing pFrs preparer, this standard would not apply.
annual improvements to pFrss 2012 - 2014 cycle The annual improvements to pFrss (2012 - 2014 cycle) are effective for annual periods beginning on or after January 1, 2016
and are not expected to have a material impact on the group.
• PFRS 5, Non-current Assets Held for Sale and Discontinued Operations – Changes in Methods of Disposal The amendment is applied prospectively and clarifies that changing from a disposal through sale to a disposal through
distribution to owners and vice-versa should not be considered to be a new plan of disposal, rather it is a continuation of the original plan. There is, therefore, no interruption of the application of the requirements in pFrs 5. The amendment also clarifies that changing the disposal method does not change the date of classification.
• PFRS 7, Financial Instruments: Disclosures – Servicing Contracts pFrs 7 requires an entity to provide disclosures for any continuing involvement in a transferred asset that is derecognized in
its entirety. The amendment clarifies that a servicing contract that includes a fee can constitute continuing involvement in a financial asset. an entity must assess the nature of the fee and arrangement against the guidance in pFrs 7 in order to assess whether the disclosures are required. The amendment is to be applied such that the assessment of which servicing contracts constitute continuing involvement will need to be done retrospectively. However, comparative disclosures are not required to be provided for any period beginning before the annual period in which the entity first applies the amendments.
• PFRS 7 - Applicability of the Amendments to PFRS 7 to Condensed Interim Financial Statements This amendment is applied retrospectively and clarifies that the disclosures on offsetting of financial assets and financial
liabilities are not required in the condensed interim financial report unless they provide a significant update to the information reported in the most recent annual report.
• PAS 19, Employee Benefits – regional market issue regarding discount rate This amendment is applied prospectively and clarifies that market depth of high quality corporate bonds is assessed based on
the currency in which the obligation is denominated, rather than the country where the obligation is located. when there is no deep market for high quality corporate bonds in that currency, government bond rates must be used.
• PAS 34, Interim Financial Reporting – disclosure of information ‘elsewhere in the interim financial report’ The amendment is applied retrospectively and clarifies that the required interim disclosures must either be in the interim
consolidated financial statements or incorporated by cross-reference between the interim financial statements and wherever they are included within the greater interim financial report (e.g., in the management commentary or risk report).

annual report 2014 89
continuing our timeless excellence
Effective in 2018
• PFRS 9, Financial Instruments – Hedge accounting and amendments to pFrs 9, pFrs 7 and pas 39 (2013 version) pFrs 9 (2013 version) already includes the third phase of the project to replace pas 39 which pertains to hedge accounting.
This version of pFrs 9 replaces the rules-based hedge accounting model of pas 39 with a more principles-based approach. changes include replacing the rules-based hedge effectiveness test with an objectives-based test that focuses on the economic relationship between the hedged item and the hedging instrument, and the effect of credit risk on that economic relationship; allowing risk components to be designated as the hedged item, not only for financial items but also for non-financial items, provided that the risk component is separately identifiable and reliably measurable; and allowing the time value of an option, the forward element of a forward contract and any foreign currency basis spread to be excluded from the designation of a derivative instrument as the hedging instrument and accounted for as costs of hedging. pFrs 9 also requires more extensive disclosures for hedge accounting.
pFrs 9 (2013 version) has no mandatory effective date. The mandatory effective date of January 1, 2018 was eventually set when the final version of pFrs 9 was adopted by the Frsc. The adoption of the final version of pFrs 9, however, is still for approval by boa.
The adoption of pFrs 9 is not expected to have any significant impact on the group’s consolidated financial statements.
• PFRS 9, Financial Instruments (2014 or final version) in July 2014, the final version of pFrs 9, Financial Instruments, was issued. pFrs 9 reflects all phases of the financial
instruments project and replaces pas 39, Financial Instruments: Recognition and Measurement, and all previous versions of pFrs 9. The standard introduces new requirements for classification and measurement, impairment, and hedge accounting. pFrs 9 is effective for annual periods beginning on or after January 1, 2018, with early application permitted. retrospective application is required, but comparative information is not compulsory. early application of previous versions of pFrs 9 is permitted if the date of initial application is before February 1, 2015.
The adoption of pFrs 9 will have an effect on the classification and measurement of the group’s financial assets and impairment methodology for financial assets, but will have no impact on the classification and measurement of the group’s financial liabilities. The group is currently assessing the impact of adopting this standard.
New Standard Issued By The IASB But Has Not Yet Been Adopted By The FRSC
iFrs 15, Revenue from Contracts with Customers iFrs 15 was issued in May 2014 and establishes a new five-step model that will apply to revenue arising from contracts with
customers. under iFrs 15 revenue is recognized at an amount that reflects the consideration to which an entity expects to be entitled in exchange for transferring goods or services to a customer. The principles in iFrs 15 provide a more structured approach to measuring and recognizing revenue. The new revenue standard is applicable to all entities and will supersede all current revenue recognition requirements under iFrs. either a full or modified retrospective application is required for annual periods beginning on or after 1 January 2017 with early adoption permitted. The group is currently assessing the impact of iFrs 15 and plans to adopt the new standard on the required effective date once adopted locally.
product classification insurance contracts are those contracts where the group (the insurer) has accepted significant insurance risk from another
party (the policyholders) by agreeing to compensate the policyholders if a specified uncertain future event (the insured event) adversely affects the policyholders. as a general guideline, the group determines whether it has significant insurance risk, by comparing benefits paid with benefits payable if the insured event did not occur. insurance contracts can also transfer financial risk.
once a contract has been classified as an insurance contract, it remains an insurance contract for the remainder of its lifetime, even if the insurance risk reduces significantly during this period, unless all rights and obligations are extinguished or have expired.
Fair value measurement The group measures financial instruments at fair value at each reporting date. also, fair values of financial instruments measured
at amortized cost and non-financial assets such as investment property carried at cost are disclosed in note 27.
Fair value is the price that would be received to sell an asset or paid to transfer a liability in an orderly transaction between market participants at the measurement date. The fair value measurement is based on the presumption that the transaction to sell the asset or transfer the liability takes place either:
• In the principal market for the asset or liability, or • In the absence of a principal market, in the most advantageous market for the asset or liability
The principal or the most advantageous market must be accessible to the group.

90
The fair value of an asset or a liability is measured using the assumptions that market participants would use when pricing the asset or liability, assuming that market participants act in their economic best interest.
a fair value measurement of a non-financial asset takes into account a market participant’s ability to generate economic benefits by using the asset in its highest and best use or by selling it to another market participant that would use the asset in its highest and best use.
The group uses valuation techniques that are appropriate in the circumstances and for which sufficient data are available to measure fair value, maximizing the use of relevant observable inputs and minimizing the use of unobservable inputs.
all assets and liabilities for which fair value is measured or disclosed in the consolidated financial statements are categorized within the fair value hierarchy, described as follows, based on the lowest level input that is significant to the fair value measurement as a whole:
• Level 1 - quoted (unadjusted) market prices in active markets for identical assets or liabilities• Level 2 - valuation techniques for which the lowest level input that is significant to the fair value measurement is directly or
indirectly observable• Level 3 - valuation techniques for which the lowest level input that is significant to the fair value measurement is unobservable
For assets and liabilities that are recognized in the consolidated financial statement on a recurring basis, the group determines whether transfers have occurred between levels in the hierarchy by re-assessing categorization (based on the lowest level input that is significant to the fair value measurement as a whole) and at the end of each reporting period.
cash and cash equivalents cash includes cash on hand and in banks. cash equivalents are short-term, highly liquid investments that are readily convertible
to known amounts of cash with original maturities of three months or less from dates of placement and that are subject to an insignificant risk of changes in value.
short-term investments short-term investments are short-term, highly liquid investments that are readily convertible to known amounts of cash with
original maturities of more than three months but less than one year from dates of placement. These earn interests at the respective short-term investment rates.
insurance receivables premium receivables (due from policyholders, agents and brokers and due from ceding companies) are recognized on policy
inception dates and measured on initial recognition at the fair value of the consideration receivable for the period of coverage. subsequent to initial recognition, insurance receivables are measured at amortized cost. The carrying value of insurance receivables is reviewed for impairment whenever events or circumstances indicate that the carrying amount may not be recoverable, with the impairment loss recorded in profit or loss.
Financial instruments Date of recognition Financial instruments are recognized in the consolidated statement of financial position when the group becomes a party to the
contractual provisions of the instrument. purchases or sales of financial assets that require delivery of assets within the time frame established by regulation or convention in the marketplace are recognized on the trade date.
Initial recognition of financial instruments Financial instruments are initially recognized at fair value of the consideration given (in case of an asset) or received (in case
of a liability). except for financial instruments at fair value through profit or loss (Fvpl), the initial measurement of financial assets includes transaction costs. The group classifies its financial assets in the following categories: held-to-maturity (HtM) investments, aFs investments, Fvpl investments and loans and receivables. The group classifies its financial liabilities into financial liabilities at Fvpl and other financial liabilities.
The classification depends on the purpose for which the investments were acquired and whether they are quoted in an active market. Management determines the classification of its investments at initial recognition and, where allowed and appropriate, re-evaluates such designation at every end of the reporting period.
as of december 31, 2014 and 2013, the group’s financial instruments are in the nature of aFs financial assets, loans and receivables and other financial liabilities.
Day 1 difference where the transaction price in a non-active market is different from the fair value from other observable current market
transactions in the same instrument or based on a valuation technique whose variables include only data from observable market, the group recognizes the difference between the transaction price and fair value (a ‘day 1’ difference) in profit or loss unless it qualifies for recognition as some other type of asset. in cases where an unobservable data is used, the difference between the transaction price and model value is only recognized in profit or loss when the inputs become observable or when the instrument is derecognized. For each transaction, the group determines the appropriate method of recognizing the ‘day 1’ difference amount.

annual report 2014 91
continuing our timeless excellence
Financial assets and liabilities at FVPL Financial assets and financial liabilities at Fvpl include financial assets and liabilities held-for-trading and financial assets and
liabilities designated upon initial recognition as at Fvpl.
Financial assets and liabilities are classified as held-for-trading if they are acquired for purposes of selling and repurchasing in the near term. derivatives, including any separated embedded derivatives, are also classified as financial assets or financial liabilities at Fvpl, unless these are designated as hedging instruments in an effective hedge.
Financial assets and liabilities at Fvpl are recorded in the consolidated statement of financial position at fair value. subsequent changes in fair value are recognized in “investment and other income” in the consolidated statement of income. interest earned or incurred is recorded as interest income or expense, respectively, while dividend income is recorded as other income when the right to receive the payment has been established.
Derivative instruments The group uses derivatives such as non-deliverable forward contracts as a means of reducing its foreign exchange exposure.
derivative instruments (including bifurcated embedded derivatives) are initially recognized at fair value on the date on which the derivative contract is entered into and are subsequently remeasured at fair value. derivatives are carried as assets when the fair value is positive and as liabilities when the fair value is negative. any gain or loss arising from changes in fair value of derivatives that do not qualify for hedge accounting is recognized in “investment and other income” in the consolidated statement of income.
Embedded derivatives an embedded derivative is a component of a hybrid (combined) instrument that also includes non-derivative host contract with
the effect that some of the cash flows of the combined instrument vary in a way similar to stand-alone derivative.
embedded derivatives are bifurcated from their host contracts, when the following conditions are met:a) the entire hybrid contracts (composed of both the host contract and the embedded derivative) are not accounted for as
financial assets and liabilities at Fvpl;b) when their economic risks and characteristics are not closely related to those of their respective host contracts; andc) a separate instrument with the same terms as the embedded derivative would meet the definition of a derivative.
The group assesses whether embedded derivatives are required to be separated from the host contract when it first becomes party to the contract. reassessment only occurs if there is a change in the terms of the contract that significantly modifies the cash flows that would otherwise be required.
AFS financial assets aFs investments are those which are designated as such or do not qualify to be classified as designated at Fvpl, HtM or loans
and receivables. They are purchased and held indefinitely, and may be sold in response to liquidity requirements or changes in market conditions.
after initial measurement, aFs investments are subsequently measured at fair value. The effective yield component of aFs debt securities, as well as the impact of restatement on foreign currency-denominated aFs debt securities, is reported in earnings. interest earned on holding
aFs investments are reported as interest income using the effective interest rate. dividends earned on holding aFs investments are recognized in profit or loss when the right to receive the payment has been established. The unrealized gains and losses arising from the fair valuation of aFs investments are reported as ‘revaluation reserve on available-for-sale financial assets’ in other comprehensive income. The losses arising from impairment of such investments are recognized in profit or loss. when the security is disposed of, the cumulative gain or loss previously recognized in other comprehensive income is recognized as realized gains or losses in profit or loss. when the group holds more than one investment in the same security, the cost is determined using the weighted average method.
when the fair value of aFs investments cannot be measured reliably because of lack of reliable estimates of future cash flows and discount rates necessary to calculate the fair value of unquoted equity instruments, these investments are carried at cost.
Loans and receivables loans and receivables are financial assets with fixed or determinable payments and fixed maturities that are not quoted in an
active market. They are not entered into with the intention of immediate or short-term resale and are not classified as financial assets held for trading, designated as aFs or Fvpl. This accounting policy relates to the consolidated statement of financial position captions: (a) “cash and cash equivalents”, (b) “short-term investments”, (c) “insurance receivables”, (d) “loans and receivables” and (e) “accrued income”.
after initial measurement, the loans and receivables are subsequently measured at amortized cost using the effective interest rate method, less allowance for impairment. amortized cost is calculated by taking into account any discount or premium on acquisition and fees that are an integral part of the effective interest rate. The amortization is included in the investment and other income account in profit or loss. The losses arising from impairment of such loans and receivables are recognized in profit or loss.

92
Other financial liabilities issued financial instruments or their components, which are not designated at Fvpl are classified as other financial liabilities,
where the substance of the contractual arrangement results in the group having an obligation either to deliver cash or another financial asset to the holder, or to satisfy the obligation other than by the exchange of a fixed amount of cash or another financial asset for a fixed number of own equity shares.
after initial measurement, other financial liabilities are subsequently measured at amortized cost using the effective interest rate method. amortized cost is calculated by taking into account any discount or premium on the issue and fees that are an integral part of the effective interest rate. any effects of restatement of foreign currency-denominated liabilities are recognized in the consolidated statement of income.
This accounting policy applies primarily to the group’s insurance payables and accounts payable, accrued expenses and other liabilities that meet the above definition (other than liabilities covered by other accounting standards, such as pension liability and income tax payable).
impairment of Financial assets The group assesses at each end of the reporting period whether there is objective evidence that a financial asset or a group
of financial assets is impaired. a financial asset or a group of financial assets is deemed to be impaired if, and only if, there is objective evidence of impairment as a result of one or more events that has occurred after the initial recognition of the asset (an incurred ‘loss event’) and that loss event (or events) has an impact on the estimated future cash flows of the financial asset or the group of financial assets that can be reliably estimated.
evidence of impairment may include indications that the borrower or a group of borrowers is experiencing significant financial difficulty, default or delinquency in interest or principal payments, the probability that they will enter bankruptcy or other financial reorganization and where observable data indicate that there is measurable decrease in the estimated future cash flows, such as changes in arrears or economic conditions that correlate with defaults.
AFS investments carried at fair value in case of equity investments classified as aFs, impairment indicators would include a significant or prolonged decline in the
fair value of the investments below its cost. where there is evidence of impairment, the cumulative loss - measured as the difference between the acquisition cost and the current fair value, less any impairment loss on that financial asset previously recognized in the consolidated statement of income is removed from other comprehensive income and recognized in profit or loss. impairment losses on equity investments are not reversed through profit or loss. increases in fair value after impairment are recognized directly in other comprehensive income.
in the case of debt instruments classified as aFs financial assets, impairment is assessed based on the same criteria as financial assets carried at amortized cost. Future interest income is based on the reduced carrying amount and is accrued based on the rate of interest used to discount future cash flows for the purpose of measuring impairment loss. such accrual is recorded as part of “interest income” in profit or loss. if, in subsequent year, the fair value of a debt instrument increases and the increase can be objectively related to an event occurring after the impairment loss was recognized in profit or loss, the impairment loss is reversed through profit or loss.
AFS investments carried at cost if there is an objective evidence that an impairment loss on an unquoted equity instrument that is not carried at fair value
because its fair value cannot be reliably measured, or on a derivative asset that is linked to and must be settled by delivery of such unquoted equity instrument has been incurred, the amount of the loss is measured as the difference between the asset’s carrying amount and the present value of estimated future cash flows discounted at the current market rate of return for a similar financial asset.
Loans and Receivables For loans and receivables carried at amortized cost, the group first assesses whether objective evidence of impairment exists
for financial assets that are individually significant, or collectively for financial assets that are not individually significant. if the group determines that no objective evidence of impairment exists for individually assessed financial asset, whether significant or not, it includes the asset in a group of financial assets with similar credit risk characteristics and collectively assesses for impairment.
assets that are individually assessed for impairment and for which an impairment loss is, or continues to be, recognized are not included in a collective assessment for impairment.
if there is objective evidence that an impairment loss has been incurred, the amount of the loss is measured as the difference between the asset’s carrying amount and the present value of the estimated future cash flows (excluding future credit losses that have not been incurred) discounted at the financial asset’s original effective interest rate. The carrying amount of the asset is reduced through the use of an allowance account and the amount of loss is charged against profit or loss. receivables, together with the associated allowance accounts, are written off when there is no realistic prospect of future recovery and all collateral has been realized. if, in a subsequent period, the amount of the estimated impairment loss decreases because of an event occurring after the impairment was recognized, the previously recognized impairment loss is reversed. any subsequent reversal of an impairment loss is recognized in profit or loss, to the extent that the carrying value of the asset does not exceed its amortized cost at the reversal date.

annual report 2014 93
continuing our timeless excellence
time value is generally not considered when the effect of discounting is not material. if a loan has a variable interest rate, the discount rate for measuring any impairment loss is the current effective interest rate, adjusted for the original credit risk premium. The calculation of the present value of the estimated future cash flows of a collateralized financial asset reflects the cash flows that may result from foreclosure less costs for obtaining and selling the collateral, whether or not foreclosure is probable.
For the purpose of a collective evaluation of impairment, financial assets are grouped on the basis of credit risk characteristics such as past-due status and term.
Future cash flows in a group of financial assets that are collectively evaluated for impairment are estimated on the basis of historical loss experience for assets with credit risk characteristics similar to those in the group. Historical loss experience is adjusted on the basis of current observable data to reflect the effects of current conditions that did not affect the period on which the historical loss experience is based and to remove the effects of conditions in the historical period that do not exist currently. The methodology and assumptions used for estimating future cash flows are reviewed regularly by the group to reduce any difference between loss estimates and actual loss experience.
offsetting of Financial instruments Financial assets and financial liabilities are offset and the net amount is reported in the consolidated statement of financial
position if, and only if, there is a currently enforceable legal right to offset the recognized amounts and there is an intention to settle on a net basis, or to realize the asset and settle the liability simultaneously.
derecognition of Financial assets and liabilities Financial Asset a financial asset (or, where applicable a part of a financial asset or part of a group of similar financial assets) is derecognized
where:• the rights to receive cash flows from the asset have expired;• the Group retains the right to receive cash flows from the asset, but has assumed an obligation to pay them in full without
material delay to a third party under a ‘pass-through’ arrangement; or• the Group has transferred its rights to receive cash flows from the asset and either (a) has transferred substantially all the
risks and rewards of the asset, or (b) has neither transferred nor retained substantially all the risks and rewards of the asset, but has transferred control of the asset.
where the group has transferred its right to receive cash flows from an asset and has neither transferred nor retained substantially all the risks and rewards of the asset nor transferred control of the asset, the asset is recognized to the extent of the group’s continuing involvement in the asset.
Financial Liability a financial liability is derecognized when the obligation under the liability is discharged or cancelled or has expired. where
an existing financial liability is replaced by another from the same lender on substantially different terms, or the terms of an existing liability are substantially modified, such an exchange or modification is treated as a derecognition of the original liability and the recognition of a new liability, and the difference in the respective carrying amounts is recognized in profit or loss.
reinsurance The group cedes insurance risk in the normal course of business. reinsurance assets represent balances due from reinsurance
companies for its share on the unpaid losses incurred by the group. recoverable amounts are estimated in a manner consistent with the outstanding claims provision and are in accordance with the reinsurance contract. reinsurance recoverable on paid losses are included as part of insurance receivables.
reinsurance assets are reviewed for impairment at each end of the reporting period or more frequently when an indication of impairment arises during the reporting year. impairment occurs when objective evidence exists that the group may not recover outstanding amounts under the terms of the contract and when the impact on the amounts that the group will receive from the reinsurer can be measured reliably. The impairment loss is recorded in the statement of income.
ceded reinsurance arrangements do not relieve the group from its obligations to policyholders.
The group also assumes reinsurance risk in the normal course of business for insurance contracts. premiums and claims on assumed reinsurance are recognized in profit or loss as income and expenses in the same manner as they would be if the reinsurance were considered direct business, taking into account the product classification of the reinsured business. reinsurance liabilities represent balances due to reinsurance companies. amounts payable are estimated in a manner consistent with the associated reinsurance contract.
premiums and claims are presented on a gross basis for both ceded and assumed reinsurance.
reinsurance assets or liabilities are derecognized when the contractual rights are extinguished or expired or when the contract is transferred to another party.

94
when the group enters into a proportional treaty reinsurance agreement for ceding out its insurance business, the group initially recognizes a liability at transaction price. subsequent to initial recognition, the portion of the amount initially recognized as a liability which is presented as insurance payables in the liabilities section of the consolidated statement of financial position will be withheld and recognized as Funds held for reinsurers and included as part of the insurance payables in the liabilities section of the consolidated statement of financial position. The amount withheld is generally released after a year. Funds held by ceding companies are accounted for in the same manner.
deferred acquisition costs (dac) commissions and other acquisition costs incurred during the financial period that vary with and are related to securing new
insurance contracts and or renewing existing insurance contracts, but which relates to subsequent financial periods, are deferred to the extent that they are recoverable out of future revenue margins. other acquisition costs include referral fee of Fnac which is classified under other underwriting expense. all other acquisition costs are recognized as expense when incurred.
subsequent to initial recognition, these costs are amortized on a straight-line basis using the 24th method over the life of the contract except for the marine cargo where commissions for the last two months of the year are recognized as expense the following year. amortization is charged against the profit or loss. The unamortized acquisition costs are shown as deferred acquisition costs in the assets section of the consolidated statement of financial position.
an impairment review is performed at each end of the reporting period or more frequently when an indication of impairment arises. The carrying value is written down to the recoverable amount. The impairment loss is charged to profit or loss. dac is also considered in the liability adequacy test for each end of the reporting period.
investment properties properties held for rental yields and for capital appreciation or both rather than for use in the production or supply of goods and
services or for administrative purposes or sale in the ordinary course of business is classified as investment property.
investment properties are measured initially at cost, including transaction costs.
investment properties consist of land, buildings and construction in progress. The land is carried at cost. The buildings are carried at cost, less accumulated depreciation and amortization and any accumulated impairment losses.
construction in-progress is carried at cost and transferred to the related property and equipment account when the construction and related activities to prepare the property for its intended use are complete, and the property is ready for occupation. construction in-progress is not depreciated until such time that the relevant assets are completed and put into operational use.
depreciation and amortization is computed using the straight-line method over the estimated useful life of 40 years. The estimated useful life and depreciation and amortization method are reviewed periodically to ensure that the period and method of depreciation and amortization are consistent with the expected pattern of economic benefits from items of investment property.
investment properties are derecognized either when they have been disposed of, or when the investment property is permanently withdrawn from use and no future benefit is expected from its disposal. any gains or losses on the retirement or disposal of an investment property are recognized in the profit or loss in the year of retirement or disposal.
transfers are made to investment property when, and only when, there is a change in use, evidenced by the end of owner-occupation and commencement of an operating lease to another party. transfers are made from investment property when, and only when, there is a change in use, evidenced by commencement of owner-occupation or commencement of development with a view to sale.
property and equipment property and equipment, except for land, are stated at cost, net of accumulated depreciation and amortization and any
impairment in value. land is stated at cost less any impairment losses.
The initial cost of property and equipment comprises its purchase price, including nonrefundable taxes and any directly attributable costs of bringing the asset to its working condition and location for its intended use. subsequent costs are included in the asset’s carrying amount or recognized as a separate asset, as appropriate, only when it is probable that future economic benefits associated with the item will flow to the group and the cost of the item can be measured reliably. all other repairs and maintenance are charged to the statement of income during the financial period in which they are incurred.
depreciation and amortization are computed using the straight-line method over the estimated useful lives of the properties as follows:
Yearsbuilding and improvements 40building equipment 5office furniture, fixtures and equipment 5transportation equipment 5

annual report 2014 95
continuing our timeless excellence
leasehold improvements are amortized over the term of the lease or estimated useful life of 5 years, whichever is shorter.
The estimated useful lives and depreciation and amortization method are reviewed periodically to ensure that the period and method of depreciation and amortization are consistent with the expected pattern of economic benefits from items of property and equipment.
when property and equipment are retired or otherwise disposed of, the cost and the related accumulated depreciation and amortization and accumulated provision for impairment losses, if any, are removed from the accounts. any gain or loss arising on derecognition of the assets, which is calculated as the difference between the net disposal proceeds and the carrying amount of the asset, is included in the consolidated statement of income in the year the asset is derecognized.
creditable withholding taxes (cwts) creditable withholding pertains to the indirect tax paid by the group that is withheld by its counterparty for the payment of its
expenses and other purchases. These cwts are initially recorded at cost as an asset under “other assets” account.
at each end of the tax reporting deadline, these cwts may either be offset against future tax income payable or be claimed as a refund from the taxation authorities at the option of the group. if these cwts are claimed as a refund, these will be recorded as a receivable under “loans and receivables” account.
at each end of the reporting period, an assessment for impairment is performed as to the recoverability of these cwts.
computer software costs associated with the acquisition of computer software are capitalized only if the asset can be reliably measured, will generate
future economic benefits, and there is an ability to use or sell the asset.
computer software is carried at cost less accumulated amortization. computer software cost is amortized over the expected useful life of the asset, but not to exceed five (5) years. all computer software components are amortized over five (5) years. amortization commences when the asset is available for use or when it is in the location and condition necessary for it to be capable of operating in the manner intended by the group.
impairment of nonfinancial assets The group assesses at each end of the reporting period whether there is an indication that investment properties, property and
equipment and computer software may be impaired. if any such indication exists, or when annual impairment testing for an asset is required, the group makes an estimate of the asset’s recoverable amount. an asset’s recoverable amount is the higher of an asset’s or cash-generating unit’s fair value less costs to sell and its value in use and is determined for an individual asset, unless the asset does not generate cash inflows that are largely independent of those from other assets or groups of assets. where the carrying amount of an asset exceeds its recoverable amount, the asset is considered impaired and is written down to its recoverable amount. in assessing value in use, the estimated future cash flows are discounted to their present value using a pre-tax discount rate that reflects current market assessments of the time value of money and the risks specific to the asset.
an assessment is made at each end of the reporting period as to whether there is any indication that previously recognized impairment losses may no longer exist or may have decreased. if such indication exists, the recoverable amount is estimated. a previously recognized impairment loss is reversed only if there has been a change in the estimates used to determine the asset’s recoverable amount since the last impairment loss was recognized. if that is the case, the carrying amount of the asset is increased to its recoverable amount. That increased amount cannot exceed the carrying amount that would have been determined, net of depreciation, had no impairment loss been recognized for the asset in prior years. such reversal is recognized in profit or loss unless the asset is carried at revalued amount, in which case, the reversal is treated as a revaluation increase. after such reversal the depreciation charge is adjusted in future periods to allocate the asset’s revised carrying amount, less any residual value, on a systematic basis over its remaining useful life.
value-added tax (vat) The input value added tax pertains to the 12% indirect tax paid by the group in the course of the group’s trade or business on
local purchase of goods or services.
output vat pertains to the 12% tax due on the sale of insurance policies and other goods or services by the group.
if at the end of any taxable month, the output vat exceeds the input vat, the outstanding balance is included under “accounts payable and accrued expenses” account. if the input vat exceeds the output vat, the excess shall be carried over to the succeeding months and included under “other assets” account.
real estate properties for sale real estate properties for sale are measured at the lower of cost and net realizable value (nrv). nrv is the estimated selling
price in the ordinary course of business, based on market prices at the reporting date, less estimated costs of completion and the estimated costs to sell. The cost of inventory recognized in profit or loss on disposal is determined with reference to the specific costs incurred on the property.

96
insurance contract liabilities Provision for Unearned Premiums The proportion of written premiums, gross of commissions payable to intermediaries, attributable to subsequent periods or
to risks that have not yet expired is deferred as provision for unearned premiums. premiums from short-duration insurance contracts are recognized as revenue over the period of the contracts using the 24th method except for the marine cargo where premiums for the last two months are considered earned the following year. The portion of the premiums written that relate to the unexpired periods of the policies at end of the reporting period are accounted for as provision for unearned premiums as part of insurance contract liabilities and presented in the liabilities section of the consolidated statement of financial position. The change in the provision for unearned premiums is taken to profit or loss in order that revenue is recognized over the period of risk. Further provisions are made to cover claims under unexpired insurance contracts which may exceed the unearned premiums and the premiums due in respect of these contracts.
Claims Provision and Incurred But Not Reported (IBNR) Losses These liabilities are based on the estimated ultimate cost of all claims incurred but not settled at the end of the reporting period
together with related claims handling costs and reduction for the expected value of salvage and other recoveries. delays can be experienced in the notification and settlement of certain types of claims, therefore the ultimate cost of which cannot be known with certainty at the end of the reporting period. The liability is not discounted for the time value of money and includes provision for ibnr losses. The liability is derecognized when the contract is discharged, cancelled or has expired.
Liability Adequacy Test at each end of the reporting period, liability adequacy tests are performed, to ensure the adequacy of insurance contract
liabilities, net of related dac assets. in performing the test, current best estimates of future cash flows, claims handling and policy administration expenses are used. changes in expected claims that have occurred, but which have not been settled, are reflected by adjusting the liability for claims and future benefits. any inadequacy is immediately charged to the consolidated statement of income by establishing an unexpired risk provision for losses arising from the liability adequacy tests. The provision for unearned premiums is increased to the extent that the future claims and expenses in respect of current insurance contracts exceed future premiums plus the current provision for unearned premiums.
insurance payables insurance payables are recognized when due and measured on initial recognition at the fair value of the consideration received
less attributable transaction cost. subsequent to initial recognition, they are measured at amortized cost using the effective interest rate method.
insurance payables are derecognized when the obligation under the liability is settled,cancelled or expired.
pension cost The net defined benefit liability or asset is the aggregate of the present value of the defined benefit obligation at the end of the
reporting period reduced by the fair value of plan assets (if any), adjusted for any effect of limiting a net defined benefit asset to the asset ceiling. The asset ceiling is the present value of any economic benefits available in the form of refunds from the plan or reductions in future contributions to the plan.
The cost of providing benefits under the defined benefit plans is actuarially determined using the projected unit credit method.
defined benefit costs comprise the following: • Service cost • Net interest on the net defined benefit liability or asset • Remeasurements of net defined benefit liability or asset
service costs which include current service costs, past service costs and gains or losses on non-routine settlements are recognized as expense in profit or loss. past service costs are recognized when plan amendment or curtailment occurs. These amounts are calculated periodically by independent qualified actuaries.
net interest on the net defined benefit liability or asset is the change during the period in the net defined benefit liability or asset that arises from the passage of time which is determined by applying the discount rate based on government bonds to the net defined benefit liability or asset. net interest on the net defined benefit liability or asset is recognized as expense or income in profit or loss.
remeasurements comprising actuarial gains and losses, return on plan assets and any change in the effect of the asset ceiling (excluding net interest on defined benefit liability) are recognized immediately in other comprehensive income in the period in which they arise. remeasurements are not reclassified to profit or loss in subsequent periods.
plan assets are assets that are held by a long-term employee benefit fund or qualifying insurance policies. plan assets are not available to the creditors of the group, nor can they be paid directly to the group. Fair value of plan assets is based on market price information. when no market price is available, the fair value of plan assets is estimated by discounting expected future cash flows using a discount rate that reflects both the risk associated with the plan assets and the maturity or expected disposal date of those assets (or, if they have no maturity, the expected period until the settlement of the related obligations). if the fair value of the plan assets is higher than the present value of the defined benefit obligation, the measurement of the resulting defined benefit asset is limited to the present value of economic benefits available in the form of refunds from the plan or reductions in future contributions to the plan.

annual report 2014 97
continuing our timeless excellence
The group’s right to be reimbursed of some or all of the expenditure required to settle a defined benefit obligation is recognized as a separate asset at fair value when and only when reimbursement is virtually certain.
equity capital stock is recognized as issued when the stock is paid for or subscribed under a binding subscription agreement and is
measured at par value.
capital in excess of par value includes any premiums received in excess of par value on the issuance of capital stock.
contributed surplus represents the original contribution of the stockholders of the parent company, in addition to the paid-in capital stock, in order to comply with the pre-licensing requirements as provided under the insurance code (the code).
contingency surplus pertains to capital infusion of shareholders in order to comply with Margin of solvency (Mos) deficiency as a result of the examination made by the insurance commission (ic).
other revaluation reserve pertains to the appraisal increment on building relating to the parent company’s previously held interest in tokio Marine Malayan insurance co., inc. (tMMic) at the time of the business combination. The balance of the other revaluation reserve will be transferred to retained earnings when the building is disposed or derecognized.
retained earnings include all the accumulated earnings of the group, net of dividends declared.
revenue recognition revenue is recognized to the extent that it is probable that the economic benefits will flow to the group and the revenue can be
reliably measured. The following specific recognition criteria must also be met before revenue is recognized:
Premiums Revenue gross insurance written premiums comprise the total premiums receivable for the whole period of cover provided by contracts
entered into during the accounting period and are recognized on the date on which the policy incepts. premiums include any adjustments arising in the accounting period for premiums receivable in respect of business written in prior periods.
premiums from short-duration insurance contracts are recognized as revenue over the period of the contracts using the 24th method except for the marine cargo where premiums for the last two months are considered earned the following year. The portion of the premiums written that relate to the unexpired periods of the policies at end of the reporting period are accounted for as provision for unearned premiums as part of insurance contract liabilities and presented in the liabilities section of the consolidated statements of financial position. The related reinsurance premiums ceded that pertains to the unexpired periods at end of the reporting period are accounted for as deferred reinsurance premiums and shown as part of reinsurance assets in the consolidated statements of financial position. The net changes in these accounts between each end of reporting periods are recognized in profit or loss.
Reinsurance Commissions commissions earned from short-duration insurance contracts are recognized as revenue over the period of the contracts using
the 24th method except for the marine cargo where the deferred reinsurance commissions for the last two months of the year are considered earned the following year. The portion of the commissions that relate to the unexpired periods of the policies at end of the reporting period are accounted for as deferred reinsurance commissions and presented in the liabilities section of the consolidated statement of financial position.
Dividend income dividend income is recognized when the shareholders’ right to receive the payment is established.
Interest income For all financial instruments measured at amortized cost and interest-bearing financial instruments, interest income is recorded
at the effective interest rate, which is the rate that exactly discounts estimated future cash receipts through the expected life of the financial instrument or a shorter period, where appropriate, to the net carrying amount of the financial asset. The calculation takes into account all contractual terms of the financial instrument (for example, prepayment options), includes any fees or incremental costs that are directly attributable to the instrument and are an integral part of the effective interest rate, but not future credit losses. The adjusted carrying amount is calculated based on the original effective interest rate. The change in carrying amount is recorded as interest income.
once the recorded value of a financial asset or a group of similar financial assets has been reduced due to an impairment loss, interest income continues to be recognized using the original effective interest rate applied to the new carrying amount.
Rental income rental income from investment properties are recognized on a straight-line basis over the term of the lease.
Management fees Management fees are recognized as income when services are rendered.

98
Other income income from other sources is recognized when earned.
expense recognition expenses are decreases in economic benefits during the accounting period in the form of outflows or depletions of assets or
incurrence of liabilities that result in decrease in equity, other than those relating to distribution to equity participants.
Benefits and Claims benefits and claims consists of benefits and claims paid to policyholders, which includes changes in the valuation of insurance
contract liabilities, except for changes in the provision for unearned premiums which are recorded in insurance revenue. it further includes internal and external claims handling costs that are directly related to the processing and settlement of claims. amounts receivable in respect of salvage and subrogation are also considered. general insurance claims are recorded on the basis of notifications received.
Commission Expense commissions are recognized as expense over the period of the contracts using the 24th method. The portion of the commissions
that relates to the unexpired periods of the policies at the end of the reporting period is accounted for as “deferred acquisition cost” in the assets section of the consolidated statement of financial position.
Other underwriting expense other underwriting expense pertains to the costs incurred by the group prior to the issuance of policies to its policyholders.
These costs include expenses for technical inspections, actuarial reviews and other work that is deemed necessary to determine whether or not to accept the risks to be written. These costs are recognized as expense as they are incurred.
Expenses general and administrative expense and other investment expense, except for lease agreements, are recognized as expense as
they are incurred.
interest expense interest expense is charged against operations as they are incurred.
leases The determination of whether an arrangement is, or contains a lease, is based on the substance of the arrangement and requires
an assessment of whether the fulfillment of the arrangement is dependent on the use of a specific asset or assets and the arrangement conveys a right to use the asset. a reassessment is made after inception of the lease only if one of the following applies:
a. There is a change in contractual terms, other than a renewal or extension of the arrangement;b. a renewal option is exercised or extension granted, unless that term of the renewal or extension was initially included in the
lease term;c. There is a change in the determination of whether fulfillment is dependent on a specified asset or;d. There is a substantial change to the asset.
where a reassessment is made, lease accounting shall commence or cease from the date when the change in circumstances gave rise to the reassessment for scenarios a, c or d above, and at the date of renewal or extension period for scenario (b).
Group as a lessor leases where the group does not transfer substantially all the risks and benefits of ownership of the assets are classified as
operating leases. lease payments received are recognized as an income in the consolidated statement of income on a straight-line basis over the lease term. initial direct costs incurred in negotiating operating leases are added to the carrying amount of the leased asset and recognized over the lease term on the same basis as the rental income.
Group as a lessee leases where the lessor retains substantially all the risks and benefits of ownership of the asset are classified as operating leases.
Fixed lease payments are recognized as an expense in the consolidated statement of income on a straight-line basis.
Foreign exchange transactions The functional and presentation currency of the group is the philippine peso (p). transactions in foreign currencies are initially
recorded in the functional currency rate ruling at the date of the transaction. Monetary assets and liabilities denominated in foreign currencies are translated at the functional currency rate of exchange ruling at the end of the reporting period. nonmonetary items that are measured in terms of historical cost in a foreign currency are translated using the exchange rate as at the date of the initial transaction and are not subsequently restated. nonmonetary items measured at fair value in a foreign currency are translated using the exchange rate at the date when the fair value was determined. all foreign exchange differences are taken to profit or loss, except where it relates to equity securities where gains or losses are recognized directly in other comprehensive income.

annual report 2014 99
continuing our timeless excellence
provisions and contingencies provisions are recognized when the group has a present obligation (legal or constructive) as a result of a past event and it
is probable that an outflow of resources embodying economic benefits will be required to settle the obligation and a reliable estimate can be made of the amount of the obligation. where the group expects some or all of a provision to be reimbursed, for example, under an insurance contract, the reimbursement is recognized as a separate asset but only when the reimbursement is virtually certain. The expense relating to any provision is presented in profit or loss, net of any reimbursement. if the effect of the time value of money is material, provisions are determined by discounting the expected future cash flows at a pre-tax rate that reflects current market assessments of the time value of money and, where appropriate, the risks specific to the liability. where discounting is used, the increase in the provision due to the passage of time is recognized as an interest expense.
contingent liabilities are not recognized in the consolidated financial statements but are disclosed unless the possibility of an outflow of resources embodying economic benefits is remote. contingent assets are not recognized but are disclosed in the consolidated financial statements when an inflow of economic benefits is probable.
income tax Current tax current tax assets and liabilities for the current and prior periods are measured at the amount expected to be recovered
from or paid to the taxation authorities. The tax rates and tax laws used to compute the amount are those that are enacted or substantively enacted at the end of the reporting period.
Deferred tax deferred tax is provided, using the liability method, on all temporary differences at the end of the reporting period between the
tax bases of assets and liabilities and their carrying amounts for financial reporting purposes.
deferred tax liabilities are recognized for all taxable temporary differences, including asset revaluations. deferred tax assets are recognized for all deductible temporary differences, carryforward of unused tax credits from the excess of minimum corporate income tax (Mcit) over the regular income tax, and unused net operating loss carryover (nolco), to the extent that it is probable that sufficient taxable profit will be available against which the deductible temporary differences and carryforward of unused tax credits from Mcit and unused nolco can be utilized. deferred tax, however, is not recognized on temporary differences that arise from the initial recognition of an asset or liability in a transaction that is not a business combination and, at the time of the transaction, affects neither the accounting income nor taxable income or loss.
The carrying amount of deferred tax assets is reviewed at each end of the reporting period and reduced to the extent that it is no longer probable that sufficient taxable profit will be available to allow all or part of the deferred tax asset to be utilized. unrecognized deferred tax assets are reassessed at each end of the reporting period and are recognized to the extent that it has become probable that future taxable profit will allow the deferred tax asset to be recovered.
deferred tax assets and liabilities are measured at the tax rates that are applicable to the period when the asset is realized or the liability is settled, based on tax rates (and tax laws) that have been enacted or substantively enacted at the end of the reporting period. Movements in the deferred tax assets and liabilities arising from changes in tax rates are charged against or credited to income for the period.
current tax and deferred tax relating to items recognized as other comprehensive income is also recognized in the consolidated statement of other comprehensive income.
deferred tax assets and deferred tax liabilities are offset if a legally enforceable right exists to set off current tax assets against current tax liabilities and deferred taxes related to the same taxable entity and the same taxation authority.
events after end of the reporting period any post year-end events that provide additional information about the group’s position at the end of the reporting period
(adjusting event) are reflected in the consolidated financial statements. post year-end events that are not adjusting events, if any, are disclosed in the consolidated financial statements when material.
3. significant accounting Judgments and estimates
The preparation of the accompanying consolidated financial statements in accordance with pFrs requires the group to make judgments and estimates that affect the amounts reported in the consolidated financial statements and accompanying notes. The estimates and assumptions used in the accompanying consolidated financial statements are based upon management’s evaluation of relevant facts and circumstances as of the date of the consolidated financial statements. actual results could differ from such estimates.
Judgments in the process of applying the group’s accounting policies, management has made the following judgments, apart from
those involving estimations, which have the most significant effect on the amounts recognized in the consolidated financial statements:

100
Product classification The significance of insurance risk is dependent on both the probability of an insured event and the magnitude of its potential
effect. as a general guideline, the group defines significant insurance risk as the possibility of having to pay benefits on the occurrence of an insured event that are at least 5% more than the benefits payable if the insured event did not occur.
The group has determined that the insurance policies it issues have significant insurance risks and therefore meet the definition of insurance contracts and should be accounted for as such.
Functional Currency based on the economic substance of the underlying circumstances relevant to the group, the functional currency of the group
has been determined to be the philippine peso. The philippine peso is the currency of the primary economic environment in which the group operates. it is the currency that mainly influences the revenue and costs of the group operations.
Operating lease commitments - Group Company as lessor The group entered into commercial property leases on its investment properties. The group determined that it retains all the
significant risks and rewards of ownership of the property, thus accounts for them as operating lease.
Operating lease commitments - Group as lessee The group entered into various property leases with various lessors. The group determined that the lessors retain all the
significant risks and rewards of ownership of the leased properties thus accounts for them as operating leases.
Distinction between investment properties and owner-occupied properties The group determines whether a property qualifies as investment property. in making this judgment, the group considers
whether the property generates cash flows largely independent of the other assets held by an entity. owner-occupied properties generate cash flows that are attributable not only to property but also to the other assets used in the production or supply process.
when properties comprise a portion that is held to earn rentals or for capital appreciation and another portion is held for use in the production or supply of goods or services or for administrative purpose, and these portions cannot be sold separately, the property is accounted for as investment property only if an insignificant portion is held for use in the production or supply of goods or services or for administrative purposes. Judgment is applied in determining whether ancillary services are so significant that a property does not qualify as investment property. The group considers each property separately in making this judgment.
Management’s use of estimates The key assumptions concerning the future and other key sources of estimation uncertainty at each reporting date, that have a
significant risk of causing a material adjustment to the carrying amounts of assets and liabilities within the next financial year are discussed below.
Fair values of financial assets The group carries certain financial assets at fair value, which requires extensive use of accounting estimates and judgments.
Fair value determinations for financial assets are based generally on listed or quoted market prices. if prices are not readily determinable or if liquidating positions is reasonably expected to affect market prices, fair value is based on either internal valuation models or management’s estimate of amounts that could be realized under current market conditions, assuming an orderly liquidation over a reasonable period of time. while significant components of fair value were determined using verifiable objective evidence (i.e., foreign exchange rates, interest rates, volatility rates), the amount of changes in fair value of these financial assets and liabilities would affect the statement of other comprehensive income.
The carrying value of aFs financial assets is p8.95 billion and p8.92 billion as of december 31, 2014 and 2013, respectively (see note 7).
Valuation of insurance contract liabilities estimates have to be made both for the expected ultimate cost of claims reported and for the expected ultimate cost of claims
ibnr at the end of reporting period. it can take a significant period of time before the ultimate claims cost can be established with certainty.
The primary technique adopted by management in estimating the cost of notified and claims ibnr, is that of using past claims settlement trends to predict future claims settlement trends. at each reporting date, prior year claims estimates are assessed for adequacy and changes made are charged to provision. insurance contract liabilities are not discounted for the time value of money.
as of december 31, 2014 and 2013, the carrying values of provision for claims reported and ibnr amounted to p10.58 billion and p8.79 billion, respectively (see note 14).
Estimation of allowance for impairment losses The group maintains allowance for impairment losses at a level considered adequate to provide for potential uncollectible
receivables. The level of this allowance is evaluated by management on the basis of factors that affect the collectability of the accounts. These factors include, but are not limited to, age of balances, financial status of counterparties, and legal opinion on

annual report 2014 101
continuing our timeless excellence
recoverability in case of legal disputes. The group reviews the age and status of receivables, and identifies accounts that are to be provided with allowance on a regular basis.
The amount and timing of recorded expenses for any period would differ if the group made different judgments or utilized different estimates. an increase in allowance for impairment losses would increase recorded expenses and decrease the related asset accounts.
The carrying value of insurance receivables, net of impairment losses amounted to p5.36 billion and p5.40 billion as of december 31, 2014 and 2013, respectively. The related allowance for impairment losses amounted to p150.36 billion and p157.68 billion as of december 31, 2014 and 2013 respectively (see note 6).
as of december 31, 2014 and 2013, the carrying value of loans and receivables amounted to p1.64 billion and p1.58 billion, respectively. as of december 31, 2014 and 2013, the related allowance for impairment losses amounted to p3.75 million an p3.70 million, respectively. (see note 7).
Impairment of AFS equity financial assets The group determines that aFs equity financial assets are impaired when there has been a significant or prolonged decline in the
fair value below its cost. The determination of what is significant or prolonged requires judgment. The group treats ‘significant’ generally as 20% or more and ‘prolonged’ as continuous decline for a period of six (6) months or more. in making this judgment, the group evaluates among other factors, the normal volatility in share price for quoted securities. in addition, impairment may be appropriate when there is evidence of deterioration in the financial health of the investee, industry and sector performance, changes in technology, and operational and financing cash flows.
as of december 31, 2014 and 2013, the carrying value of the group’s aFs equity financial assets amounted to p6.83 billion and p6.35 billion, respectively (see note 7).
impairment loss recognized on group’s aFs equity financial assets amounted to nil and p9.96 million in 2014 and 2013, respectively (see note 7).
Estimation of useful lives of computer software, investment properties and property and equipment The group reviews annually the estimated useful lives of computer software, investment properties and property and equipment,
based on the period over which the assets are expected to be available for use. it is possible that future results of operations could be materially affected by changes in these estimates. a reduction in the estimated useful lives of computer software, investment properties and property and equipment would increase recorded depreciation and amortization expense and decrease the related asset accounts.
as of december 31, 2014 and 2013, the carrying value of the investment properties amounted to p27.17 million and p28.27 million, respectively (see note 11).
as of december 31, 2014 and 2013, the carrying value of the property and equipment amounted to p304.93 million and p306.98 million, respectively (see note 12).
Evaluation of net realizable value of real estate properties for sale real estate properties for sale are valued at the lower of cost and nrv. This requires the group to make an estimate of the real
estate properties’ estimated selling price in the ordinary course of business, cost of completion and costs necessary to make a sale to determine the nrv. The group adjusts the cost of its real estate properties to net realizable value based on its assessment of the recoverability of its real estate properties for sale. in determining the recoverability of its real estate properties for sale, management considers whether its real estate properties for sale are damaged or if their selling prices have declined.
likewise, management also considers whether the estimated costs of completion or the estimated costs to be incurred to make the sale have increased. in the event that nrv is lower than the cost, the decline is recognized as an expense. The amount and timing of recorded expenses for any period would differ if different judgments were made or different estimates were utilized. see note 13 for the related balances.
Impairment of nonfinancial assets The group assesses the impairment of its nonfinancial assets (i.e., investment properties, property and equipment and computer
software) whenever events or changes in circumstances indicate that the carrying amount of the asset may not be recoverable. The factors that the group considers important which could trigger an impairment review include the following:
• significant underperformance relative to expected historical or projected future operating results;• significant changes in the manner of use of the assets; and• significant negative industry or economic trends.
The group recognizes an impairment loss whenever the carrying amount of an asset exceeds its recoverable amount. recoverable amounts are estimated for individual asset or, if it is not possible, for the cash-generating unit to which the asset belongs.
as of december 31, 2014 and 2013, the group has not recognized any impairment losses on its nonfinancial assets. see notes 11, 12 and 13 for related balances.
102
Recognition of deferred tax assets deferred tax assets are recognized for all deductible temporary differences to the extent that it is probable that taxable income
will be available against which these can be utilized. significant management judgment is required to determine the amount of deferred tax assets that can be recognized. These assets are periodically reviewed for realization. periodic reviews cover the nature and amount of deferred income and expense items, expected timing when assets will be used or liabilities will be required to be reported, reliability of historical profitability of businesses expected to provide future earnings and tax planning strategies which can be utilized to increase the likelihood that tax assets will be realized. see note 24 for the related balances.
Estimating pension obligation and other retirement benefits The determination of pension obligation and cost of pension is dependent on the selection of certain assumptions used in
calculating such amounts. Those assumptions include, among others, discount rates and salary increase rates.
due to the long-term nature of this plan, such estimates are subject to significant uncertainty.
The assumed discount rates were determined using the market yields on philippine government bonds with terms consistent with the expected employee benefit payout as of the reporting date. in accordance with pas 19, actual results that differ from the group’s assumptions are recognized immediately in other comprehensive income in the period in which they arise. while the group believes that the assumptions are reasonable and appropriate, significant differences in the actual experience or significant changes in the assumptions may materially affect the pension obligations.
as of december 31, 2014 and 2013, the carrying value of pension obligation amounted to p186.92 million and p189.06 million, respectively (see note 17).
Contingencies The group is currently involved in various legal proceedings. The estimate of probable costs for the resolution of these claims has
been developed in consultation with the legal counsels and based upon analysis of potential results. The group does not believe that these proceedings will have a material adverse effect on the group’s financial position.
4. cash and cash equivalents
This account consists of:
2014 2013cash on hand: petty cash fund p978,523 p999,521 special funds 28,000 28,000cash in banks: commercial banks and trust company (note 28) 404,250,874 523,568,053 Thrift banks, rural banks and cooperatives 5,304,095 3,688,829short-term deposits (note 28) 252,161,582 303,307,124
p662,723,074 p831,591,527
cash in banks earns interest at the respective bank rates.
short-term deposits are placed for varying periods of up to three (3) months depending on the immediate cash requirements of the group.
The range of interest rates of the short-term deposits follows:
2014 2013philippine peso 1.13% to 1.25% 0.25% to 4.50%us dollar 0.02% to 1.13% 0.50% to 0.75%
5. short-term investments
This account consists of time deposits with maturity of more than three months but less than one year from dates of placement and earns annual interest with annual rates ranging from 0.50% to 4.25% and 0.75% to 3.25% in 2014 and 2013, respectively.
interest earned on short-term investments amounted to p0.03 million and p0.13 million in 2014 and 2013, respectively (see note 20).

annual report 2014 103
continuing our timeless excellence
6. insurance receivables - net
This account consists of:
2014 2013due from policyholders, agents and brokers p3,736,938,249 p3,042,764,198due from ceding companies: treaty (note 28) 1,315,451,584 1,720,307,127 Facultative 141,004,182 494,588,371Funds held by ceding companies - treaty (note 28) 147,021,297 166,886,074reinsurance recoverable on paid losses: Facultative 135,347,778 110,943,616 treaty 31,522,889 26,584,186
5,507,285,979 5,562,073,572less allowance for impairment losses 150,362,809 157,683,213
p5,356,923,170 p5,404,390,359
Terms and Conditions due from policyholders, agents and brokers and due from ceding companies are unsecured, interest free and are settled in cash.
Funds held by ceding companies bear interest ranging from 0.00% to 1.94% per annum. The group has recognized impairment losses amounting to p47.01 million and p37.05 million in 2014 and 2013, respectively.
The reinsurance recoverable on paid losses is the amount recoverable from the reinsurers in respect of claims already paid by the group.
The following table shows aging information of insurance receivables:
december 31, 2014
< 30 days 30 > 60 days 60 > 90 days 90 > 120 days > 120 days total
due from policyholders,agents and brokers p472,458,707 p316,721,437 p443,447,633 p338,796,089 p2,165,514,383 p3,736,938,249
due from ceding companies:
treaty 381,502,370 262,681 2,673,003 5,722,029 925,291,501 1,315,451,584Facultative 93,216,921 17,415,799 4,851,937 5,618,939 19,900,586 141,004,182
Funds held by cedingcompanies - treaty
5,674,477 496,925 23,403,339 76,206 117,370,350 147,021,297
reinsurance recoverable onpaid losses:
Facultative 22,954,394 12,912,780 6,432,726 3,687,695 89,360,183 135,347,778treaty - - 959,476 - 30,563,413 31,522,889
p975,806,869 p347,809,622 p481,768,114 p353,900,958 p3,348,000,416 p5,507,285,979
december 31, 2013
< 30 days 30 > 60 days 60 > 90 days 90 > 120 days > 120 days total
due from policyholders, agents and brokers p516,294,926 p254,734,202 p556,163,596 p274,478,074 p1,441,093,400 p3,042,764,198
due from ceding companies:
treaty 697,010,263 667,807 3,621,047 1,522,130 1,017,485,880 1,720,307,127
Facultative 464,289,677 10,861 12,000,759 1,129,623 17,157,451 494,588,371Funds held by ceding
companies - treaty 4,173,128 2,906,955 29,960,895 5,470,766 124,374,330 166,886,074
reinsurance recoverable onpaid losses:
Facultative 18,180,664 1,016,140 5,404,483 1,588,949 84,753,380 110,943,616treaty - 2,122,357 8,709,619 - 15,752,210 26,584,186
p1,699,948,658 p261,458,322 p615,860,399 p284,189,542 p2,700,616,651 p5,562,073,572

104
The allowance for impairment loss on insurance receivables has been determined as follows:
2014
due from policyholders,
agents and Brokers
due from ceding
companies - treaty
due from ceding
companies - Facultative
Funds held by ceding
companies
reinsurance recoverable
on paid losses -
Facultative totalbalance at beginning of year p133,920,246 p2,153,063 p12,202,631 p1,380,777 p8,026,496 p157,683,213impairment loss (note 22) 52,383,144 1,208,363 - - 784,577 54,376,084reversals (note 22) (3,915,699) - (3,446,776) - - (7,362,475)written-off (54,334,013) - - - - (54,334,013)Balance at end of year p128,053,678 p3,361,426 p8,755,855 p1,380,777 p8,811,073 p150,362,809individually impaired p6,572,658 p3,361,426 p7,219,431 p1,380,777 p- p18,534,292collectively impaired 121,481,020 - 1,536,424 - 8,811,073 131,828,517total p128,053,678 p3,361,426 p8,755,855 p1,380,777 p8,811,073 p150,362,809
2013
due from policyholders,
agents and brokers
due from ceding
companies - treaty
due from ceding
companies - Facultative
Funds Held by ceding
companies
reinsurance recoverable
on paid losses -
Facultative total
balance at beginning of year p101,505,280 p496,316 p17,547,961 p1,380,777 p4,337,913 p125,268,247impairment loss (note 22) 37,117,893 1,656,747 - - 3,688,583 42,463,223
reversals (note 22) (72,462) - (5,345,330) - - (5,417,792)written-off (4,630,465) - - - - (4,630,465)
Balance at end of year p133,920,246 p2,153,063 p12,202,631 p1,380,777 p8,026,496 p157,683,213
individually impaired p8,358,043 p2,153,063 p10,748,795 p1,380,777 p5,047,677 p27,688,355collectively impaired 125,562,203 - 1,453,836 - 2,978,819 129,994,858
total p133,920,246 p2,153,063 p12,202,631 p1,380,777 p8,026,496 p157,683,213
7. Financial assets
The group’s financial assets, categorized based on subsequent measurement, follow:
2014 2013aFs financial assets p8,949,285,522 p8,919,764,353loans and receivables - net 1,636,856,691 1,584,309,344
p10,586,142,213 p10,504,073,697
The assets included in each of the categories above are detailed below.
a) AFS financial assets
2014 2013quoted securities - at fair valuelisted equity securities (note 28): common shares p6,449,486,090 p6,022,723,085 preferred shares 26,842,440 28,692,440government debt securities: local currency 620,400,000 880,790,158 Foreign currency 34,528,400 34,195,339private debt securities (note 28) 1,461,656,162 1,654,823,695
8,592,913,092 8,621,224,717non-quoted securities - at costunlisted equity securities: common shares 107,175,743 97,600,744 preferred shares 17,540 17,540
107,193,283 97,618,284Funds 249,179,147 200,921,352
p8,949,285,522 p8,919,764,353
in accordance with the provisions of the code, government securities amounting to p232.32 million and p232.38 million are deposited with the insurance commission (ic) as security for the benefit of policyholders and creditors of the group as of december 31, 2014 and 2013, respectively.
as of december 31, 2014 and 2013, the group has certain investments in debt securities with embedded call option feature which allows the issuers to redeem, on specified dates, the securities at face amount. based on the group’s assessment, the embedded call options identified are clearly and closely related to the host contracts and therefore do not require bifurcation.

annual report 2014 105
continuing our timeless excellence
as of december 31, 2014 and 2013, allowance for impairment loss recognized on aFs investments amounted to nil and p9.96 million in 2014 and 2013, respectively.
The carrying values of aFs financial assets have been determined as follows:
2014 2013balance at beginning of year p8,919,764,353 p9,626,111,111acquisitions 650,036,809 1,486,107,000unrealized foreign currency exchange gain 1,823,157 180,798,690Fair value changes 488,115,520 (604,983,203)disposals and maturities (1,102,986,116) (1,755,214,244)amortization of premium (7,468,201) (13,055,001)balance at end of year p8,949,285,522 p8,919,764,353
as of december 31, 2014 and 2013, the revaluation reserve on aFs financial assets amounted to p4.37 billion and p4.06 billion, respectively.
The rollforward analysis of the revaluation reserve on aFs financial assets follow:
2014 2013balance at beginning of year p4,056,851,895 p4,711,038,009Fair value gain (loss) credited to equity 488,115,520 (604,983,203)impairment loss (note 20) ‒ 9,963,296realized gain transferred to profit or loss (note 20) (170,155,505) (84,600,726)tax effect of net fair value gain (note 24) (9,806,618) 25,434,519
p4,365,005,292 p4,056,851,895attributable to: equity holders of the parent company p4,173,571,879 p3,876,703,702 non-controlling interests 191,433,413 180,148,193
p4,365,005,292 p4,056,851,895
b) Loans and receivables - net
This account consists of:2014 2013
long-term commercial papers (note 28) p1,135,760,653 p1,094,933,008notes receivable 296,312,050 393,260,119accounts receivable 140,302,797 27,606,510creditable withholding tax 62,677,478 62,677,478due from related parties (note 28) 3,629,034 450,805claims recoverable 811,250 6,500,000cash advances 768,996 837,047security fund 342,294 342,294Miscellaneous receivable ‒ 1,405,009
1,640,604,552 1,588,012,270less allowance for impairment losses 3,747,861 3,702,926
p1,636,856,691 p1,584,309,344
Terms and Conditions long-term commercial papers pertain to the group’s investments in unquoted private debt securities and corporate
notes with terms of 2 to 15 years and bear annual interest rates ranging from 3.25% to 8.88% in 2014 and from 3.25% to 9.33% in 2013. The group has not recognized any impairment losses on these debt securities for the years ended december 31, 2014 and 2013.
The group provides for the 50% of the cost of the car and motor plans extended to its managers and officers as part of their benefits. The employee’s share is recorded as notes receivable which is collected through salary deductions for a period of five (5) years with annual interest rates of 8.00% for car loans and 8.50% for motor loans. as of december 31, 2014 and 2013, notes receivable with carrying value of p1.70 million was specifically determined as impaired and was fully provided with allowance. There were no additional impairment losses recognized in 2014.
The group also granted advances to its related parties, Mei and rizal leasing and Finance corporation (rlFc), by way of receipt of promissory notes from these related parties (see note 28). These advances are unsecured with terms of 1 year and annual interest rates ranging from 4.25% to 5% in 2014 and from 4% to 7.5% in 2013. The group has not recognized any impairment losses on these notes receivables for the years ended december 31, 2014 and 2013.
creditable withholding tax for years 2009 and 2010 were filed for refund by the group to the bir.

106
The allowance for impairment losses on loans and receivable had been determined as follows:
2014accounts
receivablenotes
receivable total
balance at beginning of the year p2,005,675 p1,697,251 p3,702,926additions 44,935 ‒ 44,935balance at end of the year p2,050,610 p1,697,251 p3,747,861individually impaired p‒ p1,697,251 p1,697,251collectively impaired 2,050,610 ‒ 2,050,610total p2,050,610 p1,697,251 p3,747,861
2013accounts
receivablenotes
receivable total
balance at beginning / end of year p2,005,675 p1,697,251 p3,702,926individually impaired p‒ p1,697,251 p1,697,251collectively impaired 2,005,675 ‒ 2,005,675total p2,005,675 p1,697,251 p3,702,926
as of december 31, 2014 and 2013, accounts and notes receivable with carrying value of p3.75 million and p3.70 million, respectively, was specifically determined as impaired and was fully provided with allowance. The group recognized additional allowance of p0.05 million in 2014.
8. accrued income
This account consists of:
2014 2013accrued interest income on (note 28):
aFs financial assets p33,303,473 p37,781,439 long-term commercial papers 8,287,904 8,476,325 cash and cash equivalents 534,136 38,804 security fund 148,854 136,293 Funds held by ceding companies - treaty 108,990 85,299 notes receivables 58,476 717,528 short-term investments – 21,552
accrued rent income 1,536,610 4,148,291accrued dividend income 6,470,202 2,578,631
p50,448,645 p53,984,162
Terms and Conditions accrued interest income from aFs financial assets are unsecured, bear interest ranging from 1.25% to 12.38% and are settled
in cash within one (1) to six (6) months. accrued interest income from long term commercial papers are unsecured, interest ranging from 3.25% to 9.33% and settlement occurs in cash within 1 to 6 months.
accrued rent income pertains to rent income from The Malayan plaza condominium classified as real estate properties for sale and rent income from land and building classified as investment properties (see notes 11 and 13).
9. deferred acquisition costs - net
The details of deferred acquisition costs net of deferred reinsurance commissions follow:
2014 2013deferred acquisition costs
balance at beginning of year p411,916,355 p337,840,897cost deferred during the year (note 28) 981,773,526 1,012,837,236amortized during the year (1,043,310,796) (938,761,778)balance at end of year 350,379,085 411,916,355
deferred reinsurance commissionsbalance at beginning of year 196,616,602 113,290,719income deferred during the year (note 28) 375,935,053 371,424,683amortized during the year (388,531,867) (288,098,800)balance at end of year 184,019,788 196,616,602
p166,359,297 p215,299,753
annual report 2014 107
continuing our timeless excellence
10. reinsurance assets
This account consists of:
2014 2013reinsurance recoverable on unpaid losses (note 14) p8,576,792,418 p6,996,710,092deferred reinsurance premiums (note 14) 2,550,384,275 2,341,514,506
p11,127,176,693 p9,338,224,598
11. investment properties - net
The rollforward analysis of this account follows:
2014land Buildings total
costat beginning of year p26,696,761 p12,691,826 p39,388,587disposals (996,750) – (996,750)at end of year 25,700,011 12,691,826 38,391,837accumulated depreciation and amortizationat beginning of year – 11,115,120 11,115,120depreciation (note 22) – 106,737 106,737at end of year – 11,221,857 11,221,857net book value p25,700,011 p1,469,969 p27,169,980
2013
land buildingsconstruction
in-progress totalcostat beginning of year p29,023,039 p12,691,826 p78,194,608 p119,909,473additions – – 11,411,830 11,411,830disposals (2,326,278) – (89,606,438) (91,932,716)at end of year 26,696,761 12,691,826 – 39,388,587accumulated depreciation and amortizationat beginning of year – 11,008,383 – 11,008,383depreciation (note 22) – 106,737 – 106,737at end of year – 11,115,120 – 11,115,120net book value p26,696,761 p1,576,706 p– p28,273,467
rental income from investment properties recognized in the consolidated statement of income amounted to p22.51 million and p27.66 million in 2014 and 2013, respectively (see note 20). direct operating expenses arising from investment properties amounted to p16.40 million and p9.38 million in 2014 and 2013, respectively (see note 23).
on october 1, 2009, the parent company, rcbc savings bank, inc. (rsb), rizal commercial banking corporation (rcbc), bankard inc., great pacific life assurance corporation (grepalife) and Hexagonland corporation signed a Joint venture agreement for the construction and development of a twenty seven (27)-storey, high-rise mixed used commercial/office building to be known as the “rcbc savings bank building project”.
The total construction period is estimated at thirty-nine (39) months and the total cost is estimated at p2.20 billion, of which the parent company shall contribute 4.47% in cash contributions.
on october 2, 2012, the parent company, rsb, rcbc, bankard, inc. and grepalife executed a Memorandum of understanding (Mou) agreeing in principle to cancel or revoke the Jva, subject to the approval of the bangko sentral ng pilipinas (bsp). in the said Mou, rcbc was allowed to continue the construction and completion of the building project by purchasing the land from rsb and returning the cash contributions of rsb, bankard, inc. and the parent company.
on March 13, 2013, through Monetary board (Mb) resolution no. 405 dated March 7, 2013, the bsp confirmed the acquisition of rcbc of the land contributed by rsb, as well as the rights and interests of the parent company, rsb, bankard, inc. and grepalife to the building project.
on april 11, 2013, the parent company received its share in contribution to rsb building project amounting to p89.6 million with interest amounting to p7.69 million.

108
buildings with book value of p1.47 million and p1.54 million have fair value amounting to p5.14 million and p3.36 million as of december 31, 2014 and 2013, respectively. parcels of land with book value of p25.7 million and p26.70 million have fair value amounting to p328.16 million and p451.32 million as of december 31, 2014 and 2013, respectively. The fair values of the investment properties were determined by independent professionally qualified appraisers.
The fair value of the land and buildings were arrived at using the Market data approach. in this approach, the value of the land and buildings are based on sales and listings of comparable property registered within the vicinity. The technique of this approach requires the establishment of comparable property by reducing reasonable comparative sales and listings to a common denominator. This is done by adjusting the differences between the subject property and those actual sales and listings regarded as comparable. The properties used as basis of comparison are situated within the immediate vicinity of the subject property.
The group’s highest and best use is consistent with its current use.
depreciation expense pertaining to investment properties amounted to p0.11 million in 2014 and 2013 (see note 22).
12. property and equipment - net
The rollforward analysis of this account as of december 31, 2014 and 2013 follows:
2014
land
Building, Building
equipment and improvements
office Furniture,
Fixtures and equipment
transportation equipment
leasehold improvements total
costat beginning of year p1,013,187 p211,702,405 p487,266,876 p82,695,523 p60,080,387 p842,758,378additions – 6,469,564 22,713,035 19,708,525 20,904,909 69,796,033disposals – (3,245,934) (10,683) (6,504,736) (12,596,570) (22,357,923)at end of year 1,013,187 214,926,035 509,969,228 95,899,312 68,388,726 890,196,488accumulated depreciation and amortizationat beginning of year – 74,983,403 364,993,046 48,842,456 46,023,007 534,841,912depreciation and amortization (note 22) – 8,631,711 39,593,286 11,606,542 10,858,800 70,690,339
disposals – (3,245,932) (5,697) (4,418,483) (12,596,570) (20,266,682)at end of year – 80,369,182 404,580,635 56,030,515 44,285,237 585,265,569net book value p1,013,187 p134,556,853 p105,388,593 p39,868,797 p24,103,489 p304,930,919
2013
land
building, building
equipment and improvements
office Furniture,
Fixtures and equipment
transportation equipment
leasehold improvements total
costat beginning of year p1,013,187 p207,739,594 p351,740,043 p80,382,130 p59,737,437 p700,612,391
additions – 3,962,811 48,172,920 6,820,426 342,950 59,299,107
transfer (note 13) – – 87,424,188 – – 87,424,188disposals – – (70,275) (4,507,033) – (4,577,308)
at end of year 1,013,187 211,702,405 487,266,876 82,695,523 60,080,387 842,758,378accumulated depreciation and amortizationat beginning of year – 66,449,204 303,484,493 48,408,067 39,478,806 457,820,570depreciation and amortization (note 22) – 8,534,199.00 42,219,283 4,571,116 6,544,201 61,868,799transfer (note 13) – – 19,342,688 – – 19,342,688disposals – – (53,418) (4,136,727) – (4,190,145)
at end of year – 74,983,403 364,993,046 48,842,456 46,023,007 534,841,912net book value p1,013,187 p136,719,002 p122,273,830 p33,853,067 p14,057,380 p307,916,466
in 2013, the group transferred its computer software under “other assets” account to “property and equipment” account as a result of the change in its system from as400 to polisyasia (see note 30).
depreciation and amortization expense charged against operations amounted to p70.69 million and p61.87 million 2014 and 2013, respectively (see note 22).
annual report 2014 109
continuing our timeless excellence
13. other assets - net
This account consists of:
2014 2013creditable withholding taxes p282,194,561 p231,459,227real estate properties for sale - at cost 90,374,300 92,454,300prepayments 9,206,709 5,729,294refundable deposits 8,888,739 22,782,240Forms and supplies inventory 6,242,183 9,478,417computer software - net ‒ 302,376others 34,432,743 12,411,427
p431,339,235 p374,617,281
creditable withholding tax pertains to the group’s tax withheld at source by its customers and is creditable against the income tax liability of the group.
refundable deposits pertains to rent deposit to rcbc and deposit to gsis for the bid property and engineering risk excess of loss treaty.
real estate properties for sale consist of investments in Malayan plaza condominium units and memorial lots. as of december 31, 2014 and 2013, amounts of the real estate properties for sale follow:
2014 2013Malayan plaza condominium units p83,294,300 p83,294,300Memorial lots 7,080,000 9,160,000
p90,374,300 p92,454,300
cost of real estate properties disposed in 2014 and 2013 amounted to p2.08 million and p0.57 million, respectively.
others pertain to documentary stamp tax inventory, input vat, deferred input vat and the group’s share in its employees’ car and motor plans.
14. insurance contract liabilities and reinsurance assets
short-term insurance contract liabilities and reinsurers’ share of liabilities may be analyzed as follows:
2014 2013
insurance contract liabilities
reinsurers’ share of
liabilities (see note 10) net
insurance contract
liabilities
reinsurers’ share of
liabilities (see note 10) net
provision for claims reported and loss adjustment p10,468,409,391 p8,950,296,088 p1,518,113,303 p8,699,731,956 p6,996,710,092 p1,703,021,864
provision for ibnr losses 113,805,857 – 113,805,857 94,805,857 – 94,805,857
total claims reported andibnr 10,582,215,248 8,950,296,088 1,631,919,160 8,794,537,813 6,996,710,092 1,797,827,721
provision for unearned premiums 3,609,799,913 2,176,880,605 1,432,919,308 3,693,485,468 2,341,514,506 1,351,970,962
total insurance contract liabilities p14,192,015,161 p11,127,176,693 p3,064,838,468 p12,488,023,281 p9,338,224,598 p3,149,798,683
provisions for claims reported by policyholders and claims ibnr may be analyzed as follows:
2014 2013
insurance contract
liabilities
reinsurers’ share of
liabilities (see note 10) net
insurance contract
liabilities
reinsurers’ share of
liabilities (see note 10) net
balance at beginning of year p8,794,537,813 p6,996,710,092 p1,797,827,721 p5,496,454,853 p3,716,385,247 p1,780,069,606claims incurred during the
year 5,830,487,213 4,484,169,406 1,346,317,807 6,288,887,799 4,820,586,756 1,468,301,043
increase in ibnr 19,000,000 – 19,000,000 11,285,837 – 11,285,837total claims reported and
claims ibnr 14,644,025,026 11,480,879,498 3,163,145,528 11,796,628,489 8,536,972,003 3,259,656,486claims paid during the year
(note 21) (4,061,809,778) (2,530,583,410) (1,531,226,368) (3,002,090,676) (1,540,261,911) (1,461,828,765)balance at end of year p10,582,215,248 p8,950,296,088 p1,631,919,160 p8,794,537,813 p6,996,710,092 p1,797,827,721
110
provision for unearned premiums may be analyzed as follows:
2014 2013
insurance contract
liabilities
reinsurers’ share of
liabilities (see note 10) net
insurance contract
liabilities
reinsurers’ share of
liabilities (see note 10) net
balance at beginning of year p3,693,485,468 p2,341,514,506 p1,351,970,962 p3,041,799,037 p1,596,767,471 p1,445,031,566new policies written during the year (note 19) 7,522,325,291 4,658,831,686 2,863,493,605 7,586,161,302 5,245,501,360 2,340,659,942premiums earned during the year (note 19) (7,606,010,846) (4,823,465,587) (2,782,545,259) (6,934,474,871) (4,500,754,325) (2,433,720,546)
balance at end of year p3,609,799,913 p2,176,880,605 p1,432,919,308 p3,693,485,468 p2,341,514,506 p1,351,970,962
15. insurance payables
This account consists of:2014 2013
due to reinsurers (note 28) p2,274,764,364 p2,366,935,153Funds held for reinsurers (note 28) 589,158,871 1,376,106,979
p2,863,923,235 p3,743,042,132
Terms and Conditions due to reinsurers are unsecured, interest-free and are normally settled in cash within one (1) year. Funds held for reinsurers bear
interests ranging from 1.00% to 4.00% per annum.
The rollforward analysis of insurance payables follows:
due to reinsurers
Funds held for reinsurers total
at January 1, 2013 p1,771,491,431 p572,759,901 p2,344,251,332arising during the year 1,752,830,299 915,056,902 2,667,887,201paid during the year (1,157,386,577) (111,709,824) (1,269,096,401)at december 31, 2013 2,366,935,153 1,376,106,979 3,743,042,132arising during the year 3,342,542,652 410,130,401 3,752,673,053paid during the year (3,434,713,441) (1,197,078,509) (4,631,791,950)at december 31, 2014 p2,274,764,364 p589,158,871 p2,863,923,235
16. accounts payable, accrued expenses and other liabilities
This account consists of:2014 2013
accounts payable p890,433,452 p699,676,294commissions payable 477,463,519 304,824,160deferred output value-added tax (vat) 280,104,943 220,880,003accrued taxes 134,213,139 138,919,639accrued expenses 142,572,815 104,078,232documentary stamp taxes payable 22,201,182 126,625,122surety deposits 49,282,432 32,455,278output vat 15,645,850 28,117,240deposits payable 7,132,247 4,133,104others 19,843,380 5,858,518
p2,038,892,959 p1,665,567,590
all accounts payable and accrued expenses are due within one year.
accounts payable pertain to unpaid purchases of goods and services from suppliers.
commissions payable are unpaid commissions on the group’s direct business, payable to agents and brokers which are due upon collection of the related premiums receivables.
accrued taxes includes tax withheld, fringe benefit tax, local government tax, fire service tax and premiums tax.
accrued expenses pertain to accrual of monthly expenditures of the group. This includes expenses for utilities, allocated common expenses for the use of Y tower 1 and 2 and other expenses that are necessary to carry out the operations of the group.

annual report 2014 111
continuing our timeless excellence
17. pension
The group has a defined benefit plan, covering substantially all of its employees, which requires contribution to be made to administered funds. The plan is administered by a local bank as trustee. The group’s trustee bank is rcbc. The transactions of the fund are being approved by the president of the group.
The following tables summarize the components of net pension benefit expense recognized in the consolidated statements of income and the funded status and amounts recognized in the consolidated statements of financial position for the retirement plan.
The net pension benefit expense recognized in the consolidated statements of income, under employee benefits (see note 22), follows:
2014 2013current service cost p40,521,375 p33,022,368net interest cost 8,204,103 7,444,462net benefit expense p48,725,478 p40,466,830actual return on plan assets p15,752,280 p2,548,794
The remeasurement effects recognized in the consolidated statements of comprehensive income follows:
2014 2013actuarial loss p14,427,402 p33,879,758return on assets (excluding amount included in net interest cost) (5,915,197) 9,208,010total amount recognized in oci p8,512,205 p43,087,768
The net pension obligation recognized in the consolidated statements of financial position follows:
2014 2013present value of pension benefit obligation p400,763,989 p416,822,615Fair value of plan assets (213,842,390) (227,759,853)
p186,921,599 p189,062,762
The reconciliation of the present value of the pension benefit obligation follows:
2014 2013balance at beginning of year p416,822,615 p371,742,646current service cost 40,521,375 33,022,368interest cost 18,041,186 19,201,266actuarial loss recognized in oci 14,427,402 33,879,758present value of obligation of transferred employeesfrom, lex services, inc. 3,278,328 445,805present value of obligation of transferred employee to lex services, inc (236,657) –benefits paid (92,090,260) (41,469,228)
p400,763,989 p416,822,615
The reconciliation of the fair value of the plan assets follows:
2014 2013balance at beginning of year p227,759,853 p227,655,286interest income 9,837,083 11,756,804contributions by employer 62,420,517 39,025,001actuarial gain (loss) 5,915,197 (9,208,010)benefits paid (92,090,260) (41,469,228)balance at end of year p213,842,390 p227,759,853
The group expects to contribute p43.19 million to the retirement fund in 2015.
112
The distribution of the plan assets as of december 31, 2014 and 2013 follows:
2014 2013cash p30,246,684 p41,141,113receivables 5,861,955 7,010,207investments:
equity securities 98,889,656 86,298,171government securities 10,919,691 31,156,566other securities and debt instruments 68,863,670 62,843,431
214,781,656 228,449,488less accrued trust fees and other payables 939,266 689,635
p213,842,390 p227,759,853
The following presents the transactions of the group’s retirement fund with related parties:
2014 2013
category Balance balance terms conditionsOther related parties
savings deposits - rcbc p23,804 p1,694 non-interest bearing; on demand
unsecured; no impairment
time deposits - rcbc 2,115,455 –– unsecured;
no impairment common stocks - rcbc 12,639,456 11,191,185
– unsecured: no impairment
common stocks - Hi 2,417,258 2,429,049– unsecured:
no impairment common stocks - FMlc – 2,547,990
– unsecured: no impairment
corporate bonds - rcbc 2,639,103 14,805,715 interest rates at 0%to 3.25%: terms of
3.5 to 5.5 years
unsecured; no impairment
The principal actuarial assumptions used in determining plan assets and obligations are as follows:
2014 2013salary increase rate 5.00% 5.00%discount rate 4.48% - 4.68% 4.48% - 4.68%
The amounts for the current and the previous periods follow:
2014 2013 2012 2011 2010
present value of pension benefit obligation p400,763,989 p416,822,615 p371,742,646 p343,382,445 p303,924,481Fair value of plan assets (213,842,390) (227,759,853) (227,655,286) (188,616,897) (182,443,650)
deficit p186,921,599 p189,062,762 p144,087,360 p154,765,548 p121,480,831
Sensitivities The sensitivity analysis below has been determined based on reasonably possible changes of each significant assumption on the
defined benefit obligation as of the end of the reporting period, assuming all other assumptions were held constant:
2014
change in variables
impact on present value of defined benefit obligation
increase (decrease)percentage
changediscount rate +0.5% (p375,307,749) 6.35%
–0.5% 399,432,305 (0.33%)
salary increase rate +1.0% p415,824,329 3.76%–1.0% (367,907,050) (8.20%)
2013
change in variables
impact on present value of defined benefit obligation
increase (decrease)percentage
changediscount rate +0.5% p389,764,941 (6.49%)
–0.5% 419,518,690 0.65%
salary increase rate +1.0% p439,288,689 5.39%–1.0% (383,059,767) (8.10%)
The average duration of defined benefit obligation is 20 to 27 years.
annual report 2014 113
continuing our timeless excellence
The maturity analysis of the undiscounted benefit payments as of december 31, 2014 based on normal retirements (retirement age of 60 only) is as follows:
Year of retirement no. of retirees total Benefit2014 2 p10,050,4912015 21 66,282,5382016 45 213,474,1432017 91 366,787,6922018 72 431,631,357after 2018 454 2,617,090,610
18. cash dividends and other revaluation reserve
Cash Dividends on august 1, 2014, the parent company’s bod approved the declaration of cash dividends amounting to p126.8 million or
p15 per share out of the unappropriated retained earnings of the parent company as of december 31, 2012 in favor of the stockholders of record as of august 1, 2014. dividends were paid on december 29, 2014.
Other Revaluation Reserve on april 10, 2008, the parent company’s bod and stockholders approved the articles of merger and plan of merger between
tMMic and the parent company. tMMic is a 50-50 joint venture company owned by the parent company and tokio Marine asia pte., ltd. (tokio Marine). on July 2, 2008, the sec approved the articles and plan of merger. The effects of the merger were reckoned from January 1, 2008. The merger was accounted for as a business combination in accordance with pFrs 3. tMMic and the parent company became a single corporation, with the parent company as the surviving corporation. tMMic ceased to exist and its legal personality was terminated. as at the date of acquisition, the identifiable assets and liabilities of tMMic have been measured at fair value resulting in a difference of p46,933,294 against its carrying values. The difference between the carrying value and fair value pertains mainly to the increase in the appraised value of the building. The parent company recorded the appraisal increase amounting to p23,466,647 pertaining to its previously held interest as “other revaluation reserve” in the equity section of the consolidated statement of financial position.
The parent company is subject to the regulatory requirements of the insurance commission such as Fixed capitalization requirements and risk-based capital requirements (see note 26).
19. net premiums earned
gross premiums earned and reinsurers’ share of gross premiums earned consists of the following:
2014 2013gross premiums written direct p6,036,197,727 p5,142,691,461 assumed (note 28) 1,486,127,564 2,443,469,841total gross premiums on insurance contracts
(see note 14) 7,522,325,291 7,586,161,302gross change in provision for unearned premiums 83,685,555 (651,686,431)Gross premiums earned (see note 14) 7,606,010,846 6,934,474,871reinsurers’ share of gross premiums written direct insurance 3,760,881,038 3,690,231,660 assumed reinsurance (note 28) 897,950,648 1,555,269,700total reinsurers’ share of gross premiums on
insurance contracts (see note 14) 4,658,831,686 5,245,501,360reinsurers’ share of gross change in provision for
unearned premiums 164,633,901 (744,747,035)reinsurers’ share of gross premiums earned on
insurance contacts (see note 14) 4,823,465,587 4,500,754,325
net premiums earned p2,782,545,259 p2,433,720,546

114
20. investment and other income and investment and other expense
Investment and other income
This account consists of:
2014 2013dividend income (note 28) p267,810,303 p247,818,277interest income (note 28):
aFs financial assets 145,940,567 175,038,751 long-term commercial papers 61,673,900 54,780,166 cash and cash equivalents 14,796,110 26,553,539 notes receivables 6,727,350 22,893,029 Funds held by ceding companies 516,576 1,154,306 short-term investments (note 5) 28,034 130,072 others 1,280,511 11,531,568
gain on sale of: aFs financial assets (note 7) 170,155,505 84,178,240 real estate for sale 11,420,817 2,397,054 property and equipment (note 12) 627,221 557,702
investment property (note 11) 246,074 3,077,475long-term commercial paper – 1,782,814
rental income (note 11) 22,507,064 27,660,986Foreign currency exchange gains - net 22,123,225 119,395,794others 6,655,427 4,647,887
p732,508,684 p783,597,660
Investment and other expense
This account consists of the following:
2014 2013investment expense p22,727,324 p11,792,536broker’s fee 1,993,954 –impairment loss on financial assets (note 7) – 9,963,296loss on sale of aFs – 199,532
p24,721,278 p21,955,364
as of december 31, 2014 and 2013, the foreign exchange gain from non-deliverable foreign exchange forward contracts entered into by the parent company to hedge its exposure on foreign currency risk amounted to p16.5 million and p69.57 million, respectively. in 2014 and 2013, the weighted average rate of exchange rate of these forward currency contracts are p44.48 and p42.16, respectively.
The unrealized foreign exchange loss as of december 31, 2014 and 2013 amounted to p35.78 million and p209.57 million, respectively.
21. insurance contract Benefits and claims paid
gross insurance contract benefits and claims paid consist of:2014 2013
gross insurance contract benefitsand claims paid: direct insurance p3,438,534,098 p2,189,140,933 assumed reinsurance 623,275,679 812,949,743
total gross insurance contract benefitsand claims paid (see note 14) p4,061,809,777 p3,002,090,676
reinsurers’ share of gross insurance contract benefits and claims paid consist of:
2014 2013reinsurers’ share of insurance contract benefits
and claims paid:direct insurance p2,349,317,096 p1,362,061,209assumed reinsurance 181,266,314 178,200,702
total reinsurers’ share of gross insurancecontract benefits and claims paid (see note 14) p2,530,583,410 p1,540,261,911

annual report 2014 115
continuing our timeless excellence
gross change in insurance contract liabilities consist of:2014 2013
change in provision for claims reported: direct insurance (p601,331,431) p2,053,857,711 assumed reinsurance 2,370,008,866 1,232,939,412change in provision for ibnr 19,000,000 11,285,837total gross change in insurance contract
liabilities (see note 14) p1,787,677,435 p3,298,082,960
reinsurers’ shares of gross change in insurance contract liabilities consist of:2014 2013
reinsurers’ share of gross insurance contract liabilities: direct insurance (p474,305,288) p1,914,785,102 assumed reinsurance 2,427,891,284 1,365,539,743
total reinsurers’ share of gross change in insurance contract liabilities (see note 14) p1,953,585,996 p3,280,324,845
22. General and administrative expenses
This account consists of:
2014 2013salaries, wages and allowances (note 28) p379,527,920 p359,956,149employee benefits (note 17) 99,417,048 84,586,325depreciation and amortization (notes 11, 12 and 13) 70,797,076 61,975,537rent, light and water (notes 23 and 28) 60,380,445 53,249,521professional fees 58,326,611 46,059,668transportation and travel 49,278,485 45,575,827provisions for impairment loss - net of reversals
(note 6 and7) 47,058,544 37,045,431advertising and promotions 39,729,735 36,666,970postage, telephone and cable 43,827,996 33,779,572printing and office supplies 33,662,551 23,667,082entertainment, amusement and recreation 35,674,677 22,385,492repairs and maintenance 19,346,364 12,439,614business development 9,505,070 9,051,457Management fees (note 28) 7,500,000 7,500,000bank charges 5,660,530 4,515,116taxes, licenses and fees 3,623,170 3,705,959Membership and association dues 3,860,560 3,622,036donations and contributions 1,329,573 1,215,784insurance 1,208,161 922,227others 29,572,991 28,010,773
p999,287,507 p875,930,540
23. leases
operating leases - group as lessor The group entered into various lease agreements for its office spaces. These leases generally have terms of one year, renewable
every year.
operating leases - group as lessee The group entered into various property leases with various lessors for office space of its head office and local and provincial
branches. These leases generally have terms of one year, renewable every year.
24. income tax
The benefit from income tax consists of:
2014 2013Final p31,281,587 p27,861,358current 10,600,905 7,441,100deferred 4,144,814 (1,189,579)
p46,027,306 p34,112,879

116
The group’s net deferred tax assets consist of:
2014 2013deferred tax assets: excess of provision for unearned premiums
per books over tax basis p204,882,979 p820,235,548 excess of deferred reinsurance premiums
per books over tax basis 12,405 407,408 allowance for impairment losses 44,086,391 46,742,722 deferred reinsurance commissions 55,205,936 58,984,980 unamortized past service costs 22,142,294 20,368,113 pension obligation 5,799,941 5,269,659
nolco 6,703,731 6,703,731 provision for ibnr losses 33,570,027 28,433,622 accrual for short-term benefits 4,192,766 4,192,766
376,596,470 991,338,549deferred tax liabilities: deferred reinsurance premiums (114,172,795) (701,502,462) deferred acquisition costs (105,113,744) (123,574,906)
excess of provision for unearned premiums per tax over books basis (1,291,322) (4,080,445)
unrealized foreign exchange gains - net (60,765,038) (62,871,123)(281,342,899) (892,028,936)
deferred tax asset through equity:remeasurement loss on defined benefit obligation 56,274,649 53,809,759
deferred tax liability through equity: net unrealized gain on aFs financial assets (44,150,363) (34,343,746)
p107,377,857 p118,775,626
Movements in net deferred tax assets comprise of:
2014 2013at beginning of the year p118,775,626 p79,225,198amounts credited to (charged against) statements of
income (4,144,814) 1,189,579
amount credited to (charged against) statements of comprehensive income (7,252,955) 38,360,849
at end of the year p107,377,857 p118,775,626
as of december 31, 2014 and 2013, the group did not recognize the deferred income tax assets on the following deductible temporary differences, carryforward of unused tax credits from excess of Mcit over rcit, and unused nolco:
2014 2013nolco p991,065,008 p930,515,369accrued expenses 112,011,134 82,213,461unrealized foreign exchange gains - net 35,498,064 -Mcit 24,934,810 22,791,387pension obligation 13,065,052 -allowance for doubtful accounts 7,156,033 5,676,064
The related tax benefits will be recognized only as reassessment demonstrates that they are realizable. realization is entirely dependent upon future taxable income.
as of december 31, 2014, details of the nolco and Mcit, which is available for offset against future taxable income and future income tax liability, respectively, follows:
inception Year nolco tax effect of nolco Mcit expiration Year
2014 p301,766,777 p90,530,033 p10,600,905 20172013 470,826,154 141,247,846 7,441,100 20162012 240,817,847 72,245,354 6,892,805 2015
p1,013,410,778 p304,023,233 p24,934,810
annual report 2014 117
continuing our timeless excellence
The following are the movements in nolco:
2014 2013balance at beginning of year p952,861,139 p500,334,137addition 301,766,777 470,826,154expiration (241,217,138) (18,299,152)balance at end of year p1,013,410,778 p952,861,139
The following are the movements in Mcit:
2014 2013balance at beginning of year p22,791,387 p26,847,123addition 10,600,905 7,441,100expiration (8,457,482) (11,496,836)balance at end of year p24,934,810 p22,791,387
The reconciliation of provision for income tax computed at the statutory corporate income tax rate to benefit from income tax shown in the consolidated statements of income follows:
2014 2013at statutory income tax rate p103,935,902 p26,579,583adjustments for:
change in unrecognized deferred tax assets 86,887,008 98,056,878 nondeductible expenses 6,571,670 12,925,188 dividend income (79,577,924) (73,137,403) interest income exempt or already subjected to
final tax (32,495,988) (28,277,743) gain on sale of aFs financial assets (47,750,844) (13,258,254) nontaxable income - (91,333) expired Mcit 8,457,482 11,315,963
p46,027,306 p34,112,879
25. reconciliation of net income under pFrs to statutory net income
The reconciliation of net income under pFrs to statutory net income of the group follows:
2014 2013net income under pFrs p289,485,700 p54,485,732adjustments: difference in change in provision for unearned premiums - net (81,491,562) 57,384,625 deferred acquisition costs - net 52,452,259 (2,918,673)
eliminated dividend income 10,940,000 58,675,000 net pension benefit expense (income) 3,104,744 (92,180)
deferred reinsurance commission - 14,744,152 others (262) - tax effect of adjustments 306,500 (2,109,235)
p274,797,379 p180,169,421
26. Management of capital, insurance and Financial risks
governance Framework The primary objective of the group’s risk and financial management framework is to protect the group from events that hinder
the sustainable achievement of the group’s performance objectives, including failure to exploit opportunities. The group recognizes the importance of having efficient and effective risk management systems in place.
regulatory Framework regulators are interested in protecting the rights of the policyholders and maintain close vigil to ensure that the group is
satisfactorily managing affairs for their benefit. at the same time, the regulators are also interested in ensuring that the group maintains appropriate solvency position to meet liabilities arising from claims and that the risk levels are at acceptable levels.
capital Management and regulatory requirements The group maintains a certain level of capital to ensure sufficient solvency margins and to adequately protect the policyholders.
The level of capital maintained is usually higher than the minimum capital requirements set by the regulators and the amount computed under the risk-based capital (rbc) Model.

118
The ic capital requirements are fixed capitalization requirements, rbc requirements and unimpaired capital requirement.
The operations of the group are subject to the regulatory requirements of the ic. such regulations not only prescribe approval and monitoring of activities but also impose certain restrictive provisions (e.g., margin of solvency to minimize the risk of default and insolvency on the part of the insurance companies to meet the unforeseen liabilities as these arise, fixed capitalization requirements, rbc requirements).
no changes were made to its capital base, objectives, policies and processes from the previous year.
Fixed capitalization requirements on august 15, 2013, the president of the philippines approved republic act no. 10607 to be known as the “new insurance code”
which provides the new capitalization requirements for all existing insurance companies based on net worth on a staggered basis starting June 30, 2013 up to december 31, 2022. The following presents the amount of required net worth and the schedule of compliance per new insurance code:
networth compliance datep250,000,000 June 30, 2013
550,000,000 december 31 ,2016900,000,000 december 31, 2019
1,300,000,000 december 31, 2022
on January 13, 2015, the ic issued the circular letter (cl) no. 2015-02-a which provides for the clarification of minimum capital requirements under sections 194, 197, 200 and 289 of the new insurance code. The said circular supersedes the department order nos. 27-06 and 15-2012 and cl nos. 22-2008 and 26-2008.
The minimum networth requirement must remain unimpaired for the continuance of the license.
as of december 31, 2014 and 2013, the parent company’s estimated statutory net worth amounted to p5,702,884,006 and p6,640,086,717, respectively.
insurance risk The principal risk the group faces under insurance contracts is that the actual claims and benefit payments or the timing thereof,
differ from expectations. This is influenced by the frequency of claims, severity of claims, actual benefits paid and subsequent development of claims. Therefore, the objective of the group is to ensure that sufficient reserves are available to cover these liabilities.
The above risk exposure is mitigated by diversification across a large portfolio of insurance contracts and geographical areas. The variability of risks is also improved by careful selection and implementation of underwriting strategy guidelines, as well as the use of reinsurance arrangements.
The group purchases reinsurance as part of its risks mitigation program. reinsurance ceded is placed on both a proportional and non-proportional basis with retention limits varying by product line and territory. The majority of proportional reinsurance is quota-share reinsurance which is taken out to reduce the overall exposure of the group to certain classes of business. non-proportional reinsurance is primarily excess-of-loss reinsurance designed to mitigate the group’s net exposure to catastrophe losses. retention limits for the excess-of-loss reinsurance vary by product line and territory.
amounts recoverable from reinsurers are estimated in a manner consistent with the outstanding claims provision and are in accordance with the reinsurance contracts. although the group has reinsurance arrangements, it is not relieved of its direct obligations to its policyholders and thus a credit exposure exists with respect to ceded insurance, to the extent that any reinsurer is unable to meet its obligations assumed under such reinsurance agreements.
The group’s placement of reinsurance is diversified such that it is neither dependent on a single reinsurer nor are the operations of the group substantially dependent upon any single reinsurance contract.
The group principally issues the following types of general insurance contracts: fire, motorcar, personal accident, marine, engineering, bonds and miscellaneous casualty. The most significant risks arise from climate changes and natural disasters. These risks do not vary significantly in relation to the location of the risk insured by the group, type of risk insured and by industry.
to further reduce the risk exposure, the group requires strict claim review policies to assess all new and ongoing claims, regular detailed review of claims handling procedures and frequent investigation of possible fraudulent claims.
The group further enforces a policy of actively managing and prompt pursuing of claims, in order to reduce its exposure to unpredictable future developments that can negatively impact the group.
The group also has limited its exposure level by imposing maximum claim amounts on certain contracts as well as the use of reinsurance arrangements in order to limit exposure to catastrophic events. The purpose of these underwriting and reinsurance strategies is to limit exposure to catastrophes to a predetermined maximum amount based on the group’s risk appetite as decided by management.

annual report 2014 119
continuing our timeless excellence
The tables below set out the concentration of the claims liabilities by type of contract (see note 14).
2014
Gross reinsurers’ share net
Fire p7,811,623,118 p7,147,686,474 p663,936,644Miscellaneous casualty 197,377,019 63,604,162 133,772,857bonds 712,027,244 414,791,744 297,235,500engineering 939,198,794 879,490,154 59,708,640Marine cargo 515,590,650 432,628,644 82,962,006Motor 354,315,821 12,086,440 342,229,381others 52,082,602 8,470 52,074,132
p10,582,215,248 p8,950,296,088 p1,631,919,160
2013gross reinsurers’ share net
Fire p5,496,189,874 p4,829,797,405 p666,392,469Marine cargo 785,979,311 593,138,026 192,841,285Miscellaneous casualty 741,651,018 594,497,563 147,153,455Motor 631,992,312 597,125,395 34,866,917engineering 487,419,825 363,473,603 123,946,222bonds 460,379,205 18,664,134 441,715,071others 190,926,268 13,966 190,912,302
p8,794,537,813 p6,996,710,092 p1,797,827,721
The tables below set out the geographical concentration of the group’s claims liabilities based on the countries where the insurance business is written.
2014Gross reinsurers’ share net
philippines p10,509,392,332 p8,950,296,088 p1,559,096,244greece 72,822,916 ‒ 72,822,916
p10,582,215,248 p8,950,296,088 p1,631,919,160
2013gross reinsurers’ share net
philippines p8,666,181,908 p6,996,710,092 p1,669,471,816greece 128,355,905 – 128,355,905
p8,794,537,813 p6,996,710,092 p1,797,827,721
Key Assumptions The principal assumption underlying the liability estimates is the group’s future claims development will follow a similar pattern
to past claims development experience. This includes assumptions in respect of average claim costs, claims handling costs, claims inflation factors and claim numbers for each accident year. additional qualitative judgments are used to assess the extent to which past trends may not apply in the future, for example once-off occurrence, changes in market factors such as public attitude to claiming, economic conditions, as well as internal factors such as portfolio mix, policy conditions and claims handling procedures. Judgment is further used to assess the extent to which external factors such as judicial decisions and government legislation affect the estimates.
other key assumptions include variations in interest, delays in settlement and changes in foreign currency rates.
Sensitivities The insurance claims provision is sensitive to the above key assumptions. because of delays that arise between occurrence of a
claim and its subsequent notification and eventual settlement, the outstanding claim provisions are not known with certainty at the reporting dates.
The table below shows the impact of changes in certain important assumptions in general insurance business while other assumptions remain unchanged. The correlation of assumptions will have a significant effect in determining the claims but to demonstrate the impact due to changes in assumptions, assumptions had to be changed on individual basis.

120
2014
change in assumptions
%
impact on Gross insurance
contract liabilities
increase (decrease)
impact on net insurance
contract liabilities
increase (decrease)
impact on income Before
income tax increase
(decrease)
average claim costs +5% p137,986,136 p44,192,187 (p44,192,187)average number of claims +5% 126,250,368 40,405,762 (40,405,762)
2013
change in assumptions %
impact on gross insurance
contract liabilities
increase (decrease)
impact on net insurance
contract liabilities
increase (decrease)
impact on income before
income tax increase
(decrease)
average claim costs +5% p181,974,065 p53,699,039 (p53,699,039)average number of claims +5% 199,353,548 58,705,386 (58,705,386)
Claims Development Table The following tables reflect the cumulative incurred claims, including both claims notified and ibnr for each successive accident
year at each reporting dates, together with cumulative payments to date.
The group aims to maintain strong reserves in respect of its insurance business in order to protect against adverse future claims experience and developments. as claims develop and the ultimate cost of claims becomes more certain, adverse claims experiences are eliminated which results in the release of reserves from earlier accident years. in order to maintain strong reserves, the group transfers much of this release to current accident year reserves when the development of claims is less mature and there is much greater uncertainty attaching to the ultimate cost of claims.
The risks vary significantly in relation to the location of the risk insured by the group, type of risks insured and in respect of commercial and business interruption insurance by industry. The uncertainty of the bac’s ultimate cost of claims is typically resolved within one year. The bonds claims payable amounting to p43.40 million and p51.73 million as of december 31, 2014 and 2013, respectively is determined to be the bac’s ultimate cost of claims.

annual report 2014 121
continuing our timeless excellence
Gro
ss in
sura
nce
cont
ract
liab
ilit
ies
in 2
014
acc
iden
t yea
r20
05 a
nd
prio
r ye
ar20
0620
0720
0820
0920
1020
1120
1220
1320
14to
tal
acc
iden
t yea
rp7
,033
,157
,544
p4,8
50,9
17,5
03p2
,154
,031
,020
p3,4
54,8
04,0
95p4
,559
,381
,129
p2,4
81,3
32,4
74p2
,087
,604
,406
p3,5
65,0
60,5
91p5
,937
,238
,064
p3,8
73,6
12,9
57p3
,873
,612
,957
one
yea
r la
ter
7,21
1,48
2,10
46,
805,
336,
003
2,70
2,86
8,68
53,
081,
954,
264
4,06
4,46
3,97
22,
385,
646,
855
2,38
6,44
1,29
73,
823,
993,
982
8,11
9,57
0,41
1‒
8,11
9,57
0,41
1
two
year
s la
ter
7,27
0,83
7,80
46,
141,
362,
933
3,30
9,28
8,41
73,
045,
807,
229
4,12
3,59
4,78
32,
339,
681,
943
2,32
6,81
3,12
23,
475,
560,
926
–‒
3,47
5,56
0,92
6
Thre
e ye
ars
late
r7,
280,
263,
333
6,21
1,82
2,14
93,
238,
220,
388
3,05
4,34
0,56
64,
002,
725,
582
2,47
4,84
3,00
42,
322,
438,
981
––
‒2,
322,
438,
981
Four
yea
rs la
ter
7,32
1,31
0,33
76,
109,
296,
498
3,21
8,22
5,23
53,
050,
278,
500
4,00
1,65
5,25
82,
479,
660,
277
––
–‒
2,47
9,66
0,27
7
Five
yea
rs la
ter
7,20
4,20
4,82
66,
119,
695,
906
3,23
6,69
6,94
03,
037,
930,
350
3,81
2,40
4,79
0–
––
–‒
3,81
2,40
4,79
0
six
year
s la
ter
7,19
4,46
2,94
56,
115,
761,
614
3,23
8,96
8,33
03,
053,
080,
403
––
––
–‒
3,05
3,08
0,40
3
seve
n ye
ars
late
r7,
151,
552,
079
6,11
5,33
9,53
03,
254,
408,
887
––
––
––
‒3,
254,
408,
887
eigh
t yea
rs la
ter
7,13
8,74
1,36
26,
133,
959,
028
––
––
––
–‒
6,13
3,95
9,02
8n
ine
year
s la
ter
7,24
0,41
6,16
7‒
‒‒
‒‒
‒‒
–‒
7,24
0,41
6,16
7
curr
ent e
stim
ate
of c
umul
ativ
e cl
aim
s7,
240,
416,
167
6,13
3,95
9,02
83,
254,
408,
887
3,05
3,08
0,40
33,
812,
404,
790
2,47
9,66
0,27
72,
322,
438,
981
3,47
5,56
0,92
68,
119,
570,
411
3,87
3,61
2,95
743
,765
,112
,827
cum
ulat
ive
paym
ents
to d
ate
6,91
2,74
9,10
65,
960,
600,
181
3,24
1,77
2,83
42,
532,
828,
624
3,38
9,68
4,74
72,
389,
982,
476
2,37
3,52
9,08
52,
783,
440,
953
2,73
1,65
5,55
91,
001,
543,
266
33,3
17,7
86,8
31
insu
ranc
e co
ntra
ct
liab
ilit
ies
reco
gniz
ed in
th
e co
nsol
idat
ed s
tate
men
ts
of fi
nanc
ial p
osit
ion
p 327
,667
,061
p173
,358
,847
p12,
636,
053
p520
,251
,779
p422
,720
,043
p89,
677,
801
(p51
,090
,104
)p6
92,1
19,9
73p5
,387
,914
,852
p2,8
72,0
69,6
91p1
0,44
7,32
5,99
6
net
insu
ranc
e co
ntra
ct li
abil
itie
s in
201
4
acc
iden
t yea
r20
05 a
nd
prio
r ye
ar20
0620
0720
0820
0920
1020
1120
1220
1320
14to
tal
acc
iden
t yea
rp 3
,085
,614
,472
p1,2
42,3
78,7
49p1
,431
,258
,014
p1,9
52,1
83,3
87p1
,125
,272
,584
p1,4
97,3
15,1
41p1
,497
,678
,245
p1,3
73,0
11,8
29p1
,260
,910
,864
p1,8
45,8
79,7
26p1
,845
,879
,726
one
yea
r la
ter
3,22
6,42
7,20
91,
567,
045,
893
1,42
4,54
1,61
21,
920,
769,
319
1,15
2,61
9,67
41,
565,
185,
256
1,80
8,79
4,49
21,
363,
946,
113
934,
820,
751
‒93
4,82
0,75
1
two
year
s la
ter
3,25
4,19
2,23
71,
616,
864,
780
1,94
1,14
7,71
21,
976,
729,
680
1,21
6,04
1,80
71,
548,
687,
275
1,78
2,37
9,52
01,
186,
126,
961
–‒
1,18
6,12
6,96
1
Thre
e ye
ars
late
r3,
278,
762,
812
1,62
6,29
3,38
61,
902,
396,
647
1,94
4,57
8,88
71,
202,
979,
855
1,67
9,61
1,04
01,
780,
384,
110
––
‒1,
780,
384,
110
Four
yea
rs la
ter
3,27
1,63
0,63
71,
622,
788,
908
1,88
2,84
5,85
71,
946,
399,
063
1,33
6,79
3,70
31,
682,
578,
800
––
–‒
1,68
2,57
8,80
0
Five
yea
rs la
ter
3,04
2,76
4,56
81,
636,
820,
607
1,87
8,43
3,99
41,
932,
031,
864
224,
754,
249
––
––
‒22
4,75
4,24
9
six
year
s la
ter
2,75
4,57
6,46
81,
635,
768,
393
1,88
0,62
6,40
71,
931,
450,
543
––
––
–‒
1,93
1,45
0,54
3
seve
n ye
ars
late
r2,
728,
578,
301
1,63
5,76
8,28
41,
895,
791,
162
––
––
––
‒1,
895,
791,
162
eigh
t yea
rs la
ter
2,71
2,89
4,47
81,
654,
188,
012
––
––
––
–‒
1,65
4,18
8,01
2n
ine
year
s la
ter
2,71
6,35
3,49
1‒
2,71
6,35
3,49
1
curr
ent e
stim
ate
of c
umul
ativ
e cl
aim
s2,
716,
353,
491
1,65
4,18
8,01
21,
895,
791,
162
1,93
1,45
0,54
322
4,75
4,24
91,
682,
578,
800
1,78
0,38
4,11
01,
186,
126,
961
934,
820,
751
1,84
5,87
9,72
615
,852
,327
,805
cum
ulat
ive
paym
ents
to d
ate
2,62
6,56
8,57
41,
642,
528,
496
1,89
5,92
3,06
01,
897,
516,
101
262,
456,
095
1,60
6,48
7,87
51,
919,
536,
216
1,14
1,09
4,48
156
0,31
1,45
074
8,08
3,80
314
,300
,506
,151
net
insu
ranc
e co
ntra
ct
liab
ilit
ies
reco
gniz
ed in
th
e co
nsol
idat
ed s
tate
men
ts
of fi
nanc
ial p
osit
ion
p89,
784,
917
p11,
659,
516
(p13
1,89
8)p3
3,93
4,44
2(p
37,7
01,8
46)
p76,
090,
925
(p13
9,15
2,10
6)p4
5,03
2,48
0p3
74,5
09,3
01p1
,097
,795
,923
p1,5
51,8
21,6
54

122
Financial risk The group is exposed to financial risk through its financial assets and financial liabilities. in particular, the key financial risk is
that the proceeds from its financial assets are not sufficient to fund the obligations arising from its insurance contracts. The most important components of this financial risk are credit risk, liquidity risk and market risk.
Credit Risk credit risk is a risk due to uncertainty in a counterparty’s (also called an obligor) ability to meet its obligation.
prior to extending credit, the group manages its credit risk by assessing credit quality of its counterparty.
The group has a credit policy group that reviews all information about the counterparty which may include its statement of financial position, statements of income and other market information. The nature of the obligation is likewise considered. based on this analysis, the credit analyst assigns the counterparty a credit rating to determine whether or not credit may be provided.
credit risk limit is also used to manage credit exposure which specifies exposure credit limit for each intermediary depending on the size of its portfolio and its ability to meet its obligation based on past experience.
The table below shows the maximum exposure to credit risk for the components of the consolidated statement of financial position, net of impairment loss.
2014 2013aFs financial assets:quoted securities: listed equity securities common shares p6,449,486,090 p6,022,723,085 preferred shares 26,842,440 28,692,440 government debt securities: local currency 620,400,000 880,790,158 Foreign currency 34,528,400 34,195,339 private debt securities 1,461,656,162 1,654,823,695 Funds 249,179,147 200,921,352non-quoted securities: unlisted equity securities 107,193,283 97,618,284loans and receivables:cash and cash equivalents 661,716,551 830,564,006short-term investments 29,884,215 12,277,860insurance receivables: due from policyholders, agents and brokers 3,608,884,571 2,908,843,952 due from ceding companies: treaty 1,312,090,158 1,718,154,064 Facultative 132,248,327 482,385,740 Funds held by ceding companies 145,640,520 165,505,297 reinsurance recoverable on paid losses: Facultative 126,536,705 102,917,120 treaty 31,522,889 26,584,186loans and receivables: long-term commercial papers 1,135,760,653 1,094,933,008 notes receivable 294,614,799 391,562,868 creditable withholding tax 62,677,478 62,677,478 claims recoverable 811,250 6,500,000 accounts receivable 138,252,187 25,600,835 Miscellaneous receivable ‒ 1,405,009 cash advances 768,996 837,047 security fund 342,294 342,294 due from related parties 3,629,034 450,805accrued income: accrued interest income: aFs financial assets 33,303,473 37,781,439 long-term commercial papers 8,287,904 8,476,325 notes receivable 58,476 717,528 cash and cash equivalents 534,136 38,804 Funds held by ceding companies 108,990 85,299 security fund 148,854 136,293 short-term investments ‒ 21,552 accrued rent income 1,536,610 4,148,291 accrued dividend income 6,470,202 2,578,631
p16,685,114,794 p16,805,290,084

annual report 2014 123
continuing our timeless excellence
The following tables provide information regarding the credit risk exposure of the group by classifying the financial assets according to the group’s credit ratings of the counter parties.
2014neither past due nor impaired past due but individually
high Grade Medium Grade not impaired impaired totalaFs financial assets:quoted securities: listed equity securities
common shares p6,449,486,090 p‒ p‒ p‒ p6,449,486,090preferred shares 26,842,440 ‒ ‒ ‒ 26,842,440
government debt securities: local currency 620,400,000 ‒ ‒ ‒ 620,400,000 Foreign currency 34,528,400 ‒ ‒ ‒ 34,528,400private debt securities 398,919,192 1,062,736,970 ‒ ‒ 1,461,656,162Funds 244,517,756 4,661,391 ‒ ‒ 249,179,147
non-quoted securities:unlisted equity securities
common shares ‒ 107,175,743 ‒ ‒ 107,175,743 preferred shares ‒ 17,540 ‒ ‒ 17,540loans and receivables:cash and cash equivalents 662,723,074 ‒ ‒ ‒ 662,723,074short-term investments 29,884,215 ‒ ‒ ‒ 29,884,215insurance receivables:
due from policyholders, agents, and brokers 809,287,596 545,273,737 2,375,804,258 6,572,658 3,736,938,249 due from ceding companies: treaty 377,985,167 3,178,977 930,926,014 3,361,426 1,315,451,584 Facultative 104,825,659 10,658,998 18,300,094 7,219,431 141,004,182 Funds held by ceding companies 109,011,772 30,380,755 6,247,993 1,380,777 147,021,297 reinsurance recoverable on paid losses: Facultative 64,766,862 70,580,916 ‒ ‒ 135,347,778 treaty ‒ ‒ 31,522,889 ‒ 31,522,889accrued income: accrued interest: aFs financial assets 33,303,473 ‒ ‒ ‒ 33,303,473 long-term commercial papers 8,287,904 ‒ ‒ ‒ 8,287,904 notes receivable 58,476 ‒ ‒ ‒ 58,476 cash and cash equivalents 534,136 ‒ ‒ ‒ 534,136 Funds held by ceding companies 92,895 16,095 ‒ ‒ 108,990
security fund 148,854 ‒ ‒ ‒ 148,854 short-term investments ‒ ‒ ‒ ‒ ‒ accrued rent income 1,536,610 ‒ ‒ ‒ 1,536,610 accrued dividend income 6,470,202 ‒ ‒ ‒ 6,470,202loans and receivables:
long-term commercial papers 1,115,760,653 20,000,000 ‒ ‒ 1,135,760,653 creditable withholding tax 62,677,478 ‒ ‒ ‒ 62,677,478 notes receivable 294,614,799 ‒ ‒ 1,697,251 296,312,050 claims recoverable 811,250 ‒ ‒ ‒ 811,250
accounts receivable 63,692,833 74,559,354 ‒ 2,050,610 140,302,797 due from related parties 3,629,034 ‒ ‒ ‒ 3,629,034
cash advances 768,996 ‒ ‒ ‒ 768,996 security fund 342,294 ‒ ‒ ‒ 342,294
p11,525,908,110 p1,929,240,476 p3,362,801,248 p22,282,153 p16,840,231,987
2013
neither past due nor impaired past due but individuallyHigh grade Medium grade not impaired impaired total
aFs financial assets:quoted securities: listed equity securities
common shares p5,948,703,036 p– – p74,020,049 p6,022,723,085preferred shares 28,692,440 – – – 28,692,440
government debt securities: local currency 880,790,158 – – – 880,790,158 Foreign currency 34,195,339 – – – 34,195,339private debt securities 728,215,310 926,608,385 – – 1,654,823,695Funds 200,921,352 – – – 200,921,352
non-quoted securities:unlisted equity securities – 97,618,284 – – 97,618,284
loans and receivables:cash and cash equivalents 827,902,698 3,688,829 – – 831,591,527short-term investments 12,277,860 – – – 12,277,860insurance receivables:
due from policyholders, agents, and brokers 1,313,716,078 6,908,540 1,713,781,537 8,358,043 3,042,764,198 due from ceding companies: treaty 814,596,670 7,768,264 895,789,130 2,153,063 1,720,307,127 Facultative 475,265,583 1,035,715 7,538,278 10,748,795 494,588,371 Funds held by ceding companies 35,948,973 533,197 129,023,127 1,380,777 166,886,074 reinsurance recoverable on paid losses: Facultative 2,339,874 22,261,414 81,294,651 5,047,677 110,943,616 treaty 459,898 – 26,124,288 – 26,584,186accrued income:(Forward)

124
accrued interest: aFs financial assets p 23,433,980 p 14,347,459 p– p– p 37,781,439 long-term commercial papers 8,476,325 – – – 8,476,325 notes receivable 717,528 – – – 717,528 cash and cash equivalents 38,804 – – – 38,804 Funds held by ceding companies 36,462 160 48,677 – 85,299
security fund 136,293 – – – 136,293 short-term investments 21,552 – – – 21,552 accrued rent income 4,148,291 – – – 4,148,291 accrued dividend income 2,578,631 – – – 2,578,631loans and receivables:
long-term commercial papers 1,069,933,008 25,000,000 – – 1,094,933,008 creditable withholding tax 62,677,478 – – – 62,677,478 notes receivable 391,153,286 409,582 – 1,697,251 393,260,119 claims recoverable 6,500,000 – – – 6,500,000
accounts receivable 25,287,643 313,192 – 2,005,675 27,606,510Miscellaneous receivable 1,405,009 – – – 1,405,009
due from related parties 450,805 – – – 450,805cash advances 834,778 2,269 – – 837,047
security fund 342,294 – – – 342,294p12,902,197,436 p1,106,495,290 p2,853,599,688 p105,411,330 p16,976,639,519
The credit rating is based on the following:
a) Cash and cash equivalents, short-term investments and related accrued income High grade pertains to those deposited, placed or invested in foreign and local banks belonging to the top banks in the
philippines in terms of resources and profitability, while medium grade pertains to those deposited, placed or invested in thrift banks and rural banks in the philippines.
b) Insurance receivables, loans and receivables, accrued rent income and dividend income For insurance receivables and loans and receivables except due from ceding companies, Funds held by ceding companies,
and long-term commercial papers, the group uses a credit rating concept based on the borrowers and counterparties’ overall creditworthiness. High grade is given to borrowers and counterparties who possess strong to very strong capacity to meet its obligations. Medium grade is given to borrowers and counterparties who possess above average capacity to meet its obligations. These counterparties are somewhat susceptible to adverse changes in business and economic conditions.
For due from ceding companies and Funds held by ceding companies from local sources, the group uses a credit rating concept based on the debt-to-equity ratios of the borrowers and counterparties. High grade is given to borrowers and counterparties with debt-to-equity ratio of less than or equal to 2:1, while medium grade is given to borrowers and counterparties with debt-to-equity ratio of more than 2:1.
For Due from ceding companies and Funds held by ceding companies from foreign sources, the Group uses Standard & Poor’s (S&P) and A.M. Best’s credit rating of insurance companies. High grade pertains to insurance companies rated by S&P and a.M. best as higher than bb+, which means that the insurance company has good to strong financial security characteristics, but may be affected by adverse business conditions. Medium grade pertains to insurance companies that are ungraded and rated by S&P and A.M. Best as lower than BB+, which means that the insurance company has marginal financial security characteristics. positive attributes exist, but adverse business conditions could lead to insufficient ability to meet financial commitments.
c) Equity securities listed equity securities are classified as high grade. unlisted equity securities are classified as medium grade.
d) Debt securities, long-term commercial papers, and related accrued income These are based on the credit ratings by the international rating agency, Standard & Poors (S&P), and by Philippine Ratings
services corporation (philratings), the only domestic credit rating services in the philippines accredited by bangko sentral ng Pilipinas (BSP) and SEC, in cases where an S&P rating is not available. High grade pertains to investments rated by S&P as bbb- and higher, which means that the counterparties have extremely strong to adequate capacity of paying interest and repaying principal, as well as investments in securities issued by the philippine government. Medium grade pertains to investments rated as Baa and higher by Philratings, as well as investments rated by S&P as BB+ to B- (except Philippine Government Securities). The Group’s holdings under this category are rated either BB- by S&P (due to sovereign credit rating ceiling) or aaa by philratings which is defined by philratings to mean that the obligor’s capacity to meet its financial commitment on the obligation is extremely strong.
e) Notes receivables receivables from related entities are considered as high grade.
2013
neither past due nor impaired past due but individuallyHigh grade Medium grade not impaired impaired total

annual report 2014 125
continuing our timeless excellence
The following shows the aging analysis of financial assets:
2014
<30 days > 30 days
total past due but not
impairedloans and receivables: due from policyholders, agents and brokers p338,796,089 p2,037,008,169 p2,375,804,258 due from ceding companies: Facultative 5,722,029 925,203,985 930,926,014 treaty 5,618,939 12,681,155 18,300,094 Funds held by ceding companies - treaty ‒ 6,247,993 6,247,993
reinsurance recoverable on paid losses: treaty ‒ 31,522,889 31,522,889
p350,137,057 p3,012,664,191 p3,362,801,248
2013
<30 days > 30 days
total past due but not
impairedloans and receivables: due from policyholders, agents and brokers p274,478,075 p1,439,303,462 p1,713,781,537 due from ceding companies: treaty 1,522,130 894,267,000 895,789,130 Facultative 5,810,067 1,728,211 7,538,278 Funds held by ceding companies - treaty 5,470,766 123,552,361 129,023,127
reinsurance recoverable on paid losses: Facultative 1,588,949 79,705,702 81,294,651 treaty – 26,124,288 26,124,288accrued income: Funds held by ceding companies - treaty 121 48,556 48,677
p288,870,108 p2,564,729,580 p2,853,599,688
Liquidity Risk liquidity or funding risk is the risk that an entity will encounter difficulty in raising funds to meet commitments associated
with financial instruments. liquidity risk may result from either the inability to sell financial assets quickly at their fair values; or counterparty failing on repayment of a contractual obligation; or insurance liability falling due for payment earlier than expected; or inability to generate cash inflows as anticipated.
an institution may suffer from a liquidity problem when its credit rating falls. The group is also exposed to liquidity risk if markets on which it depends on are subject to loss of liquidity. The major liquidity risk faced by the group is the potential daily calls on its available cash resources in respect of claims from insurance contracts.
The group manages liquidity through a management team which determines liquidity risk for the group by identifying events that would trigger liquidity problems, providing contingency plans, identifying potential sources of funds and monitoring compliance of liquidity risk policy.
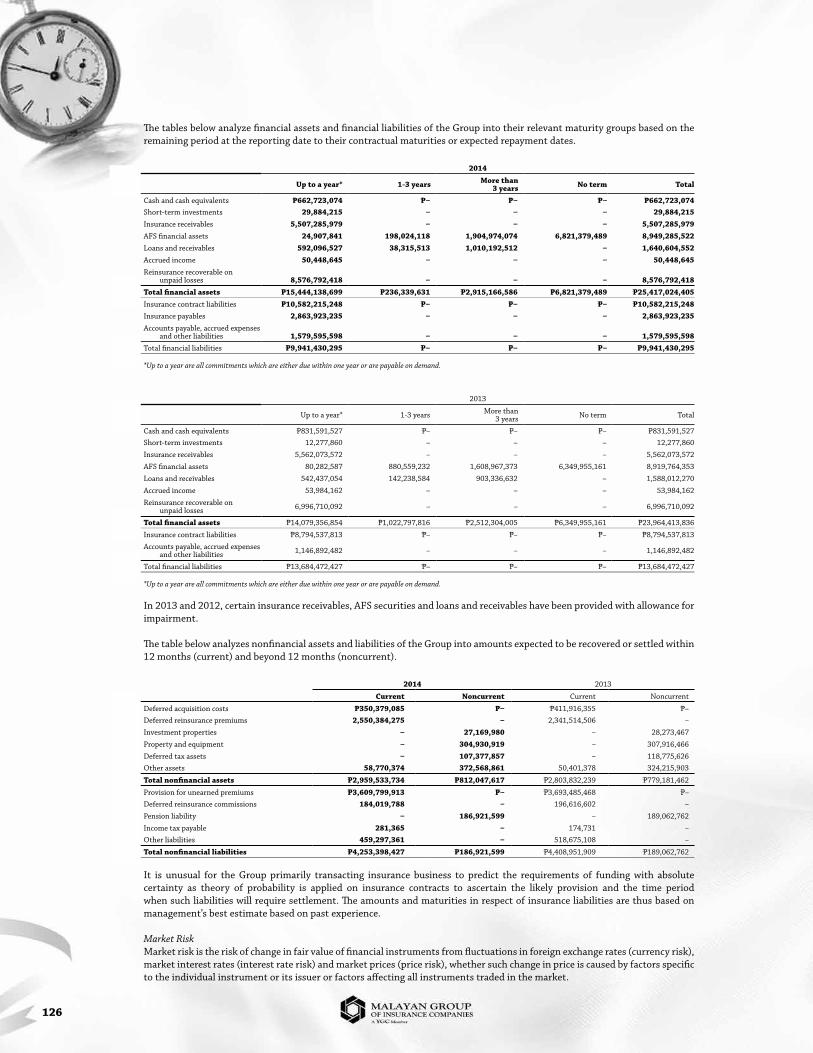
126
The tables below analyze financial assets and financial liabilities of the group into their relevant maturity groups based on the remaining period at the reporting date to their contractual maturities or expected repayment dates.
2014
up to a year* 1-3 years More than 3 years no term total
cash and cash equivalents p662,723,074 p‒ p‒ p‒ p662,723,074short-term investments 29,884,215 ‒ ‒ ‒ 29,884,215insurance receivables 5,507,285,979 ‒ ‒ ‒ 5,507,285,979aFs financial assets 24,907,841 198,024,118 1,904,974,074 6,821,379,489 8,949,285,522loans and receivables 592,096,527 38,315,513 1,010,192,512 ‒ 1,640,604,552accrued income 50,448,645 ‒ ‒ ‒ 50,448,645reinsurance recoverable on unpaid losses 8,576,792,418 ‒ ‒ ‒ 8,576,792,418total financial assets p15,444,138,699 p236,339,631 p2,915,166,586 p6,821,379,489 p25,417,024,405insurance contract liabilities p10,582,215,248 p‒ p‒ p‒ p10,582,215,248insurance payables 2,863,923,235 ‒ ‒ ‒ 2,863,923,235accounts payable, accrued expenses and other liabilities 1,579,595,598 ‒ ‒ ‒ 1,579,595,598total financial liabilities p9,941,430,295 p‒ p‒ p‒ p9,941,430,295
*Up to a year are all commitments which are either due within one year or are payable on demand.
2013
up to a year* 1-3 years More than3 years no term total
cash and cash equivalents p831,591,527 p– p– p– p831,591,527short-term investments 12,277,860 – – – 12,277,860
insurance receivables 5,562,073,572 – – – 5,562,073,572
aFs financial assets 80,282,587 880,559,232 1,608,967,373 6,349,955,161 8,919,764,353
loans and receivables 542,437,054 142,238,584 903,336,632 – 1,588,012,270
accrued income 53,984,162 – – – 53,984,162
reinsurance recoverable on unpaid losses 6,996,710,092 – – – 6,996,710,092
total financial assets p14,079,356,854 p1,022,797,816 p2,512,304,005 p6,349,955,161 p23,964,413,836
insurance contract liabilities p8,794,537,813 p– p– p– p8,794,537,813
accounts payable, accrued expenses and other liabilities 1,146,892,482 – – – 1,146,892,482
total financial liabilities p13,684,472,427 p– p– p– p13,684,472,427
*Up to a year are all commitments which are either due within one year or are payable on demand.
in 2013 and 2012, certain insurance receivables, aFs securities and loans and receivables have been provided with allowance for impairment.
The table below analyzes nonfinancial assets and liabilities of the group into amounts expected to be recovered or settled within 12 months (current) and beyond 12 months (noncurrent).
2014 2013
current noncurrent current noncurrent
deferred acquisition costs p350,379,085 p‒ p411,916,355 p–deferred reinsurance premiums 2,550,384,275 ‒ 2,341,514,506 –
investment properties ‒ 27,169,980 – 28,273,467
property and equipment ‒ 304,930,919 – 307,916,466
deferred tax assets ‒ 107,377,857 – 118,775,626other assets 58,770,374 372,568,861 50,401,378 324,215,903
total nonfinancial assets p2,959,533,734 p812,047,617 p2,803,832,239 p779,181,462
provision for unearned premiums p3,609,799,913 p‒ p3,693,485,468 p–deferred reinsurance commissions 184,019,788 ‒ 196,616,602 –
pension liability ‒ 186,921,599 – 189,062,762
income tax payable 281,365 ‒ 174,731 –other liabilities 459,297,361 ‒ 518,675,108 –
total nonfinancial liabilities p4,253,398,427 p186,921,599 p4,408,951,909 p189,062,762
it is unusual for the group primarily transacting insurance business to predict the requirements of funding with absolute certainty as theory of probability is applied on insurance contracts to ascertain the likely provision and the time period when such liabilities will require settlement. The amounts and maturities in respect of insurance liabilities are thus based on management’s best estimate based on past experience.
Market Risk Market risk is the risk of change in fair value of financial instruments from fluctuations in foreign exchange rates (currency risk),
market interest rates (interest rate risk) and market prices (price risk), whether such change in price is caused by factors specific to the individual instrument or its issuer or factors affecting all instruments traded in the market.

annual report 2014 127
continuing our timeless excellence
Market risk is the risk to an institution’s financial condition from volatility in the price movements of the assets contained in a portfolio. Market risk represents what the group would lose from price volatilities. Market risk can be measured as the potential gain or loss in a position or portfolio that is associated with a price movement of a given probability over a specified time horizon.
The group manages market risk by evenly distributing capital among investment instruments, sectors and geographical areas.
The group structures levels of market risk it accepts through a sound market risk policy based on specific guidelines set by an investment committee. This policy constitutes certain limits on exposure of investments mostly with top-rated banks, which are selected on the basis of the bank’s credit ratings, capitalization and quality servicing being rendered to the group. also, the said policy includes diversification benchmarks of investment portfolio to different investment types duly approved by the ic, asset allocation and portfolio limit structure.
Moreover, control of relevant market risks can be addressed through compliance reporting of market risk exposures, regular monitoring and review of the group’s investment performance and upcoming investment opportunities for pertinence and changing environment.
a) Currency Risk
The group’s principal transactions are carried out in philippine peso and its exposure to foreign exchange risk arises primarily with respect to u.s. dollar and euro. in addition, the parent company enters into non-deliverable forward contracts to hedge its exposure on foreign currency exchange risks.
The tables below summarize the group’s exposure to foreign currency exchange rate risks by categorizing assets and liabilities by major currencies.
2014
philippine peso u.s. dollar euro others totalaFs financial assets:equity securities:
listed equity securities p5,985,154,569 p316,606,706 p101,550,667 p73,016,588 p6,476,328,530 unlisted equity securities 107,193,283 ‒ ‒ ‒ 107,193,283private debt securities ‒ 1,447,307,893 ‒ 14,348,269 1,461,656,162government debt securities 620,400,000 34,528,400 ‒ ‒ 654,928,400Funds 18,165,540 220,712,297 ‒ 10,301,310 249,179,147loans and receivables:cash and cash equivalents 469,627,791 188,405,212 403,999 4,286,072 662,723,074short-term investments 17,764,360 12,119,855 ‒ ‒ 29,884,215insurance receivables - net 4,123,543,465 1,182,416,874 3,609,620 47,353,211 5,356,923,170loans and receivables 1,636,856,691 ‒ ‒ ‒ 1,636,856,691accrued income 28,824,787 21,516,384 ‒ 107,474 50,448,645total assets p13,007,530,486 p3,423,613,621 p105,564,286 p149,412,924 p16,686,121,317other financial liabilities
accounts payable, accrued expenses and other liabilities p1,579,595,598 p‒ p‒ p‒ p1,579,595,598insurance payables 2,598,962,382 248,882,333 1,141,376 14,937,144 2,863,923,235total liabilities p4,178,557,980 p248,882,333 p1,141,376 p14,937,144 p4,443,518,833
2013
philippine peso u.s. dollar euro others total
aFs financial assets:equity securities:
listed equity securities p5,662,841,087 p227,777,980 p80,748,155 p80,048,303 p6,051,415,525
unlisted equity securities 97,618,284 – – – 97,618,284
private debt securities – 1,571,387,756 75,789,424 7,646,515 1,654,823,695
government debt securities 880,790,158 34,195,339 – – 914,985,497
Funds 35,561,218 159,080,840 – 6,279,294 200,921,352
loans and receivables:cash and cash equivalents 506,961,345 291,110,136 12,317,944 21,202,102 831,591,527
short-term investments 12,277,860 – – – 12,277,860
insurance receivables - net 3,977,432,596 1,362,340,915 2,966,835 61,650,013 5,404,390,359
loans and receivables 1,584,282,377 26,967 – – 1,584,309,344accrued income 32,568,589 19,332,304 1,667,114 416,155 53,984,162
total assets p12,790,333,514 p3,665,252,237 p173,489,472 p177,242,382 p16,806,317,605
other financial liabilitiesaccounts payable, accrued
expenses and other liabilities p1,146,892,483 p– p– p– p1,146,892,483insurance payables 2,978,828,184 757,759,313 191,169 6,263,466 3,743,042,132
total liabilities p4,125,720,667 p757,759,313 p191,169 p6,263,466 p4,889,934,615

128
The following table demonstrates the sensitivity to a reasonably possible change in the us dollar, euro and other currency exchange rates, with all other variables held constant, of the group’s profit before tax (due to changes in the foreign exchange rate).
impact on income before tax increase (decrease)
currency change in rate 2014 2013us dollar + 5% p122,694,145 p138,114,355
- 5% (122,694,145) (138,114,355)euro + 5% 2,566,841 9,037,158
- 5% (2,566,841) (9,037,158)others + 5% 565,985 1,987,208
- 5% (565,985) (1,987,208)
b) Interest Rate Risk
interest rate risk is the risk that the value/future cash flows of a financial instrument will fluctuate because of changes in market interest rates. The group’s fixed rate investments in particular are exposed to such risk.
The group’s market risk policy requires it to manage interest rate risk by maintaining appropriate mix of fixed and variable rate instruments. The policy also requires it to manage the maturities of interest bearing financial assets.
The following table sets out the group’s financial assets exposed to interest rate risk by maturity:
2014
interest rate within one year 1-3 years More than3 years total
cash and cash equivalents 0.25% - 1.4% p661,716,551 p‒ p‒ p661,716,551short-term investments 0.63% - 7.50% 29,884,215 ‒ ‒ 29,884,215notes receivable 8% to 8.5% 296,312,050 ‒ ‒ 296,312,050long-term commercial papers 1.125% - 9% 87,252,628 38,315,513 1,010,192,512 1,135,760,653security fund 4.76% 342,294 ‒ ‒ 342,294aFs debt financial assets 1.25% - 12.38% 23,943,058 198,160,675 1,894,480,829 2,116,584,562total interest-bearing financial assets p1,099,450,796 p236,476,188 p2,904,673,341 p4,240,600,325
2013
interest rate within one year 1-3 years More than3 years total
cash and cash equivalents 0.25% - 4.50% p830,564,006 p– p– p830,564,006short-term investments 1.00% - 4.25% 12,277,860 – – 12,277,860
notes receivable 1.00% - 8.50% 382,617,911 2,838,584 7,803,624 393,260,119
long-term commercial papers 5.25% - 9.33% 60,000,000 139,400,000 895,533,008 1,094,933,008
security fund 4.76% 342,294 – – 342,294aFs debt financial assets 1.25% - 13.50% 80,282,587 880,559,232 1,608,967,373 2,569,809,192
total interest-bearing financial assets p1,366,084,658 p1,022,797,816 p2,512,304,005 p4,901,186,479
The following table demonstrates the sensitivity to a reasonably possible change in interest rates on the aFs debt securities, with all other variables held constant, of the group’s equity:
impact on equity increase (decrease)
currency change in basis points 2014 2013philippine peso + 100 p66,850,351 p96,872,889u.s. dollar + 100 3,796,637 65,529,321euro + 100 ‒ 2,680,163
philippine peso - 100 p71,715,080 p106,533,197u.s. dollar - 100 60,078,650 71,120,953euro - 100 ‒ 2,713,266
c) Equity Price Risk
The group’s price risk exposure at year-end relates to financial assets and liabilities whose values will fluctuate as a result of changes in market prices, principally, aFs equity financial assets.
such financial assets are subject to price risk due to changes in market values of instruments arising either from factors specific to individual instruments or their issuers or factors affecting all instruments traded in the market.

annual report 2014 129
continuing our timeless excellence
The group’s market risk policy requires it to manage such risks by setting and monitoring objectives and constraints on investments; diversification plan; limits on investment in each country, sector and market; and careful and planned use of derivative instruments. The price risk on investments securities is also actively managed through the use of derivative financial instruments to mitigate the risk of adverse market movements.
The following table shows the equity impact of reasonably possible change of philippine stock exchange index (psei), Morgan stanley capital international (Msci) euro and dow Jones euro stoxx 50 (sx5e index):
impact on equityincrease (decrease)
change in equity prices psei Msci euro2014 +15% p848,531,556 p18,765,019
-15% (848,531,556) (18,765,019)
2013 +15% p872,138,770 p20,842,959-15% (872,138,770) (20,842,959)
27. Financial assets and liabilities
The table below presents a comparison by category of carrying amounts and estimated fair values of all the group’s financial instruments.
2014 2013carrying value Fair value carrying value Fair value
aFs financial assets:quoted securities: listed equity securities common shares p6,449,486,090 p6,449,486,090 p6,022,723,085 p6,022,723,085 preferred shares 26,842,440 26,842,440 28,692,440 28,692,440 government debt securities: local currency 620,400,000 620,400,000 880,790,158 880,790,158 Foreign currency 34,528,400 34,528,400 34,195,339 34,195,339 private debt securities 1,461,656,162 1,461,656,162 1,654,823,695 1,654,823,695 Funds 249,179,147 249,179,147 200,921,352 200,921,352non-quoted securities: unlisted equity securities common shares 107,175,743 107,175,743 97,618,284 97,618,284 preferred shares 17,540 17,540loans and receivables:cash and cash equivalents 662,723,074 662,723,074 831,591,527 831,591,527short-term investments 29,884,215 29,884,215 12,277,860 12,277,860insurance receivables: due from policyholders, agents and brokers 3,608,884,571 3,608,884,571 2,908,843,952 2,908,843,952 due from ceding companies: treaty 1,312,090,158 1,312,090,158 1,718,154,064 1,718,154,064 Facultative 132,248,327 132,248,327 482,385,740 482,385,740 Funds held by ceding companies 145,640,520 145,640,520 165,505,297 165,505,297reinsurance recoverable on paid losses: Facultative 126,536,705 126,536,705 102,917,120 102,917,120 treaty 31,522,889 31,522,889 26,584,186 26,584,186loans and receivables:long-term commercial papers 1,135,760,653 1,182,532,588 1,094,933,008 1,197,128,920creditable withholding tax 62,677,478 62,677,478 62,677,478 62,677,478 accounts receivable 138,252,187 138,252,187 25,600,835 25,600,835 notes receivable 294,614,799 294,056,178 391,562,868 392,944,300Miscellaneous receivable ‒ ‒ 1,405,009 1,405,009 claims recoverable 811,250 811,250 6,500,000 6,500,000due from related parties 3,629,034 3,629,034 450,805 450,805cash advances 768,996 768,996 837,047 837,047 security fund 342,294 342,294 342,294 342,294accrued income:accrued interest income:aFs financial assets 33,303,473 33,303,473 37,781,439 37,781,439long-term commercial papers 8,287,904 8,287,904 8,476,325 8,476,325notes receivable 58,476 58,476 717,528 717,528cash and cash equivalents 534,136 534,136 38,804 38,804Funds held by ceding companies 108,990 108,990 85,299 85,299security fund 148,854 148,854 136,293 136,293short-term investments ‒ ‒ 21,552 21,552accrued rent income 1,536,610 1,536,610 4,148,291 4,148,291accrued dividend income 6,470,202 6,470,202 2,578,631 2,578,631total financial assets 16,686,121,317 16,732,334,631 16,806,317,605 16,909,894,949other financial liabilitiesinsurance payables due to reinsurers and ceding companies 2,274,764,364 2,274,764,364 2,366,935,153 2,366,935,153 Funds held for reinsurers 589,158,871 589,158,871 1,376,106,979 1,376,106,979accounts payable and accrued expenses and other liabilities: accounts payable 890,433,452 890,433,452 699,676,294 699,676,294 commissions payable 477,463,519 477,463,519 304,824,160 304,824,160 accrued expenses 142,572,815 142,572,815 104,078,232 104,078,232 surety deposits 49,282,432 49,282,432 32,455,278 32,455,278 others 19,843,380 19,843,380 5,858,518 5,858,518total financial liabilities p4,443,518,833 p4,443,518,833 p4,889,934,614 p4,889,934,614
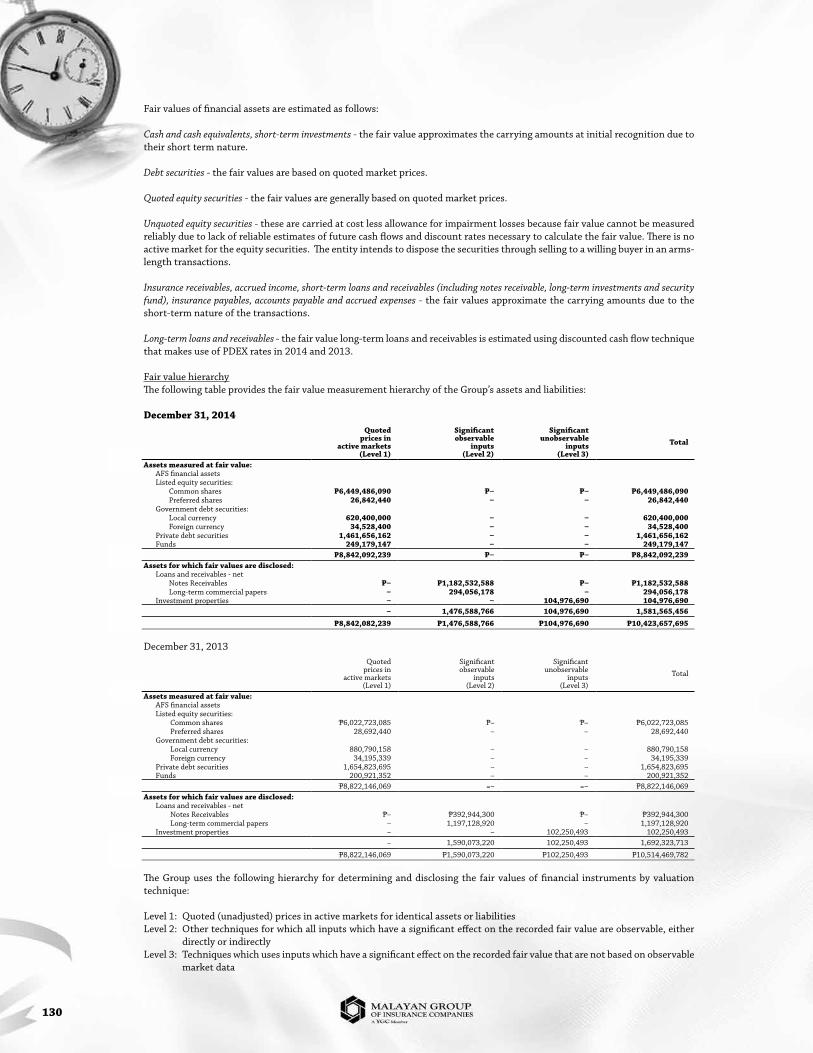
130
Fair values of financial assets are estimated as follows:
Cash and cash equivalents, short-term investments - the fair value approximates the carrying amounts at initial recognition due to their short term nature.
Debt securities - the fair values are based on quoted market prices.
Quoted equity securities - the fair values are generally based on quoted market prices.
Unquoted equity securities - these are carried at cost less allowance for impairment losses because fair value cannot be measured reliably due to lack of reliable estimates of future cash flows and discount rates necessary to calculate the fair value. There is no active market for the equity securities. The entity intends to dispose the securities through selling to a willing buyer in an arms-length transactions.
Insurance receivables, accrued income, short-term loans and receivables (including notes receivable, long-term investments and security fund), insurance payables, accounts payable and accrued expenses - the fair values approximate the carrying amounts due to the short-term nature of the transactions.
Long-term loans and receivables - the fair value long-term loans and receivables is estimated using discounted cash flow technique that makes use of pdex rates in 2014 and 2013.
Fair value hierarchy The following table provides the fair value measurement hierarchy of the group’s assets and liabilities: december 31, 2014
quoted prices in
active markets (level 1)
significant observable
inputs (level 2)
significant unobservable
inputs (level 3)
total
assets measured at fair value: aFs financial assets listed equity securities: common shares p6,449,486,090 p‒ p‒ p6,449,486,090 preferred shares 26,842,440 ‒ ‒ 26,842,440 government debt securities: local currency 620,400,000 ‒ ‒ 620,400,000 Foreign currency 34,528,400 ‒ ‒ 34,528,400 private debt securities 1,461,656,162 ‒ ‒ 1,461,656,162 Funds 249,179,147 ‒ ‒ 249,179,147
p8,842,092,239 p‒ p‒ p8,842,092,239assets for which fair values are disclosed: loans and receivables - net notes receivables p‒ p1,182,532,588 p‒ p1,182,532,588 long-term commercial papers ‒ 294,056,178 ‒ 294,056,178 investment properties ‒ ‒ 104,976,690 104,976,690
‒ 1,476,588,766 104,976,690 1,581,565,456p8,842,082,239 p1,476,588,766 p104,976,690 p10,423,657,695
december 31, 2013quoted
prices in active markets
(level 1)
significant observable
inputs (level 2)
significant unobservable
inputs (level 3)
total
assets measured at fair value: aFs financial assets listed equity securities: common shares p6,022,723,085 p– p– p6,022,723,085 preferred shares 28,692,440 – – 28,692,440 government debt securities: local currency 880,790,158 – – 880,790,158 Foreign currency 34,195,339 – – 34,195,339 private debt securities 1,654,823,695 – – 1,654,823,695 Funds 200,921,352 – – 200,921,352
p8,822,146,069 =– =– p8,822,146,069assets for which fair values are disclosed: loans and receivables - net notes receivables p– p392,944,300 p– p392,944,300 long-term commercial papers – 1,197,128,920 – 1,197,128,920 investment properties – – 102,250,493 102,250,493
– 1,590,073,220 102,250,493 1,692,323,713
p8,822,146,069 p1,590,073,220 p102,250,493 p10,514,469,782
The group uses the following hierarchy for determining and disclosing the fair values of financial instruments by valuation technique:
level 1: quoted (unadjusted) prices in active markets for identical assets or liabilitieslevel 2: other techniques for which all inputs which have a significant effect on the recorded fair value are observable, either
directly or indirectlylevel 3: techniques which uses inputs which have a significant effect on the recorded fair value that are not based on observable
market data

annual report 2014 131
continuing our timeless excellence
during the reporting period ended december 31, 2014 and 2013, there were no transfers between level 1 and level 2 fair value measurements, and no transfers into and out of level 3 fair value measurements.
28. related party transactions
parties are considered to be related if one party has the ability, directly or indirectly, to control the other party, or exercise significant influence over the other party in making financial and operating decisions. parties are also considered to be related if they are subject to common control or common significant influence.
outstanding balances as of year-end are unsecured and to be settled in cash. There have been no guarantees provided or received for any related party receivables or payables. in 2014 and 2013, the group has not recorded any impairment of receivables relating to amounts owed by related parties. This assessment is undertaken each financial year by examining the financial position of the related party and the market in which the related party operates.
significant transactions with related parties include:
2014 2013
categoryamount /
volume
outstanding receivable
(payable)amount /
volume
outstanding receivable
(payable) terms conditionsParentMEI
Management expense p7,500,000 p‒ p7,500,000 p–non-interest
bearing; on demand
–
notes receivables 100,000,000 ‒ 100,000,000 100,000,000interest at 6%
p.a.; due within one year
unsecured; no impairment
dividend income 121,553,840 (9,053,840) 11,317,320 – – –
interest income 5,945,833 ‒ 7,604,167 250,000 interest at 6% p.a.
unsecured; no impairment
inter-company advances ‒ 36,789 36,789 36,789non-interest
bearing; on demand.
unsecured; no impairment
due to related party ‒ ‒ – (7,455,167)non-interest
bearing; on demand
accounts payable ‒ ‒ – (47,700)non-interest
bearing; on demand
Other related partiesa. MIIC
reinsurers share on gross premiums 501,520,054 (1,158,553,225) 701,188,542 (663,766,222)
non-interest bearing; on
demandunsecured
commission income 4,524,254 (6,563,185) 8,020,177 (10,454,106)non-interest
bearing; on demand
unsecured; no impairment
loss recoveries ‒ ‒ 935,150 935,150non-interest
bearing; on demand
unsecured; no impairment
shared expenses ‒ ‒ 1,075,000 –non-interest
bearing; on demand
unsecured; no impairment
b. Y Realty Corporation
rent expense 8,689,131 8,689,131 14,319,473 14,319,473non-interest
bearing; on demand
unsecured; no impairment
c. RCBC Bankard
shared expenses 1,175,370 1,175,370 1,953,565 1,953,565non-interest
bearing; on demand
unsecured; no impairment
d. ASPAC
reinsurance share on gross premiums 2,219,041 11,986,305 12,496,085 9,761,426
non-interest bearing; on
demand
unsecured; no impairment
commission income 750,830 4,685,641 5,398,352 3,905,827non-interest
bearing; on demand
unsecured; no impairment
e. HI
notes receivable ‒ ‒ (200,000,000) –interest at 5.63%
p.a.; due within one year
–
interest income ‒ ‒ 15,421,875 – interest at 5.63% p.a. –
(Forward)
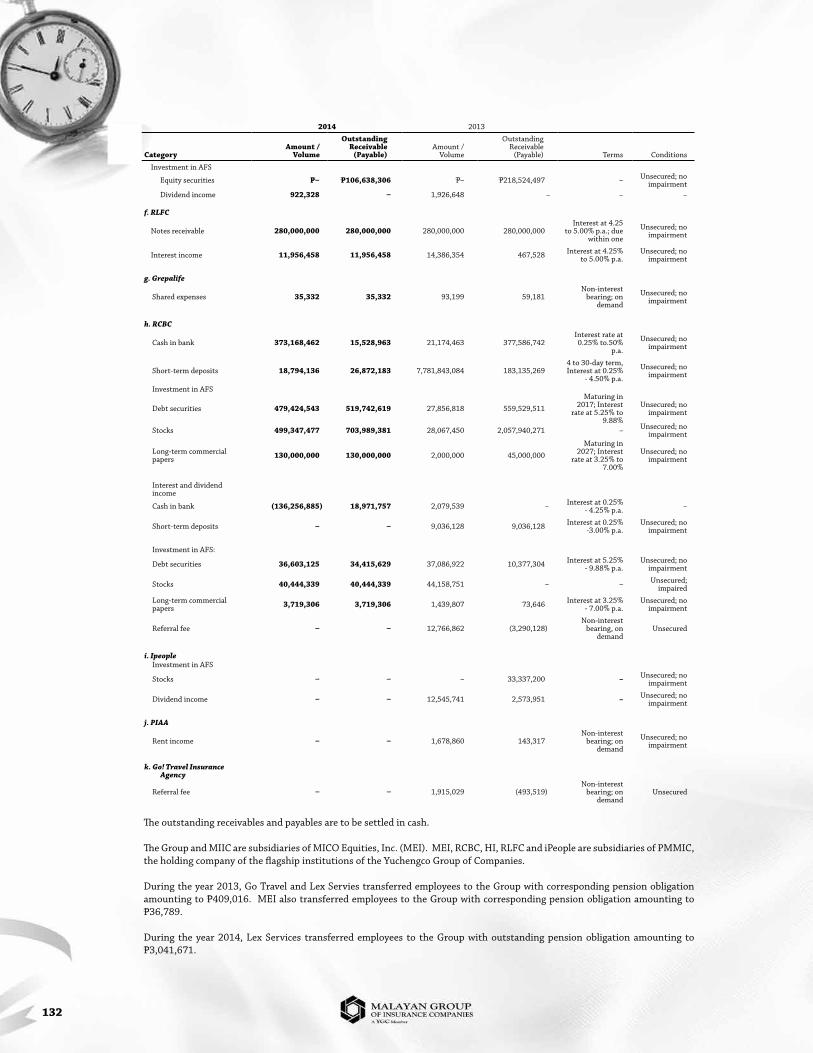
132
2014 2013
categoryamount /
volume
outstanding receivable
(payable)amount /
volume
outstanding receivable
(payable) terms conditions
investment in aFs
equity securities p‒ p106,638,306 p– p218,524,497 – unsecured; no impairment
dividend income 922,328 ‒ 1,926,648 – – –
f. RLFC
notes receivable 280,000,000 280,000,000 280,000,000 280,000,000interest at 4.25
to 5.00% p.a.; due within one
unsecured; no impairment
interest income 11,956,458 11,956,458 14,386,354 467,528 interest at 4.25% to 5.00% p.a.
unsecured; no impairment
g. Grepalife
shared expenses 35,332 35,332 93,199 59,181non-interest
bearing; on demand
unsecured; no impairment
h. RCBC
cash in bank 373,168,462 15,528,963 21,174,463 377,586,742interest rate at 0.25% to.50%
p.a.
unsecured; no impairment
short-term deposits 18,794,136 26,872,183 7,781,843,084 183,135,2694 to 30-day term, interest at 0.25%
- 4.50% p.a.
unsecured; no impairment
investment in aFs
debt securities 479,424,543 519,742,619 27,856,818 559,529,511
Maturing in 2017; interest
rate at 5.25% to 9.88%
unsecured; no impairment
stocks 499,347,477 703,989,381 28,067,450 2,057,940,271 – unsecured; no impairment
long-term commercial papers 130,000,000 130,000,000 2,000,000 45,000,000
Maturing in 2027; interest
rate at 3.25% to 7.00%
unsecured; no impairment
interest and dividend income
cash in bank (136,256,885) 18,971,757 2,079,539 – interest at 0.25% - 4.25% p.a. –
short-term deposits ‒ ‒ 9,036,128 9,036,128 interest at 0.25% -3.00% p.a.
unsecured; no impairment
investment in aFs:
debt securities 36,603,125 34,415,629 37,086,922 10,377,304 interest at 5.25% - 9.88% p.a.
unsecured; no impairment
stocks 40,444,339 40,444,339 44,158,751 – – unsecured; impaired
long-term commercial papers 3,719,306 3,719,306 1,439,807 73,646 interest at 3.25%
- 7.00% p.a.unsecured; no
impairment
referral fee ‒ ‒ 12,766,862 (3,290,128)non-interest
bearing, on demand
unsecured
i. Ipeopleinvestment in aFs
stocks ‒ ‒ – 33,337,200 – unsecured; no impairment
dividend income ‒ ‒ 12,545,741 2,573,951 – unsecured; no impairment
j. PIAA
rent income ‒ ‒ 1,678,860 143,317non-interest
bearing; on demand
unsecured; no impairment
k. Go! Travel Insurance Agency
referral fee ‒ ‒ 1,915,029 (493,519)non-interest
bearing; on demand
unsecured
The outstanding receivables and payables are to be settled in cash.
The group and Miic are subsidiaries of Mico equities, inc. (Mei). Mei, rcbc, Hi, rlFc and ipeople are subsidiaries of pMMic, the holding company of the flagship institutions of the Yuchengco group of companies.
during the year 2013, go travel and lex servies transferred employees to the group with corresponding pension obligation amounting to p409,016. Mei also transferred employees to the group with corresponding pension obligation amounting to p36,789.
during the year 2014, lex services transferred employees to the group with outstanding pension obligation amounting to p3,041,671.

annual report 2014 133
continuing our timeless excellence
Terms and Conditions of transactions with related parties outstanding balances at year end are unsecured and settlement occurs in cash. some bear interest at annual rates ranging from
0.25% to 9.88%. There have been no guarantees provided or received for any related party payables or receivables. The group has not recognized any impairment losses on amounts due from related parties for the years ended december 31, 2014 and 2013. This assessment is undertaken each financial year through review of the financial position of the related party and the market in which the related party operates.
key management personnel of the group include senior management. The total short-term employee benefit of the group’s key management personnel amounted to p9.47 million and p12.41 million in 2014 and 2013, respectively. as of december 31, 2014 and 2013, the total long-term employee benefits of the parent company’s key management personnel amounted to p47.94 million and p49.20 million, respectively.
29. contingencies
The group operates in the insurance industry and has various contingent liabilities arising in the ordinary conduct of business, which are either pending decision by the courts or being contested, the outcome of which are not presently determinable. in the opinion of management and its legal counsel, the eventual liability under these lawsuits or claims, if any, will not have a material or adverse effect on the group’s financial position and results of operations.
30. note to consolidated statements of cash Flows
The group’s noncash activities include:
a. transfers of pension obligation from lex services to the parent company amounting to p3.04 million in 2014.b. transfer of computer software amounting to p87.42 million from other assets to property and equipment in 2013.c. transfer of pension obligation from go travel and lex services to the parent company amounting to p0.41 million and from
Mei to the parent company amoiunting to amounting to p0.36 million in 2013.

134
Mico equities, inc.
Board of Directors
alfonso t. YuchengcocHairMan
(Refer to page 5 for his business affiliations)
Yvonne s. Yuchengcopresident
• Malayan Insurance Company, Inc., President, Chief Executive Officer, and Director • MICO Equities, Inc., President and Director • RCBC Capital Corporation, Chairperson and Director • Philippine Integrated Advertising Agency, Inc., President and Director • aY Foundation, inc., Member, board of trustees
teodoro d. regaladirector
• Rizal Commercial Banking Corporation, Director • Angara, Abello, Concepcion, Regala & Cruz Law Offices, Founding Partner • Agc Flat glass Philippines, Inc., Corporate Secretary • Safeway Philtech, Inc., Director • Malayan Insurance Company, Inc., Director • Oep philippines, inc., director and corporate secretary
alfonso s. Yuchengco, Jr. director
• AY Foundation, Trustee • Water Dragon, Inc., Chairman and President • Y Realty Corporation, President • Shayamala Corporation, President • ET Yuchengco, Inc., Director • Pan Malayan Realty Corporation, Vice President and Director • Pan Malayan Management & Investment Corporation, Vice Chairman and Director • iMi, Inc., Chairman and President • Yuchengco Museum, vice chairman and president
helen Y. deedirector
• Malayan Insurance Company, Inc., Chairperson • House of investments, inc., chairperson, president and Chief Executive Officer • Rizal Commercial Banking Corporation, Chairperson • Rcbc savings bank, Chairperson • Manila Memorial Park Cemetery, Inc., Chairperson • Malayan Colleges Inc., Trustee • Philippine Long Distance Telephone Company, Director • Sunlife grepa Financial, inc., director

annual report 2014 135
continuing our timeless excellence
Yvonne s. Yuchengcopresident
• Malayan Insurance Company, Inc., President, Chief Executive Officer, and Director • MICO Equities, Inc., President and Director • RCBC Capital Corporation, Chairperson and Director • Philippine Integrated Advertising Agency, Inc., President and Director • AY Foundation, inc., Member, board of trustees
Michele Marie Y. deedirector
• AY Foundation, Executive Vice President • Sandee Unlimited, Inc., President • Mico equities, inc., Treasurer • Luis Miguel Foods, Inc., President• First Nationwide Assurance Corporation, Director • Rizal Commercial Banking Corporation, First Vice President • Philippine Integrated Advertising Agency, treasurer
teodoro d. regaladirector
• Rizal Commercial Banking Corporation, Director • Angara, Abello, Concepcion, Regala & Cruz Law Offices, Founding Partner • Agc Flat glass philippines, inc., Corporate Secretary • Safeway Philtech, Inc., Director • Malayan Insurance Company, Inc., Director • Oep philippines, inc., director and corporate secretary
arthur lee director
• Tokio Marine Life Holdings, Inc., Executive Officer • Tokio Marine Asia Pte. Ltd., Chief Executive • Asia general Holdings limited, Managing director
hideyuki ishii director
• Tokio Marine Life Insurance Malaysia Bhd., Non-Executive Director • Tokio Marine Retakaful Pte. Ltd., Non-Executive Chairman • PT Tokio Marine Life Insurance Indonesia, President Commissioner • IFFCO-tokio insurance service limited, non-executive director
renato c. valenciaindependent director
• iPeople, Inc., Chairman • Anglo Philippine Holdings Corporation, Director • Philippine Veterans Bank, Board adviser
• ExEcutivE committEE: Helen Y. dee, Yvonne s. Yuchengco, renato s. valencia, armando M. Medina, arthur lee
• REnumERation and nomination committEE: Michele Marie Y. dee, renato c. valencia, teodoro d. regala
• audit committEE: renato c. valencia, armando M. Medina
• Risk managEmEnt committEE: renato c. valencia, armando M. Medina
helen Y. deecHairperson
• Malayan Insurance Company, Inc., Chairperson • House of investments, inc., chairperson, president and chief executive Officer • Rizal Commercial Banking Corporation, Chairperson • Rcbc Savings Bank, Chairperson • Manila Memorial Park Cemetery, Inc., Chairperson • Malayan Colleges Inc., Trustee • Philippine Long Distance Telephone Company, Director • sunlife grepa Financial, inc., director
alfonso t. Yuchengcodirector
see page 5.
MalaYan insurance coMpanY, inc.
Board of Directors
Jose paolo Y. abayadirector
• Malayan insurance company, inc., chief operating officer and Director • Hexagon Lounge, President
cesar e.a. viratadirector
• Rizal Commercial Banking Corp., Corporate ViceChairman and Director • rcbc savings bank, inc., director • rcbc Realty Corporation, Director • rcbc Forex brokers Corporation, Chairman • rcbc Land, Inc., President • rcbc International Finance, Ltd. (Hong Kong), Director • Pacific Fund, Inc., Chairman • Bankard, Inc., Chairman • Malayan Colleges, Inc., Trustee • Ygc corporate services, inc., director • AY Foundation, Inc., Trustee • Yuchengco Center, Inc., Trustee • Yuchengco Museum, Trustee • Great Life Financial Assurance Corporation, Director • Luisita Industrial Park Corporation, Director • Niyog Property Holdings, Inc., director
armando M. Medinaindependent director
• Rizal Commercial Banking Corporation, Independent Director • rcbc savings bank, independent director • rcbc Capital Corporation, Independent Director • Malayan Insurance Company, Inc., Independent Director • Malayan colleges, inc., independent trustee

136
Bankers assurance corporation the First nationwide assurance corporation
Board of Directors
antonio M. rubincHairperson
raul B. tandirector
edmundo l. Bunyiindependent director
herminia s. Jacintoindependent director
alma p. peñalosadirector
Jose Martin a. Morentedirector
Joselito c. Bantayandirector
Yvonne s. YuchengcocHairperson
antonio M. rubindirector
antonio G. puyatindependent director
Michele Marie Y. deedirector
annabelle s. Yuchengcodirector
edmundo l. Bunyiindependent director
alma p. peñalosadirector
• REnumERation and nomination committEE: edmundo l. bunyi, antonio M. rubin, alma p. peñalosa
• audit committEE: Herminia s. Jacinto, edmundo l. bunyi
• REnumERation and nomination committEE: edmundo l. bunyi, Michele Marie Y. dee, antonio M. rubin
• audit committEE: antonio g. puyat, edmundo l. bunyi

annual report 2014 137
continuing our timeless excellence
Principal OfficersMico equities, inc.
aMB. alFonso t. YuchenGcochairman
samuel v. torrescorporate secretary
not in photo: Michele Marie Y. dee, treasurer
Jose Martin a. Morenteassistant corporate secretary
annual report 2014 137
Yvonne s. Yuchengcopresident

138
Yvonne s. Yuchengcopresident
Jose paolo Y. abayachief operating officer
antonio M. rubin executive vice president
cecille v. huidemsenior vice president
Joselito c. Bantayansenior vice president
Principal OfficersMalaYan insurance coMpanY, inc.
helen Y. deechairperson

annual report 2014 139
continuing our timeless excellence
rogelio M. noche, Jr.second vice president
daisuke Fujiisenior vice president
Maria Beatriz a. adversalosecond vice president
kazunori tsujisecond vice president
Ma. vicente lucia alcidFirst vice president
naoki YamadaFirst vice president
raul B. tan First vice president
alegria r. castrovice president ii
Jose Martin a. Morentevice president
katsuki takaradavice president
Joanne s.p. dela cruzvice president
Martin d. Yuchiocovice president
Marissa h. dela cruzvice president
arlene q. calimagvice president
vladimir s. dizonvice president
Frederick t. pineda First vice president
Principal Officers
samuel v. torrescorporate secretary

140
Principal Officersthe First nationwide assurance corporation
Yvonne s. Yuchengcochairperson
Jose Martin a. Morenteassistant corporate secretary
antonio M. rubin president
Frederick t. pineda treasurer
Jose Mari prats vice president
samuel v. torrescorporate secretary

annual report 2014 141
continuing our timeless excellence
Principal OfficersBankers assurance corporation
Jose Martin a. Morenteassistant corporate secretary
antonio M. rubin chairman
Frederick t. pineda treasurer
samuel v. torrescorporate secretary
raul B. tan president

142
Directory of Subsidiaries, Offices and Branches
MalaYan insurance coMpanY, inc. Yuchengco tower, 500 quintin paredes street 1006 binondo, Manila p. o. box 3389 - Manila tel. no. : (632) 242 8888 website : www.malayan.com www.malayanonline.com www.facebook.com/MalayaninsurancepH e-mail : [email protected]
bankers assurance corporation 6th Floor, rm. 604, doña Felisa syjuco building remedios street corner taft avenueMalate, Manilatel. nos. : (632) 567 4678 / 567 4676 telefax no. : (632) 567 4675 website : www.bankersassurance.com.ph e-mail : [email protected]
The First nationwide assurance corporation 4th Floor, Yuchengco tower ii l.p. leviste street corner gallardo street salcedo village, 1227 Makati city tel. nos. : (632) 843 8080 local 213, 246 Fax no. : (632) 843 6168 / 843 0611 website : www.fnac.com.ph e-mail : [email protected]
ForeiGn suBsidiaries
MalaYan international insurance corp. ltd. (Hong kong brancH) unit a, 18th Floor, li dong building 9 li Yuen street, east central, Hong kong tel. nos. : (852) 2525 2137 / (852) 2525 8820 Fax no. : (852) 2167 7422 e-mail : [email protected]
MalaYan insurance coMpanY (Hong kong) ltd. unit a, 18th Floor, li dong building 9 li Yuen street, east central, Hong kong tel. nos. : (852) 2525 2137 / (852) 2525 8820 Fax no. : (852) 2167 7422 e-mail : [email protected]
ForeiGn aGencY
greecegenka insurance coMpanY s.a. 320 sygrou avenue gr-1767b kallithea, athens, greece tel. nos. : (30) 210 527 8500 / 210 900 6950 Fax nos. : (30) 210 527 8506 / 210 923 7768 email : [email protected]
representative oFFice
cHina c/o Mr. cai zhichao, xiamen representative unit 806, soHo building 619 Hubin nan road, xiamen, china 361004 tel. no. : (86592) 504 6168 Fax no. : (86592) 504 6178 e-mail : [email protected]
Metro Manila sales oFFices
alabang 2nd Floor, rcbc building, tierra nueva subd. zapote road, alabang, Muntinlupa tel. nos. : (632) 850 7659 / 842 0234 telefax no. : (632) 842 0228 cubao 8th Floor, room 8006 aurora tower araneta center, cubao, quezon city tel. nos. : (632) 912 9367 / 911 3827 / 421 4526 telefax no. : (632) 911 3825
Makati 5th Floor, Yuchengco tower ii l.p. leviste street corner gallardo streetsalcedo village, 1227 Makati city tel. nos. : (632) 843 8080 / 628 8502 / 628 8506 Fax no. : (632) 6289 8514 to 15 / 628 8511 Marikina unit 18/19 Marikina east centre building 83 gil Fernando avenuesan roque, Marikina city tel. no. : (632) 646 9788 telefax no. : (632) 369 7112
reGional oFFices
upper nortH luzon 2nd Floor, rcbc building a.b. Fernandez avenue, 2400 dagupan city tel. no. : (075) 515 5811 telefax no. : (075) 522 0928
lower nortH luzon 3rd Floor, rcbc savings bank building Maharlika Highway corner paco roman street 3100 cabanatuan city, nueva ecija tel. no. : (044) 463 9683 telefax no. : (044) 463 0910 soutH luzon ground Floor, rcbc building national Highway corner dolor street, barangay 1 crossingcalamba, lagunatel. no. : (049) 545 1162 telefax no. : (049) 545 0955
VISAYAS & MINDANAO 2nd Floor, great pacific life buildingFuente osmeña, rotonda, 6000 cebu citytel. nos. : (032) 253 9384 / 253 4801 Fax no. : (032) 255 3009
provincial oFFices
luZon baguio citY 3rd Floor, rcbc building session road, 2600 baguio city tel. nos. : (074) 442 6300 / 446 0026 Fax no. : (074) 442 7247
baliwag (bulacan) 321 2nd Floor, J & U Building benigno s. aquino avenue, baliwag, bulacan telefax no. : (044) 766 6387 cabanatuan citY 3rd Floor, rcbc savings bank building Maharlika Highway corner paco roman street 3100 cabanatuan city tel. no. : (044) 463 9683 telefax no. : (044) 463 0910

annual report 2014 143
continuing our timeless excellence
calaMba (laguna)ground Floor, rcbc buildingnational Highway corner dolor streetbarangay 1 crossing, calamba, lagunatel. no. : (049) 545 1162telefax no. : (049) 545 0955
cavite (imus)room 1-b ground Floor, Melta buildingvilla nicasia iii villageemilio aguinaldo Highway, imus, cavitetel. no. : (046) 471 6613telefax no. : (046) 471 8687
dagupan citY2nd Floor, rcbc buildinga.b. Fernandez avenue, 2400 dagupan citytel. no. : (075) 515 5811telefax no. : (075) 522 0928
isabela2nd Floor, stp ii buildingdistrict ii, cauayan city, isabelatel. no. : (078) 652 0063telefax no. : (078) 652 0092
laoag citY2nd Floor, cristina buildinggen. a. luna street, 2900 laoag citytel. no. : (077) 772 0015telefax no. : (077) 771 4806
la unioncJ arch building (pbcom bank)quezon avenue, san Fernando city, la uniontel. no. : (072) 607 0066 / 607 8419telefax no. : (072) 607 8419
legazpi citY2nd Floor, Metrobase buildinglandco business park, bitano, legazpi, 4500tel. no. : (052) 480 7523telefax no. : (052) 820 4119
lipa citYground Floor, unit 17 k-pointe commercial centerayala Highway, lipa citytel. no. : (043) 756 6951telefax no. : (043) 756 6952
naga citYground Floor, rl buildingpanganiban drive, naga citytelefax no. : (054) 473 5050
olongapo (subic)ground Floor, building 789subic international Hotel, sta. rita roadsubic bay Freeport zone, olongapotel. no. : (047) 252 3255 / 252 3256telefax no. : (047) 252 3256
paMpanga2/F Hiz-san building, Mcarthur Highwaybrgy. dolores, san Fernando city, pampangatel. no. : (045) 961 0042telefax no. : (045) 963 1027
san pablo (laguna)Maharlika Highway, brgy. san rafaelsan pablo city, 4000 lagunatel. nos. : (049) 562 5788 / 562-3655Fax no. : (049) 562 0181
tarlac2nd Floor, rm. 205 Jaral buildingcorners Juan luna street andMcarthur Highway, tarlac city, tarlactelefax no. : (045) 982 2748
tuguegarao citY2nd Floor, rcbc building, gomez streetcorner bonifacio street, tuguegarao citytelefax no. : (078) 844 1393
visaYas area
bacolod citY2nd Floor, Malayan House buildinglacson corner 3rd street, 6100 bacolod citytel. no. : (034) 434 6566 / 434 6567telefax no. : (034) 434 6567
cebu citY2nd Floor, grepalife buildingFuente osmeña rotonda, 6000 cebu citytel. nos. : (032) 253 9384 / 253 4801Fax no. : (032) 255 3009
duMaguete citY2/F rcbc savings buildingreal street corner san Juan street,dumaguete city, negros orientaltelefax no. : (035) 420 5075
iloilo citY2nd Floor, rcbc building, J.M. basa streetcorner arsenal street, 5000 iloilo citytel. no. : (033) 335 0763 / 335 0302Fax no. : (033) 335 0406
palawan2nd Floor, rcbc buildingrizal avenue corner Junction ipuerto princesa city, 5300 palawantelefax no. : (048) 434 4360
tagbilarandoor # 4, 2nd Floor, rcbc buildingcpg avenue, tagbilaran city, boholtelefax no. : (038) 235 4551
Mindanao area
cagaYan de oroground Floor, Malayan House, velez cornernacalaban streets, 9000 cagayan de oro citytel. no. : (088) 856 1685telefax no. : (088) 856 1686
davao citYground Floor, Malayan Housekm. 6, J.p. laurel lanang, 8000 davao citytel. nos. : (082) 234 -1790 / 235 2476 / 234 1765Fax no. : (082) 234 1766
davao citY (satellite office)ground Floor, rcbc buildingpalma gil corner c.M. recto streetdavao citytel. no. : (082) 224 6887telefax no. : (082) 224 6889
general santos2nd Floor, rcbc savings buildingpioneer avenue, 9500 general santos citytel. no. : (083) 552 2225telefax no. : (083) 552 3580
taguM (davao del norte)ground Floor, rcbc buildingpioneer avenue corner quirante streettagum, davao del nortetel. no. : (084) 655 6326telefax no. : (084) 655 9524
zaMboanga citYground Floor, Ypc buildingveterans avenue7000 zamboanga citytel. no. : (062) 991 2779telefax no. : (062) 991 2296

144
Products and Services
• aviation - Hull all risks / Hull war - Third party/ passenger
legal liability - crew personal accident
• EnginEERing - contractor’s all risk - erection all risk - electronic equipment - Machinery breakdown - civil engineering
completed risk - boiler pressure vessel - special risk/ equipment
Floater - deterioration of stock
following Machinery breakdown
• FiRE - business interruption - commercial all risk - Fire and lightning,
including allied perils - industrial all risk - business protect - Home protect plus - Mybiz - MyHome - Ygc-epi - sabotage and terrorism
• maRinE - Marine cargo - Marine Hull Yacht - Yacht and pleasurecraft - Fine Arts, Jewellery &
specie (FaJs) - stock Throughput (stp)
• miscELLanEous casualtY
- bankers blanket bond/computer crime
- Burglary &
Housebreaking - comprehensive general
liability - comprehensive
dishonesty disappearance and destruction
- employers liability - excess auto liability - Errors & Omissions - Fidelity guarantee - Foresight directors
& Officers Liability insurance
- Med protect - Money in transit - Money, Securities &
payroll - product’s liability - professional liability
(for contractors, design professionals and consultants, educators, lawyers and bpo’s
- comprehensive Homeowners insurance
- comprehensive personal liability
- golfers’ comprehensive insurance
- comprehensive cardholders protection insurance
- purchase protection insurance
- plate glass insurance - Hole in one
(tournament only) - atM card protect - credit protect plus • motoRcaR - dealership programs Honda insurance isuzu insurance toyota insurance
- My car - Motomax - standard Motorcar insurance private vehicle commercial vehicle Motorcyle land transportation operators
• PERsonaL accidEnt - bayan asenso
Microinsruance products - crisis cover - credit protect/
unemployment - daily Hospitalization
income benefit - diplomax - executive plan - Family plan - Family protect - income protect - inflation Free plus plan
(iFc) - i4u greeting cards - Med rescue - MyFamily - My wellness - pampamilya insurance
plan - pinoy assist compulsory
oFw insurance - rajah personal accident
insurance - student personal
accident insurance - tip domestic - tip global - todo asenso - tuition Fee protect - travelmaster - travel sure - vessel personal accident
• Bonds - administrator’s bond - attachment bond - attachment bond (to
lift) - bidder’s bond - boi omnibus bond - broker’s bond - contract growers bond - dealership bond - execution pending
appeal bond - Fidelity bond - Firearm bond - Forestry bond (internal
revenue) - Forestry bond (bureau
of Forestry) - guaranty bond
(Maintenance warranty) - guardians bond - Haulers bond - Heirs bond - immigration bond - indemnity bond (3rd
party sheriffs) - injunction bond
(plaintiff) - injunction bond (to lift) - Manufacturer’s official
bond - Miller’s bond - payment bond - performance bond - replevin bond - supersedeas bond - surety bond –
downpayment - surety bond general

annual report 2014 145
continuing our timeless excellence
Products and Services
our visionMalayan equals non-life insurance.
our MissionMalayan guarantees to provide its policyholders the best non-life insurance protection, and fair and prompt settlement of valid claims at all times.
our core valuespassion For eXcellencestriving to be great and not just good; continuously improving results.
sense oF urGencYdoing things fast; taking the initiative to respond to the needs of various stakeholders.
proFessional disciplinewith strong working ethics; deserving of others’ trust and respect; using company resources prudently; acting with fairness and objectivity; being accountable for one’s actions.
teaMworkactively tapping areas of synergy; communicating and collaborating towards shared goals.
loYaltYa good corporate citizen; pursuing corporate interests as one’s own; speaking well of the company and taking pride in its achievements.