ontario power generation reports 2010 first quarter
TRANSCRIPT

May 21, 2010
ONTARIO POWER GENERATION REPORTS 2010 FIRST QUARTER FINANCIAL RESULTS
[Toronto]: Ontario Power Generation Inc. (“OPG” or the “Company”) today reported its financial and operating results for the three months ended March 31, 2010. Net income for the first quarter of 2010 was $143 million compared to a net loss of $9 million for the three months ended March 31, 2009.
Tom Mitchell, President and CEO of OPG, said, "Ontario Power Generation continued to moderate electricity prices in the province while reducing CO2 emissions. The prices we receive for electricity generated from our regulated assets have remained the same since 2008. Further, the prices we received for electricity generated from our unregulated assets declined in the first quarter of this year, compared to the first quarter of 2009."
Mr. Mitchell added, "I am extremely proud of our performance and the reliability of our generating stations during the first quarter of 2010. Our Pickering B station achieved a unit capability factor of 97.5 percent, our hydroelectric fleet continues to achieve availability factors of over 93 percent, and the reliability of our thermal stations improved significantly."
Highlights
Net income for the first quarter of 2010 increased compared to the same quarter in 2009 as a result of an increase in earnings from the Used Fuel and Decommissioning Segregated Funds (together “Nuclear Funds”) and the recognition of a regulatory asset related to tax losses (“Tax Loss Variance Account”) established as a result of a 2009 OEB decision. The increase was partially offset by a decrease in gross margin related to lower average sales prices for production from OPG’s unregulated generation segments and lower generation.
Total electricity generated during the first quarter of 2010 was 24.5 TWh compared to 25.6 TWh during the first quarter of 2009. Production from the thermal stations declined by 0.5 TWh during the first quarter of 2010 compared to the same period in 2009 primarily due to lower primary demand and a decrease in net exports, partially offset by a decrease in electricity generation from other generators in Ontario. Unregulated hydroelectric generation decreased by 0.4 TWh primarily due to lower water levels. A decrease in nuclear generation of 0.3 TWh was primarily due to an increase in planned outage days at the Darlington nuclear generating station and an increase in unplanned outage days at the Pickering A nuclear generating station.

2
The capability factor at the Darlington nuclear station decreased in the first quarter of 2010 due to the higher number of planned outage days compared to 2009. The capability factors at the Pickering A and B nuclear stations increased in the first quarter of 2010 due to a lower number of planned outage days, as unit outages in 2010 have been scheduled to coincide with a second quarter Vacuum Building Outage. The availability of OPG’s regulated and unregulated hydroelectric generating stations remained at high levels. The reliability of the thermal generating fleet improved significantly as a result of fewer unplanned outage days at the Nanticoke and Lambton coal-fired generating stations during the first quarter of 2010 compared to the same quarter in 2009, which reflected the operating and maintenance strategies of the Thermal business segment.
Segmented Financial Results
Income before interest and income taxes from OPG’s electricity generation business segments was $232 million for the three months ended March 31, 2010 compared to $243 million for the same quarter in 2009. The reduction in income was primarily due to lower market prices for generation from OPG’s unregulated thermal and hydroelectric generating stations, lower generation volume, restructuring costs related to the pending closure of four coal-fired units expected in October 2010, and higher fuel prices. The decrease was partially offset by the recognition of a regulatory asset related to the Tax Loss Variance Account, lower outage and maintenance activities, and revenue related to a contingency support agreement with the Ontario Electricity Financial Corporation. The contingency support agreement is intended to provide for the continued reliability and availability of OPG’s Lambton and Nanticoke generating stations.
The Regulated – Nuclear Waste Management business segment incurred a loss before interest and income taxes of $24 million during the first quarter of 2010 compared to a loss before interest and income taxes of $164 million during the same period in 2009. The improvement during the first quarter of 2010 compared to the same quarter in 2009 resulted from higher returns on the Nuclear Funds primarily due to improvements in valuation levels of global financial markets. The favourable impact of these factors was partially offset by the impact of a variance account approved by the OEB related to the earnings associated with the stations leased to Bruce Power, since a portion of the earnings from the Nuclear Funds are related to these stations.
Generation Development
OPG is undertaking a number of generation development projects aimed at significantly contributing to Ontario’s long-term electricity supply requirements. The status of these capacity expansion or life extension projects is as follows:
Nuclear
OPG continues with two initiatives that were underway prior to the Government of Ontario’s suspension of the competitive Request for Proposal process to procure two new nuclear reactors planned for the Darlington site – the environmental assessment process and obtaining a site preparation licence. In November 2009, the Joint Review Panel (“JRP”) announced the start of the six-month public review period for the Environmental Impact Statement (“EIS”) and the “Licence to Prepare Site”. On February 3, 2010 and March 29, 2010, and subsequently on April 28,

3
2010, the JRP requested additional information in support of the EIS and the application for the “Licence to Prepare Site”. OPG has responded to the first two requests and is currently working to complete the response to the third request.
In February 2010, OPG announced its decision to commence the detailed planning phase for the refurbishment of the Darlington nuclear generating station. The refurbishment is expected to extend the service life of the Darlington station by approximately 30 years. In the detailed planning phase, all regulatory work will be completed including the Environmental Assessment (“EA”), the Integrated Safety Review, and the Integrated Improvement Plan. As well, OPG will complete engineering and detailed project planning, establish the project management organization, develop required infrastructure, and prepare a detailed cost and schedule estimate for project approval by mid-2014, with construction estimated to start in 2016. In April 2010, OPG announced that it was proceeding, in conjunction with the Municipality of Clarington and Durham Region, with site preparation and servicing for a proposed 250,000 square foot multi-purpose building, on OPG-owned land in the Clarington Energy Business Park adjacent to the Darlington nuclear generating station.
In February 2010, OPG announced its decision to continue the safe and reliable operation of OPG’s Pickering B nuclear generating station. Pickering B nuclear generating units are currently estimated to reach their nominal end of life between 2014 and 2016. OPG is undertaking a coordinated set of initiatives to evaluate the opportunity to continue safe and reliable operations of the station for an additional four to six years. As part of a regulatory commitment to the Canadian Nuclear Safety Commission, OPG submitted the Pickering B Operations Plan in March 2010, describing strategies for the continued safe and reliable operation of Pickering B until its end of life.
Hydroelectric
Construction activities to replace three existing hydroelectric generating stations on the Upper Mattagami River and the Hound Chute generating station on the Montreal River continued during the first quarter of 2010. As part of the redevelopment, the Wawaitin generating station was removed from service in March 2010, reducing OPG’s in-service generating capacity by 11 MW. Upon completion of the project, the total installed capacity of the four stations will increase from 23 MW to 44 MW. The stations are expected to be in service by April 2011, which is within the approved schedule. The project costs are expected to be within the approved budget of $300 million.
The Niagara tunnel boring machine had advanced 6,485 metres, which is 64 percent of the tunnel length, as of March 31, 2010. Installation of the lower one-third of the permanent concrete lining has progressed 4,550 metres. Restoration of the circular cross-section of the tunnel before installation of the upper two-thirds of the concrete lining has progressed 1,000 metres. Installation of the upper two-thirds of the concrete lining is scheduled to begin by the end of the second quarter. The project is expected to be completed by the approved in-service date of December 2013. The project costs are expected to be within the revised approved budget of $1.6 billion.

4
Project activities for the Lower Mattagami project, which will increase the capacity of four stations by 438 MW, continued during the first quarter of 2010. In January 2010, OPG entered into a design-build agreement for the project, and in March 2010, the Federal Minister of the Environment approved the EA as required by the Canadian Environmental Assessment Act. OPG is planning to have project financing in place, and is working with the Ontario Power Authority (“OPA”) to finalize and execute a Hydroelectric Energy Supply Agreement by the end of the second quarter of 2010. Pursuant to the Province of Ontario’s EA, the Ministry of Environment formed the Mattagami Extension Coordinating Committee in May 2010. Construction activities are expected to commence by the end of the second quarter of 2010.
Thermal
In September 2009, together with the Ministry of Energy and Infrastructure, OPG announced its decision to close four coal-fired units – two units at the Lambton generating station and two units at the Nanticoke generating station. The unit closures are expected to occur in October 2010.
In March 2010, OPG issued a request for indicative pricing to potential suppliers of wood-based biomass fuel for the Atikokan generating station. OPG requires cost recovery agreements with the OPA for conversion of the units and the electricity generated post-conversion before seeking Board of Directors approval to proceed with unit conversions. OPG is seeking a directive from the Ministry of Energy and Infrastructure to the OPA to negotiate a cost recovery agreement with OPG. By the end of 2014, all units currently burning coal will be either converted to alternative fuels or shut down.
The Lennox generating station operated under a Reliability Must Run (“RMR”) contract with the Independent Electricity System Operator as approved by the OEB, from October 1, 2008 to September 30, 2009. On March 30, 2010, the OPA approved an energy supply contract, with terms similar to the RMR contract for the period from October 1, 2009 to December 31, 2010. The contract was subsequently executed in April 2010.

5
FINANCIAL AND OPERATIONAL HIGHLIGHTS
Three Months Ended March 31
(millions of dollars – except where noted) 2010 2009 Earnings Revenue after revenue limit rebate 1,444 1,481 Fuel expense 248 261 Gross margin 1,196 1,220
Operations, maintenance and administration expense 726 742 Depreciation and amortization 167 178 Accretion on fixed asset removal and nuclear waste
management liabilities 165 159
(Earnings) losses on nuclear fixed asset removal and nuclear waste management funds
(141) 6
Restructuring 25 - Other net expenses 18 26 Income before interest and income taxes 236 109 Net interest expense 45 39 Income tax expenses 48 79 Net income (loss) 143 (9)
Cash flow Cash flow provided by operating activities 218 41
Income (loss) before interest and income taxes Generating segments 232 243 Nuclear Waste Management segment (24) (164) Other segment 28 30 Total income before interest and income taxes 236 109
Electricity Generation (TWh) Regulated – Nuclear 12.0 12.3 Regulated – Hydroelectric 4.8 4.7 Unregulated – Hydroelectric 3.9 4.3 Unregulated – Thermal 3.8 4.3 Total electricity generation 24.5 25.6
Average electricity sales price (¢/kWh) Regulated – Nuclear 5.4 5.5 Regulated – Hydroelectric 3.7 3.6 Unregulated – Hydroelectric 3.5 4.4 Unregulated – Thermal 3.7 4.8 OPG average sales price 4.5 4.8
Nuclear unit capability factor (percent) Darlington 82.4 99.9 Pickering A 67.3 42.4 Pickering B 97.5 84.9
Availability (percent) Regulated – Hydroelectric 93.5 94.2 Unregulated– Hydroelectric 93.8 95.5
Equivalent forced outage rate (percent) Unregulated – Thermal 2.6 12.1

6
Ontario Power Generation Inc. is an Ontario-based electricity generation company whose principal business is the generation and sale of electricity in Ontario. Our focus is on the efficient production and sale of electricity from our generation assets, while operating in a safe, open and environmentally responsible manner.
Ontario Power Generation Inc.’s unaudited consolidated financial statements and Management’s Discussion and Analysis as at and for the three months ended March 31, 2010, can be accessed on OPG’s Web site (www.opg.com), the Canadian Securities Administrators’ Web site (www.sedar.com), or can be requested from the Company.
For further information, please contact: Investor Relations 416-592-6700
1-866-592-6700 [email protected]
Media Relations 416-592-4008 1-877-592-4008
-30-

2010 FIRST QUARTER REPORT CONTENTS MANAGEMENT’S DISCUSSION AND ANALYSIS Forward-Looking Statements 2The Company 2Highlights 4Vision, Core Business and Strategy 9Ontario Electricity Market Trends 14Business Segments 14Key Generation and Financial Performance Indicators 15Discussion of Operating Results by Business Segment 15 Regulated – Nuclear Generation Segment 16 Regulated – Nuclear Waste Management Segment 17 Regulated – Hydroelectric Segment 18 Unregulated – Hydroelectric Segment 19 Unregulated – Thermal Segment 21 Other 22 Net Interest Expense 23 Income Taxes 23Liquidity and Capital Resources 24Balance Sheet Highlights 26Changes in Accounting Policies and Estimates 27Conversion to International Financial Reporting Standards 27Risk Management 30Internal Controls over Financial Reporting and Disclosure Controls 33Quarterly Financial Highlights 34Supplemental Earnings Measures 34 UNAUDITED INTERIM CONSOLIDATED FINANCIAL STATEMENTSUnaudited Interim Consolidated Financial Statements 35Notes to the Unaudited Interim Consolidated Financial Statements 40
2
ONTARIO POWER GENERATION INC. MANAGEMENT’S DISCUSSION AND ANALYSIS This Management’s Discussion and Analysis (“MD&A”) should be read in conjunction with the unaudited interim consolidated financial statements and accompanying notes of Ontario Power Generation Inc. (“OPG” or the “Company”) as at and for the three months ended March 31, 2010. For a complete description of OPG’s corporate strategies, risk management, corporate governance, related parties transactions and the effect of critical accounting policies and estimates on OPG’s results of operations and financial condition, this MD&A should also be read in conjunction with OPG’s audited consolidated financial statements, accompanying notes, and MD&A as at and for the year ended December 31, 2009. Certain of the 2009 comparative amounts have been reclassified to conform to the 2010 presentation. OPG’s consolidated financial statements are prepared in accordance with Canadian generally accepted accounting principles (“GAAP”) and are presented in Canadian dollars. This MD&A is dated May 20, 2010. FORWARD-LOOKING STATEMENTS The MD&A contains forward-looking statements that reflect OPG’s current views regarding certain future events and circumstances. Any statement contained in this document that is not current or historical is a forward-looking statement. OPG generally uses words such as “anticipate”, “believe”, “foresee”, “forecast”, “estimate”, “expect”, “schedule”, “intend”, “plan”, “project”, “seek”, “target”, “goal”, “strategy”, “may”, “will”, “should”, “could” and other similar words and expressions to indicate forward-looking statements. The absence of any such word or expression does not indicate that a statement is not forward-looking. All forward-looking statements involve inherent assumptions, risks and uncertainties, including those set out under the heading Risk Management, and therefore, could be inaccurate to a material degree. In particular, forward-looking statements may contain assumptions such as those relating to OPG’s fuel costs and availability, asset performance, nuclear decommissioning and waste management, closure or conversion of coal-fired generating stations, refurbishment of existing facilities, development and construction of new facilities, pension and other post employment benefit (“OPEB”) obligations, income taxes, spot electricity market prices, the ongoing evolution of the Ontario electricity industry, proposed new legislation, conversion to International Financial Reporting Standards (“IFRS”), environmental and other regulatory requirements, health, safety and environmental developments, business continuity events, the weather, the developments with respect to third-party Asset-Backed Commercial Paper (“ABCP”), and the impact of regulatory decisions by the Ontario Energy Board (“OEB”). Accordingly, undue reliance should not be placed on any forward-looking statement. The forward-looking statements included in this MD&A are made only as of the date of this MD&A. Except as required by applicable securities laws, OPG does not undertake to publicly update these forward-looking statements to reflect new information, future events or otherwise. THE COMPANY OPG is an Ontario-based electricity generation company whose principal business is the generation and sale of electricity in Ontario. OPG’s focus is on the efficient production and sale of electricity from its generating assets, while operating in a safe, open and environmentally responsible manner. OPG was established under the Business Corporations Act (Ontario) and is wholly owned by the Province of Ontario (the “Province”). As at March 31, 2010, OPG’s electricity generating portfolio had an in-service capacity of 21,720 megawatts (“MW”). OPG’s electricity generating portfolio consists of three nuclear generating stations, five thermal generating stations, 65 hydroelectric generating stations, of which four are being redeveloped, and two wind power turbines. In addition, OPG and TransCanada Energy Ltd. co-own the Portlands Energy Centre (“PEC”) gas-fired combined cycle generating station. OPG, ATCO Power Canada Ltd., and ATCO Resources Ltd. co-own the Brighton Beach gas-fired combined cycle generating station. OPG also owns two other nuclear generating stations, which are leased on a long-term basis to
3
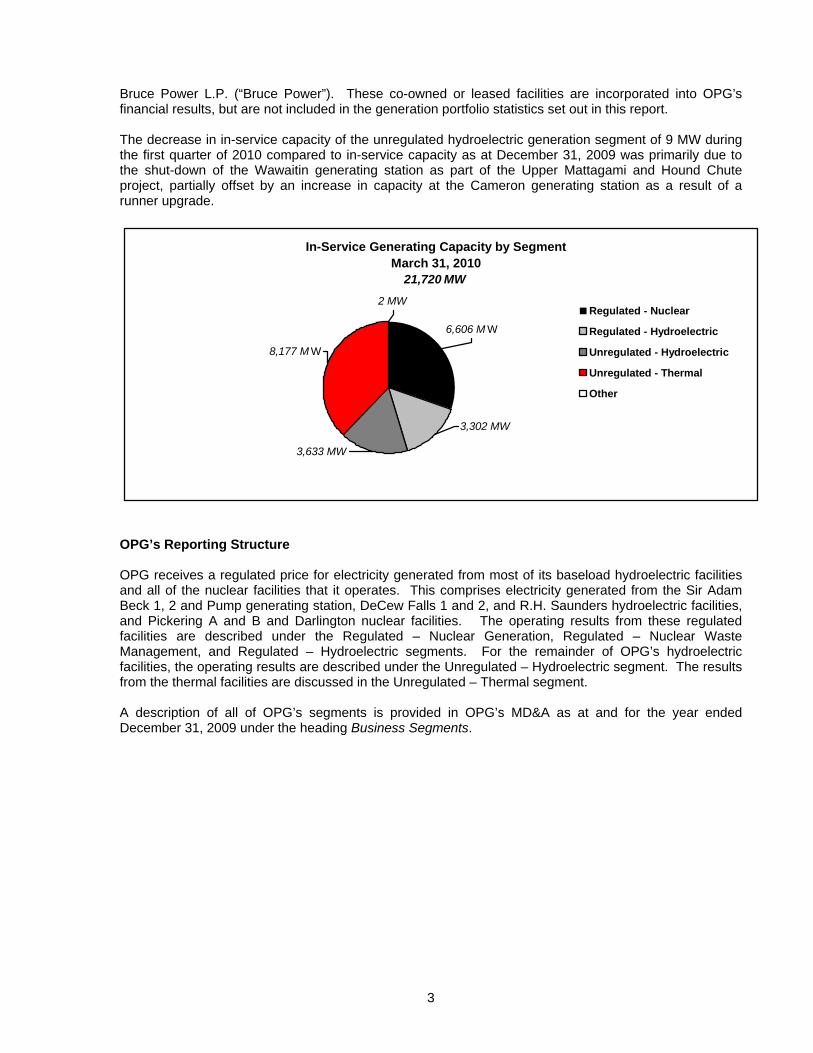
Bruce Power L.P. (“Bruce Power”). These co-owned or leased facilities are incorporated into OPG’s financial results, but are not included in the generation portfolio statistics set out in this report. The decrease in in-service capacity of the unregulated hydroelectric generation segment of 9 MW during the first quarter of 2010 compared to in-service capacity as at December 31, 2009 was primarily due to the shut-down of the Wawaitin generating station as part of the Upper Mattagami and Hound Chute project, partially offset by an increase in capacity at the Cameron generating station as a result of a runner upgrade.
In-Service Generating Capacity by Segment March 31, 2010
21,720 MW
3,302 MW
8,177 M W
3,633 MW
6,606 M W
2 MW Regulated - Nuclear
Regulated - Hydroelectric
Unregulated - Hydroelectric
Unregulated - Thermal
Other
OPG’s Reporting Structure OPG receives a regulated price for electricity generated from most of its baseload hydroelectric facilities and all of the nuclear facilities that it operates. This comprises electricity generated from the Sir Adam Beck 1, 2 and Pump generating station, DeCew Falls 1 and 2, and R.H. Saunders hydroelectric facilities, and Pickering A and B and Darlington nuclear facilities. The operating results from these regulated facilities are described under the Regulated – Nuclear Generation, Regulated – Nuclear Waste Management, and Regulated – Hydroelectric segments. For the remainder of OPG’s hydroelectric facilities, the operating results are described under the Unregulated – Hydroelectric segment. The results from the thermal facilities are discussed in the Unregulated – Thermal segment. A description of all of OPG’s segments is provided in OPG’s MD&A as at and for the year ended December 31, 2009 under the heading Business Segments.

4
HIGHLIGHTS Overview of Results This section provides an overview of OPG’s unaudited interim consolidated operating results. A detailed discussion of OPG’s performance by reportable segment is included under the heading, Discussion of Operating Results by Business Segment. Three Months Ended
March 31 (millions of dollars) 2010 2009 Revenue
Revenue before revenue limit rebate 1,444 1,509 Revenue limit rebate - (28) 1,444 1,481 Fuel expense 248 261 Gross margin 1,196 1,220
Expenses Operations, maintenance and administration 726 742 Depreciation and amortization 167 178 Accretion on fixed asset removal and nuclear waste management
liabilities 165 159
(Earnings) losses on nuclear fixed asset removal and nuclear waste management funds
(141) 6
Restructuring 25 - Other net expenses 18 26 960 1,111 Income before interest and income taxes 236 109 Net interest expense 45 39 Income tax expense 48 79 Net income (loss) 143 (9) Electricity production (TWh) 24.5 25.6 Cash flow
Cash flow provided by operating activities 218 41 Net income for the three months ended March 31, 2010 was $143 million compared to a net loss of $9 million for the same period in 2009, an increase of $152 million. Income before income taxes for the three months ended March 31, 2010 was $191 million compared to $70 million for the same period in 2009, an increase of $121 million.

5
The following is a summary of the factors impacting OPG’s results for the three months ended March 31, 2010 compared to results for the same period ended in 2009, on a before-tax basis: Regulated (millions of dollars – before tax)
Electricity Generation Segments1
Nuclear Waste Management
Segment
Other2
Total Income (loss) before income taxes for the three months ended March 31, 2009
243 (164) (9) 70
Changes in gross margin: Change in electricity sales price after revenue limit rebate
Regulated generation segments (4) - - (4) Unregulated generation segments (73) - - (73)
Change in electricity generation by segment: Regulated – Nuclear Generation (13) - - (13) Regulated – Hydroelectric 2 - - 2 Unregulated – Hydroelectric (17) - - (17)
Increase in revenue related to contingency support agreement for the Nanticoke and Lambton generating stations
44 - - 44
Impact of regulatory variance accounts 153 - - 153 Increase in fuel price and other fuel related costs (20) - - (20) (Decrease) increase in non-electricity generation revenue (99) 1 4 (94) Other changes in gross margin 1 - (3) (2) (26) 1 1 (24) Changes in operations, maintenance and administration (“OM&A”) expenses:
Lower expenditures related to decrease in outage and maintenance activities at OPG’s nuclear and thermal generating stations
45 - - 45
Increase in pension and OPEB costs (18) (1) (1) (20) Other changes in OM&A (10) - 1 (9)
17 (1) - 16 Increase in earnings from the Nuclear Funds - 293 - 293 Impact of the regulatory asset related to earnings from the Nuclear Funds
associated with stations on lease to Bruce Power - (146) - (146)
Decrease in depreciation and amortization expenses 16 - (5) 11 Increase in expense due to restructuring charges (25) - - (25) Other changes 7 (7) (4) (4) Income (loss) before income taxes for the three months ended March 31, 2010
232
(24)
(17)
191
1 Electricity generation segments include results of the Regulated – Nuclear Generation, Regulated – Hydroelectric, Unregulated – Hydroelectric, and Unregulated – Thermal segments.
2 Other includes results of the Other category in OPG’s segmented statement of income, inter-segment eliminations, and net interest expense.
Income before interest and income taxes from OPG’s electricity generation business segments was $232 million for the three months ended March 31, 2010 compared to $243 million for the same quarter in 2009. The Regulated – Nuclear Waste Management business segment incurred a loss before interest and income taxes of $24 million in the first quarter of 2010 compared to $164 million during the same period in 2009. Earnings from the electricity generation business segment for the first quarter of 2010 were unfavourably impacted by a decrease in gross margin of $26 million compared to the same period in 2009. This decrease was primarily due to a decrease in the average sales price in the unregulated generation segments due to lower Ontario spot electricity market prices, and lower generation at OPG’s unregulated hydroelectric and regulated nuclear generating stations. The decrease in gross margin in the electricity generation business segments was partially offset by revenue related to a contingency support agreement established with the Ontario Electricity Financial Corporation (“OEFC”) to provide for the continued reliability and availability of OPG’s Lambton and Nanticoke generating stations. The agreement was put in place to enable OPG to recover the costs of its coal-fired generating stations following implementation of OPG’s carbon dioxide (“CO2”) emissions reduction strategy.

6
The decrease in gross margin in the electricity generation business segments was also partially offset by an increase in revenue of $48 million due to the recognition of a regulatory asset related to the Tax Loss Variance Account. The account was authorized by the OEB’s decision and order issued in May 2009 on OPG’s motion to review, and vary, a portion of the OEB’s 2008 decision establishing current regulatory prices as it pertains to the treatment of tax losses and their use for mitigation. In accordance with the OEB’s decision on the motion, the balance in this variance account was determined based on the difference between regulatory tax losses for the period from April 1, 2005 to March 31, 2008 calculated in accordance with the methodology in the OEB’s 2008 decision and the revenue requirement reduction reflected in current regulated prices. Under the Bruce Power lease agreement (“Bruce Lease”), lease revenue is reduced in each calendar year where the annual arithmetic average of the Hourly Ontario Electricity Price (“Average HOEP”) falls below $30/MWh, and certain other conditions are met. The conditional reduction to revenue in the future, embedded in the terms of the Bruce Lease, is treated as a derivative according to Canadian Institute of Chartered Accountants (“CICA”) Section 3855, Financial Instruments – Recognition and Measurement. Derivatives are measured at fair value and changes in fair value are recognized in the statement of income. As a result of a reduction in expected future Average HOEP prices, the fair value of the derivative liability increased by $95 million for the three months ended March 31, 2010. The increase in the fair value of this derivative is recognized as a reduction to non-electricity generation revenue, offset by the impact of a variance account authorized by the OEB to capture the differences between actual and forecast revenues and costs related to the nuclear generating stations under the Bruce Lease (“Bruce Lease Net Revenues Variance Account”). For the three months ended March 31, 2010, operations, maintenance and administration (“OM&A”) expenses were $726 million compared to $742 million for the same period in 2009. The decrease of $16 million during the first quarter of 2010 compared to the same quarter in 2009 was primarily due to lower outage and maintenance activities at OPG’s nuclear generating stations, and lower project and outage work at the Nanticoke and Lambton coal-fired generating stations due to the pending closure of four coal-fired units expected in October 2010. The decrease in OM&A expense was partially offset by an increase in pension and OPEB costs largely as a result of lower discount rates. Earnings from the Used Fuel Segregated Fund (“Used Fuel Fund”) and the Decommissioning Segregated Fund (“Decommissioning Fund”) (together “Nuclear Funds”) for the three months ended March 31, 2010 were $141 million compared to losses of $6 million in 2009. The earnings from the Nuclear Funds, before the impact of the Bruce Lease Net Revenues Variance Account, were $157 million for the three months ended March 31, 2010 compared to losses of $136 million, an increase of $293 million. The increase in the earnings from the Nuclear Funds was primarily due to improvements in valuation levels of global financial markets, which increased the current market value of the Decommissioning Fund, and higher earnings from the Used Fuel Fund due to a higher Ontario Consumer Price Index (“CPI”), which impacted the guaranteed return on the Used Fuel Fund. During the first quarter of 2010, OPG recorded a reduction to the Bruce Lease Net Revenues Variance Account regulatory asset of $16 million, which reduced the reported earnings from the Nuclear Funds. For the same period in 2009, OPG recorded an increase to the Bruce Lease Net Revenues Variance Account regulatory asset of $130 million, which reduced the reported losses from the Nuclear Funds. Depreciation and amortization expenses for the three months ended March 31, 2010 were $167 million compared to $178 million during the same period in 2009, a decrease of $11 million. The decrease was primarily due to the impact of the Darlington nuclear generating station life extension to 2051, related to OPG’s announcement to commence the definition phase for refurbishment of the station. In September 2009, together with the Ministry of Energy and Infrastructure, OPG announced its decision to close two coal-fired units at each of the Lambton and Nanticoke coal-fired generating stations. The closures are expected to occur in October 2010. Restructuring charges of $25 million were recorded during the three months ended March 31, 2010 due to the recognition of severance costs related to the unit closures. For the three months ended March 31, 2010, income tax expense was $48 million compared to $79 million for the same period in 2009. The decrease in income tax expense was primarily due to a

7
higher proportion of income before taxes coming from the Nuclear Funds, as earnings on the Nuclear Funds are not taxable. In addition, the decrease in income tax expense was also due to a lower income tax component of the Bruce Lease Net Revenues Variance Account. These factors were partially offset by an increase in the tax expense due to the recognition of income related to the Tax Loss Variance Account during the first quarter of 2010. Average Sales Prices The weighted average Ontario spot electricity market price and OPG’s average sales prices from generation paid through the regulated prices and the Ontario market, by reportable electricity segment for the three months ended March 31, 2010 and 2009, were as follows:
Three Months Ended March 31 (¢/kWh) 2010 2009 Weighted average hourly Ontario spot electricity market price 3.4 4.5 Regulated – Nuclear Generation 5.4 5.5 Regulated – Hydroelectric 3.7 3.6 Unregulated – Hydroelectric 3.5 4.4 Unregulated – Thermal 3.7 4.8
OPG’s average sales price 4.5 4.8 The weighted average hourly Ontario spot electricity market price was 3.4¢/kWh for the three months ended March 31, 2010 compared to 4.5¢/kWh for the same period in 2009. The decrease was primarily due to lower market demand, and a stronger Canadian dollar, partially offset by lower generation from nuclear generating stations in Ontario. The decrease in average sales prices for the unregulated segments for the three months ended March 31, 2010 compared to the same period in 2009 was primarily due to the impact of lower Ontario spot electricity market prices. Electricity Generation OPG’s electricity generation for the three months ended March 31, 2010 and 2009, was as follows: Three Months Ended
March 31 (TWh) 2010 2009
Regulated – Nuclear Generation 12.0 12.3 Regulated – Hydroelectric 4.8 4.7 Unregulated – Hydroelectric 3.9 4.3 Unregulated – Thermal 3.8 4.3 Total electricity generation 24.5 25.6 Total electricity generated during the three months ended March 31, 2010 from OPG’s generating stations was 24.5 TWh compared to 25.6 TWh for the first quarter of 2009. The decrease was related to lower electricity generation from OPG’s nuclear, unregulated hydroelectric and thermal generating stations. The decrease in generation from the nuclear generating stations during the first quarter of 2010 compared to the same period in 2009 was primarily due to an increase in planned outage days at the Darlington nuclear generating station and an increase in unplanned outage days at the Pickering A

8
nuclear generating station. There was a decrease in planned outage days at the Pickering A and Pickering B nuclear generating stations for the three months ended March 31, 2010 compared to the same period in 2009, as the required planned outage work will be completed during a Pickering Vacuum Building Outage (“VBO”) which began in April 2010. The decrease in generation from the unregulated hydroelectric stations during the first quarter of 2010 compared to the same quarter in 2009 was primarily due to the impact of lower water flows. The lower generation from OPG’s thermal generating stations was primarily due to the impact of lower primary demand and a decrease in net exports, partially offset by a decrease in electricity generation from other generators in Ontario. OPG’s operating results are impacted by changes in demand resulting from variations in seasonal weather conditions. Heating Degree Days during the three months ended March 31, 2010 decreased compared to the same period in 2009 as a result of warmer than average temperatures. The following table provides a comparison of Heating Degree Days for the three months ended March 31: Three Months Ended
March 31 2010 2009 Heating Degree Days 1 Period 1,731 1,954 Ten-year average 1,866 1,868
1 Heating Degree Days are recorded on days with an average temperature below 180C, and represent the aggregate of the
differences between the average temperature and 180C for each day during the period, as measured at Pearson International Airport in Toronto, Ontario.
Ontario primary electricity demand was 36.6 TWh and 37.6 TWh for the three months ended March 31, 2010 and 2009, respectively. The decrease in demand was primarily due to the mild weather conditions. Cash Flow from Operations Cash flow provided by operating activities for the three months ended March 31, 2010 was $218 million compared to $41 million for the three months ended March 31, 2009. The increase in cash flow of $177 million was primarily due to lower tax installments, lower fuel purchases, a decrease in revenue limit rebate payments with the discontinuance of the revenue limit in the second quarter of 2009, and lower contributions to the Nuclear Funds. The increase was partially offset by lower cash receipts as a result of lower generation revenue. Recent Developments Lennox Generating Station The Lennox generating station operated under a reliability must run (“RMR”) contract with the IESO, as approved by the OEB, for the period October 1, 2008 to September 30, 2009. This contract was justified on the basis of analysis conducted by the IESO that indicated that all four units at the Lennox generating station were required for the purpose of local area reliability during the period. Given an indication from the Ontario Power Authority (“OPA”) that it would require the four units at the Lennox generating station, as documented in the OPA’s preliminary Integrated Power System Plan, OPG continued to operate the facility following the expiry of the RMR contract. On March 30, 2010, the OPA approved an energy supply contract, with terms similar to the RMR contract, for the period from October 1, 2009 to December 31, 2010. The contract was subsequently executed in April 2010. The revenue from the contract was reflected in OPG’s earnings for the three months ended March 31, 2010. OEB Application In the second quarter of 2010, OPG intends to file an application with the OEB for new regulated prices. These regulated prices are applicable to production from OPG’s regulated hydroelectric and nuclear

9
facilities. In the application, OPG will also request approval to recover the balances in the deferral and variance accounts. The application will reflect a revised effective date of March 1, 2011. Thermal Generating Stations Unit Closures In September 2009, together with the Ministry of Energy and Infrastructure, OPG announced its decision to close two coal-fired units at each of the Lambton and Nanticoke coal-fired generating stations. This decision was based on the impact of the CO2 limit, forecast surplus capacity and demand profiles, and the resulting reductions in OM&A expenses beyond 2010. The closures are expected to occur in October 2010. OPG applied to the IESO to de-register the four units and the application was approved in the first quarter of 2010. OPG is conducting discussions with key stakeholders, including the Society of Energy Professionals and the Power Workers’ Union, in accordance with their respective collective bargaining agreements. During the first quarter of 2010, employees at the Lambton and Nanticoke coal-fired generating stations indicated their preferences to either remain at the existing stations, to be redeployed to other OPG sites, or to leave OPG. As determined by the collective bargaining agreements, restructuring costs of $25 million have been recorded during the first quarter of 2010 for those employees who have elected to leave OPG. VISION, CORE BUSINESS AND STRATEGY OPG’s mandate is to cost-effectively produce electricity from its diversified generating assets, while operating in a safe, open, and environmentally responsible manner. OPG’s goal is to be a leader in clean energy generation and to have a major role in leading Ontario’s transition to a more sustainable energy future. OPG is focused on three corporate strategies: performance excellence; generation development; and developing and acquiring talent. Performance Excellence Each of OPG’s business segments and corporate groups exhibit the Company’s commitment to performance excellence in the areas of generation, safety, the environment, and fiscal performance. It is through this focus on performance excellence that OPG is able to efficiently and reliably provide electricity to the Province and deliver value to its Shareholder. Nuclear Generating Assets Performance excellence at OPG’s nuclear generating facilities is defined as generating safe, efficient, reliable and cost effective electricity through dependable performance. This is achieved through the effective execution of work programs and initiatives in the four cornerstones of safety, reliability, human performance and value for money. In April 2010, OPG commenced the planned VBO at the Pickering nuclear generating stations, which requires the shutdown of all six units. Approximately 2,000 workers have augmented station resources to complete the outage work program, which includes the scheduled completion of over 40,000 tasks. Inspection and testing of key components of the negative pressure containment system will be completed, as well as unit inspections and maintenance activities that include pressure tube inspections, steam generator inspections, and turbine, generator and valve maintenance. The VBO is nearing completion. Safe execution of this outage on schedule and within budget is a key strategic focus for OPG in 2010. Hydroelectric Generating Assets The hydroelectric business segments are focused on producing electricity in a safe, reliable and cost-effective and efficient manner. OPG plans to continue to increase the capacity of many of the existing stations over the upcoming years by replacing aging equipment such as turbines, generators, transformers, and other control components with more efficient equipment.
10
OPG completed major equipment overhauls and rehabilitation work at several stations during the first quarter of 2010, including runner upgrades and major overhauls at the Chats Falls and Cameron Falls generating stations. The completion of these outages marks the end of the runner upgrade programs at these two stations. The Chats Falls generating station runner upgrade program, which began in 2003 and included work on all 8 units, has increased energy efficiency by approximately five percent. This is one of the most significant energy increases of all hydroelectric runner upgrades since the program started in the late 1980’s. In the first quarter of 2010, OPG continued work on a number of strategies related to its Aboriginal Relations Policy. The strategies include negotiating past grievance settlements, working with Aboriginal Communities to explore hydroelectric business development opportunities, and developing employment and contracting opportunities, capacity building, and community relations programs. Refer to the discussion under the Generation Development – Lower Mattagami project for work performed with the Aboriginal community. Thermal Generating Assets OPG continues its strategy for its thermal generating stations to ensure that units are available when they are required and to optimize how coal-fired units are offered into the electricity system to reduce equipment damage from frequent starts and stops. OPG is closely managing outage scope and schedule in an effort to reduce maintenance related expenditures, as OPG continues to experience low demand for thermal generation. Environmental Performance During the first quarter of 2010, there were no significant changes to environmental legislation and environmental risks affecting the Company. For the three months ended March 31, 2010, CO2 emissions were 3.8 million tonnes compared to 4.3 million tonnes for the same quarter in 2009. Acid gas (SO2 and NOx) emissions were 15 and 19 gigagrams, for the three months ended March 31, 2010 and 2009, respectively. Emissions were significantly reduced during the first quarter of 2010 compared to the same quarter in 2009 as a result of lower generation from OPG’s coal-fired stations. OPG’s disclosures relating to environmental policies and procedures, and environmental risks are provided in the annual MD&A as at and for the year ended December 31, 2009. Safety OPG is committed to achieving its goal of zero injuries through further development of a strong safety culture and continuous improvement in safety management systems and risk control programs. Maintenance of formal safety management systems based on the British Standard Institution’s Occupational Health and Safety Assessment Series 18001 (“OHSAS 18001”) at both the corporate and site levels will continue in 2010. Injury reduction priorities in 2010 include enhanced musculoskeletal disorder prevention programming. Improvements in OPG’s rigorous incident management system are also underway to specifically improve the investigation process to enhance lessons learned from safety incidents and prevent reoccurrences. Together with OPG’s unions, the Company has also completed improvements to energy control procedures for workers who perform work with equipment. OPG continues to demonstrate leadership in safety through a commitment to young worker safety in the communities where OPG operates. In March 2010, OPG continued its awareness programs in conjunction with a young worker safety advocate in Ontario high schools to raise awareness on the importance of workplace safety. Financial Sustainability OPG’s financial priority is to achieve a sustainable level of financial performance. Inherent in this priority are the objectives of earning an appropriate return on OPG’s regulated assets; optimizing prices for production from unregulated assets; identifying and exploring efficiency improvement opportunities; and ensuring that sufficient funds are available to achieve its strategic objectives of performance excellence

11
and generation development. The strategies that OPG has employed to achieve a level of sustainable financial performance are outlined in the 2009 annual MD&A. In order to earn an appropriate return on its regulated assets, OPG intends to file a rate application with the OEB in the second quarter of 2010, for new regulated prices effective March 1, 2011. To ensure recovery of costs, OPG entered into an energy supply contract with the OPA for the Lennox generating station covering the period from October 1, 2009 to December 31, 2010. To ensure that sufficient funds are available to achieve its strategic objectives of performance excellence and generation development, OPG initiated or continued with a number of initiatives in the first quarter of 2010. OPG is in the process of pursuing an amendment to the Niagara Tunnel project credit facility with the OEFC, consistent with the revised cost estimate of $1.6 billion, and the revised scheduled completion date of December 2013. OPG is working with OPA to finalize and execute a Hydroelectric Energy Supply Agreement for the Lower Mattagami generation development project, and is also in the process of arranging project financing. In addition, OPG reached an agreement with the OEFC in the first quarter of 2010 for a $970 million credit facility to refinance notes as they mature over the period from January 2010 to December 2010. Generation Development OPG is pursuing a number of generation development opportunities including capacity expansion and life extension opportunities where possible. Increasing the production potential of existing infrastructure reduces the environmental impact of meeting Ontario’s electricity demands. Pursuing opportunities to leverage existing sites and assets will enable OPG to realize additional benefits from these assets. OPG’s major projects include nuclear station refurbishment, new hydroelectric generation and plant upgrades, and the conversion of some of the coal-fired generating units to alternate fuels. New Nuclear Units In June 2009, the Government of Ontario suspended the competitive Request for Proposal (“RFP”) process to procure two new nuclear reactors planned for the Darlington site. In the announcement, the Government indicated that the competitive RFP process did not provide Ontario with a suitable option at this time. The bids that were received during this process have subsequently expired. Discussions between Atomic Energy of Canada Limited, Infrastructure Ontario, OPG and representatives from the Government of Ontario are currently underway. OPG continues with two initiatives that were underway – the environmental assessment process and obtaining a site preparation licence. In November 2009, the Joint Review Panel (“JRP”) announced the start of a six-month public review period for the Environmental Impact Statement (“EIS”) and the “Licence to Prepare Site”. On February 3, 2010 and March 29, 2010, and subsequently on April 28, 2010, the JRP requested additional information in support of the EIS and application for the “Licence to Prepare Site”. OPG has responded to the first two documentation requests, and is currently working to complete the response to the third request. Darlington Refurbishment Project In February 2010, OPG announced its decision to commence the detailed planning phase for the refurbishment of the Darlington nuclear generating station. The Darlington nuclear station units are currently predicted to reach their nominal end of life between 2019 and 2020. The objective of the refurbishment is to extend the operating life of the station by approximately 30 years. The refurbishment would involve an outage for the replacement of life-limiting components, as well as maintenance of other plant components which is most effectively done during the refurbishment outage period. In the detailed planning phase, all regulatory work will be completed including the Environmental Assessment (“EA”), the Integrated Safety Review (“ISR”), and the Integrated Improvement Plan (“IIP”). As well, OPG will also complete engineering and detailed project planning, establish the project management organization, develop required infrastructure, and prepare a detailed cost and schedule estimate for project approval by mid-2014, with construction expected to start in 2016. A preliminary

12
feasibility assessment has been completed based on the anticipated Darlington station refurbishment project scope and the expected operating life once refurbishment is complete. Work continues on the development of the contracting strategy. In March 2010, a “Request for Expressions of Interest” was issued to a number of vendors regarding the retube and feeder replacement work for the Darlington refurbishment project. In April 2010, OPG announced that it was proceeding, in conjunction with the Municipality of Clarington and Durham Region, with site preparation and servicing for a proposed 250,000 square foot multi-purpose building, on OPG-owned land in the Clarington Energy Business Park adjacent to the Darlington nuclear generating station. Pickering B Continued Operations In September 2009, OPG submitted its final Integrated Safety Review report for the Pickering B nuclear generating station to the CNSC. The report concluded that the station demonstrates a high level of compliance with modern codes and standards, and can be operated safely today and in the future. In February 2010, OPG announced its decision to continue the safe and reliable operation of OPG’s Pickering B nuclear generating station. Pickering B nuclear generating units are currently estimated to reach their nominal end of life between 2014 and 2016. OPG is undertaking a coordinated set of initiatives to evaluate the opportunity to continue safe and reliable operations of Pickering B for an additional four to six years. Work is progressing to resource the organization, finalize the detailed scope of the program, and to implement plant improvements. When continued operations end, OPG will place the units into safe-storage and then begin the long-term decommissioning process. As part of a regulatory commitment to the CNSC, OPG submitted the Pickering B Operations Plan in March 2010, describing strategies for the continued safe and reliable operation of Pickering B until its end of life. Pickering A Units 2 and 3 Safe Storage The Pickering A safe storage project includes de-fuelling, de-watering, and isolating Units 2 and 3 from the rest of the generating station, along with redesigning the control room for the remaining two operating units and placing the various systems in a safe state. De-fuelling of the units was completed in 2008 and de-watering was completed in January 2010. As of March 31, 2010, approximately 80 percent of the various sub-systems have been placed in a safe state. The work to place the remaining sub-systems in a safe state will be completed by June 30, 2010. The project remains on schedule for completion in the fall of 2010 with a projected completion cost of $349 million. The year-to-date and life-to-date expenditures on the project were $32 million and $308 million, respectively. Upper Mattagami and Hound Chute Construction activities to replace three existing hydroelectric generating stations on the Upper Mattagami River and the Hound Chute generating station on the Montreal River continued during the first quarter of 2010. As part of the redevelopment, the Wawaitin generating station was removed from service in March 2010 reducing OPG’s generating capacity by 11 MW. Upon completion of the project, the total installed capacity of the four stations will increase from 23 MW to 44 MW, and the expected annual energy will increase from 134 gigawatt hours (“GWh”) to 223 GWh. During the first quarter of 2010, design activities were completed and all major equipment from overseas vendors was delivered. The stations are expected to be completed on schedule, and will be in-service by April 2011. Project financing was completed in May 2009, and Senior notes totalling $200 million were issued. The capital project expenditures for the three months ended March 31, 2010 were $18 million and the life-to-date capital expenditures were $214 million. The project costs are expected to be within the approved budget of $300 million.

13
Niagara Tunnel
As of March 31, 2010, the tunnel boring machine has progressed 6,485 metres, which is 64 percent of the tunnel length. Installation of the lower one-third of the permanent concrete lining has progressed 4,550 metres. Restoration of the circular cross-section of the tunnel, before installation of the upper two-thirds of the concrete lining, has progressed 1,000 metres. Installation of the upper two-thirds of the concrete lining is scheduled to begin by the end of the second quarter.
The capital project expenditures for the quarter ended March 31, 2010 were $47 million, and the life-to-date capital expenditures were $696 million. The project is debt financed through the OEFC. OPG is in the process of pursuing an amendment to the Niagara Tunnel project credit facility with the OEFC, consistent with the revised budget estimate of $1.6 billion, and the revised scheduled completion date of December 2013. The project is expected to be completed within the revised approved budget and schedule. Lower Mattagami OPG continues to proceed with project activities on the planned Lower Mattagami development to increase the capacity of four stations by 438 MW. In January 2010, OPG entered into a design-build agreement with Kiewit-Alarie, A Partnership (“KAP”) for the Lower Mattagami project. In March 2010, the Federal Minister of the Environment approved the EA as required by the Canadian Environmental Assessment Act and posted an Environmental Assessment Decision Statement for the project. This Decision Statement indicated that public concerns have been taken into account; thus, there is no need to address them further through the comprehensive study. The Environmental Assessment Decision Statement also indicated that the project, taking into account the mitigation measures described in the comprehensive study report, is not likely to cause significant adverse environmental effects. OPG and the OPA are working to finalize and execute a Hydroelectric Energy Supply Agreement by the end of the second quarter of 2010. OPG is in the process of arranging project financing. OPG has engaged in consultation discussions with Aboriginal communities regarding the project. A comprehensive agreement has been executed with a local First Nation that resolves grievances attributed to the construction and subsequent operation and maintenance of OPG facilities in the area. The new agreement also provides the First Nation with an ability to purchase up to a 25 percent equity interest in the project. Discussions with other Aboriginal groups are ongoing. Pursuant to the Province of Ontario’s EA, the Ministry of Environment formed the Mattagami Extensions Coordinating Committee (“MECC”) in May 2010. Construction activities are expected to commence by the end of the second quarter of 2010. The capital project expenditures for the three months ended March 31, 2010 were $36 million and the life-to-date capital expenditures were $55 million. Little Jackfish OPG is proceeding with a development plan to provide approximately 100 MW of additional generation capacity in Northwestern Ontario. Current activities associated with this project include coordinating the federal and provincial Environmental Assessment processes, and engaging Aboriginal communities. The project is dependent on the construction of additional transmission in the area and securing a revenue agreement with the OPA. Unit Conversion Opportunities The coal-unit conversion strategy is continuing to advance with the request for indicative pricing issued in March 2010 by OPG to potential suppliers of wood-based biomass fuel for the Atikokan generating station. In addition to fuel pricing levels, the feasibility of the Atikokan conversion is dependent upon the cost of conversion and operation. OPG requires cost recovery agreements with the OPA for conversion of the units and the electricity generated post-conversion before seeking Board of Directors approval to proceed with unit conversions. OPG is seeking a directive from the Ministry of Energy and Infrastructure to the OPA to negotiate a cost recovery agreement with OPG.

14
Developing and Acquiring Talent Skilled Workforce As of March 31, 2010, OPG had approximately 90 percent of its regular labour force represented by a union. The Company’s collective agreement with the Power Workers’ Union runs through March 31, 2012 and the labour agreement with The Society of Energy Professionals runs through December 31, 2010. Collective Agreements between the Company and its construction unions, negotiated either directly or through the Electrical Power Systems Construction Association (“EPSCA”), expired April 30, 2010. Negotiations are currently underway in conjunction with the EPSCA. Electricity generation involves complex technologies, which demand highly skilled and trained workers. Many positions at OPG have significant educational prerequisites as well as rigorous requirements for continuing training and periodic requalification. OPG relies on partnerships with educational institutions, and an extensive internal training infrastructure, to maintain its workforce at the required level of qualification. ONTARIO ELECTRICITY MARKET TRENDS In its 18-Month Outlook published on February 23, 2010, the IESO indicated that as of February 4, 2010, Ontario’s installed electricity generating capacity was 35,485 MW. As of March 31, 2010, OPG’s in-service electricity generating capacity was 21,720 MW or 61 percent of Ontario’s capacity. The IESO reported that the outlook for the reliability of Ontario's electricity system remains positive over the next 18 months. A description of this 18-Month Outlook is provided in OPG’s MD&A as at and for the year ended December 31, 2009 under the heading, Ontario Electricity Market Trends. Fuel prices can have a significant impact on OPG’s revenue and gross margin. The industry average uranium spot market price was U.S. $44.50 per pound at the beginning of 2010. By the end of the first quarter of 2010, the industry average spot price had declined to U.S. $41.88 per pound. The industry average long-term uranium price began the year at U.S. $61.00 per pound and has since declined to U.S. $59.00 per pound at the end of the first quarter of 2010. Natural gas prices at Henry Hub have trended down since the beginning of the year. Prices remained above $5.00/MMBtu primarily due to colder-than-normal weather in January and February of 2010. Since February 2010, warmer weather, lower demand and higher production, especially from shale gas wells, have exerted downward pressure on gas prices. Prices dropped below $4.00/MMBtu and averaged $4.29/MMBtu in March. Gas prices at Henry Hub averaged U.S. $5.15/MMBtu in the first quarter, 19 percent above the prices in the fourth quarter of 2009, and 13 percent above prices in the first quarter of 2009. Weather conditions have also impacted coal prices as several storms in the northeast, along with a rebounding economy, have positively influenced prices in the first quarter of 2010. Eastern coal prices have averaged around U.S. $56.00/tonne during the first quarter of 2010, which is approximately 6 percent higher than the fourth quarter of 2009 and 9 percent lower than the same quarter of 2009. Powder River Basin coal prices have averaged over U.S. $11.00/tonne during the first quarter of 2010, which were 26 percent higher than the fourth quarter of 2009 and 10 percent lower than the average in the same quarter of 2009. BUSINESS SEGMENTS OPG has five reportable business segments. The business segments are Regulated – Nuclear Generation, Regulated – Nuclear Waste Management, Regulated – Hydroelectric, Unregulated –Hydroelectric, and Unregulated – Thermal. Descriptions of OPG’s reportable business segments are included in the 2009 annual MD&A under the heading, Business Segments.

15
KEY GENERATION AND FINANCIAL PERFORMANCE INDICATORS Key performance indicators that directly pertain to OPG’s mandate and corporate strategies are measures of production efficiency, cost effectiveness, and environmental performance. OPG evaluates the performance of its generating stations using a number of key performance indicators, which vary depending on the generating technology. These indicators are defined in the 2009 annual MD&A and are discussed in the Discussion of Operating Results by Business Segment section. DISCUSSION OF OPERATING RESULTS BY BUSINESS SEGMENT This section summarizes OPG’s key results by segment for the three months ended March 31, 2010 and 2009. The following table provides a summary of revenue, earnings and key generation and financial performance indicators by business segment:
Three Months Ended March 31
(millions of dollars) 2010 2009 Revenue, net of revenue limit rebate
Regulated – Nuclear Generation 793 773 Regulated – Nuclear Waste Management 11 10 Regulated – Hydroelectric 185 179 Unregulated – Hydroelectric 149 206 Unregulated – Thermal 268 276 Other 48 47 Elimination (10) (10)
1,444 1,481 Income (loss) before interest and income taxes
Regulated – Nuclear Generation 89 47 Regulated – Nuclear Waste Management (24) (164) Regulated – Hydroelectric 93 83 Unregulated – Hydroelectric 67 122 Unregulated – Thermal (17) (9) Other 28 30
236 109 Electricity generation (TWh)
Regulated – Nuclear Generation 12.0 12.3 Regulated – Hydroelectric 4.8 4.7 Unregulated – Hydroelectric 3.9 4.3 Unregulated – Thermal 3.8 4.3
Total electricity generation 24.5 25.6
Nuclear unit capability factor (percent) Darlington 82.4 99.9 Pickering A 67.3 42.4 Pickering B 97.5 84.9
Equivalent forced outage rate (percent) Regulated – Hydroelectric 0.3 0.9 Unregulated – Hydroelectric 1.0 0.7 Unregulated – Thermal 2.6 12.1
Availability (percent) Regulated – Hydroelectric 93.5 94.2 Unregulated – Hydroelectric 93.8 95.5
Nuclear Production Unit Energy Cost (“PUEC”) ($/MWh) 46.77 45.97 Regulated – Hydroelectric OM&A expense per MWh ($/MWh) 4.79 4.89 Unregulated – Hydroelectric OM&A expense per MWh ($/MWh) 11.79 9.77 Unregulated – Thermal OM&A expense per MW ($000/MW) 49.90 59.20

16
0
Regulated – Nuclear Generation Segment Three Months Ended
March 31 (millions of dollars) 2010 2009 Regulated generation sales 655 674 Variance accounts 150 13 Other (12) 86 Total revenue 793 773 Fuel expense 50 49 Gross margin 743 724 Operations, maintenance and administration 550 552 Depreciation and amortization 93 114 Property and capital taxes 11 11 Income before interest and income taxes
89
47
Revenue Regulated – Nuclear Generation revenue was $793 million for the three months ended March 31, 2010 compared to $773 million for the same period in 2009. The increase in revenue of $20 million was primarily due to the recognition of a regulatory asset of $43 million related to the Tax Loss Variance Account authorized by the OEB’s decision and order issued in May 2009, partially offset by the impact of lower generation volume. During the three months ended March 31, 2010, OPG recognized a reduction in Bruce Lease revenue of $95 million related to the increase in the fair value of the derivative liability embedded in the Bruce Lease as a result of a reduction in expected future Average HOEP prices. The decrease in lease revenue was offset by the increase in the regulatory asset related to the Bruce Lease Net Revenues Variance Account. Electricity Prices The OEB established a fixed price of 5.50¢/kWh for electricity generation from stations in the Regulated – Nuclear Generation segment. During the first quarter of 2010, the average price for electricity generated by OPG’s Pickering and Darlington nuclear generating stations was 5.4¢/kWh. This average price reflected the fixed price of 5.50¢/kWh and other market settlement adjustments. Volume Electricity generation from OPG’s nuclear generating stations was 12.0 TWh for the three months ended March 31, 2010 compared to 12.3 TWh for the same period in 2009. The decrease of 0.3 TWh was primarily due to an increase in planned outage days at the Darlington nuclear generating station and an increase in unplanned outage days at the Pickering A nuclear generating station. This resulting decrease in generation was largely offset by a reduction in planned outage days at the Pickering A and Pickering B nuclear generating stations for the three months ended March 31, 2010 compared to the same period in 2009, as the required planned outage work will be completed during the Pickering VBO. The Darlington nuclear generating station’s unit capability factor for the three months ended March 31, 2010 was 82.4 percent compared to 99.9 percent for the same period in 2009. The lower capability factor reflects the higher planned outage days during the first quarter of 2010.
82.467.3
97.599.9
42.4
84.9
DarlingtonPickering A
PickeringB
Regulated – Nuclear Unit Capability Factor Three Months Ended
March 31(%)
20102009

17
The unit capability factor for the Pickering A nuclear generating station for the three months ended March 31, 2010 was 67.3 percent compared to 42.4 percent for the same period in 2009. The unit capability factor for the Pickering B nuclear generating station was 97.5 percent for the three months ended March 31, 2010, compared to 84.9 percent for the same period in 2009. The higher capability factors at the Pickering nuclear generating stations reflect lower planned outages days in the first quarter of 2010, as unit outages are scheduled in the second quarter consistent with the VBO. The capability factor for the Pickering B nuclear generating station reflects the high reliability of the units during the first quarter of 2010. Fuel Expense Fuel expense for the three months ended March 31, 2010 was $50 million compared to $49 million during the same period in 2009. The increase in fuel expense was primarily due to an increase in uranium costs, largely offset by the impact of the Nuclear Fuel Cost Variance Account. Operations, Maintenance and Administration OM&A expenses for the three months ended March 31, 2010 were $550 million compared to $552 million during the same period in 2009. The decrease in OM&A expenses during the first quarter of 2010 compared to the same quarter in 2009 was primarily due to lower planned outage and maintenance activities, largely offset by higher pension and OPEB costs. Nuclear PUEC for the three months ended March 31, 2010 was $46.77/MWh compared to $45.97/MWh during the same period in 2009. The increase was primarily due to lower production, partially offset by lower OM&A expenses. Depreciation and Amortization Depreciation and amortization expenses for the three months ended March 31, 2010 were $93 million compared to $114 million in the same quarter of 2009. The decrease in depreciation and amortization expenses was primarily due to the impact of the Darlington nuclear generating station life extension to 2051, related to OPG’s commencement of the definition phase for refurbishment of the station. Regulated – Nuclear Waste Management Segment
Three Months Ended March 31
(millions of dollars) 2010 2009 Revenue 11 10 Operations, maintenance and administration 12 11 Accretion on fixed asset removal and nuclear waste management liabilities 164 157 (Earnings) losses on nuclear fixed asset removal and nuclear waste
management funds (141) 6
Loss before interest and income taxes
(24)
(164)
Accretion Accretion expense for the three months ended March 31, 2010 was $164 million compared to $157 million for the same period in 2009. The increase in accretion expense was primarily due the increase in the present value of the liabilities for Fixed Asset Removal and Nuclear Waste Management (“Nuclear Liabilities”) due to the passage of time, and the increase in the Nuclear Liabilities as a result of OPG’s commencement of the definition phase for refurbishment of the Darlington nuclear generating
46.77 45.97
Regulated – Nuclear PUEC
Three Months EndedMarch 31($/MWh) 2010
2009

18
station. This increase was partially offset by the impact of the Bruce lease Net Revenues Variance Account. Earnings on the Nuclear Fixed Asset Removal and Nuclear Waste Management Funds Earnings from the Nuclear Funds for the three months ended March 31, 2010 were $141 million compared to losses of $6 million during the first quarter of 2009. During the first quarter of 2010, before the impact of the Bruce Lease Net Revenues Variance Account, earnings from the Nuclear Funds were $157 million compared to losses of $136 million during the same period in 2009. The increase in earnings from the Nuclear Funds was primarily due to improvements in valuation levels of global financial markets, which increased the market value of the Decommissioning Fund, and higher earnings from the Used Fuel Fund resulting from an increase in the Ontario CPI. During the first quarter of 2010, OPG recorded a reduction to the Bruce Lease Net Revenues Variance Account regulatory asset of $16 million, which decreased the reported earnings from the Nuclear Funds. Regulated – Hydroelectric Segment
Three Months Ended March 31
(millions of dollars) 2010 2009 Regulated generation sales 174 170 Variance accounts 1 (8) Other 10 17 Revenue 185 179 Fuel expense 50 52 Gross margin 135 127 Operations, maintenance and administration 23 23 Depreciation and amortization 16 18 Property and capital taxes 3 3 Income before interest and income taxes 93 83
Revenue Regulated – Hydroelectric revenue was $185 million for the three months ended March 31, 2010 compared to $179 million during the same period in 2009. Electricity Prices The average electricity sales price for the three months ended March 31, 2010 was 3.7¢/kWh compared to 3.6¢/kWh for the same period in 2009. These prices reflected the fixed price of 3.67¢/kWh and an incentive mechanism as approved by the OEB in 2008. Volume Electricity generation volume for the three months ended March 31, 2010 and 2009 was 4.8 TWh and 4.7 TWh, respectively. For the three months ended March 31, 2010 and 2009, the EFOR for the Regulated – Hydroelectric stations was 0.3 percent and 0.9 percent, respectively. The availability for the Regulated – Hydroelectric stations was 93.5 percent for the first quarter of 2010 compared to 94.2 percent for the same quarter in 2009. The high availability and low EFOR reflect the continued strong performance of the regulated hydroelectric stations.
0.3
0.9
0.0
0.2
0.4
0.6
0.8
1.0
1.2
1.4
1.6
1.8
2.0
Regulated – HydroelectricEFOR
Three Months EndedMarch 31
(%)20102009

19
Fuel Expense Fuel expense was $50 million for the three months ended March 31, 2010 compared to $52 million in the same period during 2009. Variance Accounts During the three months ended March 31, 2010, OPG recorded a net increase in revenue of $1 million due to the recognition of regulatory assets related to the Tax Loss Variance Account and the regulatory variance account reflecting the differences between forecast and actual ancillary services revenue. This increase was largely offset by the recognition of regulatory liabilities related to the regulatory variance account that reflects the impact of differences between forecast and actual water conditions on hydroelectric production. During the first quarter of 2009, OPG recorded a net decrease to revenue of $8 million related to these variance accounts. Operations, Maintenance and Administration OM&A expenses for the three months ended March 31, 2010 and 2009 were $23 million.
OM&A expense per MWh for the regulated hydroelectric generating stations was $4.79/MWh during the three months ended March 31, 2010 compared to $4.89/MWh for the same period in 2009. The decrease in OM&A expense per MWh in the first quarter of 2010 compared to the first quarter of 2009 was primarily due to the impact of higher generation. Unregulated – Hydroelectric Segment Three Months Ended
March 31 (millions of dollars) 2010 2009 Spot market sales, net of hedging instruments 140 204 Revenue limit rebate - (11) Other 9 13 Revenue, net of revenue limit rebate 149 206 Fuel expense 19 22 Gross margin 130 184 Operations, maintenance and administration 46 42 Depreciation and amortization 16 18 Property and capital taxes 1 2 Income before interest and income taxes
67
122
4.79 4.89
Regulated – Hydroelectric OM&A per MWh
Three Months Ended March 31($/MWh) 2010
2009
93.594.2
Regulated – HydroelectricAvailability
Three Months EndedMarch 31
(%) 2010
2009

20
Revenue Unregulated – Hydroelectric revenue was $149 million for the three months ended March 31, 2010 compared to $206 million during the same period in 2009. The decrease in revenue was primarily due to lower electricity prices and lower generation volume for the first quarter of 2010 compared to the same quarter in 2009. Electricity Prices OPG’s average sales price for its unregulated hydroelectric generation for the three months ended March 31, 2010 and 2009 was 3.5¢/kWh and 4.4¢/kWh, respectively. The decrease in electricity prices was primarily due to the impact of lower Ontario spot electricity market prices. Volume For the three months ended March 31, 2010 and 2009, electricity generation was 3.9 TWh and 4.3 TWh, respectively. The decrease in volume during the first quarter of 2010 compared to the same quarter in 2009 was primarily due to the impact of lower water flows. The EFOR for the Unregulated – Hydroelectric generating stations was 1.0 percent for the quarter ended March 31, 2010 compared to 0.7 percent in the first quarter of 2009. The availability for the Unregulated – Hydroelectric stations was 93.8 percent for the three months ended March 31, 2010 compared to 95.5 percent in the same period in 2009. The high availability and low EFOR reflect the continued strong performance of the unregulated hydroelectric stations. Fuel Expense Fuel expense was $19 million for the three months ended March 31, 2010 compared to $22 million for the same period in 2009. Operations, Maintenance and Administration For the three months ended March 31, 2010, OM&A expenses were $46 million compared to $42 million for the same period in 2009. OM&A expense per MWh for the unregulated hydroelectric stations for the quarters ended March 31, 2010 and 2009 was $11.79/MWh and $9.77/MWh, respectively. The increase in OM&A expense per MWh in the first quarter of 2010 compared to the first quarter of 2009 was due to the impact of lower generation and higher OM&A expenses.
11.799.77
Unregulated – Hydroelectric OM&A per MWh
Three Months EndedMarch 31 ($/MWh) 2010
2009
1.0
0.7
0.0
0.2
0.4
0.6
0.8
1.0
1.2
1.4
1.6
1.8
2.0 Unregulated – Hydroelectric
EFORThree Months Ended
March 31 (%)
20102009
93.895.5
Unregulated –Hydroelectric Availability
Three Months EndedMarch 31
(%)2010
2009

21
Unregulated – Thermal Segment Three Months Ended
March 31 (millions of dollars) 2010 2009 Spot market sales, net of hedging instruments 138 220 Revenue limit rebate - (17) Other 130 73 Revenue, net of revenue limit rebate 268 276 Fuel expense 129 138 Gross margin 139 138 Operations, maintenance and administration 102 121 Depreciation and amortization 27 18 Accretion on fixed asset removal liabilities 1 2 Restructuring 25 - Property and capital taxes 1 6 Loss before interest and income taxes (17) (9) Revenue Unregulated – Thermal revenue was $268 million for the three months ended March 31, 2010 compared to $276 million in 2009, a decrease of $8 million. The decrease in revenue was primarily due to lower electricity prices and lower electricity generation volume. The reduction in revenue was partially offset by an increase in revenue related to a contingency support agreement established with the OEFC to provide for the continued reliability and availability of OPG’s Lambton and Nanticoke generating stations. The revenue related to the contingency support agreement was $83 million for the three months ended March 31, 2010 compared to $39 million for the same period in 2009. In March 2010, the OPA approved an energy supply contract for the Lennox generating station covering the period from October 1, 2009 to December 31, 2010. The new contract has terms similar to the previous RMR contract with the IESO, which expired on September 30, 2009. OPG recognized revenue of $33 million from the new contract with the OPA for the period October 1, 2009 to March 31, 2010. For the three months ended March 31, 2009, OPG reported revenue of $20 million from the previous RMR contract with the IESO. Electricity Prices OPG’s average sales price from generation paid through the Ontario market prices for its unregulated thermal generation was 3.7¢/kWh for the three months ended March 31, 2010 and 4.8¢/kWh for the three months ended March 31, 2009. The decrease in average electricity sales price for the unregulated thermal generation was as a result of lower Ontario spot electricity market prices.

22
Volume Electricity generation volume for the three months ended March 31, 2010 was 3.8 TWh compared to 4.3 TWh during 2009. The decrease in generation from the thermal generating stations during the first quarter of 2010 compared to the same quarter in 2009 was primarily due to the impact of lower primary demand and a decrease in net exports, partially offset by a decrease in electricity generation from other generators in Ontario. The EFOR for the Unregulated – Thermal stations during the three months ended March 31, 2010 was 2.6 percent compared to 12.1 percent during the same period in 2009. The improvement in EFOR was primarily due to fewer unplanned outage days at the Nanticoke and Lambton coal-fired generating stations, which reflected the operating and maintenance strategies of the Thermal business segment. Fuel Expense During the three months ended March 31, 2010, fuel expense was $129 million compared to $138 million for the same period in 2009. The decrease of $9 million in 2010 compared to 2009 was primarily due to a decrease in generation volume, partially offset by the impact of higher coal prices. Operations, Maintenance and Administration For the three months ended March 31, 2010, OM&A expenses were $102 million compared to $121 million. The decrease in OM&A expenses was primarily due to lower project and outage work at the Lambton and Nanticoke coal-fired generating stations as a result of the pending closure of four coal-fired units in October 2010. Annualized OM&A expense per MW for the unregulated thermal stations was $49,900/MW for the three months ended March 31, 2010 compared to $59,200/MW in 2009. The decrease in OM&A expense per MW during 2010 compared to 2009 was due to a decrease in OM&A expenses. Other Three Months Ended
March 31 (millions of dollars) 2010 2009 Revenue 48 47 Operations, maintenance and administration 3 3 Depreciation and amortization 15 10 Property and capital taxes 3 4 Income before other gains and losses, interest and income taxes 27 30 Other (gains) and losses (1) - Income before interest and income taxes
28
30
Other revenue was $48 million for the three months ended March 31, 2010 compared to $47 million for the same quarter in 2009. The increase in other revenue during the first quarter of 2010 compared to the
2.6
12.1
Unregulated – Thermal EFOR
Three Months Ended March 31
(%)2010
2009
49.959.2
Unregulated – ThermalOM&A per MW
Three Months EndedMarch 31
($000/MW) 2010
2009

23
same quarter of 2009 was primarily due to an increase in revenue from the PEC, largely offset by a decrease in investment income from OPG’s equity investments. OM&A expenses of the generation business segments include an inter-segment service fee for the use of certain property, plant and equipment, and intangibles held within the Other category. The total service fee is recorded as a reduction to the Other category’s OM&A expense. For the three months ended March 31, 2010, the service fee was $6 million for Regulated – Nuclear Generation, with a corresponding reduction in OM&A expense of $6 million for the Other category. For the three months ended March 31, 2009, the service fee was $6 million for Regulated – Nuclear Generation, $1 million for Unregulated – Hydroelectric, $2 million for Unregulated – Thermal, with a corresponding reduction in OM&A expense of $9 million for the Other category. Interconnected purchases and sales, including those to be physically settled, and unrealized mark-to-market gains and losses on energy trading contracts, are disclosed on a net basis in the consolidated statements of income. If disclosed on a gross basis, revenue and power purchases for the three months ended March 31, 2010 would have increased by $22 million (March 31, 2009 – $23 million). With the exception of the derivative embedded in the Bruce Lease, the changes in the fair value of derivative instruments not qualifying for hedge accounting are recorded in Other revenue, and the fair value of derivative instruments are carried on the consolidated balance sheets as assets or liabilities at fair value. The carrying amounts and notional quantities of the derivative instruments are disclosed in Note 12 in the unaudited interim consolidated financial statements as at and for the three months ended March 31, 2010. Net Interest Expense Net interest expense for the three months ended March 31, 2010 was $45 million compared to $39 million for the same quarter in 2009. The increase in net interest expense was primarily due to the long-term debt of the PEC, which was declared in-service in April 2009. Income Taxes Effective January 1, 2009, OPG follows the liability method of tax accounting for all its business segments and records a corresponding regulatory asset or liability for the future taxes relating to its rate regulated segment. Previously OPG had followed the taxes payable method for rate regulated segments of its business. In transitioning to the liability method for its rate regulated segments, OPG recorded a future income tax liability of $466 million and a corresponding regulatory asset. For the three months ended March 31, 2010, income tax expense was $48 million compared to an income tax expense of $79 million for the same period in 2009. The decrease in income tax expense was primarily due to lower income before earnings from the Nuclear Funds, as earnings on the Nuclear Funds are not taxable. In addition, the decrease in income tax expense was also due to a lower income tax component of the Bruce Lease Net Revenues Variance Account. The decrease in income tax expense was partially offset by an increase in the tax expense due to the recognition of income related to the Tax Loss Variance Account during the first quarter of 2010. The audit of OPG’s taxation years subsequent to 1999 commenced in 2009. Should the outcome of the audit for subsequent years differ from OPG’s recorded income tax liabilities, the Company’s effective tax rate and its net income could be materially affected either negatively or positively in the period in which the matters are resolved. The OEB’s decision in 2008 on OPG’s new payment amounts established an Income and Other Taxes Variance Account retrospective to April 1, 2008. The account captures variances in the income tax expense for the regulated business caused by changes in tax rates or rules under the Income Tax Act (Canada) and the Corporations Tax Act (Ontario), as modified by the Electricity Act, 1998, as well as variances caused by reassessments. Variances in income tax expense from reassessments of prior taxation years that have an impact on taxes payable for the years after April 1, 2008 are also recorded in the account. During the three months ended March 31, 2010, OPG recorded $4 million in the account (March 31, 2009 – nil).
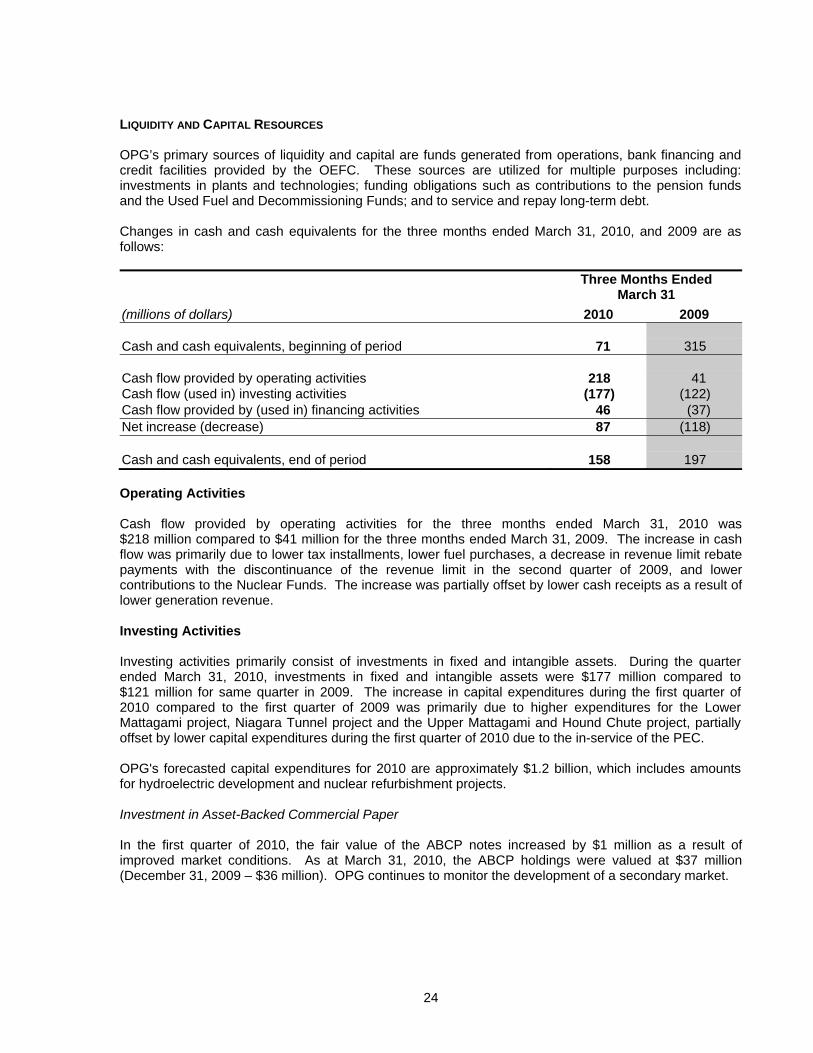
24
LIQUIDITY AND CAPITAL RESOURCES OPG’s primary sources of liquidity and capital are funds generated from operations, bank financing and credit facilities provided by the OEFC. These sources are utilized for multiple purposes including: investments in plants and technologies; funding obligations such as contributions to the pension funds and the Used Fuel and Decommissioning Funds; and to service and repay long-term debt. Changes in cash and cash equivalents for the three months ended March 31, 2010, and 2009 are as follows: Three Months Ended
March 31 (millions of dollars) 2010 2009 Cash and cash equivalents, beginning of period 71 315 Cash flow provided by operating activities 218 41 Cash flow (used in) investing activities (177) (122) Cash flow provided by (used in) financing activities 46 (37) Net increase (decrease) 87 (118) Cash and cash equivalents, end of period 158 197 Operating Activities Cash flow provided by operating activities for the three months ended March 31, 2010 was $218 million compared to $41 million for the three months ended March 31, 2009. The increase in cash flow was primarily due to lower tax installments, lower fuel purchases, a decrease in revenue limit rebate payments with the discontinuance of the revenue limit in the second quarter of 2009, and lower contributions to the Nuclear Funds. The increase was partially offset by lower cash receipts as a result of lower generation revenue. Investing Activities Investing activities primarily consist of investments in fixed and intangible assets. During the quarter ended March 31, 2010, investments in fixed and intangible assets were $177 million compared to $121 million for same quarter in 2009. The increase in capital expenditures during the first quarter of 2010 compared to the first quarter of 2009 was primarily due to higher expenditures for the Lower Mattagami project, Niagara Tunnel project and the Upper Mattagami and Hound Chute project, partially offset by lower capital expenditures during the first quarter of 2010 due to the in-service of the PEC. OPG's forecasted capital expenditures for 2010 are approximately $1.2 billion, which includes amounts for hydroelectric development and nuclear refurbishment projects. Investment in Asset-Backed Commercial Paper In the first quarter of 2010, the fair value of the ABCP notes increased by $1 million as a result of improved market conditions. As at March 31, 2010, the ABCP holdings were valued at $37 million (December 31, 2009 – $36 million). OPG continues to monitor the development of a secondary market.
25
Financing Activities OPG maintains a $1 billion revolving committed bank credit facility, which is divided into two tranches – a $500 million 364-day term tranche, and a $500 million multi-year term tranche. In April 2010, OPG renewed and extended the maturity date of the 364-day term tranche to May 18, 2011. The multi-year term tranche has three years remaining, with a maturity date of May 20, 2013. The total credit facility will continue to be used primarily as credit support for notes issued under OPG’s commercial paper program. As at March 31, 2010, no commercial paper was outstanding (December 31, 2009 – nil), and OPG had no other outstanding borrowings under the bank credit facility. In the second quarter of 2008, OPG entered into a $100 million five-year revolving committed bank credit facility in support of the Upper Mattagami and Hound Chute project. As at March 31, 2010, there was no borrowing under this credit facility. As at March 31, 2010, OPG maintained $25 million (December 31, 2009 – $25 million) of short-term, uncommitted overdraft facilities, and $275 million (December 31, 2009 – $275 million) of short-term, uncommitted credit facilities, which support the issuance of the Letters of Credit. OPG uses Letters of Credit to support its supplementary pension plans, and for other purposes. At March 31, 2010, there was a total of $231 million of Letters of Credit issued (December 31, 2009 – $231 million), which included $210 million for the supplementary pension plans (December 31, 2009 – $210 million), and $7 million related to the construction and operation of the PEC (December 31, 2009 – $7 million). Effective January 1, 2009, in accordance with Accounting Guideline 15, Consolidation of Variable Interest Entities, the applicable amounts in the accounts of the Nuclear Waste Management Organization (“NWMO”) are included in OPG’s consolidated financial statements as OPG became the primary beneficiary of the NWMO. As at March 31, 2010, the NWMO has issued a $1 million Letter of Credit for its supplementary pension plan (December 31, 2009 – $1 million). OPG has an agreement with the OEFC to finance the Niagara Tunnel project for up to $1 billion over the duration of the project. The funding is advanced in the form of 10-year notes, on commercial terms and conditions. Advances under this facility commenced in October 2006 and amounted to $540 million as at March 31, 2010, which included $50 million of new borrowing during the first quarter of 2010. OPG is in the process of pursuing an amendment to the Niagara Tunnel project credit facility, consistent with the revised approved budget estimate of $1.6 billion, and schedule. As at March 31, 2010, OPG’s long-term debt outstanding with the OEFC was $3.7 billion. Although the new borrowings added in 2008, 2009 and in the first quarter of 2010 have extended the maturity profile, approximately $1.2 billion of long-term debt must be repaid or refinanced within the next three years. To ensure that adequate financing resources are available beyond the $1 billion revolving committed bank credit facility, OPG reached an agreement with the OEFC in the first quarter of 2010 for a $970 million credit facility to refinance notes as they mature over the period from January 2010 to December 2010. Refinancing under this agreement totalled $530 million as at March 31, 2010.

26
BALANCE SHEET HIGHLIGHTS The following section provides highlights of OPG’s unaudited interim consolidated financial position using selected balance sheet data: As At Selected balance sheet data March 31 December 31 (millions of dollars) 2010 2009 Assets
Nuclear fixed asset removal and nuclear waste management funds 10,449 10,246 Regulatory assets 1,512 1,396
Liabilities Fixed asset removal and nuclear waste management 12,279 11,859 Long-term accounts payable and accrued charges 646 522 Nuclear Fixed Asset Removal and Nuclear Waste Management Funds Decommissioning Fund The Decommissioning Fund was established to fund the future costs of nuclear fixed asset removal and long-term low and intermediate level nuclear waste management, and a portion of used fuel storage costs after station life. For additional information regarding the Decommissioning Fund, refer to the 2009 annual MD&A under the heading, Balance Sheet Highlights. The Decommissioning Fund’s asset value on a fair value basis was $4,942 million as at March 31, 2010 compared to $4,876 million as at December 31, 2009. The increase in asset value of $66 million was primarily due to improvements in valuation levels of global financial markets during the three months ended March 31, 2010. Used Fuel Fund Under the Ontario Nuclear Funds Agreement, the Province guarantees OPG’s annual return from the Used Fuel Fund at 3.25 percent plus the change in the Ontario Consumer Price Index for funding related to the first 2.23 million used fuel bundles (“committed return”). For additional information regarding the Used Fuel Fund, refer to the 2009 annual MD&A under the heading, Balance Sheet Highlights. The Used Fuel Fund’s asset value on a fair value basis was $5,507 million as at March 31, 2010 compared to $5,370 million as at December 31, 2009. The increase in asset value in the Used Fuel Fund of $137 million was related to the committed return and new contributions to the fund. The asset values at March 31, 2010 and December 31, 2009, included a payable to the Province of $91 million and $33 million, respectively, related to the committed return adjustment. Regulatory Assets As at March 31, 2010, regulatory assets were $1,512 million compared to $1,396 million as at December 31, 2009. The increase in regulatory assets was primarily due to additions to the Bruce Lease Net Revenues Variance Account and the Tax Loss Variance Account. The increase in regulatory assets was partly offset by amortization expense of $24 million, resulting from the recovery of regulatory assets through current regulated prices. Fixed Asset Removal and Nuclear Waste Management The liability for fixed asset removal of nuclear and thermal generating stations and nuclear waste management as at March 31, 2010 was $12,279 million compared to $11,859 million as at December 31, 2009. The increase was largely due to OPG’s decision to commence the definition phase for the refurbishment of the Darlington nuclear generating station, which impacted the assumptions

27
regarding OPG’s liabilities for fixed asset removal and nuclear waste management. This resulted in a $293 million increase in the Nuclear Liabilities on January 1, 2010. In addition, the liability increased as a result of accretion expense of $168 million due to the passage of time, partially offset by expenditures of $51 million on nuclear waste management activities. Long-Term Accounts Payable and Accrued Charges Long-term accounts payable and accrued charges as at March 31, 2010 were $646 million compared to $522 million as at December 31, 2009. The change was primarily due to an increase in the fair value of the derivative liability embedded in the Bruce Lease of $95 million. Off-Balance Sheet Arrangements In the normal course of operations, OPG engages in a variety of transactions that, under Canadian GAAP, are either not recorded in the Company’s consolidated financial statements or are recorded in the Company’s consolidated financial statements using amounts that differ from the full contract amounts. Principal off-balance sheet activities that OPG undertakes include securitization of certain accounts receivable agreements, guarantees, which provide financial or performance assurance to third parties on behalf of certain subsidiaries, and long-term fixed price contracts. CHANGES IN ACCOUNTING POLICIES AND ESTIMATES OPG’s significant accounting policies, including the impact of future accounting pronouncements, are outlined in Note 3 to the audited annual consolidated financial statements as at and for the year ended December 31, 2009. Certain of these policies are recognized as critical accounting policies by virtue of the subjective and complex judgments and estimates required around matters that are inherently uncertain, and could result in materially different amounts being reported under different conditions or assumptions. Liabilities for Fixed Asset Removal and Nuclear Waste Management, and Depreciation Expense In February 2010, OPG announced its decision to commence the definition phase of the refurbishment of the Darlington nuclear generating station. Accordingly, the service life of the Darlington nuclear generating station, for the purposes of calculating depreciation, was extended to 2051. The approval and the extension of service life also impacted the assumptions for OPG’s liabilities for fixed asset removal and nuclear waste management primarily due to cost increases related to additional used fuel bundles, partially offset by a decrease in the liability for decommissioning, resulting from the change in the service life assumptions. The net increase in the liabilities was $293 million, using a discount rate of 4.8 percent. The increase in liabilities was reflected with a corresponding increase in the fixed asset balance in the first quarter of 2010. As a result of these changes, OPG’s depreciation expense will decrease by $135 million on an annual basis beginning in 2010. CONVERSION TO INTERNATIONAL FINANCIAL REPORTING STANDARDS Introduction to Conversion Project OPG’s IFRS conversion project progressed during the first quarter of 2010, including regular communications to executive management, finance employees and other stakeholders, and the Audit/Risk Committee of the Board of Directors. This section provides an update with respect to the disclosure included in the 2009 MD&A, under the heading, Conversion to International Financial Reporting Standards.

28
Accounting Policy Decisions and Anticipated Impacts OPG expects the following areas to be most impacted by its conversion to IFRS: Property, Plant and Equipment; Fixed Asset Removal and Nuclear Waste Management Liabilities; Accounts Receivable; Short-term Notes Payable; Employee Benefits; Impairment of Assets; Joint Ventures; and Regulatory Assets and Liabilities. OPG continued to evaluate its accounting policy options under IFRS, and progressed on identifying the accounting adjustments required to develop a January 1, 2010 IFRS opening balance sheet. In addition, OPG began collecting data, which will be used to report 2010 comparative information in its first IFRS financial statements as at and for the three months ending March 31, 2011. Since the International Accounting Standards Board (“IASB”) continues to issue new accounting standards, the final accounting policy decisions of OPG will only be determined once all applicable standards are known upon the January 1, 2011 conversion date. Ongoing Monitoring of IASB Projects The IASB continues to work on its rate-regulated activity accounting project. During April 2010, the IASB issued an amendment to IFRS 1 regarding the use of deemed cost for operations subject to rate regulation. Since the future of the IASB’s project on rate-regulated activity accounting is uncertain, OPG is unable to determine the impact on its accounting for rate-regulated operations and financial results. The IASB has a number of on-going projects on its agenda which may result in changes to existing IFRS prior to OPG’s conversion in 2011. OPG continues to monitor these projects and the impact that any resulting IFRS changes may have on its anticipated accounting policies, financial position or results of operations. The following table provides certain elements of the changeover plan and an assessment of the progress OPG has achieved as of March 31, 2010. This information reflects OPG’s most recent assumptions and expectations. Circumstances may arise, such as changes in IFRS, regulations or economic conditions, which could change these assumptions or expectations.

29
Selected Key Activities Milestones/Deadlines Progress to Date
Financial statement preparations Identify relevant differences between IFRS and current accounting policies and practices and design and implement solutions Evaluate and select one-time and ongoing accounting policy alternatives Benchmark findings with peer companies Prepare illustrative financial statements and related note disclosures to comply with IFRS Quantify the effects of changeover to IFRS
Assessment and quantification of the significant effects of the changeover completed by approximately the third quarter of 2010 OPG expects the IASB to issue certain guidance related to accounting for Rate-regulated activities in late-2010, and to be able to adopt such guidance effective January 1, 2011, with comparative 2010 figures Final selection of accounting policy alternatives by the changeover date
Completed the identification of IFRS differences Assessment and design of solutions to resolve differences continues Evaluation and selection of accounting policy alternatives continues During April the IASB issued an amendment to IFRS 1 regarding the use of deemed cost for operations subject to rate regulation. Since the future of the IASB’s project on Rate-regulated activities is uncertain, OPG is unable to determine the impact on its accounting for rate-regulated operations and financial results.
Training and communications Provide training to affected employees of operating units, management and the Board of Directors and relevant committees thereof, including the Audit/Risk Committee Engage subject matter experts to assist in the transition Communicate progress of change over plan to internal and external stakeholders
Provide timely training in line with changeover milestones. Target to complete training by mid-2010 Communicate effects of changeover by the fourth quarter of 2010
Completed detailed training for resources directly engaged in the changeover and general awareness training to broader group of finance employees Completed specific and relevant training to 150 finance employees Continued ongoing, periodic internal and external communications about OPG’s progress Continued use of third-party subject matter experts to assist in the transition
IT systems Identify and address IFRS differences that require changes to financial systems Evaluate and select methods to address need for dual record-keeping during 2010 (i.e., IFRS and Canadian GAAP) for comparatives and budget and planning purposes in 2011
Changes to significant systems and dual record-keeping process completed for the first quarter of 2010 Remaining changes to systems post-dual recordkeeping year by the fourth quarter of 2010
Systems changes complete to the extent possible. Further changes to information systems are largely dependent upon future changes to the IFRS standards such as the accounting for rate-regulated activities. Continued accumulation of IFRS data to enable reporting of 2010 comparative information in 2011
Contractual arrangements and compensation Identify impact of changeover on contractual arrangements, including financial covenants and employee compensation plans Make any required changes to arrangements and plans
Changes completed by the third quarter of 2010
IFRS differences with potential impacts on financial covenants and compensation plans were identified and discussed with both internal and external parties as required
Internal controls: Internal controls over financial reporting (“ICOFR”), disclosure controls and procedures (“DC&P”) and related communications Revise existing internal control processes and procedures to address significant changes to existing accounting policies and practices, including the need for dual record-keeping during 2010, and changes to financial systems Design and implement internal controls with respect to one-time changeover adjustments and related communications. For changes to accounting policies and practices identified, assess the DC&P and ICOFR design and effectiveness implications
Conduct management evaluation of new or revised controls throughout 2010 Changes will be mapped and tested to ensure that no material deficiencies exist as a result of OPG’s conversion to the IFRS accounting standards
Accounting policies and procedures, as well as their impact on controls continue to be evaluated.

30
RISK MANAGEMENT A detailed discussion of OPG’s governance structure and inherent risks is included in the 2009 annual MD&A under the heading, Risk Management. The following discussion provides an update of OPG’s risk management activities since the 2009 annual disclosure. Operational Risks Thermal Generating Stations The Lennox generating station operated under a RMR contract with the IESO as approved by the OEB for the period from October 1, 2008 to September 30, 2009. On March 30, 2010, the OPA approved an energy supply contract with terms similar to the RMR contract with the IESO, for the period from October 1, 2009 to December 31, 2010. The contract was subsequently executed in April 2010. Although the contract is renewable for a further term or terms by agreement of OPG and OPA, there is uncertainty whether the OPA will contract with OPG for the Lennox generating station beyond 2010. Negotiations with the OPA will start later this year to extend the contract beyond 2010. Major Development Projects OPG is undertaking numerous projects designed to enhance and expand its fleet of generating stations. These projects are capital intensive and require significant investments. There may be an adverse effect on the Company if OPG is unable to manage these projects to achieve the cost, schedule and quality required, if it is unable to borrow the necessary capital to undertake the projects, or if it does not fully recover its invested capital and operating costs. The major projects include possible new nuclear units at OPG’s Darlington site, the continued operation of the Pickering B nuclear generating station, the refurbishment of the existing Darlington nuclear generating station, the Niagara Tunnel project, the Lower Mattagami project, and other hydroelectric and thermal projects. Significant risk factors associated with these projects were discussed in OPG’s 2009 annual MD&A. The following discussion provides an update to the 2009 annual disclosure. Niagara Tunnel Project Uncertainty with respect to the cost and schedule for both the tunnel excavation and liner installation continues. There are a number of factors which contribute to this uncertainty, including challenging rock conditions. To address this, the cost estimate and schedule include allowances for differing rock conditions. Major equipment breakdown is also a risk factor. To mitigate this risk and minimize potential delays, the contractor is monitoring the equipment, and ensuring maintenance programs are in place and critical spare parts are available. In addition, there is risk with respect to the rate of progress for the restoration of the circular cross-section of the tunnel. The contractor has committed to supply additional resources for this operation in order to prevent an impact on the critical path for tunnel completion. OPG continues to assess the impact, if any, on the target cost and schedule.
There are also uncertainties associated with future project activities, such as the installation of the upper two-thirds of the concrete lining and tunnel pre-stress grouting. Allowances are included in the cost estimate and schedule with respect to these uncertainties. Finally, events such as tunnel failure or flood are also potential risks. The contractor has implemented tunnel convergence and cofferdam monitoring programs, and has emergency response programs in place, including safety drills and storage of redundant equipment and materials on site, in order to minimize the impact should such an event occur. Lower Mattagami Project In January 2010, OPG entered into a design-build agreement with KAP for the Lower Mattagami project. In March 2010, the Federal Minister of the Environment approved the EA required by the Canadian Environmental Assessment Act and posted an Environmental Assessment Decision Statement for the project. This Decision Statement indicated that public concerns have been taken into account and thus, there is no need to address them further through the comprehensive study. The Environmental Assessment Decision Statement also indicated that the project, taking into account the mitigation

31
measures described in the comprehensive study report, is not likely to cause significant adverse environmental effects, and the mitigation measures and follow-up program described in the comprehensive study report are appropriate for the project.
Pursuant to the Province of Ontario’s EA, the Ministry of the Environment formed the MECC in May 2010. Construction activities are expected to commence by the end of the second quarter of 2010. If construction of the project does not commence during the second quarter of 2010, there is a risk that the construction contract may need to be renegotiated or terminated. Other The Green Energy Act is expected to provide a significant amount of additional electricity from renewable energy sources. Given the potential for other producers to add significant amounts of non-dispatchable renewable resources under the Green Energy Act, OPG’s future operations and generation development activities may be significantly impacted. These impacts include the potential inability to access transmission in areas that are targeted for significant amounts of new renewable energy generation. Financial Risks OPG is exposed to a number of capital market-related risks that could adversely impact its financial and operating performance. Many of these risks are due to OPG’s exposure to volatility in commodity, equity and foreign exchange markets, and interest rate movements. Pension and OPEB costs and OPG’s Nuclear Fund values are potentially impacted by these various market and interest rate movements. OPG manages this complex array of risks to reduce the uncertainty or mitigate the potential unfavourable impact on the Company’s financial results. Despite OPG’s risk management measures, residual risk to financial results continues due to volatility in the markets. Commodity Markets Changes in the market price of electricity, or in the price of the fuels used to produce electricity, can adversely impact OPG’s earnings and cash flows from operations. To manage these risks, OPG seeks to maintain a balance between the commodity price risk inherent in its electricity production and fuel portfolios. OPG, at times, hedges its exposure to the wholesale Ontario electricity price through forward sales in the wholesale market (to the extent that opportunities exist). To manage fuel price risk, OPG has a fuel hedging program which incorporates fixed price and indexed contracts.

32
The percentages of OPG’s expected generation, emission requirements, and fuel requirements hedged are shown below:
2010 2011 2012
Estimated generation output hedged 1 Estimated fuel requirements hedged 2 Estimated nitric oxide (“NO”) emission requirement hedged 3 Estimated SO2 emission requirement hedged 3
81% 99%
100% 100%
82% 97% 100% 100%
82% 56% 100% 100%
1 Represents the portion of megawatt-hours of expected future generation production, including power purchases, for which the Company has sales commitments and contracts including the obligations under regulated pricing commitments, and agreements with the IESO, OEFC, and OPA auction sales.
2 Represents the approximate portion of megawatt hours of expected generation production (and thermal year end inventory targets) from each type of facility (thermal and nuclear) for which OPG has entered into contractual arrangements or obligations in order to secure either the availability and/or price of fuel. Excess fuel in inventories in a given year is attributed to the next year for the purpose of measuring hedge ratios.
3 Represents the approximate portion of megawatt hours of expected thermal production for which OPG has purchased, been allocated or granted emission allowances and Emission Reduction Credits to meet OPG’s obligations under Ontario Environmental Regulations 397/01.
Foreign Exchange and Interest Rate Markets OPG’s financial results are exposed to volatility in the Canadian/U.S. foreign exchange rate as fuels purchased for thermal and nuclear generation stations are paid in U.S. dollars. The magnitude of the impact of this volatility is largely a function of the quantity of the fuels purchased. In addition to this exposure, the market price of electricity in Ontario is influenced by the exchange rate due to the interaction between the Ontario and neighbouring U.S. interconnected electricity markets. In order to manage this risk OPG employs various financial instruments such as forwards and other derivative contracts in accordance with approved risk management policies. OPG has interest rate exposure on its short-term borrowings and investment programs. The majority of OPG’s existing debt is at fixed interest rates. Interest rate risk arises with the need to undertake new financing and with the potential addition of variable rate debt. The management of these risks is undertaken by using derivatives to hedge the exposure in accordance with corporate risk management policies. OPG periodically uses interest rate swap agreements to mitigate elements of interest rate risk exposure associated with anticipated new financing. As at March 31, 2010, OPG had total interest rate swap contracts outstanding with a notional principal of $505 million. Trading OPG’s trading operations are closely monitored, and total exposures are measured and reported to senior management on a daily basis. The metric used to measure the risk of this trading activity is known as “value at risk” or “VaR”, which is defined as the potential future loss, expressed in monetary terms, for a portfolio based on normal market conditions for a set period of time. The VaR limit for trading was $5 million, and VaR utilization ranged between $0.2 million to $0.4 million during the three months ended March 31, 2010, compared to $0.3 million to $0.9 million during the three months ended December 31, 2009. Credit OPG manages its exposure to various suppliers or “counterparties” by evaluating the financial condition of all counterparties and ensuring that appropriate collateral or other forms of security are held by OPG. OPG’s credit exposure as at March 31, 2010 was $420 million, including $350 million to the IESO. Over 69 percent of the remaining $70 million exposure related to investment grade counterparties.

33
Regulatory Risks The prices for electricity generated from most of OPG’s baseload hydroelectric facilities and all of the nuclear facilities that it operates are determined by the OEB based on a forecast cost of service methodology. The regulated prices remain in effect until the effective date of the OEB’s next payment amounts order. As with any regulated price established using a forecast cost of service methodology, there is an inherent risk that the prices established by the regulator may not provide for recovery of all actual costs incurred by the regulated operations, or allow the regulated operations to earn the allowed rate of return. The measurement of regulatory assets and liabilities is subject to certain estimates and assumptions, including assumptions made in the interpretation of the OEB’s decisions and the regulation. These estimates and assumptions will be reviewed as part of the OEB’s regulatory process. In the second quarter of 2010, OPG intends to file an application with the OEB for new regulated prices. In the application, OPG will also request approval to recover the balances in the deferral and variance accounts. The application will reflect a revised effective date of March 1, 2011. Other Enterprise-Wide Risks Leases and Partnerships OPG has leased its Bruce nuclear generating stations to Bruce Power and is a party to a number of partnership arrangements related to the ownership and operation of generating stations. Each of these generating stations is subject to numerous operational, financial, regulatory, and environmental risk factors. In addition, under the Bruce Lease, lease revenue is reduced in each calendar year where the annual arithmetic Average HOEP falls below $30/MWh, and certain other conditions are met. The conditional reduction to revenue in the future, embedded in the terms of the Bruce Lease, is treated as a derivative according to CICA Section 3855, Financial Instruments – Recognition and Measurement. Derivatives are measured at fair value and changes in fair value are recognized in the statement of income. As a result of a reduction in expected future Average HOEP prices, the fair value loss of the derivative has increased by $95 million for the three months ended March 31, 2010. The exposure will continue until the Bruce units that are subject to this mechanism are no longer in operation, specific units are refurbished, or when the lease agreement is terminated. This exposure is mitigated through the OEB regulatory process, since the revenue from the lease of the Bruce generating stations is included in the determination of regulated prices. Human Resources The risk associated with the availability of skilled and experienced resources continues to exist for OPG. In order to mitigate the impact of this risk, OPG has embarked upon an organization wide work force planning effort, and has established on-going monitoring processes to re-assess risks, issues and opportunities related to staffing on a regular basis. OPG also continues to improve its active succession planning program and continues to implement leadership development programs to improve the capability of its current workforce. INTERNAL CONTROLS OVER FINANCIAL REPORTING AND DISCLOSURE CONTROLS During the most recent interim period, there have been no changes in the Company’s policies and procedures and other processes that comprise its internal control over financial reporting, that have materially affected, or are reasonably likely to materially affect, the Company’s internal control over financial reporting.

34
QUARTERLY FINANCIAL HIGHLIGHTS The following tables set out selected financial information from OPG’s unaudited interim consolidated financial statements for each of the eight most recently completed quarters. This financial information has been prepared in accordance with Canadian GAAP. (millions of dollars)
March 31 2010
December 31 2009
September 30 2009
June 30 2009
Revenue after revenue limit rebate
1,444
1,390
1,345
1,397
Net income 143 67 259 306 Net income per share $0.56 $0.26 $1.01 $1.20 (millions of dollars)
March 31 2009
December 31 2008
September 30 2008
June 30 2008
Revenue after revenue limit rebate
1,481
1,621
1,513
1,385
Net (loss) income (9) (31) (142) 99 Net (loss) income per share $ (0.04) $(0.12) $(0.55) $0.39 OPG’s quarterly results are impacted by changes in demand primarily resulting from variations in seasonal weather conditions. Historically, OPG’s revenues are higher in the first and third quarters of a fiscal year as a result of winter heating demands in the first quarter and air conditioning and cooling demands in the third quarter. Additional items which impacted net income (loss) in certain quarters above are described in OPG’s 2009 annual MD&A under the heading, Quarterly Financial Highlights. Additional information about OPG, including its Annual Information Form, annual MD&A, and audited annual consolidated financial statements and notes thereto for the year ended December 31, 2009 can be found on SEDAR at www.sedar.com. SUPPLEMENTAL EARNINGS MEASURES In addition to providing net income in accordance with Canadian GAAP, OPG’s MD&A, unaudited interim consolidated financial statements as at and for the three months ended March 31, 2010 and 2009 and the notes thereto, present certain non-GAAP financial measures. These financial measures do not have standard definitions prescribed by Canadian GAAP, and therefore, may not be comparable to similar measures disclosed by other companies. OPG utilizes these measures in making operating decisions and assessing its performance. Readers of the MD&A, consolidated financial statements, and notes thereto, utilize these measures in assessing the Company’s financial performance from ongoing operations. These non-GAAP financial measures have not been presented as an alternative to net income in accordance with Canadian GAAP as an indicator of operating performance. The definitions of the non-GAAP financial measures are as follows: (1) Gross margin is defined as revenue less revenue limit rebate and fuel expense. (2) Earnings are defined as net income. For further information, please contact: Investor Relations 416-592-6700 1-866-592-6700 [email protected] www.opg.com Media Relations 416-592-4008 www.sedar.com 1-877-592-4008

Ontario Power Generation Inc. 35
INTERIM CONSOLIDATED STATEMENTS OF INCOME (LOSS) (UNAUDITED)
Three Months Ended March 31 (millions of dollars except where noted) 2010 2009 Revenue (Note 15) Revenue before revenue limit rebate 1,444 1,509 Revenue limit rebate (Note 14) - (28) 1,444 1,481 Fuel expense (Note 15) 248 261 Gross margin (Note 15) 1,196 1,220 Expenses Operations, maintenance and administration 726 742 Depreciation and amortization (Note 5) 167 178 Accretion on fixed asset removal and nuclear waste
management liabilities (Note 9) 165 159
(Earnings) losses on nuclear fixed asset removal and nuclear waste management funds (Note 9)
(141) 6
Property and capital taxes 19 26 Restructuring (Note 18) 25 - 961 1,111 Income before the following: 235 109 Other (gains) and losses (Notes 3 and 15) (1) - Income before interest and income taxes 236 109 Net interest expense 45 39 Income before income taxes 191 70 Income tax expense (Note 10) Current Future
33 31 15 48
48 79 Net income (loss) 143 (9) Basic and diluted income (loss) per common share (dollars)
0.56
(0.04)
Common shares outstanding (millions) 256.3 256.3
See accompanying notes to the interim consolidated financial statements

Ontario Power Generation Inc. 36
INTERIM CONSOLIDATED STATEMENTS OF CASH FLOWS (UNAUDITED) Three Months Ended March 31 (millions of dollars) 2010 2009 Operating activities Net income (loss) 143 (9) Adjust for non-cash items:
Depreciation and amortization (Note 5) 167 178 Accretion on fixed asset removal and nuclear waste
management liabilities (Note 9) 165 159
(Earnings) losses on nuclear fixed asset removal and nuclear waste management funds
(141) 6
Pension costs (Note 11) 31 18 Other post employment benefits and supplementary pension plans
(Note 11) 52 45
Future income taxes (Note 10) 15 48 Provision for restructuring (Note 18) 25 - Mark-to-market on derivative instruments (2) (2) Provision for used nuclear fuel 10 9 Regulatory assets and liabilities (Note 6) (134) 4 Other 1 (9)
332 447Contributions to nuclear fixed asset removal and nuclear
waste management funds (72) (87)
Expenditures on nuclear fixed asset removal and nuclear waste management
(51) (38)
Reimbursement of expenditures on nuclear fixed asset removal and nuclear waste management
26 23
Contributions to pension funds (68) (66) Expenditures on other post employment benefits and
supplementary pension plans (17) (19)
Revenue limit rebate (Note 14) - (54) Net changes to other long-term assets and liabilities 137 (17) Net changes in non-cash working capital balances (Note 16) (69) (148) Cash flow provided by operating activities 218 41 Investing activities Increase in regulatory assets (Note 6) - (1) Investment in fixed and intangible assets (177) (121) Cash flow used in investing activities (177) (122) Financing activities Issuance of long-term debt (Note 7) 580 140 Repayment of long-term debt (Note 7) (534) (177) Cash flow provided by (used in) financing activities 46 (37)
Net increase (decrease) in cash and cash equivalents 87 (118) Cash and cash equivalents, beginning of period 71 315
Cash and cash equivalents, end of period 158 197
See accompanying notes to the interim consolidated financial statements

Ontario Power Generation Inc. 37
INTERIM CONSOLIDATED BALANCE SHEETS (UNAUDITED) As at March 31 December 31 (millions of dollars) 2010 2009
Assets
Current assets Cash and cash equivalents (Note 9) 158 71 Accounts receivable (Note 4) 280 391 Fuel inventory 765 837 Prepaid expenses 72 47 Income tax recoverable 21 45 Future income taxes (Note 10) 55 51 Materials and supplies 131 132
1,482 1,574 Fixed assets (Note 15)
Property, plant and equipment 19,121 18,656 Less: accumulated depreciation 5,944 5,820
13,177 12,836 Intangible assets (Notes 2 and 15)
Intangible assets 368 370 Less: accumulated amortization 323 318
45 52 Other long-term assets
Deferred pension asset 1,036 999 Nuclear fixed asset removal and nuclear waste
management funds (Note 9) 10,449 10,246
Long-term investments (Note 3) 67 66 Long-term materials and supplies 368 388 Regulatory assets (Note 6) 1,512 1,396 Long-term accounts receivable and other assets 26 27
13,458 13,122 28,162 27,584
See accompanying notes to the interim consolidated financial statements

Ontario Power Generation Inc. 38
INTERIM CONSOLIDATED BALANCE SHEETS (UNAUDITED)
As at March 31 December 31 (millions of dollars) 2010 2009
Liabilities
Current liabilities Accounts payable and accrued charges 705 933 Long-term debt due within one year (Note 7) 633 978 Deferred revenue due within one year 12 12
1,350 1,923
Long-term debt (Note 7) 3,459 3,068
Other long-term liabilities Fixed asset removal and nuclear waste management (Note 9) 12,279 11,859 Other post employment benefits and supplementary pension plans 1,831 1,796 Long-term accounts payable and accrued charges 646 522 Deferred revenue 135 130 Future income taxes (Note 10) 655 633 Regulatory liabilities (Note 6) 195 172
15,741 15,112
Non-controlling interest (Note 17) 4 4
Shareholder’s equity Common shares 5,126 5,126 Retained earnings 2,518 2,375 Accumulated other comprehensive loss (36) (24)
7,608 7,477 28,162 27,584
Commitments and Contingencies (Notes 7, 12, and 13)
See accompanying notes to the interim consolidated financial statements
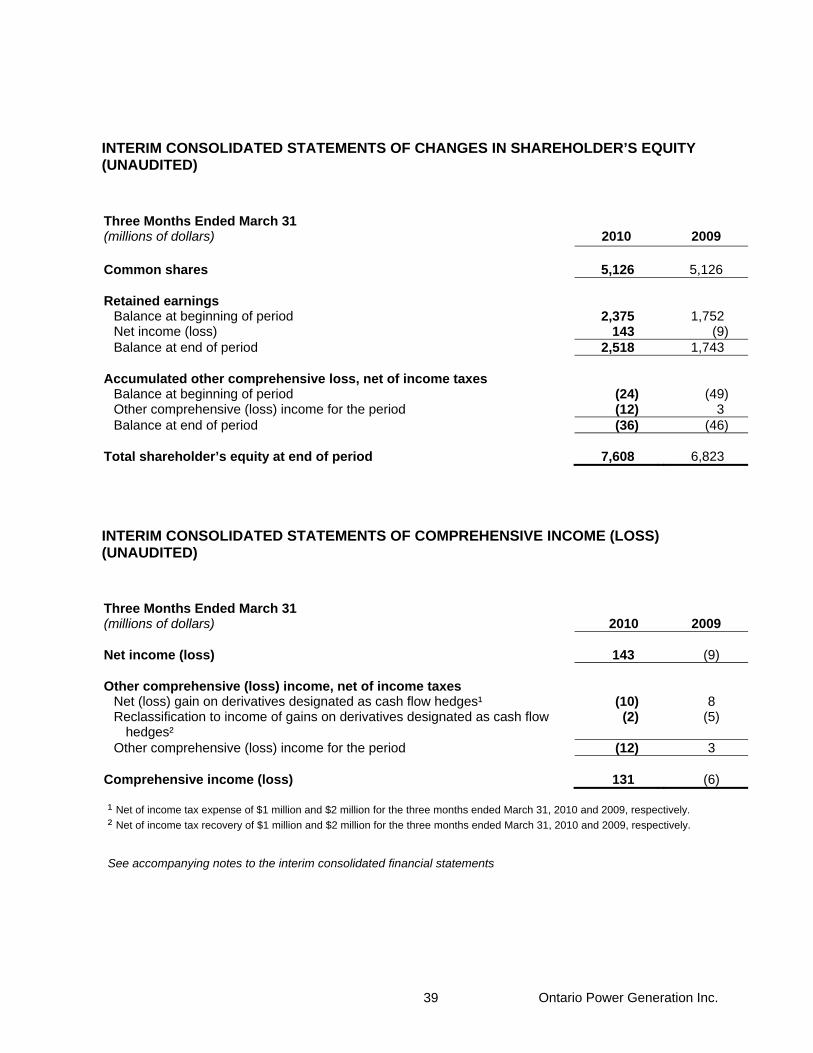
Ontario Power Generation Inc. 39
INTERIM CONSOLIDATED STATEMENTS OF CHANGES IN SHAREHOLDER’S EQUITY (UNAUDITED)
Three Months Ended March 31 (millions of dollars) 2010 2009
Common shares 5,126 5,126
Retained earnings Balance at beginning of period 2,375 1,752 Net income (loss) 143 (9) Balance at end of period 2,518 1,743
Accumulated other comprehensive loss, net of income taxes
Balance at beginning of period (24) (49) Other comprehensive (loss) income for the period (12) 3 Balance at end of period (36) (46)
Total shareholder’s equity at end of period 7,608 6,823
INTERIM CONSOLIDATED STATEMENTS OF COMPREHENSIVE INCOME (LOSS) (UNAUDITED)
Three Months Ended March 31 (millions of dollars) 2010 2009
Net income (loss) 143 (9)
Other comprehensive (loss) income, net of income taxes Net (loss) gain on derivatives designated as cash flow hedges¹ (10) 8 Reclassification to income of gains on derivatives designated as cash flow
hedges² (2) (5)
Other comprehensive (loss) income for the period (12) 3
Comprehensive income (loss) 131 (6) ¹ Net of income tax expense of $1 million and $2 million for the three months ended March 31, 2010 and 2009, respectively. ² Net of income tax recovery of $1 million and $2 million for the three months ended March 31, 2010 and 2009, respectively. See accompanying notes to the interim consolidated financial statements

Ontario Power Generation Inc. 40
NOTES TO THE INTERIM CONSOLIDATED FINANCIAL STATEMENTS FOR THE THREE MONTHS ENDED MARCH 31, 2010 AND 2009 (UNAUDITED) 1. BASIS OF PRESENTATION These interim consolidated financial statements were prepared following the same accounting policies and methods as in the most recent annual consolidated financial statements, except as discussed in Note 2 to these interim consolidated financial statements, and are presented in Canadian dollars. These interim consolidated financial statements do not contain all the disclosures required by Canadian generally accepted accounting principles (“GAAP”) for annual financial statements. Accordingly, these interim consolidated financial statements should be read in conjunction with the most recently prepared annual consolidated financial statements for the year ended December 31, 2009. The preparation of financial statements in conformity with Canadian GAAP requires management to make estimates and assumptions that affect the reported amounts of assets, liabilities, revenue and expenses, and the disclosure of contingent assets and liabilities. Actual results could differ from those estimates. Certain of the 2009 comparative amounts have been reclassified from financial statements previously presented to conform to the 2010 financial statement presentation. 2. CHANGES IN ACCOUNTING POLICIES AND ESTIMATES Changes Applicable to the Current Period Liabilities for Fixed Asset Removal and Nuclear Waste Management, and Depreciation Expense In February 2010, Ontario Power Generation Inc. (“OPG” or the “Company”) announced its decision to commence the definition phase of the refurbishment of the Darlington nuclear generating station. Accordingly, the service life of the Darlington nuclear generating station, for the purposes of calculating depreciation, was extended to 2051. The approval and the extension of service life also impacted the assumptions for OPG’s liabilities for fixed asset removal and nuclear waste management primarily due to cost increases related to additional used fuel bundles, partially offset by a decrease in the liability for decommissioning, resulting from the change in the service life assumptions. The net increase in the liabilities was $293 million, using a discount rate of 4.8 percent. The increase in liabilities was reflected with a corresponding increase in the fixed asset balance in the first quarter of 2010. As a result of these changes, OPG’s depreciation expense will decrease by $135 million on an annual basis beginning in 2010. Accounting for Regulated Operations The Canadian Institute of Chartered Accountants (“CICA”) revised its guidance on accounting for rate regulated operations, effective January 1, 2009, with amendments to Handbook Sections 1100, Generally Accepted Accounting Principles, and 3465, Income Taxes, and Accounting Guideline 19 (“AcG-19”), Disclosures by Entities Subject to Rate Regulation, as follows: • To remove the temporary exemption pertaining to the application of Section 1100 to rate regulated
operations, including the elimination of the opportunity to use industry practice as an acceptable basis for recognition and measurement of assets and liabilities arising from rate regulation;
• To amend Section 3465 to require the recognition of future income tax assets and liabilities as well as a separate regulatory asset or liability for the amount of future income taxes expected to be included in future rates and recovered from or paid to customers; and
• To amend AcG-19, as necessary, as a result of amendments to Sections 1100 and 3465.

Ontario Power Generation Inc. 41
As a result of the changes to Section 3465, OPG is required to recognize future income taxes associated with its rate regulated operations. OPG applied the changes prospectively to interim and annual consolidated financial statements beginning January 1, 2009. The impact of the change is disclosed in Note 10, Income Taxes. In addition, effective January 1, 2009, with the removal of the temporary exemption in Section 1100, the Company must now apply Section 1100 to the recognition of assets and liabilities arising from rate regulation. Certain assets and liabilities arising from rate regulation continue to have specific guidance under a primary source of Canadian GAAP that applies only to the particular circumstances described therein, including those arising under Section 1600, Consolidated Financial Statements, Section 3061, Property, Plant and Equipment, Section 3465, and Section 3475, Disposal of Long-Lived Assets and Discontinued Operations. Other assets and liabilities arising from rate regulation do not have specific guidance under a primary source of Canadian GAAP. Therefore, Section 1100 directs the Company to adopt accounting policies that are developed through the exercise of professional judgment and the application of concepts described in Section 1000, Financial Statement Concepts. In developing these accounting policies, the Company may consult other sources including pronouncements issued by bodies authorized to issue accounting standards in other jurisdictions. Therefore, in accordance with Section 1100, the Company has determined that these assets and liabilities qualify for recognition under Canadian GAAP and this recognition is consistent with the Financial Accounting Standards Board Accounting Standards Codification Topic 980, Accounting for the Effects of Certain Types of Regulation (formerly Financial Accounting Standards No. 71). As a result, the removal of the temporary exemption has no effect on the Company’s interim consolidated financial statements. Changes Applicable to Future Reporting Periods In February 2008, the Canadian Accounting Standards Board confirmed that Publicly Accountable Enterprises will be required to transition from Canadian GAAP to International Financial Reporting Standards (“IFRS”), as issued by the International Accounting Standards Board (“IASB”), for interim and annual financial reporting purposes of fiscal years beginning on or after January 1, 2011. IFRS are premised on a conceptual framework similar to Canadian GAAP; however, significant differences exist in certain matters of recognition, measurement and disclosure. In line with OPG’s IFRS conversion project, an assessment has been completed to identify the key accounting differences from Canadian GAAP. OPG’s assessment of the impact of IFRS will depend on the IFRS standards in effect at the time of transition and accounting elections made. Proposed changes to the IFRS accounting standards have the potential to introduce additional significant accounting differences. OPG’s interim consolidated financial statements, as currently disclosed in accordance with Canadian GAAP, will be significantly different when presented in accordance with IFRS. OPG will publish its first consolidated financial statements prepared in accordance with IFRS for the three months ending and as at March 31, 2011, and for the corresponding comparative periods. The opening balance sheet as at January 1, 2010 will be disclosed in the March 31, 2011 interim consolidated financial statements. 3. INVESTMENTS IN ASSET-BACKED COMMERCIAL PAPER Pursuant to the terms of a restructuring plan announced by the Pan-Canadian Investors Committee for third-party Asset-Backed Commercial Paper (“ABCP”), OPG's short-term commercial paper was exchanged for longer term notes of approximately $58 million in January 2009. OPG received five classes of notes, which are supported by margin funding facilities from third-party asset providers, Canadian banks, and governments. OPG replaced existing ABCP notes that had a net book value of $35 million ($58 million book value less a provision of $23 million) with new ABCP notes of $35 million, which represented the fair value of the new ABCP notes. The restructured notes are expected to have a maturity of eight to nine years. The exact maturity will be determined by the timing of the release of collateral as underlying swap trades mature. The stated maturity of the notes is 2056.

Ontario Power Generation Inc. 42
OPG classified the new ABCP notes for the purposes of measurement as held-for-trading. Fair value was determined based on a discounted cash flow model. In the first quarter of 2010, the fair value of the ABCP notes increased by $1 million as a result of improved market conditions. The increase is reflected in Other (Gains) and Losses in the interim consolidated statements of income (loss). As at March 31, 2010, the ABCP holdings were valued at $37 million (December 31, 2009 – $36 million). OPG continues to monitor the development of a secondary market. 4. SALE OF ACCOUNTS RECEIVABLE In October 2003 the Company signed an agreement to sell an undivided co-ownership interest in its current and future accounts receivable (the “receivables”) to an independent trust. The Company also retains an undivided co-ownership interest in the receivables sold to the trust. Under the agreement, OPG continues to service the receivables. The transfer provides the trust with ownership of a share of the payments generated by the receivables, computed on a monthly basis. The trust’s recourse to the Company is generally limited to its income earned on the receivables. In accordance with the receivable purchase agreement, OPG reduced the securitized receivable balance by $50 million, from $300 million to $250 million in May and June of 2009 primarily due to lower cash flows from the Independent Electricity System Operator. During the third quarter of 2009, OPG renewed the agreement with a maturity date of August 31, 2010, and an amended commitment of $250 million. The accounts receivable reported and securitized by the Company are as follows: Principal Amount of
Receivables as at
March 31 December 31 (millions of dollars) 2010 2009 Total receivables portfolio 1 333 436 Receivables sold 250 250 Receivables retained
83
186
1 Amount represents receivables outstanding, including receivables that have been securitized, which the Company continues to service.
The pre-tax charges and average cost of funds are as follows: Three Months Ended March 31 (millions of dollars) 2010 2009 Pre-tax charges 1 2 Average cost of funds (percent) 1.0 2.5

Ontario Power Generation Inc. 43
5. DEPRECIATION AND AMORTIZATION Depreciation and amortization expense for the three months ended March 31, 2010 and 2009 consists of the following: Three Months Ended March 31 (millions of dollars) 2010 2009 Depreciation 136 149 Amortization of intangible assets 5 6 Amortization of regulatory assets and liabilities (Note 6) 25 21 Nuclear waste management costs 1 2 167 178 Interest capitalized to construction in progress at an average rate of six percent during the three months ended March 31, 2010 (three months ended March 31, 2009 – six percent) was $18 million (three months ended March 31, 2009 – $17 million). 6. REGULATORY ASSETS AND LIABILITIES The Ontario Energy Board’s (“OEB”) decision issued in the fourth quarter of 2008 authorized certain variance and deferral accounts effective April 1, 2008. In that decision the OEB also ruled on the disposition of the balances previously recorded by OPG in variance and deferral accounts as at December 31, 2007 pursuant to the regulation under the Ontario Energy Board Act, 1998. During the fourth quarter of 2009, the OEB issued a decision on the treatment of variance and deferral accounts for the period after December 31, 2009. During the three months ended March 31, 2010, the Company recorded additions to the variance and deferral accounts authorized by the OEB, and amortized approved regulatory balances based on recovery periods established by the OEB. OPG also recorded interest on outstanding regulatory balances at the interest rate prescribed by the OEB, which was 0.55 percent during the three months ended March 31, 2010. The interest rate fluctuated in the range of 0.55 percent to 2.45 percent during the year ended December 31, 2009. In its next application to the OEB, OPG will apply for recovery of regulatory balances recorded subsequent to December 31, 2007, including balances recorded for the three months ended March 31, 2008 pursuant to the regulation under the Ontario Energy Board Act, 1998. Beginning on January 1, 2009, OPG also started recording a regulatory asset or liability related to the recognition of future income taxes, as required by the CICA’s amended guidance for accounting for rate regulated operations described in Notes 2 and 10.
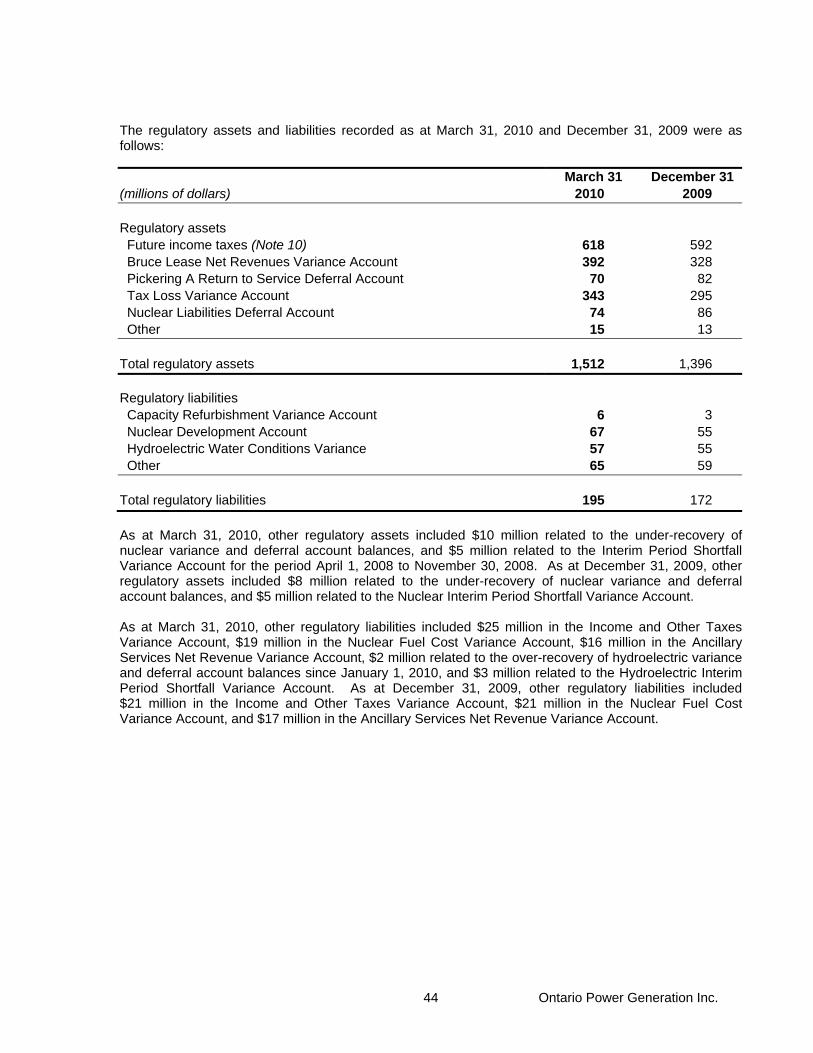
Ontario Power Generation Inc. 44
The regulatory assets and liabilities recorded as at March 31, 2010 and December 31, 2009 were as follows: March 31 December 31 (millions of dollars) 2010 2009 Regulatory assets Future income taxes (Note 10) 618 592 Bruce Lease Net Revenues Variance Account 392 328 Pickering A Return to Service Deferral Account 70 82 Tax Loss Variance Account 343 295 Nuclear Liabilities Deferral Account 74 86 Other 15 13 Total regulatory assets 1,512 1,396 Regulatory liabilities Capacity Refurbishment Variance Account 6 3 Nuclear Development Account 67 55 Hydroelectric Water Conditions Variance 57 55 Other 65 59 Total regulatory liabilities 195 172 As at March 31, 2010, other regulatory assets included $10 million related to the under-recovery of nuclear variance and deferral account balances, and $5 million related to the Interim Period Shortfall Variance Account for the period April 1, 2008 to November 30, 2008. As at December 31, 2009, other regulatory assets included $8 million related to the under-recovery of nuclear variance and deferral account balances, and $5 million related to the Nuclear Interim Period Shortfall Variance Account. As at March 31, 2010, other regulatory liabilities included $25 million in the Income and Other Taxes Variance Account, $19 million in the Nuclear Fuel Cost Variance Account, $16 million in the Ancillary Services Net Revenue Variance Account, $2 million related to the over-recovery of hydroelectric variance and deferral account balances since January 1, 2010, and $3 million related to the Hydroelectric Interim Period Shortfall Variance Account. As at December 31, 2009, other regulatory liabilities included $21 million in the Income and Other Taxes Variance Account, $21 million in the Nuclear Fuel Cost Variance Account, and $17 million in the Ancillary Services Net Revenue Variance Account.
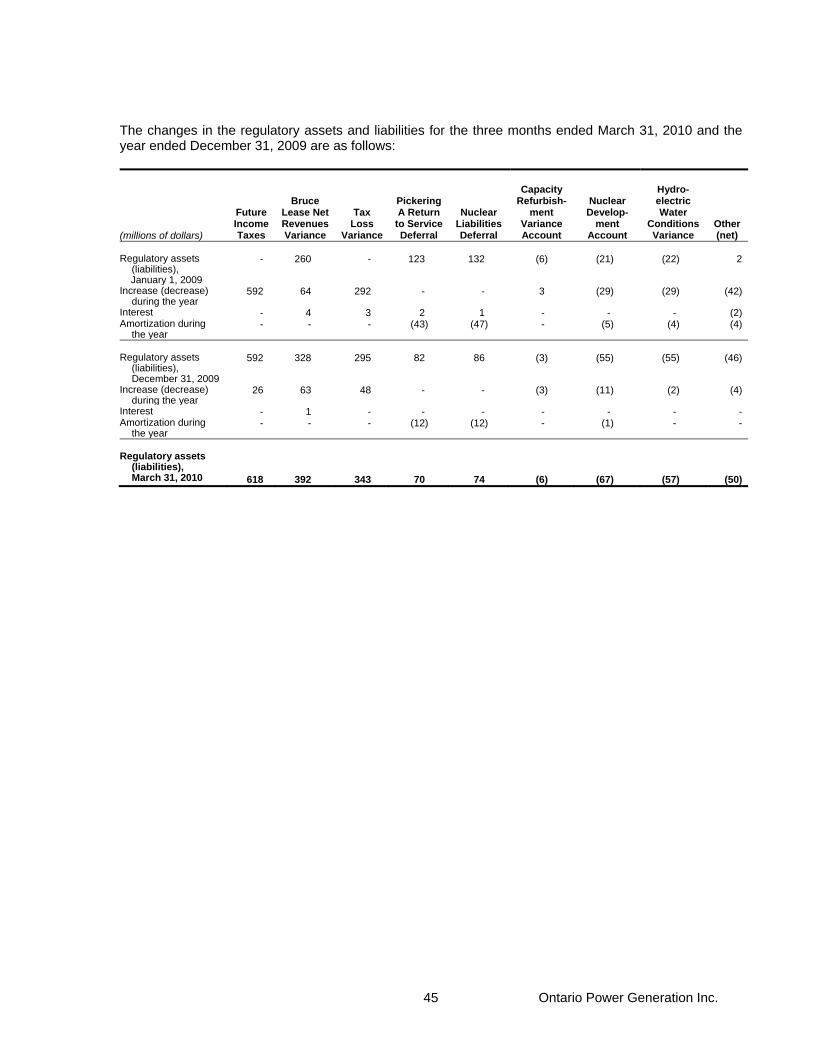
Ontario Power Generation Inc. 45
The changes in the regulatory assets and liabilities for the three months ended March 31, 2010 and the year ended December 31, 2009 are as follows:
(millions of dollars)
Future Income Taxes
Bruce Lease Net RevenuesVariance
Tax Loss
Variance
Pickering A Return
to Service Deferral
Nuclear Liabilities Deferral
Capacity Refurbish-
ment Variance Account
Nuclear Develop-
ment Account
Hydro- electric Water
Conditions Variance
Other (net)
Regulatory assets
(liabilities), January 1, 2009
- 260 - 123 132 (6) (21) (22) 2
Increase (decrease) during the year
592 64 292 - - 3 (29) (29) (42)
Interest - 4 3 2 1 - - - (2) Amortization during
the year - - - (43) (47) - (5) (4) (4)
Regulatory assets
(liabilities), December 31, 2009
592 328 295 82 86 (3) (55) (55) (46)
Increase (decrease) during the year
26 63 48 - - (3) (11) (2) (4)
Interest - 1 - - - - - - - Amortization during
the year - - - (12) (12) - (1) - -
Regulatory assets
(liabilities), March 31, 2010
618
392
343
70
74
(6)
(67)
(57)
(50)
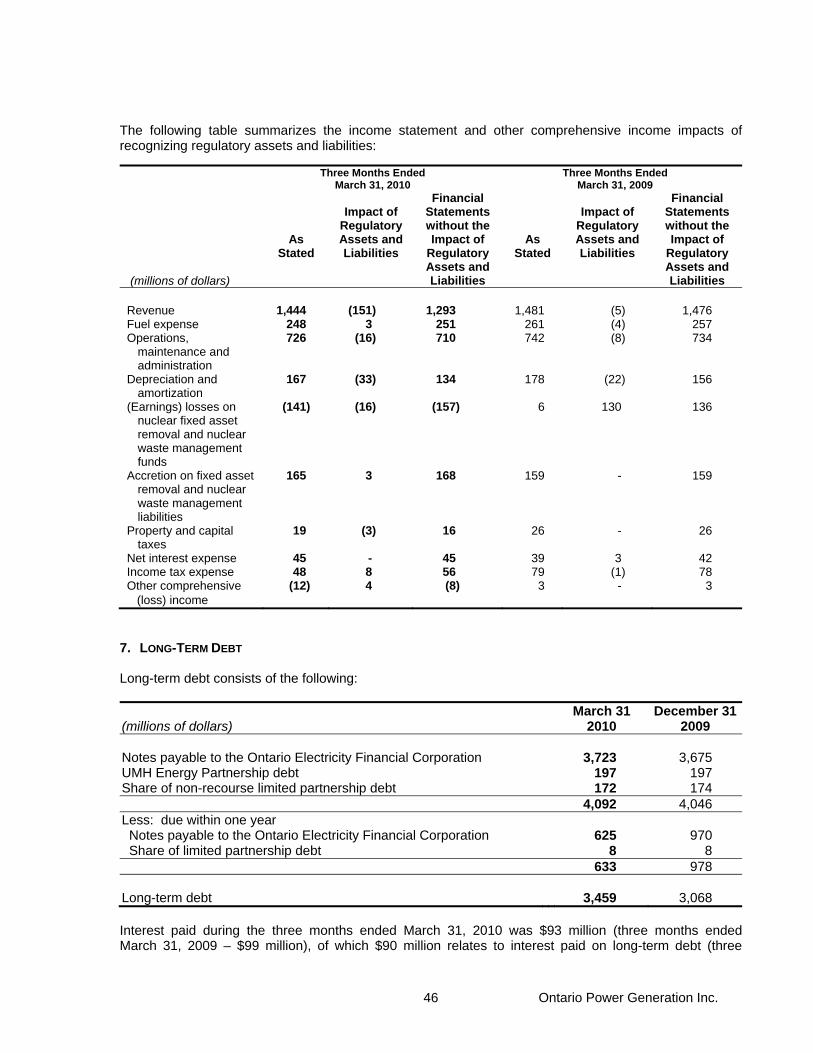
Ontario Power Generation Inc. 46
The following table summarizes the income statement and other comprehensive income impacts of recognizing regulatory assets and liabilities:
Three Months Ended March 31, 2010
Three Months Ended March 31, 2009
(millions of dollars)
As
Stated
Impact of Regulatory Assets and Liabilities
Financial Statements without the Impact of
Regulatory Assets and Liabilities
As Stated
Impact of
Regulatory Assets and Liabilities
Financial Statements without the Impact of
Regulatory Assets and Liabilities
Revenue 1,444 (151) 1,293 1,481 (5) 1,476 Fuel expense 248 3 251 261 (4) 257 Operations,
maintenance and administration
726 (16) 710 742 (8) 734
Depreciation and amortization
167 (33) 134 178 (22) 156
(Earnings) losses on nuclear fixed asset removal and nuclear waste management funds
(141) (16) (157) 6 130 136
Accretion on fixed asset removal and nuclear waste management liabilities
165 3 168 159 - 159
Property and capital taxes
19 (3) 16 26 - 26
Net interest expense 45 - 45 39 3 42 Income tax expense 48 8 56 79 (1) 78 Other comprehensive (12) 4 (8) 3 - 3 (loss) income
7. LONG-TERM DEBT Long-term debt consists of the following: March 31 December 31(millions of dollars) 2010 2009 Notes payable to the Ontario Electricity Financial Corporation UMH Energy Partnership debt
3,723 197
3,675 197
Share of non-recourse limited partnership debt 172 174 4,092 4,046 Less: due within one year Notes payable to the Ontario Electricity Financial Corporation 625 970 Share of limited partnership debt 8 8 633 978 Long-term debt 3,459 3,068 Interest paid during the three months ended March 31, 2010 was $93 million (three months ended March 31, 2009 – $99 million), of which $90 million relates to interest paid on long-term debt (three
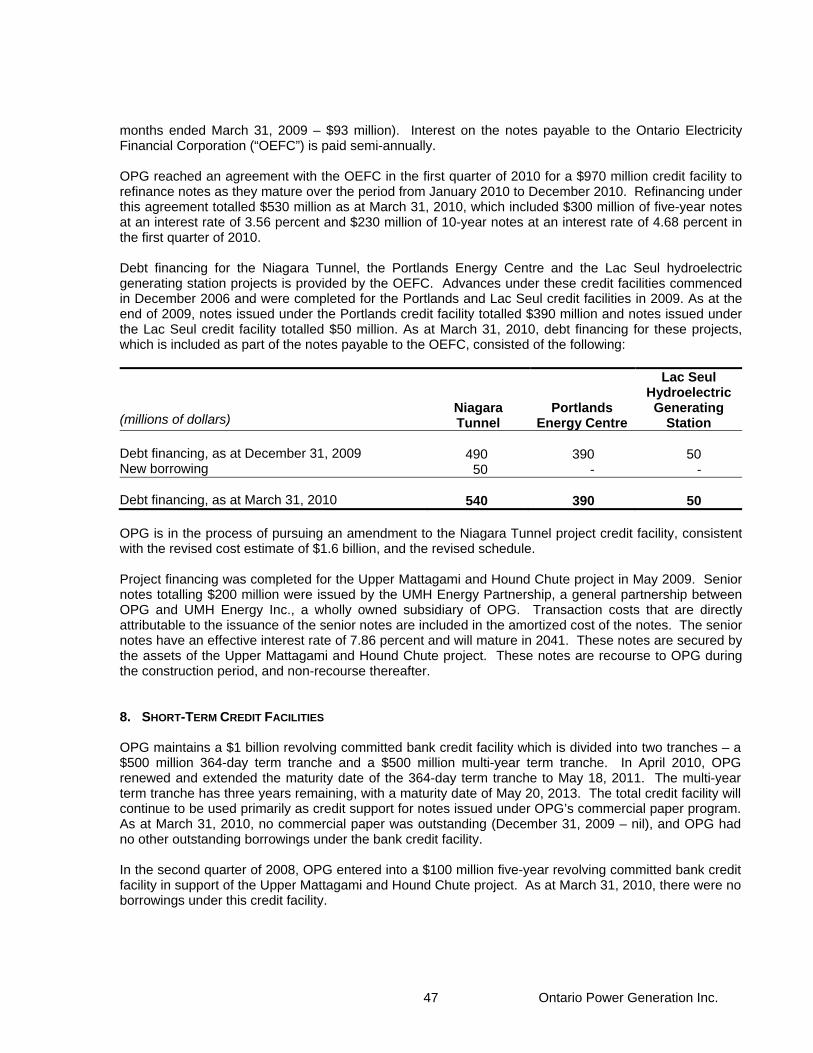
Ontario Power Generation Inc. 47
months ended March 31, 2009 – $93 million). Interest on the notes payable to the Ontario Electricity Financial Corporation (“OEFC”) is paid semi-annually. OPG reached an agreement with the OEFC in the first quarter of 2010 for a $970 million credit facility to refinance notes as they mature over the period from January 2010 to December 2010. Refinancing under this agreement totalled $530 million as at March 31, 2010, which included $300 million of five-year notes at an interest rate of 3.56 percent and $230 million of 10-year notes at an interest rate of 4.68 percent in the first quarter of 2010. Debt financing for the Niagara Tunnel, the Portlands Energy Centre and the Lac Seul hydroelectric generating station projects is provided by the OEFC. Advances under these credit facilities commenced in December 2006 and were completed for the Portlands and Lac Seul credit facilities in 2009. As at the end of 2009, notes issued under the Portlands credit facility totalled $390 million and notes issued under the Lac Seul credit facility totalled $50 million. As at March 31, 2010, debt financing for these projects, which is included as part of the notes payable to the OEFC, consisted of the following:
(millions of dollars) Niagara Tunnel
Portlands Energy Centre
Lac Seul Hydroelectric Generating
Station Debt financing, as at December 31, 2009 490 390 50 New borrowing 50 - - Debt financing, as at March 31, 2010 540 390 50 OPG is in the process of pursuing an amendment to the Niagara Tunnel project credit facility, consistent with the revised cost estimate of $1.6 billion, and the revised schedule. Project financing was completed for the Upper Mattagami and Hound Chute project in May 2009. Senior notes totalling $200 million were issued by the UMH Energy Partnership, a general partnership between OPG and UMH Energy Inc., a wholly owned subsidiary of OPG. Transaction costs that are directly attributable to the issuance of the senior notes are included in the amortized cost of the notes. The senior notes have an effective interest rate of 7.86 percent and will mature in 2041. These notes are secured by the assets of the Upper Mattagami and Hound Chute project. These notes are recourse to OPG during the construction period, and non-recourse thereafter. 8. SHORT-TERM CREDIT FACILITIES OPG maintains a $1 billion revolving committed bank credit facility which is divided into two tranches – a $500 million 364-day term tranche and a $500 million multi-year term tranche. In April 2010, OPG renewed and extended the maturity date of the 364-day term tranche to May 18, 2011. The multi-year term tranche has three years remaining, with a maturity date of May 20, 2013. The total credit facility will continue to be used primarily as credit support for notes issued under OPG’s commercial paper program. As at March 31, 2010, no commercial paper was outstanding (December 31, 2009 – nil), and OPG had no other outstanding borrowings under the bank credit facility. In the second quarter of 2008, OPG entered into a $100 million five-year revolving committed bank credit facility in support of the Upper Mattagami and Hound Chute project. As at March 31, 2010, there were no borrowings under this credit facility.

Ontario Power Generation Inc. 48
9. FIXED ASSET REMOVAL AND NUCLEAR WASTE MANAGEMENT The liability for fixed asset removal and nuclear waste management on a present value basis consists of the following: (millions of dollars)
March 31 2010
December 31 2009
Liability for nuclear used fuel management 7,265 6,525 Liability for nuclear decommissioning and low and intermediate level
waste management 4,864 5,186
Liability for non-nuclear fixed asset removal 150 148 Fixed asset removal and nuclear waste management liabilities 12,279 11,859 The changes in the fixed asset removal and nuclear waste management liabilities for the three months ended March 31, 2010 and the year ended December 31, 2009 are as follows: (millions of dollars)
March 31 2010
December 31 2009
Liabilities, beginning of period 11,859 11,384 Increase in liabilities due to accretion 168 631 Increase in liabilities due to changes in assumptions related to the
decision to commence the definition phase of the refurbishment of the Darlington nuclear generating station
293 -
Increase in liabilities due to nuclear used fuel and nuclear waste management variable expenses
10 42
Liabilities settled by expenditures on waste management (51) (189) Change in the liabilities for non-nuclear fixed asset removal - (9) Liabilities, end of period 12,279 11,859 The cash and cash equivalents balance as of March 31, 2010 included $7 million of cash and cash equivalents that are for the use of nuclear waste management activities (December 31, 2009 – $11 million). Ontario Nuclear Funds Agreement OPG sets aside and invests funds held in segregated custodian and trustee accounts specifically for discharging its nuclear fixed asset removal and nuclear waste management liabilities.

Ontario Power Generation Inc. 49
The nuclear fixed asset removal and nuclear waste management funds (“Nuclear Funds”) as at March 31, 2010 and December 31, 2009 consist of the following: Fair Value March 31 December 31(millions of dollars) 2010 2009 Decommissioning Segregated Fund 4,942 4,876 Used Fuel Segregated Fund1 5,598 5,403 Due to Province – Used Fuel Fund (91) (33) 5,507 5,370 10,449 10,246 1 The Ontario NFWA Trust represented $1,792 million as at March 31, 2010 (December 31, 2009 – $1,693 million) of the Used
Fuel Fund on a fair value basis. As required by the terms of the Ontario Nuclear Funds Agreement, the Province of Ontario (the “Province”) has provided a Provincial Guarantee to the Canadian Nuclear Safety Commission (“CNSC”) on behalf of OPG. The Nuclear Safety and Control Act (Canada) requires OPG to have sufficient funds available to discharge the current nuclear decommissioning and waste management liabilities. The Provincial Guarantee provides for any shortfall between the long-term liabilities and the current market value of the Used Fuel Segregated Fund and the Decommissioning Segregated Fund. OPG pays the Province an annual guarantee fee of 0.5 percent of the amount of the Provincial Guarantee provided by the Province. In December 2009, the CNSC approved an increase in the amount of the Provincial Guarantee to $1,545 million, to be effective on March 1, 2010. The value of this Provincial Guarantee will be in effect through to the end of 2012, when the next reference plan for the CNSC is required to be submitted. The increase was primarily a result of the market value losses experienced by the Nuclear Funds in 2008. In 2009, OPG paid the annual guarantee fee of $3.8 million based on a Provincial Guarantee amount of $760 million. In accordance with Section 3855, the investments in the Nuclear Funds and the corresponding payables to the Province are classified as held-for-trading and are measured at fair value with realized and unrealized gains and losses recognized in OPG’s interim consolidated financial statements. The earnings (losses) on the Nuclear Funds for the three months ended March 31, 2010 and 2009 are as follows: Three Months Ended March 31 March 31 (millions of dollars) 2010 2009 Decommissioning Fund 87 (119) Used Fuel Fund 70 (17) Bruce Revenues and Cost Variance (Note 6) (16) 130 Total earnings (losses)
141
(6)
During the first quarter of 2010, OPG recorded a reduction to the Bruce Lease Net Revenues Variance Account regulatory asset of $16 million, which reduced the reported earnings from the Nuclear Funds.

Ontario Power Generation Inc. 50
For the same period in 2009, OPG recorded an increase to the Bruce Lease Net Revenues Variance Account regulatory asset of $130 million, which reduced the reported losses from the Nuclear Funds. 10. INCOME TAXES From April 1, 2005 to December 31, 2008, OPG followed the liability method of tax accounting for its unregulated operations and the taxes payable method for the rate regulated segments of its business. Under the liability method, future income tax assets and liabilities are determined based on differences between the accounting and tax bases of assets and liabilities and measured using the substantively enacted tax rates and laws that will be in effect when the differences are expected to reverse. Under the taxes payable method, OPG did not recognize future income taxes relating to the rate regulated segments of its business, to the extent those future income taxes were expected to be recovered or refunded through future regulated prices charged to customers. As discussed in Note 2, Changes in Accounting Policies and Estimates, effective January 1, 2009, OPG is required to recognize future income taxes associated with its rate regulated operations, including future income taxes on temporary differences related to the regulatory assets and liabilities recognized for accounting purposes. Accordingly, on January 1, 2009, OPG recorded a future income tax liability of $340 million, being the cumulative future income tax liability on January 1, 2009 related to differences between the accounting and tax bases of assets and liabilities, measured using the substantively enacted tax rates and laws that will be in effect when the differences are expected to reverse, and recorded a corresponding regulatory asset. OPG also recorded an additional future income tax liability and a corresponding regulatory asset of $126 million for future income taxes resulting from regulatory assets that were recorded due to amendments to Section 3465. Effective January 1, 2009, OPG follows the liability method of tax accounting for all its business segments and records a corresponding regulatory asset or liability for the future income taxes that are expected to be recovered or refunded through future regulated prices charged to customers. During the three months ended March 31, 2010, OPG recorded an increase to the future income tax liability of $26 million, which is expected to be recovered through future regulated prices, and recorded a corresponding increase to the regulatory asset for future income taxes. As a result, the future income tax expense for the three months ended March 31, 2010 was not impacted. The increase in the future income tax liability for the three months ended March 31, 2010 included $8 million related to the increase to the regulatory asset for future income taxes. The OEB’s decision in 2008 on OPG’s new payment amounts established an Income and Other Taxes Variance Account retrospective to April 1, 2008. The account captures variances in the income tax expense for the regulated business caused by changes in tax rates or rules under the Income Tax Act (Canada) and the Corporations Tax Act (Ontario), as modified by the Electricity Act, 1998, as well as variances caused by reassessments. Variances in income tax expense from reassessments of prior taxation years that have an impact on taxes payable for the years after April 1, 2008 are also recorded in the account. During the three months ended March 31, 2010, OPG recorded $4 million in the account (March 31, 2009 – nil). The amount of cash income taxes paid during the three months ended March 31, 2010 was $8 million (three months ended March 31, 2009 – $147 million).

Ontario Power Generation Inc. 51
11. PENSION AND OTHER POST EMPLOYMENT BENEFIT COSTS Total benefit costs for the three months ended March 31, 2010 and 2009 are as follows: Three Months Ended March 31 (millions of dollars) 2010 2009 Registered pension plans 31 18 Supplementary pension plans 5 4 Other post employment benefits 47 41 Pension and other post employment benefit costs
83
63
12. FINANCIAL INSTRUMENTS OPG’s risk management governance structure is designed to effectively identify, measure, monitor, and report on key risk management activities across the Company. Risk management activities are coordinated by a centralized Corporate Risk Management group led by the Chief Risk Officer. Risks that would prevent business units from achieving business plan objectives are identified at the business unit level. Senior management sets risk limits for the financing, procurement, and trading activities of the Company and ensures that effective risk management policies and processes are in place to ensure compliance with such limits in order to maintain an appropriate balance between risk and return. OPG's risk management process aims to continually evaluate the effectiveness of risk mitigation activities for identified key risks. The findings from this evaluation process are reported quarterly to the Audit/Risk Committee of the Board of Directors. OPG is exposed to risks related to changes in electricity prices associated with a wholesale spot market for electricity in Ontario, changes in interest rates, and movements in foreign currency that affect its assets, liabilities, and forecast transactions. Select derivative instruments are used to limit such risks. Derivatives are used as hedging instruments, as well as for trading purposes. Derivatives and Hedging At the inception of a hedging relationship, OPG documents the relationship between the hedging instrument and the hedged item, its risk management objective and its strategy for undertaking the hedge. OPG also requires a documented assessment, both at hedge inception and on an ongoing basis, of whether or not the derivatives that are used in hedging transactions are highly effective in offsetting the changes attributable to the hedged risks in the fair values or cash flows of the hedged items. Hedge accounting is applied when the derivative instrument is designated as a hedge and is expected to be effective throughout the life of the hedged item. When such a derivative instrument hedge ceases to exist or be effective as a hedge, or when designation of a hedging relationship is terminated, any associated deferred gains or losses are carried forward to be recognized in income in the same period as the corresponding gains or losses associated with the hedged item. When a hedged item ceases to exist, any associated deferred gains or losses are recognized in the interim consolidated statements of income (loss). Derivative Instruments Qualifying for Hedge Accounting The following table provides the estimated fair value of derivative instruments designated as hedges. The majority of OPG’s derivative instruments are treated as hedges, with gains or losses recognized in net income (loss) upon settlement when the underlying transactions occur.

Ontario Power Generation Inc. 52
OPG holds financial commodity derivatives primarily to hedge the commodity price exposure associated with changes in the price of electricity. (millions of dollars except where noted)
Notional Quantity
Terms FairValue
Notional Quantity
Terms FairValue
March 31, 2010 December 31, 2009
Electricity derivative instruments 0.3TWh 1yr 15 0.4TWh 1 yr 16Floating-to-fixed interest rate
hedges 37 1 – 9 yrs (4) 38 1–10 yrs (4)
Forward start interest rate hedges
505 1-13 yrs (6) 490 1–13 yrs 3
One of the Company’s joint ventures is exposed to changes in interest rates. The joint venture entered into an interest rate swap to manage the risk arising from fluctuations in interest rates by swapping the short-term floating interest rate with a fixed rate of 5.33 percent. OPG’s proportionate interest in the swap is 50 percent and is accounted for as a hedge. Net gains of $2 million related to derivative instruments qualifying for hedge accounting were recognized in net income during the three months ended March 31, 2010. This amount was previously recorded in other comprehensive loss. Existing net gains of $15 million deferred in accumulated other comprehensive loss at March 31, 2010 are expected to be reclassified to net income (loss) within the next 12 months. Derivative Instruments Not Qualifying for Hedge Accounting The carrying amount (fair value) of commodity derivative instruments not designated for hedging purposes is as follows: (millions of dollars except where noted)
Notional Quantity
FairValue
Notional Quantity
FairValue
March 31, 2010 December 31, 2009
Commodity derivative instruments Assets 3.4 TWh 8 3.6 TWh 7 Liabilities 0.8 TWh (7) 1.3 TWh (6)
1 1 Market liquidity reserve - (1)
Total 1 - Under the Bruce Lease, lease revenue is reduced in each calendar year where the annual arithmetic average of the Hourly Ontario Electricity Price (“Average HOEP”) falls below $30/MWh, and if certain other conditions are met. The conditional reduction to revenue included in the lease agreement is treated as a derivative according to CICA Section 3855, Financial Instruments – Recognition and Measurement. OPG reported a liability of $213 million as at March 31, 2010 (December 31, 2009 - $118 million), which reflected the fair value of a derivative embedded in the Bruce Power lease agreement. This increase in the fair value was primarily due to reductions in the expected future Average HOEP. Under reasonably possible alternative assumptions, the effect of changing expected future electricity prices ranged from a decrease to long-term accounts payable of $107 million to an increase of $93 million. This sensitivity analysis is determined based on the existing assessment of market conditions with consideration of historical changes in electricity prices. The income statement impact as a result of changes to the liability is offset by the impact of the Bruce Lease Net Revenues Variance Account.

Ontario Power Generation Inc. 53
Fair Value Fair value is the value that a financial instrument can be closed out or sold, in a transaction with a willing and knowledgeable counterparty. The fair value of financial instruments traded in active markets is based on quoted market prices at the balance sheet date. A market is regarded as active if quoted prices are readily and regularly available from an exchange, dealer, broker, industry group, pricing service, or regulatory agency, and those prices represent actual and regularly occurring market transactions on an arm’s length basis. The quoted market price used for financial assets held by OPG is the current bid price. For financial instruments which do not have quoted market prices directly available, fair values are estimated using forward price curves developed from observable market prices or rates which may include the use of valuation techniques or models based, wherever possible, on assumptions supported by observable market prices or rates prevailing at the dates of the interim consolidated balance sheets. This is the case for over-the-counter derivatives and securities, which include energy commodity derivatives, foreign exchange derivatives, interest rate swap derivatives, and fund investments. Valuation models use general assumptions and market data and therefore do not reflect the specific risks and other factors that would affect a particular instrument’s fair value. The methodologies used for calculating the fair value adjustments are reviewed on an ongoing basis to ensure that they remain appropriate. 13. COMMITMENTS AND CONTINGENCIES Litigation Various legal proceedings are pending against OPG or its subsidiaries covering a wide range of matters that arise in the ordinary course of its business activities. On August 9, 2006, a Notice of Action and Statement of Claim in the amount of $500 million was served on OPG and Bruce Power L.P. by British Energy Limited and British Energy International Holdings Limited ("British Energy"). The British Energy claim against OPG pertains to corrosion in the Bruce Unit 8 Steam Generators, in particular erosion of the support plates through which the boiler tubes pass. The claim amount includes $65 million due to an extended outage to repair some of the alleged damage. The balance of the amount claimed is based on an increased probability the steam generators will have to be replaced or the unit taken out of service prematurely. OPG leased the Bruce nuclear generating stations to Bruce Power L.P. in 2001. British Energy is involved in arbitration with the current owners of Bruce Power L.P. regarding an alleged breach of British Energy’s representations and warranties to the current owners when they purchased British Energy’s interest in Bruce Power L.P. (the “Arbitration”). If British Energy is successful in defending against the Arbitration claim, they will not have suffered any damages to attempt to recoup from OPG. This Arbitration commenced on April 5, 2010 and is scheduled to conclude in May 2010. The arbitrator may take some time to come to a decision following the conclusion of the Arbitration. British Energy previously indicated that they did not require OPG or Bruce Power L.P. to actively defend the court action until the conclusion of the Arbitration. Although the Arbitration has not been heard, British Energy has now requested that OPG file a Statement of Defence. OPG and Bruce Power L.P. advised British Energy that if British Energy wishes the court action to proceed prior to the conclusion of the Arbitration, the defendants would bring a motion for a Stay of proceedings, a Dismissal of the current action or, in the alternative, a motion to extend the time for service of the Statement of Defence until the

Ontario Power Generation Inc. 54
conclusion of the arbitration. That motion was scheduled to be heard March 5, 2010 but was adjourned at the request of British Energy. The return date of that motion is yet to be set. In September 2008, a certain First Nation has served a Notice of Action against the Government of Canada, the Province of Ontario, OPG, and the OEFC claiming damages in the amount of $200 million arising from breach of contract, fiduciary duty, trespass to property, negligence, nuisance, misrepresentation, breach of riparian rights and unlawful and unjustifiable infringement of the aboriginal and treaty rights, and $0.5 million in special damages. OPG continues to assess the merits of the litigation. A Notice of Arbitration was served upon OPG and OEFC by a First Nation. The arbitration concerns whether OPG breached an Agreement to use its "best efforts" to engage the Province in discussion with the First Nation concerning the sharing of benefits related to hydroelectric development. The arbitration hearing has concluded and the parties are waiting for the decision of the Arbitrator. The arbitration is not expected to have any material impact on the Company's financial position. Certain First Nations have commenced actions for interference with reserve and traditional land rights. OPG has been brought into certain actions by a First Nation against other parties as a third party defendant. The claims by some of these First Nations against OPG total $70 million and the other claims are for unspecified amounts. Each of these matters is subject to various uncertainties. Some of these matters may be resolved unfavourably with respect to OPG and could have a significant effect on OPG’s financial position. Management has provided for contingencies that are determined to be likely and are reasonably measurable. Environmental OPG was required to assume certain environmental obligations from Ontario Hydro. A provision of $76 million was established as at April 1, 1999 for such obligations. As at March 31, 2010 and December 31, 2009, the remaining provision was $40 million. Current operations are subject to regulation with respect to emissions to air, water and land as well as other environmental matters by federal, provincial and local authorities. The cost of obligations associated with current operations is provided for on an ongoing basis. Management believes it has made adequate provision in its interim consolidated financial statements to meet OPG’s current environmental obligations. 14. REVENUE LIMIT REBATE Eighty-five percent of the generation output from OPG’s unregulated generation assets, excluding the Lennox generating station and forward sales as of January 1, 2005, was subject to a revenue limit. The term of the revenue limit rebate ended on April 30, 2009.

Ontario Power Generation Inc. 55
The revenue limit rebate liability for the year ended December 31, 2009 was as follows: December 31(millions of dollars) 2009 Liability, beginning of year 85 Increase to provision during the year 27 Payments made during the year (112) Liability, end of year - 15. BUSINESS SEGMENTS
Segment Income (Loss) for the Three Months Ended March 31, 2010
Regulated Unregulated
Other
Elimination
Total Nuclear
Nuclear Waste
Manage-ment
Hydro-electric
Hydro-electric
Thermal
(millions of dollars)
Revenue 793 11 185 149 268 48 (10) 1,444 Revenue limit rebate - - - - - - - -
793 11 185 149 268 48 (10) 1,444Fuel expense 50 - 50 19 129 - - 248 Gross margin 743 11 135 130 139 48 (10) 1,196Operations,
maintenance and administration
550 12 23 46 102 3 (10) 726
Depreciation and amortization
93 - 16 16 27 15 - 167
Accretion on fixed asset removal and nuclear waste management liabilities
- 164 - - 1 - - 165
Earnings on nuclear fixed asset removal and nuclear waste management funds
- (141) - - - - - (141)
Property and capital taxes
11 - 3 1 1 3 - 19
Restructuring - - - - 25 - - 25 Other (gains) and
losses - - - - - (1) - (1)
Income (loss) before interest and income taxes 89 (24) 93 67 (17) 28
- 236

Ontario Power Generation Inc. 56
Segment Income (Loss) for the Three Months Ended March 31, 2009
Regulated Unregulated Nuclear
Nuclear Waste
Manage-ment
Hydro-electric
Hydro-electric
Thermal Other Elimination Total
(millions of dollars)
Revenue 773 10 179 217 293 47 (10) 1,509 Revenue limit rebate - - - (11) (17) - - (28)
773 10 179 206 276 47 (10) 1,481Fuel expense 49 - 52 22 138 - - 261Gross margin 724 10 127 184 138 47 (10) 1,220Operations,
maintenance and administration
552 11 23 42 121 3 (10) 742
Depreciation and amortization
114 - 18 18 18 10 - 178
Accretion on fixed asset removal and nuclear waste management liabilities
- 157 - - 2 - - 159
Losses on nuclear fixed asset removal and nuclear waste management funds
- 6 - - - - - 6
Property and capital taxes
11 - 3 2 6 4 - 26
Income (loss) before interest and income taxes 47
(164)
83
122
(9)
30
-
109

Ontario Power Generation Inc. 57
(millions of dollars)
Regulated Unregulated
Nuclear Hydro- electric
Hydro- electric
Thermal Other
Total
Selected Balance Sheet Information As at March 31, 2010 Segment fixed assets in service, net Segment construction in progress
3,956203
3,777 716
2,962 366
361 33
800 3
11,856 1,321
Segment property, plant and equipment, net 4,159
4,493
3,328
394
803
13,177
As at March 31, 2010
Segment intangible assets in service, net Segment development in progress
204
- -
2 1
- -
13 5
35 10
Segment intangible assets, net 24
-
3
-
18
45
As at December 31, 2009 Segment fixed assets in service, net Segment construction in progress
3,661217
3,791 663
2,968 308
384 32
808 4
11,6121,224
Segment property, plant and equipment, net 3,878
4,454
3,276
416
812
12,836
As at December 31, 2009 Segment intangible assets in service, net Segment development in progress
228
- -
2 1
- 1
15 3
39 13
Segment intangible assets, net 30
-
3
1
18
52
16. NET CHANGES IN NON-CASH WORKING CAPITAL BALANCES Three Months Ended March 31 (millions of dollars) 2010 2009 Accounts receivable 112 131 Prepaid expenses (25) (6) Fuel inventory 72 49 Materials and supplies 1 4 Revenue limit rebate payable - 28 Accounts payable and accrued charges (253) (238) Income and capital taxes payable / recoverable 24 (116) (69) (148)
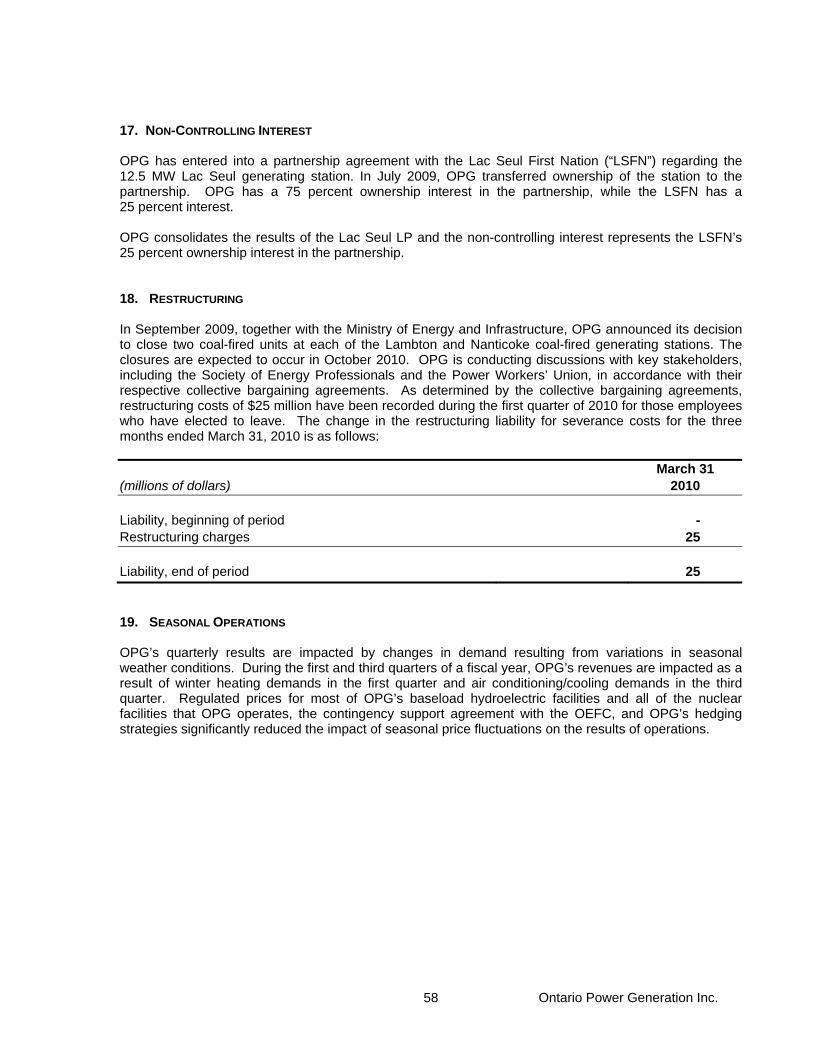
Ontario Power Generation Inc. 58
17. NON-CONTROLLING INTEREST OPG has entered into a partnership agreement with the Lac Seul First Nation (“LSFN”) regarding the 12.5 MW Lac Seul generating station. In July 2009, OPG transferred ownership of the station to the partnership. OPG has a 75 percent ownership interest in the partnership, while the LSFN has a 25 percent interest. OPG consolidates the results of the Lac Seul LP and the non-controlling interest represents the LSFN’s 25 percent ownership interest in the partnership. 18. RESTRUCTURING In September 2009, together with the Ministry of Energy and Infrastructure, OPG announced its decision to close two coal-fired units at each of the Lambton and Nanticoke coal-fired generating stations. The closures are expected to occur in October 2010. OPG is conducting discussions with key stakeholders, including the Society of Energy Professionals and the Power Workers’ Union, in accordance with their respective collective bargaining agreements. As determined by the collective bargaining agreements, restructuring costs of $25 million have been recorded during the first quarter of 2010 for those employees who have elected to leave. The change in the restructuring liability for severance costs for the three months ended March 31, 2010 is as follows: March 31 (millions of dollars) 2010 Liability, beginning of period - Restructuring charges 25 Liability, end of period 25 19. SEASONAL OPERATIONS OPG’s quarterly results are impacted by changes in demand resulting from variations in seasonal weather conditions. During the first and third quarters of a fiscal year, OPG’s revenues are impacted as a result of winter heating demands in the first quarter and air conditioning/cooling demands in the third quarter. Regulated prices for most of OPG’s baseload hydroelectric facilities and all of the nuclear facilities that OPG operates, the contingency support agreement with the OEFC, and OPG’s hedging strategies significantly reduced the impact of seasonal price fluctuations on the results of operations.