ontap performance considerations related to disk
TRANSCRIPT
ONTAP Performance ConsiderationsRelated to Disk
© 2019 NetApp, Inc. All rights reserved. 1

About This Webinar
This webinar focuses on enabling you to do the following:
Describe disk subsystem components
Analyze and isolate disk subsystem bottlenecks
Resolve disk subsystem bottlenecks
Describe the functions of the WAFL file system
List the advantages when the WAFL optimizes write operations
Identify and resolve WAFL-related performance issues
2© 2019 NetApp, Inc. All rights reserved.

Key Metrics of Performance
I/O is measured in input/output operations
per second (IOPS).
IOPS measures how many requests can
be managed in one second.
IOPS data is most useful if I/O has any of
the following features: I/O request patterns are random.
I/O requests are small.
Multiple I/O sources must be managed.
IOPS
© 2019 NetApp, Inc. All rights reserved. 3
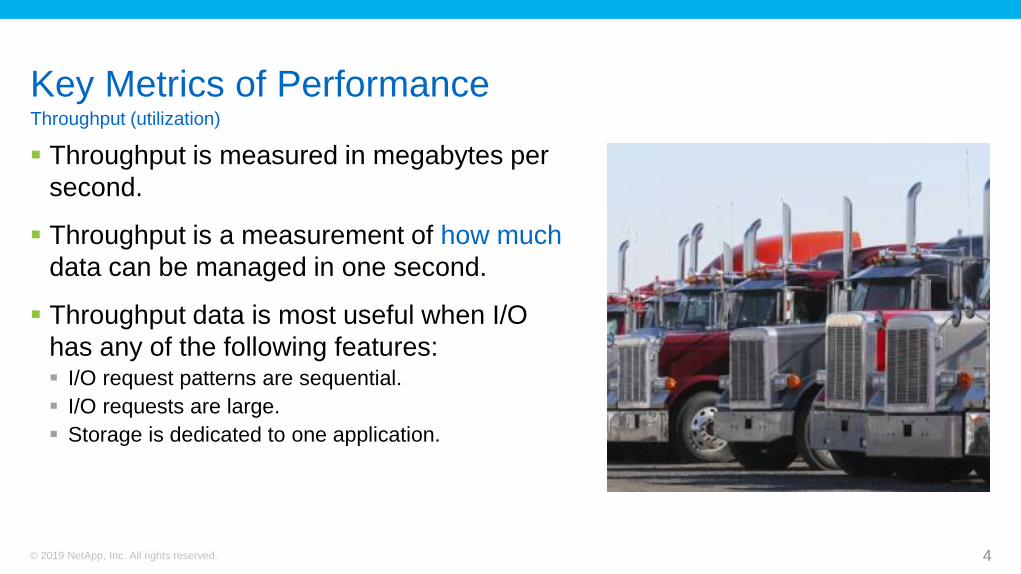
Key Metrics of Performance
Throughput is measured in megabytes per
second.
Throughput is a measurement of how much
data can be managed in one second.
Throughput data is most useful when I/O
has any of the following features: I/O request patterns are sequential.
I/O requests are large.
Storage is dedicated to one application.
Throughput (utilization)
© 2019 NetApp, Inc. All rights reserved. 4

Key Metrics of Performance
Latency is measured in milliseconds.
Latency is a measurement of how
long data processing takes.
Latency values are most useful
when you are comparing flash
performance.
Latency for hard disks is typically
measured in milliseconds. Because
flash is much faster, the latency of
the flash is measured in
submilliseconds or microseconds.
Latency
© 2019 NetApp, Inc. All rights reserved. 5
Lesson 1Disk Subsystem Hardware
© 2019 NetApp, Inc. All rights reserved. 6

FAS Disk Shelves
7© 2019 NetApp, Inc. All rights reserved.
450GB
450GB
450GB
450GB
450GB
450GB
450GB
450GB
450GB
450GB
450GB
450GB
450GB
450GB
450GB
450GB
450GB
450GB
450GB
450GB
450GB
450GB
450GB
450GB
DS4243
4 5 6 70 1 2 3 12 13 14 158 9 10 11 20 21 22 2316 17 18 19
DS2246
60
0G
B
60
0G
B
60
0G
B
60
0G
B
60
0G
B
60
0G
B
60
0G
B
60
0G
B
60
0G
B
60
0G
B
60
0G
B
60
0G
B
60
0G
B
60
0G
B
60
0G
B
60
0G
B
60
0G
B
60
0G
B
60
0G
B
60
0G
B
60
0G
B
60
0G
B
60
0G
B
60
0G
B
DS4246
DS4486
DS2246
DS224C
DS212C
Disk Speeds:
7.2K SATA
Solid-state
drive (SSD)
10K SAS
SSD
DS42464U, 24 disks
6 Gbps I/O Modules
DS44864U, 48 disks
6 Gbps I/O Modules
DS22462U, 24 disks
6 Gbps I/O Modules
DS224C2U, 24 disks
12 Gbps I/O Modules
DS212C2U, 12 disks
12 Gbps I/O Modules c1::> storage shelf show
Displays the shelf identification and status information

Shelf Connection Speeds
First, compute minimum stacks to handle load, using “75% of Peak”.
Second, add 50% more stacks to handle bursts.
8© 2019 NetApp, Inc. All rights reserved.
Transport Peak Throughput 75% of Peak (Recommended)
1 Gbps FC 120 megabytes per second (MBps) 90 MBps
2 Gbps FC 240 MBps 180 MBps
4 Gbps FC 480 MBps 360 MBps
3 Gbps SAS (IOM3) 1.2 gigabytes per second (GBps) 0.9 GBps
6 Gbps SAS (IOM6) 2.4 GBps 1.8 GBps
12 Gbps SAS (IOM12) 4.8 GBps 3.6 GBps

HDD Speeds
Throughput is primarily determined by rotational speed.
9© 2019 NetApp, Inc. All rights reserved.
Drive Type Spindle Speed
(RPM)
Form Factor Average Seek Time Average
Rotational
Latency
Estimated Drive IOPS
SATA 7.2K 3.5" 9.0 4.16 75
FC 10K 3.5" 4.1 2.98 141
SAS 10K 2.5" 4.10 3.0 140
FC 15K 3.5" 3.70 2.0 176
SAS 15K 3.5" 3.70 2.0 176

SSD Performance
SSDs consistently deliver low-latency IOPS until the upper limit of per-drive
usage is reached.
SSDs offer better ROI for read-heavy workloads than for write-heavy workloads.
To achieve peak controller performance, fewer SSDs are required than hard
disk drives (HDDs).
10© 2019 NetApp, Inc. All rights reserved.
Workload Peak Throughput Number of 15K RPM FC Drives Number of SSDs
4KB FCP random read 64,000 IOPS 215 8
64KB FCP sequential read 1000 MBPS 20 8
32KB NFS sequential write 450 MBPS 12 8
OTLP 47,000 IOPS 98 11
ONTAP Disk Behavior
Over time, data is randomly distributed across the disk media surfaces.
Every disk I/O looks like moderately-sized random access.
Expected IOPS based on random access time: SAS random access time ~7ms
Gives ~120 IOPS per data spindle
SATA random access time ~10ms
Gives ~80 IOPS per data spindle
I/Os can be queued on disk and at the software storage layer
11© 2019 NetApp, Inc. All rights reserved.

Comparing HDD and SSD
HDD performance is mostly dictated by density and speed. The random or transactional (IOPS) performance is dominated by the access time.
Access time is determined by rotational latency and seek time.
Consider using SSDs instead of HDDs for transactional workloads. Not all SSD systems have the rotational latency and seek time delays that HDDs have.
All-SSD storage solutions might be cheaper, because fewer drives are required to achieve the
same IOPS.
SSDs have a greatly reduced power footprint per IOPS.
Choosing the correct drive increases the overall reliability and performance of
a storage system.
12© 2019 NetApp, Inc. All rights reserved.

Lesson 2Analyzing and Isolating Disk Subsystem Bottlenecks
© 2019 NetApp, Inc. All rights reserved. 13

Disk Configuration
14© 2019 NetApp, Inc. All rights reserved.
The following commands are most commonly used to troubleshoot problems:
c1::> storage aggregate show-status aggr1 This command displays the RAID layout
and disk configuration of aggregates.
c1::> set diag
c1::*> storage disk partition show
This command reports on the disk
partitions. Use the command if the
system was deployed by using
Advanced Disk Partitioning (ADP). The
command runs in the diag privilege level.
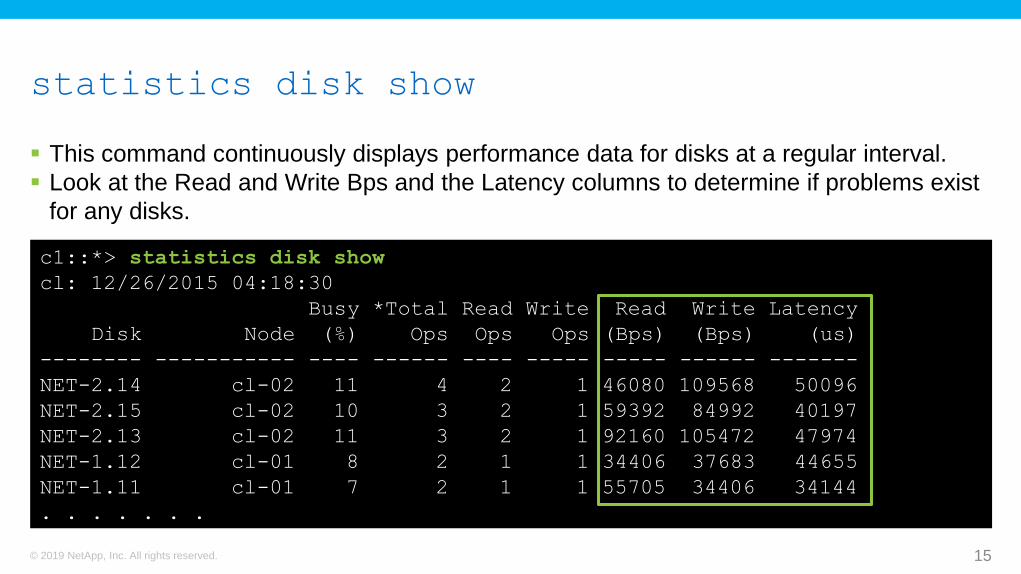
statistics disk show
This command continuously displays performance data for disks at a regular interval.
Look at the Read and Write Bps and the Latency columns to determine if problems exist
for any disks.
15© 2019 NetApp, Inc. All rights reserved.
c1::*> statistics disk show
cl: 12/26/2015 04:18:30
Busy *Total Read Write Read Write Latency
Disk Node (%) Ops Ops Ops (Bps) (Bps) (us)
-------- ----------- ---- ------ ---- ----- ----- ------ -------
NET-2.14 cl-02 11 4 2 1 46080 109568 50096
NET-2.15 cl-02 10 3 2 1 59392 84992 40197
NET-2.13 cl-02 11 3 2 1 92160 105472 47974
NET-1.12 cl-01 8 2 1 1 34406 37683 44655
NET-1.11 cl-01 7 2 1 1 55705 34406 34144
. . . . . . .

statistics raid show
c1::*> statistics start –object raid –instance raid
c1::*> statistics show
Object: raid
Instance: raid
Start-time: 12/23/2015 23:23:18
End-time: 12/23/2015 23:23:53
Elapsed-time: 35s
Node: c1-01
Counter Value
-------------------------------- --------------------------------
blocks_written 19
full_stripes 2
instance_name raid
node_name c1-01
num_aggrvote_update_attempts 0
num_aggrvote_update_failures 0
partial_stripes 4
© 2019 NetApp, Inc. All rights reserved.
Compare full stripes written to partial stripes
written. A ratio that is less than 2:1 might
indicate poor write allocation.
16

Lesson 3Analyzing Disk Subsystem Bottlenecks with Statit
© 2019 NetApp, Inc. All rights reserved. 17
Identifying Disk I/O Bottlenecks
High protocol latencies might indicate a problem with disk I/O.
When you examine RAID statistics, notice the number of full stripes compared
to stripes written, which indicates whether the writing is efficient.
When you examine Disk statistics, notice the ut% and xfers columns, which
indicate how busy the disks are and the number of “hot” disks (if any).
The higher the read chain length, the more sequential in nature the I/O is, and
the more efficiently you are getting data from disk.
Write chains should always be high, unless full stripes are not being written.
18© 2019 NetApp, Inc. All rights reserved.

Running statit in a Cluster
Displays a list of the objects and instances for statit:
c1::> set diag
c1::*> statistics preset detail show –instance statit
Runs statit:
c1::*> statistics show-periodic -preset statit
-object disk:constituent -instance NET-1.12
Runs statit on a node:
cl::> set advanced
cl::*> run –node c1-01 –command statit –b (to start the gathering of data)
cl::*> run –node c1-01 –command statit –e (to end the gathering of data)
19© 2019 NetApp, Inc. All rights reserved.

Choices for -counter in the statit Disk Option
c1::*> statistics show-periodic -preset statit -object disk:constituent
-instance NET-1.1 -counter base_for_disk_busy cp_io_pending cp_msg_pending cp_read_blocks
cp_read_chain cp_read_latency cp_reads disk_busy
disk_capacity disk_io_latency_histogram disk_speed display_name
dlsched_count dlsched_distant dlsched_distant_bg dlsched_immediate
dlsched_immediate_bg dlsched_io_time dlsched_max_background dlsched_max_distant
dlsched_qtime dlsched_svctime dlsched_wait
guaranteed_read_blocks guaranteed_read_chain guaranteed_read_latency
guaranteed_reads guaranteed_write_blocks guaranteed_write_chain
guaranteed_write_latency guaranteed_writes guarenteed_read_blocks
guarenteed_read_chain guarenteed_read_latency guarenteed_reads
guarenteed_write_blocks guarenteed_write_chain guarenteed_write_latency
guarenteed_writes instance_name instance_uuid io_pending
io_queued node_name node_uuid operation_latency
physical_disk_name physical_disk_uuid process_name raid_group
raid_group_id raid_name raid_type read_data
read_ops skip_blocks total_transfers user_read_blocks
user_read_chain user_read_latency user_reads user_skip_write_ios
user_write_blocks user_write_chain user_write_latency user_writes
user_writes_in_skip_mask write_data write_ops
20© 2019 NetApp, Inc. All rights reserved.

statit from the statistics Command
c1::*> statistics show-periodic -preset statit -object disk:constituent -instance
NET-1.1 –counter disk_busy|total_transfers|user_read_chain|
user_write_chain|cp_read_chain|guaranteed_reads|guaranteed_writes
c1-01: statit: 1/27/2017 02:27:53
user user
cp_read disk guaranteed guaranteed total read write Complete Number of
chain busy reads writes transfers chain chain Aggregation Constituents
-------- ---- ---------- ---------- --------- -------- -------- ----------- ------------
0 55% 14.31 0 21.83 2.34 22.58 n/a n/a
0 56% 14.31 0 29.98 2.65 24.16 n/a n/a
0 50% 14.31 0 20.58 3.68 7.32 n/a n/a
0 55% 14.31 0 29.79 2.67 27.83 n/a n/a
0 18% 14.31 0 7.51 2.34 22.71 n/a n/a
0 75% 14.31 0 29.30 2.70 27.57 n/a n/a
21© 2019 NetApp, Inc. All rights reserved.
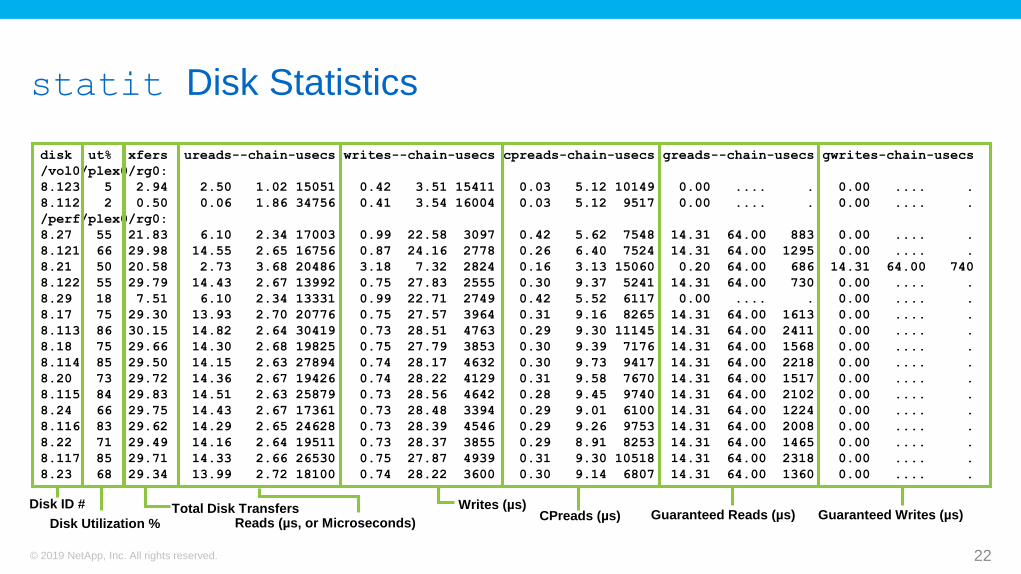
statit Disk Statistics
22© 2019 NetApp, Inc. All rights reserved.
CPreads (µs) Guaranteed Writes (µs) Guaranteed Reads (µs) Disk ID #
Disk Utilization %Total Disk Transfers
Reads (µs, or Microseconds)
Writes (µs)
disk ut% xfers ureads--chain-usecs writes--chain-usecs cpreads-chain-usecs greads--chain-usecs gwrites-chain-usecs
/vol0/plex0/rg0:
8.123 5 2.94 2.50 1.02 15051 0.42 3.51 15411 0.03 5.12 10149 0.00 .... . 0.00 .... .
8.112 2 0.50 0.06 1.86 34756 0.41 3.54 16004 0.03 5.12 9517 0.00 .... . 0.00 .... .
/perf/plex0/rg0:
8.27 55 21.83 6.10 2.34 17003 0.99 22.58 3097 0.42 5.62 7548 14.31 64.00 883 0.00 .... .
8.121 66 29.98 14.55 2.65 16756 0.87 24.16 2778 0.26 6.40 7524 14.31 64.00 1295 0.00 .... .
8.21 50 20.58 2.73 3.68 20486 3.18 7.32 2824 0.16 3.13 15060 0.20 64.00 686 14.31 64.00 740
8.122 55 29.79 14.43 2.67 13992 0.75 27.83 2555 0.30 9.37 5241 14.31 64.00 730 0.00 .... .
8.29 18 7.51 6.10 2.34 13331 0.99 22.71 2749 0.42 5.52 6117 0.00 .... . 0.00 .... .
8.17 75 29.30 13.93 2.70 20776 0.75 27.57 3964 0.31 9.16 8265 14.31 64.00 1613 0.00 .... .
8.113 86 30.15 14.82 2.64 30419 0.73 28.51 4763 0.29 9.30 11145 14.31 64.00 2411 0.00 .... .
8.18 75 29.66 14.30 2.68 19825 0.75 27.79 3853 0.30 9.39 7176 14.31 64.00 1568 0.00 .... .
8.114 85 29.50 14.15 2.63 27894 0.74 28.17 4632 0.30 9.73 9417 14.31 64.00 2218 0.00 .... .
8.20 73 29.72 14.36 2.67 19426 0.74 28.22 4129 0.31 9.58 7670 14.31 64.00 1517 0.00 .... .
8.115 84 29.83 14.51 2.63 25879 0.73 28.56 4642 0.28 9.45 9740 14.31 64.00 2102 0.00 .... .
8.24 66 29.75 14.43 2.67 17361 0.73 28.48 3394 0.29 9.01 6100 14.31 64.00 1224 0.00 .... .
8.116 83 29.62 14.29 2.65 24628 0.73 28.39 4546 0.29 9.26 9753 14.31 64.00 2008 0.00 .... .
8.22 71 29.49 14.16 2.64 19511 0.73 28.37 3855 0.29 8.91 8253 14.31 64.00 1465 0.00 .... .
8.117 85 29.71 14.33 2.66 26530 0.75 27.87 4939 0.31 9.30 10518 14.31 64.00 2318 0.00 .... .
8.23 68 29.34 13.99 2.72 18100 0.74 28.22 3600 0.30 9.14 6807 14.31 64.00 1360 0.00 .... .
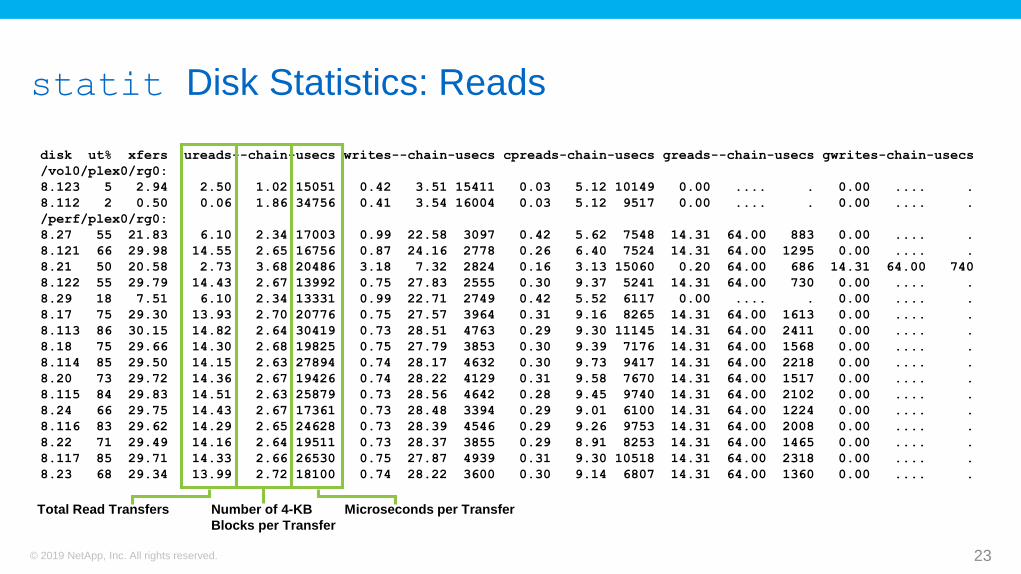
statit Disk Statistics: Reads
23© 2019 NetApp, Inc. All rights reserved.
disk ut% xfers ureads--chain-usecs writes--chain-usecs cpreads-chain-usecs greads--chain-usecs gwrites-chain-usecs
/vol0/plex0/rg0:
8.123 5 2.94 2.50 1.02 15051 0.42 3.51 15411 0.03 5.12 10149 0.00 .... . 0.00 .... .
8.112 2 0.50 0.06 1.86 34756 0.41 3.54 16004 0.03 5.12 9517 0.00 .... . 0.00 .... .
/perf/plex0/rg0:
8.27 55 21.83 6.10 2.34 17003 0.99 22.58 3097 0.42 5.62 7548 14.31 64.00 883 0.00 .... .
8.121 66 29.98 14.55 2.65 16756 0.87 24.16 2778 0.26 6.40 7524 14.31 64.00 1295 0.00 .... .
8.21 50 20.58 2.73 3.68 20486 3.18 7.32 2824 0.16 3.13 15060 0.20 64.00 686 14.31 64.00 740
8.122 55 29.79 14.43 2.67 13992 0.75 27.83 2555 0.30 9.37 5241 14.31 64.00 730 0.00 .... .
8.29 18 7.51 6.10 2.34 13331 0.99 22.71 2749 0.42 5.52 6117 0.00 .... . 0.00 .... .
8.17 75 29.30 13.93 2.70 20776 0.75 27.57 3964 0.31 9.16 8265 14.31 64.00 1613 0.00 .... .
8.113 86 30.15 14.82 2.64 30419 0.73 28.51 4763 0.29 9.30 11145 14.31 64.00 2411 0.00 .... .
8.18 75 29.66 14.30 2.68 19825 0.75 27.79 3853 0.30 9.39 7176 14.31 64.00 1568 0.00 .... .
8.114 85 29.50 14.15 2.63 27894 0.74 28.17 4632 0.30 9.73 9417 14.31 64.00 2218 0.00 .... .
8.20 73 29.72 14.36 2.67 19426 0.74 28.22 4129 0.31 9.58 7670 14.31 64.00 1517 0.00 .... .
8.115 84 29.83 14.51 2.63 25879 0.73 28.56 4642 0.28 9.45 9740 14.31 64.00 2102 0.00 .... .
8.24 66 29.75 14.43 2.67 17361 0.73 28.48 3394 0.29 9.01 6100 14.31 64.00 1224 0.00 .... .
8.116 83 29.62 14.29 2.65 24628 0.73 28.39 4546 0.29 9.26 9753 14.31 64.00 2008 0.00 .... .
8.22 71 29.49 14.16 2.64 19511 0.73 28.37 3855 0.29 8.91 8253 14.31 64.00 1465 0.00 .... .
8.117 85 29.71 14.33 2.66 26530 0.75 27.87 4939 0.31 9.30 10518 14.31 64.00 2318 0.00 .... .
8.23 68 29.34 13.99 2.72 18100 0.74 28.22 3600 0.30 9.14 6807 14.31 64.00 1360 0.00 .... .
Total Read Transfers Number of 4-KB
Blocks per Transfer
Microseconds per Transfer

statit Disk Statistics: RAID Groups (Part 1)
24© 2019 NetApp, Inc. All rights reserved.
1. Add together the write operations for a RAID group.
2. Add together the CP read operations for a RAID group.
3. Divide the total number of write operations by the total
number of CP read operations.
> 1.20 = RAID Group Good
1.20 to 1.0 = Concern
< 1.0 = Probably Fragmented
disk writes--chain-usecs cpreads-chain-usecs
/vol0/plex0/rg0:
0b.16 69.67 5.75 1400 68.88 5.33 6000
0b.17 69.51 5.72 1439 68.68 5.33 5143
0b.18 69.53 5.67 1419 68.73 5.33 5443
/vol1/plex0/rg0:
0b.19 157.58 15.90 477 1.30 16.00 460
0b.20 157.42 15.90 506 2.42 11.74 613
0b.21 156.67 15.96 481 2.23 10.87 645
208.71 206.29
471.67 5.95
Vol0
Total Writes = 208.71
Total CP Reads = 206.29
208.71 / 206.29 = 1.01
Total Writes/Total CP Reads = 1.01
Vol1
Total Writes = 471.67
Total CP Reads = 5.95
471.67 / 5.95 = 79.27
Total Writes/Total CP Reads = 79.27
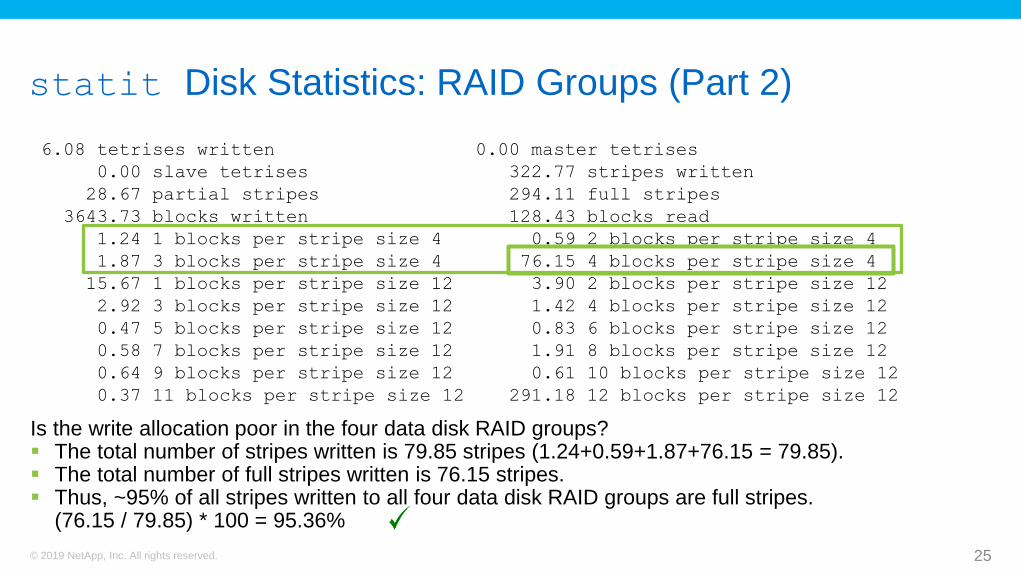
statit Disk Statistics: RAID Groups (Part 2)
6.08 tetrises written 0.00 master tetrises
0.00 slave tetrises 322.77 stripes written
28.67 partial stripes 294.11 full stripes
3643.73 blocks written 128.43 blocks read
1.24 1 blocks per stripe size 4 0.59 2 blocks per stripe size 4
1.87 3 blocks per stripe size 4 76.15 4 blocks per stripe size 4
15.67 1 blocks per stripe size 12 3.90 2 blocks per stripe size 12
2.92 3 blocks per stripe size 12 1.42 4 blocks per stripe size 12
0.47 5 blocks per stripe size 12 0.83 6 blocks per stripe size 12
0.58 7 blocks per stripe size 12 1.91 8 blocks per stripe size 12
0.64 9 blocks per stripe size 12 0.61 10 blocks per stripe size 12
0.37 11 blocks per stripe size 12 291.18 12 blocks per stripe size 12
25© 2019 NetApp, Inc. All rights reserved.
Is the write allocation poor in the four data disk RAID groups? The total number of stripes written is 79.85 stripes (1.24+0.59+1.87+76.15 = 79.85). The total number of full stripes written is 76.15 stripes. Thus, ~95% of all stripes written to all four data disk RAID groups are full stripes.
(76.15 / 79.85) * 100 = 95.36%
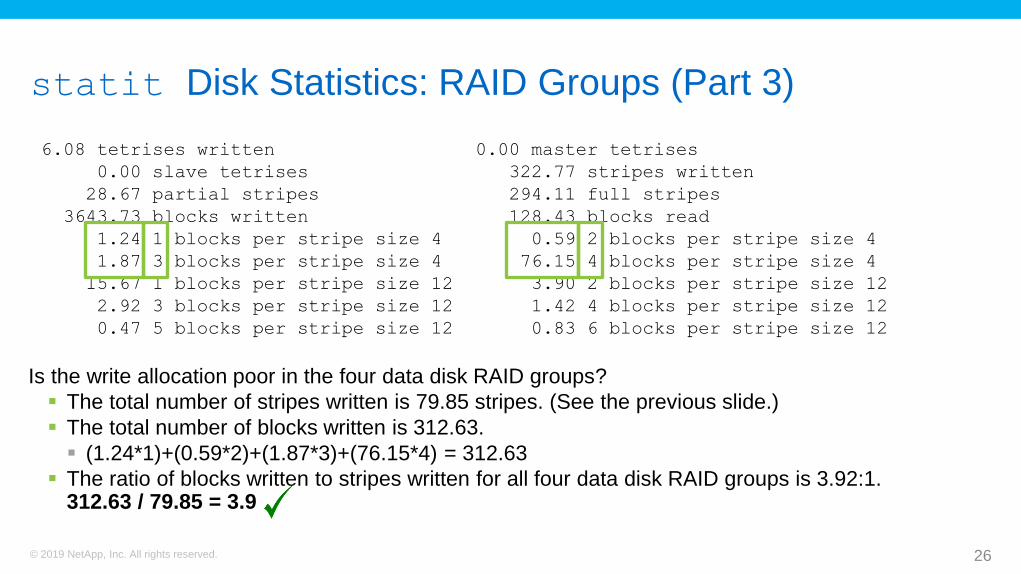
statit Disk Statistics: RAID Groups (Part 3)
6.08 tetrises written 0.00 master tetrises
0.00 slave tetrises 322.77 stripes written
28.67 partial stripes 294.11 full stripes
3643.73 blocks written 128.43 blocks read
1.24 1 blocks per stripe size 4 0.59 2 blocks per stripe size 4
1.87 3 blocks per stripe size 4 76.15 4 blocks per stripe size 4
15.67 1 blocks per stripe size 12 3.90 2 blocks per stripe size 12
2.92 3 blocks per stripe size 12 1.42 4 blocks per stripe size 12
0.47 5 blocks per stripe size 12 0.83 6 blocks per stripe size 12
26© 2019 NetApp, Inc. All rights reserved.
Is the write allocation poor in the four data disk RAID groups?
The total number of stripes written is 79.85 stripes. (See the previous slide.)
The total number of blocks written is 312.63.
(1.24*1)+(0.59*2)+(1.87*3)+(76.15*4) = 312.63
The ratio of blocks written to stripes written for all four data disk RAID groups is 3.92:1. 312.63 / 79.85 = 3.9

Lesson 4Resolving Disk Subsystem Bottlenecks
© 2019 NetApp, Inc. All rights reserved. 27

Resolving Disk Subsystem Performance Issues
When the health of the system is degraded, you can receive status alerts.
Read about the probable cause and corrective actions.
Display information about the degraded subsystem, and resolve the problem.
View suppressed alerts, modify them, and see whether they are acknowledged.
To discover that an alert was generated, view an AutoSupport message or an EMS event, or use the system health commands.
28© 2019 NetApp, Inc. All rights reserved.

Resolving Disk Subsystem Issues: Examples
Show alerts to locate the problem, and see that shelf 2 does not have two paths to node1:
c1::> system health alert show
Node: node1
Resource: Shelf ID 2
Severity: Major
Indication Time: Mon Nov 10 16:48:12 2013
Probable Cause: Disk shelf 2 does not have two paths to controller node1.
Possible Effect: Access to disk shelf 2 via controller node1 will be lost with a
single hardware component failure (e.g. cable, HBA, or IOM failure).
Corrective Actions:
1. Halt controller node1 and all controllers attached to disk shelf 2.
2. Connect disk shelf 2 to controller node1 via two paths following the rules
in the Universal SAS and ACP Cabling Guide.
3. Reboot the halted controllers.
4. Contact support personnel if the alert persists.
29© 2019 NetApp, Inc. All rights reserved.

Resolving Disk Subsystem Issues: More Examples
Display details about the alert to obtain more information, including the alert ID:
c1::> system health alert show -monitor node-connect -alert-id
DualPathToDiskShelf_Alert -instance
Node: node1
Monitor: node-connect
Alert ID: DualPathToDiskShelf_Alert
Alerting Resource: 50:05:0c:c1:02:00:0f:02
Subsystem: SAS-connect
Indication Time: Mon Mar 21 10:26:38 2011
Perceived Severity: Major
Connection_establishment_error
Description: Disk shelf 2 does not have two paths to controller node1.
30© 2019 NetApp, Inc. All rights reserved.
Resolving Disk I/O Bottlenecks
Identify the busiest disks:
Which aggregates do these volumes belong to?
Which volumes reside in the aggregates?
Which volumes are the most and least accessed?
Which type of access is used: read, write, or other?
What is the latency?
Assess the environment
31© 2019 NetApp, Inc. All rights reserved.

Resolving Disk I/O Bottlenecks
Distribute the I/O traffic across multiple aggregates and/or nodes: If the I/O pattern is predominately read, then consider Flash Pool and Flash Cache intelligent
caching.
Use Quality of Service (QoS) to throttle the I/O of noncritical workloads.
32© 2019 NetApp, Inc. All rights reserved.
RAID Group Sizing
You might want to always create the largest RAID groups in an aggregate, to
minimize parity calculations and maximize performance. You might get unwanted
results, such as larger failure domains:
The more drives you have in a RAID group, the more likely it is that a drive will
fail during the operational lifetime of the storage system.
Drive reliability is a primary factor that affects the risk of multiple drive failures
(MDFs) within a single RAID group.
Your calculations might or might not accurately predict future drive failures.
Drives might not fail at the same time, fail in the same RAID group, or fail at all.
33© 2019 NetApp, Inc. All rights reserved.

RAID Group Sizing Considerations
Increased drive reconstruction times affect the following outcomes: The more data drives that are present in the RAID group, the greater the calculation overhead for
reconstructing data from parity.
Each data drive contributes a data point that you should consider when you calculate parity.
The more data points that are present, the larger the parity calculation, and the longer the
reconstruction times.
In RAID group sizes from 12 to 20, the reconstruction data suggests an increase of about 6%.
As disk drives become larger, the likelihood increases that a drive will fail during
the reconstruction process. Degraded performance is a possible outcome.
To increase resiliency, use NetApp RAID-TEC technology: Provides triple disk failure protection
Enables larger RAID groups
34© 2019 NetApp, Inc. All rights reserved.

Raid Reconstruction Performance Impact
The raid.reconstruct.perf_impact option determines how foreground
I/O and corrective I/O (that is, RAID reconstruction I/O and Rapid RAID Recovery
I/O) compete for system resources.
c1::> node run –node c1-01
c1-01> options raid.reconstruct.perf_impact low
For the purposes of corrective I/O the term “system resources” refers to CPU, I/O
bandwidth, and drive utilization.
35© 2019 NetApp, Inc. All rights reserved.
RAID Scrubs
RAID-level scrubbing checks the disk blocks of all disks that are used in
aggregates, to identify media errors and determine parity consistency.
RAID-level scrubs help improve data availability by uncovering and fixing media
and checksum errors when the RAID group is in a normal state.
RAID-DP technology and RAID-level scrubs can be performed when the RAID
group has a single-disk failure.
If ONTAP software finds media errors or inconsistencies, it uses RAID to
reconstruct the data from other disks and rewrites the data.
By default, ONTAP performs a weekly RAID-level scrub that starts every
Sunday at 1:00 a.m. and lasts for six hours.
36© 2019 NetApp, Inc. All rights reserved.

RAID Scrub Example
The following command schedules two weekly RAID scrubs. The first scrub
starts every Tuesday at 2 a.m. and lasts for 240 minutes (four hours). The second scrub starts every Saturday at 10 p.m. and lasts for eight hours.
c1::> storage raid-options modify -node c1-01 –name raid.scrub.schedule
-value 240m@tue@2,8h@sat@22
The following command displays the current RAID-level automatic scrub schedule.
c1::> storage raid-options show -node c1-01 -name raid.scrub.schedule
Node: c1-01
Option Name: raid.scrub.schedule
Option Value: 240m@tue@2,8h@sat@22
Option Constraint: none
37© 2019 NetApp, Inc. All rights reserved.
Keeping RAID Groups Within Aggregates Balanced
Try to avoid “stub” RAID groups within an aggregate.
For example, for five RAID groups, the following RAID group sizes in the
aggregate are not recommended: 16 16 16 16 4. Best practice is to have group
sizes of 17-17-17-17.
Failure to do so can result in poor performance.
Ideally, you should balance the RAID groups within the aggregate.
Add complete RAID groups to an aggregate.
38© 2019 NetApp, Inc. All rights reserved.
Lesson 5WAFL Functions
© 2019 NetApp, Inc. All rights reserved. 39

Write Anywhere File Layout
The WAFL file system writes data in full stripes across the storage media.
WAFL performs write coalescing. The number of operations that land on the disk is reduced.
Operations are reorganized in memory before they are committed to disk.
The system waits for multiple writes to memory accrue before committing the writes disk by using
a consistency point (CP).
By using write coalescing, the system avoids the costly RAID workflow of “read
modify write.”
40© 2019 NetApp, Inc. All rights reserved.
WAFL
The WAFL file system can write anywhere, but in practice, WAFL writes in the
most reasonable location. WAFL writes in the location that is the closest relative to the disk head, where a complete stripe
can be written to minimize seek time on later I/O requests. WAFL is optimized for writes.
After 10 seconds elapse, or if NVRAM becomes greater than or equal to 50%
full, or a Snapshot copy is created, the client data is written from system
memory (not from NVRAM) to disk. This process is a CP.
After a CP, RAID performs calculations to calculate parity. The CPUs process
the calculations by using data that exists in RAM.
Using the WAFL file system avoids the problem of “hot parity disk.” WAFL
always uses precalculated parity and writes to new, free disk blocks.
41© 2019 NetApp, Inc. All rights reserved.
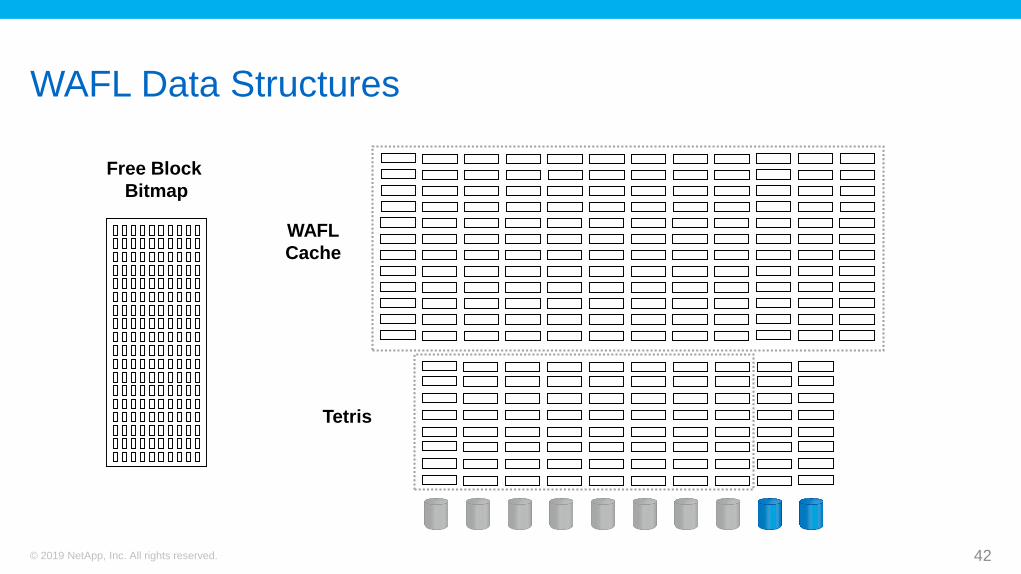
WAFL Data Structures
42© 2019 NetApp, Inc. All rights reserved.
Free Block
Bitmap
Tetris
WAFL
Cache
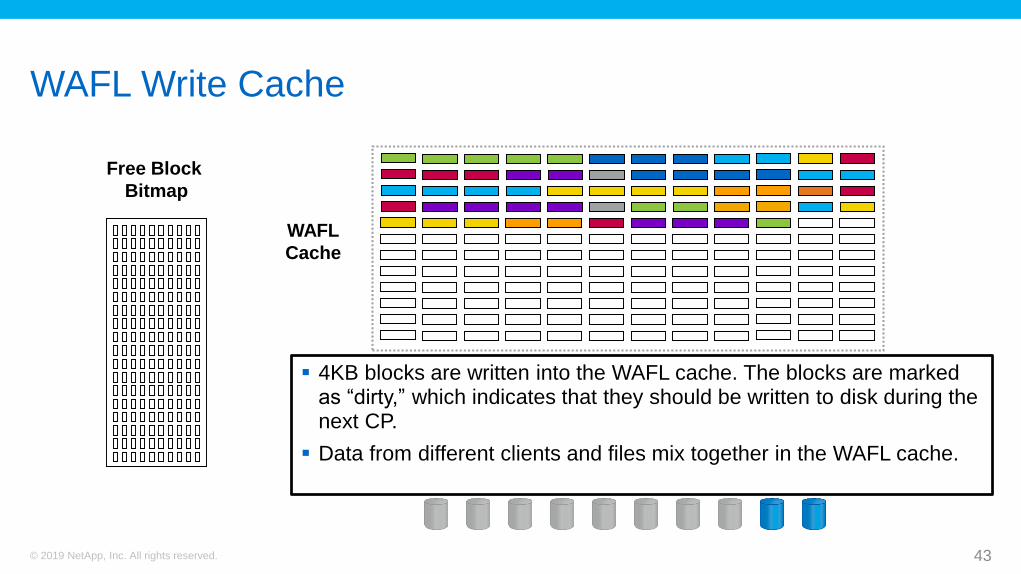
WAFL Write Cache
43© 2019 NetApp, Inc. All rights reserved.
Free Block
Bitmap
WAFL
Cache
4KB blocks are written into the WAFL cache. The blocks are marked as “dirty,” which indicates that they should be written to disk during the next CP.
Data from different clients and files mix together in the WAFL cache.
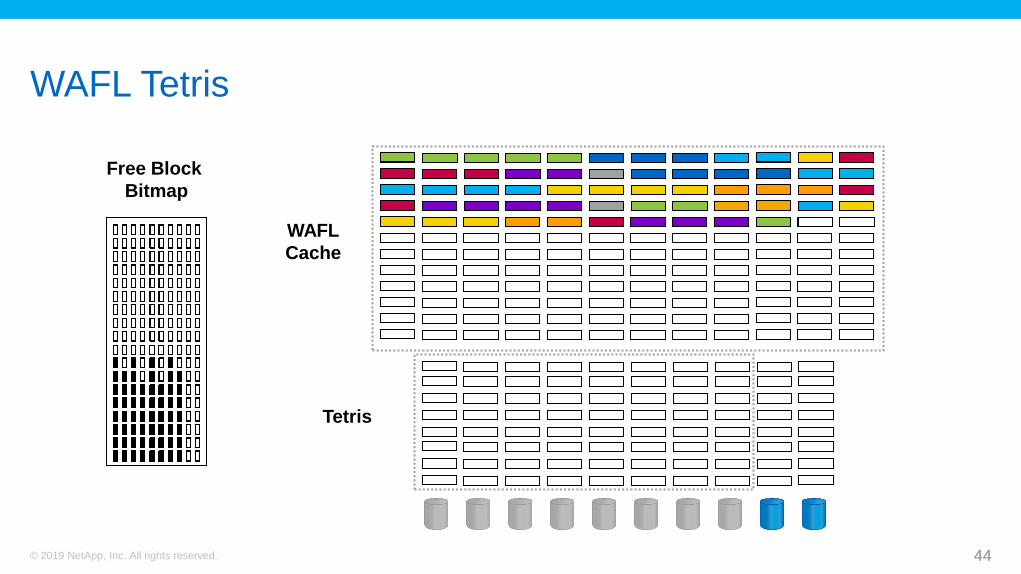
WAFL Tetris
© 2019 NetApp, Inc. All rights reserved.
Free Block
Bitmap
Tetris
WAFL
Cache
44
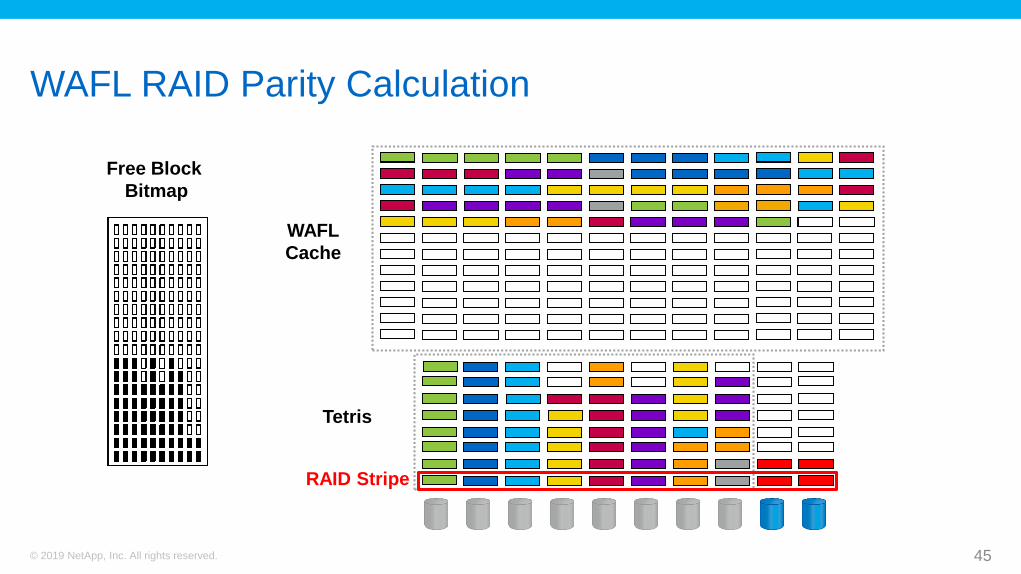
WAFL RAID Parity Calculation
45© 2019 NetApp, Inc. All rights reserved.
Free Block
Bitmap
WAFL
Cache
Tetris
RAID Stripe
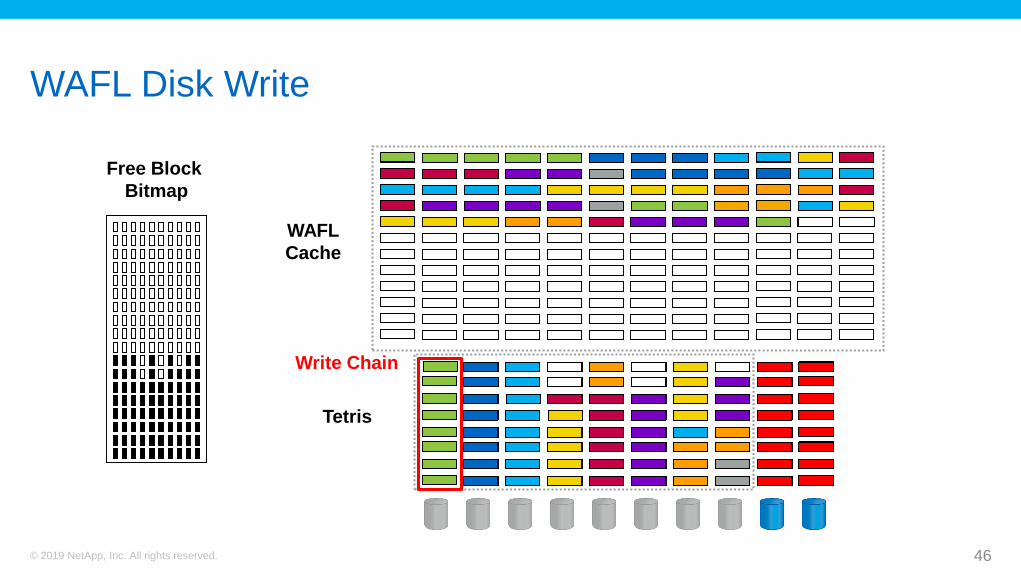
WAFL Disk Write
46© 2019 NetApp, Inc. All rights reserved.
Write Chain
Free Block
Bitmap
Tetris
WAFL
Cache
WAFL Filesystem Aging
Files change over time. WAFL writes the modified data blocks to a new location within the aggregate by using the
process that was described.
WAFL then frees the old disk block and clears the corresponding bit in the free block
bitmap file.
The location of the new disk block is recorded into the inode of the file. The inode block is also
written to a new disk block.
Users delete files that they no longer need, which frees the disk blocks that
contain those files.
This process causes fragmentation. Fragmentation can degrade performance,
especially when the “write to” process is random and the “read from” process
is sequential.
47© 2019 NetApp, Inc. All rights reserved.

WAFL Aging
48© 2019 NetApp, Inc. All rights reserved.
Free Block
Bitmap WAFL
Cache
Tetris
WAFL Compute Parity Reads - CPreads
If WAFL does not fill an entire stripe in Tetris, then it has insufficient data to
compute the RAID parity. To complete the stripe and compute the parity, WAFL must read data from active disk blocks.
A single write request might result in several disk read operations and poor performance.
These disk reads are called compute parity reads (cpreads).
A large number of cpreads might indicate a fragmented file system.
To check WAFL cpreads, use the following commands:
c1::*> statistics start -preset statit -object wafl -instance wafl
c1::*> statistics show
49© 2019 NetApp, Inc. All rights reserved.

WAFL Compute Parity Reads
50© 2019 NetApp, Inc. All rights reserved.
Free Block
Bitmap
Tetris
WAFL
Cache
File Names, Inodes, and Data Blocks
File Names > Inodes > Data Blocks
File names create convenience for users. The system tracks files by inodes.
The file name to inode number mapping is stored in the directory file.
Inodes describe files and contain the following: File metadata, such as ownership, size, timestamps, permissions, and so forth
Disk block pointers, such as pointers to data blocks
Data blocks contain the file data. Each data block is 4 kilobytes (KB) in size.
51© 2019 NetApp, Inc. All rights reserved.
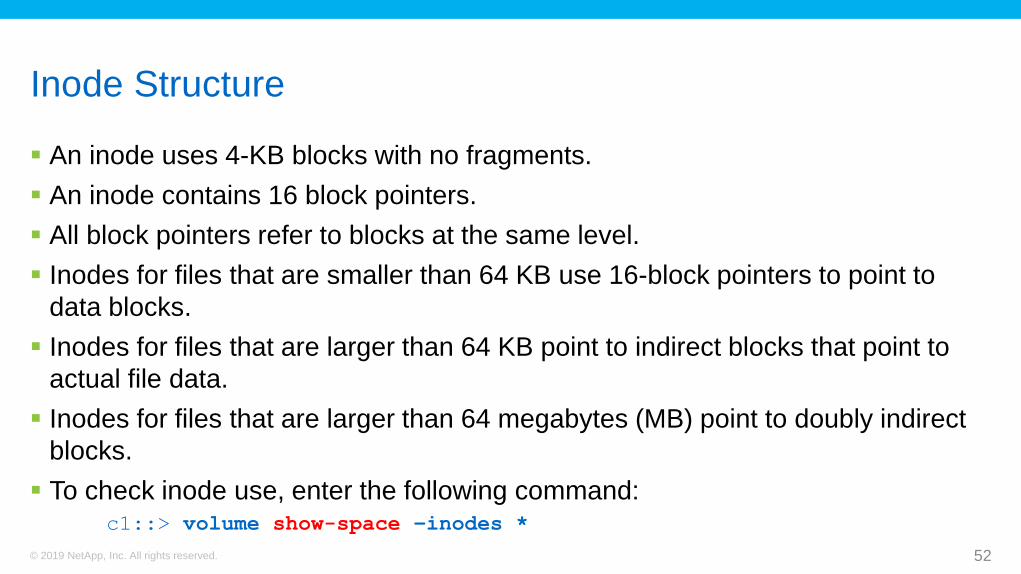
Inode Structure
An inode uses 4-KB blocks with no fragments.
An inode contains 16 block pointers.
All block pointers refer to blocks at the same level.
Inodes for files that are smaller than 64 KB use 16-block pointers to point to
data blocks.
Inodes for files that are larger than 64 KB point to indirect blocks that point to
actual file data.
Inodes for files that are larger than 64 megabytes (MB) point to doubly indirect
blocks.
To check inode use, enter the following command:c1::> volume show-space –inodes *
52© 2019 NetApp, Inc. All rights reserved.
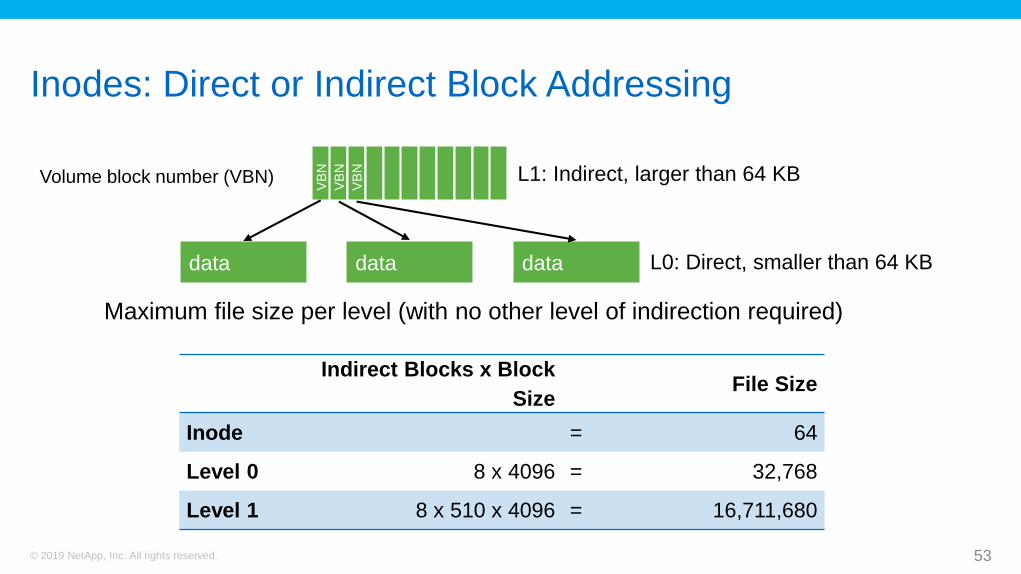
Inodes: Direct or Indirect Block Addressing
53© 2019 NetApp, Inc. All rights reserved.
L0: Direct, smaller than 64 KB
L1: Indirect, larger than 64 KB
VB
N
VB
N
VB
N
data data data
Indirect Blocks x Block
SizeFile Size
Inode = 64
Level 0 8 x 4096 = 32,768
Level 1 8 x 510 x 4096 = 16,711,680
Maximum file size per level (with no other level of indirection required)
Volume block number (VBN)

Inodes: Double Indirect Addressing
© 2019 NetApp, Inc. All rights reserved.
Indirect: L2
VB
N
VB
N
VB
N
VB
N
VB
N
VB
N
VB
N
VB
N
VB
N
data data datadata
Indirect: L1
Indirect Blocks x Block Size File Size (in Bytes)
Level 0 8 x 4096 = 32,768
Level 1 8 x 510 x 4096 = 16,711,680
Level 2 8 x 510 x 510 x 4096 = 8,522,956,800
Level 3 8 x 510 x 510 x 510 x 4096 = 4,346,707,968,000
Level n ………… …………
Maximum file size per level (with no other level of indirection required)
Direct: L0
Indirect Blocks x
Block Size
54
Lesson 6Resolving WAFL Issues
© 2019 NetApp, Inc. All rights reserved. 55
Identifying File System Fragmentation
Symptoms of space locality issues:
Back-to-back consistency points and poor chain lengths A chain is the number of block operations per transfer. (WAFL uses 4K blocks.)
Excessive compute parity reads (for example, a worse than one-to-one ratio
between CPread operations and write operations)
A skewed chain length histogram, in which some disks alone have good
chain lengths
56© 2019 NetApp, Inc. All rights reserved.
Repairing File System Fragmentation
Steps to avoid spatial locality issues: Maintain 15% free space in aggregates that have database loads.
Maintain 10% free space in aggregates that have file-based loads.
When growing an aggregate, add enough drives for full RAID stripes.
To reduce file spatial locality issues, use the reallocate command. The
reallocate command works on the aggregate.
Reallocating a file or a volume results in the following: Can increase space that is consumed by the file, when the file has data blocks in common
with a Snapshot copy
Requires a large amount of free space (at least 25%) when processing a volume
57© 2019 NetApp, Inc. All rights reserved.
reallocate Commands
You can use the reallocate family of commands to optimize the layout of
data on spinning disk.
reallocate optimizes sequential read performance. The workload that most
benefits from the use of reallocate is sequential reads after random writes.
Typical applications that see the most benefit from using reallocate: OLTP databases that perform large table scans
Email systems that use verification processes
Host-side backups of LUNs
58© 2019 NetApp, Inc. All rights reserved.
Read Reallocate
read_realloc is a volume option that improves performance by performing
opportunistic reallocation on data.
This option is built into the readahead mechanism.
The read reallocate option is not a scheduled task:
volume modify –vserver vs1 –volume volX
–read_realloc space-optimized
59© 2019 NetApp, Inc. All rights reserved.
Free Space Reallocation
The free space reallocation function performs opportunistic free space
reallocation to maintain an optimal free space layout
The free-space-realloc option Is enabled on the aggregate
c1::> storage aggregate modify –aggregate aggr1 –free-space-realloc on
Should be enabled when creating a new aggregate
60© 2019 NetApp, Inc. All rights reserved.

Moving Volumes
As more storage virtual machines (SVMs) and volumes are created, an
aggregate can become busy.
To improve performance, consider moving volumes to less-used aggregates.
To determine how busy the volumes and aggregates are, enter the statistics command at the cluster level or use OnCommand Performance
Manager.
61© 2019 NetApp, Inc. All rights reserved.
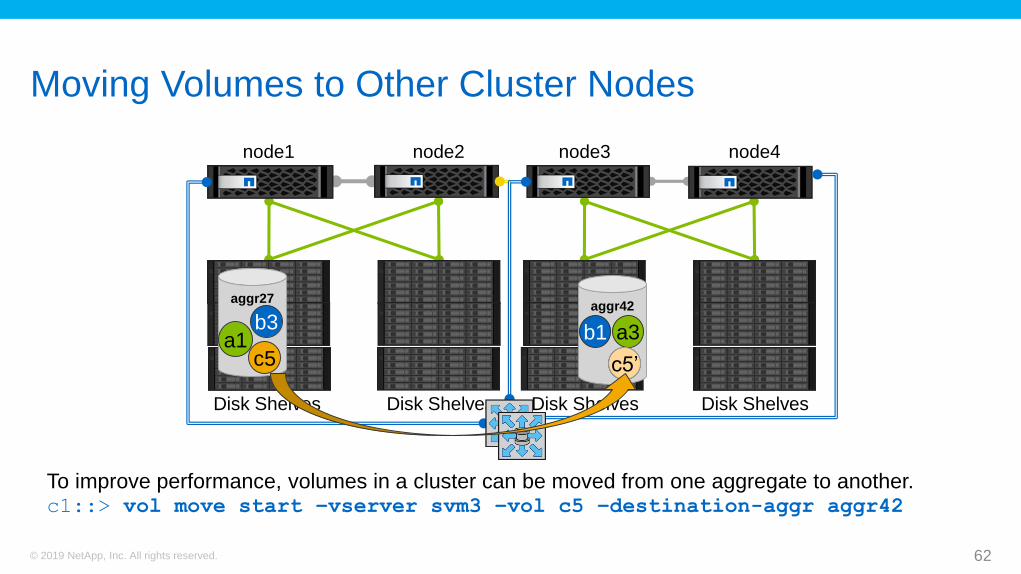
Moving Volumes to Other Cluster Nodes
62© 2019 NetApp, Inc. All rights reserved.
node1 node2
Disk Shelves Disk Shelves
node3 node4
Disk Shelves Disk Shelves
aggr27
a1
aggr42
c5
a3b1b3
c5c5’
To improve performance, volumes in a cluster can be moved from one aggregate to another.c1::> vol move start –vserver svm3 –vol c5 –destination-aggr aggr42
Lesson 7Best Practices
© 2019 NetApp, Inc. All rights reserved. 63
Do Not Exceed the Aggregate Maximum
Very high write performance is sustainable, if the aggregate does not exceed
85% of capacity.
Enabling deduplication might eventually consume about 4% of the aggregate
capacity.
Volumes require an extra 2% of free space during deduplication.
Realistically, aggregates should not exceed 90% of capacity, unless the
workloads are mostly reads.
When you add these limits to a 10% WAFL reserve, the result is a maximum
loss of capacity of 20% to maintain high performance.
64© 2019 NetApp, Inc. All rights reserved.
Best Practices for Deduplication and Compression
Deduplication, compression, and compaction processes consume system
resources and can alter the data layout on a disk.
The use of deduplication or compression can cause the read and write I/O
performance to vary.
Any space savings and performance impacts are dependent upon the
application and data.
Inline deduplication and compression are enabled by default on all NetApp All
Flash FAS systems.
NetApp recommends careful consideration of the impact to performance. Best
practice is to take measurements in a test setup and consider sizing issues.
If only a small amount of new data is present, run deduplication infrequently.
65© 2019 NetApp, Inc. All rights reserved.
Webinar Review
This webinar focused on enabling you to do the following:
Describe disk subsystem components
Analyze and isolate disk subsystem bottlenecks
Resolve disk subsystem bottlenecks
Describe the functions of the WAFL file system
List the advantages when the WAFL optimizes write operations
Identify and resolve WAFL-related performance issues
66© 2019 NetApp, Inc. All rights reserved.