onondaga lake capping, dredging, habitat and profundal ... · onondaga lake capping, dredging,...
TRANSCRIPT
ONONDAGA LAKE CAPPING, DREDGING, HABITAT AND PROFUNDAL ZONE (SMU 8)
FINAL DESIGN
MODIFIED PROTECTIVE CAP RA-D-1 DESIGN REVISION
Prepared for:
301 Plainfield Road, Suite 330
Syracuse, NY 13212
Prepared by:
Parsons
301 Plainfield Road, Suite 350 Syracuse, NY 13212
290 Elwood Davis Road, Suite 318
Liverpool, NY 13088
OCTOBER 2015

ONONDAGA LAKE CAPPING, DREDGING, HABITAT AND
PROFUNDAL ZONE (SMU 8) FINAL DESIGNMODIFIED PROTECTIVE CAP RA-D-1 DESIGN REVISION
PARSONS P:\Honeywell -SYR\446934 OL Capping Operations\10 Technical Categories\FCFs\MPC RA-D1 Design Revision\Final\MPC RA-D1 Design Revision (Final).docx
October 2015 1
SUMMARY OF DESIGN REVISION
This cap design revision pertains to a small portion of Remediation Area D (RA-D) where movement of the cap and underlying sediment occurred due to the presence of soft (low strength) sediment on relatively steep slopes. This design revision also addresses the small adjacent area in Sediment Management Unit 8 (SMU 8) where sediment movement was also identified. For a capping project of the scale of Onondaga Lake Remediation, it is not unusual to expect to incur field conditions in minor areas throughout the implementation that may require adjustments to the cap system to achieve the remedial goals for the project. As discussed below, the modified protective cap (MPC) in the area of cap movement and the thin layer cap (TLC) in the adjacent area in SMU 8 will be protective for more than 1,000 years, consistent with the evaluation timeframe used in the final design.
Capping operations have been underway in Onondaga Lake since August 21, 2012. During capping in RA-C, movement of a small area of the cap and underlying and adjacent SMU 8 sediment was observed east of the Department of Transportation (DOT) turnaround area on September 5, 2012. Capping operations were subsequently revised to significantly reduce the likelihood of cap movement. Despite those efforts, in early November of 2014, movement of the sediment cap and underlying sediments within a small portion of RA-D was observed shortly following completion of cap placement within RA-D (Figure 1). Movement of the sediments in a small adjacent area within SMU-8 was also observed. The combined total area of cap movement in RA-C and RA-D is approximately 7 acres, which represents approximately 1.6% of the total capping area under the lake remediation program. The combined area of sediment movement in SMU 8 adjacent to RA-C and RA-D cap movement areas is approximately 39 acres, which represents approximately 2% of SMU 8. The area of sediment movement in RA-D extended to a maximum depth of approximately nine feet.
Subsequently collected in situ data and geotechnical analyses indicated that these localized areas of movement resulted from underlying sediments that were softer than previously identified during the pre-design investigation. The design of the MPC for the area of cap movement in RA-D, referred to as MPC RA-D-1, and the thin layer cap in the adjacent SMU 8 area is presented in this design revision. The design of the MPC for the area of movement in RA-C and the thin layer cap in the adjacent SMU 8 area is presented in a separate design revision.
Subsequent to the movement of the cap and sediments RA-D, surface sediment samples were collected in 2015 from throughout the movement area and analyzed for the constituents used to quantify the Mean Probable Effects Concentration Quotient (Mean PECQ): total mercury, ethylbenzene, xylenes, certain chlorinated benzenes, polynuclear aromatic hydrocarbons (PAHs), and total polychlorinated biphenyls (PCBs) based on Aroclors (Parsons 2015). As detailed in the Final Design, the sediment compliance depth for the Mean PECQ used for determining the extent of remedial action in SMU 8 is 4 cm, consistent with the SMU 8

ONONDAGA LAKE CAPPING, DREDGING, HABITAT AND
PROFUNDAL ZONE (SMU 8) FINAL DESIGNMODIFIED PROTECTIVE CAP RA-D-1 DESIGN REVISION
PARSONS P:\Honeywell -SYR\446934 OL Capping Operations\10 Technical Categories\FCFs\MPC RA-D1 Design Revision\Final\MPC RA-D1 Design Revision (Final).docx
October 2015 2
mercury PEC compliance depth. Sample locations where the Mean PECQ of 1 is exceeded in the 0 to 4 cm sampling interval were used in conjunction with post-movement bathymetry survey results to delineate the thin layer cap (TLC) area shown on Figure 1. The area of the MPC includes and extends beyond the area where a full-thickness cap was originally included in the design. Samples were also collected from 4 to 15 cm at all 2015 sampling locations. Results from both intervals from RA-D and the adjacent SMU- 8 area were used in development of the MPC and TLC designs, as detailed in Attachment 2.
The MPC designs and thin layer cap design shown in Figure 1 were determined to be stable based on substantial geotechnical data collected following the movement and detailed geotechnical analysis, as presented in Attachment 1. The thickness and composition of the various layers comprising the MPCs and amended TLC are shown below as well as on Figure 1:
Modified Protective Cap Area RA-D-1A (Multi-layer Cap)
12-inch minimum sand habitat/erosion protection layer 6-inch minimum sand/GAC chemical isolation layer 3-inch minimum sand/siderite mixing layer
Modified Protective Cap Area RA-D-1B (Mono-layer Cap)
4.5-inch average sand/GAC/siderite
Amended Thin Layer Cap (Model Areas A and B)
4.5-inch average sand/GAC
Chemical isolation modeling was completed to determine the granular activated carbon (GAC) application rates that will be protective for more than 1,000 years, consistent with the evaluation timeframe used in the final design, as documented in Attachment 2. The updated GAC application rate based on this modeling are listed below.
GAC Application Rate RA-D-1A 1.26 lbs/sq ft RA-D-1B 3.73 lbs/sq ft Amended TLC Model Area A 1.76 lbs/sq ft Amended TLC Model Area B 0.1 lbs/sq ft
No siderite is required in the TLC area. Siderite is incorporated into caps within portions of the littoral zone, including RA-D, to neutralize high pH and thus promote biodegradation of contaminants within the chemical isolation layer. Cap modeling of multi-layer caps in these areas incorporates biodegradation. The pH in most of the TLC area is typically closer to neutral than in RA-D. Therefore, some biological decay of contaminants is expected in at least portions of the TLC. However, the GAC application rate was conservatively developed through modeling assuming there was no biological decay. Because the protectiveness of the TLC does not depend on a neutral pH and biological decay of contaminants, siderite is not required in the TLC.
ONONDAGA LAKE CAPPING, DREDGING, HABITAT AND
PROFUNDAL ZONE (SMU 8) FINAL DESIGNMODIFIED PROTECTIVE CAP RA-D-1 DESIGN REVISION
PARSONS P:\Honeywell -SYR\446934 OL Capping Operations\10 Technical Categories\FCFs\MPC RA-D1 Design Revision\Final\MPC RA-D1 Design Revision (Final).docx
October 2015 3
The siderite ore application rate based on lbs/sf will be consistent with the Final Design in RA-D-1A and RA-D-1B (1.75 lbs/sf). The siderite percent by weight within the sand/siderite mixture will be increased to account for the thinner sand/siderite layer as compared to the Final Design. The revised design as it pertains to the pH neutralization provides a level of protection that is equivalent to that of the original design, as detailed at the end of this design revision.
A comprehensive Construction Quality Assurance Plan (CQAP) (Parsons and AnchorQEA, 2012) has been developed and implemented to ensure that the cap is constructed consistent with the Final Design, including thickness and amendment application rate requirements. The construction verification methods will be revisited as necessary to ensure the MPCs and TLC are constructed consistent with this design modification.
Post-construction monitoring and maintenance of the capped areas throughout the lake, inclusive of the MPC and TLC addressed in the design revision, will be performed to verify that the overall integrity of the cap is maintained so that it remains physically stable (i.e., does not erode) and chemically protective over time. Long-term monitoring of the caps will include physical monitoring to verify stability and sampling of the caps to verify their chemical integrity, as summarized below. It will also include macrobenthic community sampling and documentation of vegetation recovery, as appropriate. Details of the monitoring methods, frequencies, and procedures and response actions will be developed based on joint discussions with NYSDEC and will be presented in the Onondaga Lake Monitoring and Maintenance Scoping document (OLMMS).
Physical monitoring of the capped areas, including the MPC and TLC areas included in this design revision, will involve verifying that the various layers of cap material placed are stable and intact using a combination of methods including bathymetric surveys, sediment probing and coring, and/or other geophysical methods. The cap integrity will be monitored routinely and following wind/wave, tributary inflow, ice scour or seismic events that exceed a threshold design magnitude, consistent with USEPA (2005) recommendations. The frequency of routine monitoring will be greater initially after construction (e.g., multiple monitoring events within the first 5 to 10 years), and reduced over time once the monitoring is able to establish a consistent pattern of cap performance.
Chemical monitoring will involve measuring chemical concentrations within the caps to verify that contaminants are not moving through or accumulating within the cap at rates and concentrations that exceed specified remedy success metrics. Samples will also be collected within each of the MPC areas as the different cap configurations in these areas will likely result in different monitoring approaches, depths, and compliance points. The frequency of routine monitoring may be reduced over time once the monitoring is able to establish a consistent pattern of cap performance. Details of the chemical monitoring methods, frequencies, locations, sampling intervals, procedures, and response actions will be developed based on joint discussions with NYSDEC and will be presented in the OLMMS for NYSDEC review and approval.
In the unlikely event that the monitoring plan discussed above identifies areas where the cap may not be performing consistent with expectations, follow-on assessments and/or response

ONONDAGA LAKE CAPPING, DREDGING, HABITAT AND
PROFUNDAL ZONE (SMU 8) FINAL DESIGNMODIFIED PROTECTIVE CAP RA-D-1 DESIGN REVISION
PARSONS P:\Honeywell -SYR\446934 OL Capping Operations\10 Technical Categories\FCFs\MPC RA-D1 Design Revision\Final\MPC RA-D1 Design Revision (Final).docx
October 2015 4
actions will be implemented. Follow-on assessments/actions may include additional investigation to further evaluate potential deficiencies, continued monitoring and assessment of overall remedy effectiveness over time, and/or placement of additional cap materials. Cap maintenance and response actions will be detailed in the OLMMS.
Siderite Evaluation for MPCs
As discussed above, the siderite ore application rate based on lbs/sf will be consistent with the Final Design in RA-D-1A and RA-D-1B (1.75 lbs/sf). Control of pH is important primarily because the pH needs to be less than 8 before biodegradation of contaminants will occur, which is consistent with the way the chemical isolation layer was modeled in the Final Design. Siderite is included as a separate layer in RA-D-1A, and therefore biodegradation is included in the cap modeling as discussed in Attachment 2. Siderite is included in the monolayer cap in RA-D-1B and therefore biodegradation is expected to occur, however it is excluded from cap modeling as a conservative assumption, as detailed in Attachment 2. Siderite is not included in the TLC and therefore biodegradation is excluded from the TLC modeling.
In RA-D-1A, the sand/siderite layer, inclusive of the mixing layer, has been reduced from a minimum of 6 inches to a minimum of 3 inches. The revised design as it pertains to the pH neutralization provides a level of protection that is equivalent to that of the original design, as discussed below.
Sensitivity analysis was completed as part of the siderite pH amendment modeling in Appendix I of the Final Design to evaluate the potential impacts of siderite distribution within the chemical isolation layer. An excerpt from this analysis is provided below.
“Four scenarios with siderite segregated to varying degrees towards the bottom of the pH amendment layer were simulated for areas C2 and Waste Beds 1-8 [connected wetland]:
1) all siderite concentrated at the bottom of the pH amendment layer (lowermost model cell)
2) all siderite evenly distributed within the lower 1 inch of the pH amendment layer
3) all siderite evenly distributed within the lower 2 inches of the pH amendment layer, and
4) all siderite evenly distributed within the lower 3 inches of the pH amendment layer
The long-term cap pH performance criteria were met for all four siderite distribution scenarios using the Table 4 design doses… Based on these model results, long-term cap pH performance does not appear to be sensitive to variability in vertical distribution of siderite within the pH amendment layer.
The model results from the sensitivity analysis suggest that non-uniform siderite distribution may have some impact on the time to establish initial pH control within the cap… the time to establish pH control within the cap is predicted to increase from approximately 6 months for uniform siderite distribution to a maximum of 12 months if all the siderite were to be concentrated at the bottom of the pH amendment layer. For Waste Beds 1-8, the time to establish pH control within the cap is predicted to increase from approximately 24 months to a maximum of 38 months if all the siderite were to be concentrated at the bottom of the pH amendment layer.”

Honeywell ONONDAGA LAKE CAPPING, DREDGING, HABITAT AND
PRO FUND AL ZONE (SMU 8) FINAL DESIGN MODIFIED PROTECTIVE CAP RA-D-1 DESIGN REVISION
Although the sensitivity analysis above was conducted for areas other than RA-D-IA, the conclusions are applicable to this area as well. The chemical isolation layer modeling assumed that there would be an initial short-term period of elevated porewater pH within the cap, and accordingly assumed as a conservative measure that biodegradation will not occur until after a 100 year lag period. Therefore, given that the modified design has no long-term impacts on pH neutralization, the minor potential impact to short-term pH control effectiveness does not impact the chemical isolation effectiveness of the cap (i.e., because the short-term impacts, if any, would occur well before the assumed 100-year lag period) . Based on this analysis, decreasing the total minimum thickness of the sand/siderite layer (inclusive of the mixing layer) from 6 in. to 3 in. while maintaining the original design minimum siderite application rate will not impact cap chemical isolation layer performance.
REFERENCES
Parsons and AnchorQEA, (2012), "Construction Quality Assurance Plan Onondaga Lake Capping, Dredging and Habitat"
Parsons, (2015), "Onondaga Lake Modified Protective Cap Areas RA-C-1 and RA-D-1 Mean PECQ Investigation Results"
United States Environmental Protection Agency. 2005. Contaminated Sediment Remediation Guidance for Hazardous Waste Sites. EPA-540-R-05-012. OSWER 9355.0-85. Office of Solid Waste and Emergency Response. December 2005.
PARSCNS P:\Honeywell -SYR\446934 O L Capping Operations\ JO Technical Categories\FCFs\MPC RA-DI Design Revision\Final\MPC RA-DI Design Revision (Pinal).docx
October 20 I 5 5

0
Scale in Feet
250
Oct
15,
201
5 4:
10pm
cya
rd
H:\
Syra
cuse
1\CA
D Pr
ojec
ts\0
1013
9-O
NO
NDA
GA_L
AKE\
0101
3902
\Fig
ures
\Con
stru
ctio
n M
onito
ring\
RA-D
9-S
tep
Cap
Inve
st\R
A-D
9-St
ep C
ap In
vest
igat
ion
Area
-10-
15-1
5.dw
g Fi
gure
1
SOURCE: Rem D Disturbance Bathy (Parsons)
(This is a merge of multiple post-disturbance bathy surveys)
HORIZONTAL DATUM: New York State Plane, Central Zone,
North American Datum 1983 (NAD83), U.S. Feet
VERTICAL DATUM: North American Vertical Datum 1988 (NAVD88)
Figure 1
Remediation Area D
Modified Protective Cap Area D-1 and Adjacent Thin Layer Cap
Onondaga Lake
LEGEND:
Approximate Limits of Cap and/or Sediment Movement
Post-Disturbance Bathymetry
Original Capped Area Boundary
Original Thin Layer Cap Area
20-foot (6 Meter) Depth Contour (elev. 342.5')
30-foot (9 Meter) Depth Contour (elev. 332.5')

ONONDAGA LAKE CAPPING, DREDGING, HABITAT AND
PROFUNDAL ZONE (SMU 8) FINAL DESIGNMODIFIED PROTECTIVE CAP RA-D-1 DESIGN REVISION
PARSONS P:\Honeywell -SYR\446934 OL Capping Operations\10 Technical Categories\FCFs\MPC RA-D1 Design Revision\Final\MPC RA-D1 Design Revision (Final).docx
October 2015
ATTACHMENT 1
MODIFIED PROTECTIVE CAP RA-D-1 GEOTECHNICAL ANALYSIS

Page 1 of 22
Written by:
C. Carlson/M. Erten
Date: 10/15/2015 Reviewed
by: A. Ebrahimi/ J. Beech Date: 10/15/2015
Client: Honeywell Project: Cap Placement in Modified Protective Cap Area RA-D-1
Project No.:GD5837 Task No.: 03
REVISION 3 SLOPE STABILITY ANALYSIS
FOR CAP PLACEMENT IN MODIFIED PROTECTIVE CAP AREA RA-D-1
This report evaluates the geotechnical aspects of a modified protective cap (MPC) in a small area (approximately 5.8 acres) of Remediation Area D (RA-D) as well as in the adjacent area in Sediment Management Unit 8 (SMU 8). The results of the slope stability analyses showed that a MPC design in this area with an average thickness of approximately 28.5 inches placed in a series of five lifts would be stable within the majority of the originally capped area and that a MPC consisting of a single lift with an average thickness of 4.5 inches would be stable within the remaining portion of the originally capped area as well is in the adjacent area in SMU 8. One week wait is required between placements of cap lifts to allow consolidation of soft remaining sediments. The MPC design will be protective consistent with the intent of the Remedial Design, which will be documented in a separate submittal to the New York State Department of Environmental Conservation (NYSDEC).
INTRODUCTION
Sediment capping operations have been underway in Onondaga Lake since August 21, 2012. During capping in Remediation Area C (RA-C), movement of a small area of the cap and underlying sediment was observed east of the Department of Transportation (DOT) turnaround area on September 5, 2012. At the time of cap movement, the thickness of cap was between approximately 25 and 40 inches within the area of movement, including approximately 7-10 inches of siderite placed in August 2012, 9-15 inches of granular activated carbon (GAC) placed in August and September 2012, and 9-15 inches of habitat layer placed in September 2012. Capping operations were subsequently modified to reduce the potential for cap movement.
In early November of 2014, movement of the sediment cap and underlying sediments within and adjacent to a small portion of RA-D was observed shortly following completion of cap placement within RA-D (Figure 1). At the time of cap movement, a full cap thickness was completed in this area and in the area upslope of the cap movement area. Movement of the sediments in a small adjacent area within SMU-8 was also observed. The areas where MPCs are being developed to address this movement in RA-C and RA-D are referred to as modified cap areas RA-C-1 and RA-D-1, respectively. The combined total area of cap movement in RA-C and RA-D is approximately 7.1 acres, which represents approximately 1.6% of the total capping area under the lake remediation program. For a capping project of the scale of Onondaga Lake

Page 2 of 22
Written by:
C. Carlson/M. Erten
Date: 10/15/2015 Reviewed
by: A. Ebrahimi/ J. Beech Date: 10/15/2015
Client: Honeywell Project: Cap Placement in Modified Protective Cap Area RA-D-1
Project No.:GD5837 Task No.: 03
Remediation, it is not unusual to expect to incur field conditions in minor areas throughout the implementation that may require adjustments to the cap system to achieve the remedial goals for the project. Subsequently collected in situ data and geotechnical analyses indicated that these localized areas of movement resulted from underlying sediments that were softer than previously identified during the pre-design investigation (Geosyntec, 2015b). Geotechnical analyses associated with capping in the modified protective cap area RA-C-1 has been submitted to NYSDEC in a separate document prepared by Geosyntec, titled “Slope Stability Analysis for Cap Placement in Modified Protective Cap Area RA-C-1,” [Geosyntec, 2015a].
For the purposes of cap chemical isolation modeling, RA-D-1 has been divided into three modeling areas based on the results of post-movement surface sediment sample results (Figure 1).
• Model Area A includes the area where a full-thickness cap was originally placed and in which, post-movement surface sediment sample analytical results showed higher surface sediment contaminant concentrations. Therefore, the geotechnical analysis for this area includes placement of multiple lifts of cap material (i.e., 4.5 in. sand/siderite + two 4.5 in. sand/granular activated carbon (GAC) + two 7.5 in. habitat sand layer).
• Model Areas B and C include areas where the original design included a thin layer cap or monitored natural recovery and in which post-movement surface sediment sample analytical results showed lower contaminant concentrations. Therefore, the geotechnical analysis for these areas considered placement of a single lift of cap material.
Additional details pertaining to development of the cap modeling areas and chemical isolation modeling results will be provided in a separate submittal.
SLOPE STABILITY ANALYSES
The slope stability analyses were performed using Janbu’s simplified method [Janbu, 1973] for block failure slip surfaces and Spencer’s method [Spencer, 1973] for the circular slip surfaces, as implemented in the computer program SLIDE, version 6.026 [Rocscience, 2013]. Spencer’s method, which satisfies vertical and horizontal force equilibrium and moment equilibrium, is considered to be more rigorous than other methods, such as Janbu’s simplified method [Janbu, 1973] and the simplified Bishop’s method [Bishop, 1955]. However, Spencer’s method often encounters numerical convergence difficulties when considering block slip

Page 3 of 22
Written by:
C. Carlson/M. Erten
Date: 10/15/2015 Reviewed
by: A. Ebrahimi/ J. Beech Date: 10/15/2015
Client: Honeywell Project: Cap Placement in Modified Protective Cap Area RA-D-1
Project No.:GD5837 Task No.: 03
surfaces. Therefore, Spencer’s method was used for the circular slip surfaces, while Janbu’s method was used for block slip surfaces.
The rotational and block modes of slope stability analyses are consistent with the methods presented in the RA-C-1 Report [Geosyntec, 2015a].
Target Factor of Safety
Consistent with the RA-C-1 Report [Geosyntec, 2015a], a target factor of safety (FS) of 1.5 was selected for the analyses presented herein.
Subsurface Stratigraphy
Because the sediments are soft, undisturbed samples could not be collected in the field and tested in the laboratory for shear strength and consolidation properties. Therefore, the information regarding the subsurface stratigraphy was obtained from in situ field testing techniques, including the Cone Penetrometer Test (CPT) and Full-Flow Penetrometer Test (FFP). The locations of in situ tests are presented in Figure 1. The in situ tests were performed both in the shallow slope areas (i.e., slope < 10%) and steep slope areas (i.e., slope > 10%) to obtain representative undrained shear strength estimates in different regions of RA-D and SMU-8. These tests provided information to characterize the in situ shear strength and consolidation properties of the soft sediments within these areas; however, the FFP is generally more accurate than the CPT for assessing the low shear strength of soft sediments. Therefore only the results of FFP tests are presented in this report. Nine FFP tests (FFP-15-DD6, FFP-14-07, FFP-14-10, FFP-14-05, FFP-14-04, FFP-15-DD4, FFP-15-DD5, FFP-14-06, and FFP-15-DD7) were performed in the original cap-only and thin-layer cap areas of RA-D. Six FFP tests (FFP-14-02, FFP-15-DD2, FFP-15-DD3, FFP-14-03, FFP-15-DD1, and FFP-15-DD8) were performed within SMU-8. Figure 2 shows the results of the FFP tests in RA-D-1 following the movement of the cap and underlying sediments. The selected shear strength profiles for slope stability analyses are also shown on Figure 2.
The development of geotechnical parameters used for the lakebed sediments is described in a separate Geosyntec report submitted to NYSDEC [Geosyntec 2015b].

Page 4 of 22
Written by:
C. Carlson/M. Erten
Date: 10/15/2015 Reviewed
by: A. Ebrahimi/ J. Beech Date: 10/15/2015
Client: Honeywell Project: Cap Placement in Modified Protective Cap Area RA-D-1
Project No.:GD5837 Task No.: 03
GEOTECHNICAL STABILITY EVALUATION Shear Strength Gain
The shear strength gain caused by an increase in vertical effective stress (in this case, as a result of cap placement) is proportional to the degree of consolidation. The shear strength gain considered in the analyses for RA-D-1 was consistent with the method described in Geosyntec [2015b].
Approximately, the top 4 ft of sediments (based on the FFP data) within the SMU-8 portion
of MPC area RA-D-1 and the top 2 ft in the area where significant movement of the sediments was not observed is considered to be disturbed and in a normally consolidated state and, thus, can gain strength after the placement of any cap material. In the area where movement of the sediments was observed, the sediments were considered to be in an over-consolidated state due to removal of overlying sediments and no strength gain with time was assumed for the slope stability analyses.
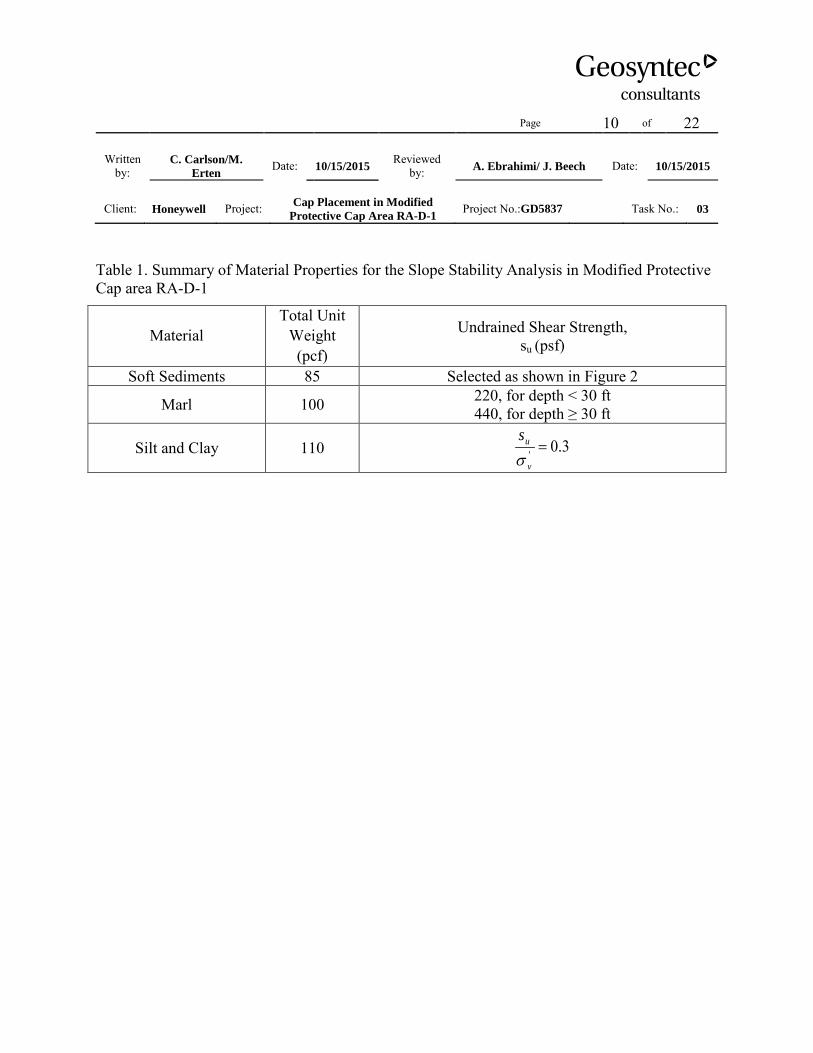
Geotechnical Parameters
The material properties used for the geotechnical slope stability analyses herein are presented in Table 1. Figure 2 shows the shear strength profile for Cross Section 2. The shear strength profile for Cross Sections 1, 3, and 4 is similar to the one for Cross Section 2 and therefore is not presented in this report. In summary, the subsurface materials in the modified protective cap area RA-D-1 consist of three strata: Soft Sediments, Marl, and Silt and Clay. Soft sediments extend to depths of about 10 to 20 ft. Marl lies between depths of 20 and 60 ft. Silt and clay is below depths of 60 ft.
Per RA-C-1 Report [Geosyntec, 2015a], the coefficient of consolidation, cv, to estimate the rate of consolidation of sediments under cap loading is selected as 4 x 10⁻³ cm2/s.
ANALYZED CROSS SECTIONS
Four cross sections were preliminary evaluated in RA-D-1, as shown in Figure 1. Out of these four cross sections, Cross Sections 2 and 3 (CS-2 and CS-3) were selected as representative cross sections for slope stability analyses. Figure 2 shows the pre- and post-movement bathymetry of the lake bottom (shown for CS-2), which indicates the movement of up to 8 ft of

Page 5 of 22
Written by:
C. Carlson/M. Erten
Date: 10/15/2015 Reviewed
by: A. Ebrahimi/ J. Beech Date: 10/15/2015
Client: Honeywell Project: Cap Placement in Modified Protective Cap Area RA-D-1
Project No.:GD5837 Task No.: 03
the lake bottom sediments. A majority of the movement was observed in the shallow slope (i.e., slope < 10%) area of CS-2 (i.e., station 75 to 520 ft). For CS-2, sediments have moved between stations 75 and 460 ft and accumulated between stations 750 and 1430 ft.
RESULTS OF SLOPE STABILITY ANALYSES
Figure 3 shows the calculated FS for CS-2 and CS-3 under current conditions. The minimum calculated FS in the current condition (i.e., subsequent to the sediment movement and prior to additional cap placement) are:
• 1.97 for CS-2 and 1.73 for CS-3 in the steep slope area of the original RA-D cap-only area or Model Area A; and
• 1.57 for CS-2 and 2.38 for CS-3 in SMU-8 (i.e., downslope of the original RA-D cap-only area).
Figure 4 shows the calculated FS after placement of the first 4.5-in. thick lift of cap material. The minimum calculated FS after placement of the first lift in each of the cross sections are:
• 1.87 for CS-2 and 1.53 for CS-3 in the steep slope area of the original RA-D cap-only area; and
• 1.32 for CS-2 and 1.96 for CS-3 in SMU-8.
The FS of 1.32 for CS-2 does not meet the target FS of 1.5. However, the slip surface associated with this FS is only 11-ft wide and is reflective of potential localized irregularities in the sediment surface rather than larger scale slope instability. Similarly, a slip surface with a calculated FS of 1.25 is observed for CS-3 in the SMU-8 portion of the MPC due to a localized irregularity. Therefore, placement of a single 4.5-in. lift in this area is considered acceptable.
Figure 5 shows the calculated FS in Model Area A after placement of a second 4.5-in. thick lift of cap (total average thickness of 9 in.). The minimum calculated FS after placement of the second lift are:
• 1.63 for CS-2 and 1.15 for CS-3 in the steep slope area of the original RA-D cap-only area.

Page 6 of 22
Written by:
C. Carlson/M. Erten
Date: 10/15/2015 Reviewed
by: A. Ebrahimi/ J. Beech Date: 10/15/2015
Client: Honeywell Project: Cap Placement in Modified Protective Cap Area RA-D-1
Project No.:GD5837 Task No.: 03
Based on these results, the steep slope areas in Model Area A should be capped with placement of no more than one lift with an average thickness no greater than 4.5 in. The boundary of steep slope area in Model Area A was delineated using the bathymetry map (shown in Figure 10). Based on the FFP data, the shallow sediments in this area are considered to be over-consolidated due to the loss of overlying sediment as a result of the slope movement. Therefore, a longer wait time would not increase the calculated FS for placement of additional lifts. The calculated FS in the remaining portion of Model Area A exceeded 1.5, therefore placement of additional lifts consistent with the thickness goals discussed in the introduction were evaluated. These results also indicate that CS-3 is the more critical section, so the remaining results and recommendations are based on the slope stability analyses for CS-3.
Figure 6 shows the calculated FS in Model Area A (excluding the steep slope area) after placement of an additional 4.5-in. thick cap lift (with a 1 week wait following placement of the initial 4.5-in. lift for a total cumulative average thickness of 9 in.). The minimum calculated FS after placement of this lift is 1.91 for CS-3.
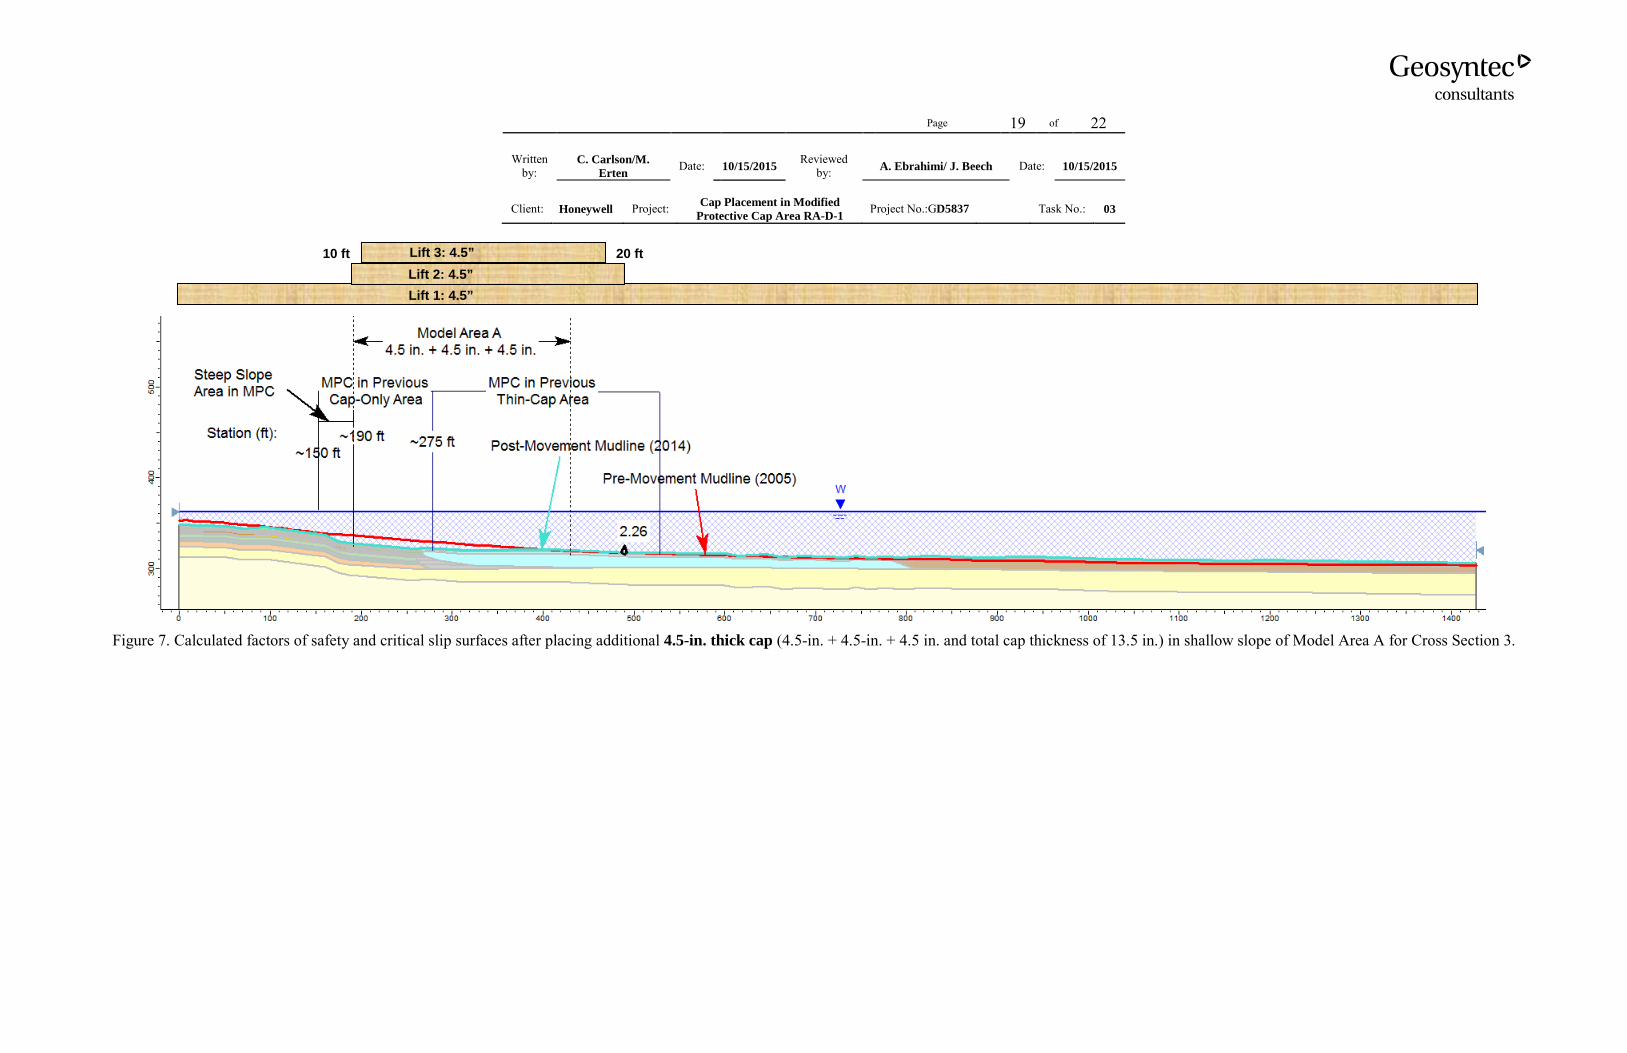
Figure 7 shows the calculated FS in Model Area A (excluding the steep slope area) after placement of a third 4.5-in. thick cap lift (total cumulative average thickness of 13.5 in.; 1 week wait following the previous lift). In the slope stability analyses, 20-ft feathering for the downslope of Model Area A toward SMU-8 and 10-ft feathering for upslope of Model Area A toward the steep slopes were considered. The minimum calculated FS after placement of this lift is 2.26 for CS-3.
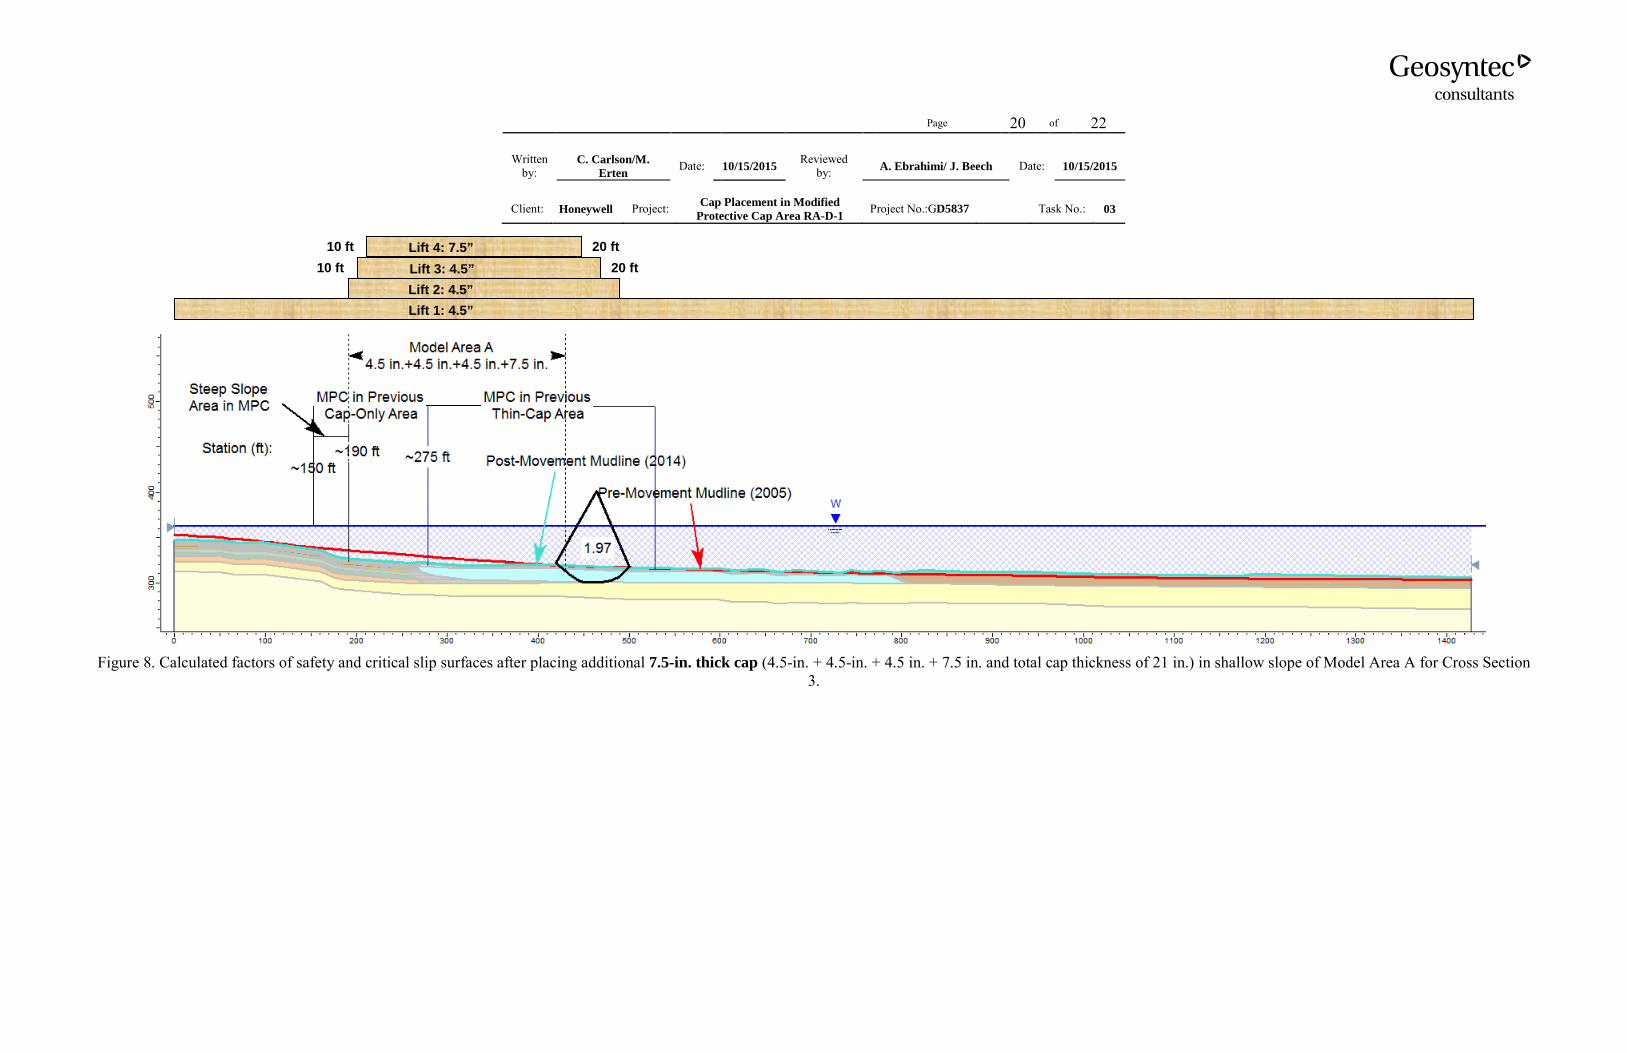
Figure 8 shows the calculated FS in Model Area A (excluding the steep slope area) after placing a 7.5-in. thick cap lift 1 week after the previous lift (total cumulative average thickness of 21 in.) The minimum calculated FS for CS-3 after placement of this lift is 1.97.
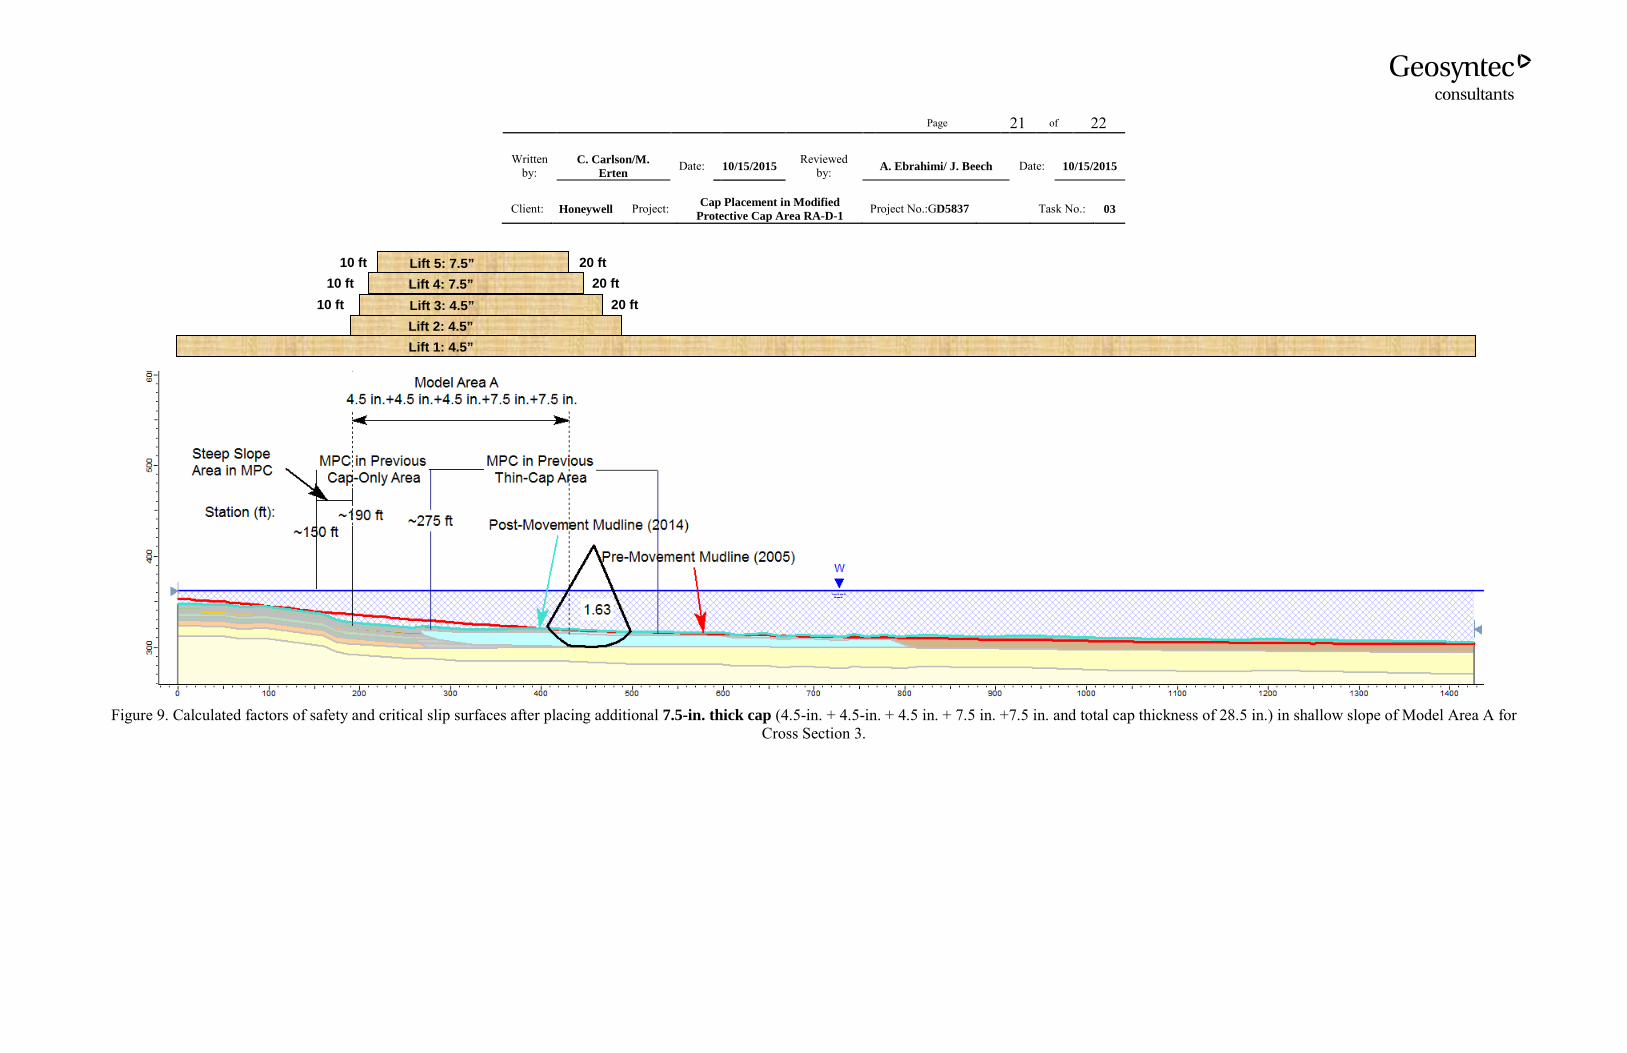
Figure 9 shows the calculated FS in Model Area A (excluding the steep slope area) after placing an additional 7.5-in. thick cap lift 1 week after the previous lift (total cumulative average thickness of 28.5 in.). The minimum calculated FS for CS-3 after placement of this lift is 1.63.
In general, the calculated failure surfaces are within the upper zone of the disturbed sediments (i.e., depths of 2 to 4 feet) or deeper soft sediments (i.e., depths of 8 to 14 ft).

Page 7 of 22
Written by:
C. Carlson/M. Erten
Date: 10/15/2015 Reviewed
by: A. Ebrahimi/ J. Beech Date: 10/15/2015
Client: Honeywell Project: Cap Placement in Modified Protective Cap Area RA-D-1
Project No.:GD5837 Task No.: 03
The cap placement procedure in RA-D-1 includes a verification of successful placement of each lift by the operations team thru methods such as coring prior to proceeding with the subsequent lift. However, the monitoring and verification of successful lift placement will not provide information regarding whether additional lift placements would be stable, it only verifies that it was stable for what was already placed. Therefore, real time monitoring would not allow additional cap material to be placed.
Other engineering methods to improve stability and allow additional cap material placement, such as toe berms and keyways, were considered. However, the critical slip surfaces are related to multiple localized surface irregularities in the steep portion of this area rather than a single large slip surface that could potentially be targeted for methods such as toe berms and keyways. Therefore, implementation of these methods would not be practical for this area.
CONCLUSIONS
The results of the slope stability analyses for the placement of multiple lifts of cap show that in general:
• in the area where significant movement of the sediments (i.e., 2 to 8 ft) was observed, the sediments were considered over consolidated and no strength gain with time was used in the slope stability analyses;
• in the area where significant movement of the sediments was not observed, the sediments were considered normally consolidated and strength gain with time was used in the slope stability analyses;
• the calculated FS after placement of the first 4.5-in. thick lift of cap in RA-D-1 exceed the target FS of 1.5 except in small areas associated with post-movement sediment surface irregularities (Figure 4). Therefore, placement of one lift of cap with an average thickness no greater than 4.5 in. is considered acceptable within Model Areas A, B, and C;
• the calculated FS after placement of the second 4.5-in. thick lift of cap does not meet the target FS of 1.5 within the steep slope portion of the original cap area (Model Area A), therefore cap placement in this area should be limited to a single 4.5-in. thick lift;

Page 8 of 22
Written by:
C. Carlson/M. Erten
Date: 10/15/2015 Reviewed
by: A. Ebrahimi/ J. Beech Date: 10/15/2015
Client: Honeywell Project: Cap Placement in Modified Protective Cap Area RA-D-1
Project No.:GD5837 Task No.: 03
• the calculated FS after placement of two additional 4.5-in. thick lifts of cap and two 7.5-in. thick lifts of cap with one-week wait between each lift within the shallow slope portion of Model Area A meet the target FS of 1.5 (Figures 6 through 9).
• for each lift in Model Area A, a minimum of 10-ft feathering is required on the upslope portion of the area and a minimum of 20-ft feathering is required on the downslope portion of the area.
Figure 10 shows the recommendation for cap placement in the MPC area RA-D-1. The boundary of 4.5 in. thin cap layer in steep slope portion of Model Area A was selected to take into account the surface irregularities shown in the bathymetry survey and local steep slope areas.

Page 9 of 22
Written by:
C. Carlson/M. Erten
Date: 10/15/2015 Reviewed
by: A. Ebrahimi/ J. Beech Date: 10/15/2015
Client: Honeywell Project: Cap Placement in Modified Protective Cap Area RA-D-1
Project No.:GD5837 Task No.: 03
REFERENCES
Bishop, A. (1955), “The Use of the Slip Circle in the Stability Analysis of Slopes,” Geotechnique, Volume 5, No. 1, Jan 1955, pp. 7-17.
Geosyntec Consultants (2015a), “Slope Stability Analysis for Cap Placement in Modified
Protective Cap Area RA-C-1,” Prepared for submittal to NYSDEC, July 9, 2015, 21 pages.
Geosyntec Consultants (2015b), “Development of Geotechnical Design Parameters for Lakebed Sediments in Onondaga Lake Capping Areas,” Prepared for submittal to NYSDEC, July 13, 2015.
Janbu, N. (1973), “Slope Stability Computations,” Embankment Dam Engineering, Casagrande
Memorial Volume, R. C. Hirschfield and S. J. Poulos, Eds., John Wiley, New York, 1973, pp. 47-86.
Mayne, P.W. (2007), “Cone Penetration Testing, A Synthesis of Highway Practice,” NCHRP
Synthesis 368, Transportation Research Board, Washington, D.C. Rocscience (2013), “SLIDE – 2-D Limit Equilibrium Slope Stability for Soil and Rock Slopes,”
User's Guide, Rocscience Software, Inc., Toronto, Ontario, Canada, 2013. Spencer, E. (1973), “The Thrust Line Criterion in Embankment Stability Analysis,”
Géotechnique, Vol. 23, No. 1, pp. 85-100, March 1973.
Page 10 of 22
Written by:
C. Carlson/M. Erten
Date: 10/15/2015 Reviewed
by: A. Ebrahimi/ J. Beech Date: 10/15/2015
Client: Honeywell Project: Cap Placement in Modified Protective Cap Area RA-D-1
Project No.:GD5837 Task No.: 03
Table 1. Summary of Material Properties for the Slope Stability Analysis in Modified Protective Cap area RA-D-1
Material Total Unit
Weight (pcf)
Undrained Shear Strength, su (psf)
Soft Sediments 85 Selected as shown in Figure 2
Marl 100 220, for depth < 30 ft 440, for depth ≥ 30 ft
Silt and Clay 110 3.0' =v
uss

Page 11 of 22
Written by:
C. Carlson/M. Erten
Date: 10/15/2015 Reviewed
by: A. Ebrahimi/ J. Beech Date: 10/15/2015
Client: Honeywell Project: Cap Placement in Modified Protective Cap Area RA-D-1
Project No.:GD5837 Task No.: 03
Figure 1. Modified protective cap area RA-D-1 in Remediation Area D (RA-D) and Thin Layer Cap in SMU-8. The map also shows locations of in situ FFP tests and cross sections within RA-D.
Model Area A
Model Area C
Model Area B
Thin Cap Layer (TLC) in SMU-8
Modified Protective Cap Area in RA-D-1

Page 12 of 22
Written by:
C. Carlson/M. Erten
Date: 10/15/2015 Reviewed
by: A. Ebrahimi/ J. Beech Date: 10/15/2015
Client: Honeywell Project: Cap Placement in Modified Protective Cap Area RA-D-1
Project No.:GD5837 Task No.: 03
Figure 2a. Subsurface stratigraphy and shear strength profiles from the FFPs collected within the previous cap-only area of RA-D portion of modified protective cap (MPC) RA-D-1.
Marl for depth ≥ 30ft su = 440 psf
Soft Sediments– likely to be in an over consolidated state
Marl for depth < 30ft su = 220 psf

Page 13 of 22
Written by:
C. Carlson/M. Erten
Date: 10/15/2015 Reviewed
by: A. Ebrahimi/ J. Beech Date: 10/15/2015
Client: Honeywell Project: Cap Placement in Modified Protective Cap Area RA-D-1
Project No.:GD5837 Task No.: 03
Figure 2b. Subsurface stratigraphy and shear strength profiles from the FFPs collected within the SMU-8 portion of modified protective cap (MPC) RA-D-1.
Marl for depth < 30ft su = 220 psf
Marl for depth ≥ 30ft su = 440 psf
Soft Sediments – likely to be in an over consolidated state
TLC in SMU-8

Page 14 of 22
Written by:
C. Carlson/M. Erten
Date: 10/15/2015 Reviewed
by: A. Ebrahimi/ J. Beech Date: 10/15/2015
Client: Honeywell Project: Cap Placement in Modified Protective Cap Area RA-D-1
Project No.:GD5837 Task No.: 03
Figure 2c. Subsurface stratigraphy and shear strength profiles from the FFPs collected within the mounded area of the SMU-8 portion of modified protective cap (MPC) RA-D-1.
Marl for depth ≥ 30ft su = 440 psf
Marl for depth < 30ft su = 220 psf
Soft Sediments likely to be in normally consolidated state
Post-Movement Mudline (2014) Pre-Movement Mudline (2005)
TLC in SMU-8

Page 15 of 22
Written by:
C. Carlson/M. Erten
Date: 10/15/2015 Reviewed
by: A. Ebrahimi/ J. Beech Date: 10/15/2015
Client: Honeywell Project: Cap Placement in Modified Protective Cap Area RA-D-1
Project No.:GD5837 Task No.: 03
Figure 3. Calculated factors of safety and critical slip surfaces for current condition of Cross Sections 2 (top) and 3 (bottom) using the post-movement geometry. The modified protective cap (MPC) area RA-D-1 is separated
into steep area within original cap-only area, thin layer cap area, and SMU-8.
TLC in SMU-8
TLC in SMU-8

Page 16 of 22
Written by:
C. Carlson/M. Erten
Date: 10/15/2015 Reviewed
by: A. Ebrahimi/ J. Beech Date: 10/15/2015
Client: Honeywell Project: Cap Placement in Modified Protective Cap Area RA-D-1
Project No.:GD5837 Task No.: 03
Figure 4. Calculated factors of safety and critical slip surfaces for first lift of 4.5-in. thick cap placed over post-movement mudline of Cross Sections 2 (top) and 3 (bottom).
Lift 1: 4.5”
TLC in SMU-8
TLC in SMU-8

Page 17 of 22
Written by:
C. Carlson/M. Erten
Date: 10/15/2015 Reviewed
by: A. Ebrahimi/ J. Beech Date: 10/15/2015
Client: Honeywell Project: Cap Placement in Modified Protective Cap Area RA-D-1
Project No.:GD5837 Task No.: 03
Figure 5. Calculated factors of safety and critical slip surfaces for second lift of 4.5-in. thick cap (total cap thickness of 9 in.) in Cross Sections 2 (top) and 3 (bottom).
Lift 1: 4.5”
Lift 2: 4.5”

Page 18 of 22
Written by:
C. Carlson/M. Erten
Date: 10/15/2015 Reviewed
by: A. Ebrahimi/ J. Beech Date: 10/15/2015
Client: Honeywell Project: Cap Placement in Modified Protective Cap Area RA-D-1
Project No.:GD5837 Task No.: 03
Figure 6. Calculated factors of safety and critical slip surfaces after placing additional 4.5-in. thick cap (4.5-in. + 4.5-in. and total cap thickness of 9 in.) in shallow slope of Model Area A for Cross Section 3.
Lift 1: 4.5”
Lift 2: 4.5”
Page 19 of 22
Written by:
C. Carlson/M. Erten
Date: 10/15/2015 Reviewed
by: A. Ebrahimi/ J. Beech Date: 10/15/2015
Client: Honeywell Project: Cap Placement in Modified Protective Cap Area RA-D-1
Project No.:GD5837 Task No.: 03
Figure 7. Calculated factors of safety and critical slip surfaces after placing additional 4.5-in. thick cap (4.5-in. + 4.5-in. + 4.5 in. and total cap thickness of 13.5 in.) in shallow slope of Model Area A for Cross Section 3.
Lift 1: 4.5”
Lift 2: 4.5”
Lift 3: 4.5”
20 ft
10 ft
Page 20 of 22
Written by:
C. Carlson/M. Erten
Date: 10/15/2015 Reviewed
by: A. Ebrahimi/ J. Beech Date: 10/15/2015
Client: Honeywell Project: Cap Placement in Modified Protective Cap Area RA-D-1
Project No.:GD5837 Task No.: 03
Figure 8. Calculated factors of safety and critical slip surfaces after placing additional 7.5-in. thick cap (4.5-in. + 4.5-in. + 4.5 in. + 7.5 in. and total cap thickness of 21 in.) in shallow slope of Model Area A for Cross Section
3.
Lift 1: 4.5”
Lift 2: 4.5”
Lift 3: 4.5”
20 ft
10 ft
20 ft
10 ft
Lift 4: 7.5”
Page 21 of 22
Written by:
C. Carlson/M. Erten
Date: 10/15/2015 Reviewed
by: A. Ebrahimi/ J. Beech Date: 10/15/2015
Client: Honeywell Project: Cap Placement in Modified Protective Cap Area RA-D-1
Project No.:GD5837 Task No.: 03
Figure 9. Calculated factors of safety and critical slip surfaces after placing additional 7.5-in. thick cap (4.5-in. + 4.5-in. + 4.5 in. + 7.5 in. +7.5 in. and total cap thickness of 28.5 in.) in shallow slope of Model Area A for
Cross Section 3.
Lift 1: 4.5”
Lift 2: 4.5”
Lift 3: 4.5”
20 ft
10 ft
20 ft
10 ft
Lift 4: 7.5”
Lift 5: 7.5”
20 ft
10 ft

Page 22 of 22
Written by:
C. Carlson/M. Erten
Date: 10/15/2015 Reviewed
by: A. Ebrahimi/ J. Beech Date: 10/15/2015
Client: Honeywell Project: Cap Placement in Modified Protective Cap Area RA-D-1
Project No.:GD5837 Task No.: 03
Figure 10. Recommended cap placement in modified protective cap area RA-D-1.
Model Area A – Steep Slopes
4.5 in. Cap Placement
Model Area A – Shallow Slopes
Three 4.5 in. + two 7.5 in. Lifts 20-ft feather downslope and 10-ft
feather upslope with one-week wait
Model Areas B and C
4.5 in. Cap Placement

ONONDAGA LAKE CAPPING, DREDGING, HABITAT AND
PROFUNDAL ZONE (SMU 8) FINAL DESIGNMODIFIED PROTECTIVE CAP RA-D-1 DESIGN REVISION
PARSONS P:\Honeywell -SYR\446934 OL Capping Operations\10 Technical Categories\FCFs\MPC RA-D1 Design Revision\Final\MPC RA-D1 Design Revision (Final).docx
October 2015
ATTACHMENT 2
MODIFIED PROTECTIVE CAP RA-D-1 CHEMICAL ISOLATION MODELING

290 Elwood Davis Road, Suite 340 Liverpool, New York 13088
Phone 315.453.9009 Fax 315.453.9010
www.anchorqea.com
M E M O R A N D U M To: Ed Glaza, Parsons Date: October 16, 2015 From: Deirdre Reidy and Kevin Russell,
Anchor QEA, LLC Project: E50139-09.02
Cc: Paul LaRosa and Ram Mohan, Anchor QEA, LLC Re: Cap Modeling in Modified Protective Cap Area RA-D-1 and Adjacent Amended
Thin-layer Cap in SMU 8
1 INTRODUCTION
This memorandum documents the numerical modeling conducted for the Modified Protective Cap (MPC) Area RA-D-1 as well as for the amended thin-layer cap (TLC) in the adjacent area of Sediment Management Unit 8 (SMU 8). It is the first in a series of memoranda that will document the evaluations conducted to develop granular activated carbon (GAC) amendment application rates and document the protectiveness of the various MPCs. For a capping project of the scale of Onondaga Lake Remediation, it is not unusual to expect previously unforeseen field conditions in small areas that may warrant adjustments to the cap system to achieve the remedial goals for the project. Sediment capping operations have been underway in Onondaga Lake since August 21, 2012. During capping in Remediation Area (RA)-C, movement of a small area of the cap and underlying sediment was observed in a portion of this area in September 2012. Capping operations were subsequently revised to significantly reduce the likelihood of cap movement. In early November 2014, movement of the sediment cap and underlying sediments within and adjacent to a small portion of RA-D was observed shortly following completion of cap placement within that area. Subsequent to these cap movements, additional in situ data collection and geotechnical analyses were conducted. These recent geotechnical stability evaluations have indicated that the cap thicknesses developed as part of the final design (Parsons and Anchor QEA 2012a) need to be reduced in the small areas of cap movement, as well as in other small portions of Onondaga Lake RAs where the sediments are much softer than previously identified. Therefore, numerical modeling was conducted to verify the protectiveness of the reduced cap thicknesses and to develop GAC application rates that would be required for these

Ed Glaza October 16, 2015
Page 2
modified caps to be protective for more than 1,000 years, consistent with the evaluation timeframe used in the final design. This memorandum consists of the following sections:
• Section 2 describes the general modeling approach used to evaluate the various modified cap configurations.
• Section 3 describes the modeling details specific to RA-D-1. • Section 4 describes the modeling details specific to the adjacent amended TLC in
SMU 8. • Section 5 tabulates the GAC application rate required in each area to meet the target
criteria for more than 1,000 years. • Section 6 presents model sensitivity analyses. • Section 7 presents a list of references. • Attachment 1 includes the model files associated with RA-D-1 MPC and SMU 8
amended TLC modeling.
2 GENERAL MODELING APPROACH
This section describes the modeling approach employed for the proposed MPC configurations identified from the geotechnical analyses. The modeling approaches can be simplified into three basic categories:
1. Multi-layer caps 2. Mono-layer caps, including direct GAC amendment application and amended TLCs 3. Modeling deposition effects for mercury and TLCs
The following three subsections describe the details of these general cap configurations, how they were represented in the model, and the approach for assessing compliance, for these three approaches, respectively. Considerations specific to area RA-D-1 and adjacent amended TLCs are described in Section 3. These considerations include site-specific cap configuration, the chemical source term (i.e., initial sediment porewater concentrations), groundwater upwelling velocity, the bioturbation depth, and the biological decay rate.

Ed Glaza October 16, 2015
Page 3
2.1 Multi-layer Caps
Multi-layer caps will have sufficient thickness based on geotechnical analysis such that there will be separate habitat and chemical isolation layers. Within RA-D, such multi-layer MPCs are located within the littoral zone (i.e., original limits of RA-D), as well as within a portion of SMU 8 directly adjacent to RA-D. These multi-layer MPCs were simulated consistent with the final design cap configuration (except using the reduced thicknesses). Compliance with design standards (i.e., probable effects concentrations [PECs] and sediment screening concentrations [SSCs]) for multi-layer MPCs was assessed at the point of the maximum concentration within the habitat restoration layer to verify compliance throughout that layer, consistent with the final design. Multi-layer MPCs having a sand/siderite layer separate from the GAC-amended chemical isolation layer were evaluated incorporating biological degradation (which is expected to occur over the long term following porewater pH neutralization by siderite), consistent with the final design. Biological degradation was conservatively not simulated for MPCs in which siderite and GAC are mixed with sand within the same layer. Consistent with the final design, multi-layer MPCs were evaluated with the numerical cap model using deterministic simulations; probabilistic modeling was not conducted for these MPCs. During the final design, although probabilistic modeling was performed for 13 separate modeling areas, the GAC dose was increased in one model area only—WBB1-8, which is not an area of concern for these evaluations. In this area, the GAC application rate increased by less than 10%. These results indicate that the deterministic modeling drives the GAC application rate in nearly all cases and probabilistic modeling is not needed for the MPC evaluations.
2.2 Mono-layer Caps
Mono-layer caps will be implemented in those areas where the thickness limitations based on geotechnical analysis do not allow for separate habitat and chemical isolation layers. Mono-layer caps will consist of a single layer of sand that includes both GAC and siderite. Studies have shown that toxicity and bioaccumulation in benthic organisms decrease with the addition of GAC to sediments due to reductions in contaminant concentrations in porewater (Janssen and Beckingham 2013). If GAC with adsorbed contaminants is ingested by benthic organisms, it would likely pass through their digestive system with minimum if
Ed Glaza October 16, 2015
Page 4
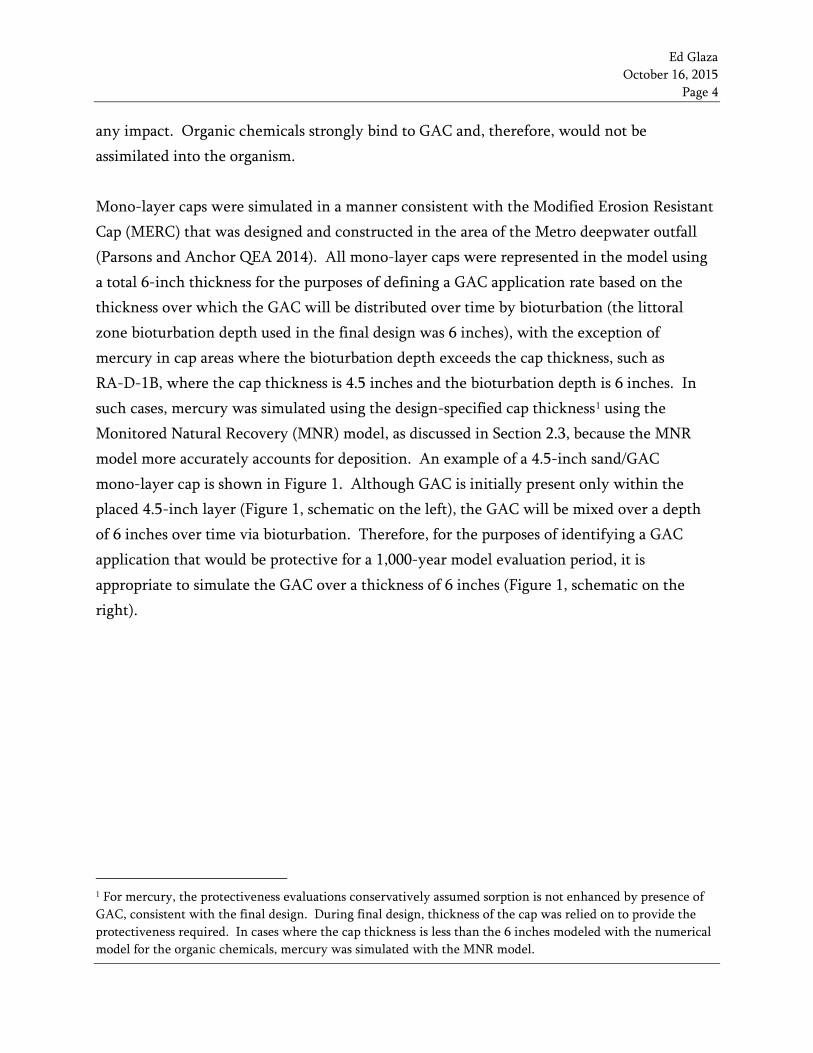
any impact. Organic chemicals strongly bind to GAC and, therefore, would not be assimilated into the organism. Mono-layer caps were simulated in a manner consistent with the Modified Erosion Resistant Cap (MERC) that was designed and constructed in the area of the Metro deepwater outfall (Parsons and Anchor QEA 2014). All mono-layer caps were represented in the model using a total 6-inch thickness for the purposes of defining a GAC application rate based on the thickness over which the GAC will be distributed over time by bioturbation (the littoral zone bioturbation depth used in the final design was 6 inches), with the exception of mercury in cap areas where the bioturbation depth exceeds the cap thickness, such as RA-D-1B, where the cap thickness is 4.5 inches and the bioturbation depth is 6 inches. In such cases, mercury was simulated using the design-specified cap thickness1 using the Monitored Natural Recovery (MNR) model, as discussed in Section 2.3, because the MNR model more accurately accounts for deposition. An example of a 4.5-inch sand/GAC mono-layer cap is shown in Figure 1. Although GAC is initially present only within the placed 4.5-inch layer (Figure 1, schematic on the left), the GAC will be mixed over a depth of 6 inches over time via bioturbation. Therefore, for the purposes of identifying a GAC application that would be protective for a 1,000-year model evaluation period, it is appropriate to simulate the GAC over a thickness of 6 inches (Figure 1, schematic on the right).
1 For mercury, the protectiveness evaluations conservatively assumed sorption is not enhanced by presence of GAC, consistent with the final design. During final design, thickness of the cap was relied on to provide the protectiveness required. In cases where the cap thickness is less than the 6 inches modeled with the numerical model for the organic chemicals, mercury was simulated with the MNR model.
Ed Glaza October 16, 2015
Page 5
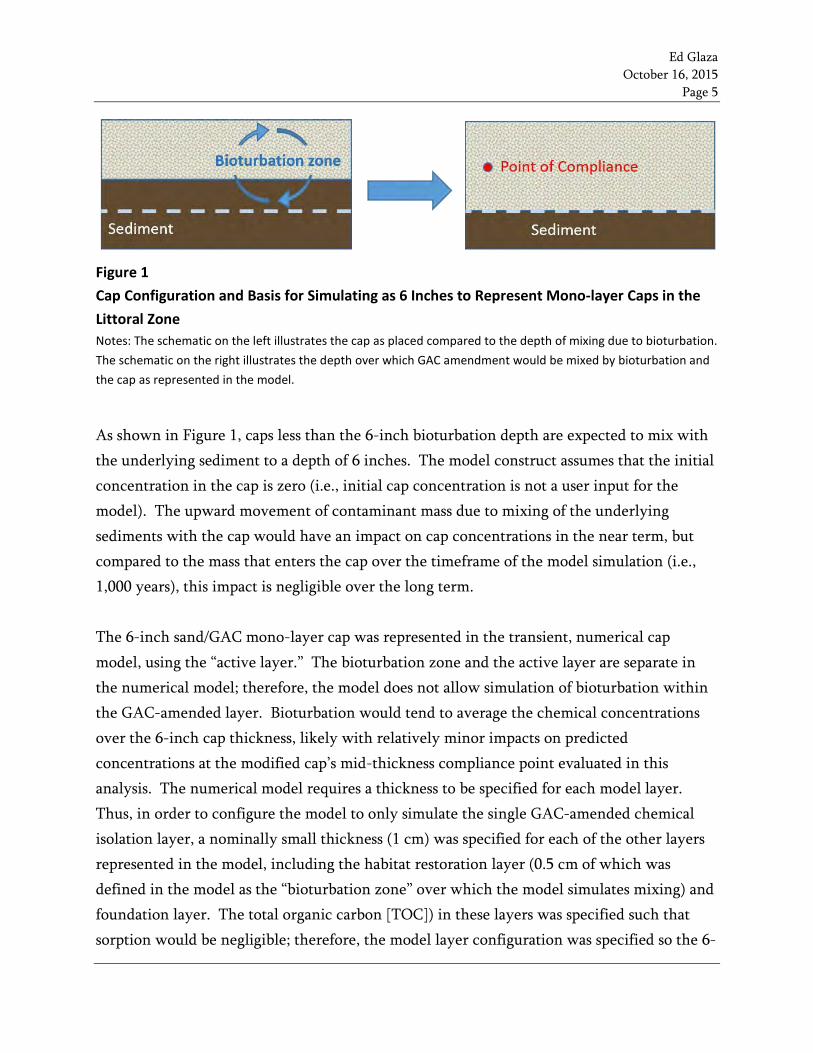
Figure 1 Cap Configuration and Basis for Simulating as 6 Inches to Represent Mono-layer Caps in the Littoral Zone Notes: The schematic on the left illustrates the cap as placed compared to the depth of mixing due to bioturbation. The schematic on the right illustrates the depth over which GAC amendment would be mixed by bioturbation and the cap as represented in the model.
As shown in Figure 1, caps less than the 6-inch bioturbation depth are expected to mix with the underlying sediment to a depth of 6 inches. The model construct assumes that the initial concentration in the cap is zero (i.e., initial cap concentration is not a user input for the model). The upward movement of contaminant mass due to mixing of the underlying sediments with the cap would have an impact on cap concentrations in the near term, but compared to the mass that enters the cap over the timeframe of the model simulation (i.e., 1,000 years), this impact is negligible over the long term. The 6-inch sand/GAC mono-layer cap was represented in the transient, numerical cap model, using the “active layer.” The bioturbation zone and the active layer are separate in the numerical model; therefore, the model does not allow simulation of bioturbation within the GAC-amended layer. Bioturbation would tend to average the chemical concentrations over the 6-inch cap thickness, likely with relatively minor impacts on predicted concentrations at the modified cap’s mid-thickness compliance point evaluated in this analysis. The numerical model requires a thickness to be specified for each model layer. Thus, in order to configure the model to only simulate the single GAC-amended chemical isolation layer, a nominally small thickness (1 cm) was specified for each of the other layers represented in the model, including the habitat restoration layer (0.5 cm of which was defined in the model as the “bioturbation zone” over which the model simulates mixing) and foundation layer. The total organic carbon [TOC]) in these layers was specified such that sorption would be negligible; therefore, the model layer configuration was specified so the 6-

Ed Glaza October 16, 2015
Page 6
inch, GAC-amended layer was the only sorptive layer in the model, and bioturbation was not accounted for in this layer. Consistent with previous modeling completed for the MERC (Parsons and Anchor QEA 2014), compliance with design standards (i.e., PECs and SSCs) for mono-layer MPCs was assessed at the midpoint of the bioturbation depth (which, in the case of the littoral zone, is the midpoint of the 6-inch simulated mono-layer MPC thickness, or a depth of 3 inches). This compliance point is representative of the depth-averaged chemical concentrations to which benthic organisms may be exposed. Because the compliance point for this mono-layer MPC is within GAC-amended sand (Figure 1, schematic on right), it is not appropriate to assess compliance based on sorbed-phase concentrations (as was done in the final design) because that would include contaminants adsorbed to the GAC. To avoid this, PEC-equivalent porewater values were developed based on chemical-specific partition coefficients and the habitat restoration layer TOC value of 4.6% used for these areas in the final design, consistent with the approach used for the MERC. Table 1 lists the PEC-equivalent porewater value used to assess compliance for each chemical when simulating a mono-layer MPC.
Table 1 PEC-equivalent Porewater Concentration
Chemical PEC (µg/kg) PEC-equivalent Porewater
Concentration (µg/L)
Chlorobenzene 428 50.4 Dichlorobenzenes 239 12.0
Ethybenzene 176 9.92 Naphthalene 917 68.1
Xylene 561 36.3 Trichlorobenzene 347 6.78
Total PCBs 295 0.005 Fluorene 264 0.383
Phenanthrene 543 0.423 Acenaphthene 861 0.883
Acenaphthylene 1,301 3.28

Ed Glaza October 16, 2015
Page 7
Table 1 PEC-equivalent Porewater Concentration
Chemical PEC (µg/kg) PEC-equivalent Porewater
Concentration (µg/L) Anthracene 207 0.161
Pyrene 344 0.036 Benzo(a)anthracene 192 0.010
Benzo(b)fluoranthene 908 0.018 Benzo(k)fluoranthene 203 0.004
Chrysene 253 0.005 Fluoranthene 1,436 0.203
Benzo(a)pyrene 146 0.003 Dibenz(a,h)anthracene 157 0.001 Indeno(1,2,3-cd)pyrene 183 0.004
Benzo(g,h,i)perylene 780 0.003 Mercury1 2,200 1.63
Table notes: 1 = Mercury PEC-equivalent Porewater Concentration is based on the partition coefficient (Kd) for sand in model areas RA-D, RA-C, and RA-B; alternate values will be calculated for other RAs as necessary. µg/kg = micrograms per kilogram µg/L = micrograms per liter
As with the multi-layer MPCs, numerical cap modeling for mono-layer MPCs was conducted with deterministic simulations (i.e., probabilistic simulations were not necessary).
2.3 Modeling Deposition Effects for Mercury and Thin-layer Caps
In some cases the MNR model was used to evaluate caps in the manner consistent with natural recovery modeling conducted for SMU 8 as part of the final design (Parsons and Anchor QEA 2012b) because that model accurately accounts for deposition. These cases include: 1) evaluation of mercury for mono-layer cap thicknesses less than the bioturbation depth of 6 inches (which was the thickness modeled for organic chemicals), including areas of direct amendment application; and 2) evaluation of TLCs in SMU 8. Consideration of deposition via the MNR model was included for areas where the water depth was 6 meters or deeper because portions of the 6- to 9- meter zone may be considered net depositional. Because deposition rates have not been measured within the 6- to 9-meter zone, the

Ed Glaza October 16, 2015
Page 8
modeling with the MNR model for areas within the 6- to 9-meter zone was conducted for a range of deposition rates observed in SMU 8. For mercury, the MPC protectiveness evaluations conservatively assumed adsorption is not enhanced by the presence of GAC, consistent with the final design. Thus, in this modeling approach, the thickness of the cap provides protectiveness for mercury by providing a layer over which sorption to sand and dispersion attenuate porewater concentrations. However, deposition of new material atop the cap also provides an important attenuating mechanism for mercury. Therefore, in the 6- to 9-meter zone where the proposed cap thickness is less than the bioturbation depth of 6 inches, mercury was evaluated with the MNR model. Likewise, in cases where a TLC with no GAC amendment is proposed, the MNR model was used to simulate protectiveness based on sorption to sand, as well as deposition. The following updates to the MNR model were made to accommodate its use for evaluating the protectiveness of modified caps and TLCs:
1. The model construct was expanded to include 23 chemicals that have a PEC. 2. Chemical-specific properties were set to those used in the transient cap modeling. 3. When simulating TLCs (and mercury for mono-layer caps less than 6 inches thick),
the “mixed layer” was configured to initially represent the placed cap material (i.e., sand) mixed with the sediment beneath the cap by setting the initial concentrations to a contaminant concentration that accounts for the relative contribution of each material based on chemical concentration of the sediments, the thickness of each material, and the bulk density of each material. When simulating mercury for direct amendment application, the initial concentration was based on in-lake sediment data.
4. The “buried layer” in the MNR model was set to the sediment concentrations that will be present beneath the placed cap material, based on available sampling data.
5. When simulating cap material (TLCs and mono-layer caps less than 6 inches thick for mercury), the mercury concentrations on depositing particles were set to 1.9 mg/kg in the south corner of the lake and 1.4 mg/kg for other areas of the lake prior to the end of construction in 2017 and reduced to 0.4 mg/kg post 2017, which is consistent with the MNR modeling conducted during final design.

Ed Glaza October 16, 2015
Page 9
6. Sediment deposition rates in the 6- to 9-meter zone have not been measured. Deposition rates reported in Appendix M of the final design indicate the lower end of the range observed in SMU 8 is 0.08 g/cm2/year and the midpoint of the range observed in SMU 8 is 0.25 g/cm2/year. Sediment traps deployed at South Deep station in 2012 resulted in deposition rates ranging from 0.1 g/cm2/year to 0.62 g/cm2/year (average of 0.26 g/cm2/year, which is similar to the deposition rate of 0.25 g/cm2/year used in the MNR modeling for SMU 8 during the final design). Therefore, caps within in the 6- to 9-meter zone were simulated using the midpoint of the range observed in SMU 8 (0.25 g/cm2/year) and the low end of the range observed in SMU 8 (0.08 g/cm2/year).
3 RA-D-1 MODIFIED PROTECTIVE CAPS
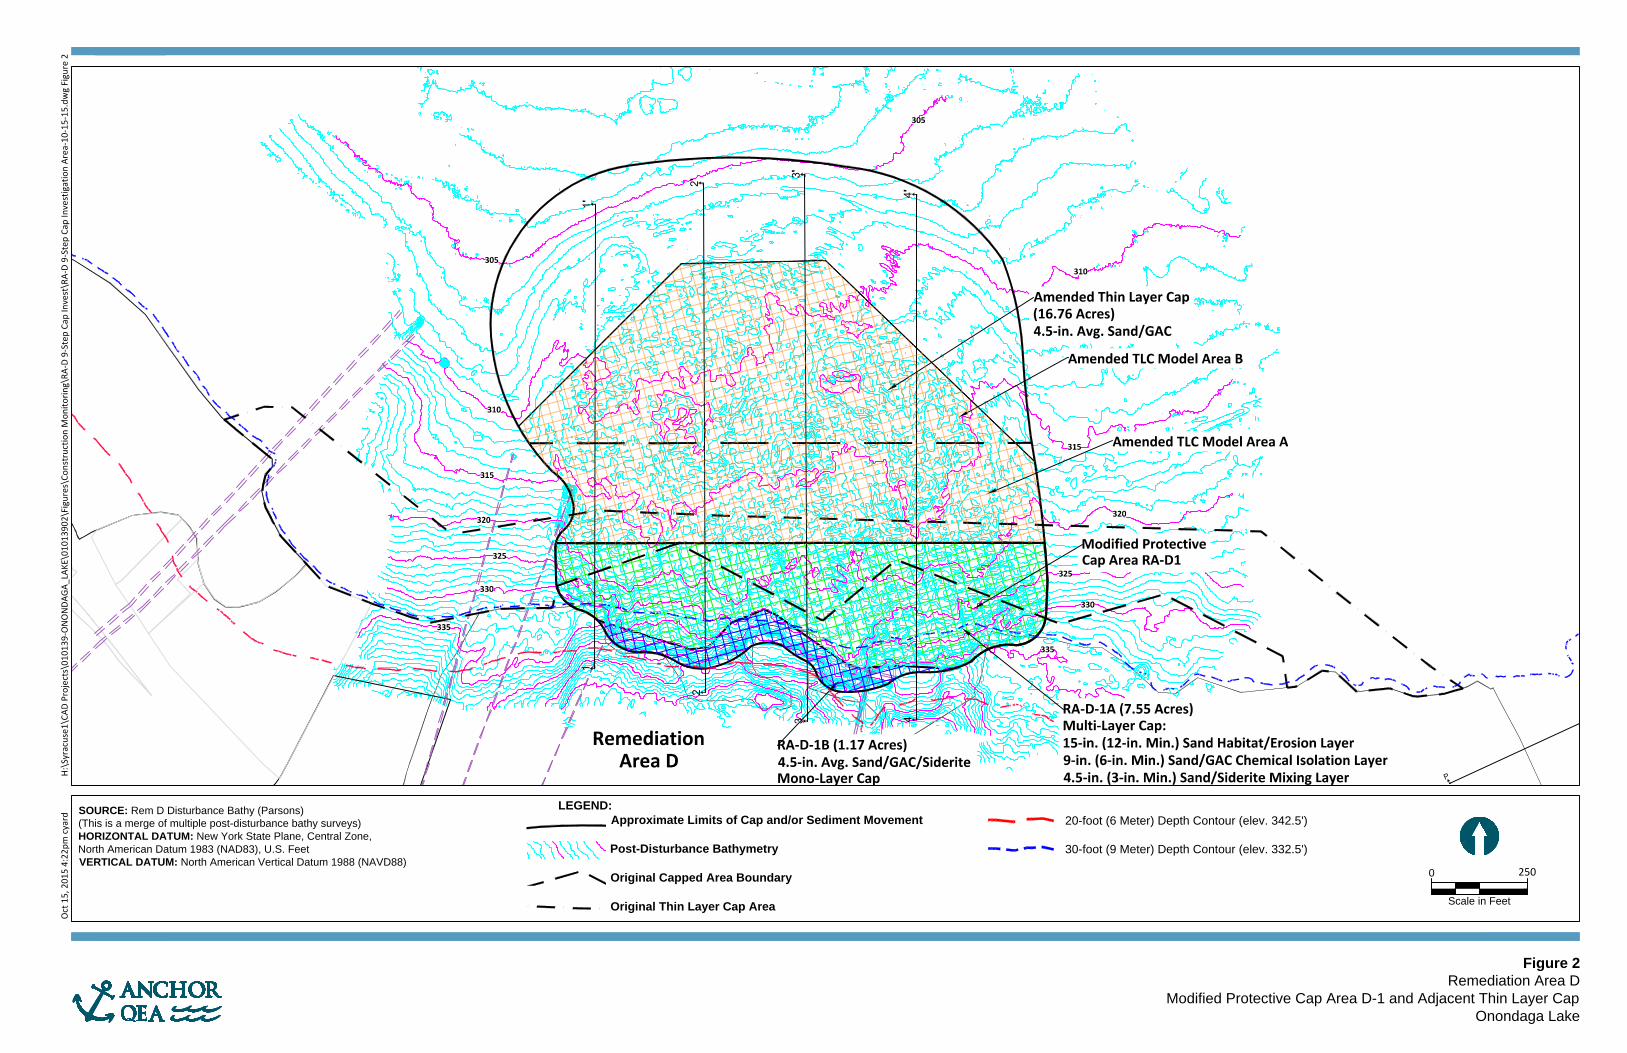
The area of MPC in RA-D-1 was determined based on surface sediment sampling completed subsequent to the cap movement that occurred in this area, as documented in a separate submittal to the New York State Department of Environmental Conservation (NYSDEC) (Honeywell 2015). The modeling conducted for RA-D-1 was performed for two separate subareas based on the two different MPC designs developed in this area. Results of slope stability analyses showed a multi-layer cap would be stable within the area designated as RA-D-1A (Figure 2), which incorporates the majority of the area where a multi-layer cap was included in the final design. An MPC consisting of a single lift with an average thickness of 4.5 inches (i.e., mono-layer cap) would be stable within the steep-slope area designated as RA-D-1B (Figure 2). The cap configurations and modeling conducted to define the GAC application rate required in these two areas are described in the subsections that follow.
0
Scale in Feet
250
Oct
15,
201
5 4:
22pm
cya
rd
H:\
Syra
cuse
1\CA
D Pr
ojec
ts\0
1013
9-O
NO
NDA
GA_L
AKE\
0101
3902
\Fig
ures
\Con
stru
ctio
n M
onito
ring\
RA-D
9-S
tep
Cap
Inve
st\R
A-D
9-St
ep C
ap In
vest
igat
ion
Area
-10-
15-1
5.dw
g Fi
gure
2
SOURCE: Rem D Disturbance Bathy (Parsons)
(This is a merge of multiple post-disturbance bathy surveys)
HORIZONTAL DATUM: New York State Plane, Central Zone,
North American Datum 1983 (NAD83), U.S. Feet
VERTICAL DATUM: North American Vertical Datum 1988 (NAVD88)
Figure 2
Remediation Area D
Modified Protective Cap Area D-1 and Adjacent Thin Layer Cap
Onondaga Lake
LEGEND:
Approximate Limits of Cap and/or Sediment Movement
Post-Disturbance Bathymetry
Original Capped Area Boundary
Original Thin Layer Cap Area
20-foot (6 Meter) Depth Contour (elev. 342.5')
30-foot (9 Meter) Depth Contour (elev. 332.5')

Ed Glaza October 16, 2015
Page 11
3.1 RA-D-1A Multi-layer Cap
The multi-layer cap in this area will consist of 3 inches of sand and siderite, overlain by 6 inches of sand and GAC, in turn overlain by 12 inches of sand (Figure 3, schematic on the left). Specified thicknesses exclude overplacement allowances. Conservatively assuming the 3 inches of sand/siderite would completely mix with the underlying sediment and not contribute to chemical isolation thickness, this layer was not explicitly represented in the chemical isolation modeling, which is consistent in concept with the approach used in the final design modeling. The exception is that a 6-inch sand/siderite layer was included in the final design and only the lower 3 inches of that layer were excluded from the modeling; the upper 3 inches were included by representing it as sand. In both cases, biological degradation associated with pH neutralization from the siderite, following an initial equilibration period (lag time), was represented in the model.
Figure 3 RA-D-1A Multi-layer Cap Configuration Notes: The schematic on the left illustrates the cap as proposed. The schematic on the right illustrates the cap as represented in the model.

Ed Glaza October 16, 2015
Page 12
Compliance was assessed at the bottom of the bioturbation zone and bottom of the habitat restoration layer to ensure criteria would be met throughout the habitat layer, consistent with the final design (Figure 3). Model input parameters were consistent with the final design cap configuration for Model Area D-Center and the addendum cap area, with one exception. Because RA-D-1A is located within the original footprint of Model Area D-Center and porewater measurements already existed for that area, the initial porewater concentration in underlying sediment used in the model was set equal to the corresponding 95th percentile porewater concentrations, consistent with the final design cap modeling approach. However, the 95th percentile porewater concentrations used for this modeling were recalculated after removing the chemical concentration data associated with sampling locations OL-VC-10138 and OL-VC-10140—two locations that were addressed separately as a supplemental cap area in the final design (see Table 5 of Appendix B to the final design [Parsons and Anchor QEA 2012a]). In 2015, sediment cores were collected from the area of the MPCs and analyzed for volatile organic compounds (VOCs), polycyclic aromatic hydrocarbons (PAHs), polychlorinated biphenyls (PCBs), and mercury (Honeywell 2015). Results from these samples were used to verify that use of the Model Area D Center porewater dataset in the final design was appropriate for modeling of the MPCs as described above. Maximum concentrations of critical VOCs were lower in the 2015 sediment samples from the MPC areas than were measured during the pre-design investigation (PDI) in RA-D Center; therefore, use of the RA-D Center porewater dataset is appropriate for modeling of the MPC areas. Details are provided below. Sediment data collected during the PDI from RA-D Center were compared to the sediment data collected in 2015 (including data from both the 0- to 4-cm and 4- to 15-cm intervals). The evaluation focused on xylenes, chlorobenzene, and dichlorobenzenes because these were the only contaminants that exceeded the hot spot criteria in RA-D Center within the one-meter interval immediately underlying the baseline removal depth, which was the basis for identifying hot-spot removal areas. Also, based on the MPC modeling results discussed in Section 5, xylene is the critical VOC in determining the GAC dose in the MPCs. As shown
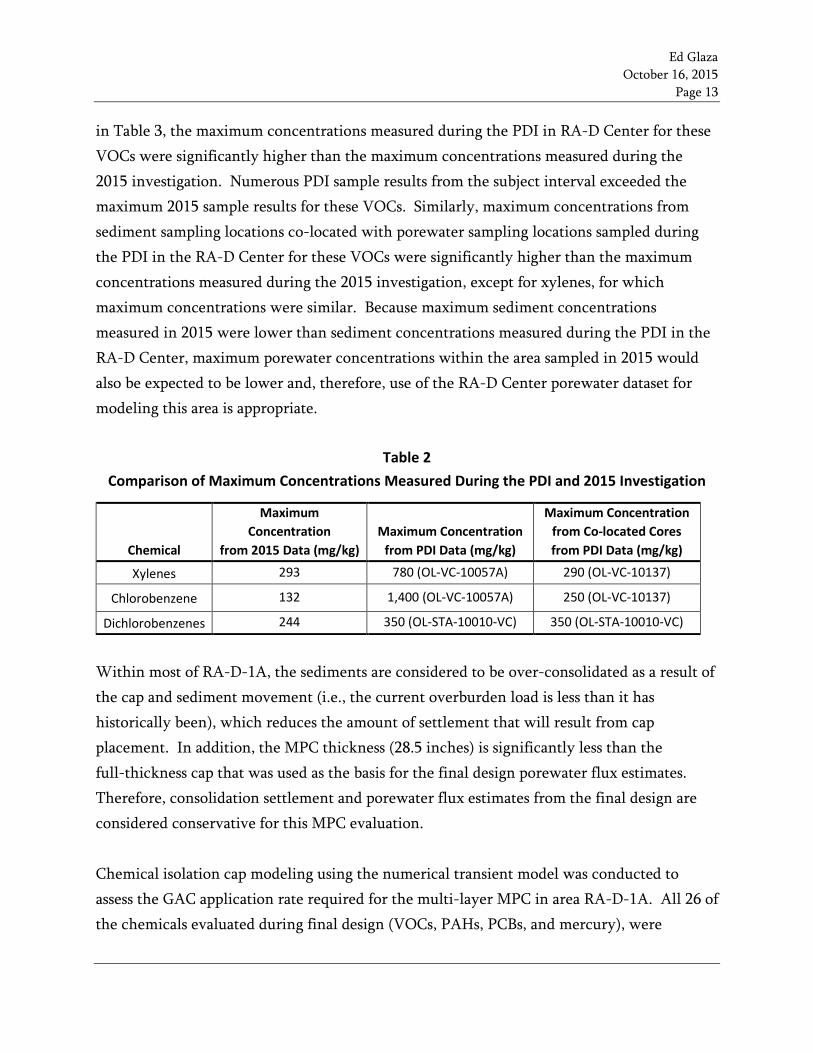
Ed Glaza October 16, 2015
Page 13
in Table 3, the maximum concentrations measured during the PDI in RA-D Center for these VOCs were significantly higher than the maximum concentrations measured during the 2015 investigation. Numerous PDI sample results from the subject interval exceeded the maximum 2015 sample results for these VOCs. Similarly, maximum concentrations from sediment sampling locations co-located with porewater sampling locations sampled during the PDI in the RA-D Center for these VOCs were significantly higher than the maximum concentrations measured during the 2015 investigation, except for xylenes, for which maximum concentrations were similar. Because maximum sediment concentrations measured in 2015 were lower than sediment concentrations measured during the PDI in the RA-D Center, maximum porewater concentrations within the area sampled in 2015 would also be expected to be lower and, therefore, use of the RA-D Center porewater dataset for modeling this area is appropriate.
Table 2 Comparison of Maximum Concentrations Measured During the PDI and 2015 Investigation
Chemical
Maximum Concentration
from 2015 Data (mg/kg) Maximum Concentration
from PDI Data (mg/kg)
Maximum Concentration from Co-located Cores from PDI Data (mg/kg)
Xylenes 293 780 (OL-VC-10057A) 290 (OL-VC-10137)
Chlorobenzene 132 1,400 (OL-VC-10057A) 250 (OL-VC-10137)
Dichlorobenzenes 244 350 (OL-STA-10010-VC) 350 (OL-STA-10010-VC)
Within most of RA-D-1A, the sediments are considered to be over-consolidated as a result of the cap and sediment movement (i.e., the current overburden load is less than it has historically been), which reduces the amount of settlement that will result from cap placement. In addition, the MPC thickness (28.5 inches) is significantly less than the full-thickness cap that was used as the basis for the final design porewater flux estimates. Therefore, consolidation settlement and porewater flux estimates from the final design are considered conservative for this MPC evaluation. Chemical isolation cap modeling using the numerical transient model was conducted to assess the GAC application rate required for the multi-layer MPC in area RA-D-1A. All 26 of the chemicals evaluated during final design (VOCs, PAHs, PCBs, and mercury), were
Ed Glaza October 16, 2015
Page 14
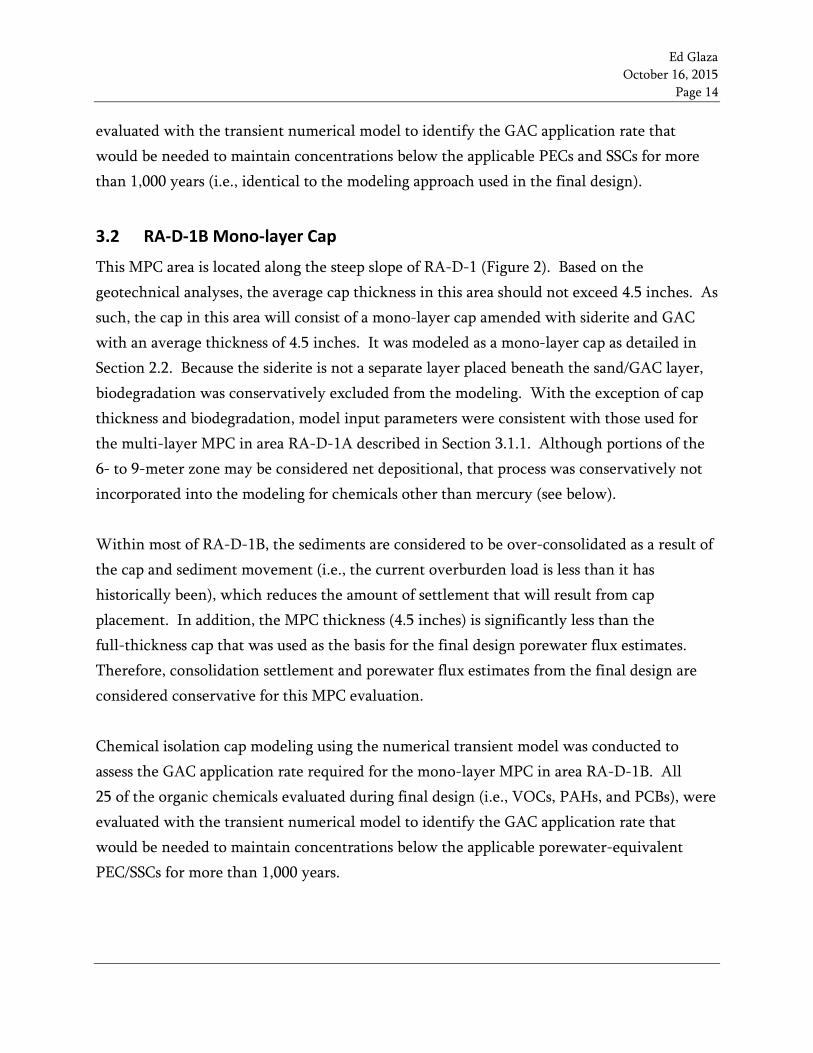
evaluated with the transient numerical model to identify the GAC application rate that would be needed to maintain concentrations below the applicable PECs and SSCs for more than 1,000 years (i.e., identical to the modeling approach used in the final design).
3.2 RA-D-1B Mono-layer Cap
This MPC area is located along the steep slope of RA-D-1 (Figure 2). Based on the geotechnical analyses, the average cap thickness in this area should not exceed 4.5 inches. As such, the cap in this area will consist of a mono-layer cap amended with siderite and GAC with an average thickness of 4.5 inches. It was modeled as a mono-layer cap as detailed in Section 2.2. Because the siderite is not a separate layer placed beneath the sand/GAC layer, biodegradation was conservatively excluded from the modeling. With the exception of cap thickness and biodegradation, model input parameters were consistent with those used for the multi-layer MPC in area RA-D-1A described in Section 3.1.1. Although portions of the 6- to 9-meter zone may be considered net depositional, that process was conservatively not incorporated into the modeling for chemicals other than mercury (see below). Within most of RA-D-1B, the sediments are considered to be over-consolidated as a result of the cap and sediment movement (i.e., the current overburden load is less than it has historically been), which reduces the amount of settlement that will result from cap placement. In addition, the MPC thickness (4.5 inches) is significantly less than the full-thickness cap that was used as the basis for the final design porewater flux estimates. Therefore, consolidation settlement and porewater flux estimates from the final design are considered conservative for this MPC evaluation. Chemical isolation cap modeling using the numerical transient model was conducted to assess the GAC application rate required for the mono-layer MPC in area RA-D-1B. All 25 of the organic chemicals evaluated during final design (i.e., VOCs, PAHs, and PCBs), were evaluated with the transient numerical model to identify the GAC application rate that would be needed to maintain concentrations below the applicable porewater-equivalent PEC/SSCs for more than 1,000 years.
Ed Glaza October 16, 2015
Page 15
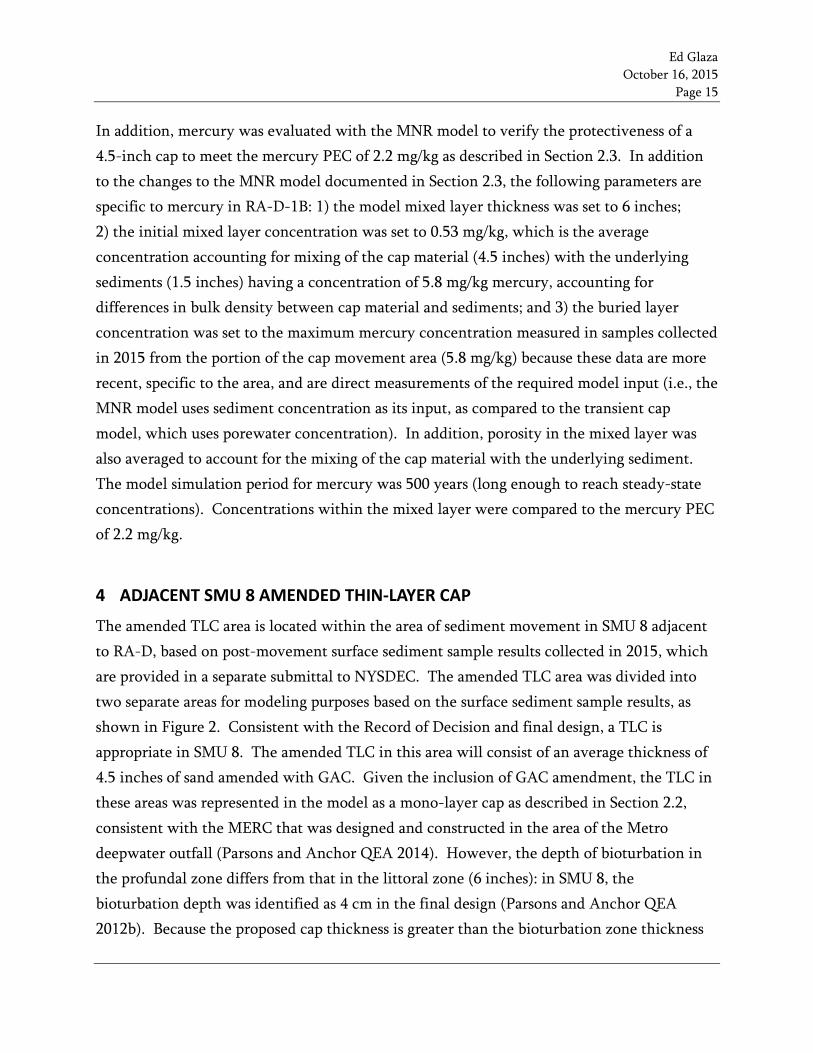
In addition, mercury was evaluated with the MNR model to verify the protectiveness of a 4.5-inch cap to meet the mercury PEC of 2.2 mg/kg as described in Section 2.3. In addition to the changes to the MNR model documented in Section 2.3, the following parameters are specific to mercury in RA-D-1B: 1) the model mixed layer thickness was set to 6 inches; 2) the initial mixed layer concentration was set to 0.53 mg/kg, which is the average concentration accounting for mixing of the cap material (4.5 inches) with the underlying sediments (1.5 inches) having a concentration of 5.8 mg/kg mercury, accounting for differences in bulk density between cap material and sediments; and 3) the buried layer concentration was set to the maximum mercury concentration measured in samples collected in 2015 from the portion of the cap movement area (5.8 mg/kg) because these data are more recent, specific to the area, and are direct measurements of the required model input (i.e., the MNR model uses sediment concentration as its input, as compared to the transient cap model, which uses porewater concentration). In addition, porosity in the mixed layer was also averaged to account for the mixing of the cap material with the underlying sediment. The model simulation period for mercury was 500 years (long enough to reach steady-state concentrations). Concentrations within the mixed layer were compared to the mercury PEC of 2.2 mg/kg.
4 ADJACENT SMU 8 AMENDED THIN-LAYER CAP
The amended TLC area is located within the area of sediment movement in SMU 8 adjacent to RA-D, based on post-movement surface sediment sample results collected in 2015, which are provided in a separate submittal to NYSDEC. The amended TLC area was divided into two separate areas for modeling purposes based on the surface sediment sample results, as shown in Figure 2. Consistent with the Record of Decision and final design, a TLC is appropriate in SMU 8. The amended TLC in this area will consist of an average thickness of 4.5 inches of sand amended with GAC. Given the inclusion of GAC amendment, the TLC in these areas was represented in the model as a mono-layer cap as described in Section 2.2, consistent with the MERC that was designed and constructed in the area of the Metro deepwater outfall (Parsons and Anchor QEA 2014). However, the depth of bioturbation in the profundal zone differs from that in the littoral zone (6 inches): in SMU 8, the bioturbation depth was identified as 4 cm in the final design (Parsons and Anchor QEA 2012b). Because the proposed cap thickness is greater than the bioturbation zone thickness

Ed Glaza October 16, 2015
Page 16
(Figure 4, schematic on the left), the simulated thickness for the amended TLC was 4.5 inches, with compliance being assessed at the bottom of the bioturbation zone (i.e., depth of 4 cm; Figure 4, schematic on the right). The numerical model specifies the process of bioturbation in a layer that is separate from the layer that represents non-linear adsorption to GAC (i.e., the active layer). Although the bioturbation depth is less than the cap thickness, the model was configured to only simulate the single GAC-amended chemical isolation layer, and therefore, a nominally small thickness (1 cm) was specified for each of the other layers represented in the model, including the habitat restoration layer (0.5 cm of which was defined in the model as the “bioturbation zone” over which the model simulates mixing) and foundation layer. Mixing due to bioturbation was essentially ignored in this application.2
Figure 4 Amended TLC Area A and B Cap Configuration Notes: The schematic on the left illustrates the caps as proposed. The schematic on the right illustrates the caps as represented in the model.
Model input parameters for amended TLC Areas A and B were consistent with those used in the final design for Model Area D-Center, with the following exceptions:
• The proposed configuration does not include siderite; therefore, biodegradation was excluded from the modeling.
• In 2015, sediment cores were collected from amended TLC Areas A and B and analyzed for VOCs, PAHs, PCBs, and mercury. These sediment concentrations were converted to porewater concentrations using the KOC values for sediment from Model Area D-Center in the final design and the sample-specific TOC results. Use of sediment data and partitioning theory to develop porewater concentrations for use in modeling in these
2 Mixing due to bioturbation, if it could be included in this model construct, would decrease concentrations due to dilution and also increase transport from diffusion. These processes would likely balance each other out and cause negligible changes to model results. Previous experience with the transient cap model has shown that bioturbation within GAC-amended caps has little impact on model results.
Ed Glaza October 16, 2015
Page 17
areas was appropriate given that there are no new or historical porewater data from these areas, and the post-movement sediment sampling demonstrated that contaminant concentrations in these areas are significantly lower than in MPC Area RA-D-1. The initial sediment porewater concentration in the model was set to the concentrations from the surface sample having the highest mean probable effects concentration quotient (PECQ) within the amended TLC Areas A and B samples, respectively.
• Because these model subareas are located within SMU 8, groundwater upwelling velocity was set to 1 cm/year, which is consistent with the value used in the final design SMU 8 MNR modeling (Parsons and Anchor QEA 2012b).
The model-predicted porewater concentrations at the bottom of the 4-cm bioturbation zone were used to calculate a time-variable mean PECQ (using PEC-equivalent porewater values listed in Table 1), which is the TLC protectiveness goal in SMU 8. The method for calculating the mean PECQ calculations involves removing non-detect concentrations. Therefore, model-predicted concentrations below an assumed detection limit of 0.001 μg/L were removed from the calculation. The transient numerical modeling was conducted starting with the minimal practical GAC application rate of 0.1 pound per square foot, and the application rate was increased as necessary to meet a mean PECQ of 1 for more than 1,000 years.
5 RESULTS
The GAC application rates developed to achieve compliance criteria for 1,000 years for the organic contaminants based on the numerical modeling described in the preceding sections are presented in Table 3. Compliance for RA-D-1A and RA-D-1B was assessed against the PECs (or PEC-equivalent porewater concentrations) and SSCs for each of the 26 chemicals evaluated. Compliance for amended TLCs A and B, both of which are located in SMU 8, were assessed against a mean PECQ of 1 and the mercury PEC of 2.2 at the bottom of the 4-cm bioturbation zone.

Ed Glaza October 16, 2015
Page 18
Table 3 Transient Numerical Model Results
Model Area
Final Design Model Results GAC Application Rate
(pounds per square foot) Driving
Chemical GAC Application Rate
(pounds per square foot) Driving
Chemical
RA-D-1A Multi-layer MPC 0.93 Xylenes 1.26 Xylenes
RA-D-1B Mono-layer MPC 0.93 Xylenes 3.73 Xylenes
Amended TLC Area A NA NA 1.76 NE
Amended TLC Area B NA NA 0.1 NE
Notes: NA = the model area, located in SMU 8, was not previously evaluated with the cap model during final design NE = the metric was not evaluated; in SMU 8, compliance was assessed based on mean PECQ; individual chemicals were not assessed and, therefore, a driving chemical was not identified The results from simulations of mercury in amended TLC Areas A and B with the transient numerical model indicate that mercury concentrations at the compliance depth remain below 2.2 mg/kg for more than 1,000 years. Modeling mercury in RA-D-1B with the MNR model indicates that model-predicted mercury concentrations remain below the mercury PEC in for the range of deposition rates evaluated (0.08 g/cm2/year and 0.25 g/cm2/year).
6 SENSITIVITY ANALYSIS
This section describes sensitivity analyses that were conducted to evaluate select model input parameters.
6.1 Depth of Mixing
The model approach for RA-D-1B assumes the GAC placed within a 4.5-inch sand/GAC layer will be mixed to a depth of 6 inches, which is the depth of mixing due to bioturbation in the littoral zone. Although bioturbation occurs to a depth of 6 inches, a sensitivity analysis was conducted to evaluate the impacts on model results if the GAC mixed to a depth that is 25% less than the bioturbation depth. To evaluate this scenario, the modeling for the RA-D-1B mono-layer MPC was repeated at a GAC application rate of 3.73 lb/sf and a thickness of 4.5 inches (with all other model settings unchanged, including assessing compliance at the midpoint of the bioturbation depth, or 3 inches). Results indicated that all
Ed Glaza October 16, 2015
Page 19
chemicals meet the SSCs and porewater equivalent PECs for more than 1,000 years, except xylene, which was predicted to exceed the porewater-equivalent PEC after 417 years. However, compliance is expected for longer than this prediction because biodegradation of contaminants and natural deposition of clean sediments over time were conservatively excluded from the modeling simulation. Using the low end of the deposition rate discussed in Section 2.3 results in a predicted deposition of 4.5 feet of new sediment over the 1,000-year modeling period.
6.2 Mercury Diffusion Coefficient in MNR Model for RA-D-1B
The molecular diffusion coefficient for mercury in the MNR model used to evaluate natural recovery in SMU 8 sediments during the final design was set to 202 cm2/year based on literature. The molecular diffusion coefficient for mercury in the cap modeling conducted during final design was 61.8 cm2/year, which was also based on literature (but a different source). The mercury molecular diffusion rate of 61.8 cm2/year was used to maintain consistency with the final design cap modeling. Therefore, a sensitivity analysis was conducted to evaluate the impact on results from using the molecular diffusion rate of 202 cm2/year in the MNR model used to simulate mercury in RA-D-1B. Simulations using this value were conducted for the low-end deposition rate of 0.08 g/cm2/year and the midpoint of the range observed in SMU 8 (0.25 g/cm2/year). The use of the higher diffusion coefficient of 202 cm2/year in the MNR model indicates that mercury concentrations remain below the PEC of 2.2 mg/kg for the duration of the simulation when simulating a deposition rate of 0.25 g/cm2/year. Mercury concentrations are predicted to exceed the PEC of 2.2 mg/kg after 91 years, reaching a steady-state concentration of 3.2 mg/kg, when simulating the low-end deposition rate of 0.08 g/cm2/year in conjunction with the higher molecular diffusion rate. This prediction likely overestimates the steady-state mercury concentration because it uses the low-end deposition rate and the high end of the diffusion coefficient in combination with the maximum mercury concentration.
Ed Glaza October 16, 2015
Page 20
7 REFERENCES
Janssen, E.M.L., and B.A. Beckingham, 2013. Biological Responses to Activated Carbon Amendments in Sediment Remediation. Environ. Sci. Technol. 470:7595-7607.
Honeywell, 2015. Letter to: Mr. Tim Larson, NYSDEC. Regarding: Onondaga Lake Remedial Site – Onondaga County, NY Modified Protective Cap Areas RA-C-1 and RA-D-1 Mean PECQ Investigation Results. October 8, 2015.
Parsons and Anchor QEA (Anchor QEA, LLC), 2012a. Onondaga Lake Capping, Dredging, Habitat and Profundal Zone (SMU 8) Final Design. Appendix B – Cap Modeling. Prepared for Honeywell. March 2012.
Parsons and Anchor QEA, 2012b. Onondaga Lake Capping, Dredging, Habitat and Profundal Zone (SMU 8) Final Design. Appendix M – MNR Modeling. Prepared for Honeywell. March 2012.
Parsons and Anchor QEA, 2014. Onondaga Lake Capping, Dredging, Habitat and Profundal Zone (SMU 8) Final Design Metro Outfall Vicinity Design Addendum. Attachment 2 – Modified Erosion Resistant Cap Chemical Isolation Layer Modeling. Prepared for Honeywell. October 2014.

ATTACHMENT 1 ONONDAGA LAKE CAP MODELING FILES FOR MPC RA-D-1 AND SMU 8 AMENDED TLC

Attachment 1
1
ATTACHMENT 1: MODEL FILES
This attachment details the files and directory structure associated with the numerical modeling conducted for the Modified Protective Cap (MPC) Area RA-D-1 as well as for the amended thin-layer cap (TLC) in the adjacent area of Sediment Management Unit 8 (SMU 8). The cap modeling files are organized into two main folders:
1. Numerical Model 2. MNR Model
The following sections describe the files and subfolders contained in each folder.
Numerical Model
The numerical cap modeling files are contained in two subfolders:
1. Inputs 2. Outputs
The contents of each of these subfolders are described in this section. Please reference Attachment 4 to Appendix B of the final design (Parsons and Anchor QEA 20121) for the numerical model code files and their description. In addition, the structure and formatting of the input and output files for this numerical cap modeling is identical to that from the final design; differences in input values from the final design associated with using the model to represent MPCs are mainly what is described in the subsections that follow.
Numerical Model Inputs
The input files used for simulations with the numerical model are located in the Numerical_Model\Inputs\ folder. Separate input files are used for each of the four model areas evaluated as part of the RA-D-1 MPC modeling effort, including the input file for the sensitivity analysis in RA-D-1B:
1 Parsons and Anchor QEA (Anchor QEA, LLC), 2012. Onondaga Lake Capping, Dredging, Habitat and Profundal Zone (SMU 8) Final Design. Prepared for Honeywell. March 2012.
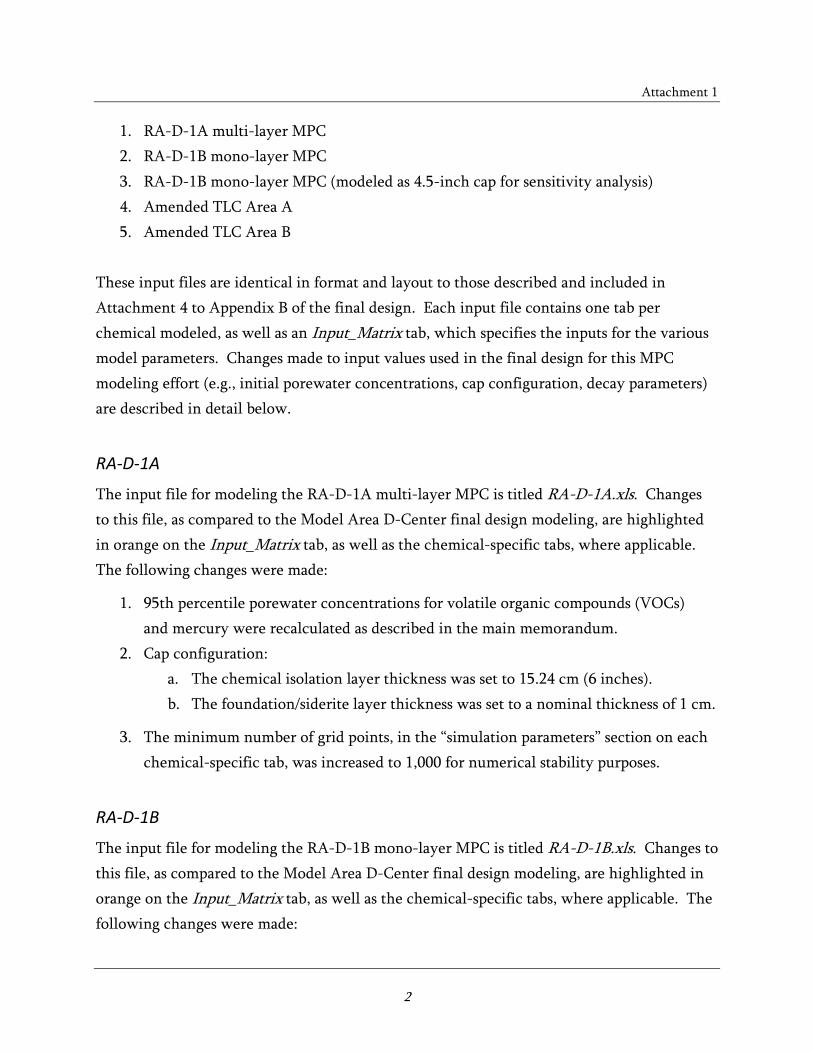
Attachment 1
2
1. RA-D-1A multi-layer MPC 2. RA-D-1B mono-layer MPC 3. RA-D-1B mono-layer MPC (modeled as 4.5-inch cap for sensitivity analysis) 4. Amended TLC Area A 5. Amended TLC Area B
These input files are identical in format and layout to those described and included in Attachment 4 to Appendix B of the final design. Each input file contains one tab per chemical modeled, as well as an Input_Matrix tab, which specifies the inputs for the various model parameters. Changes made to input values used in the final design for this MPC modeling effort (e.g., initial porewater concentrations, cap configuration, decay parameters) are described in detail below.
RA-D-1A
The input file for modeling the RA-D-1A multi-layer MPC is titled RA-D-1A.xls. Changes to this file, as compared to the Model Area D-Center final design modeling, are highlighted in orange on the Input_Matrix tab, as well as the chemical-specific tabs, where applicable. The following changes were made:
1. 95th percentile porewater concentrations for volatile organic compounds (VOCs) and mercury were recalculated as described in the main memorandum.
2. Cap configuration: a. The chemical isolation layer thickness was set to 15.24 cm (6 inches). b. The foundation/siderite layer thickness was set to a nominal thickness of 1 cm.
3. The minimum number of grid points, in the “simulation parameters” section on each chemical-specific tab, was increased to 1,000 for numerical stability purposes.
RA-D-1B
The input file for modeling the RA-D-1B mono-layer MPC is titled RA-D-1B.xls. Changes to this file, as compared to the Model Area D-Center final design modeling, are highlighted in orange on the Input_Matrix tab, as well as the chemical-specific tabs, where applicable. The following changes were made:

Attachment 1
3
1. 95th percentile porewater concentrations for VOCs and mercury were recalculated as described in the main memorandum.
2. Decay rates for VOCs were set to 1E-12 to effectively eliminate the effects of degradation kinetics in the model simulations (1E-12 is used because a non-zero number is necessary for model function).
3. Organic carbon fraction (FOC) in the bioturbation zone was set to a nominally low value of 0.022% (the value used in the final design for cap sand) so that sorption would be negligible.
4. The following inputs for cap configuration were specified to represent the total simulated thickness of 6 inches for the purposes of identifying granular activated carbon (GAC) amendment application rates for mono-layer MPC evaluation, for all chemicals except mercury (which was simulated with the MNR model as described in the last section of this attachment):
a. The habitat restoration layer thickness was set to a nominal thickness of 1 cm. b. The bioturbation zone thickness was set to a nominal thickness of 0.5 cm. c. The chemical isolation layer thickness was set to a thickness of 15.24 cm. d. The foundation/siderite layer thickness was set to a nominal thickness of 1 cm.
5. The minimum number of grid points, in the “simulation parameters” section on each chemical-specific tab, was increased to 1,000 for numerical stability purposes.
RA-D-1B (Modeled as 4.5-inch Cap for Sensitivity Analysis)
The input file for modeling the RA-D-1B mono-layer MPC modeled as a 4.5-inch cap is titled RA-D-1B-45in.xls. Changes to this file, as compared to the Model Area D-Center final design modeling, are highlighted in orange on the Input_Matrix tab, as well as the chemical-specific tabs, where applicable. Changes to this file compared to the Model Area D-Center final design modeling are the same as those described above for RA-D-1B (RA-D-1B.xls) modeling, except the cap thickness. The following inputs for cap configuration were specified to represent the total simulated thickness of 4.5 inches for the purpose of evaluating sensitivity to GAC mixing to a depth that is 25% less than the depth of mixing due to bioturbation:
a. The habitat restoration layer thickness was set to a nominal thickness of 1 cm. b. The bioturbation zone thickness was set to a nominal thickness of 0.5 cm.

Attachment 1
4
c. The chemical isolation layer thickness was set to a thickness of 11.43 cm. d. The foundation/siderite layer thickness was set to a nominal thickness of 1 cm.
TLC-A
The input file for the amended TLC Area A modeling is titled TLC-A.xls. Changes to this file, as compared to the Model Area D-Center final design modeling, are highlighted in orange on the Input_Matrix tab, as well as the chemical-specific tabs, where applicable. The following changes were made:
1. Porewater concentrations for all chemicals were set to the concentration from the sample collected in 2015 (from the 0 to 4 cm and 4 to 15 cm samples) within this area with the highest mean probable effects concentration quotient (PECQ).
2. Decay rates for VOCs were set to 1E-12 to effectively eliminate the effects of degradation kinetics in the model simulations (1E-12 is used because a non-zero number is necessary for model function).
3. Groundwater upwelling velocities were set to 1 cm/yr, consistent with groundwater velocity used for the final design MNR modeling in SMU 8.
4. FOC in the bioturbation zone was set to a nominally low value of 0.022% (the value used in the final design for cap sand) so that sorption would be negligible.
5. The following inputs for cap configuration were specified to represent the total simulated thickness of 4.5 inches for the purposes of identifying GAC amendment application rates for the amended TLC:
a. The habitat restoration layer thickness was set to a nominal thickness of 1 cm. b. The bioturbation zone thickness was set to a nominal thickness of 0.5 cm. c. The chemical isolation layer thickness was set to a thickness of 11.43 cm. d. The foundation/siderite layer thickness was set to a nominal thickness of 1 cm.
6. The minimum number of grid points, in the “simulation parameters” section on each chemical-specific tab, was increased to 1,000 for numerical stability purposes.
TLC-B
The input file for the amended TLC Area B modeling is titled TLC-B.xls. Changes to this file, as compared to the Model Area D-Center final design modeling, are highlighted in orange on

Attachment 1
5
the Input_Matrix tab, as well as the chemical-specific tabs, where applicable. Changes to this file compared to the Model Area D-Center final design modeling are the same as those described above for amended TLC Area A modeling, except that initial porewater concentrations were set to the surface sample collected in 2015 within this area (i.e., TLC Area B) with the highest PECQ.
Numerical Model Outputs
The numerical model output files are located in the Numerical_Model\Outputs\Det_Output\ folder. Within this folder, outputs for each model area are contained in separate folders. The outputs are saved in comma-delimited format (*.csv). Output file names used the same naming convention from the final design, which helps to understand the model scenario: “Output_”<Model Area>”_”<Chemical Name Abbreviation>”_”<GAC application rate>”-
”<Initial Concentration Type> For file-naming purposes, the GAC application rate component of the file name does not include a decimal point. It should be understood that the decimal place is located between the first and second digits. For example, Output_RA-D-1A_EB_126-C95_UT2.csv is the file containing outputs from the model simulation of ethylbenzene using the 95th percentile porewater concentrations in Model Area RA-D-1A (multi-layer MPC) with a 1.26 lb/sf GAC application rate.
MNR Model
The input file used to simulate mercury for the mono-layer MPC in area RA-D-1B is titled MNR_RA-D-1B.xlsm. The model is based on the SMU 8 MNR model used in the final design, with slight modifications to allow for the simulation of organic chemicals (although only mercury was simulated for the mono-layer MPC in RA-D-1B). These changes mainly involved adding flexibility to the model by increasing the number of input variables on the Model_Inputs-Outputs tab. The following changes were made:
1. Parameters that were previously set as hard-wire values in the code (chemical-specific parameters) were included in the Model_Inputs-Outputs tab to allow users to make changes as necessary.
Attachment 1
6
2. Chemical-specific properties such as partition coefficients and diffusion coefficients were set to those used in the transient cap modeling. A sensitivity analysis was performed to evaluate impact of using the diffusion coefficient that previously used in the MNR model (202 cm2/year).
3. FOC of the buried layer and mixed layer were added to the model equations (for calculating Kd for organic chemical) and as a model input. For mercury, FOC was set to a value of 1.0, as a way of forcing the model to use a Kd for mercury partitioning, consistent with the cap modeling approach used in the final design.
4. For the case of the RA-D-1B mono-layer MPC, the “mixed layer” was configured to initially represent the placed cap material (i.e., 4.5 inches of sand) mixed with 1.5 inches of underlying sediment (for a total mixed depth of 6 inches) by setting the initial concentration to the bulk density and length-weighted average mercury concentration.
5. The “buried layer” in the MNR model was set to the sediment concentrations that will be present beneath the placed cap material, based on available sampling data.
Everything else associated with this model file works similar to the SMU 8 MNR model from the final design (e.g., the “Run Model” button executes the code to run the model and outputs are generated for each simulated chemical; see “Instructions” worksheet for more detail).