onondaga county ash tree management …media.syracuse.com/news/other/2015/01/14/onondaga county ash...
TRANSCRIPT

ONONDAGA COUNTY ASH TREE MANAGEMENT
STRATEGY
June 2014


TABLE OF CONTENTS PAGE Executive Summary 1. Introduction 1 2. Emerald Ash Borer -‐ An Overview 1 3. Preparing for Emerald Ash Borer 2 4. Inventory of Ash Trees on County-‐Owned Land 6 5. Ash Tree Management Alternatives Available to the County 7 6. Regulatory Requirements/Considerations 11 7. Timing Considerations 11 8. Proposed Ash Tree Management Strategy 13
a. Preemptive Removal b. Management of Wood Waste c. Replacement of Lost Canopy d. Preservation of High Value Ash Trees through Inoculation e. Selection of Pesticide Product f. Strategy Implementation -‐ Projected Costs and Schedule g. Plan for Flexibility h. Management of Ash Trees in County-‐owned Timber Stands
9. Information Available to Residents and Commercial Property Owners 20 -‐-‐-‐-‐-‐-‐-‐-‐-‐-‐ Appendix A: Summarized ash tree inventory data Appendix B: Estimated Costs – Cost Curves and Tables

EXECUTIVE SUMMARY Emerald Ash Borer (EAB) has arrived in Onondaga County and will eventually kill every ash tree not inoculated to protect them against EAB infestation. The prospect of the loss of all ash trees in the County (approximately 1 out of every 9 trees) carries with it potentially significant ecological, recreational, economic, public safety and quality of life implications. In particular, if nothing is done to manage ash trees on County-‐owned property these dead or dying ash trees have the potential to pose a significant hazard to public safety. The goal of managing ash trees on County-‐owned land includes cost-‐effectively: 1) ensuring public safety; and 2) retaining some of the ecological and social benefits that the ash trees currently provide. This Comprehensive Ash Tree Management Strategy has been developed to guide the County’s efforts to manage ash trees on County-‐owned property. The County began preparing for the arrival of EAB in earnest in 2012 when the County Executive requested that the County Legislature appropriate funding to carry out an inventory of ash trees on County-‐owned property, an essential first step in developing this comprehensive ash tree management strategy. The County owns 8,000 acres of land, including 15 parks/park properties (e.g., sports facilities, cemeteries and a zoo), and is responsible for 800 miles of County highway right-‐of-‐way. Efforts to date have also included an aggressive monitoring program aimed at early detection of EAB infestations. The Onondaga County EAB Task Force spearheaded this effort, and in 2013 distributed over 150 purple traps, primarily in the urbanized core. These efforts led to the initial positive identification of EAB in 15 locations in the City of Syracuse, the Eastwood area and the Town of DeWitt. More have been identified since then. During the past two years the County has been reaching out to communities across the United States that have already been dealing with or preparing for an EAB invasion, with the intent that the County’s ash tree management strategy reflect and integrate the insights and lessons learned from communities that have been dealing with EAB infestations for a number of years. Onondaga County, in collaboration with the EAB Task Force, has also been conducting a number of public meetings at various locations around the County and near Onondaga Lake Park to educate the public on EAB, to explain management options available to municipalities responsible for managing ash trees on public property, and to obtain public feedback on what considerations to take in to account as these plans are developed. The County held two public meetings (in September and October of 2013) specifically aimed at accepting public input on how to manage the ash trees in Onondaga Lake Park. The County’s inventory of ash trees has revealed that the number of ash trees on County-‐owned land “with targets in the drop zone” (Drop zone: Where tree limbs and tree trunks are likely to fall; Targets: People, structures, trails or roads, parking lots, utilities and other assets) is 46,730. The locations, concentrations, size distributions, health and functions of the ash trees inventoried are important factors to consider in making management decisions. The options available to the County for dealing with EAB and ash trees on County-‐owned property are relatively straightforward, and include: 1) preemptive removal prior to tree mortality; 2) protection and preservation of ash trees with pesticides; and 3) planting of new, non-‐host trees to replace the functions provided by those trees lost to EAB.

Onondaga County will implement a balanced or “selective” ash tree management strategy. The benefit of this balanced approach is that management of ash trees can be optimized at each location, preserving tree functions where they provide the greatest value, restoring lost canopy over time in other locations, and preemptively removing less valuable trees before they become a safety hazard. The County's program features the following key elements:
1) Preemptive removal of approximately 95% of inventoried ash trees over a period of 10 years (a little over 44,000 trees).
2) Replacement of approximately 10% of removed trees, phased over 10 years, primarily in the
County’s parks, with non-‐invasive, non-‐hose tree species (a little over 4,400 replacement trees).
3) Preservation of approximately 5% of inventoried ash trees. These will be carefully chosen, high value ash trees that provide significant amenities for up to 25 years (approximately 2,300 ash trees).
To carry out the County’s Ash Tree Management Strategy, the County Office of Environment will enter into an Agreement with the Onondaga County Soil & Water Conservation District (SWCD) to prepare bid documents, administer contracts with vendors and to oversee tree removal and replacement. The SWCD will also assist the County with other EAB associated activities such as monitoring for infestations, community outreach and coordination with other municipalities within the county. It is estimated that the cost for the SWCD to provide these services to the County will be $80,000/year. Though not part of these administrative and oversight costs, it is also expected that the SWCD will be responsible for inoculating trees selected for preservation. The projected cost to carry out the County’s ash tree management strategy over the next 25 years is approximately $13.5 million, $15.3 million if paid for through the issuance of bonds. In round numbers, estimated ash tree management costs include: Estimated tree removal costs (over 10 years): $ 9.6 million Estimated tree replacement costs (over 10 years): $ 1.5 million Estimated tree inoculation costs (over 25 years): $ 1.6 million Estimated administrative/oversight costs (over 10 years): $ .8 million Estimated total cost (over 25 years): $13.5 million Estimated cost to retire debt if bonds are issued: $ 1.8 million Estimated total cost if bonds are issued: $15.3 million

1
Introduction Emerald Ash Borer (EAB) has arrived in Onondaga County and will eventually kill every ash tree not inoculated to protect them against EAB infestation. The prospect of the loss of all ash trees in the County (approximately 1 out of every 9 trees) carries with it potentially significant ecological, recreational, economic, public safety and quality of life implications. In particular, if nothing is done to manage ash trees on County-‐owned property, these dead or dying ash trees have the potential to pose a significant hazard to public safety. The goal of managing ash trees on County-‐owned land includes cost-‐effectively: 1) ensuring public safety; and 2) retaining some of the ecological and social benefits that the ash trees currently provide. This Comprehensive Ash Tree Management Strategy has been developed to guide the County’s efforts to manage ash trees on County-‐owned property. Other efforts described briefly at the end of this document are underway to assist other municipalities and residents contend with the challenges posed by EAB. Emerald Ash Borer -‐ An Overview Emerald ash borer (EAB) is a small invasive green beetle that infests and kills all species of ash (Fraxinus) trees. EAB has been in the U.S. since the mid-‐1990s and was likely introduced through wood packing material in Michigan where it was discovered in 2002. The first discovery in New York was in 2009 in Randolph, Cattaraugus County. It has since been found in 15 other counties in New York, including Onondaga County in 2013.
This map, developed by the New York State Department of Environ. Conservation, depicts the relative risk to ash trees in the vicinity of known EAB infestations in New York State.
2
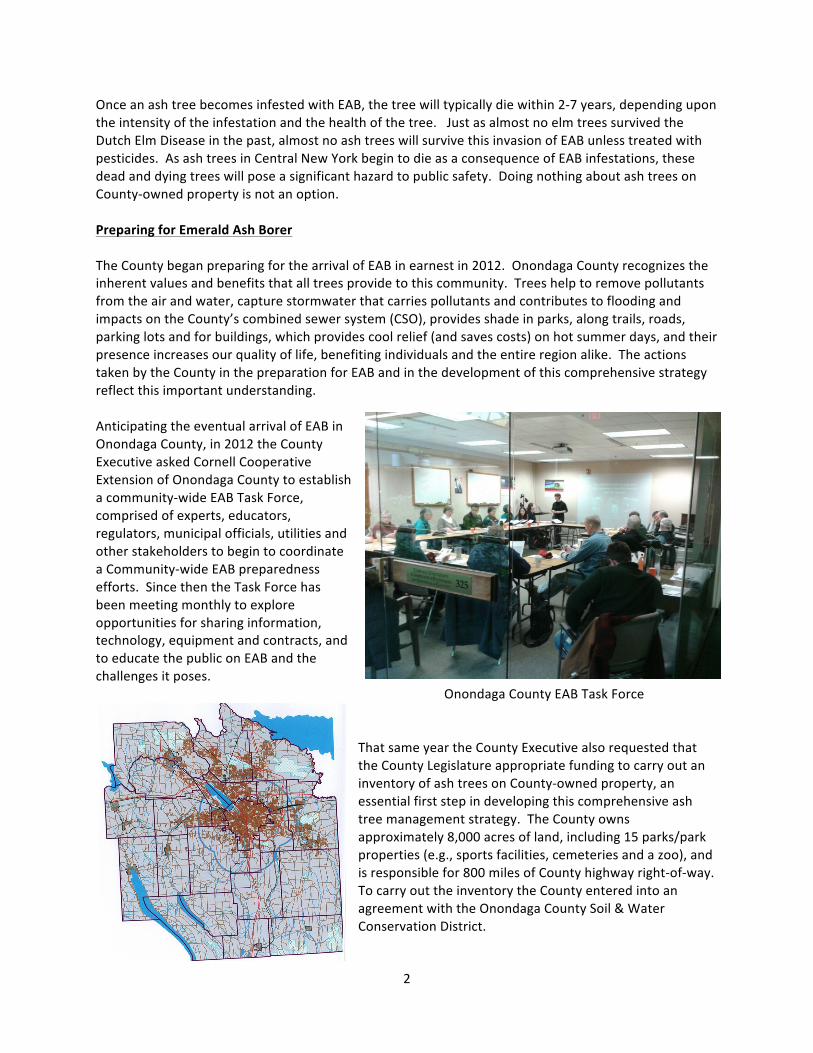
Once an ash tree becomes infested with EAB, the tree will typically die within 2-‐7 years, depending upon the intensity of the infestation and the health of the tree. Just as almost no elm trees survived the Dutch Elm Disease in the past, almost no ash trees will survive this invasion of EAB unless treated with pesticides. As ash trees in Central New York begin to die as a consequence of EAB infestations, these dead and dying trees will pose a significant hazard to public safety. Doing nothing about ash trees on County-‐owned property is not an option. Preparing for Emerald Ash Borer The County began preparing for the arrival of EAB in earnest in 2012. Onondaga County recognizes the inherent values and benefits that all trees provide to this community. Trees help to remove pollutants from the air and water, capture stormwater that carries pollutants and contributes to flooding and impacts on the County’s combined sewer system (CSO), provides shade in parks, along trails, roads, parking lots and for buildings, which provides cool relief (and saves costs) on hot summer days, and their presence increases our quality of life, benefiting individuals and the entire region alike. The actions taken by the County in the preparation for EAB and in the development of this comprehensive strategy reflect this important understanding. Anticipating the eventual arrival of EAB in Onondaga County, in 2012 the County Executive asked Cornell Cooperative Extension of Onondaga County to establish a community-‐wide EAB Task Force, comprised of experts, educators, regulators, municipal officials, utilities and other stakeholders to begin to coordinate a Community-‐wide EAB preparedness efforts. Since then the Task Force has been meeting monthly to explore opportunities for sharing information, technology, equipment and contracts, and to educate the public on EAB and the challenges it poses. Onondaga County EAB Task Force
That same year the County Executive also requested that the County Legislature appropriate funding to carry out an inventory of ash trees on County-‐owned property, an essential first step in developing this comprehensive ash tree management strategy. The County owns approximately 8,000 acres of land, including 15 parks/park properties (e.g., sports facilities, cemeteries and a zoo), and is responsible for 800 miles of County highway right-‐of-‐way. To carry out the inventory the County entered into an agreement with the Onondaga County Soil & Water Conservation District.

3
In 2013 the County Executive sought, and the County Legislature appropriated an additional $250,000 to complete the inventory, summarize and analyze the data, develop this comprehensive ash tree management strategy and to begin preemptively removing priority ash trees that already exhibit significant damage or decline (though not necessarily due to EAB). These are trees that are not suitable for preservation through inoculation, and are likely to become safety hazards sooner than other ash trees in the County. During the past two years the County has been reaching out to communities across the United States that have Ash Tree Removal in Onondaga Lake Park Winter 2014 already been dealing with or preparing for an EAB invasion, with the intent that the County’s ash tree management strategy reflect and integrate the insights and lessons learned from communities that have been dealing with EAB infestations for a number of years. This effort was enhanced in 2013 by a collaborative effort with the Syracuse University Maxwell School. The “Capstone Student Project” involved graduate students from the Syracuse University Maxwell School of Communication who interviewed and engaged in conversations with urban forestry and municipal park staff and other City and County officials in 18 states, generating 32 case studies of how they have been dealing with or preparing for the Emerald Ash Borer. Insert Web Link to Capstone Study on Env. Web Site Onondaga County, in collaboration with the Onondaga County EAB Task Force, has also been conducting a number of public meetings at various locations around the County and near Onondaga Lake Park to educate the public on EAB, to explain management options available to municipalities responsible for
managing ash trees on public property, and to obtain public feedback on what considerations to take in to account as these plans are developed. The County held two public meetings (in September and October of 2013) specifically aimed at accepting public input on how to manage the ash trees in Onondaga Lake Park (Willow Bay area pictured at left). In November of 2013 the County invited a number of experts and stakeholders to discuss considerations associated with tree replacement in Onondaga Lake Park. Those in attendance included representatives from the County Parks
4
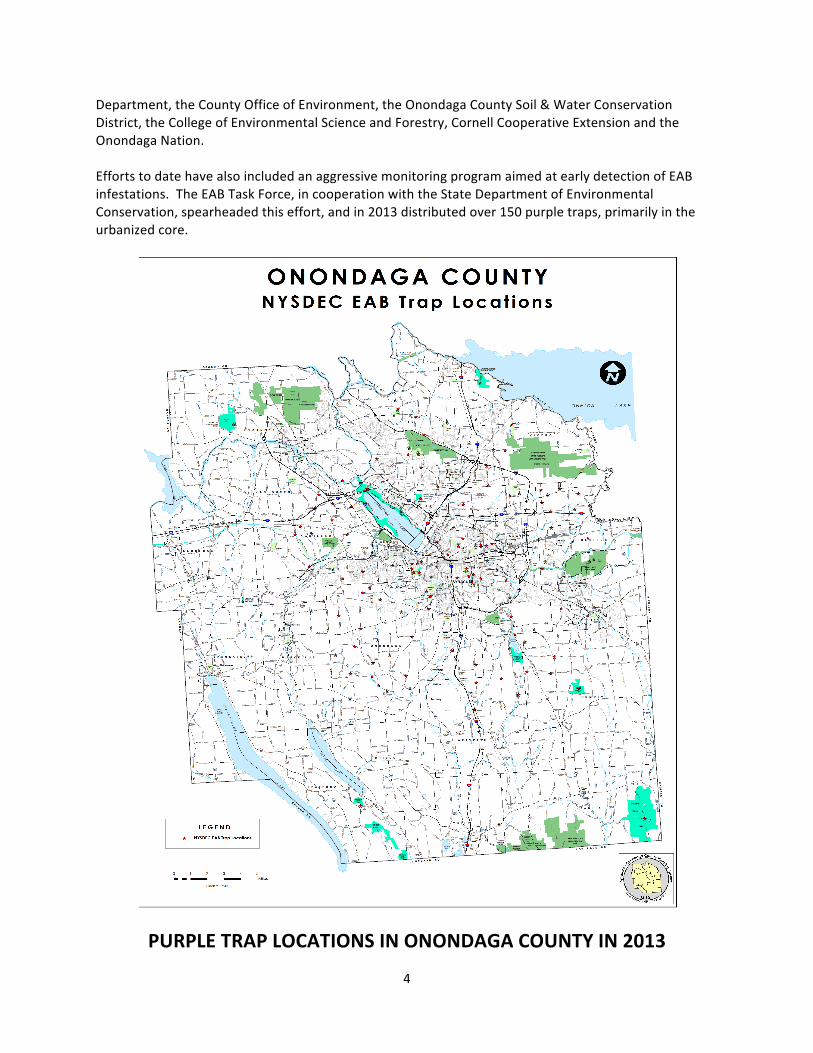
Department, the County Office of Environment, the Onondaga County Soil & Water Conservation District, the College of Environmental Science and Forestry, Cornell Cooperative Extension and the Onondaga Nation. Efforts to date have also included an aggressive monitoring program aimed at early detection of EAB infestations. The EAB Task Force, in cooperation with the State Department of Environmental Conservation, spearheaded this effort, and in 2013 distributed over 150 purple traps, primarily in the urbanized core.
PURPLE TRAP LOCATIONS IN ONONDAGA COUNTY IN 2013

5
The County also collaborated with the State Department of Environmental Conservation, Cornell Cooperative Extension of Onondaga County and the County Soil & Water Conservation District in 2013 to supplement the network of purple traps by establishing additional “sentinel trees” (designed to attract any EAB in the vicinity) throughout the more rural areas of the County. These combined efforts have led to the positive identification of EAB in 15 locations in the City of Syracuse, the Eastwood area and the Town of DeWitt. Once the EAB was found in the County, expert Establishing a Sentinel Tree in 2013 members of the EAB Task Force began delimiting the geographic extent of the infestations, which will further enable municipalities to target resources into critical areas and hopefully slow the spread of EAB. Experts from the College of Environmental Science and Forestry, who participate on the EAB Task Force, are now undertaking an effort to “date” the existing infestations in order to determine how long EAB might have been in the County. On-‐going EAB detection efforts and mapping of infestations will continue to be critical to efforts to manage EAB and to target resources going forward.
KNOWN EAB INFESTATIONS WITHIN ONONDAGA COUNTY -‐ MARCH 2014 TREES WTIHIN 10 MILES OF KNOWN INFESTATIONS (RED DOTS) SHOULD BE TREATED NOW

6
Inventory of Ash Trees on County-‐owned land The inventory of ash trees on County-‐owned land includes only those ash trees with “targets in the drop zone,” or where tree limbs and tree trunks are likely to fall. Targets can include people, structures, trails or roads, parking lots, utilities and other assets. Ash trees in isolated locations, and therefore which will not pose a safety hazard when they die and fall, have been excluded from the inventory. The inventory data base includes information on each tree, such as GPS location, the size of the tree (measured as “diameter at breast height, or DBH) and the health of the tree (whether there are existing damages or health issues associated with the tree’s trunk or leaf canopy). Inventory Results: The inventory has revealed that the number of ash trees on County-‐owned land with targets in the drop zone is 46,730. The locations, concentrations, size distributions, health and functions of the ash trees inventoried are Example of Inventory Map of Ash Tree Locations important factors to consider in Onondaga Lake Outlet making management decisions. The distribution of ash tree sizes on County-‐owned property, measured as diameter at breast height, was found to be typical, with a large percentage of smaller diameter trees (less than 12”), and diminishing numbers of trees as the diameters increased (see figure on following page). While the County’s ash tree inventory reflects a typical distribution across diameter ranges, certain locations do reflect notable concentrations of ash trees of particular size ranges, which can be an important factor in determining how best to manage the ash trees in specific locations. For example, the overwhelming majority of ash trees along Onondaga Lake Park’s West Shore Trail are less than six inches in diameter, while the Willow Bay area of Onondaga Lake Park is comprised predominantly of larger ash trees, which give Willow Bay its character and offers substantial shade to park patrons picnicking and/or recreating there. Removal of all ash trees in the Willow Bay area would dramatically alter the character of this intensively used portion of Onondaga Lake Park. The ash tree inventory also allows the County to identify the number and locations of those ash trees that are poor candidates for preservation. The current health of an ash tree is an important factor in considering its suitability for preservation through the use of pesticides. The rate of success in attempts to preserve ash trees through the use of pesticides can be low for trees that already exhibit damage to the trunk or decline in leaf canopy. Ash trees exhibiting these characteristics are identified in the inventory. Appendix A includes a summary of County ash tree inventory data.

7
Size Distribution of Ash Trees on County-‐Owned Property The rate of success in attempts to preserve ash trees through the use of pesticides can be low for trees that already exhibit damage to the trunk or decline in leaf canopy. Ash trees exhibiting these characteristics are identified in the inventory. Pictured right is an example of canopy die back in an ash tree in Onondaga Lake Park.

8
Ash Tree Management Alternatives Available to the County The goal of managing ash trees on County-‐owned land includes cost-‐effectively: 1) ensuring public safety; and 2) retaining some of the ecological and social benefits that the ash trees currently provide. Ash tree management alternatives available to the County include:
• Do nothing (allow nature to take its course) • Preemptive removal of all ash trees • Pre-‐emptive removal of all ash trees with some percentage of replacement/restoration
plantings • Inoculation of all ash trees that can be protected from EAB by use of pesticides (again, not all
trees can be saved with inoculation, either because of damage to the tree or existing poor tree health)
• Some combination of pre-‐emptive removal, tree replacement and tree preservation through pesticide inoculation
Policy considerations for establishing ash tree management decisions on County-‐owned property differ from one location to the next based on site conditions and use of the site. That is, no single approach is suitable for all locations. For example, the functions provided by ash trees located on public parkland are likely different from those provided by ash trees located in highway right-‐of-‐ways or adjacent to emergency communications towers. Further, decisions about how to manage ash trees located in intensively used areas, such as Oneida Shores Park, will differ from those located in lightly used areas, such as adjacent to a wastewater pump station. Option 1: Do nothing -‐ Not an option! Doing nothing, allowing nature to take its course, is not an option with respect to management of ash trees on County-‐owned property with targets in the drop zone. Existing County policy calls for the removal of any species of tree that poses a hazard to public safety. Therefore the “do nothing” option would involve removal of ash trees as they die and become a hazard. Waiting would invariably be more costly than pre-‐emptive removal, since dead trees are more difficult, more dangerous and more costly to remove than live trees, and there is no assurance that the County would be able to keep pace with the rate of ash tree mortality, as witnessed in EAB infested locations in the Midwest. This approach would result in greater risk to public safety, and is therefore neither a responsible nor an acceptable option. Under this alternative, eventually all ash trees on County-‐owned property will suffer EAB mortality, the functions these trees provide would be lost and removal costs would be greatest. Option 2: Preemptive removal of all ash trees Preemptive removal of all ash trees on County-‐owned land -‐ that is, those with targets in the drop zone -‐ would involve removing all 46,730 ash trees, preferably before they begin to exhibit decline associated with infestation by EAB.

9
The numbers and concentrations of ash trees, as well as the sizes and their functions in various locations throughout the county differ significantly. Some locations are home to hundreds of densely clustered, small diameter ash trees (e.g., Onondaga Lake Park West Shore Trail and along some highway right-‐of-‐ways), while in other locations large diameter ash trees are the predominant species (e.g., Willow Bay). Still other locations include sparse populations of ash trees, interspersed with other species of trees. The nature and extend of impacts associated with preemptive removal of all ash trees vary significantly depending upon these and other factors. Removal of Ash Tree As noted previously, all trees provide useful functions (e.g., energy conservation, stormwater management, air quality benefits, wildlife habitat, carbon sequestration, aesthetics, etc.). Efforts have been made by others across the country to assign a dollar value to these functions, typically in the neighborhood of $120/tree per year. The County has not attempted to assign a dollar value for the functions provided by existing ash trees, but does recognize that there will be costs, real costs, beyond those of simply physically removing these trees. Option 3: Pre-‐emptive removal of all ash trees with some replacement/restoration plantings This alternative is the same as the previous one (preemptive removal of all ash trees) but seeks to mitigate some of the ecological and cultural impacts associated preemptive removals by replacing some number of ash trees with new non-‐invasive, non-‐host species of trees. This alternative is intended to “jump start” the restoration of urban forest and lost ecological and cultural functions. The limitation of this approach is that it will likely be decades before the ecological functions and cultural benefits that had been provided by large, older ash trees will be restored.
Preemptive removal of all ash trees on County-‐owned land would involve removing all 46,730 ash trees, preferably before they begin to exhibit decline associated with infestation by EAB, plus the additional cost of restoration plantings. It has been estimated that replacement plantings (including trees stock, materials and labor at prevailing wage rates) would cost approximately $350/tree. If the County were to replace 10% of the ash trees removed preemptively, the cost of removal and replacement has been estimated to be approximately $1.5 million.

10
Option 4: Protection or preservation of all healthy ash trees by use of pesticides Management of Emerald Ash Borer (EAB) has been evolving at a rapid pace since it was first identified as the cause of widespread ash mortality in the Detroit area in 2002. Ash trees are being successfully treated and protected from EAB with systemic insecticides in many communities in the Midwest. The term often used in reference to such pesticide treatment is “inoculation.” As noted before, not all trees can be preserved by inoculation. Trees that already exhibit trunk and/or canopy damage or decline, often due to something other than EAB, are less likely to survive infestation by EAB even with inoculation because of the tree’s reduced ability to translocate the pesticides to all areas of the tree. Based on the inventory data under this alternative the number of trees deemed to be in good enough health to be considered for preservation by inoculation is 43,869. The balance of trees, 2,861, would be preemptively removed. The benefit of this approach is that the functions provided by existing “healthy” ash trees would be preserved until the tree dies of other natural causes. Using this approach it is not necessary to replace lost functions by planting replacement trees, or waiting decades for replacement trees to mature and restore lost functions. In contrast to preemptive removal, which represents a one-‐time cost, this approach results in a long-‐term cost as the trees have to be inoculated until their useful lives expire or until nature or new science leads to alternative, less costly control measures. It should also be pointed out that preserved trees will continue to grow, and consequently so will the cost of treatment per tree (treatment costs are based on tree diameter). Over time cost increases due to tree growth are likely to be offset to some extent by tree losses (that is, as protected ash trees die of causes other than EAB). There are two typical types of pesticide treatments for EAB. One type involves applying pesticides to either the tree bark or to the soil around the tree (e.g., a soil drench product like Imidacloprid). With this latter system pesticides are injected into the soil where the roots of the trees take up the pesticide during uptake of soil moisture. The pesticide can be effective at reducing populations of EAB larvae but does not reduce populations of EAB insects foraging on leaves. The disadvantages of using a soil drench include:
• Pesticide can bind to the soil. • Pesticide can be washed away by rain. • The tree may not take up the pesticide uniformly or at desired amounts. • There are “per acre” limitations on use for water quality reasons.
The second type of pesticide treatment is systemic injection of trees by directly injecting pesticides (e.g., emamectic benzoate) through holes drilled into the lower stem or trunk of the trees. The tree distributes this type of pesticide throughout the tree, and it is effective at killing both the EAB larvae in the tree as well as the EAB adults foraging on the green, leafy vegetation in the canopy of the tree. According to the label, systemic pesticide injection can provide two years of effective treatment to a tree. Municipalities in the Midwest have reported success (ash tree survival) in reapplying this type of product every three Injecting pesticide into tree trunk years instead of every two years.

11
All treatments involving the use of pesticides will require posting of pesticide application notification signs on a minimum of two (2) sides of each tree, or posting of the entire perimeter of the treatment area for 24 hours after application. Option 5: Some combination of pre-‐emptive removal, tree replacement and tree preservation through inoculation A final option would be to adopt a balanced or “selective” management approach that would feature preemptive removal of most ash trees with targets in the drop zone, preservation of selected, high value ash trees that are able to uptake the systemic trunk injection pesticides (to kill EAB larvae in the wood and EAB adults eating the green leafy tissue), and mitigation of lost functions by replanting of some number of new trees using non-‐host, non-‐invasive tree species. The benefit of this balanced approach is that management of ash trees can be optimized at each location, preserving tree functions where they provide the greatest value, restoring lost canopy over time in other locations, and preemptively removing less valuable trees before they become a safety hazard. Regulatory requirements/considerations Some aspects of ash tree management are subject to State and Federal regulations, which will generally fall under the jurisdiction of three State or Federal Agencies:
1) New York State Department of Environmental Conservation (DEC) 2) New York State Department of Agriculture & Markets 3) U.S. Fish & Wildlife Service
The New York State DEC regulates the use of pesticides with respect to applicator certification and pesticide use notification. The DEC also regulates the movement of ash firewood and protecting "endangered species" (which in the case of ash trees in Onondaga County involves the presence of roosting sites for the Indiana Bat and the requirement to limit impacts to this endangered species.). The State Department of Agriculture & Markets is responsible for regulating the movement of EAB infested ash wood in all forms (logs, branches, mulch, etc.), and requires those involved in the movement of infested ash wood to enter into a Quarantine Infested Materials Compliance Agreement in order to slow the spread of EAB. The U.S. Fish and Wildlife Service is responsible for administering the Federal Endangered Species Act which, similar to the roll of DEC above, involves the presence of roosting sites for the Indiana Bat and the requirement to limit impacts to this endangered species. Timing Considerations Timing considerations with respect to ash tree management decisions involve the following:
• The location of confirmed EAB infestations within and in proximity to County-‐owned ash trees • The age of EAB infestations (which impacts EAB populations, the rate of spread of EAB and their
impact on the rate of ash tree mortality)

12
• The timing of “treatment” with respect to tree removal, replacement planting and inoculation At the time of this writing, EAB has been confirmed in numerous locations within the City of Syracuse, Eastwood and the Town of DeWitt (see figure on page 5). Consequently, decisions with respect to ash tree preservation/inoculation in proximity to these locations would best be made without delay. Researchers in the Midwest have established an ash tree mortality curve for areas infested by EAB (see figure below). These mortality curves indicate that for the first seven years following infestation by EAB ash tree mortality is approximately 10% (that is, one out of 10 trees will die). During the subsequent five years (years 8-‐12 following initial infestation) ash tree mortality rises to approximately 90% (that is, nine out of ten trees will die). A primary goal of the County’s ash tree management strategy is to carry out treatments (removal and/or inoculation) before ash tree mortality rates fall within the steep part of the “death curve.” As the level of EAB infestation increases, ash tree management options available to the County decrease, essentially because the option to preserve trees becomes less viable.
There is also a “seasonality” to treatment of ash trees with respect to removal, replacement planting and inoculation with pesticides. Because of the potential presence of the Indiana Bat, tree removals

13
below the 900’ elevation might be limited in some locations to the period from November 1st to March 31st when the bats are in hibernation. Inoculation of selected ash trees is likely to occur in the spring and summer when the trees can successfully translocate the pesticide to all areas of the tree and the EAB are likely to be exposed to the product. The timing of planting of replacement trees can vary based on site conditions and existing weather-‐related conditions (primarily temperature and precipitation). Onondaga County Ash Tree Management Strategy EAB has now been confirmed in Onondaga County, and the prospect of the total loss of ash trees in the County (approximately 1 out of every 9 trees) carries with it potentially significant ecological, recreational, economic, public safety and quality of life implications. As noted previously, the options available to the County for dealing with EAB and ash trees on County-‐owned property are relatively straightforward, and include: 1) preemptive removal prior to tree mortality; 2) protection and preservation of ash trees with pesticides; and 3) planting of new, non-‐host trees to replace the functions provide by some of those trees lost to EAB. Onondaga County will implement a balanced or “selective” ash tree management strategy that features the following key elements:
1) Preemptive removal of approximately 95% of inventoried ash trees, phased over a period of 10 years (a little over 44,000 trees)
2) Replacement of approximately 10% of removed trees, primarily in the County parks and urbanized portions of drainage districts, with non-‐invasive, non-‐host tree species (a little over 4,400 replacement trees). Replacement plantings will be phased over 10 years.
3) Preservation of approximately 5% of inventoried ash trees -‐ carefully
chosen, high value trees that provide significant amenities -‐ for up to 25 years (approximately 2,300 ash trees).
Preemptive Removal A majority of ash trees on County-‐owned land will be preemptively removed over a ten year period between 2014 and 2024 so that these ash trees will not become a safety hazard to the public or County personnel. The decision to opt for this amount and rate of removal includes:
• Many of the ash trees are small diameter (almost 30,000 of the approximately 46,740 inventoried trees are 8” or less in diameter. Removal of these trees before they grow to maturity will reduce costs over the long term.
• Because so many of these trees are small, the loss of canopy and tree function is relatively
modest and can be replaced relatively quickly.

14
• As many as 8,000 of the trees in the inventory are not suitable for preservation because of
existing impairments in the trunk or canopy, which would likely limit the success rate of efforts to preserve them.
• While the “annual cost” to remove these trees over a ten year period is estimated to be greater
than the estimated annual cost of preservation through inoculation, the total or “cumulative” estimated cost for removal over 10 years is less than the long-‐term cost of preserving this number of trees over 25 years (see cost curves in Appendix B).
While these same considerations might argue for more rapid removal of these trees (e.g., in five years rather than ten years) constraints imposed by the availability of qualified technicians to perform safe removals, by the presence of overhead and underground utilities, by the presence of the public (using County roads and parkland), by regulatory constrains (e.g., the protection of the Indiana Bat during roosting season), by the availability of wood utilization and/or disposal options, and the ability to oversee and monitor tree removal operations is likely to make it impractical to remove targeted trees at a much more rapid rate. The cost for removal of approximately 44,000+ ash trees on County-‐owned property over 10 years is projected to be $9.6 million. This is based on bid rates obtained for tree removals in January 2014, and a conservative annual tree growth rate of approximately ½” per year over ten years (removal costs are based largely on tree size; diameter at breast height). The County will target as an early priority for removal those ash trees on County-‐owned property in closest proximity to know EAB infestations. At the time of this writing that includes ash trees within County right-‐of-‐ways in the Towns of DeWitt and Salina, and includes Onondaga Lake and Hopkins Road Parks. Future removals in County parks, on County campuses, adjacent to County facilities (e.g., pump stations or communications towers) and along County highway right-‐of-‐ways will occur where proximity to pest infestations and pest pressure is greatest, with the goal of removing as many trees as possible before EAB infestations kill the trees. To this end, monitoring will continue to be an integral part of the County’s ash tree management strategy. In addition to the use of “purple traps” and/or any new EAB detection methods developed in the years ahead, the County will train field staff in key departments (Parks, Transportation, Water Environment Protection) on ash tree identification and symptoms to look for that would indicate the likelihood of EAB infestations. Management of Wood Waste Management of wood waste associated with the removal of such large quantities of ash trees is an important consideration in developing a management strategy. Ash wood is a valuable hardwood used to make such things as furniture, wood veneer, tool handles and baseball bats. However, not all ash trees are suitable for use in processing ash wood into such products. The vast majority of ash trees to be managed by the County in implementing this strategy are part of the urban forest, and not part of a remote or isolated timber stand. As a consequence, a majority of these trees

15
are small diameter, and not typically sought by milling operations (almost 30,000 of the approximately 46,730 inventoried trees are less than 8” in diameter). Most of the trees in County parks, on County campuses and along County right-‐of-‐ways are “open grown,” and often exhibit features not found in forest grown trees. Open grown trees often exhibit multiple stems and many large limbs that originate low on the trunks. Because of the availability of more sunlight in open grown settings, the trees often have co-‐dominant stems very low in the trunk rather than higher in the trees, which can also result in “bark inclusion” and weak structure. It is not uncommon for urban trees to include foreign objects, such as nails and other metal objects that pose a concern to mill operators due to the damage such objects cause to expensive saw blades and the hazards they pose for mill workers. As a consequence, a significant portion of the wood waste generated from the County’s ash tree management strategy, as a practical matter, will likely be used for firewood or turned into mulch. Ultimately, all wood waste will be beneficially used one way or another. Tree removal bid documents will be written in such a way as to maximize the potential for reuse of wood waste in an effort to minimize wood waste disposal costs and maximize reuse of the wood. Replacement of Lost Canopy As noted earlier, all trees provide useful or valuable functions. However, some are clearly more useful and/or valuable than others. Restoration of lost value and functions through replacement plantings in strategic locations is a vital element of the County’s ash tree management strategy. The County has established as a goal the replacement of 10% of preemptively removed ash trees with non-‐invasive, non-‐host species. These replacement trees will be planted either in locations where the lost function is critical, or in locations where they will provide the greatest value, such as in County parks. Species Selection As noted previously, a meeting was held on October 29, 2013 at the Onondaga Lake Park office with various groups to discuss an ash tree replacement strategy specifically in Onondaga Lake Park. Meeting attendees helped develop a list of native species to include in the park planting plan. The following goals emerged from this discussion, and can and should be applied in other locations selected for replacement plantings: 1) Maximize diversity of tree species; 2) Ensure that selected species appear on the www.urbantree.org/list website; 3) Ensure that none of the selected species are identified on the NYSDEC list of invasive terrestrial shrub and tree species; 4) Select species that are best suited to the site to facilitate long-‐term success while at the same time minimizing annual and long-‐term maintenance requirements; and 5) Source planting stock from nurseries rearing trees in a gravel bed system in the USDA plant hardiness zone 5b. The County will strive to use these criteria in selecting replacement tree species. Preservation of High Value Ash Trees through Inoculation Again, all trees provide useful or valuable functions, but some are clearly more useful and/or valuable than others. Some ash trees on County-‐owned land provide valuable functions that cannot be readily replaced if removed. These do not constitute a majority of County-‐owned ash trees, but rather a select group. The County will attempt to preserve approximately 2,300 carefully chosen, high value ash trees

16
that provide significant amenities for up to 25 years. 25 years is viewed to be a realistic planning horizon, during which time it is understood that: 1) Some of the trees selected for preservation will suffer mortality due to factors other than EAB; 2) Pest pressure will diminish over time due to loss of food source; 3) The science and understanding of EAB is likely to lead to improved, more cost-‐effective control measures; and 4) Nature might respond in some unanticipated manner that serves to diminish EAB populations and/or enhance ash tree resistance to EAB. Because preservation of ash trees represents an on-‐going, long-‐term cost, the decision to preserve any given ash tree must be made judiciously. Only those ash trees that are recognized to be of particular value will be preserved. The following criteria have been established to identify those ash trees on County-‐owned land that will be candidates for preservation:
• Ash trees exhibiting health characteristics supporting a high probability of success/survival.
• Ash trees in locations characterized by intensive use by the public, and where such intensive public use is due, at least in part, to the presence of the ash tree(s) and the function/value the tree(s) provide at that location.
• Ash trees that serve to
protect a County asset from damage or harm (such as lake shore, creek bank stabilization or a drainage district) that cannot be cost-‐effectively achieved in some other manner.
• Ash trees which are likely to provide savings in energy use in buildings due to shading in the summer and/or that serve as a barrier to wind in the winter.
• Ash trees that serve as unique habitat to rare or endangered species, such as eagles.
“Tagged” ash trees in the Willow Bay Area in Onondaga Lake Park
• Ash trees located proximate to future EAB infestations that, if inoculated, could serve to slow the spread of the beetle to other areas.
• Healthy ash trees in locations that create difficulties for removal (due to access or infrastructure
issues) that would likely involve high removal costs.
• Healthy ash trees in unique or special setting, such as cemeteries, where removal of a particular tree might be considered unfitting.

17
Trees with the following characteristics are not viewed as good candidates for preservation:
• Where nearly comparable function(s) are provided by adjacent, non-‐host trees, and tree functions will essentially be preserved even with removal of the ash tree(s), an ash tree or trees within such a cluster will not be preserved.
• Trees with canopy decline greater than 40% and/or
extensive trunk damage
• Trees exhibiting excessive lean
• Trees exhibiting storm damage and/or that are structurally unsound
• Trees with power lines overhead
• Trees with roots that threaten nearby infrastructure or other
assets (e.g., trail)
• Trees with co-‐dominant stems
• Small diameter trees (<12”)
• Very large diameter trees (>36”) at the outset of the preservation program
Photo by: University of Florida
Dept. of Environmental Horticulture Some towns within the County have expressed an interest in preserving selected ash trees along County highway right-‐of-‐way within their municipality. It is the County’s intent to allow municipalities interested in preserving selected ash trees along County highway right-‐of-‐ways if the municipality enters into an inter-‐municipal agreement with the County and agrees to pay the cost of inoculating selected trees. Selection of Pesticide Product There are a limited number of pesticide products available to the County to protect ash trees on County-‐owned land from EAB. These were described on page 10. Experience in other locations that have already been facing EAB infestations for several years now indicates that use of emamectin benzoate provides the most effective protection against EAB, and is the only trunk injected product currently available that is labeled for two years of protection. Recent research findings have demonstrated that emamectin benzoate has provided reliable protection for three years, and in some cases (where infestation pressure is slight) potentially for as many as four years.

18
Another “injected” EAB pesticide product available to the County is imidicloprid, but this product provides only one year of protection against EAB, and has “per acre limitations” on use (that is, there are limits to the number of trees that can receive the product within a given area). Because the advantages afforded by ememectin benzoate (injected directly into the tree, 2-‐3 years of protection and no acreage limitation), and the potentially significant disadvantages associated with alternative products (applied to the soil, shorter period of effectiveness and limitations on the area over which it can be applied), the County will use ememectin benzoate to protect ash trees selected for preservation on County-‐owned land. All treatments involving the use of pesticides will require posting of pesticide application notification signs on a minimum of two (2) sides of each tree, or posting of the entire perimeter of the treatment area for 24 hours after application. All products will be applied by applicators certified by the State of New York. In general, one third of the trees selected for preservation on County-‐owned property will be inoculated each year. Where applied, inoculations will be distributed roughly evenly geographically in order to maximize effectiveness. This is because research has shown that having inoculated trees adjacent to unprotected trees serves to limit the growth of EAB populations, limit the intensity of infestations in adjacent trees and to slow the spread of EAB to other locations. Even if EAB were to infest unprotected adjacent trees, if the infestation is not severe, treating such trees within one or two years is likely to provide adequate protection to achieve survival. In the event infestation pressure is found to be more intense than expected, the number of inoculations in such locations will be increased in the second year. By the third year it is expected that all trees identified for preservation in a particular location will have adequate protection to allow for on-‐going inoculations of each tree every third year. Inoculations of selected ash trees are expected to continue until a tree becomes a hazard for reasons other than EAB (e.g., damage due to wind, lightning or disease), or until for some reason the tree no longer provides the special function(s) which led to its selection for preservation. There is some evidence that once the initial wave of EAB move through an area, infestation pressure drops off and the frequency of inoculation applications can be reduced. It is also hoped that over time other cost-‐effective alternatives to managing EAB or protecting ash trees from EAB will become available. Strategy Implementation -‐ Projected Costs and Schedule As stated previously, the County’s strategy reflects a balanced or “selective” ash tree management strategy that allows for the preservation of approximately 2,300 carefully chosen, high value ash trees that provide significant amenities (approximately 5% of the ash trees inventoried on County-‐owned property), while preemptively removing the balance of ash trees (approximately 44,000 trees) over a period of 10 years (approximately 4,400 trees per year) that would otherwise eventually pose a safety hazard to the public. Loss of the functional value of trees due to preemptive removals (shade, habitat, stormwater management, etc.) will be partially offset by planting approximately 4,400 replacement trees phased over 10 years (approximately 10% of the ash trees lost due to preemptive removal or EAB mortality).

19
To carry out the County’s Ash Tree Management Strategy, the County Office of Environment will enter into an Agreement with the Onondaga County Soil & Water Conservation District (SWCD) to prepare bid documents, administer contracts with vendors and to oversee tree removal and replacement. The SWCD will also assist the County with other EAB associated activities such as monitoring for infestations, community outreach and coordination with other municipalities within the county. It is estimated that the cost for the SWCD to provide these services to the County will be $80,000/year. Though not part of these administrative and oversight costs, it is also expected that the SWCD will be responsible for inoculating trees selected for preservation. In order to project other costs for the County’s ash tree management strategy, the County developed a model that takes into account the following factors:
• The current cost of tree removal (based on recent bid prices), which is tied to tree diameter at breast height, management of wood waste and stump grinding costs, as well as tree growth (to account for increasing costs associated with removing larger diameter trees over time).
• The number and cost of replacement trees expected to be planted over a 10 year period
(including tree stock, materials and labor).
• The anticipated cost for inoculation of trees selected for preservation over a 25 year period (including increasing costs associated with tree growth over time).
The projected cost to carry out the County’s ash tree management strategy over the next 25 years is approximately $13.5 million, $15.3 million if paid for through the issuance of bonds. In round numbers, estimated ash tree management costs include: Estimated tree removal costs (over 10 years): $ 9.6 million Estimated tree replacement costs (over 10 years) : $ 1.5 million Estimated tree inoculation costs (over 25 years): $ 1.6 million Estimated administrative/oversight costs (over 10 years) $ .8 million Estimated total cost (over 25 years): $13.5 million Estimated cost to retire debt if bonds are issued: $ 1.8 million Estimated total cost if bonds are issued: $15.3 million Additional information regarding annual and cumulative costs for strategy implementation is provided in Appendix B. Plan for Flexibility The goal of the County’s Ash Tree Management Strategy is to ensure the health and safety of the public and County employees, and to mitigate the cultural and ecological impacts of EAB on County-‐owned land. The proposed strategy calls for a balanced or “selective” approach that, over the next 25 years is intended to allow for the preservation of high value ash trees, preemptively remove trees that will eventually pose a safety hazard, and to partially offset the loss of the functional values provided by the trees selected for preemptive removal by replacing 10% of them. It must be recognized that nature, in this case the emerald ash borer, does not always accommodate even the best laid plans. EAB infestations could move at a more rapid rate than expected, and require

20
some flexibility in order to achieve the stated objectives, particularly public safety. Schedules should be viewed as tentative and subject to change, depending primarily upon observed pest pressure and where it is occurring. Management of Ash Trees in County-‐owned Timber Stands This strategy is aimed at managing ash trees on County-‐owned land with targets in the drop zone (Drop zone: Where tree limbs and tree trunks are likely to fall; Targets: People, structures, trails or roads, parking lots, utilities and other assets), rather than ash trees in “timber stands” on County-‐owned land. As of this writing, the County has had its forestry services expert, Forecon, investigate opportunities for harvesting ash-‐heavy timber stands in Highland Forest and Spafford Forest as a consideration in management of EAB-‐related issues. Where such harvesting supports sustainable forest management practices, harvesting has been and should continue to be pursued. It should be noted that in considering the harvesting of ash in timber stands as a possible management strategy, it will be important to consider such factors as: 1) size (value) of the ash trees (it probably does not make sense to harvest smaller diameter, less valuable ash trees that are likely to remain unaffected by EAB for several years); 2) the types and status of other types of trees located among ash trees (it probably does not make sense to remove a few ash trees in locations where there are other types of trees that will realize their optimum economic value (and the value of the stand) at a later date); and 3) the impact on the on the overall health of the forest that would be caused by ash tree harvesting. It is recommended that sustainable forest management strategies be developed for all County-‐owned timber stands so that ash tree removals can be managed in the context of a more comprehensive sustainable forest management strategy. Information Available to Residents and Commercial Property Owners As noted previously, the Onondaga County Emerald Ash Borer Task Force has been actively working with municipalities and public agencies to prepare for EAB and coordinate management needs since April 2012. The Task Force is comprised of representatives from local agencies, tree commissions, universities, utilities and industry. The mission of the Task Force is to coordinate and facilitate the sharing of information, technology, equipment, policy and contracts in order for all stakeholders in Onondaga County to have a better and less expensive outcome with regard to EAB and ash tree management. Another goal of the Task Force is to make information about EAB available to the public so that residents and commercial interests are able to make more informed decisions about how to manage ash trees on their property. Cornell Cooperative Extension of Onondaga County, the entity chairing the County EAB Task Force, has taken the lead in informing and educating the public on EAB and the options available to manage ash trees on private property. Anyone interested in learning more about EAB and what you can do to responsibly manage your ash trees can go to the Cooperative Extension web site at: http://www.extendonondaga.org/ , or call them at (315)424-‐9485.

21
APPENDIX A
Summarized ash tree inventory data

22

SUMMAR
Y OF AS
H TR
EE IN
VENTO
RY DAT
A
1st P
riority
2nd Priority
Remove All A
sh Trees
Conservativ
e Inoculation
Intensive Inoculation
Level 1
Level 2
Level 3
Quantity
Quantity
Quantity
Quantity
Quantity
1432
2020
86453
346
424
21652
88
81681
593
676
2,024
20,099
1,391
1391
3572
23,514
18,547
21,927
5219
2424
47248
177
223
3,282
18,004
377
377
1,667
21,663
18,650
20,451
264
22
568
6065
1102
00
0103
103
103
5,336
39,572
1,822
1,822
5,458
46,730
38,476
43,869
076
00
276
7476
2119
11
19122
102
121
509
20,818
670
670
2,404
21,997
18,923
21,139
863
11
972
6269
519
21,076
672
672
2,434
22,267
19,161
21,405
5,855
60,648
2494
2494
7,892
68,997
57,637
65,274
Risk Assessm
ent 1= Tree
s that are cu
rren
tly health
y and po
se no risk to pub
lic or p
rivate targets if d
ead
Risk Assessm
ent 2= Tree
s that cou
ld fall and cause damage to pub
lic or p
rivate targets if d
ead
Risk Assessm
ent 3= Tree
s that h
ave po
or health
and
may ca
use damage to pub
lic or p
rivate prop
erty re
gardless of the
presence of EAB
infestation
Target: Person, prope
rty, or infrastructure that may be damaged
from
falle
n tree
s
1st P
riority Re
moval= Tree
s inven
torie
d with
a risk assessm
ent o
f 3 (risk of falling re
gardless of EAB
presence)
2nd Priority Re
moval= Tree
s inven
torie
d with
a risk assessm
ent o
f 2, but do no
t qualify for ino
culatio
n du
e to health
cond
ition
. The
se are tree
s that h
ave a he
alth ratin
g of "B" or "C"
Conservativ
e Inoculation= All tree
s that are Risk 1 (perfectly health
y) and
tree
s that are Risk 2 that have a he
alth assessm
ent o
f 1A or 2A
Intensive Inoculation= Trees with
a risk assessm
ent 2 with
health
assessm
ents of 1B or 2B
Health Com
men
ts:
1= Stem
2= Canop
yA=
Small amou
nt of d
ead branches or rot
B= Med
ium amou
nt of d
ead branches or rot
C= La
rge am
ount of d
ead branches or rot (greater th
an 40%
decay/rot in ca
nopy of tree)
Total num
ber o
f trees to
be managed
Trees A
djacen
t to Co
unty
Prop
erty
Tree
Rem
oval
Site
Risk Assessm
ent
911 Towers
Coun
ty Highw
ay ROW's
Misc. Prope
rties
Coun
ty Parks
Wastewater Treatmen
t Plants
Pumping Statio
ns
WEP Drainage Districts
Wastewater Treatmen
t Plants
Sub
Total
Notes and
Definition
s:
Grand
Total
Pumping Statio
nsCo
unty Highw
ay ROW's
Coun
ty Parks
Sub Total

ONONDA
GA CO
UNTY
ASH
TRE
E INVE
NTO
RY
DISTRIBU
TION OF AS
H TR
EE DIAMETER
S

ONONDA
GA CO
UNTY
ASH
TRE
E INVE
NTO
RY
DISTRIBU
TION OF AS
H TR
EE DIAMETER
S

ONONDA
GA CO
UNTY
ASH
TRE
E INVE
NTO
RY
NUMBE
R OF TR
EES BY
TAR
GET TYP
E

23
APPENDIX B
Estimated Costs – Cost Curves and Tables


COST ESTIM
ATES AND ASSOCIAT
ED ASSUMPT
IONS
The following conservativ
e assumptions were used
in develop
ing the cost projection mod
el:
Num
ber o
f ash tree
s to man
age:
46
,730
Av
erage grow
th in tree diameter per year:
0.5”/year
Percen
tage of p
reem
ptively removed
tree
s to be
replaced
:
10
% ≈ 4,400
Num
ber o
f trees to
be preserved with
pesticides:
5%
≈ 2,300
Re
placem
ent cost p
er tree
(assum
ing pa
ymen
t of p
revailing
wages fo
r lab
or):
$350
/tree
Assumed
cost o
f rem
oval and
stum
p grinding
(Based
on 20
14 bid pric
es):
Tree
Re
moval
Stum
p
Diam
eter
Cost
Grin
ding
1" to
6"
$33.33
$4
9.50
7" to
12"
$85.00
$5
9.00
13" to 18"
$325
.00
$69.50
19" to 24"
$525
.00
$118
.00
25
" to 30"
$825
.00
$143
.00
31" to 36"
$1,200
.00
$215
.00
37" to 42"
$1,650
.00
$275
.00
Assumed
cost o
f ino
culatio
n of trees b
etween 12
” an
d 36
” diam
eter at b
reast h
eigh
t (Assumes 1/3 of a
ll trees s
elected for p
reservation will be
inoculated
ann
ually):
If ou
tsou
rced
(con
tract cost): $7
.00/diam
eter inch
If do
ne in-‐hou
se: $4
.50/diam
eter inch
It is estim
ated
that th
e cost fo
r the
SWCD
to provide
adm
inistrativ
e an
d im
plem
entatio
n oversig
ht se
rvices to
the Co
unty will be $8
0,00
0/year.
The projected cost to
carry out th
e Co
unty’s ash tree m
anagem
ent strategy over th
e ne
xt 25 years is a
pproximately $1
3.5 million, $15
.3 m
illion if pa
id
for throu
gh th
e issuan
ce of b
onds. In ro
und nu
mbe
rs, estim
ated
ash tree m
anagem
ent costs includ
e:
Estim
ated
tree re
moval costs (o
ver 1
0 years):
$ 9.6 m
illion
Estim
ated
tree re
placem
ent costs (o
ver 1
0 years) :
$ 1.5 m
illion
Estim
ated
tree inoculation costs (over 25 years):
$ 1.6 m
illion *
Estim
ated
adm
inistrativ
e/oversig
ht costs (o
ver 1
0 years)
$ .8 m
illion
Estim
ated
total cost (over 25 years):
$1
3.5 million
Estim
ated
cost to retire de
bt if bon
ds are issued
:
$ 1.8 m
illion
Estim
ated
total cost if b
onds are issued
:
$1
5.3 million
*Assum
es in-‐hou
se inoculation

ANNUAL
AND CU
MULA
TIVE
COST PRO
JECT
IONS FO
R VA
RIOUS SCEN
ARIOS (CAS
H; NO BORR
OWING)
TOTA
L RE
MOVA
L AN
D TO
TAL PR
EESERV
ATION
Removal Only
Inoculation Only
Year
5 Years
10 Years
Outsourced
In Hou
se2014
$2,114,600
$1,057,300
$906,192
$582,552
2015
$2,114,600
$1,057,300
$906,192
$582,552
2016
$2,524,585
$1,262,292
$1,013,220
$651,356
2017
$2,524,585
$1,262,292
$1,013,220
$651,356
2018
$2,524,585
$1,262,292
$1,120,061
$720,039
2019
$1,262,292
$1,120,061
$720,039
2020
$1,480,890
$1,226,083
$788,196
2021
$1,480,890
$1,226,083
$788,196
2022
$1,480,890
$1,331,839
$856,182
2023
$1,480,890
$1,331,839
$856,182
2024
$1,436,300
$923,336
2025
$1,436,300
$923,336
2026
$1,537,821
$988,599
2027
$1,537,821
$988,599
2028
$1,634,115
$1,050,503
2029
$1,634,115
$1,050,503
2030
$1,724,539
$1,108,632
2031
$1,724,539
$1,108,632
2032
$1,812,344
$1,165,079
2033
$1,812,344
$1,165,079
2034
$1,891,190
$1,215,765
2035
$1,891,190
$1,215,765
2036
$1,958,390
$1,258,965
2037
$1,958,390
$1,258,965
2038
$1,993,880
$1,281,780
2039
$1,993,880
$1,281,780
Annu
al Cost
Removal Only
Inoculation Only
Year
5 Years
10 Years
Outsourced
In Hou
se2014
$2,114,600
$1,057,300
$906,192
$582,552
2015
$4,229,200
$2,114,600
$1,812,384
$1,165,104
2016
$6,753,784
$3,376,892
$2,825,604
$1,816,460
2017
$9,278,369
$4,639,184
$3,838,823
$2,467,815
2018
$11,802,953
$5,901,477
$4,958,884
$3,187,854
2019
$7,163,769
$6,078,945
$3,907,893
2020
$8,644,658
$7,305,027
$4,696,089
2021
$10,125,548
$8,531,110
$5,484,285
2022
$11,606,437
$9,862,949
$6,340,467
2023
$13,087,327
$11,194,787
$7,196,649
2024
$12,631,087
$8,119,985
2025
$14,067,387
$9,043,320
2026
$15,605,207
$10,031,919
2027
$17,143,028
$11,020,518
2028
$18,777,143
$12,071,021
2029
$20,411,258
$13,121,523
2030
$22,135,797
$14,230,155
2031
$23,860,335
$15,338,787
2032
$25,672,680
$16,503,866
2033
$27,485,024
$17,668,944
2034
$29,376,214
$18,884,709
2035
$31,267,404
$20,100,474
2036
$33,225,794
$21,359,439
2037
$35,184,184
$22,618,404
2038
$37,178,064
$23,900,184
2039
$39,171,944
$25,181,964
Cumulative Co
st

COST PRO
JECT
IONS FO
R TH
E PR
OPO
SED STRA
TEGY – 5%
PRE
SERV
ATION
Removal Only
Outsourced Inoculation &
In Hou
se Inoculation &
Year
5 Years
10 Years
5 Yr Rem
ov10 Yr R
emov
5 Yr Rem
ov10 Yr R
emov
2014
$2,114,600
$1,057,300
$2,014,970
$1,048,921
$1,985,372
$1,019,324
2015
$2,114,600
$1,057,300
$2,014,970
$1,048,921
$1,985,372
$1,019,324
2016
$2,524,585
$1,262,292
$2,373,863
$1,230,847
$2,342,495
$1,199,479
2017
$2,524,585
$1,262,292
$2,373,863
$1,230,847
$2,342,495
$1,199,479
2018
$2,524,585
$1,262,292
$2,378,775
$1,235,759
$2,345,653
$1,202,637
2019
$1,262,292
$92,743
$1,235,759
$59,620
$1,202,637
2020
$1,480,890
$97,435
$1,446,631
$62,637
$1,411,832
2021
$1,480,890
$97,435
$1,446,631
$62,637
$1,411,832
2022
$1,480,890
$101,631
$1,450,826
$65,334
$1,414,529
2023
$1,480,890
$101,631
$1,450,826
$65,334
$1,414,529
2024
$104,944
$104,944
$67,464
$67,464
2025
$104,944
$104,944
$67,464
$67,464
2026
$107,268
$107,268
$68,958
$68,958
2027
$107,268
$107,268
$68,958
$68,958
2028
$109,151
$109,151
$70,169
$70,169
2029
$109,151
$109,151
$70,169
$70,169
2030
$109,531
$109,531
$70,412
$70,412
2031
$109,531
$109,531
$70,412
$70,412
2032
$107,959
$107,959
$69,402
$69,402
2033
$107,959
$107,959
$69,402
$69,402
2034
$101,088
$101,088
$64,985
$64,985
2035
$101,088
$101,088
$64,985
$64,985
2036
$83,310
$83,310
$53,556
$53,556
2037
$83,310
$83,310
$53,556
$53,556
2038
$47,368
$47,368
$30,451
$30,451
2039
$47,368
$47,368
$30,451
$30,451
Annu
al Cost
Removal Only
Outsourced Inoculation &
In Hou
se Inoculation &
Year
5 Years
10 Years
5 Yr Rem
ov10 Yr R
emov
5 Yr Rem
ov10 Yr R
emov
2014
$2,114,600
$1,057,300
$2,014,970
$1,048,921
$1,985,372
$1,019,324
2015
$4,229,200
$2,114,600
$4,029,939
$2,097,843
$3,970,744
$2,038,648
2016
$6,753,784
$3,376,892
$6,403,802
$3,328,690
$6,313,239
$3,238,127
2017
$9,278,369
$4,639,184
$8,777,666
$4,559,537
$8,655,734
$4,437,605
2018
$11,802,953
$5,901,477
$11,156,441
$5,795,296
$11,001,387
$5,640,242
2019
$7,163,769
$11,249,184
$7,031,055
$11,061,007
$6,842,879
2020
$8,644,658
$11,346,619
$8,477,685
$11,123,644
$8,254,711
2021
$10,125,548
$11,444,054
$9,924,316
$11,186,281
$9,666,543
2022
$11,606,437
$11,545,685
$11,375,142
$11,251,615
$11,081,073
2023
$13,087,327
$11,647,316
$12,825,968
$11,316,950
$12,495,602
2024
$11,752,260
$12,930,912
$11,384,414
$12,563,066
2025
$11,857,204
$13,035,856
$11,451,877
$12,630,530
2026
$11,964,471
$13,143,124
$11,520,835
$12,699,488
2027
$12,071,739
$13,250,391
$11,589,793
$12,768,446
2028
$12,180,890
$13,359,543
$11,659,962
$12,838,614
2029
$12,290,041
$13,468,694
$11,730,130
$12,908,783
2030
$12,399,572
$13,578,224
$11,800,543
$12,979,195
2031
$12,509,102
$13,687,755
$11,870,955
$13,049,608
2032
$12,617,061
$13,795,714
$11,940,358
$13,119,010
2033
$12,725,021
$13,903,673
$12,009,760
$13,188,412
2034
$12,826,109
$14,004,762
$12,074,745
$13,253,398
2035
$12,927,198
$14,105,850
$12,139,731
$13,318,383
2036
$13,010,507
$14,189,160
$12,193,287
$13,371,939
2037
$13,093,817
$14,272,469
$12,246,843
$13,425,496
2038
$13,141,185
$14,319,837
$12,277,294
$13,455,947
2039
$13,188,553
$14,367,206
$12,307,745
$13,486,397
Cumulative Co
st

COST PRO
JECT
IONS FO
R 10% PRE
SERV
ATION
Removal Only
Outsourced Inoculation &
In Hou
se Inoculation &
Year
5 Years
10 Years
5 Yr Rem
ov10 Yr R
emov
5 Yr Rem
ov10 Yr R
emov
2014
$2,114,600
$1,057,300
$1,915,339
$1,040,543
$1,856,144
$981,348
2015
$2,114,600
$1,057,300
$1,915,339
$1,040,543
$1,856,144
$981,348
2016
$2,524,585
$1,262,292
$2,223,142
$1,199,402
$2,160,406
$1,136,665
2017
$2,524,585
$1,262,292
$2,223,142
$1,199,402
$2,160,406
$1,136,665
2018
$2,524,585
$1,262,292
$2,232,966
$1,209,226
$2,166,721
$1,142,981
2019
$1,262,292
$185,485
$1,209,226
$119,240
$1,142,981
2020
$1,480,890
$194,871
$1,412,372
$125,274
$1,342,775
2021
$1,480,890
$194,871
$1,412,372
$125,274
$1,342,775
2022
$1,480,890
$203,262
$1,420,763
$130,668
$1,348,169
2023
$1,480,890
$203,262
$1,420,763
$130,668
$1,348,169
2024
$209,888
$209,888
$134,928
$134,928
2025
$209,888
$209,888
$134,928
$134,928
2026
$214,535
$214,535
$137,916
$137,916
2027
$214,535
$214,535
$137,916
$137,916
2028
$218,302
$218,302
$140,337
$140,337
2029
$218,302
$218,302
$140,337
$140,337
2030
$219,061
$219,061
$140,825
$140,825
2031
$219,061
$219,061
$140,825
$140,825
2032
$215,918
$215,918
$138,805
$138,805
2033
$215,918
$215,918
$138,805
$138,805
2034
$202,177
$202,177
$129,971
$129,971
2035
$202,177
$202,177
$129,971
$129,971
2036
$166,619
$166,619
$107,112
$107,112
2037
$166,619
$166,619
$107,112
$107,112
2038
$94,736
$94,736
$60,902
$60,902
2039
$94,736
$94,736
$60,902
$60,902
Annu
al Cost
Removal Only
Outsourced Inoculation &
In Hou
se Inoculation &
Year
5 Years
10 Years
5 Yr Rem
ov10 Yr R
emov
5 Yr Rem
ov10 Yr R
emov
2014
$2,114,600
$1,057,300
$1,915,339
$1,040,543
$1,856,144
$981,348
2015
$4,229,200
$2,114,600
$3,830,679
$2,081,086
$3,712,288
$1,962,696
2016
$6,753,784
$3,376,892
$6,053,821
$3,280,488
$5,872,694
$3,099,361
2017
$9,278,369
$4,639,184
$8,276,963
$4,479,889
$8,033,100
$4,236,026
2018
$11,802,953
$5,901,477
$10,509,929
$5,689,115
$10,199,821
$5,379,007
2019
$7,163,769
$10,695,414
$6,898,340
$10,319,062
$6,521,988
2020
$8,644,658
$10,890,285
$8,310,712
$10,444,336
$7,864,763
2021
$10,125,548
$11,085,155
$9,723,084
$10,569,610
$9,207,539
2022
$11,606,437
$11,288,417
$11,143,847
$10,700,278
$10,555,708
2023
$13,087,327
$11,491,678
$12,564,610
$10,830,946
$11,903,877
2024
$11,701,566
$12,774,497
$10,965,874
$12,038,805
2025
$11,911,454
$12,984,385
$11,100,802
$12,173,733
2026
$12,125,989
$13,198,921
$11,238,717
$12,311,649
2027
$12,340,525
$13,413,456
$11,376,633
$12,449,564
2028
$12,558,827
$13,631,758
$11,516,970
$12,589,902
2029
$12,777,129
$13,850,061
$11,657,307
$12,730,239
2030
$12,996,190
$14,069,122
$11,798,132
$12,871,064
2031
$13,215,251
$14,288,183
$11,938,957
$13,011,889
2032
$13,431,170
$14,504,101
$12,077,762
$13,150,693
2033
$13,647,088
$14,720,019
$12,216,567
$13,289,498
2034
$13,849,265
$14,922,196
$12,346,538
$13,419,469
2035
$14,051,442
$15,124,373
$12,476,508
$13,549,440
2036
$14,218,061
$15,290,992
$12,583,621
$13,656,552
2037
$14,384,680
$15,457,612
$12,690,733
$13,763,664
2038
$14,479,417
$15,552,348
$12,751,635
$13,824,566
2039
$14,574,153
$15,647,084
$12,812,537
$13,885,468
Cumulative Co
st
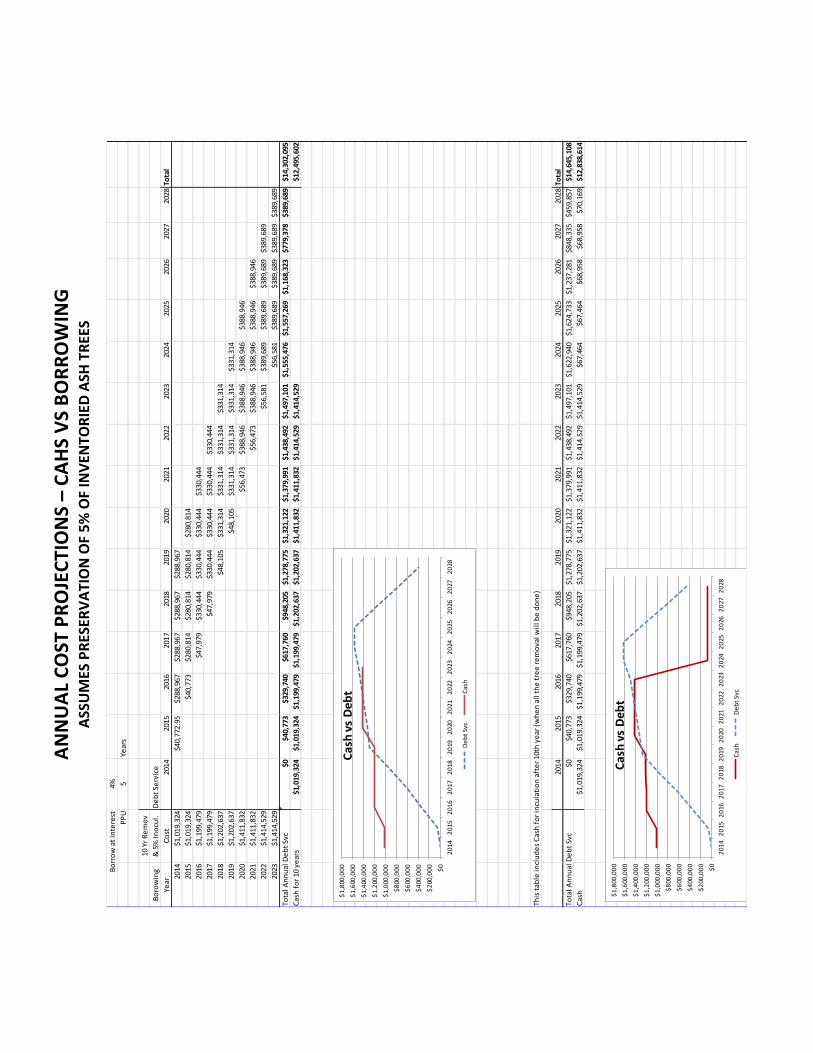
ANNUAL
COST PRO
JECT
IONS – CA
HS VS
BORR
OWING
ASSU
MES PRE
SERV
ATION OF 5%
OF INVE
NTO
RIED
ASH
TRE
ES
Borrow
at Interest
4%PP
U5
Years
10 Yr R
emov
Borowing
& 5% Inocul.
Debt Service
Year
Cost
2014
2015
2016
2017
2018
2019
2020
2021
2022
2023
2024
2025
2026
2027
2028
Total
2014
$1,019,324
$40,772.95
$288,967
$288,967
$288,967
$288,967
2015
$1,019,324
$40,773
$280,814
$280,814
$280,814
$280,814
2016
$1,199,479
$47,979
$330,444
$330,444
$330,444
$330,444
2017
$1,199,479
$47,979
$330,444
$330,444
$330,444
$330,444
2018
$1,202,637
$48,105
$331,314
$331,314
$331,314
$331,314
2019
$1,202,637
$48,105
$331,314
$331,314
$331,314
$331,314
2020
$1,411,832
$56,473
$388,946
$388,946
$388,946
$388,946
2021
$1,411,832
$56,473
$388,946
$388,946
$388,946
$388,946
2022
$1,414,529
$56,581
$389,689
$389,689
$389,689
$389,689
2023
$1,414,529
$56,581
$389,689
$389,689
$389,689
$389,689
Total A
nnual D
ebt Svc
$0$40,773
$329,740
$617,760
$948,205
$1,278,775
$1,321,122
$1,379,991
$1,438,492
$1,497,101
$1,555,476
$1,557,269
$1,168,323
$779,378
$389,689
$14,302,095
Cash fo
r 10 years
$1,019,324
$1,019,324
$1,199,479
$1,199,479
$1,202,637
$1,202,637
$1,411,832
$1,411,832
$1,414,529
$1,414,529
$12,495,602
This table includ
es Cash for inculation after 10th year (w
hen all the
tree
removal will be do
ne)
2014
2015
2016
2017
2018
2019
2020
2021
2022
2023
2024
2025
2026
2027
2028
Total
Total A
nnual D
ebt Svc
$0$40,773
$329,740
$617,760
$948,205
$1,278,775
$1,321,122
$1,379,991
$1,438,492
$1,497,101
$1,622,940
$1,624,733
$1,237,281
$848,335
$459,857
$14,645,108
Cash
$1,019,324
$1,019,324
$1,199,479
$1,199,479
$1,202,637
$1,202,637
$1,411,832
$1,411,832
$1,414,529
$1,414,529
$67,464
$67,464
$68,958
$68,958
$70,169
$12,838,614
$0$2
00,000
$400,000
$600,000
$800,000
$1,000,000
$1,200,000
$1,400,000
$1,600,000
$1,800,000
2014
2015
2016
2017
2018
2019
2020
2021
2022
2023
2024
2025
2026
2027
2028
Cash vs
Deb
t
Debt Svc
Cash
$0$2
00,000
$400,000
$600,000
$800,000
$1,000,000
$1,200,000
$1,400,000
$1,600,000
$1,800,000
2014
2015
2016
2017
2018
2019
2020
2021
2022
2023
2024
2025
2026
2027
2028
Cash vs
Deb
t
Cash
Debt Svc