onia stabilization assisted zirc by high energy ball-...
TRANSCRIPT

Journal of Ceramic Processing Research. Vol. 10, No. 2, pp. 144~147 (2009)
144
J O U R N A L O F
CeramicProcessing Research
Zirconia stabilization assisted by high energy ball- milling
J. Hernández, J. Zárate and G. Rosas*
Instituto de Investigaciones Metalúrgicas, UMSNH Edif. U, Ciudad Universitaria, Morelia, Mich. 58060, MÉXICO
Different zirconia (ZrO2) − x (x = CaO, ZnO mol%) solid solutions have been produced by high energy ball-milling (HEBM).The ZrO2 + oxide powder mixtures were milled for 15 and 25 hours, and thermal experiments were subsequently carried out.Experimental findings demonstrate a relationship of the powders’ morphology and crystal structure with zirconiastabilization. After the different milling times, X-ray diffraction (XRD) studies did not show any sign of zirconia stabilization;however, after thermal experiments total cubic ZrO2-CaO stabilization was obtained. According to the lattice parametermeasurements, solid solutions were formed with the oxides and zirconia powders during the HEBM. These results did notshow zirconia stabilization in the ZnO2 addition case. Both scanning electron microscope (SEM) and XRD structuralobservations indicate greater crystalline structural deformation of the ZrO2-ZnO high energy ball-milled powders incomparison to that of the ZrO2-CaO powders. Furthermore, the behaviors in the lattice parameter values of the ZrO2-CaOsystem showed a tendency toward increasing the monoclinic symmetry of the cell, which could be beneficial in obtaining totalzirconia stabilization (TZS). In the dilatometer and XRD experiments monoclinic (m)→ cubic (c) (CaO) or m→ tetragonal(t) (ZnO) temperature changes for each oxide addition to zirconia were observed.
Key words: High energy ball-milling, Zirconia, Oxides, Stabilization, Shrinkage, Structure.
Introduction
Different synthesis methods to obtain partial (PZS) ortotal (TZS) zirconia stabilization have been explored in thepast [1-8]. In all methods the most notable characteristicsobserved were the homogenous composition and the nano-sized grains. These micro-structural features produce goodPZS or TZS solid solutions. The materials manufacturedby mechanical milling possess both of these characteristics,and the technique improves solubility and promotes specieshomogeneity. The stabilization temperature in the m→ t-ZrO2 transformation depends upon these parameters, andalso upon the quantity of oxide added. Few investigationshave been undertaken with ZrO2 stabilization assisted byhigh energy ball-milling [9-12]. In this paper we reporton the results obtained from the HEBM of ZrO2 with CaOor ZnO powder mixtures, wherein we evaluate the changesin stabilization temperature and cell volume. Theseevaluations were made from the results of dilatometerand XRD experiments. We analyze changes in expansionor contraction rates to determine the decomposition reactionsof the additives, zirconia transitions, and sintering process.
Experimental Procedure
The mechanical milling experiments on the ZrO2-x(x = CaO, ZnO) powder mixtures were performed in a
vibratory ball-mill (SPEX 8000) with silicon nitride vialsand balls in an argon atmosphere. The ball-to-weight ratiowas 3 : 1. The starting material was a commercial powder(Merk) with the following purities: CaO (99.9%), ZnO(99%) and ZrO2 (99.97%). The starting particle size ofthe powder was < 44 μm (−325 mesh). The CaO additionswere 4.5 and 16 mol%. The ZnO additions were 10 and20 mol%. The samples (ZrO2 + oxides) were milled for15 and 25 h. The mechanically-milled powders werecompacted in a steel die 5 cm in length and 1 cm inwidth under an applied pressure of 60 MPa to obtainrectangular samples with a depth of ~5 mm. The greendensity of the compacted material, determined from themass and dimensions, was 55-60% of the theoreticaldensity. The compacted material was thermally treatedin air in a dilatometer (Dilatronic Theta 6548) at aconstant heating rate of 10 K·minute−1 to 1,773 K. Thetendency for sintering was determined from the axialshrinkage of the compacted material. Morphological andstructural characteristics of the powders were observedusing SEM (Jeol 6400) and XRD (Siemens D5000)techniques. Measurements obtained from the dilatometerand thermal analyses (SDT Q600) were carried out todetermine the shrinkage and temperature transformation,respectively. The heating rate used in the differentialscanning calorimetry (DSC) experiments was20 K·minute−1. After thermal analysis, XRD experimentswere carried out and the monoclinic-to-tetragonal zirconiaratio was estimated. The cell volume was also calculatedas a function of the composition of the powder mixture.The least squares refinement method was used to obtainthe lattice parameters measurements.
*Corresponding author: Tel : +52 (443) 322 3500Fax: +52 (443) 316 8355E-mail: [email protected]

Zirconia stabilization assisted by high energy ball- milling 145
Experimental Results
Figs. 1(a) and (b) show the XRD patterns of the ZrO2-CaO (4.5, 16 mol%) and ZrO2-ZnO (10, 20 mol%) powdermixtures respectively for (a) 0, (b) 15 and (c) 20 hoursof ball-milling. The XRD patterns show only thecharacteristic peaks of the ZrO2-monoclinic (m) phase,whose lattice parameters are: a = 0.53129 nm, b =0.52125 nm, c = 0.51471 nm, V = 0.1407 nm3 and β =99.22o, space group P21/a, Z = 4. The most intensereflections correspond to the Miller indices of the planes( ) and ( ). As the milling time and the oxidecontent were increased, the reflection intensities diminishedand the peaks become wider, suggesting finer crystallitesizes and lattice micro-strains. In some XRD patterns avery small ( ) reflection of the ZrO2 tetragonal phasealso appears. These results indicate that under the present
experimental milling conditions the structural transfor-mations, for instance m-t or m-c, are far from complete.
To evaluate the oxide solubility in the monoclinic phase,lattice parameter measurements of the specimens after25 hours of milling were carried out. Table 1 shows latticeparameter (a, b and c) and cell volume (V) values obtainedfor different powder mixtures. The first line valuescorrespond to the ZrO2 powder used as the startingmaterial. After 25 hours of milling (line #2) the cellvolume of the ZrO2 powder exhibits a slight increasedue to a heavy deformation effect and the induction ofinternal stresses. With the ZrO2-oxide samples (lines #3and 4) the cell volumes demonstrated even larger increases.This behavior can be related to the dissolution of Caand Zn ions in the ZrO2, and therefore the formation ofa solid solution. The increment in the cell volume of theZrO2-CaO system is greater than in the ZrO2-ZnO system.Hence, the Ca2+ ionic radius (0.099 nm), which is largerthan the Zn2+ ionic radius (0.074), explains the increasein the ZrO2 monoclinic phase lattice parameters. It isimportant to note that in the ZrO2-CaO system and inthe pure ZrO2 ball-milled sample, the ‘a’, ‘b’ and ‘c’lattice parameter values tend to reduce the symmetryof the monoclinic cell. For example, the ‘a’ parametervalue is decreased while the ‘c’ parameter value isincreased in comparison to their values obtained in testsof the prime material. This parameter behavior couldbe related with cell distortion and Ca dissolution afterball milling, mainly in preferential planar directions inwhich the monoclinic phase is stabilized.
Fig. 2 shows crystal size estimation as a function of
111 111
101
Fig. 1. XRD patterns obtained from (a) ZrO2-CaO and (b) ZrO2-ZnO powder mixtures for different HEBM times.
Table 1. Lattice parameter measurements from different monoclinic-ZrO2 powder mixtures
Experimental system a (nm) b (nm) c (nm) V (cell volume, nm3)
ZrO2 (starting material) 0.53154 0.52116 0.51454 0.14075
ZrO2 (25 h. of milling) 0.53015 0.52174 0.51553 0.14083
ZrO2-20 %M ZnO (25 h) 0.53128 0.52154 0.51533 0.14090
ZrO2-16 % M CaO(25 h) 0.53038 0.52118 0.5154 0.14103
Fig. 2. Crystal size as a function of milling time for differentmolar concentrations in the powder mixtures.
146 J. Hernández, J. Zárate and G. Rosas
milling time for different oxides (CaO and ZnO) addedto ZrO2. These measurements were carried out from the( ) reflection using Sherrer’s method. The crystal sizediminishes with increased milling time and with theoxide (mol%) added to ZrO2. It is important to note thatthe crystal size is slightly larger in the ZrO2-CaO systemthan in the ZrO2-ZnO system. For the specimens after25 hours of milling the crystal size is approximately 14 nmfor ZrO2-CaO 16 mol% and 12 nm for ZrO2-ZnO 20 mol %.
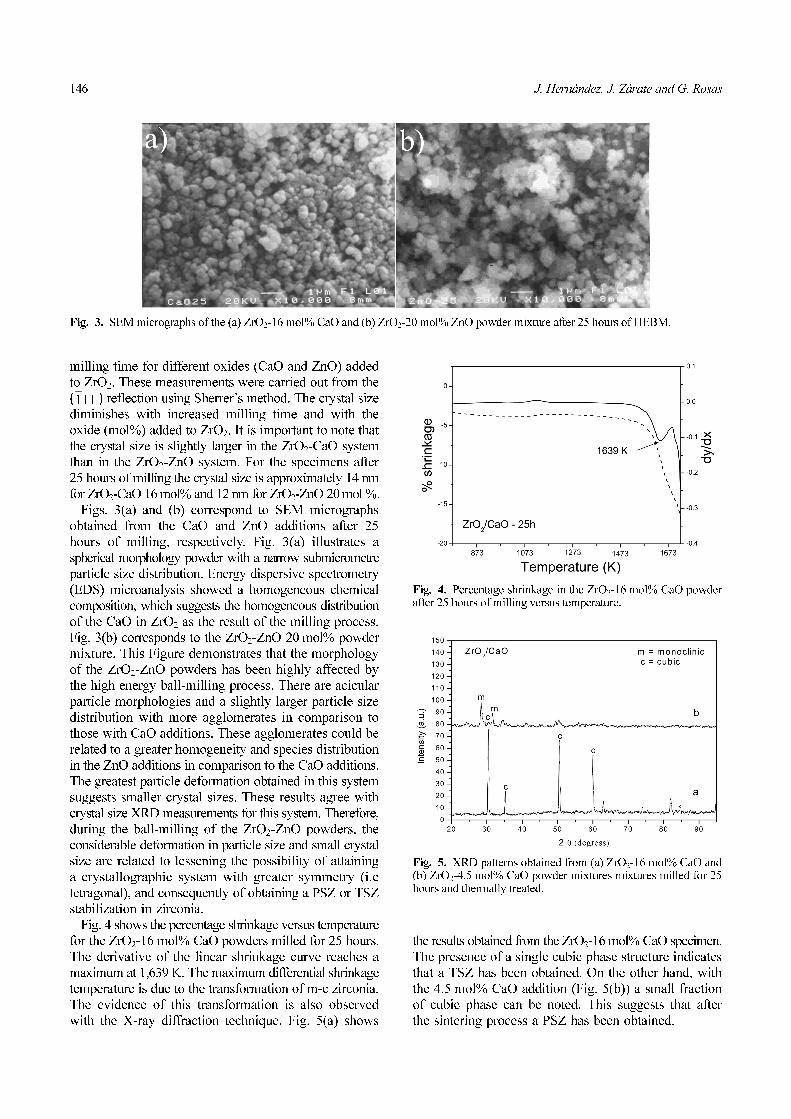
Figs. 3(a) and (b) correspond to SEM micrographsobtained from the CaO and ZnO additions after 25hours of milling, respectively. Fig. 3(a) illustrates aspherical morphology powder with a narrow submicrometreparticle size distribution. Energy dispersive spectrometry(EDS) microanalysis showed a homogeneous chemicalcomposition, which suggests the homogeneous distributionof the CaO in ZrO2 as the result of the milling process.Fig. 3(b) corresponds to the ZrO2-ZnO 20 mol% powdermixture. This Figure demonstrates that the morphologyof the ZrO2-ZnO powders has been highly affected bythe high energy ball-milling process. There are acicularparticle morphologies and a slightly larger particle sizedistribution with more agglomerates in comparison tothose with CaO additions. These agglomerates could berelated to a greater homogeneity and species distributionin the ZnO additions in comparison to the CaO additions.The greatest particle deformation obtained in this systemsuggests smaller crystal sizes. These results agree withcrystal size XRD measurements for this system. Therefore,during the ball-milling of the ZrO2-ZnO powders, theconsiderable deformation in particle size and small crystalsize are related to lessening the possibility of attaininga crystallographic system with greater symmetry (i.etetragonal), and consequently of obtaining a PSZ or TSZstabilization in zirconia.
Fig. 4 shows the percentage shrinkage versus temperaturefor the ZrO2-16 mol% CaO powders milled for 25 hours.
The derivative of the linear shrinkage curve reaches amaximum at 1,639 K. The maximum differential shrinkagetemperature is due to the transformation of m-c zirconia.The evidence of this transformation is also observedwith the X-ray diffraction technique. Fig. 5(a) shows
the results obtained from the ZrO2-16 mol% CaO specimen.The presence of a single cubic phase structure indicatesthat a TSZ has been obtained. On the other hand, withthe 4.5 mol% CaO addition (Fig. 5(b)) a small fractionof cubic phase can be noted. This suggests that afterthe sintering process a PSZ has been obtained.
111
Fig. 3. SEM micrographs of the (a) ZrO2-16 mol% CaO and (b) ZrO2-20 mol% ZnO powder mixture after 25 hours of HEBM.
Fig. 4. Percentage shrinkage in the ZrO2-16 mol% CaO powderafter 25 hours of milling versus temperature.
Fig. 5. XRD patterns obtained from (a) ZrO2-16 mol% CaO and(b) ZrO2-4.5 mol% CaO powder mixtures mixtures milled for 25hours and thermally treated.

Zirconia stabilization assisted by high energy ball- milling 147
Fig. 6 shows the percentage shrinkage versus temperaturefor the ZrO2-20 %mol ZnO powders milled for 25 hours.
The derivative of the linear shrinkage curve reaches amaximum at 1,502 K. A maximum differential shrinkagetemperature due to the transformation of m-t zirconia isobtained. This transformation temperature coincidesapproximately with that of pure zirconia. Figs. 7(a) and (b)correspond to the XRD patterns of the 10% mol ZnOspecimen and the 20% mol ZnO, respectively, after thesintering process. In both patterns only the presence ofthe monoclinic phase can be observed, or in other words,the ZnO does not show signs of zirconia stabilization.
According to these results, after the HEBM the ZrO2-ZnO powder mixtures observed by SEM suffered greaterdeformation than the ZrO2-CaO powder mixtures.Furthermore, the ZrO2-ZnO powder presented smaller
crystal sizes, as seen by XRD. These results suggestgreater crystalline lattice deformation in the ZrO2-ZnOpowder than in the ZrO2-CaO powder. In the CaO additioncase the XRD results showed an increase in the axial‘c’ lattice parameter and a decrease in the ‘a’ latticeparameter. This tendency in the parameter values wasonly in the crystallographic directions, which in themonoclinic phase increased the cell symmetry andconsequently aided in the stabilization of the ZrO2-CaOpowder during the sintering process.
Conclusions
In this study ZrO2-CaO (4.5, 16 mol%) and ZrO2-ZnO(10, 20 mol%) powder mixtures were milled using HEBMand were characterized in XRD, SEM, and dilatometerexperiments. According to the lattice parametermeasurements, solid solutions were formed with theoxides and zirconia powders during the HEBM. Theseresults indicate that it is possible to obtain total ZrO2-CaO stabilization in the cubic phase using HEBM andsintering processes. However, these results did not showsigns of zirconia stabilization in the ZnO2 addition case.Furthermore, these powders (ZrO2-ZnO) presented greaterparticle deformation and a smaller crystal size incomparison to the ZrO2-CaO powders, which was possiblycaused because stabilization was not obtained.
References
1. L. Joo-Sin, P. Jung-il and Ch. Tae-Woon J. Mater. Sci. 31(1996) 2833-2838.
2. G. Dell’Agli and G. Mascolo, J. Mater. Sci. 35[3] (2000)661-665.
3. M.E. Contreras-García, I. Espitia-Cabrera, J. Serrato-Rodríguezand J. Reyes-Gasga, Mater. Res. Bull., 35 (2000) 1171-1186.
4. R. Muccillo, R.C.B. Netto and E.N.S. Muccillo, Mater.Lett., 49[3-4] (2001) 197-201.
5. J. García, P. Quintana, D.H. Aguilar, T. Lopez and R. Gomez,J. Sol-Gel Sci. Techn., 37[3] (2006) 185-188.
6. S.K. Durrani, J. Akhtar, M. Ahmad and M.A. Hussain,Mater. Chem. Phys, 100[2-3] (2006) 324-328.
7. Susanta Kumar Saha and P. Pramanik, Br. Ceram. Trans.94[3] (1995) 123-127.
8. E. Torres-García, G. Rosas, J.A. Ascencio, E. Haro-Poniatowskiand R. Pérez, Appl. Phys. A 79 (2004) 401-406.
9. N.-H. Kwon, G.-H. Kim, H.S. Song and H.-L. Lee, Mater.Sci. & Eng. A299 (2001) 185-194.
10. A.C. Dodd, T. Tsuzuki and P.G. McCormick, Mater. Sci. &Eng. A301 (2001) 54-58.
11. G. Stefanic, S. Music and A. Gajovic, Mater. Res. Bull.,41[4] (2006) 764-777.
12. G.T. Ye and T. Troczynski, J Am Ceram Soc, 90[1] (2007)
287-290.13. A.H. Heuer, N. Claussen, W.M. Kriven and M. Ruhle, J.
Am. Ceram. Soc. 65[12] (1982) 642-650.
Fig. 6. Percentag shrinkage in the ZrO2-20 mol% ZnO powderafter 25 hours of milling versus temperature.
Fig. 7. XRD patterns obtaned from (a) ZrO2-10 mol% ZnO and(b) ZrO2-20 mol% ZnO powder mixtures milled for 25 hours andthermally treated.