one year of sanctions by russia - effect on estonia
TRANSCRIPT

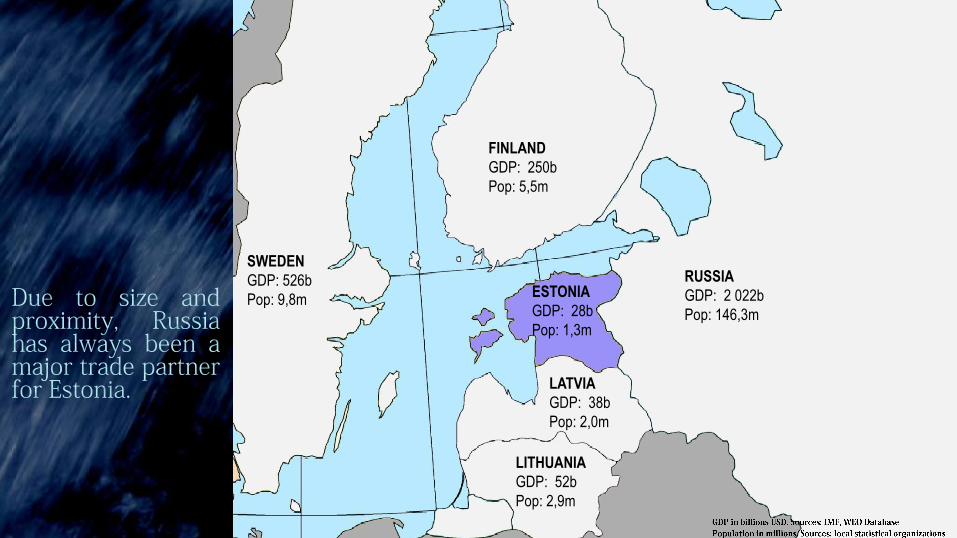
SWEDEN
GDP: 526b
Pop: 9,8m
RUSSIA
GDP: 2 022b
Pop: 146,3m
FINLAND
GDP: 250b
Pop: 5,5m
ESTONIA
GDP: 28b
Pop: 1,3m
LATVIA
GDP: 38b
Pop: 2,0m
LITHUANIA
GDP: 52b
Pop: 2,9m

267
402
605
710
880
601
844
1 312
1 512 1 411
1 187
2004 2005 2006 2007 2008 2009 2010 2011 2012 2013 2014
Estonia’s Export of Goods to Russia in million euros
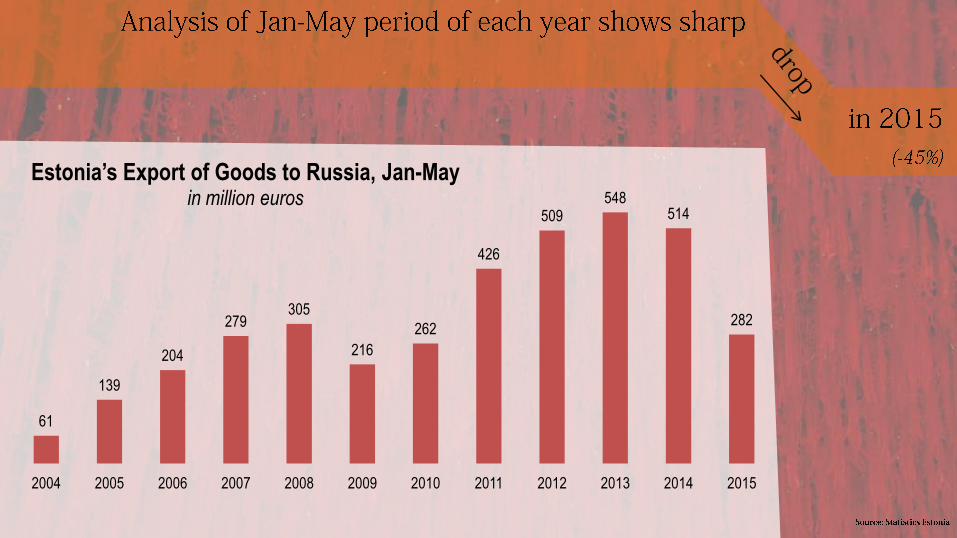
61
139
204
279 305
216
262
426
509 548
514
282
2004 2005 2006 2007 2008 2009 2010 2011 2012 2013 2014 2015
Estonia’s Export of Goods to Russia, Jan-May in million euros

0
10
20
30
40
50
60
70
80
90
EUR vs RUB rate 2011 Jan to 2015 May
2011 2012 2013 2014 2015
0
50
100
150
200
250
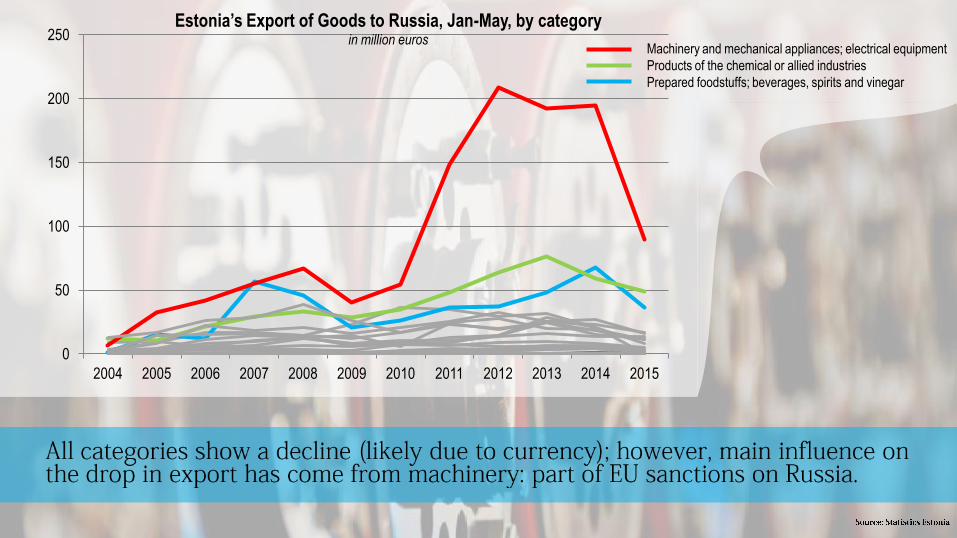
2004 2005 2006 2007 2008 2009 2010 2011 2012 2013 2014 2015
Estonia’s Export of Goods to Russia, Jan-May, by category in million euros
Machinery and mechanical appliances; electrical equipment
Products of the chemical or allied industries
Prepared foodstuffs; beverages, spirits and vinegar

3,4
9,2
16,6 16,6
14,6
22,7
36,6 35,0
29,3
31,8
21,0
0,6
2004 2005 2006 2007 2008 2009 2010 2011 2012 2013 2014 2015
Estonia’s Export of Goods to Russia, Jan-May, by category in million euros
Animal products (Fish, dairy products)

617 755
1 389
1 157
832
597 763
1 265
1 004
787 852
2004 2005 2006 2007 2008 2009 2010 2011 2012 2013 2014
Estonia’s Import of Goods from Russia in million euros
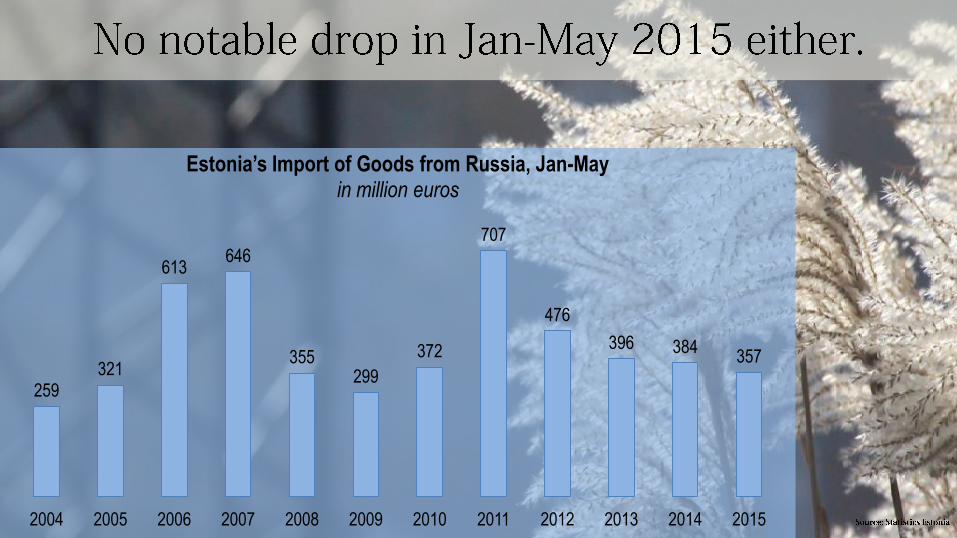
259 321
613 646
355 299
372
707
476
396 384 357
2004 2005 2006 2007 2008 2009 2010 2011 2012 2013 2014 2015
Estonia’s Import of Goods from Russia, Jan-May in million euros
0
100
200
300
400
500
600
700
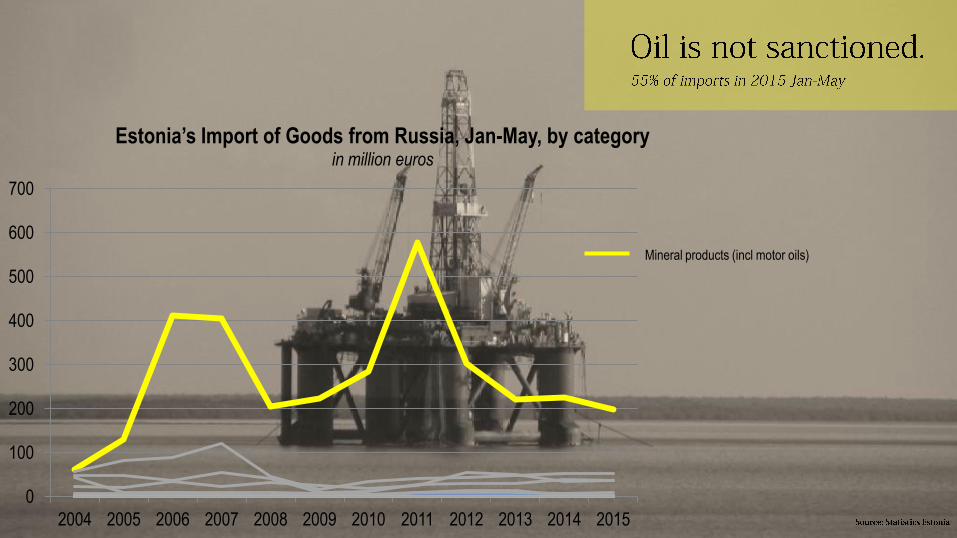
2004 2005 2006 2007 2008 2009 2010 2011 2012 2013 2014 2015
Estonia’s Import of Goods from Russia, Jan-May, by category in million euros
Mineral products (incl motor oils)

There has been a drop in total exports,
but not a noticeable one (-1,4%)
1 825 2 347
3 134 3 327 3 538
2 516
3 184
4 955 5 056 5 297
4 897 4 828
2004 2005 2006 2007 2008 2009 2010 2011 2012 2013 2014 2015
Estonia’s Total Exports, Jan-May in million euros
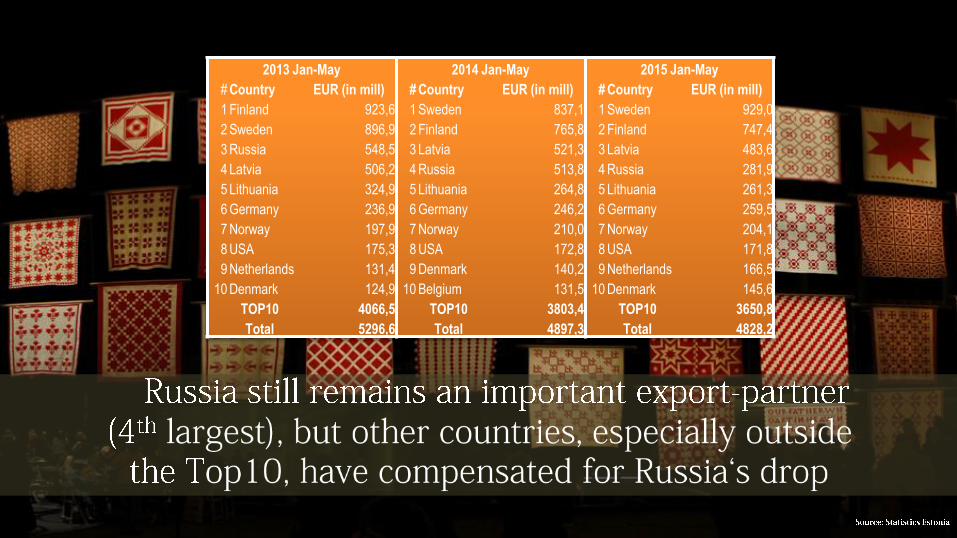
2013 Jan-May 2014 Jan-May 2015 Jan-May
# Country EUR (in mill) # Country EUR (in mill) # Country EUR (in mill)
1 Finland 923,6 1 Sweden 837,1 1 Sweden 929,0
2 Sweden 896,9 2 Finland 765,8 2 Finland 747,4
3 Russia 548,5 3 Latvia 521,3 3 Latvia 483,6
4 Latvia 506,2 4 Russia 513,8 4 Russia 281,9
5 Lithuania 324,9 5 Lithuania 264,8 5 Lithuania 261,3
6 Germany 236,9 6 Germany 246,2 6 Germany 259,5
7 Norway 197,9 7 Norway 210,0 7 Norway 204,1
8 USA 175,3 8 USA 172,8 8 USA 171,8
9 Netherlands 131,4 9 Denmark 140,2 9 Netherlands 166,5
10 Denmark 124,9 10 Belgium 131,5 10 Denmark 145,6
TOP10 4066,5 TOP10 3803,4 TOP10 3650,8
Total 5296,6 Total 4897,3 Total 4828,2
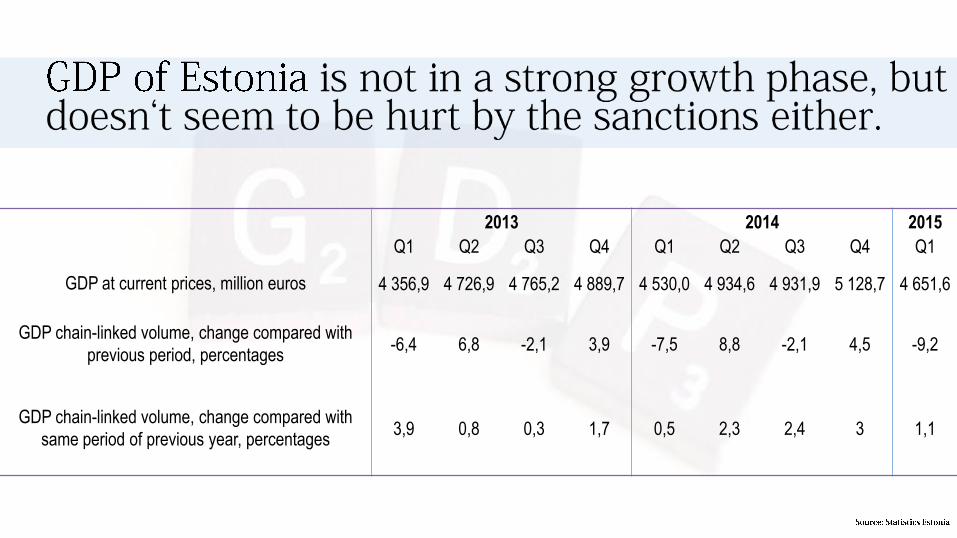
2013 2014 2015
Q1 Q2 Q3 Q4 Q1 Q2 Q3 Q4 Q1
GDP at current prices, million euros 4 356,9 4 726,9 4 765,2 4 889,7 4 530,0 4 934,6 4 931,9 5 128,7 4 651,6
GDP chain-linked volume, change compared with
previous period, percentages -6,4 6,8 -2,1 3,9 -7,5 8,8 -2,1 4,5 -9,2
GDP chain-linked volume, change compared with
same period of previous year, percentages 3,9 0,8 0,3 1,7 0,5 2,3 2,4 3 1,1
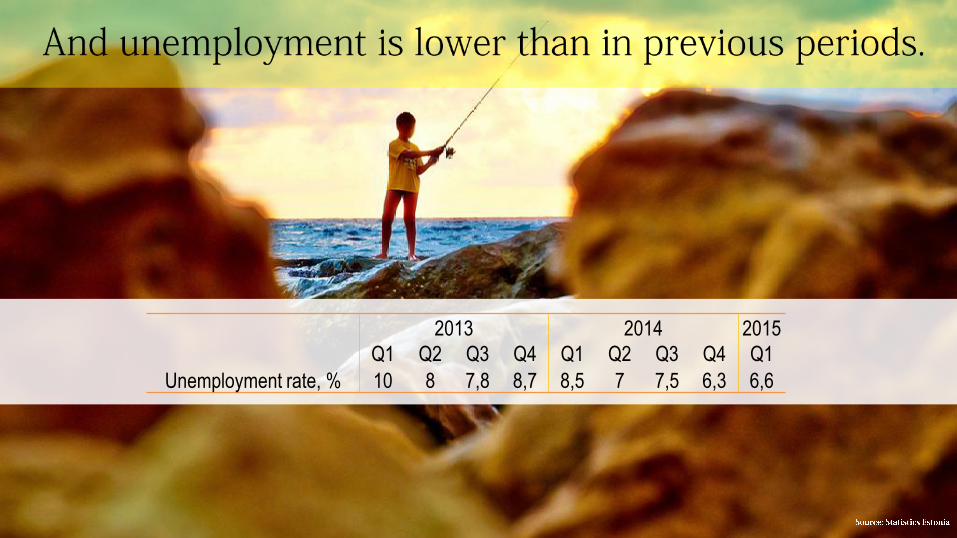
2013 2014 2015
Q1 Q2 Q3 Q4 Q1 Q2 Q3 Q4 Q1
Unemployment rate, % 10 8 7,8 8,7 8,5 7 7,5 6,3 6,6

More of a breeze than a storm.

• Thanks!