one security, many markets: determining the contributions ... · joel hasbrouck* abstract when...
TRANSCRIPT
http://www.jstor.org
One Security, Many Markets: Determining the Contributions to Price DiscoveryAuthor(s): Joel HasbrouckSource: The Journal of Finance, Vol. 50, No. 4 (Sep., 1995), pp. 1175-1199Published by: Blackwell Publishing for the American Finance AssociationStable URL: http://www.jstor.org/stable/2329348Accessed: 10/09/2008 19:00
Your use of the JSTOR archive indicates your acceptance of JSTOR's Terms and Conditions of Use, available at
http://www.jstor.org/page/info/about/policies/terms.jsp. JSTOR's Terms and Conditions of Use provides, in part, that unless
you have obtained prior permission, you may not download an entire issue of a journal or multiple copies of articles, and you
may use content in the JSTOR archive only for your personal, non-commercial use.
Please contact the publisher regarding any further use of this work. Publisher contact information may be obtained at
http://www.jstor.org/action/showPublisher?publisherCode=black.
Each copy of any part of a JSTOR transmission must contain the same copyright notice that appears on the screen or printed
page of such transmission.
JSTOR is a not-for-profit organization founded in 1995 to build trusted digital archives for scholarship. We work with the
scholarly community to preserve their work and the materials they rely upon, and to build a common research platform that
promotes the discovery and use of these resources. For more information about JSTOR, please contact [email protected].

THE JOURNAL OF FINANCE * VOL. L, NO. 4 * SEPTEMBER 1995
One Security, Many Markets: Determining the Contributions to Price Discovery
JOEL HASBROUCK*
ABSTRACT
When homogeneous or closely-linked securities trade in multiple markets, it is often of interest to determine where price discovery (the incorporation of new information) occurs. This article suggests an econometric approach based on an implicit unobserv- able efficient price common to all markets. The information share associated with a particular market is defined as the proportional contribution of that market's inno- vations to the innovation in the common efficient price. Applied to quotes for the thirty Dow stocks, the technique suggests that the preponderance of the price dis- covery takes place at the New York Stock Exchange (NYSE) (a median 92.7 percent information share).
ALTHOUGH MOST OF THE CLASSIC paradigms in market microstructure concern a security that trades in a single centralized market, such situations are becom- ing increasingly rare in practice. Fragmentation, the dispersal of trading in a security to multiple sites, has emerged as a dominant institutional trend. This process is of concern to financial economists and regulators because price information and price discovery (the impounding of new information into the security price), arguably the most important products of a security market, have many attributes of public goods. As the process of fragmentation accel- erates, it may be important to determine where the price information and price discovery are being produced.1 This paper suggests a practical econometric approach to this problem.
The technique is illustrated with an application to U.S. equity markets. Many stocks listed on the New York Stock Exchange (NYSE) trade concur- rently on the regional exchanges and the National Association of Securities Dealers' National Market System (NASD NMS). Since a share of IBM stock is the same security whether purchased on the Midwest or Pacific Exchange, this is a particularly clear instance of multiple markets. Nevertheless, the expres-
* Stern School of Business, New York University. For comments on an earlier draft, I am indebted to the editor, the anonymous referees, Gail Belonsky, Frederick H. deB. Harris, Gautam Kaul, A. Craig MacKinlay, Ananth Madhavan, Terry Marsh, Maureen O'Hara, and presentation audiences at Duke University, University of Iowa, University of Missouri, Washington University, and the American Finance Association. The author is a former Visiting Academic Economist at the New York Stock Exchange. All errors are my own responsibility.
1 Economic and institutional issues related to fragmentation are discussed by Cohen, et al. (1982), Cohen, Conroy, and Maier (1985), Mendelson (1987) and Harris (1993). For current institutional and regulatory perspectives, see Shapiro (1993) and the U.S. Securities and Ex- change Commission's Market 2000 Study (U.S. SEC (1994)).
1175
1176 The Journal of Finance
sion "one security" in the paper's title should be taken broadly, to include securities that may be technically distinct, but are closely linked by arbitrage or short-term equilibrium considerations. Under this definition, a stock and a call option on the stock can be considered one security, as can the index and the index futures contract. In both cases, arbitrage relationships can be used to transform the derivative price into an implicit stock price that may meaning- fully be compared with the actual stock price. As a further example, many empirical microstructure studies of quote behavior use the quote midpoint as a summary measure. It may be useful in some situations to analyze the bid and ask separately, effectively modeling separately the market for buyer-initiated and seller-initiated trades.
This article is not, of course, the first to address such issues. Garbade and Silber (1979) analyze NYSE and regional exchange trading patterns, suggest the terminology "dominant" and "satellite" markets, and conclude that the regional exchanges are "satellites, but not pure satellites". Later studies fo- cusing on multiple trading in equities include Harris et al., (1995) (U.S.), Roell (1992) (Paris and London), Pallmann (1992) (Germany) and Grunbichler, Longstaff, and Schwartz (1994) (Germany), and Kleidon and Werner (1993) (cross-traded U.K./U.S. equities). Garbade, Pomrenze, and Silber (1979) exam- ine multiple dealer quotes in the GNMA pass-through market.
Garbade and Silber (1982) analyze commodity futures and spot markets, concluding that "about 75 percent of new information [is] incorporated first in future prices." With the advent of financial futures, questions of price discov- ery in futures and spot markets gained renewed urgency. Articles describing the links between stock and stock index futures markets include Finnerty and Park (1987), Ng (1987), Kawaller, Koch, and Koch (1987), Harris (1989), Stoll and Whaley (1990), and Chan (1992). Other equity derivative products have attracted attention as well. The links between stock and option markets have been studied by Manaster and Rendelman (1982), Bhattacharya (1987), Stephan and Whaley (1990), Vijh (1990), Damodaran and Lim (1991), John, Koticha, and Subrahmanyam (1991), and Easley, O'Hara, and Srinivas (1993).
From a broad statistical viewpoint, these articles exhibit two different ap- proaches to the problem of modeling multiple markets. Garbade and Silber (1979, 1982) assume that the prices in the diverse markets share a common implicit efficient price. Actual transaction prices are determined by a bid-ask spread component or an autoregressive adjustment component. An appealing characteristic of a common implicit efficient price is that it supports the economic intuition that, subject to transaction cost bounds, the securities traded in different markets are linked by arbitrage or short-term equilibrium considerations. On the other hand, one may assume that it was not immedi- ately obvious how these models might have been generalized to handle the diversity of microstructure effects that began to attract-attention shortly after these papers appeared.
Accordingly, most of the empirical studies subsequent to Garbade and Sil- ber, particularly in index futures/cash analysis, use "lead-lag" return regres- sions. These are paired univariate specifications in which one return is re-

Determining the Contributions to Price Discovery 1177
gressed against leads and lags of the other, e.g., stock index return against leads and lags of the cash index return, accompanied by the cash index return against leads and lags of the stock index return. The coefficients on the leads and lags are used to support rough statements about temporal precedence. These applications (at least in the area of stock index cash and futures markets) often support reasonable conclusions (futures markets lead the cash). This paper notes that from an econometric viewpoint, however, such models are generally misspecified in that convergent representations are assumed in situations where it can be proven that no such representations exist.
The techniques discussed in this article return to the Garbade and Silber approach in the presumption of a common implicit efficient price. Beyond this, however, only a minimal structure is imposed on the dynamics of the prices in multiple markets. The present approach thus achieves most of the functional generality of the lead-lag regression approach. Hasbrouck (199Ib) assumes that a single observed security price impounds an implicit efficient price, and attributes the sources of variation in this efficient price to trades and (in Hasbrouck (1993b)) orders. The present piece can be viewed as a multiple market extension in which the implicit efficient price is common to all markets, and the sources of variation in this efficient price are attributed to different markets. Price discovery in this framework refers to innovations in the effi- cient price. A market's contribution to price discovery is its information share, defined as the proportion of the efficient price innovation variance that can be attributed to that market.
The econometric approach that constrains multiple price series to share a common component relies on cointegration. Cointegration refers to the feature that while two price series (such as the prices of IBM stock on the Midwest and Pacific Exchanges) may be nonstationary, they do not diverge without bound from each other. Cointegration is typically studied in aggregate macroeco- nomic data. However, Bossaerts (1988) examines cointegration in a panel study of monthly stock returns over a long sample (1926 to 1984). Closer to the present study, Harris et al. (1995) discuss cointegration in stock transactions data. The focus in the Harris paper is on specification and estimation of an error correction mechanism for IBM transaction prices. The results are consistent with a rejection of the null hypothesis that off-NYSE trading activ- ity does not affect price determination on the NYSE. In contrast, by focusing on the common factor (implicit efficient price) implied by cointegration, the present paper seeks to provide a richer characterization of the price discovery contributions.
This article is organized as follows. Section I discusses a simple microstruc- ture model that illustrates the basic principles of the analysis. A more general and formal statement of the cointegrated microstructure models follows in Section II. Section III defines the information share measure. The remainder of the article presents an application. Section IV discusses the institutional and economic considerations relating to trading of U.S. equities on and away from the NYSE. Section V presents the results of the estimations. A brief summary concludes the article in section VI.

1178 The Journal of Finance
I. Cointegration in Microstructure Models: Basic Principles
The principles of the analysis in this paper can be developed using a simple microstructure model. Suppose that a security is traded in two separate markets, and that the evolution and linkage of the prices in the markets are given as:
Pit Pi,t-i + Wt (1)
P2,t P1,t-2 + Et
where the p 1 t and P2, t are price variables such as actual transaction prices or quotes (the bid or offer quote or a quote midpoint). The wt and Et are zero-mean disturbances that are also independently and identically distributed and un- correlated. The price in the first market follows a random-walk with increment wt. The second price tracks the first price lagged two periods (perhaps due to transmission delay) and also reflects a random error (perhaps due to random liquidity demands).
Although both prices are integrated (and are therefore nonstationary), it is also apparent that the two prices will never wander very far from each other. The difference between the two prices is:
P1,t - P2,t = P1,t - (Pl,t-2 + Et) = Wt + Wt-1 - Et, (2)
which is a stationary random variable. When a linear combination of inte- grated variables is stationary, the variables are said to be cointegrated. Text- book-level discussions of cointegration are found in Banerjee et al. (1994), Campbell and Perron (1991), Hamilton (1994), Lutkepohl (1993), and Watson (1994).
There are many alternative forms of the model (1). It is useful to first consider representations that are useful for interpretation, and then turn to representations that are convenient for estimation. The vector moving average (VMA) representation for price changes expresses price changes exclusively in terms of current and lagged innovations:
w~l~t= Wt(3)
AP2,t =APt-2 + Et - Et-l = Wt-2 + Et-l- Et-l
That the two prices share a common long-term component can be seen in what Stock and Watson (1988) term the common trends representation. By inte- grating equation (1) and rearranging,
pit = P2,0 ? ( )w
P 2,t = P 2,0 + E Ws + (-Wt - Wt-1 + Et)

Determining the Contributions to Price Discovery 1179
That is, both price series can be viewed as the sum of an initial value, a common random-walk term, and a stationary term. In the present application, this representation is particularly useful because the random-walk component of a security price may (with additional structure) be viewed as the implicit efficient price. The information share measure proposed in this article is a calculation that attributes the source of variation in the random-walk compo- nent to the innovations in the various markets. In this simple model, all of the random-walk variation arises in the first market.
Other representations of the model are useful for estimation. Before consid- ering valid models, however, it is useful to examine one that is generally invalid. Lead-lag effects between related price series are commonly assessed using autoregressions of the price changes. When cointegration is present, this is not appropriate. Such estimations can easily mislead. Application of recur- sive substitution in equation (3) shows that the representation for the second price change is:
AP2,t= APlt-2 + 'St t-
= APlJt-2 AP2,t-1 + APl,t-3 - 6t-2 + Et
=APt-2 AP2,t-1 + AP1,t-3 - AP2,t-2 + APt-4 6t-3 + Et (5)
Clearly, this does not converge: a correct specification would involve infinite lags. The econometrician's predicament is rendered all the more difficult, however, by the fact that finite-lag autoregressions are likely to appear well- behaved, with coefficients that decline in an attractive and plausible manner. With Var(wt) = Var(st) = 1, for example, the linear projection coefficients in a fourth-lag regression are:
E*1AP2,t1 AP1,t-17 . . . , API,t-47AP2,t-1, * * ,AP2,t-4]
= -0.722AP2,t1 ? l.OAPit-2 - 0.444AP2,t-2 + 0.722Aplt-3
- 0.167AP2,t-3 + 0.444APl,t-4 - 0.056AP2,t4 (6)
where E* denotes linear expectation. The consequences of proceeding further depend on the purpose of the analysis. From either equation (1) or (3) it is apparent that in the true model, the lag with which the first market influences the second is no greater than two. The trailing coefficient patterns in the misspecified model, however, suggest a much longer lag (and presumably a more egregious inefficiency in information transmission). An econometrician desiring a more precise characterization of the information transmission may be inclined to invert the misspecified estimated regression to obtain an inno- vations representation analogous to equation (3). Engle and Granger (1987) note that such a calculation is likely to be highly sensitive to numerical instabilities.

1180 The Journal of Finance
An alternative representation of the model that is valid and is also amenable to estimation is the so-called error correction model. One such representation is:
(7)
P2,t = (Pit-1 - P2,t-1) - P1t-1 + Qt
This may be conveniently estimated by including the term in parentheses as a single explanatory variable. The terminology reflects an economic explanation for the cointegration (see Davidson et al (1978)). Hypothetically, traders in the second market are responding to the price discrepancy ("error"). This interpre- tation belongs, however, to the realm of economic interpretation. It does not arise from the statistical model. There are infinitely many error-correction representa- tions. Another possibility ("agents react to the error lagged two periods") is:
AP2,t = (P1t-2 - P2,t-2) - AP2,t-I + -t, (8)
where the equation for the first price is as before. It is not even necessary that the error correction term be constructed from contemporaneous prices, as a third possibility is
\P2,t = (P1,t-2 - P2,t-1) + et. (9)
("Traders in the second market are reacting to the relative price in the first market observed with a one-period delay.") It may easily be verified, however that these different error correction specifications lead to the same VMA representation (3). Thus any preference for one over another must be based on economic considerations external to the data.
This simple model exhibits the feature that prices in two different markets were driven in a fundamental sense by one market. The key results in this case are that the different prices series may be viewed as sharing a common random-walk component and that a vector autoregression specification for the first differences does not exist. Multiple error correction models do exist, however. Any one of these may be used to consistently estimate the model. The next section summarizes these results in a more general setting.
II. Cointegration in Microstructure Models: Formal Summary
There are assumed to be n price variables closely related to a single security, such as transaction prices in n markets, or bid and offer quotes in n /2 markets. These are collected in an (n x 1) column vector pt. Each price series is assumed to be integrated of order one, i.e., contains a random-walk component. The price changes are assumed to be covariance stationary. This implies that they may be expressed as the vector moving average (VMA):
Apt = 4(L)et (10)

Determining the Contributions to Price Discovery 1181
where et is a zero-mean vector of serially uncorrelated disturbances with covariance matrix fQ, and T is a polynomial in the lag operator.
Although each price is nonstationary, the difference between any two prices is stationary. Formally this implies that the prices are cointegrated of order n - 1: the n - 1 variables defined by 13pt are stationary, where f3(n-l)Xn
[L(n1) - I(n -)]7 I(n1-) is an identity matrix and L(n-1) is a column unit vector. The requirement that 13'Pt is stationary implies f3'T(1) = 0, where T(1) is the
sum of the moving average coefficients. Given the structure of (3, this implies that all of the rows of T(1) are identical. Intuitively, T(l)et constitutes the long-run impact of a disturbance on each of the prices. That the rows are identical implies that this long-run impact is the same for all prices. This result is closely related to the common trends representation of a cointegrated system suggested by Stock and Watson (1988). Letting ql denote the common row vector in T(1), the common trends representation implies in the present instance that the price levels may be written as:
Pt =Po + qi(X es t + ? *(L)et (11)
where po is a constant n-vector and T*(L) is a matrix polynomial in the lag operator.
The first term on the right-hand-side of equation (11) is a vector of initial values that may reflect nonstochastic differences between the price variables. If the price vector includes bid and offer quotes, for example, the difference between the corresponding terms in Po will reflect the average spread. The second term in equation (11) is the product of a scalar random walk and a unit vector. This term captures the random-walk component that is common to all prices. The third component is a zero-mean covariance stationary process.
Suppose that there exists a nonstationary autoregressive representation of order K for the price levels:
A(L)pt = K + et, (12)
where A(L) = I - A1L - A2L - ... - AKLK. Then by the Granger Representation Theorem (Engle and Granger (1987)) there exists an error correction model (ECM) of the form:
'APt = a(3'pt-1 - Ef'pt) + F1Apt-, + F2Apt2 + **+ FK-lAPt-K+l + et (13)
The correspondence between the ECM and the level VAR is given by
K
ac3'= -A(1) and Fj= - E Ai for j = 1, ,K- 1. i=j+1
1182 The Journal of Finance
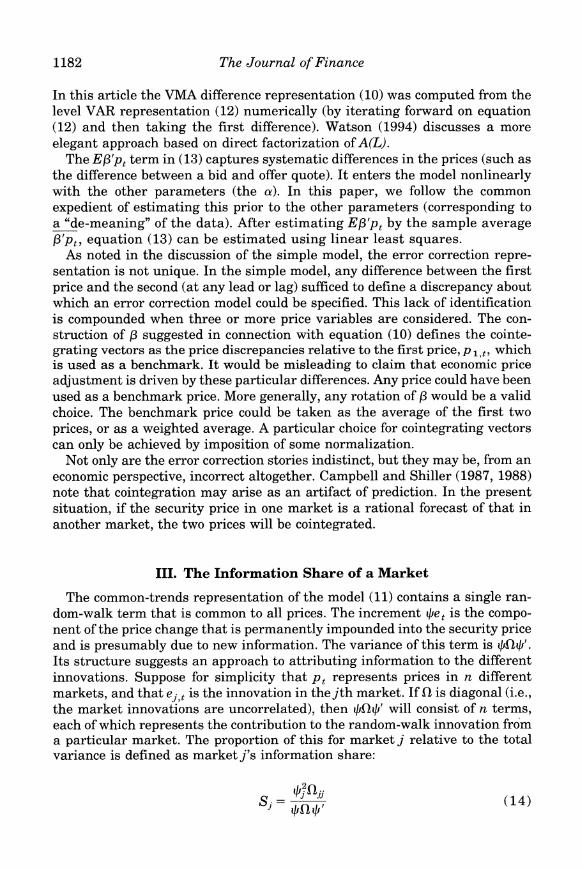
In this article the VVIA difference representation (10) was computed from the level VAR representation (12) numerically (by iterating forward on equation (12) and then taking the first difference). Watson (1994) discusses a more elegant approach based on direct factorization of A(L).
The Ef3'pt term in (13) captures systematic differences in the prices (such as the difference between a bid and offer quote). It enters the model nonlinearly with the other parameters (the a). In this paper, we follow the common expedient of estimating this prior to the other parameters (corresponding to a "de-meaning" of the data). After estimating Ef'pt by the sample average f3'pt, equation (13) can be estimated using linear least squares.
As noted in the discussion of the simple model, the error correction repre- sentation is not unique. In the simple model, any difference between the first price and the second (at any lead or lag) sufficed to define a discrepancy about which an error correction model could be specified. This lack of identification is compounded when three or more price variables are considered. The con- struction of ,3 suggested in connection with equation (10) defines the cointe- grating vectors as the price discrepancies relative to the first price, p 1,t, which is used as a benchmark. It would be misleading to claim that economic price adjustment is driven by these particular differences. Any price could have been used as a benchmark price. More generally, any rotation of f3 would be a valid choice. The benchmark price could be taken as the average of the first two prices, or as a weighted average. A particular choice for cointegrating vectors can only be achieved by imposition of some normalization.
Not only are the error correction stories indistinct, but they may be, from an economic perspective, incorrect altogether. Campbell and Shiller (1987, 1988) note that cointegration may arise as an artifact of prediction. In the present situation, if the security price in one market is a rational forecast of that in another market, the two prices will be cointegrated.
III. The Information Share of a Market
The common-trends representation of the model (11) contains a single ran- dom-walk term that is common to all prices. The increment 4Set is the compo- nent of the price change that is permanently impounded into the security price and is presumably due to new information. The variance of this term is tAlQiU'. Its structure suggests an approach to attributing information to the different innovations. Suppose for simplicity that pt represents prices in n different markets, and that ej t is the innovation in the jth market. If fl is diagonal (i.e., the market innovations are uncorrelated), then qfth' will consist of n terms, each of which represents the contribution to the random-walk innovation from a particular market. The proportion of this for market j relative to the total variance is defined as market j's information share:
Si = . ,t1i>, (14)

Determining the Contributions to Price Discovery 1183
where QA is the jth element of tf. The normalization ensures that the informa- tion shares sum to unity.
If the price innovations are correlated across markets, however, then ft will not be diagonal, and this simple resolution will not be appropriate. There are two steps that can be taken to minimize the correlation and to bound the effects of the correlation. In the first place, most of the contemporaneous correlation in practical applications will be due to time aggregation. In prac- tice, market prices usually change sequentially: a new price is posted in one market, and then the other markets respond. If the observation interval is so long that the sequencing cannot be determined, however, the initial change and the response will appear to be contemporaneous. Therefore, one obvious way of minimizing the correlation is to shorten the interval of observation. The specifications in this paper are estimated with one-second sampling intervals.
Shortening the observation interval is not always practical, however. In any event, it will only lessen but not eliminate the contemporaneous correlation. (Even with a one-second frequency of observation, two markets may report simultaneous price changes.) At this juncture, while no unique values may be found for the information shares, triangularization of the covariance matrix may be used to establish upper and lower bounds. This approach is closely related to the standard treatment of the prediction error variance decom- position (see Hamilton (1994), pp. 318-336). A summary of the technique follows.
Let the innovations in the n market prices be given by the factor structure:
et = Fzt (15)
where zt is an (n X 1) vector of random variables with Ezt = 0 and Var(zt) = I, and F is the Cholesky factorization of fl (the lower triangular matrix such that ?1 = FF'). The lower triangular structure of F implies that the random variate zit may be interpreted as the normalized residual in the regression of eit on {elt, e2,t, * *, - 1,t). That is, zit is the (normalized) component of e t that is orthogonal to the innovations that precede it in the ordering.
The market-share of the innovation variance attributable to zj may be computed as:
([qiFIj) 2 (16)
where [tfFlj is thejth element of the row matrix qiF. The factorization imposes a hierarchy that maximizes the information share on the first price and minimizes the information share on the last price. An upper bound for a market's information share may be obtained by permuting if and fl to place that market's price first. A lower bound may be obtained by permuting to place that market's price last. Use of the Cholesky factorization in this fashion is analogous to the process of allocating the explained variance in a multiple

1184 The Journal of Finance
regression by considering the incremental improvement in the R2 associated with adding the variables in sequence.
In principle an asymptotic standard error for the information share can be computed from the distribution of the estimated VAR parameters (either by linearization or Monte Carlo simulation). The information share, however, is a nonlinear function of the VAR coefficients and the disturbance covariance matrix. The distribution of the latter is difficult to obtain in the present situation. Accordingly, this paper will adopt the simpler route of addressing the issue of statistical significance by consideration of cross-sectional esti- mates of the information share and related measures.
It is worth emphasizing that the information share proposed here is based on the common permanent component of all the market prices. That part of a market's innovation that helps forecast only transient price disturbances (such as uninformative bid-ask bounce or reporting errors) is effectively ignored.
The information share is a relative measure that allocates information to the different markets. The implicit efficient price is a statistical construct based on small subset of market information. Absent economic informational efficiency arguments, there is no presumption that the implicit efficient price would fully reflect, say, the information in recent financial statements. Thus, nothing in this approach measures in any absolute sense the total information that is impounded in prices.
Nor does the model attempt to determine which market has the "best" prices. Intuitively, the information share measures "who moves first" in the process of price adjustment. A market could conceivably have an information share of 100 percent, and yet have the widest spreads and the slowest lagged adjust- ment of prices. If the innovations in this market drive the reactions in the other markets with narrower spreads and faster adjustments, then it is (informa- tionally, at least) dominant.2 This feature may be important in some applica- tions because the spread is generally assumed to depend positively on the information content of an incoming trade. The most informative market may therefore exhibit the widest spreads.
The information share can easily be extended to more complex models. If the price vector contains several prices from one market (such as a bid and ask quote), the information share may be computed by cumulating the information shares of all prices for that market. If the model is extended to include nonprice variables, such as trades and orders, the structure of the VAR must be changed. However, an information share for a market can still be computed by cumulating the variance contribution over all the variables pertaining to that market.
2 Nevertheless, if the pt are actual transaction prices, it may be interesting to determine which market's prices track the efficient price most closely. This problem is considered for a single market in Hasbrouck (1993a). Most of this could easily be generalized to the multiple market situation. Hasbrouck (1993a) contains a lower bound result on the variance of the stationary component in equation (1). A related result is given in Eckbo and Liu (1993).

Determining the Contributions to Price Discovery 1185
IV. Stocks Trading in Multiple Markets: The NYSE and its Competitors
This section examines the dynamic behavior of prices on the New York and regional stock exchanges. As noted in the introduction, this issue was first addressed in Garbade and Silber (1979), but has gained new currency due to recent trends in fragmentation. Shapiro (1993) notes that an increasing vol- ume of trading in NYSE-listed equities has moved from the NYSE to alterna- tive market centers. Besides the U.S. regional exchanges, these alternatives include Nasdaq, orders crossed in-house by the broker (in accordance with the provisions of NYSE Rule 390), and so-called "fourth-market" trades (those not facilitated by a broker, such as the POSIT crossing system). These venues reflect diverse market structures and regulatory constraints. This has engen- dered debate in regulatory circles concerning the desirability of a central market and the extent to which regulation can and should promote this outcome (U.S. SEC (1994)).
While it is beyond the scope of this paper to lay out this debate in full detail, it is useful to point out the critical role played by price discovery. It is generally acknowledged that it is relatively expensive for a market to provide a price discovery mechanism: balancing supply and demand in an orderly fashion requires procedural safeguards that are costly to provide. In contrast, once a price has been determined and publicized, it is relatively cheap to provide order matching or crossing functions that simply pair off buyers and sellers at that price. The latter so-called "derivative" markets are in part appropriating the informational value of the price determined in the primary market.3
There may be, according to this view, an implicit market failure in that the cost of producing the information in a market price may not be recovered from the revenues associated with selling this price information. (See Mulherin, Netter, and Overdahl (1990, 1991).) The costs of trading in a market are distributed primarily over the agents transacting in that market. Thus, if one were to find generally close agreement between a market's shares of trading activity and provision of price discovery, one would be inclined to conclude that the costs of price discovery were being born in a proportionate fashion across markets. A finding of gross discrepancies between market share and provision of price discovery would suggest the opposite.
The NYSE and the regional exchanges are electronically linked in that all quotes and trades are disseminated by a central transmission authority (the Consolidated Tape Association). Thus, a trader who subscribes to the quotes receives those from all exchanges. In addition, the exchanges are linked via the Intermarket Trading System (ITS), which provides a direct communication for orders and messages between the market makers at different exchanges. Trade-throughs (executions of orders at prices inferior to a quote advertised
3 The term "derivative market" is in common industry use to denote a market in which prices are determined by observation of other markets. This usage is distinct from the meaning "deriv- ative security," in the sense of options, futures, etc.

1186 The Journal of Finance
Table I
An Illustration of Autoquote Mechanisms: Allied Signal on August 8, 1993
Table I reports the bid and offer quotes (in dollars per share) surrounding a New York Stock Exchange (NYSE) quote change that resulted from a clerical or technical error (at 15:59:28). The exchange codes are: N (NYSE), M (Midwest/ Chicago), B (Boston), X (Philadelphia), C (Cincinnati). The sizes are the number of shares (in 100-share round lots) at the bid and offer. The data are taken from the NYSE's Trade and Quote (TAQ) data set.
Time Bid Offer Exch Size
15:53:39 73.625 73.875 N 50 X 15 15:53:41 73.625 73.875 M 1 X 1 15:53:43 73.500 74.000 B 1 X 1 15:53:46 73.500 74.000 X 1 X 1 15:53:50 73.625 74.000 C 5 X 1 15:58:45 73.625 73.875 N 50 X 50 15:58:47 73.625 73.875 M 1 X 1 15:59:28 100.375 102.000 N 50 x 50 15:59:31 100.375 102.000 M 1 x 1 15:59:32 100.250 102.125 X 1 X 1 15:59:59 73.625 73.875 N 50 X 50 16:00:02 73.625 73.875 M 1 x 1 16:00:04 73.500 74.000 X 1 X 1 16:01:51 73.625 73.875 N 50 X 50 16:01:54 73.500 74.000 X 1 X 1 16:02:10 73.625 74.000 C 5 x 2
anywhere on the ITS) are expressly prohibited.4 Hasbrouck, Sofianos, and Sosebee (1993) discuss these and other institutional details.
Exchanges can and do compete for the incoming order flow by posting aggressive quotes. However, brokers direct a significant portion of the order flow to particular exchanges in return for payments and other inducements. An order received at an exchange need not be directed to the one with the best quote. The receiving market may execute the order as long as the execution price is not inferior to the best posted quote. Although the regional exchanges sometimes establish the best bid or offer, the usual practice is to post quotes that are slightly inferior and execute incoming orders at the best bid or offer. The mechanisms by which the regional quotes default to the best system quotes, widened by a small amount, are generally known as "autoquote" procedures.
Autoquote adjustments are rapid, generally on the order of several seconds. As an example, Table I presents the sequence of quote changes for Allied Signal near the close of trading on August 8, 1993. Prior to the close, the quotes and transaction prices were in the neighborhood of $74. At 15:59:28 the NYSE specialist posted a bid and offer of over $100, presumably in error. The
4 Quotes for 100 shares or less, however, are not protected against trade-throughs.

Determining the Contributions to Price Discovery 1187
Midwest Exchange matches the NYSE quote within three seconds; the Philadelphia specialist brackets the NYSE quote within four seconds. Moments later, when the NYSE specialist corrects the quote, the Midwest and Philadelphia Exchanges react with similar celerity.
This study considers the thirty stocks in the Dow Jones Industrial Average for the three-month period August through October, 1993. The Dow stocks were used because most off-NYSE trading venues concentrate on large capi- talization stocks. It is for these stocks that competition for order flow between exchanges is particularly intense. Trade and quote data for these stocks were taken from the NYSE's Trade and Quote (TAQ) database. (August 1993 is the first month for which the database contains market-maker identification in the quote file.) The trade data reflect all transactions reported to the consolidated tape. This includes most domestic U.S. transactions such as Instinet and POSIT, but exclude overseas trades such as those occurring in the London "fax market."
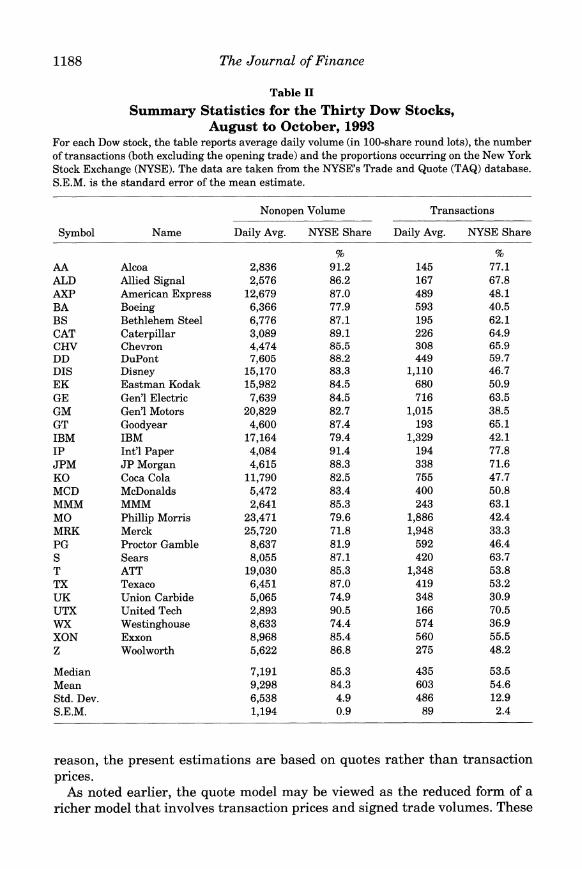
NYSE market shares by volume and transactions for the thirty Dow stocks are reported in Table II. Opening volume is excluded from these calculations on the grounds that the time series analysis will be applied to the continuous trading session only. Furthermore, the opening trade is almost invariably located in New York, probably more for reasons of custom than competition. Table II shows that although the NYSE generally accounts for most of the trades and volume, its dominance is far from total. That the NYSE's market share by volume is larger than that by transaction suggests that more smaller trades are taking place away from the NYSE.
This is confirmed by Table III which presents trading volume market share statistics for different transaction sizes. The NYSE's market share is particu- larly low for transaction sizes of 500 or fewer shares. In fact, for 18 of the 30 stocks, this share is under 50 percent. On the other hand, the NYSE's domi- nance at the high end is fairly uniform. For only four of the stocks is this share less than 90 percent.
Table IV presents time-weighted average spreads and related statistics. The NYSE generally, but not always, exhibits the lowest average spread. The "away" values in the fourth and fifth column of the table summarize the av- erage distances by which the best non-NYSE bid and offer are worse than the NYSE quotes. Negative values indicate that the best non-NYSE quote betters (on average) the NYSE quote. There is a generally tendency for the distance on the offer side to be smaller than that on the bid side. That is, off-NYSE market makers are more aggressive on the offer side of the market, perhaps in reflection of smaller exposure to positive information.
In computing the information share measures suggested in this paper, modeling centers on the bid and offer quotes. An analysis of an individual stock trading in multiple markets, if based on last sale prices, would labor under problems of autocorrelation induced by infrequent trading. In particular, a market that happened to have relatively infrequent trades would tend to have last-sale prices that were most obsolete, and therefore least informative. Quotes, on the other hand, can be updated in the absence of trades. For this
1188 The Journal of Finance
Table II
Summary Statistics for the Thirty Dow Stocks, August to October, 1993
For each Dow stock, the table reports average daily volume (in 100-share round lots), the number of transactions (both excluding the opening trade) and the proportions occurring on the New York Stock Exchange (NYSE). The data are taken from the NYSE's Trade and Quote (TAQ) database. S.E.M. is the standard error of the mean estimate.
Nonopen Volume Transactions
Symbol Name Daily Avg. NYSE Share Daily Avg. NYSE Share
AA Alcoa 2,836 91.2 145 77.1 ALD Allied Signal 2,576 86.2 167 67.8 AXP American Express 12,679 87.0 489 48.1 BA Boeing 6,366 77.9 593 40.5 BS Bethlehem Steel 6,776 87.1 195 62.1 CAT Caterpillar 3,089 89.1 226 64.9 CHV Chevron 4,474 85.5 308 65.9 DD DuPont 7,605 88.2 449 59.7 DIS Disney 15,170 83.3 1,110 46.7 EK Eastman Kodak 15,982 84.5 680 50.9 GE Gen'l Electric 7,639 84.5 716 63.5 GM Gen'l Motors 20,829 82.7 1,015 38.5 GT Goodyear 4,600 87.4 193 65.1 IBM IBM 17,164 79.4 1,329 42.1 IP Int'l Paper 4,084 91.4 194 77.8 JPM JP Morgan 4,615 88.3 338 71.6 KO Coca Cola 11,790 82.5 755 47.7 MCD McDonalds 5,472 83.4 400 50.8 MMM MMM 2,641 85.3 243 63.1 MO Phillip Morris 23,471 79.6 1,886 42.4 MRK Merck 25,720 71.8 1,948 33.3 PG Proctor Gamble 8,637 81.9 592 46.4 S Sears 8,055 87.1 420 63.7 T ATT 19,030 85.3 1,348 53.8 TX Texaco 6,451 87.0 419 53.2 UK Union Carbide 5,065 74.9 348 30.9 UTX United Tech 2,893 90.5 166 70.5 WX Westinghouse 8,633 74.4 574 36.9 XON Exxon 8,968 85.4 560 55.5 Z Woolworth 5,622 86.8 275 48.2
Median 7,191 85.3 435 53.5 Mean 9,298 84.3 603 54.6 Std. Dev. 6,538 4.9 486 12.9 S.E.M. 1,194 0.9 89 2.4
reason, the present estimations are based on quotes rather than transaction prices.
As noted earlier, the quote model may be viewed as the reduced form of a richer model that involves transaction prices and signed trade volumes. These

Determining the Contributions to Price Discovery 1189
Table III
NYSE Volume Market Shares by Transaction Size, August to October, 1993
For each Dow stock, Table III reports New York Stock Exchange (NYSE) market share (by volume) in the indicated transaction size classes. (For example, the NYSE accounted for 66.1 percent of the shares traded in AA (Alcoa) in trades of 500 or fewer shares.) The data are taken from the NYSE's Trade and Quote (TAQ) database. S.E.M. is the standard error of the mean estimate.
Transaction Size (Shares)
Symbol All Sizes Up to 500 501-2,500 2,501-10,000 Above 10,000
AA 91.2 66.1 88.3 93.9 95.2 ALD 86.2 55.1 87.0 94.1 84.5 AXP 87.0 33.0 67.5 87.5 96.0 BA 77.9 34.0 65.2 87.3 95.6 BS 87.1 48.4 62.7 89.2 93.6 CAT 89.1 57.4 86.5 94.4 96.6 CHV 85.5 54.1 85.3 90.5 89.7 DD 88.2 50.0 79.5 92.6 95.8 DIS 83.3 38.2 71.7 91.2 93.9 EK 84.5 39.4 73.7 92.0 88.0 GE 84.5 57.2 83.0 91.7 90.7 GM 82.7 24.6 57.8 89.0 94.0 GT 87.4 52.1 75.7 90.7 93.2 IBM 79.4 34.5 68.6 87.4 91.4 IP 91.4 66.6 88.3 94.7 93.7 JPM 88.3 62.7 87.0 90.3 97.2 KO 82.5 39.4 67.9 89.1 92.7 MCD 83.4 41.9 78.3 86.3 95.2 MMM 85.3 56.0 85.7 91.5 92.3 MO 79.6 36.0 65.0 87.0 93.3 MRK 71.8 27.1 49.2 80.2 89.8 PG 81.9 35.8 70.4 90.8 92.1 S 87.1 50.9 80.2 93.5 90.9 T 85.3 47.2 71.7 91.4 94.4 TX 87.0 42.9 78.6 92.1 95.7 UK 74.9 22.3 43.7 84.8 93.9 UTX 90.5 62.2 83.1 94.8 97.0 WX 74.4 29.9 47.2 78.7 95.0 XON 85.4 45.4 75.9 91.4 92.8 Z 86.8 38.2 69.6 92.2 94.8
Median 85.3 44.1 74.7 91.0 93.8 Mean 84.3 45.0 73.1 90.0 93.3 Std. Dev. 4.9 12.4 12.3 3.9 2.8 S.E.M. 0.9 2.3 2.2 0.7 0.5
variables almost certainly play important roles in the evolution of the quotes and the efficient price. The present purpose, however, is allocation of innova- tions across markets. To the extent that a transaction, say, on the Pacific Exchange conveys useful information, this should be reflected in the quotes of
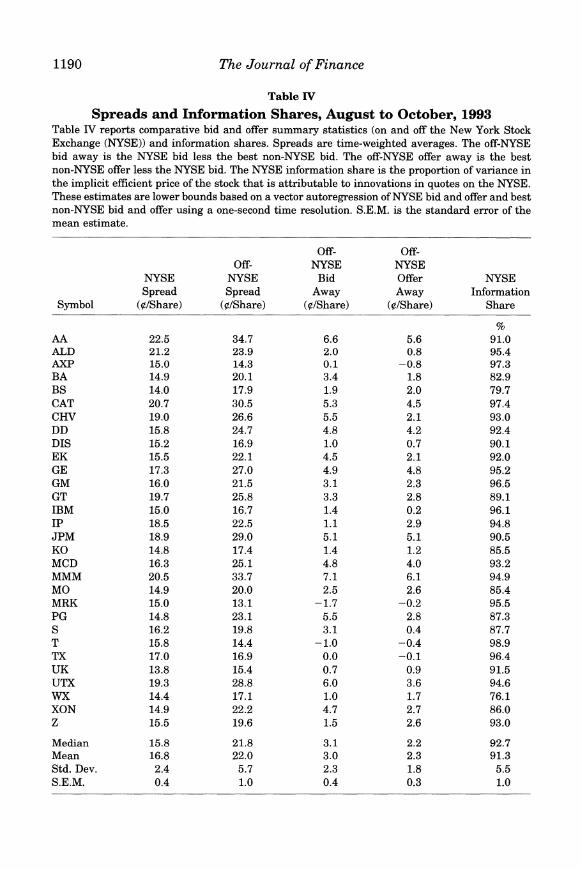
1190 The Journal of Finance
Table IV
Spreads and Information Shares, August to October, 1993 Table IV reports comparative bid and offer summary statistics (on and off the New York Stock Exchange (NYSE)) and information shares. Spreads are time-weighted averages. The off-NYSE bid away is the NYSE bid less the best non-NYSE bid. The off-NYSE offer away is the best non-NYSE offer less the NYSE bid. The NYSE information share is the proportion of variance in the implicit efficient price of the stock that is attributable to innovations in quotes on the NYSE. These estimates are lower bounds based on a vector autoregression of NYSE bid and offer and best non-NYSE bid and offer using a one-second time resolution. S.E.M. is the standard error of the mean estimate.
Off- Off- Off- NYSE NYSE
NYSE NYSE Bid Offer NYSE Spread Spread Away Away Information
Symbol (?/Share) (?/Share) (?/Share) (?/Share) Share
AA 22.5 34.7 6.6 5.6 91.0 ALD 21.2 23.9 2.0 0.8 95.4 AXP 15.0 14.3 0.1 -0.8 97.3 BA 14.9 20.1 3.4 1.8 82.9 BS 14.0 17.9 1.9 2.0 79.7 CAT 20.7 30.5 5.3 4.5 97.4 CHV 19.0 26.6 5.5 2.1 93.0 DD 15.8 24.7 4.8 4.2 92.4 DIS 15.2 16.9 1.0 0.7 90.1 EK 15.5 22.1 4.5 2.1 92.0 GE 17.3 27.0 4.9 4.8 95.2 GM 16.0 21.5 3.1 2.3 96.5 GT 19.7 25.8 3.3 2.8 89.1 IBM 15.0 16.7 1.4 0.2 96.1 IP 18.5 22.5 1.1 2.9 94.8 JPM 18.9 29.0 5.1 5.1 90.5 KO 14.8 17.4 1.4 1.2 85.5 MCD 16.3 25.1 4.8 4.0 93.2 MMM 20.5 33.7 7.1 6.1 94.9 MO 14.9 20.0 2.5 2.6 85.4 MRK 15.0 13.1 -1.7 -0.2 95.5 PG 14.8 23.1 5.5 2.8 87.3 S 16.2 19.8 3.1 0.4 87.7 T 15.8 14.4 -1.0 -0.4 98.9 TX 17.0 16.9 0.0 -0.1 96.4 UK 13.8 15.4 0.7 0.9 91.5 UTX 19.3 28.8 6.0 3.6 94.6 WX 14.4 17.1 1.0 1.7 76.1 XON 14.9 22.2 4.7 2.7 86.0 Z 15.5 19.6 1.5 2.6 93.0
Median 15.8 21.8 3.1 2.2 92.7 Mean 16.8 22.0 3.0 2.3 91.3 Std. Dev. 2.4 5.7 2.3 1.8 5.5 S.E.M. 0.4 1.0 0.4 0.3 1.0

Determining the Contributions to Price Discovery 1191
the exchange that is first aware of the transaction-the Pacific. Trade report- ing and transmission delays are such that the Exchange that executes a trade effectively observes a trade before the others. In basing the information shares solely on quotes, the present analysis is ignoring, for example, the incremental information contained in a Pacific transaction (beyond that reflected in the Pacific quote) that might be used by the NYSE specialist in setting his quote. It is assumed that these cross-market transaction effects are negligible.
A related issue concerns the accuracy of the time stamps. U.S. equity quotes are disseminated on the Consolidated Quotation System (CQS). If the report- ing of an NYSE quote update is delayed relative to a Pacific update, for example, it is possible that a Pacific quote change would erroneously appear to lead New York's. This problem is relatively minor because the CQS is also the system by which different market makers learn about each other's quotes. While the illustrated improper sequencing might arise, the Pacific market- maker would not have observed the NYSE quote prior to the (Pacific) revision. In short, the CQS (and the data used in the present study) accurately depict the quotes in the order in which they become common knowledge. Data timing factors also played a role in the decision to suppress transaction prices and volumes from the analysis. Trades are reported on a different system, and are often improperly sequenced with respect to quotes even within the same market (Hasbrouck (1988), Lee and Ready (1991)).
It is furthermore apparent that, if for no other reason than the existence of autoquote mechanisms, the competitive responses to quote revisions may occur on a very fine time interval. Quote change sequences that can be clearly resolved with a one-second period of observation become smeared and indis- tinct with even a five-second time aggregation. This consideration militates strongly in favor of a model specification that maximizes the time resolution. The quote data disseminated on the consolidated tape are stamped at one- second intervals, and this is used as the sampling interval here.
Although essential to the analysis, this fine time resolution leads to an immediate practical difficulty. Since each equation in the VAR includes all variables through all lags, the number of parameters is roughly Mn2, where M is the maximum lag employed and n is the number of price series. The specifications estimated here involve four price series and 60 one-second lags, i.e., 960 parameters. To manage the dimensions of the problem, polynomial distributed lags were employed: coefficients were constrained to lie on seg- ments that were linear (in lag) over lags 1-5, 6-10, 11-30, and 31-60 seconds.
Four price variables were used in the estimations, the NYSE bid and offer quotes and the best non-NYSE bid and offer quotes. Bid and offer quotes were modeled separately because an exchange may often bid or offer aggressively, but only on one side of the market. There are six regional exchanges, not all of which are active in all stocks on all days. To ensure continuity and to reduce the number of price series, quotes from the regionals were used to compute best non-NYSE bids and offers.
1192 The Journal of Finance
V. Results
The cointegrated model described in the last section was estimated for all thirty stocks in the sample. Coefficient estimates are not presented for the sake of brevity. They did, however, display the following general characteris- tics. Each of the two bids and offer pairs modeled tended to depend negatively on its own lagged values and positively on the lagged values of the other series. The negative autocorrelation was generally stronger for the off-NYSE bids and offers. In addition, the coefficients of all the cointegration variables in all equations were generally statistically significant, including those in the NYSE bid and offer equations. This implies a rejection of the null hypothesis that the off-NYSE bids and offers contribute no information to the price formation process.
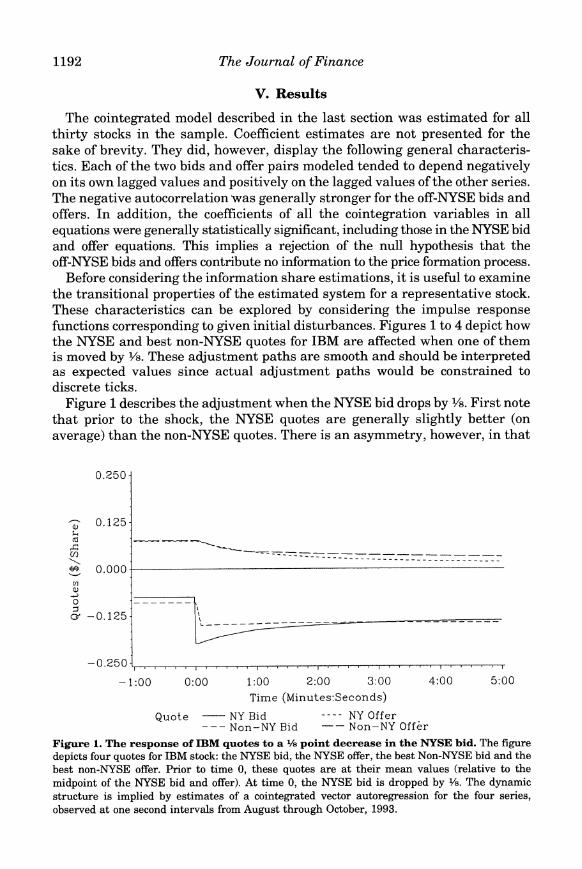
Before considering the information share estimations, it is useful to examine the transitional properties of the estimated system for a representative stock. These characteristics can be explored by considering the impulse response functions corresponding to given initial disturbances. Figures 1 to 4 depict how the NYSE and best non-NYSE quotes for IBM are affected when one of them is moved by Y8. These adjustment paths are smooth and should be interpreted as expected values since actual adjustment paths would be constrained to discrete ticks.
Figure 1 describes the adjustment when the NYSE bid drops by '8. First note that prior to the shock, the NYSE quotes are generally slightly better (on average) than the non-NYSE quotes. There is an asymmetry, however, in that
0.250
? 0.125 cc
- --
-0.250
-1:00 0:00 1:00 2:00 3:00 4:00 5:00
Time (Minutes-Seconds)
Quote NY Bid ---- NY Offer --Non-NY Bid -- Non-NY Off~r
Figure 1. The response of IBM quotes to a 1/8 point decrease in the NYSE bid. The figure depicts four quotes for IBM stock: the NYSE bid, the NYSE offer, the best Non-NYSE bid and the best non-NYSE offer. Prior to time 0, these quotes are at their mean values (relative to the midpoint of the NYSE bid and offer). At time 0, the NYSE bid is dropped by Vs. The dynamic structure is implied by estimates of a cointegrated vector autoregression for the four series, observed at one second intervals from August through October, 1993.

Determining the Contributions to Price Discovery 1193
0.250
a 0.125 _ ?
0.000 U)
oa -0.125
-0.250 [
-1:00 0:00 1:00 2:00 3:00 4:00 5:00 Time (Minutes:Seconds)
Quote NY Bid ---- NY Offer ---Non-NY Bid - Non-NY Offer
Figure 2. The response of IBM quotes to a 1/8 point increase in the NYSE offer. The figure depicts four quotes for IBM stock: the NYSE bid, the NYSE offer, the best Non-NYSE bid and the best non-NYSE offer. Prior to time 0, these quotes are at their mean values (relative to the midpoint of the NYSE bid and offer). At time 0, the NYSE offer is raised by ?8. The dynamic structure is implied by estimates of a cointegrated vector autoregression for the four series, observed at one second intervals from August through October, 1993.
the best non-NYSE offer is more aggressive than the best non-NYSE bid. This is a common feature for most stocks, noted in the discussion of Table IV. After the initial drop, the NYSE bid exhibits partial reversal. This is consistent with the negative autocorrelation in quote revisions found in Hasbrouck and Ho (1987) and Hasbrouck (1991a), and may reflect in part the lumpiness with which liquidity suppliers arrive. An aggressive limit buy order, for example, may elevate the bid. Once the order is hit and filled, however, the bid may revert back to its earlier position. Note that the adjustment path of the NYSE offer is gradual and monotonic: it does not move in lock-step with the bid. The response of the best non-NYSE bid displays rapid partial adjustment, a reflec- tion of the autoquote mechanism. Figure 2 describes adjustment when the NYSE offer is raised by Y?. It is essentially symmetric to the bid case.
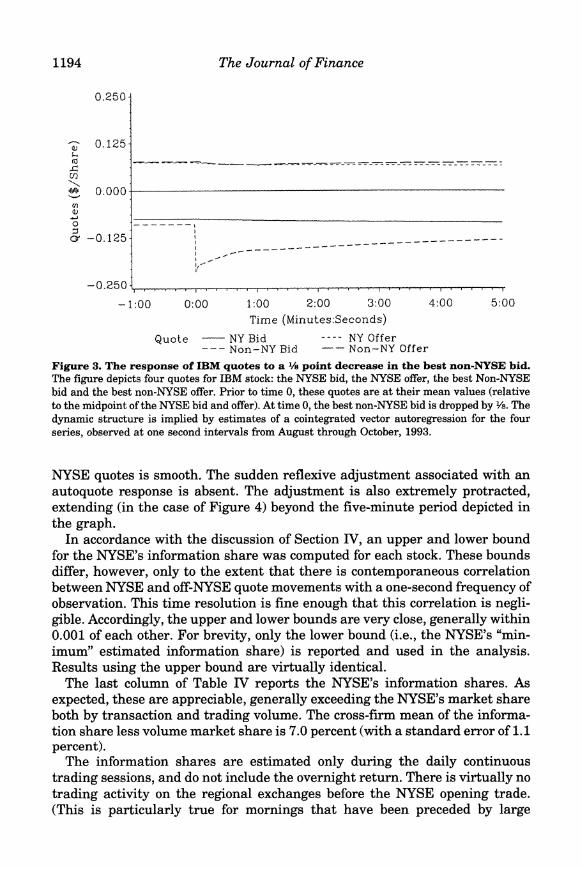
Figures 3 and 4 depict adjustment when the best non-NYSE bid and offer are moved by Y?. In contrast to Figures 1 and 2, the reversion is more substantial. That is, relative to the perturbations of the NYSE quotes, less of the initial shock is eventually incorporated into the security price. The greater apparent transience of non-NYSE quote movements may reflect greater frequency of errors in quote revision. It may also be partially explained by the non-NYSE "price improvement" mechanisms. In one variant, a market buy order (for example) arriving when the quotes are 10 bid, 10 ? offered is first represented for a brief period as a limit buy order at 10 Y?. The bid rises to 10Y?, but reverts quickly thereafter when the order is filled or withdrawn. Adjustment of the
1194 The Journal of Finance
0.250
au 0.125
co M
O l Or -0.125 - - -___________- -__ __
I,-o
-0.250
-1:00 0:00 1:00 2:00 3:00 4:00 5:00 Time (Minutes:Seconds)
Quote NY Bid ---- NY Offer --- Non-NY Bid -- Non-NY Offer
Figure 3. The response of IBM quotes to a '/s point decrease in the best non-NYSE bid. The figure depicts four quotes for IBM stock: the NYSE bid, the NYSE offer, the best Non-NYSE bid and the best non-NYSE offer. Prior to time 0, these quotes are at their mean values (relative to the midpoint of the NYSE bid and offer). At time 0, the best non-NYSE bid is dropped by Ys. The dynamic structure is implied by estimates of a cointegrated vector autoregression for the four series, observed at one second intervals from August through October, 1993.
NYSE quotes is smooth. The sudden reflexive adjustment associated with an autoquote response is absent. The adjustment is also extremely protracted, extending (in the case of Figure 4) beyond the five-minute period depicted in the graph.
In accordance with the discussion of Section IV, an upper and lower bound for the NYSE's information share was computed for each stock. These bounds differ, however, only to the extent that there is contemporaneous correlation between NYSE and off-NYSE quote movements with a one-second frequency of observation. This time resolution is fine enough that this correlation is negli- gible. Accordingly, the upper and lower bounds are very close, generally within 0.001 of each other. For brevity, only the lower bound (i.e., the NYSE's "min- imum" estimated information share) is reported and used in the analysis. Results using the upper bound are virtually identical.
The last column of Table IV reports the NYSE's information shares. As expected, these are appreciable, generally exceeding the NYSE's market share both by transaction and trading volume. The cross-firm mean of the informa- tion share less volume market share is 7.0 percent (with a standard error of 1.1 percent).
The information shares are estimated only during the daily continuous trading sessions, and do not include the overnight return. There is virtually no trading activity on the regional exchanges before the NYSE opening trade. (This is particularly true for mornings that have been preceded by large

Determining the Contributions to Price Discovery 1195
0.250
2 0.125 I
\ 0.000
O -- _ __ _ ----------------- - ---- ---- ---- --- - - --
o~-0.125
-0.250
- 1:00 0:00 1:00 2:00 3:00 4:00 5:00
Time (Minutes:Seconds)
Quote NY Bid ---- NY Offer --- Non-NY Bid -Non-NY Offer
Figure 4. The response of IBM quotes to a 1/8 point increase in the best non-NYSE offer. The figure depicts four quotes for IBM stock: the NYSE bid, the NYSE offer, the best Non-NYSE bid and the best non-NYSE offer. Prior to time 0, these quotes are at their mean values (relative to the midpoint of the NYSE bid and offer). At time 0, the best non-NYSE offer is raised by V8. The dynamic structure is implied by estimates of a cointegrated vector autoregression for the four series, observed at one second intervals from August through October, 1993.
information releases.) As a practical matter, then, virtually all of the overnight price discovery occurs on the NYSE. From this it may be inferred that the NYSE's overall (inter- plus intraday) information shares are even larger than the estimates reported here for the intraday activity.
The result that the NYSE's information share appears to exceed its share of trading activity by other measures is consistent with the common brokerage industry practice of channeling retail market order flow to centers other than the NYSE. These alternative market makers execute the order at the best prevailing intermarket quote (generally the NYSE quote). The information content of these orders is presumably relatively low, leaving a disproportionate concentration of informative trading occurring at the NYSE.
To explore this hypothesis further, Table V presents correlation coefficients for the information share and market share variables (including transaction- size based subsamples). It is striking that the correlation is weak for small and large trades, but stronger and positive for the market shares in the two middle categories. Before proceeding, it should be noted that the statistical signifi- cance of the middle-category correlations is not robust to changes in the methodology. When Spearman (rank-order) correlations were computed in- stead of the usual Pearson coefficients, or when the stocks with the two lowest information shares (BS and WX) were deleted, the statistical significance vanished, although the correlations remained substantially positive. Accord- ingly, this analysis must be taken as suggestive.

1196 The Journal of Finance
Table V
Correlations between NYSE Information Share and NYSE Volume Market Share Measures
Table V reports correlation coefficients for the thirty Dow Jones Industrial Average (DOW) stocks between the New York Stock Exchange (NYSE) market shares by trading volume in the indicated transaction size classes (Table III) and the NYSE information share measures (Table IV). The NYSE information share is the proportion of variance in the implicit efficient price of the stock that is attributable to innovations in quotes on the NYSE. These estimates are lower bounds based on a vector autoregression of NYSE bid and offer and best non-NYSE bid and offer using a one-second time resolution. Significance probabilities under the null hypothesis of no correlation are given in parentheses.
Vol. Mkt. Vol. Mkt. Vol. Mkt. Vol. Mkt. Vol. Mkt. Information Share: Share: Share: Share: Share:
Share All sizes Up to 500 501-2,500 2,501-10,000 Above 10,000
Information share 1
Vol. mkt. share: 0.310 1 all sizes (0.096)
Vol. mkt. share: 0.197 0.811 1 Up to 500 (0.296) (0.000)
Vol. mkt. share: 0.373 0.833 0.890 1 501-2,500 (0.043) (0.000) (0.000)
Vol. mkt. share: 0.383 0.877 0.730 0.830 1 2,501-10,000 (0.037) (0.000) (0.000) (0.000)
Vol. mkt. share: -0.074 0.214 0.048 -0.034 -0.025 1 above 10,000 (0.699) (0.257) (0.800) (0.860) (0.895)
Nevertheless, these correlation patterns are consistent with certain charac- teristics of market behavior. The apparent lack of a relation between the NYSE's market share in large trades and its information share is consistent with Seppi's (1990) analysis. He suggests that the block trade market is one characterized by repeated transactions involving nonanonymous parties, an arrangement that supports uninformed trading in large quantities. It should also be noted, however, that the sample dispersion of large-trade market share (cf. Table III) is low, rendering accurate estimation of correlation difficult. The absence of a relation between information share and low-end market share is presumably a reflection of the low information content of these trades. Overall, these correlations are consistent with Barclay and Warner's (1993) conclusion that it is the medium size trades that move prices.
Although the preceding inferences are drawn from an analysis of market share in various size classifications, it should be noted that market makers often possess knowledge in addition to order size that may help them assess the information content of a trade. A market center displaying a quote that is worse than the best prevailing intermarket quote has the option of executing an incoming order. (If it does execute the order, of course, it must meet or exceed the best quote.) An order that is perceived as originating from an

Determining the Contributions to Price Discovery 1197
informed trader may simply be forwarded to another market center for action. In practice, however, this is not usually necessary. Most order flow to non- NYSE market centers direction is by prearrangement with a broker and is by agreement limited to individual retail (noninstitutional) orders. This suggests the possibility that the NYSE's larger information shares may reflect factors supplemental to order size.
VI. Conclusions
This article has presented an econometric analysis of a single security trading in multiple markets. The approach is applicable when this condition holds literally, as when a stock trades on multiple exchanges. It is also applicable when the securities traded on the diverse markets are different, but are linked by arbitrage conditions (even when the arbitrage is costly). The essence of the situation is that the securities share a common factor, and that arbitrage ensures that the price differences between markets do not diverge without bound.
The common factor is the implicit efficient price of the security, which is defined statistically as the random-walk component of the prices from the diverse markets. The innovation variance in this random walk is a measure of the information intensity of the efficient price process. The information share of a market is defined as the proportion of this innovation variance that can be attributed to that market. In applications where prices are contemporaneously determined, these proportions cannot generally be determined unambigu- ously. It is possible, however, to set bounds on these proportions by imposing orthogonalizations on the cross-market innovation covariance matrix. These bounds may be tightened by estimating the specifications on a fine time grid, to reduce correlation induced by time aggregation.
The paper applies these techniques in measuring price discovery for equities traded on the NYSE and regional exchanges. The analysis models both the NYSE and the best non-NYSE bids and offers using one-second time resolu- tion. The specification is estimated for the thirty Dow stocks, high-volume stocks that have significant trading activity away from the NYSE. The results suggest that price discovery appears to be concentrated at the NYSE: the median information share is 92.7 percent. Furthermore, for twenty-eight of the Dow stocks, the information share is larger than the NYSE's market share (by trading volume). The information share is most strongly correlated with mar- ket share for medium size trades, consistent with the finding of Barclay and Warner (1993) that it is these trades that convey information.
REFERENCES
Banerjee, A., J. Dolado, J. W. Galbraith, and D. F. Hendry, 1994, Co-integration, error-correction, and the Econometric Analysis of Non-stationary Data (Oxford University Press, London).
Barclay, M. J., and J. B. Warner, 1993, Stealth trading and volatility: Which trades move prices?, Journal of Financial Economics 34, 281-306.

1198 The Journal of Finance
Bhattacharya, M., 1987, Price changes of related securities: The case of call options and stocks, Journal of Financial and Quantitative Analysis 22, 1-15.
Bossaerts, P., 1988, Common nonstationary components of asset prices, Journal of Economic Dynamics and Control 12, 347-364.
Campbell, J. Y., and P. Perron, 1991, Pitfalls and opportunities: What macroeconomists should know about unit roots, in 0. J. Blanchard and S. Fischer, Eds.: NBER Macroeconomics Annual, 1991 (MIT Press, Cambridge, MA).
Campbell, J. Y., and R. J. Shiller, 1987, Cointegration and tests of present value models, Journal of Political Economy 95, 1062-1088.
Campbell, J. Y., and R. J. Shiller, 1988, Interpreting cointegrated models, Journal of Economic Dynamics and Control 12, 505-522.
Chan, K., 1992, A further analysis of the lead-lag relationship between the cash market and stock index futures market, Review of Financial Studies 5, 123-152.
Cohen, K. J., S. F. Maier, R. A. Schwartz, and D. K. Whitcomb, 1982, An analysis of the economic justification for consolidation in a secondary security market, Journal of Banking and Finance 6, 117-136.
Cohen, K. J., R. M. Conroy, and S. F. Maier, 1985, Order flow and the quality of the market, in Y. Amihud, T. S. Y. Ho and R. A. Schwartz, Eds.: Market Making and the Changing Structure of the Securities Industry (Lexington Books, Lexington, Mass.).
Damodaran, A., and J. Lim, 1991, The effects of option listing on the underlying stock's return process, Journal of Banking and Finance 15, 647-664.
Davidson, J. E. H., D. F. Hendry, F. Srba, and S. Yeo, 1978, Econometric modelling of the aggregate time series relationship between consumer's expenditure and income in the United Kingdom, Economic Journal 88, 661-692.
Easley, D., M. O'Hara, and P. S. Srinivas, 1993, Option volume and stock prices: Evidence on where informed traders trade, working paper, Cornell University.
Engle, R. F., and C. W. J. Granger, 1987, Co-integration and error correction: Representation, estimation, and testing, Econometrica 55, 251-276.
Eckbo, B. E., and J. Liu, 1993, Temporary components of stock prices: New univariate results, Journal of Financial and Quantitative Analysis 28, 161-176.
Finnerty, J. E., and H. Y. Park, 1987, Stock index futures: Does the tail wag the dog? A technical note, Financial Analysts Journal 43, 57-61.
Garbade, K. D., J. L. Pomrenze, and W. L. Silber, 1979, On the information content of prices, American Economic Review 1979, 69, 50-59.
Garbade, K. D., and W. L. Silber, 1979, Dominant and satellite markets: A study of dually-traded securities, Review of Economics and Statistics 61, 455-460.
Garbade, K. D., and W. L. Silber, 1982, Price movements and price discovery in futures and cash markets, Review of Economics and Statistics 64, 289-297.
Grunbichler, A., F. A. Longstaff, and E. S. Schwartz, 1994, Electronic screen trading and the transmission of information: An empirical examination, Journal of Financial Intermediation 3, 166-187.
Hamilton, J. D., 1994, Time Series Analysis (Princeton University Press, Princeton). Harris, F. H. deB., T. H. McInish, G. L. Shoesmith, and R. A. Wood, 1995, Cointegration, error
correction, and price discovery on informationally linked security markets. Journal of Finan- cial and Quantitative Analysis, forthcoming.
Harris, L. E., 1989, The October 1987 S&P 500 stock-futures basis, Journal of Finance 44, 77-99. Harris, L. E., 1993, Consolidation, fragmentation, segmentation, and regulation, Financial Mar-
kets, Institutions and Instruments 2, 1-28. Hasbrouck, J., 1988, Trades, quotes, inventories, and information, Journal of Financial Economics
22, 2. Hasbrouck, J., 1991a, Measuring the information content of stock trades, Journal of Finance 46,
179-208. Hasbrouck, J., 1991b, The summary informativeness of stock trades: An econometric analysis,
Review of Financial Studies 4, 571-595.

Determining the Contributions to Price Discovery 1199
Hasbrouck, J., 1993a, Assessing the quality of a security market: A new approach to transaction cost measurement, Review of Financial Studies 6, 191-212.
Hasbrouck, J., 1993b, Order characteristics and stock price evolution: Program trading on the NYSE, Working paper, New York University.
Hasbrouck, J., and T. S. Y. Ho, 1987, Order arrival, quote behavior, and the return generation process, Journal of Finance 42, 1035-1048.
Hasbrouck, J., G. Sofianos, and D. Sosebee, 1993, Orders, trades, reports, and quotes at the New York Stock Exchange, Working paper, NYSE Research and Planning Section.
John, K., A. Koticha, and M. Subrahmanyam, 1991, The micro-structure of options markets: Informed trading, liquidity, volatility, and efficiency, working paper, New York University.
Kawaller, I. G., P. D. Koch, and T. W. Koch, 1987, The temporal price relationship between S&P 500 futures and the S&P 500 index, Journal of Finance 42, 1309-1329.
Kleidon, A. W., and I. M. Werner, Round the clock trading: Evidence from U.K. cross-listed securities, NBER Working paper 4410.
Lee, C. M. C., and M. Ready, 1992, Inferring trade direction from intradaily data, Journal of Finance 47, 733-46.
Lutkepohl, H., 1993, Introduction to Multiple Time Series Analysis (Springer-Verlag, New York). Manaster, S., and R. Rendelman, 1982, Option prices as predictors of equilibrium stock prices,
Journal of Finance 37, 1043-1057. Mendelson, H., 1987, Consolidation, fragmentation, and market performance, Journal of Finan-
cial and Quantitative Analysis 22, 189-207. Mulherin, J. H., J. M. Netter, and J. A. Overdahl, 1990, Who owns the quotes: A case study into
the definition and enforcement of property rights at the Chicago Board of Trade, working paper, Office of Economic Analysis, U.S. Securities and Exchange Commission.
Mulherin, J. H., J. M. Netter, and J. A. Overdahl, 1991, Prices are property: The organization of financial exchanges from a transaction cost perspective, Journal of Law and Economics 34, 591-644.
Ng, N., 1987, Detecting spot prices forecasts in futures prices using causality tests, Review of Futures Markets 6, 250-267.
Pallmann, N., 1992, Market structure and the speed of incorporating new information into security prices: Evidence from Germany, Working paper, New York University.
Roell, A., 1992, Comparing the performance of stock exchange trading systems, in J. Fingleton and D. Schoenmaker, eds.: The Internationalisation of Capital Markets and the Regulatory Re- sponse (Graham & Trotman, London).
Seppi, D. J., 1990, Equilibrium block trading and asymmetric information, Journal of Finance 45, 73-94.
Shapiro, J., 1993, Recent competitive developments in U.S. equity markets, New York Stock Exchange Working paper 93-02.
Stephan, J. A., and R. E. Whaley, 1990, Intraday price change and trading volume relations in the stock and stock options markets, Journal of Finance 55, 191-220.
Stock, J. H., and M. W. Watson, 1988, Testing for common trends, Journal of the American Statistical Association 83, 1097-1107.
Stoll, H. R., and R. E. Whaley, 1990, The dynamics of stock index and stock futures returns, Journal of Financial and Quantitative Analysis 25, 441-468.
U.S. Securities and Exchange Commission, 1994, Market 2000: An examination of current equity market developments, U.S. Government Printing Office.
Vijh, A. M., 1990, Liquidity of the CBOE equity options, Journal of Finance 45, 1157-1179. Watson, M. W., 1994, Vector autoregressions and cointegration, in R. F. Engle and D. L.
McFadden, Eds.: Handbook of Econometrics, Volume IV (Elsevier Science, Amsterdam).