one customer at a time
TRANSCRIPT

2019 ANNUAL REPORTTHE PNC FINANCIAL SERVICES GROUP
GROWING. ONE CUSTOMERAT A TIME.
74375.indd 1 3/4/20 10:38 AM

Tangible book value per common share calculated as tangible common shareholders’ equity divided by period end common
shares outstanding. Net interest margin calculated on a taxable-equivalent basis. See the Statistical Information (Unaudited)
section in Item 8 of the accompanying 2019 Form 10-K for additional information, including non-GAAP reconciliations.
The Basel III common equity Tier 1 capital ratios are calculated using the regulatory capital methodology applicable to PNC
during each period presented, except for the 2017 Basel III common equity Tier 1 ratio which is the fully phased-in Basel III ratio
and presented as a pro forma estimate. Ratios for all periods were calculated based on the standardized approach. The 2019
and 2018 Basel III common equity Tier 1 ratios refl ect the full phase-in of all Basel III adjustments to this metric applicable to
PNC. See the regulatory capital rules discussion in the Supervision and Regulation section of Item 1, the capital management
discussion in the Risk Management section of Item 7 and the Statistical Information (Unaudited) section of Item 8 in the
accompanying 2019 Form 10-K for additional information.
These Financial Highlights should be read in conjunction with disclosures in the accompanying 2019 Form 10-K including
the audited fi nancial statements.
The PNC Financial Services Group, Inc. Financial HighlightsYear ended December 31
In millions, except per share data
2019 2018 2017
FINANCIAL RESULTSNet interest income $ 9,965 $ 9,721 $ 9,108
Noninterest income 7,862 7,411 7,221
Total revenue 17,827 17,132 16,329
Noninterest expense 10,574 10,296 10,398
Pretax, pre-provision earnings (non-GAAP) 7,253 6,836 5,931
Provision for credit losses 773 408 441
Income taxes 1,062 1,082 102
Net income $ 5,418 $ 5,346 $ 5,388
PER COMMON SHAREDiluted earnings $ 11.39 $ 10.71 $ 10.36
Cash dividends 4.20 3.40 2.60
Closing price 159.63 116.91 144.29
Book value 104.59 95.72 91.94
Tangible book value (non-GAAP) 83.30 75.42 72.28
BALANCE SHEET At year end
Assets $ 410,295 $ 382,315 $ 380,768
Loans 239,843 226,245 220,458
Deposits 288,540 267,839 265,053
Common shareholders’ equity 45,321 43,742 43,530
Common shares outstanding 433 457 473
SELECTED RATIOSReturn on average common shareholders’ equity 11.50 % 11.83 % 12.09 %
Return on average assets 1.35 1.41 1.45
Net interest margin 2.89 2.97 2.87
Noninterest income to total revenue 44 43 44
Effi ciency 59 60 64
Basel III common equity Tier 1 capital ratio 9.5 9.6 9.8
Transitional Basel III common equity
Tier 1 capital ratio 10.4
74375.indd 2 3/4/20 10:38 AM

Dear Shareholder,Against the backdrop of ongoing change and disruption across our industry, PNC delivered
another year of solid performance in 2019, and continued to differentiate our company
in a way that positions us well to meet the challenges and opportunities ahead.
2019 ANNUAL REPORT • THE PNC FINANCIAL SERVICES GROUP | 1
As I wrote last year, the banking
industry is quickly evolving, driven
by profound changes in customer
preferences. The cost to compete
and win is rising rapidly, and scale
matters more than ever. The nation’s
biggest banks are embracing this
and investing heavily. Regional
and community banks recognize the
pressures, and consolidation among
them has accelerated.
Amidst this change, we have the
necessary scale to invest in technology
and geographic expansion — physical
and digital — and grow organically.
We have a collaborative culture that
allows us to deliver value-added
solutions for our clients. And, we
operate the company with values
that have earned the trust of our
clients, employees and communities
for nearly 170 years.
While there has been an increase in
advocacy and press regarding the
social purpose of a company and the
necessary commitment to something
beyond shareholder profi ts, we at
PNC have recognized this consistently
throughout our history. The banking
business is built on trust, not on
next quarter’s earnings — the trust
of customers, the trust of employees,
the trust of communities and
the trust of shareholders. Our
unwavering commitment to these
four constituencies has been the
primary component of our long-term
viability, and is the foundation of
our continued progress.
We’re extremely proud of what we’ve
accomplished over our long history,
but recognize that much work remains
to defend the competitive advantages
we have gained, and that’s where
we are intensely focused.
Our Financial PerformanceFor the full year, we increased
earnings per share, achieved record
revenue, improved our effi ciency ratio
and generated positive operating
leverage. I am especially proud of this
performance given that we started
the year anticipating an interest rate
hike by the Federal Reserve, and
instead experienced three interest
rate cuts of 25 basis points each.
PNC reported net income of
$5.4 billion, or $11.39 per diluted
common share. Earnings per share
increased 6 percent over 2018.
Our return on average assets was
1.35 percent, and our return on
average common equity was
11.50 percent.
Total revenue has grown consistently
over the past several years driven
by our diverse business mix. In 2019,
we generated a record $17.8 billion
in total revenue, up 4.1 percent over
2018 with higher net interest income
and noninterest income.
Net interest income was $10.0 billion,
also a record for PNC, and increased
2.5 percent over 2018, despite the
three rate cuts by the Federal Reserve.
Our net interest margin of 2.89 percent
was down 8 basis points compared
with 2018 driven by the declining rate
environment throughout the year
as loans repriced faster than deposits.
Noninterest income of $7.9 billion
was up 6.1 percent and represented
a substantial 44 percent of total
revenue. Importantly, we continue
to execute on strategies to grow fee
businesses across our franchise,
including growing customers in
existing and new markets.
Expenses remained well controlled
and for 2019 were $10.6 billion,
up 2.7 percent compared with 2018,
as we continued to invest in our
strategies, technology and employees.
Our effi ciency ratio was 59 percent,
improving from 60 percent last year.
Our commitment has been to invest
in our business for growth while also
maintaining an effi cient organization.
We were happy with our efforts in 2019
as we generated positive operating
leverage of 1.4 percent with revenue
growing faster than expenses.
We were disciplined in managing
our balance sheet, yet still outpaced
our peer group in average loan
growth in 2019 by growing both our
commercial and consumer portfolios,
which increased 6.2 percent and
3.4 percent, respectively. We
accomplished this organically through
value-added products and services
and geographic expansion.
Our overall credit quality remained
strong. While our provision for credit
losses of $773 million increased
WILLIAM S. DEMCHAK
CHAIRMAN, PRESIDENT AND
CHIEF EXECUTIVE OFFICER
74375.indd 3 3/4/20 10:38 AM

2 | FROM THE CEO | MARCH 4, 2020
RETURN ON ASSETS
1.35%RETURN ON COMMON EQUITY
11.50%RECORD REVENUE
$17.8B
EFFICIENCY RATIO
59%POSITIVE OPERATING LEVERAGE
1.4%
NONINTEREST INCOME
TO TOTAL REVENUE
44%
2019 vs. 2018
$365 million compared with 2018, it
was driven by strong loan growth and
some early stage credit normalization
in our loan portfolio. Our reserves
to total loans remained strong and
stable year over year at 1.14 percent
at year end 2019.
We also grew deposits, refl ecting
strong growth from both commercial
and retail customers. Average deposits
in 2019 increased 5.4 percent over
2018, ranking PNC favorably among
our peer group.
Capital Flexibility Our capital levels are strong and
enabled us to return signifi cant capital
to shareholders totaling $5.4 billion
in 2019. This represented a 22 percent
increase over 2018 and comprised
$3.5 billion in share repurchases
and $1.9 billion in common stock
dividends. We raised our quarterly cash
dividend on common stock in the third
quarter by 20 cents to $1.15 per share,
a 21 percent increase.
Our tangible book value was $83.30
per common share as of year end 2019,
an increase of 10 percent over 2018. As
of December 31, 2019, PNC’s fi ve-year
annualized total shareholder return
was 14.6 percent compared to an 11.3
percent average for our peer group.
In 2019, the federal banking agencies
adopted rules designed to better tailor
capital and liquidity requirements to
the asset size and risk profi le of banks.
These tailoring rules, which became
effective January 1, 2020, allowed us
to announce an increase in the amount
of our share repurchase programs over
the fi rst two quarters of 2020 and,
going forward, will provide us increased
fl exibility in managing our capital and
liquidity levels as we navigate both
opportunities and challenges.
Expanding Our Geographic ReachOur strong organic growth has been
supported by our investments in new
geographic markets across the
Corporate & Institutional Bank (C&IB)
and Retail Bank.
In C&IB, we continue to expand our
reach by combining a traditional
relationship, high-touch feel that’s
characteristic of a regional approach
with the technology, scale, talent
and capabilities of one of the biggest
banks in the country.
Our client-centric approach is driving
the ongoing expansion of our middle
market corporate banking business,
leveraging our highly successful
Regional Presidents model. In 2020,
we will enter Portland and Seattle,
following Boston and Phoenix in 2019;
Denver, Houston and Nashville in
2018; and Dallas, Kansas City and
Minneapolis in 2017.
Following our early success in C&IB
in these expansion markets, we
launched a national expansion of our
Retail Banking business in 2018. The
primary focus is building a national
deposit franchise capable of growing
primary banking relationships and
gathering core deposits. While we are
encouraged by our early success, we
recognize that this is a long-term effort
that involves building a national brand.
Beyond our existing network of 2,300
branches and 9,100 ATMs in our legacy
markets, we’re adding customers
and growing deposits with digitally-led
banking and an ultra-thin network
of solution centers located within
a 20-minute drive of 80 percent of the
population in the markets they serve.
Our solution centers, which totaled fi ve
at the end of 2019 in Kansas City and
Dallas, are expected to grow to 25 this
year with additional locations in
Boston, Dallas, Houston, Kansas City
and Nashville.
When we launched our retail national
expansion in 2018, we led with a digital
high yield savings account. Over time,
we have learned a great deal about
growing retail deposits digitally and
outside of our footprint — and we’ve
STRONG RESULTS
74375.indd 4 3/4/20 10:38 AM

2019 ANNUAL REPORT • THE PNC FINANCIAL SERVICES GROUP | 3
learned about the positive impact of
having a physical presence in new
geographies. Our research indicates
that while 80 percent of consumers
report visiting a retail location one or
fewer times a year, they still want a
physical location with knowledgeable
bank staff to be available nearby
to work with them on major fi nancial
decisions involving lending, mortgages
and investments.
Our sustained investments in
technology position us to deliver
the predominantly digital experience
many people desire, coupled with
high-touch availability for major
fi nancial decisions.
These learnings are driving us to
go bigger and faster and to ensure
that we have the right infrastructure,
product solutions and disruptive
approach at a time when many of
our competitors are unable to make
the investments in technology and
innovation required to survive into
the future.
Our Values PNC’s progress to date and the
opportunities ahead would not be
possible without the passion,
dedication and commitment of our
employees, and we continue investing
in them to ensure that they have
what they need to thrive personally
and professionally.
We provide competitive compensation
and affordable health care and help
our employees prepare for retirement.
This includes our implementation in
late 2018 of a minimum hourly pay
rate of $15 or higher, depending on the
market, an annual $2,000 minimum
earnings credit for eligible employees
in our defi ned benefi t pension plan,
and a year-end 2019 award of an
additional contribution to the Health
Savings Accounts of eligible employees.
We also continued to invest in our
employees’ ongoing career
development, including the launch
of iLearn, an online continuing
education platform through which
thousands of resources are available.
An engaged employee base is critical
to our success, as is diversity and
inclusion — one of PNC’s corporate
values and an integral part of our talent
and leadership development strategy.
We believe that the highest-performing
teams are diverse and the most
productive workplaces are inclusive.
We also know that to most effectively
compete in the market, our company
must refl ect our increasingly diverse
customer base.
Along these lines, we were recently
named among the Best Places
to Work for LGBTQ Equality by the
Human Rights Campaign for the
seventh consecutive year.
We are also proud to have DirectWomen
recognize our commitment to diversity
with its 2019 Board Diversity Award.
Having leaders with diverse
perspectives and experiences on
corporate boards has never been more
important and that’s why we’ve worked
hard over the past decade to bring more
diversity to our board. Women represent
one-third of our independent directors
and there are now more people of color
on our board than at any other point
in our company’s history.
As a Main Street bank, PNC is
committed to meeting the needs
of all of our constituencies —
customers, employees, communities
and shareholders — as the success of
one is intricately linked to the others.
This includes the communities we
serve, a source of great pride for all
of us at PNC and one of the greatest
legacies of our company over our
long history. As I mentioned earlier,
PNC has always had a social purpose
beyond making money. Our philosophy
is that our prosperity will be
proportional to the prosperity we
create for those we serve.
LOAN GROWTH
FIVE-YEAR TOTAL RETURN
Loans at December 31
$ billions
Stock price change plus
dividend reinvestment
Five years ended December 31, 2019
2017
PEER GROUP
S&P 500 PNC
2018 2019
$222000
11.7%
repurchases
of 25.9 million
common shares
common
stock
dividends
$3.5B $1.9B+ = $5.4B
CAPITAL RETURNED
TO OUR SHAREHOLDERS
$$222266$$2240
11.3%14.6%%%
74375.indd 5 3/4/20 10:38 AM

OUR STRATEGIC PRIORITIES
4 | FROM THE CEO | MARCH 4, 2020
To that end, we were pleased to
learn in 2019 that we received an
“Outstanding” Community
Reinvestment Act rating from the
OCC — the highest possible rating
and one that we are proud to have
earned for every exam period since
the inception of CRA in 1977. We
also announced the extension of
our commitment to Grow Up Great®,
our signature philanthropic program
focused on early childhood education,
now a $500 million initiative benefi ting
41 markets.
PNC is fi rmly committed to operating
our business in an ethical, responsible
and sustainable way. We acknowledge
that climate change threatens the way
we live and the future of our planet, and
we understand that the decisions we
make impact the lives, livelihood,
health and safety of our constituents.
As such, we have built environmental
and human rights considerations
into our risk management frameworks
to ensure that we are minimizing
unnecessary risk to our business,
protecting human rights, and effectively
managing our environmental impact.
In 2019, PNC became a member
of the Ceres Company Network, an
internationally respected nonprofi t
that mobilizes investors, companies
and public interest groups to support
sustainable business practices
and solutions for a healthier global
economy.
In keeping with our commitment to
transparency and helping to enable
a smooth transition to a low-carbon
economy, we formally endorsed the
recommendations of the Task Force
on Climate-related Financial
Disclosures (TCFD) and have begun
assessing the work necessary to
integrate the recommendations into
our business operations. In addition,
we became only the third U.S. bank
to issue a green bond. The issuance
raised $650 million for initiatives that
support the transition to a low-carbon
economy and offer sustainability
benefi ts across three categories
aligned with the United Nations
Sustainable Development Goals,
including renewable energy, energy
effi ciency and green buildings.
Looking AheadAs we publish this report, the global
impact of the coronavirus is unknown,
contributing to uncertainty that we
undoubtedly will face in the year
to come — from the economic
environment, ramifi cations of
international trade tensions and tariffs,
geopolitics, political discourse, and the
upcoming U.S. presidential election.
However, we are confi dent in our ability
to continue to execute on our strategic
priorities and feel great about the
momentum we currently have. We
will remain dedicated and diligent
in our continued investments in our
businesses and technology to drive
long-term growth, and our strategy
and focus on our customers position
us well to deliver for you and all of our
constituencies.
I’d like to thank our board of
directors and the members of the
PNC Executive Committee for their
leadership. I’d like to thank our
employees for their steadfast
commitment to PNC’s values,
customers and communities. And
of course, I’d like to thank you for
your investment and your trust.
Sincerely,
William S. Demchak
Chairman, President
and Chief Executive Offi cer
HONORS AND ACCOLADES
MOST SUSTAINABLE
U.S. COMPANIES
BARRON’S 2020
100HUMAN RIGHTS CAMPAIGN
FOUNDATION
2019 EMPLOYER OF THE YEAR
2020 BEST PLACES
TO WORK FOR
LGBTQ EQUALITY
DISABILITY:IN’S
1. Expanding our leading banking
franchise to new markets and
digital platforms
2. Deepening customer
relationships by delivering
a superior banking experience
and fi nancial solutions
3. Leveraging technology to
innovate and enhance products,
services, security and processes
For more information regarding certain factors that could cause future results to differ, possibly materially, from historical performance or from those anticipated in forward-looking statements, see
the Cautionary Statement in Item 7 of our 2019 Form 10-K, which accompanies this letter. For additional information regarding PNC’s Peer Group, see Item 5 of the accompanying 2019 Form 10-K,
and for additional information on PNC’s fee income and tangible book value, which are non-GAAP fi nancial measures, see the Statistical Information (Unaudited) section in Item 8 of the accompanying
2019 Form 10-K.
74375.indd 6 3/4/20 10:38 AM

UNITED STATESSECURITIES AND EXCHANGE COMMISSION
Washington, DC 20549
FORM 10-K
ANNUAL REPORT PURSUANT TO SECTION 13 OR 15(d) OF THE SECURITIES EXCHANGE ACT OF 1934For the fiscal year ended December 31, 2019
or
TRANSITION REPORT PURSUANT TO SECTION 13 OR 15(d) OF THE SECURITIES EXCHANGE ACT OF 1934For the transition period from to Commission file number 001-09718
THE PNC FINANCIAL SERVICES GROUP, INC.(Exact name of registrant as specified in its charter)
Pennsylvania 25-1435979(State or other jurisdiction of incorporation or organization) (I.R.S. Employer Identification No.)
The Tower at PNC Plaza, 300 Fifth Avenue, Pittsburghg , , Pennsylvaniay 15222-2401(Address of principal executive offices, including zip code)
Registrant’s telephone number, including area code - ((888) ) 762-2265
Securities registered pursuant to Section 12(b) of the Act:g p ( )
Title of Each ClassTradingg
Symbol(s)y ( ) Name of Each Exchange on Which Registered g
Common Stock, par value $5.00 PNC New York Stock ExchangeDepositary Shares Each Representing a 1/4,000 Interest in a Share of Fixed-to- Floating Rate Non-Cumulative Perpetual Preferred Stock, Series P PNC P New York Stock Exchange
Depositary Shares Each Representing a 1/4,000 Interest in a Share of 5.375% Non-Cumulative Perpetual Preferred Stock, Series Q PNC Q
New York Stock Exchange
Securities registered pursuant to Section 12(g) of the Act:g p (g)$1.80 Cumulative Convertible Preferred Stock - Series B, par value $1.00
Indicate by check mark if the registrant is a well-known seasoned issuer, as defined in Rule 405 of the Securities Act. Yes No
Indicate by check mark if the registrant is not required to file reports pursuant to Section 13 or Section 15(d) of the Act. Yes No
Indicate by check mark whether the registrant: (1) has filed all reports required to be filed by Section 13 or 15(d) of the Securities Exchange Act of 1934during the preceding 12 months (or for such shorter period that the registrant was required to file such reports), and (2) has been subject to such filingrequirements for the past 90 days. Yes No
Indicate by check mark whether the registrant has submitted electronically every Interactive Data File required to be submitted pursuant to Rule 405 of dRegulation S-T (§232.405 of this chapter) during the preceding 12 months (or for such shorter period that the registrant was required to submit suchfiles). Yes No
Indicate by check mark whether the registrant is a large accelerated filer, an accelerated filer, a non-accelerated filer, a smaller reporting company, or an emerging growth company. See the definitions of “large accelerated filer,” “accelerated filer,” “smaller reporting company,” and "emerging growth company" in Rule 12b-2 of the Exchange Act.
Large accelerated filer Accelerated filer Emerging growth companyNon-accelerated filer Smaller reporting company
If an emerging growth company, indicate by check mark if the registrant has elected not to use the extended transition period for complying with any new or ffrevised financial accounting standards provided pursuant to Section 13(a) of the Exchange Act.
Indicate by check mark whether the registrant is a shell company (as defined in Rule 12b-2 of the Act). Yes No
The aggregate market value of the registrant’s outstanding voting common stock held by nonaffiliates on June 30, 2019, determined using the per share closing price on that date on the New York Stock Exchange of $137.28, was approximately $60.9 billion. There is no non-voting common equity of theregistrant outstanding.
Number of shares of registrant’s common stock outstanding at February 6, 2020: 428,726,784
DOCUMENTS INCORPORATED BY REFERENCE
Portions of the definitive Proxy Statement of The PNC Financial Services Group, Inc. to be filed pursuant to Regulation 14A for the 2020 annual meeting of rshareholders (Proxy Statement) are incorporated by reference into Part III of this Form 10-K.

THE PNC FINANCIAL SERVICES GROUP, INC.Cross-Reference Index to 2019 Form 10-K
TABLE OF CONTENTS
Page
PART I
Item 1 Business.
Item 1A Risk Factors.
Item 1B Unresolved Staff Comments.
Item 2 Properties.
Item 3 Legal Proceedings.
Item 4 Mine Safety Disclosures.
Information about our Executive Officers
PART II
Item 5 Market for Registrant’s Common Equity, Related Stockholder Matters and Issuer Purchases of Equity Securities.
Common Stock Performance Graph
Item 6 Selected Financial Data.
Item 7 Management’s Discussion and Analysis of Financial Condition and Results of Operations (MD&A).
Executive Summary
Consolidated Income Statement Review
Consolidated Balance Sheet Review
Business Segments Review
Risk Management
Critical Accounting Estimates and Judgments
Off-Balance Sheet Arrangements and Variable Interest Entities
Glossary of Terms
Cautionary Statement Regarding Forward-Looking Information
Item 7A Quantitative and Qualitative Disclosures about Market Risk.
Item 8 Financial Statements and Supplementary Data.
Report of Independent Registered Public Accounting Firm
Consolidated Income Statement
Consolidated Statement of Comprehensive Income
Consolidated Balance Sheet
Consolidated Statement of Changes in Equity
Consolidated Statement of Cash Flows
Notes To Consolidated Financial Statements
Note 1 Accounting PoliciesNote 2 Loan Sale and Servicing Activities and Variable Interest EntitiesNote 3 Asset QualityNote 4 Allowance for Loan and Lease LossesNote 5 Investment Securities
1
14
29
29
29
30
30
31
32
33
35
35
38
41
44
53
76
78
78
81
83
84
84
87
88
89
90
91
93
93106109117118

THE PNC FINANCIAL SERVICES GROUP, INC.Cross-Reference Index to 2019 Form 10-K (continued)
TABLE OF CONTENTS (Continued)
Page
Item 8 Financial Statements and Supplementary Data. (continued)Note 6 Fair ValueNote 7 Goodwill and Mortgage Servicing RightsNote 8 Premises, Equipment and Leasehold ImprovementsNote 9 Time DepositsNote 10 Borrowed FundsNote 11 Employee Benefit PlansNote 12 Stock Based Compensation PlansNote 13 Financial DerivativesNote 14 Earnings Per ShareNote 15 EquityNote 16 Other Comprehensive IncomeNote 17 Income TaxesNote 18 Regulatory MattersNote 19 Legal ProceedingsNote 20 CommitmentsNote 21 Parent CompanyNote 22 Segment ReportingNote 23 Fee-based Revenue from Contracts with CustomersNote 24 Leases Note 25 Subsequent Events
Statistical Information (Unaudited)
Item 9 Changes in and Disagreements with Accountants on Accounting and Financial Disclosure.
Item 9A Controls and Procedures.
Item 9B Other Information.
PART III
Item 10 Directors, Executive Officers and Corporate Governance.
Item 11 Executive Compensation.
Item 12 Security Ownership of Certain Beneficial Owners and Management and Related Stockholder Matters.
Item 13 Certain Relationships and Related Transactions, and Director Independence.
Item 14 Principal Accounting Fees and Services.
PART IV
Item 15 Exhibits, Financial Statement Schedules.
Item 16 Form 10-K Summary
SIGNATURES
121133135135136137143143150150153154156157162163164167169170171
177
178
178
178
179
179
179
180
180
186
186

THE PNC FINANCIAL SERVICES GROUP, INC.Cross-Reference Index to 2019 Form 10-K (continued) MD&A TABLE REFERENCE
Table Description Page
1 Summarized Average Balances and Net Interest Income2 Noninterest Income3 Noninterest Expense4 Summarized Balance Sheet Data5 Loans6 Investment Securities7 Weighted-Average Expected Maturities of Mortgage and Asset-Backed Debt Securities8 Details of Funding Sources9 Retail Banking Table10 Corporate & Institutional Banking Table11 Asset Management Group Table12 BlackRock Table13 Details of Loans14 Commercial Loans by Industry15 Commercial Real Estate Loans by Geography and Property Type16 Home Equity Loans by Geography and by Lien Type17 Residential Real Estate Loans by Geography18 Nonperforming Assets by Type19 Change in Nonperforming Assets20 Accruing Loans Past Due21 Summary of Troubled Debt Restructurings22 Allowance for Loan and Lease Losses23 Loan Charge-Offs and Recoveries24 Senior and Subordinated Debt25 PNC Bank Notes Issued26 Contractual Obligations27 Other Commitments28 Credit Ratings for PNC and PNC Bank29 Basel III Capital30 Interest Sensitivity Analysis31 Net Interest Income Sensitivity to Alternative Rate Scenarios32 Alternate Interest Rate Scenarios: One Year Forward33 Equity Investments Summary
383940414142434345475152575758596061616262646566676868697072727374

THE PNC FINANCIAL SERVICES GROUP, INC.Cross-Reference Index to 2019 Form 10-K (continued) NOTES TO CONSOLIDATED FINANCIAL STATEMENTS TABLE REFERENCE
Table Description Page
34 Impact of the CECL Standard Adoption35 Cash Flows Associated with Loan Sale and Servicing Activities36 Principal Balance, Delinquent Loans and Net Charge-offs Related to Serviced Loans For Others37 Non-Consolidated VIEs38 Analysis of Loan Portfolio39 Nonperforming Assets40 Commercial Lending Asset Quality Indicators41 Asset Quality Indicators for Home Equity and Residential Real Estate Loans42 Asset Quality Indicators for Automobile, Credit Card, Education and Other Consumer Loans43 Financial Impact and TDRs by Concession Type44 Impaired Loans45 Rollforward of Allowance for Loan and Lease Losses and Associated Loan Data46 Investment Securities Summary47 Gross Unrealized Loss and Fair Value of Debt Securities48 Gains (Losses) on Sales of Securities Available for Sale49 Contractual Maturity of Securities50 Fair Value of Securities Pledged and Accepted as Collateral51 Fair Value Measurements – Recurring Basis Summary52 Reconciliation of Level 3 Assets and Liabilities53 Fair Value Measurements – Recurring Quantitative Information54 Fair Value Measurements – Nonrecurring55 Fair Value Option – Fair Value and Principal Balances56 Fair Value Option – Changes in Fair Value57 Additional Fair Value Information Related to Other Financial Instruments58 Goodwill by Business Segment59 Commercial Mortgage Servicing Rights60 Residential Mortgage Servicing Rights61 Commercial Mortgage Servicing Rights – Key Valuation Assumptions62 Residential Mortgage Servicing Rights – Key Valuation Assumptions63 Premises, Equipment and Leasehold Improvements64 Depreciation and Amortization Expense65 Time Deposits66 Borrowed Funds
105107107108110111112113114115116117118119120120120125126128130130131132133133134134135135135135136

THE PNC FINANCIAL SERVICES GROUP, INC.Cross-Reference Index to 2019 Form 10-K (continued)
NOTES TO CONSOLIDATED FINANCIAL STATEMENTS TABLE REFERENCE (Continued)
Table Description Page
67 FHLB Borrowings, Senior Debt and Subordinated Debt68 Reconciliation of Changes in Projected Benefit Obligation and Change in Plan Assets69 Asset Strategy Allocations70 Pension Plan Assets - Fair Value Hierarchy71 Estimated Cash Flows72 Components of Net Periodic Benefit Cost73 Net Periodic Costs - Assumptions74 Other Pension Assumptions75 Nonvested Incentive/Performance Unit Awards and Restricted Share/Restricted Share Unit Awards - Rollforward76 Total Gross Derivatives77 Gains (Losses) Recognized on Fair Value and Cash Flow Hedges in the Consolidated Income Statement78 Hedged Items - Fair Value Hedges79 Gains (Losses) on Derivatives Not Designated for Hedging80 Derivative Assets and Liabilities Offsetting81 Basic and Diluted Earnings Per Common Share82 Preferred Stock - Authorized, Issued and Outstanding83 Terms of Outstanding Preferred Stock84 Dividends Per Share85 Other Comprehensive Income (Loss)86 Accumulated Other Comprehensive Income (Loss) Components87 Components of Income Tax Expense88 Deferred Tax Assets and Liabilities89 Reconciliation of Statutory and Effective Tax Rates90 Net Operating Loss Carryforwards91 Change in Unrecognized Tax Benefits92 IRS Tax Examination Status93 Basel Regulatory Capital94 Commitments to Extend Credit and Other Commitments95 Parent Company - Income Statement96 Parent Company - Balance Sheet97 Parent Company - Interest Paid and Income Tax Refunds (Payments)98 Parent Company - Statement of Cash Flows99 Results of Businesses100 Retail Banking Noninterest Income Disaggregation101 Corporate & Institutional Banking Noninterest Income Disaggregation102 Asset Management Group Noninterest Income Disaggregation103 Sales-Type and Direct Financing Leases 104 Future Minimum Lease Payments of Lessor Arrangements 105 Operating Lease Term and Discount Rates of Lessee Arrangements106 Future Lease Payments of Operating Lease Liabilities
136138139140141141142142143144146146147149150150151151153154154155155155156156157162163163164164166167168168169169170170

The PNC Financial Services Group, Inc. – 2019 Form 10-K 1
PART IForward-Looking Statements: From time to time, The PNC Financial Services Group, Inc. has made and may continue to make written or oral forward-looking statements regarding our outlook for earnings, revenues, expenses, capital and liquidity levels and ratios, asset levels, asset quality, financial position and other matters regarding or affecting us and our future business and operations or the impact of legal, regulatory or supervisory matters on our business operations or performance. This Annual Report on Form 10-K (the Report or Form 10-K) also includes forward-looking statements. With respect to all such forward-looking statements, you should review our Risk Factors discussion in Item 1A, our Risk Management, Critical Accounting Estimates and Judgments, and Cautionary Statement Regarding Forward-Looking Information sections included in Item 7, and Note 19 Legal Proceedings in the Notes To Consolidated Financial Statements included in Item 8 of this Report. See page 79 for a glossary of certain terms used in this Report. In this Report, "PNC", "we", "us", "the Company" or "the Corporation" refers to The PNC Financial Services Group, Inc. and its subsidiaries on a consolidated basis (except when referring to PNC as a public company, its common stock or other securities issued by PNC, which just refer to The PNC Financial Services Group, Inc.). References to The PNC Financial Services Group, Inc. or to any of its subsidiaries are specifically made where applicable.
ITEM 1 – BUSINESS Business Overview
Headquartered in Pittsburgh, Pennsylvania, we are one of the largest diversified financial services companies in the United States (U.S.). We have businesses engaged in retail banking, including residential mortgage, corporate and institutional banking and asset management, providing many of our products and services nationally. Our retail branch network is located primarily in markets across the Mid-Atlantic, Midwest and Southeast. We also have strategic international offices in four countries outside the U.S. At December 31, 2019, our consolidated total assets, total deposits and total shareholders’ equity were $410.3 billion, $288.5 billion and $49.3 billion, respectively.
We were incorporated under the laws of the Commonwealth of Pennsylvania in 1983 with the consolidation of Pittsburgh National Corporation and Provident National Corporation. Since 1983, we have diversified our geographical presence, business mix and product capabilities through organic growth, strategic bank and non-bank acquisitions and equity investments, and the formation of various non-banking subsidiaries.
Subsidiaries
Our corporate legal structure at December 31, 2019 consisted of one domestic subsidiary bank, including its subsidiaries, and 38 active non-bank subsidiaries, in addition to various affordable housing investments and historic rehabilitation investments. Our bank subsidiary is PNC Bank, National Association (PNC Bank), a national bank headquartered in Pittsburgh, Pennsylvania. For additional information on certain of our subsidiaries, see Exhibit 21 to this Report.
Statistical Disclosure By Bank Holding Companies
The following statistical information is included on the indicated pages of this Report and is incorporated herein by reference:
Form 10-K page
Average Consolidated Balance Sheet And Net Interest Analysis 172Analysis Of Year-To-Year Changes In Net Interest Income 173Book Values Of Securities 42 and 118-120Maturities And Weighted-Average Yield Of Securities 43 and 120Loan Types 41-42, 57, 110-111 and 174Selected Loan Maturities And Interest Sensitivity 175Nonaccrual, Past Due And Restructured Loans And Other Nonperforming Assets 56-65, 96-100, 109-116 and 175Potential Problem Loans 56-65Summary Of Loan Loss Experience 63-65, 117 and 176Allocation Of Allowance For Loan And Lease Losses 63-65, and 176Average Amount And Average Rate Paid On Deposits 172Time Deposits Of $100,000 Or More 177Selected Consolidated Financial Data 33-35Short-term Borrowings – not included as average balances during 2019, 2018 and 2017 were less than 30% of
total shareholders’ equity at the end of each period.

2 The PNC Financial Services Group, Inc. – 2019 Form 10-K
Supervision and Regulation
The PNC Financial Services Group, Inc. is a bank holding company (BHC) registered under the Bank Holding Company Act of 1956 (BHC Act) and a financial holding company under the Gramm-Leach-Bliley Act (GLB Act).
We are subject to numerous governmental regulations, some of which are highlighted below. See Note 18 Regulatory Matters in the Notes To Consolidated Financial Statements in Item 8 of this Report for additional information regarding our regulatory matters. Applicable laws and regulations restrict our permissible activities and investments, impose conditions and requirements on the products and services we offer and the manner in which they are offered and sold, and require compliance with protections for loan, deposit, brokerage, fiduciary, investment management and other customers, among other things. They also restrict our ability to repurchase stock or pay dividends, or to receive dividends from our bank subsidiary, and impose capital adequacy and liquidity requirements. The consequences of noncompliance with these, or other applicable laws or regulations, can include substantial monetary and nonmonetary sanctions.
In addition, we are subject to comprehensive supervision and periodic examination by, among other regulatory bodies, the Board of Governors of the Federal Reserve System (Federal Reserve) and the Office of the Comptroller of the Currency (OCC). These examinations consider not only compliance with applicable laws, regulations and supervisory policies of the agency, but also capital levels, asset quality, risk management effectiveness, the ability and performance of management and the board of directors, the effectiveness of internal controls and internal audit function, earnings, liquidity and various other factors.
The results of examination activity by any of our federal bank regulators potentially can result in the imposition of significant limitations on our activities and growth. These regulatory agencies generally have broad discretion to impose restrictions and limitations on the operations of a regulated entity and take enforcement action, including the imposition of substantial monetary penalties and nonmonetary requirements, against a regulated entity where the relevant agency determines, among other things, that the operations of the regulated entity or any of its subsidiaries fail to comply with applicable law or regulations, are conducted in an unsafe or unsound manner, or represent an unfair or deceptive act or practice. This supervisory framework, including the examination reports and supervisory ratings (which are not publicly available) of the agencies, could materially impact the conduct, growth and profitability of our operations.
The Consumer Financial Protection Bureau (CFPB) is responsible for examining PNC Bank and its affiliates (including PNC) for compliance with most federal consumer financial protection laws, including the laws relating to fair lending and prohibiting unfair, deceptive or abusive acts or practices in connection with the offer, sale or provision of consumer financial products or services, and for enforcing such laws with respect to PNC Bank and its affiliates. The results of the CFPB’s examinations (which are not publicly available) also can result in restrictions or limitations on the operations of a regulated entity as well as enforcement actions against a regulated entity, including the imposition of substantial monetary penalties and nonmonetary requirements.
We also are subject to regulation by the Securities and Exchange Commission (SEC) by virtue of our status as a public company and by the SEC and the Commodity Futures Trading Commission (CFTC) due to the nature of some of our businesses. Our businesses with operations outside the United States also are subject to regulation by appropriate authorities in the foreign jurisdictions in which they do business.
As a regulated financial services firm, our relationships and good standing with regulators are of fundamental importance to the operation and growth of our businesses. The Federal Reserve, OCC, CFPB, SEC, CFTC and other domestic and foreign regulators have broad enforcement powers, and certain of the regulators have the power to approve, deny, or refuse to act upon our applications or notices to conduct new activities, acquire or divest businesses, assets or deposits, expand our operations geographically, or reconfigure existing operations.
Among the areas that have been receiving a high level of regulatory focus are cyber security, compliance with the Bank Secrecy Act and anti-money laundering laws, capital and liquidity management (including stress testing), the oversight of arrangements with third-party vendors and suppliers, the protection of confidential customer information, the structure and effectiveness of enterprise risk management frameworks, and compliance with fair lending and other consumer protection laws and regulations, including those governing retail sales practices, fee disclosures, unfair, deceptive or abusive acts or practices, collection practices, and protections for military service members and individuals in bankruptcy.
New legislation, changes in rules promulgated by federal financial regulators, other federal and state regulatory authorities and self-regulatory organizations, or changes in the interpretation or enforcement of existing laws and rules, may directly affect the operations and profitability of our businesses. We anticipate new legislative and regulatory initiatives over the next several years, focused specifically on banking and other financial services in which we are engaged. Legislative and regulatory developments to date, as well as those that come in the future, have had and are likely to continue to have an impact on the conduct of our business. The more detailed description of the significant regulations to which we are subject included in this Report is based on current laws and

The PNC Financial Services Group, Inc. – 2019 Form 10-K 3
regulations and is subject to potentially material change. See also the additional information included as Risk Factors in Item 1A of this Report discussing the impact of financial regulatory initiatives on the regulatory environment for us and the financial services industry.
The profitability of our businesses could also be affected by rules and regulations that impact the business and financial sectors in general, including changes to the laws governing taxation, antitrust regulation, electronic commerce, data security and privacy.
There are numerous rules governing the regulation of financial services institutions and their holding companies. Accordingly, the following discussion is general in nature and does not purport to be complete or to describe all of the laws, regulations and policies that apply to us. To a substantial extent, the purpose of the regulation and supervision of financial services institutions and their holding companies is not to protect our shareholders and our non-customer creditors, but rather to protect our customers (including depositors) and the financial markets and financial system in general.
Banking Regulation and SupervisionRegulatory Capital Requirements, Stress Testing and Capital Planning. PNC and PNC Bank are subject to the regulatory capital requirements established by the Federal Reserve and the OCC, respectively. The foundation of the agencies’ regulatory capital rules is the international regulatory capital framework developed by the Basel Committee on Banking Supervision (Basel Committee), the international body responsible for developing global regulatory standards for banking organizations for consideration and adoption by national jurisdictions. The regulatory capital rules establish minimum requirements for the ratio of a banking organization’s regulatory capital to its risk-weighted assets, referred to as risk-based capital requirements, as well as for the ratio of its regulatory capital to measures of assets and other exposures, referred to as leverage capital requirements. The agencies’ regulatory capital rules have undergone significant change since 2013, when the agencies adopted final rules to implement the Basel Committee's international regulatory capital framework, known as “Basel III”, as well as certain provisions of the Dodd-Frank Wall Street Reform and Consumer Protection Act (Dodd-Frank).
In 2019, the federal banking agencies adopted rules to better tailor the application of their capital, liquidity and enhanced prudential requirements for banking organizations to the asset size and risk profile (as measured by certain regulatory metrics) of the banking organization (the “2019 Tailoring Rules”). Effective January 1, 2020, the agencies’ capital and liquidity rules classify all bank holding companies (BHCs) with $100 billion or more in total assets into one of four categories (Category I, Category II, Category III and Category IV), with the most stringent capital and liquidity requirements applying to Category I firms and the least restrictive requirements applying to Category IV firms. The classification of any bank subsidiary of a BHC generally follows that of its parent BHC. PNC and PNC Bank currently are Category III firms because PNC (i) has more than $250 billion, but less than $700 billion, in consolidated total assets, (ii) is not designated as a globally systemically important bank (GSIB), and (iii) has less than $75 billion in cross-jurisdictional activity (as defined by the rules). PNC and PNC Bank would become a Category I or II institution, and subject to more stringent capital and liquidity standards, if PNC were at some point in the future to have $700 billion or more in total consolidated assets, be designated as a GSIB, or have $75 billion or more in cross-jurisdictional activity. As of December 31, 2019, PNC had cross-jurisdictional activities for these purposes of $13.4 billion.
The regulatory capital rules generally divide regulatory capital into three components: common equity Tier 1 (CET1) capital, additional Tier 1 capital (which, together with CET1 capital, comprises Tier 1 capital) and Tier 2 capital. CET1 capital is generally common stock, retained earnings, and qualifying minority interest less required deductions. Prior to January 1, 2020, CET1 capital for PNC and PNC Bank also included accumulated other comprehensive income (AOCI) related to both available for sale securities and pension and other post-retirement plans. Effective January 1, 2020, PNC and PNC Bank elected to exclude AOCI related to these items from CET1 capital. Additional Tier 1 capital generally includes, among other things, perpetual preferred stock and qualifying minority interests, less required deductions. Tier 2 capital generally comprises qualifying subordinated debt, less any required deductions from Tier 2 capital. The regulatory capital rules limit the extent to which minority interests in consolidated subsidiaries may be included in regulatory capital. Total capital is the sum of Tier 1 capital and Tier 2 capital, less the deductions required from Total capital.
Under the regulatory capital rules effective as of January 1, 2020, PNC and PNC Bank must deduct investments in unconsolidated financial institutions, mortgage servicing rights and deferred tax assets from CET1 capital (in each case, net of associated deferred tax liabilities) to the extent such items individually exceed 25% of the institution’s adjusted CET1 capital. Prior to January 1, 2020, PNC and PNC Bank had to deduct significant common stock investments in unconsolidated financial institutions, as well as mortgage servicing rights and deferred tax assets, from CET1 capital (in each case, net of associated deferred tax liabilities) to the extent such items individually exceeded 10%, or in the aggregate exceeded 15%, of the institution’s adjusted CET1 capital. PNC's common stock investment in BlackRock is treated as an investment (and a significant common stock investment) in an unconsolidated financial institution for these purposes. A significant amount of PNC's common stock investment in BlackRock, net of associated deferred tax liabilities, was subject to these threshold deductions under the rules applicable as of December 31, 2019. If the new rules had been in effect on that date, no amount of PNC's equity investment in BlackRock would have been subject to these threshold deductions.

4 The PNC Financial Services Group, Inc. – 2019 Form 10-K
The agencies’ capital rules also permit banking organizations to elect to phase-in, on a straight-line basis over a three-year period, the day-one regulatory capital effects of implementing the Financial Accounting Standards Board’s (FASB) Accounting Standards Update (ASU) 2016-13 Financial Instruments - Credit Losses (Topic 326), commonly referred to as the Current Expected Credit Losses (CECL) standard. PNC implemented the CECL standard effective January 1, 2020, but elected not to implement the phase-in of the day-one regulatory capital effects of the standard. See Note 1 Accounting Policies in the Notes to Consolidated Financial Statements in Item 8 of this Report for more detail on the CECL standard.
PNC and PNC Bank are required to use the standardized approach for determining a banking organization’s risk-weighted assets for purposes of calculating the risk-based capital ratios. The standardized approach for risk-weighted assets takes into account credit and market risk. To calculate risk-weighted assets under the standardized approach for credit risk, the nominal dollar amounts of assets and credit equivalent amounts of off-balance sheet items are generally multiplied by risk weights set forth in the rules, with the risk weights increasing as the perceived credit risk of the relevant asset or exposure increases. For certain types of exposures, such as securitization exposures, the standardized approach establishes one or more methodologies that are to be used to calculate the risk-weighted asset amount for the exposure. High volatility commercial real estate, past due, securitization and equity exposures, as well as mortgage servicing rights and deferred tax assets that are not deducted from capital, are generally subject to higher risk weights than other types of exposures. Under the market risk capital rule, risk-weighted asset amounts for covered trading positions are determined based on the calculation of value-at-risk (including stressed value-at-risk), specific risk, incremental risk and comprehensive risk amounts, as specified in the capital rules.
Prior to January 1, 2020, PNC and PNC Bank also were required to calculate risk-weighted assets using a separate methodology, referred to as the advanced approaches, that is based on the Basel II capital framework. Capital ratios calculated using this methodology would potentially have been applicable to PNC upon completion of a parallel run qualification phase. PNC remained in this phase as of the end of 2019, and accordingly, our regulatory risk-based capital ratios in 2019 were calculated using the standardized approach for determining risk-weighted assets.
With the exception of certain nonqualifying trust preferred capital securities included in PNC’s total risk-based capital (which remain subject to a phase-out period that runs through 2021), the transitions and multi-year phase-in of the definition of capital under the Basel III rules were completed as of January 1, 2018. Accordingly, we refer to the capital ratios calculated using the definition of capital in effect as of January 1, 2018 and, for the risk-based ratios, standardized risk-weighted assets, as our Basel III regulatory capital ratios.
The risk-based capital rules establish certain minimum standards for the capital ratios of banking organizations, including PNC and PNC Bank. Banking organizations must maintain a minimum CET1 ratio of 4.5%, a Tier 1 capital ratio of 6.0%, and a Total capital ratio of 8.0%, in each case in relation to risk-weighted assets, to be considered “adequately capitalized.” Banking organizations also must maintain a capital conservation buffer requirement above the minimum risk-based capital ratio requirements in order to avoid limitations on capital distributions (including dividends and repurchases of any Tier 1 capital instrument, such as common and qualifying preferred stock) and certain discretionary incentive compensation payments. The capital conservation buffer requirement became fully phased in as of January 1, 2019. As a result, banking organizations (including PNC and PNC Bank) now are required to maintain a CET1 capital ratio of at least 7.0%, a Tier 1 capital ratio of at least 8.5%, and a Total capital ratio of at least 10.5% to avoid limitations on capital distributions and certain discretionary incentive compensation payments.
For Category III banking organizations (such as PNC and PNC Bank), these higher capital conservation buffer levels above the regulatory minimums could be supplemented by a countercyclical capital buffer of up to an additional 2.5% of risk-weighted assets. This buffer is currently set at zero in the U.S. A Federal Reserve policy statement establishes the framework and factors the Federal Reserve would use in setting and adjusting the amount of the U.S. countercyclical capital buffer. Covered banking organizations would generally have 12 months after the announcement of any increase in the countercyclical capital buffer to meet the increased buffer requirement, unless the Federal Reserve determines to establish an earlier effective date. If the full countercyclical buffer amount is implemented, PNC and PNC Bank would be required to maintain a CET1 capital ratio of at least 9.5%, a Tier 1 capital ratio of at least 11%, and a Total capital ratio of at least 13% to avoid limitations on capital distributions and certain discretionary incentive compensation payments.
The regulatory capital rules also require that banking organizations maintain a minimum amount of Tier 1 capital to average consolidated assets, referred to as the leverage ratio, and require Category III banking organizations to maintain a minimum amount of Tier 1 capital to total leverage exposure, referred to as the supplementary leverage ratio. Total leverage exposure takes into account on-balance sheet assets as well as certain off-balance sheet items, including loan commitments and potential future exposure under derivative contracts. Banking organizations are required to maintain a minimum leverage ratio of Tier 1 capital to total assets of 4.0%, and Category III banking organizations must maintain a minimum supplementary leverage ratio of 3.0%. As of December 31, 2019, the leverage and supplementary leverage ratios of PNC and PNC Bank were above the required minimum level.

The PNC Financial Services Group, Inc. – 2019 Form 10-K 5
PNC and PNC Bank are not subject to the additional CET1 capital surcharge, minimum long-term debt requirement, minimum total loss-absorbing capacity (TLAC), or enhanced supplementary leverage ratio requirements that apply to U.S. GSIBs.
Failure to meet applicable capital requirements could subject a banking organization to a variety of enforcement remedies available to the federal banking agencies, including a limitation on the ability to pay dividends or repurchase shares, the issuance of a capital directive to increase capital and, in severe cases, the termination of deposit insurance by the FDIC and the appointment of a conservator or receiver. In some cases, the extent of these powers depends upon whether the institution in question is considered “well capitalized,” “adequately capitalized,” “undercapitalized,” “significantly undercapitalized” or “critically undercapitalized.” The thresholds at which an insured depository institution is considered “well capitalized,” “adequately capitalized,” “undercapitalized,” “significantly undercapitalized” or “critically undercapitalized” are based on (i) the institution’s CET1, Tier 1 and total risk-based capital ratios; (ii) the institution’s leverage ratio; and (iii) for the definitions of “adequately capitalized” and “undercapitalized”, the institution’s supplementary leverage ratio (if applicable). Generally, the smaller an institution’s capital base in relation to its risk-weighted or total assets, the greater the scope and severity of the agencies’ powers. Business activities may also be affected by an institution’s capital classification. For example, as a financial holding company, PNC and PNC Bank must remain “well capitalized.”
At December 31, 2019, PNC and PNC Bank exceeded the required ratios for classification as “well capitalized.” For additional discussion of capital adequacy requirements, including the levels of capital required to be considered “well capitalized,” see the Liquidity and Capital Management portion of the Risk Management section of Item 7 of this Report and Note 18 Regulatory Matters in the Notes To Consolidated Financial Statements in Item 8 of this Report.
In addition to regulatory capital requirements, we are subject to the Federal Reserve’s capital plan rule, capital stress testing requirements and Comprehensive Capital Analysis and Review (CCAR) process, as well as the Dodd-Frank capital stress testing (DFAST) requirements of the Federal Reserve and the OCC.
As part of the annual CCAR process, the Federal Reserve undertakes a supervisory assessment of the capital planning process of BHCs, including PNC, that have $100 billion or more in total consolidated assets. For us, this capital planning assessment is based on a review of a comprehensive capital plan submitted to the Federal Reserve that describes the company’s planned capital actions, such as plans to pay or increase common stock dividends, engage in common stock repurchase programs, or issue or redeem preferred stock or other regulatory capital instruments, during the nine quarter review period, as well as the results of stress tests conducted by both the company and the Federal Reserve under different hypothetical macro-economic scenarios, including a supervisory severely adverse scenario provided by the Federal Reserve.
The Federal Reserve can object to a BHC’s capital plan if the Federal Reserve estimates that under the hypothetical supervisory macro-economic scenarios (including the supervisory severely adverse scenario) the BHC would not be able to maintain, throughout each quarter of the nine quarter review period, projected regulatory risk-based and leverage capital ratios that exceed the applicable minimums. In making these estimates, the Federal Reserve assumes that the BHC would continue its base case capital actions in each supervisory scenario, including the severely adverse scenario. If the Federal Reserve objects to a BHC’s capital plan, the BHC cannot make capital distributions without Federal Reserve approval.
In evaluating PNC’s capital plan, the Federal Reserve also considers a number of qualitative factors. The Federal Reserve’s supervisory expectations for the capital planning and stress testing processes at large and complex BHCs, including PNC, are heightened relative to smaller and less complex BHCs. In assessing a BHC’s capital planning and stress testing processes, the Federal Reserve considers whether the BHC has sound and effective governance to oversee these processes. The Federal Reserve’s evaluation focuses on whether a BHC’s capital planning and stress testing processes are supported by a strong risk management framework to identify, measure and assess material risks and that provides a strong foundation to capital planning. The Federal Reserve also considers the comprehensiveness of a BHC’s control framework and evaluates a BHC’s policy guidelines for capital planning and assessing capital adequacy. A BHC’s stress testing scenario design processes and approaches for estimating the impact of stress on its capital position, including stress testing models and non-model qualitative approaches, are comprehensively reviewed to ensure that projections reflect the impact of appropriately stressful conditions, as well as risks idiosyncratic to the BHC, on its capital position. Significant deficiencies in a BHC’s capital planning and stress testing processes may result in supervisory directives that require the firm to address the identified deficiencies and, potentially, a downgrade in the BHC’s supervisory capital positions and planning rating.
In connection with the 2020 CCAR exercise, we must file our capital plan and stress testing results using financial data as of December 31, 2019, with the Federal Reserve by April 6, 2020. We expect to receive the Federal Reserve’s response (either a non-objection or objection) to the capital plan submitted as part of the 2020 CCAR in June 2020.
As part of the annual CCAR and biennial company-run DFAST processes, both we and the Federal Reserve release certain revenue, loss and capital results from stress testing exercises. For the 2020 exercises, the Federal Reserve has announced that it intends to publish its supervisory revenue, loss and capital projections for participating BHCs under the severely adverse macro-economic

6 The PNC Financial Services Group, Inc. – 2019 Form 10-K
scenarios using the common assumptions concerning capital distributions established by the Federal Reserve in its DFAST regulations, as well as capital ratio information using the company’s proposed base case capital actions. As a Category III institution, PNC must conduct a company-run DFAST stress test biennially in even numbered years. In those years when a company-run DFAST stress test is required, we are required to publicly disclose our own estimates of certain capital, revenue and loss information under the agencies' hypothetical supervisory severely adverse macro-economic scenario and apply the agencies' DFAST capital action assumptions within 15 days of the Federal Reserve publishing its DFAST results.
The Federal Reserve’s capital plan rule provides that a BHC must resubmit a new capital plan prior to the next annual submission date if, among other things, there has been or will be a material change in the BHC’s risk profile, financial condition or corporate structure since its last capital plan submission. Under the “de minimis” safe harbor of the Federal Reserve’s capital plan rule, we may make limited repurchases of common stock or other capital distributions in amounts that exceed the amounts included in our most recently approved capital plan subject to certain conditions, including that the Federal Reserve does not object to the additional repurchases or distributions. Such additional distributions may not exceed, in the aggregate, 0.25% of Tier 1 capital during the relevant 12-month period. The Federal Reserve’s capital plan rule also allows a BHC to request the Federal Reserve’s approval to make additional capital distributions, above the amounts permitted by this de minimis safe harbor and the amounts included in its most recently approved capital plan, provided that, among other things, the request is filed between July 1 and March 30 of the relevant capital plan year. As announced in January 2020, PNC received approval from the Federal Reserve for additional capital distributions above the amounts included in the capital plan we submitted in connection with the 2019 CCAR process. See the Liquidity and Capital Management portion of the Risk Management section in Item 7 of this Report for additional detail.
In 2018, the Federal Reserve requested public comment on a proposal that would integrate its capital plan rule, stress test rules and the annual CCAR exercise with its Basel III regulatory capital rules. Among other things, the proposal would introduce new CET1 and Tier 1 leverage stress capital buffer that would replace the Basel III capital conservation buffer for covered BHCs. Under the proposal, PNC would be subject to limitations on capital distributions and certain discretionary incentive compensation payments if its CET1 ratio fell below (i) 4.5%, plus (ii) its applicable CET1 stress capital buffer, plus (iii) any applicable countercyclical capital buffer (which is currently set at zero in the United States). In connection with these changes, the Federal Reserve proposed to make a number of other changes to the CCAR process. It is unclear when, or if, the Federal Reserve may finalize all, or portions of, this proposal or when such provisions (if adopted in final) might become effective. In addition, any final rules adopted by the Federal Reserve could differ, perhaps materially, from the proposal.
Regulatory Liquidity Standards and Liquidity Risk Management Requirements. The Basel Committee’s Basel III framework includes short-term liquidity standards (Liquidity Coverage Ratio or LCR) and long-term funding standards (Net Stable Funding Ratio or NSFR).
The U.S. banking agencies’ LCR rules are designed to ensure that covered banking organizations maintain an adequate level of cash and high quality, unencumbered liquid assets (HQLA) to meet estimated net liquidity needs in a short-term stress scenario using liquidity inflow and outflow assumptions prescribed in the rules (net cash outflow). A company’s LCR is the amount of its HQLA, as defined and calculated in accordance with the haircuts and limitations in the rule, divided by its net cash outflows, with the quotient expressed as a percentage. The regulatory minimum LCR that covered banking organizations are required to maintain is 100%. PNC and PNC Bank are required to calculate the LCR on a daily basis. If either institution’s LCR is below the minimum requirement for three consecutive business days, the institution must promptly provide its regulator with a plan for achieving compliance with the minimum LCR requirement. As of December 31, 2019, the LCR for PNC and PNC Bank exceeded the required minimum levels.
Effective January 1, 2020, PNC and PNC Bank, as Category III institutions with less than $75 billion in weighted short-term wholesale funding (as defined by the rules), are subject to a reduced LCR requirement, with each company’s net outflows (as calculated under the rules) reduced by 15%, thereby reducing the amount of HQLA each institution must hold to meet the LCR minimum requirement. As of December 31, 2019, PNC had weighted short-term wholesale funding for these purposes of $26.3 billion.
The Federal Reserve requires large BHCs, including PNC, to publicly disclose certain quantitative and qualitative measures of their LCR-related liquidity profile. These disclosures include major components used to calculate the LCR (e.g., HQLA, cash outflows and inflows for the consolidated parent company), and a qualitative discussion of the BHC’s LCR results, including, among other things, key drivers of the results, composition of HQLA and concentration of funding sources.
The NSFR is designed to promote a stable maturity structure of assets and liabilities of banking organizations over a one-year time horizon. In 2016, the federal banking agencies requested comment on proposed rules that would implement the NSFR in the United States. The proposed rules would require a covered BHC to calculate its NSFR as the ratio of its available stable funding (ASF) to its required stable funding (RSF) amount, each as defined in the proposed rules, over a one-year horizon. The regulatory minimum ratio for all covered banking organizations (expressed as a percentage) is 100%. In the 2019 Tailoring Rules, the agencies indicated that the RSF for Category III institutions with less than $75 billion in weighted short-term wholesale funding would be reduced by 15% in any

The PNC Financial Services Group, Inc. – 2019 Form 10-K 7
final NSFR rule, thereby reducing the amount of ASF that the institution would have to maintain to meet its NSFR minimum ratio. The agencies' 2016 NSFR proposal also includes requirements for quarterly quantitative and qualitative NSFR disclosures. Although the impact on us will not be fully known until the rules are finalized, we have taken several actions to prepare for implementation of the NSFR and we expect to be in compliance with the NSFR requirements applicable to PNC and PNC Bank if and when they become effective.
As a Category III institution, PNC also is subject to Federal Reserve rules that require PNC to, among other things, conduct internal liquidity stress tests over a range of time horizons, maintain a buffer of highly liquid assets sufficient to meet projected net outflows under the BHC’s 30-day liquidity stress test, and maintain a contingency funding plan that meets certain requirements.
For additional discussion of regulatory liquidity requirements, refer to the Liquidity and Capital Management portion of the Risk Management section of Item 7 of this Report.
Source of Parent Company Liquidity and Dividends. The principal source of our liquidity at the parent company level is dividends from PNC Bank. PNC Bank is subject to various restrictions on its ability to pay dividends to PNC Bancorp, Inc., its direct parent, which is a wholly-owned direct subsidiary of The PNC Financial Services Group, Inc. PNC Bank is also subject to federal laws limiting extensions of credit to its parent holding company and non-bank affiliates as discussed in Note 18 Regulatory Matters in the Notes To Consolidated Financial Statements in Item 8 of this Report. Further information on bank level liquidity and parent company liquidity is also available in the Liquidity and Capital Management portion of the Risk Management section of Item 7 of this Report.
Federal Reserve rules provide that a BHC is expected to serve as a source of financial strength to its subsidiary banks and to commit resources to support such banks if necessary. Dodd-Frank requires that the Federal Reserve jointly adopt new rules with the OCC and the FDIC to implement this source of strength requirement. These joint rules have not yet been proposed. Consistent with this source of strength policy for subsidiary banks, the Federal Reserve has stated that, as a matter of prudent banking, a BHC generally should not maintain a rate of cash dividends unless its net income available to common shareholders has been sufficient to fully fund the dividends and the prospective rate of earnings retention appears to be consistent with the corporation’s capital needs, asset quality and overall financial condition. Further, in providing guidance to the large BHCs participating in the CCAR exercise, discussed above, the Federal Reserve has expected capital plans to reflect conservative dividend payout ratios. Requests that imply common dividend payout ratios above 30% of projected after-tax net income available to common shareholders have typically received particularly close scrutiny.
Enhanced Prudential Requirements. Under Federal Reserve rules, PNC and other BHCs with total consolidated assets of $100 billion or more are subject to various enhanced prudential standards related to liquidity risk management and overall risk management. For PNC, these rules, among other things, establish liquidity stress testing requirements (discussed above), limitations on PNC’s aggregate net credit exposures to any single, unaffiliated company (referred to as the single counterparty credit limit (SCCL)), and certain oversight and governance responsibilities for PNC's chief risk officer, the board of directors, and the risk committee of the board of directors. Under the Federal Reserve’s SCCL rules, which become effective July 1, 2020, PNC’s aggregate net credit exposure (including exposure resulting from, among other transactions, extensions of credit, repurchase and reverse repurchase transactions, investments in securities, and derivative transactions) to any unaffiliated counterparty may not exceed 25% of PNC’s Tier 1 capital. The rules permit a covered BHC to reduce its gross credit exposure to a counterparty by entering into an eligible credit or equity derivative with an eligible guarantor (as those terms are defined in the rules) that hedges the covered BHC’s exposure to the counterparty. For SCCL purposes, PNC's gross credit exposure arising from its equity investment in BlackRock, which is accounted for under the equity method, is the carrying value of the investment. PNC remains in discussions with the Federal Reserve regarding the possibility of reducing PNC's credit exposure to BlackRock for purposes of the SCCL by the amount of the deferred tax liability associated with the investment.
The Federal Reserve is required to impose a maximum 15-to-1 debt to equity ratio on a BHC if the federal agencies that comprise the Financial Stability Oversight Council (FSOC) determine that the company poses a grave threat to the financial stability of the United States and that the imposition of such a debt-to-equity requirement would mitigate such risk. The Federal Reserve also is required to establish early remediation requirements for BHCs with more than $250 billion in total assets and continues to work towards finalizing these requirements.
The Federal Reserve may continue to develop the set of enhanced prudential standards that apply to large BHCs in order to further promote the resiliency of such firms and the U.S. financial system. For additional information, see Item 1A Risk Factors of this Report.
Additional Powers Under the GLB Act. The GLB Act permits a qualifying BHC, such as PNC, to become a “financial holding company” and thereby engage in, or affiliate with financial companies engaging in, a broader range of activities than would otherwise be permitted for a BHC. Permitted affiliates include securities underwriters and dealers, insurance companies, insurance agents and companies engaged in other activities that are determined by the Federal Reserve, in consultation with the Secretary of the Treasury, to
8 The PNC Financial Services Group, Inc. – 2019 Form 10-K
be “financial in nature or incidental thereto” or are determined by the Federal Reserve unilaterally to be “complementary” to financial activities. We became a financial holding company in 2000. A BHC qualifies to become a financial holding company if the BHC and its subsidiary depository institutions are “well capitalized” and “well managed” and its subsidiary depository institutions have a rating under the Community Reinvestment Act (CRA) of Satisfactory or better. Among other activities, we currently rely on our status as a financial holding company to conduct merchant banking activities and securities underwriting and dealing activities. As subsidiaries of a financial holding company under the GLB Act, our non-bank subsidiaries are generally allowed to conduct new financial activities, and we generally are permitted to acquire non-bank financial companies that have less than $10 billion in assets, with after-the-fact notice to the Federal Reserve.
In addition, the GLB Act permits qualifying national banks to engage in expanded activities through a “financial subsidiary.” PNC Bank has filed a financial subsidiary certification with the OCC and currently engages in insurance agency activities through financial subsidiaries. PNC Bank may also generally engage through a financial subsidiary in any activity that is determined to be financial in nature or incidental to a financial activity by the Secretary of the Treasury, in consultation with the Federal Reserve (other than insurance underwriting activities, insurance company investment activities and merchant banking). In order to establish a financial subsidiary, a national bank and each of its depository institution affiliates must be “well capitalized” and “well managed” and the national bank and each of its depository institution affiliates must have a CRA rating of Satisfactory or better.
If a financial holding company or a national bank with a financial subsidiary fails to continue to meet the applicable “well capitalized” or “well managed” criteria, the financial holding company or national bank must enter into an agreement with the Federal Reserve or the OCC, respectively, that, among other things, identifies how the capital or management deficiencies will be corrected. Until such deficiencies are corrected, the relevant agency may impose limits or conditions on the activities of the company or bank, and the company or bank may not engage in, or acquire a company engaged in, the types of expanded activities only permissible for a financial holding company or financial subsidiary without prior approval of the relevant agency.
In addition, a financial holding company generally may not engage in a new financial activity authorized by the GLB Act, or acquire a company engaged in such a new activity, if any of its insured depository institutions receives a CRA rating of less than Satisfactory. A national bank’s financial subsidiary generally may not engage in a new financial activity authorized by the GLB Act, or acquire a company engaged in such a new financial activity, if the national bank or any of its insured depository institution affiliates received a CRA rating of less than Satisfactory.
At December 31, 2019, PNC Bank had an Outstanding rating with respect to the CRA. On December 12, 2019, the OCC and the FDIC requested comment on a proposal to modernize their regulations implementing the CRA. The proposal would significantly alter what activities by a bank qualify for CRA credit, where such activities must be conducted to receive credit, how the agencies measure a bank’s CRA performance, and how a bank must document and report its CRA qualifying activities. PNC is currently assessing the proposal and its potential implications for PNC and its local communities. Comments on the proposal currently are due by April 8, 2020. It is unclear when, or if, the OCC and FDIC may finalize this proposal or when its provisions (if adopted in final) might become effective. In addition, any final rule adopted by the OCC and FDIC could differ, perhaps materially, from the proposal issued for comment.
Volcker Rule. The Volcker Rule and its implementing regulations prohibit banking entities (as defined by the statute and its implementing regulations) from engaging in short-term trading as principal and having certain ownership interests in and relationships with hedge funds, private equity funds, and certain other private funds (together, “covered funds”), unless an exemption or exception applies. For example, the exemptions under the Volcker Rule allow banking entities to trade as principal for securities underwriting, market making and risk-mitigating hedging purposes, subject to a variety of conditions.
To date, the prohibitions under the final Volcker Rule regulations have not had, and we do not expect them to have in the future, a material effect on our businesses or revenue. However, the conditions for engaging in exempted trading activities and having permissible relationships with a private fund under the regulations could, depending on the agencies’ approach to interpreting them, cause us to forego engaging in hedging or other transactions that we would otherwise undertake in the ordinary course of business and, thus, to some extent, may limit our ability to most effectively hedge our risks, manage our balance sheet or provide products or services to our customers. We also have divested prohibited investments in covered funds and received extensions allowing an extended conformance period for our remaining $.1 billion interests in illiquid covered funds (as defined by the applicable requirements).
In 2019, the federal banking agencies, SEC, and CFTC approved changes to the regulations implementing the Volcker Rule that, among other things, (i) simplified the compliance requirements for engaging in permissible underwriting, market-making, and risk-mitigating hedging trading activities, and (ii) simplified and tailored the compliance program requirements for banking entities (like PNC) that have trading assets and liabilities of more than $1 billion, but less than $20 billion. As permitted by the rules, PNC elected to comply with these modified requirements beginning January 1, 2020.

The PNC Financial Services Group, Inc. – 2019 Form 10-K 9
In January 2020, the agencies requested comment on proposed changes to their regulations implementing the covered fund restrictions in the Volcker Rule. These proposed changes would, among other things, broaden the types of private funds that a banking entity may sponsor or invest in, and permit a banking entity to engage in additional types of transactions with a covered fund that it sponsors or advises. Comments on the proposed changes are due by April 1, 2020.
Other Federal Reserve and OCC Regulation and Supervision. The federal banking agencies possess broad powers to take corrective action as deemed appropriate based on the actions, operations or risk management programs of a BHC, an insured depository institution or their subsidiaries, and the Federal Reserve and the OCC have the ability to take enforcement action against PNC and PNC Bank, respectively, to prevent and remedy acts and practices that the agencies determine to be unfair or deceptive. A finding that we have engaged in a deceptive act or practice may have collateral consequences on our ability to rely on certain exemptions, or take advantage of certain provisions of, the securities laws absent a government waiver of such restrictions.
Moreover, less than satisfactory examination ratings, lower capital ratios than peer group institutions, or regulatory concerns regarding management, controls, assets, operations or other factors can all potentially result in practical limitations on the ability of a bank or BHC to engage in new activities, grow, acquire new businesses, repurchase its stock or pay dividends, or continue to conduct existing activities. Furthermore, the OCC has established certain heightened risk management and governance standards for large banks, including PNC Bank, as enforceable guidelines under Section 39 of the Federal Deposit Insurance Act (FDI Act). The guidelines, among other things, establish minimum standards for the design and implementation of a risk governance framework, describe the appropriate risk management roles and responsibilities of front line units, independent risk management, internal audit, and the board of directors, and provide that a covered bank should have a comprehensive written statement that articulates its risk appetite and serves as a basis for the framework. If the OCC determines that a covered national bank is not in compliance with these or other guidelines established under Section 39 of the FDI Act (including the guidelines relating to information security standards), the OCC may require the bank to submit a corrective action plan and may initiate enforcement action against the bank if an acceptable plan is not submitted or the bank fails to comply with an approved plan.
Sections 23A and 23B of the Federal Reserve Act and the Federal Reserve’s implementing regulation, Regulation W, place quantitative and qualitative restrictions on covered transactions between a bank and its affiliates (for example between PNC Bank, on the one hand, and The PNC Financial Services Group, Inc. and its nonbank subsidiaries, on the other hand). In general, Section 23A and Regulation W limit the total amount of covered transactions between a bank and any single affiliate to 10% of the bank’s capital stock and surplus, limit the total amount of covered transactions between a bank and all its affiliates to 20% of the bank’s capital stock and surplus, prohibit a bank from purchasing low-quality assets from an affiliate, and require certain covered transactions to be secured with prescribed amounts of collateral. Section 23B generally requires that transactions between a bank and its affiliates be on terms that are at least as favorable to the bank as the terms that would apply in comparable transactions between the bank and a third party. Dodd-Frank amended Section 23A of the Federal Reserve Act to include as a covered transaction the credit exposure of a bank to an affiliate arising from a derivative transaction with the affiliate. The Federal Reserve has yet to propose rules to implement these revisions.
The Federal Reserve Act and Federal Reserve regulations also place quantitative limitations and conditions on extensions of credit by a bank to its executive officers, directors, or principal shareholders and their related interests (including any company controlled by such persons). Generally, extensions of credit by a bank to such individuals, companies, and related interests must comply with certain individual and aggregate lending limits, as well as procedural and qualitative requirements. As a result of the amount of PNC common stock held by its advised mutual funds and other accounts, the Vanguard Group is considered a principal shareholder of PNC Bank for purposes of these regulations. In December 2019, the federal banking agencies issued an interagency statement addressing the application of these insider lending restrictions to the other portfolio companies owned or controlled by the advised funds and accounts of a fund complex that could be considered a principal shareholder of a bank. The statement is effective through January 1, 2021, by which time the Federal Reserve has indicated it hopes to propose amendments to its regulations to address the application of these insider lending restrictions to the portfolio companies held by a principal shareholder fund complex on a more permanent basis.
The Federal Reserve and the OCC have provided guidance regarding incentive and other elements of compensation provided to executives and other employees at banking organizations they regulate, both as general industry-wide guidance and guidance specific to select larger companies, including PNC. These guidelines are intended to ensure that the incentive compensation practices of covered banking organizations do not encourage excessive risk-taking. Dodd-Frank requires the Federal Reserve, the OCC, the FDIC, the SEC and two other regulatory agencies to adopt regulations governing incentive compensation provided by regulated financial services companies to their executives and other employees. These agencies jointly proposed regulations in 2011 and again in 2016 to implement these requirements. Final regulations have not been adopted. Regulation of compensation provided to our executives and other employees, whether through guidance or rules and regulations, could hamper our ability to attract and retain quality employees.
The trust, investment advisory and other fiduciary activities conducted by PNC Bank also are subject to the OCC’s regulations governing the fiduciary activities of national banks, as well as applicable state fiduciary laws. The OCC’s regulations, among other

10 The PNC Financial Services Group, Inc. – 2019 Form 10-K
things, set standards for the administration of fiduciary accounts, prohibit or govern potential conflicts of interests, and establish recordkeeping requirements for fiduciary accounts.
The Federal Reserve’s prior approval is required whenever we propose to acquire all or substantially all of the assets of any bank, to acquire direct or indirect ownership or control of more than 5% of any class of voting securities of any bank or BHC, or to merge or consolidate with any other BHC. The BHC Act and other federal law enumerates the factors the Federal Reserve must consider when reviewing the merger of BHCs, the acquisition of banks or the acquisition of voting securities of a bank or BHC. These factors include the competitive effects of the proposal in the relevant geographic markets; the financial and managerial resources and future prospects of the companies and banks involved in the transaction; the effect of the transaction on the financial stability of the United States; the organizations’ compliance with anti-money laundering laws and regulations; the convenience and needs of the communities to be served; and the records of performance under the CRA of the insured depository institutions involved in the transaction.
The Federal Reserve’s prior approval also is required, and similar factors are considered, for a BHC to acquire direct or indirect ownership or control of more than 5% of any class of voting securities of a savings association or savings and loan holding company, or to merge or consolidate with a savings and loan holding company. In cases involving interstate bank acquisitions, the Federal Reserve also must consider the concentration of deposits nationwide and in certain individual states. A BHC is generally prohibited from merging or consolidating with, or acquiring, another company or bank if upon consummation the resulting company would control 10% or more of deposits in the U.S. or a state, or if the resulting company’s liabilities would exceed 10% of the aggregate liabilities of the U.S. financial sector (including the U.S. liabilities of foreign financial companies). In extraordinary cases, the FSOC, in conjunction with the Federal Reserve, could order the break-up of financial firms that are deemed to present a grave threat to the financial stability of the United States.
OCC prior approval is required for PNC Bank to acquire another insured bank or savings association by merger or to acquire deposits or substantially all of the assets of such institutions. In deciding whether to approve such a transaction, the OCC is required to consider factors similar to those that must be considered by the Federal Reserve in connection with the acquisition of a bank or BHC. Approval of the OCC and the FDIC is required to merge a nonbank entity into PNC Bank. Our ability to grow through acquisitions or reorganize our operations could be limited by these approval requirements.
In 2020, the Federal Reserve finalized rules governing when a BHC is presumed to “control” another company for purposes of the BHC Act, thereby causing the company to be considered a subsidiary for purposes of the BHC Act. The rules establish a set of presumptions identifying when a BHC would be deemed to control another company, with the nature and scope of relationships a BHC may have with a non-controlled company (e.g., director or officer representatives, scope of business relationships, etc.) declining as the BHC’s voting ownership percentage in the company increases. Under the final rules, PNC is presumed to control BlackRock for purposes of the BHC Act as a result of its ownership interest and certain rights that PNC has under its stockholders agreement with BlackRock, which would cause BlackRock to be considered a subsidiary of PNC for purposes of the BHC Act and subject to the supervision and regulation of the Federal Reserve. For financial reporting purposes, BlackRock is not considered a subsidiary of PNC and BlackRock is responsible for, and has control over, the preparation of its financial statements and its internal controls over financial reporting. See additional detail on our investment in BlackRock in Item 1A Risk Factors, Business Segments Review in Item 7 and Note 22 Segment Reporting in the Notes To Consolidated Financial Statements.
FDIC Insurance and Related Matters. PNC Bank is insured by the FDIC and subject to deposit premium assessments. Regulatory matters could increase the cost of FDIC deposit insurance premiums to an insured bank as FDIC deposit insurance premiums are “risk based.” Therefore, higher fee percentages would be charged to banks that have lower capital ratios or higher risk profiles. These risk profiles take into account, among other things, weaknesses that are found by the primary federal banking regulator through its examination and supervision of the bank and the bank’s holdings of assets or liabilities classified as higher risk by the FDIC, including brokered deposits. A negative evaluation by the FDIC or a bank’s primary federal banking regulator could increase the costs to a bank and result in an aggregate cost of deposit funds higher than that of competing banks in a lower risk category.
PNC Bank is subject to certain enhanced deposit insurance recordkeeping requirements adopted by the FDIC, which are designed to assist the FDIC to promptly determine whether, or to what extent, a large bank’s deposits are covered by deposit insurance if the bank were to fail. These requirements go into effect on April 1, 2020, although banks may request an extension of this compliance date in certain circumstances for up to one year.
Federal banking laws and regulations also apply a variety of requirements or restrictions on insured depository institutions with respect to brokered deposits. For instance, only a “well capitalized” insured depository institution may accept brokered deposits without prior regulatory approval. In addition, brokered deposits are generally subject to higher outflow assumptions than other types of deposits for purposes of the LCR. In December 2019, the FDIC requested comment on proposed rules that would define when a deposit is considered brokered and implement certain statutory exemptions to this classification. The proposed rules have the potential to create additional uncertainty regarding the types of deposits that must be considered brokered. Changes to the scope of the definition of brokered deposits, or limitations on the scope of the statutory exemptions from this classification could, among other

The PNC Financial Services Group, Inc. – 2019 Form 10-K 11
things, affect PNC’s deposit insurance premiums and projected outflow rates under regulatory liquidity requirements. The comment period on the proposal extends through April 10, 2020, and it is unclear, at this time, whether or in what form the proposal might be finalized or when, if adopted in final, it would become effective.
Resolution and Recovery Planning. BHCs that have $100 billion or more in assets, such as PNC, are required to periodically submit to the Federal Reserve and the FDIC a resolution plan that includes, among other things, an analysis of how the company could be resolved in a rapid and orderly fashion if the company were to fail or experience material financial distress. The Federal Reserve and the FDIC may jointly impose restrictions on a covered BHC, including additional capital requirements or limitations on growth, if the agencies jointly determine that the company’s plan is not credible or would not facilitate a rapid and orderly resolution of the company under the U.S. Bankruptcy Code (or other applicable resolution framework), and additionally could require the company to divest assets or take other actions if the company did not submit an acceptable resolution plan within two years after any such restrictions were imposed. The FDIC also requires large insured depository institutions, including PNC Bank, to periodically submit a resolution plan to the FDIC that includes, among other things, an analysis of how the institution could be resolved under the FDI Act in a manner that protects depositors and limits losses or costs to creditors of the bank in accordance with the FDI Act. PNC and PNC Bank are required to provide the Federal Reserve and FDIC a public summary of their resolution plans, which the agencies then make available to the public. Depending on how the agencies conduct their review of the resolution plans submitted by PNC and PNC Bank, these requirements could affect the ways in which PNC structures and conducts its business and result in higher compliance and operating costs.
PNC generally must file a resolution plan with the Federal Reserve and FDIC at least once each three year period, with submissions alternating between a full plan and a plan targeted on certain areas or subjects identified by the agencies. PNC’s next resolution plan is scheduled to be a targeted plan and is due to be filed by July 1, 2021. The agencies, however, have reserved the ability to alter the scheduled filing date for a covered company, request an interim update before a covered company’s next scheduled filing date, and require a covered company to submit a full resolution plan in lieu of a scheduled targeted plan. The FDIC is currently conducting a rulemaking with respect to its resolution planning requirements for insured banks and has indicated that banks will not be expected to file a resolution plan with the FDIC until this rulemaking is completed.
PNC Bank also is subject to OCC guidelines under Section 39 of the FDI Act that establish standards for recovery planning. These guidelines require a covered bank to develop and maintain a recovery plan that is evaluated and updated annually that, among other things, identifies a range of options that could be undertaken by the covered bank to restore its financial strength and viability should identified triggering events occur. The recovery plan guidelines are enforceable in the same manner as the other guidelines the OCC has established under Section 39 of the FDI Act.
CFPB Regulation and Supervision. The CFPB examines PNC and PNC Bank for compliance with a broad range of federal consumer financial laws and regulations, including the laws and regulations that relate to deposit products, credit card, mortgage, automobile, student and other consumer loans, and other consumer financial products and services that we offer. The consumer financial protection laws that are subject to the CFPB’s supervision and enforcement powers include, among others, the Truth in Lending Act, Truth in Savings Act, Home Mortgage Disclosure Act, Fair Credit Reporting Act, Electronic Funds Transfer Act, Real Estate Settlement Procedures Act, Fair Debt Collections Practices Act, Equal Credit Opportunity Act and Fair Housing Act. The CFPB also has authority to take enforcement actions to prevent and remedy acts and practices relating to consumer financial products and services that it deems to be unfair, deceptive or abusive, and to impose new disclosure requirements for any consumer financial product or service.
The CFPB may issue regulations that impact products and services offered by PNC or PNC Bank. The regulations could reduce the fees that we receive, require that we provide additional consumer disclosures, alter the way we provide our products and services, impair our ability to compete with other providers of financial products or services, or expose us to greater risk of private litigation or regulatory enforcement action. The CFPB has engaged in rulemakings that affect, among other things, consumer remittance transfers, the qualified mortgage definition under the Truth in Lending Act, the Home Mortgage Disclosure Act, the Fair Debt Collection Practices Act, and payday, vehicle title, and certain high-cost installment loans and may establish, or modify, rules governing other aspects of consumer financial products or services in the future.
Securities and Derivatives RegulationOur registered broker-dealer and investment adviser subsidiaries are subject to the Securities Exchange Act of 1934, and the Investment Advisers Act of 1940, respectively, and related rules and regulations promulgated by the SEC. The Financial Industry Regulatory Authority (FINRA) is the primary self-regulatory organization for our registered broker-dealer subsidiaries. Our broker-dealer and investment adviser subsidiaries also are subject to additional regulation by states or local jurisdictions.
The SEC and FINRA have active enforcement functions that oversee broker-dealers and investment advisers and can bring actions that result in fines, restitution, a limitation on permitted activities, disqualification to continue to conduct certain activities and an inability to rely on certain favorable exemptions. Certain types of infractions and violations also can affect our ability to expeditiously issue new securities into the capital markets. In addition, certain changes in the activities of a broker-dealer require approval from FINRA,

12 The PNC Financial Services Group, Inc. – 2019 Form 10-K
and FINRA takes into account a variety of considerations in acting upon applications for such approval, including internal controls, capital levels, management experience and quality, prior enforcement and disciplinary history and supervisory concerns.
In 2019, the SEC enacted a package of regulations that impact the provision of investment advice to retail customers by registered broker-dealers and investment advisers, which take effect on June 30, 2020. Regulation Best Interest creates a new standard of conduct for broker-dealers making investment recommendations to retail customers, including obligations relating to conflicts of interest and disclosures to customers, and a duty of care in making investment recommendations. Broker-dealers and investment advisers making recommendations to retail customers will also be required to develop and deliver to customers a new relationship summary document, Form CRS. Regulation Best Interest and Form CRS will primarily impact PNC’s retail broker-dealer/investment adviser subsidiary, PNC Investments LLC.
There are comprehensive and significant regulations on the activities of financial institutions that are active in the U.S. over-the-counter derivatives and foreign exchange markets. These regulations are intended to (i) address systemic risk issues, (ii) bring greater transparency to the derivatives markets, (iii) provide enhanced disclosures and protections to customers and (iv) promote market integrity. Among other things, these regulations require both “swap dealers” and “major swap participants” to register with one or both of the CFTC (in the case of non security-based swaps) and the SEC (in the case of security-based swaps); (i) require that, absent certain specified exemptions, most standardized swaps be centrally cleared through a regulated clearing house and be traded on a centralized exchange or swap execution facility; (ii) subject swap dealers and major swap participants to capital requirements in excess of historical practice; (iii) subject swap dealers and major swap participants to comprehensive recordkeeping, regulatory reporting and real-time public reporting requirements; (iv) subject swap dealers and major swap participants to new business conduct requirements, including the provision of daily marks to counterparties and disclosing to counterparties (pre-execution) the material risks, material incentives, and any conflicts of interest associated with their swap; (v) impose special duties on swap dealers and major swap participants when transacting a swap with a “special entity” (e.g., governmental agency (federal, state or local) or political subdivision thereof, pension plan or endowment); and (vi) impose margin requirements on certain swaps that are not centrally cleared through a regulated clearing house.
As a provisionally registered swap dealer with the CFTC, PNC Bank's derivatives and foreign exchange businesses are subject to the regulations and requirements imposed on registered swap dealers, and the CFTC (and for certain delegated responsibilities, the National Futures Association) has a meaningful supervisory role with respect to PNC Bank’s derivatives and foreign exchange businesses. Because of the limited volume of our security-based swap dealing activities, PNC Bank has not registered (and currently does not intend to register) with the SEC as a security-based swap dealer. The regulations and requirements applicable to swap dealers have and will continue to impose compliance burdens on PNC Bank and introduce additional legal risks (including as a result of applicable anti-fraud and anti-manipulation provisions and private rights of action). In addition, failure to comply with the "pay-to-play" regulations that govern our swap and municipal securities businesses could result in limitations on PNC Bank's ability to conduct swap and municipal securities business with state or local governments and their authorities.
BlackRock has subsidiaries in securities and related businesses subject to SEC, other governmental agencies, state, local and FINRA regulation, and a federally chartered nondepository trust company subsidiary subject to supervision and regulation by the OCC. BlackRock describes its regulation by these agencies and others in its filings with the SEC.
Regulations of Other AgenciesIn addition to regulations issued by the federal banking, securities and derivatives regulators, we also are subject to regulations issued by other federal agencies with respect to certain financial products and services we offer. For example, certain of our fiduciary, brokerage and investment management activities are subject to regulations issued by the Department of Labor (DOL) under the Employee Retirement Income Security Act of 1974 (ERISA), as amended, and related provisions of the Internal Revenue Code and certain of our student lending and servicing activities are subject to regulation by the Department of Education.
Competition
We are subject to intense competition from other regulated banking organizations, as well as various other types of financial institutions and non-bank entities that can offer a number of similar products and services without being subject to bank regulatory supervision and restrictions.
PNC Bank competes for deposits and/or loans with:• Other commercial banks,• Savings banks,• Credit unions,• Consumer finance companies,• Leasing companies,• Other non-bank lenders,

The PNC Financial Services Group, Inc. – 2019 Form 10-K 13
• Financial technology companies,• Treasury management service companies,• Insurance companies, and• Issuers of commercial paper and other securities, including mutual funds.
In providing asset management services, our businesses compete with:• Investment management firms,• Large banks and other financial institutions,• Brokerage firms,• Financial technology companies,• Mutual fund complexes, and• Insurance companies.
Our various non-bank businesses engaged in investment banking and alternative investment activities compete with:• Commercial banks,• Investment banking firms,• Collateralized loan obligation managers,• Hedge funds,• Mutual fund complexes,• Merchant banks,• Insurance companies,• Private equity firms, and• Other investment vehicles.
Competition is based on a number of factors including pricing, product structure, the range of products and services offered and the quality of customer service. Loan pricing, structure and credit standards are extremely important as we seek to achieve appropriate risk-adjusted returns. Deposit-taking activities are also subject to pricing pressures and to customer migration as a result of intense competition for deposits and investments. Competitors may seek to compete with us through traditional channels such as physical locations or through digital channels such as the internet or mobile applications. We include here by reference the additional information regarding competition and factors affecting our competitive position included in Item 1A Risk Factors of this Report.
Employees
Employees totaled 51,918 at December 31, 2019. This total included 50,017 full-time and 1,901 part-time employees, of which 28,270 full-time and 1,759 part-time employees were employed in our Retail Banking business.
SEC Reports and Corporate Governance Information
We are subject to the informational requirements of the Securities Exchange Act of 1934 (Exchange Act) and, in accordance with the Exchange Act, we file annual, quarterly and current reports, proxy statements, and other information with the SEC. Our SEC File Number is 001-09718.
The SEC maintains a website at www.sec.gov that contains reports, including exhibits, proxy and information statements, and other information about issuers, like us, who file electronically with the SEC. You can also inspect reports, proxy statements and other information about us at the offices of the New York Stock Exchange, 20 Broad Street, New York, New York 10005.
We make our Annual Report on Form 10-K, Quarterly Reports on Form 10-Q, Current Reports on Form 8-K, and amendments to those reports filed with or furnished to the SEC pursuant to Section 13(a) or 15(d) of the Exchange Act available free of charge on our internet website as soon as reasonably practicable after we electronically file such material with, or furnish it to, the SEC. Our corporate internet address is www.pnc.com and you can find this information at www.pnc.com/secfilings. Shareholders and bondholders may obtain copies of these filings without charge by contacting Shareholder Services at 800-982-7652 or via the online contact form at www.computershare.com/contactus for copies without exhibits, or via e-mail to [email protected] for copies of exhibits, including financial statement and schedule exhibits where applicable. The interactive data file (XBRL) exhibit is only available electronically.
Information about our Board of Directors and its committees and corporate governance, including our PNC Code of Business Conduct and Ethics (as amended from time to time), is available on our corporate website at www.pnc.com/corporategovernance. In addition, any future waivers from a provision of the PNC Code of Business Conduct and Ethics covering any of our directors or executive officers (including our principal executive officer, principal financial officer, and principal accounting officer or controller) will be posted at this internet address.

14 The PNC Financial Services Group, Inc. – 2019 Form 10-K
Shareholders who would like to request printed copies of the PNC Code of Business Conduct and Ethics or our Corporate Governance Guidelines or the charters of our Board's Audit, Nominating and Governance, Personnel and Compensation, or Risk Committees (all of which are posted on our corporate website at www.pnc.com/corporategovernance) may do so by sending their requests to our Corporate Secretary at corporate headquarters at The Tower at PNC Plaza, 300 Fifth Avenue, Pittsburgh, Pennsylvania 15222-2401. Copies will be provided without charge.
Our common stock is listed on the New York Stock Exchange (NYSE) under the symbol “PNC.”
Internet Information
The PNC Financial Services Group, Inc.’s financial reports and information about its products and services are available on the internet at www.pnc.com. We provide information for investors on our corporate website under "About Us – Investor Relations." We use our Twitter account, @pncnews, as an additional way of disseminating to the public information that may be relevant to investors.
We generally post the following under “About Us – Investor Relations” shortly before or promptly following its first use or release: financially-related press releases, including earnings releases and supplemental financial information, various SEC filings, including annual, quarterly and current reports and proxy statements, presentation materials associated with earnings and other investor conference calls or events, and access to live and recorded audio from earnings and other investor conference calls or events. In some cases, we may post the presentation materials for other investor conference calls or events several days prior to the call or event. For earnings and other conference calls or events, we generally include in our posted materials a cautionary statement regarding forward-looking and non-GAAP financial information, and we provide GAAP reconciliations when we include non-GAAP financial information. Such GAAP reconciliations may be in materials for the applicable presentation, in materials for prior presentations or in our annual, quarterly or current reports.
When warranted, we will also use our website to expedite public access to time-critical information regarding PNC instead of using a press release or a filing with the SEC for first disclosure of the information. In some circumstances, the information may be relevant to investors but directed at customers, in which case it may be accessed directly through the home page rather than "About Us - Investor Relations."
We are required to provide additional public disclosure regarding estimated income, losses and pro forma regulatory capital ratios under supervisory and PNC-developed hypothetical severely adverse economic scenarios, as well as information concerning our capital stress testing processes, pursuant to the stress testing regulations adopted by the Federal Reserve and the OCC. We are also required to make certain additional regulatory capital-related public disclosures about our capital structure, risk exposures, risk assessment processes, risk-weighted assets and overall capital adequacy, including market risk-related disclosures, under the regulatory capital rules adopted by the Federal banking agencies. Under these regulations, we may satisfy these requirements through postings on our website, and we have done so and expect to continue to do so without also providing disclosure of this information through filings with the SEC.
Other information posted on our corporate website that may not be available in our filings with the SEC includes information relating to our corporate governance and annual communications from our chairman to shareholders.
Where we have included internet addresses in this Report, such as our internet address and the internet address of the SEC, we have included those internet addresses as inactive textual references only. Except as specifically incorporated by reference into this Report, information on those websites is not part hereof.
ITEM 1A – RISK FACTORSWe are subject to a number of risks potentially impacting our business, financial condition, results of operations and cash flows. As a financial services company, certain elements of risk are inherent in what we do and the business decisions we make. Thus, we encounter risk as part of the normal course of our business, and we design risk management processes to help manage these risks.
Our success is dependent on our ability to identify, understand and manage the risks presented by our business activities so that we can appropriately balance revenue generation and profitability. We discuss our principal risk management oversight and processes and, in appropriate places, related historical performance and other metrics in the Risk Management section included in Item 7 of this Report.
The following are the key risk factors that affect us. Any one or more of these risk factors could have a material adverse impact on our business, financial condition, results of operations or cash flows. In addition, these risks present other possible adverse consequences, including those described below. These risk factors and other risks we face are also discussed further in other sections of this Report.

The PNC Financial Services Group, Inc. – 2019 Form 10-K 15
Risks Related to the Economy and Other External Factors, Including Regulation
Our business and financial performance are vulnerable to the impact of adverse economic conditions.
As a financial services company, our business and overall financial performance are affected to a significant extent by economic conditions, primarily in the U.S. The U.S. currently is in a prolonged economic expansion. This is not likely to continue forever, and at some point economic conditions are likely to turn recessionary.
Declining or adverse economic conditions generally result in reduced business activity, which may decrease the demand for our products and services. The ability of borrowers to repay loans is often weakened as a result of economic downturns. Such economic conditions also may lead to turmoil and volatility in financial markets, often with at least some financial asset categories losing value. Any of these effects would likely have an adverse impact on financial institutions such as PNC, with the significance of the impact generally depending on the nature and severity of the adverse economic conditions.
Even when economic conditions are relatively good or stable, specific economic factors can negatively affect our business and performance. This can be especially true when the factors relate to particular segments of the economy. For example, shifting consumer behavior with respect to retail purchases being made over the internet rather than in physical stores has negatively impacted performance by some retailers. This likely decreases demand for financial services in that sector, possibly harming the creditworthiness of some shopping mall operators and retail companies with whom we do business. As another example, trade tensions leading to increased tariffs likely adversely affect companies that are relatively dependent on imports or exports. Increased tariffs may also result in increased prices for some products or services, leading to decreases in demand. Here, as well, affected companies may experience lower levels of business and possible declining creditworthiness. Recently increased tariffs on imports into, as well as exports out of, the U.S. have had, at least to some extent, a negative impact on the U.S. economy.
Given the geographic scope of our business and operations, we are most exposed to issues within the U.S. economy and financial markets. Within the U.S., we are most exposed to issues within markets located in the Mid-Atlantic, Midwest and Southeast. This will likely continue to be the case for at least some period of time, even as we expand the national reach of our businesses.
Our foreign business activities continue to be a relatively small part of our overall business. As a result, the direct impact on our business and performance from economic conditions outside the U.S. is not likely to be significant, although the impact would increase if we expand our foreign business more than nominally. We are, however, susceptible to the risk that such economic conditions could negatively affect our business and financial performance. Primarily, this risk results from the possibility that poor economic conditions or financial market disruptions affecting other major economies would also affect the U.S. Currently, the United Kingdom’s exit from the European Union, so-called “Brexit,” which became effective January 31, 2020 with a transition period through the end of 2020, has led to uncertainty regarding the impact on the economy and capital markets of the United Kingdom and throughout Europe more generally. The extent of the impact of Brexit will depend in part on transitional activities, including replacement trade agreements with the European Union, as to which uncertainties remain even after Brexit was finalized. The more severe the overall impact, the more likely it would have adverse effects on PNC and its business. PNC is also vulnerable to the impact of Brexit on PNC’s customers with significant business or operations in the United Kingdom or elsewhere in the European Union. Another example is the current coronavirus outbreak originating in China. To the extent that this disease impacts business activity in China or other parts of the world where it spreads, it could adversely affect our customers dependent on the economy of China or other affected areas, even if it does not reach epidemic levels in the U.S.
Throughout the remainder of this Risk Factors section, we address specific ways in which economic issues could create risk for us and result in adverse impacts on our business and financial performance.
The impact of government legislation, regulation and policy and other political factors on the economy could have an adverse effect on our business and financial performance.
Changes in law or governmental policy affecting the economy, business activity, or personal spending, investing or saving activities may cause consumers and businesses to alter behavior in ways that impact demand for our products and services. Such changes may also alter the profitability of the transactions in which we engage. PNC may alter the types or terms of the products and services we offer to reflect such changes. Uncertainty regarding future law or policy may have similar impacts. Future changes in composition of Congress or in the identity of the President may create such uncertainty, as such changes often lead to changes in law or policy.
Concern regarding the ability of Congress and the President collectively to reach agreement on federal budgetary matters (including the debt ceiling), or prolonged stalemates leading to total or partial governmental shutdowns, also can have adverse economic consequences and create the risk of economic instability or market volatility, with potential adverse consequences to our business and financial performance. Divided control of the U.S. government, which has been the case since the 2018 elections and may continue to be the case following the 2020 elections, may increase concern over the inability of Congress and the President to reach necessary agreements or make government shutdowns more likely.

16 The PNC Financial Services Group, Inc. – 2019 Form 10-K
The policies of the Federal Reserve and other governmental agencies have a significant impact on interest rates and overall financial market performance, which are important to our business and financial performance.
The monetary policies of the Federal Reserve have a significant impact on interest rates and overall financial market performance. These policies can thus affect the activities and results of operations of financial companies such as PNC. An important function of the Federal Reserve is to monitor the national supply of bank credit and set certain interest rates. The actions of the Federal Reserve influence the rates of interest that we charge on loans and that we pay on borrowings and interest-bearing deposits. Rates of interest can also affect the value of our on-balance sheet and off-balance sheet financial instruments. We cannot predict the nature or timing of future changes in monetary policies or the precise effects that they may have on our activities and financial results.
In addition, monetary policy actions by governmental authorities in the European Union or other countries could have an impact on global interest rates, which could affect rates in the U.S. as well as rates on instruments denominated in currencies other than the U.S. dollar, any of which could have one or more of the potential effects on us described above.
Some of the potential impacts on our business and results of governmental monetary policy are described in Risk Factors under the heading “Risks Related to the Business of Banking.”
As a regulated financial services firm, we are subject to numerous governmental regulations and comprehensive oversight by a variety of regulatory agencies and enforcement authorities. These regulations and the manner in which they are implemented can have a significant impact on our businesses and operations.
The PNC Financial Services Group, Inc. is a bank holding company (BHC) and a financial holding company, with the Federal Reserve as its primary regulator. PNC Bank is a federally chartered bank, with the Office of Comptroller of the Currency (OCC) as its primary regulator. In addition, our businesses are subject to regulation by multiple other banking, consumer protection, securities and derivatives regulatory bodies. We are also subject to the jurisdiction of criminal and civil enforcement authorities.
As a result, we are subject to numerous laws and regulations involving both our business and organization, with multiple regulators or agencies having supervisory or enforcement oversight over aspects of our business. These laws, regulations and supervisory activities are intended to promote the safety and soundness of financial institutions, financial market stability, the transparency and liquidity of financial markets, and consumer and investor protection. In addition to regulation in the U.S., we are also to a limited extent subject to foreign regulation as a result of our business activities outside the U.S.
Applicable laws and regulations restrict permissible activities and investments and require compliance with provisions designed to protect loan, deposit, brokerage, fiduciary, and other customers, and for the protection of customer information, among other things. We also are subject to laws and regulations designed to combat money laundering, terrorist financing, and transactions with persons, companies or foreign governments designated by U.S. authorities.
Over time, the scope of the laws and regulations affecting our businesses, as well as the number of requirements or limitations imposed by legislative or regulatory actions, has increased. Although recently there have been efforts to update some of the regulations affecting us, which has resulted in reductions in some regulatory burdens, we expect to continue to face substantial regulatory oversight for the foreseeable future. Legislative or regulatory actions can result in increased compliance costs, reduced business opportunities, or new requirements and limitations on how we conduct our business.
The Federal Reserve requires a BHC to act as a source of financial and managerial strength for its subsidiary banks. The Federal Reserve could require PNC to commit resources to PNC Bank when doing so is not otherwise in the interests of PNC or its shareholders or creditors.
The single counterparty credit limit (SCCL) rules adopted by the Federal Reserve requires that PNC limit its aggregate net credit exposure to any single unaffiliated counterparty, including BlackRock, to an amount that is no more than 25% of PNC’s Tier 1 capital. PNC expects to manage its net credit exposure to BlackRock to maintain compliance with the SCCL.
The results of supervisory or examination activities by our regulators could result in limitations on our ability to engage in new activities or expand geographically. These activities also could result in significant fines, penalties, or required corrective actions, some of which could be expensive and difficult to implement. As we expand our product and service offerings into additional states or countries, we will face increases in state or foreign regulation affecting our operations. Different approaches to regulation by different jurisdictions could materially increase our compliance costs or risks of non-compliance.
A failure to comply, or to have adequate policies and procedures designed to comply, with regulatory requirements and expectations exposes us to the risk of damages, fines and regulatory penalties and other regulatory or enforcement actions or consequences, such as limitations on activities otherwise permissible for us or additional requirements for engaging in new activities, and could also injure our reputation with customers and others with whom we do business.

The PNC Financial Services Group, Inc. – 2019 Form 10-K 17
We expect new regulatory requirements or other initiatives to be pursued and implemented in the future. Such future regulatory requirements or initiatives could further increase our compliance costs and the risks associated with non-compliance and could affect our ability to pursue or take full advantage of some desirable business opportunities.
See the Risk Factor headed “We are subject to regulatory capital and liquidity standards that affect our business, operations and ability to pay dividends or otherwise return capital to shareholders” for a discussion of risks associated with capital and liquidity regulation. Also see Supervision and Regulation in Item 1 of this Report for more information concerning the regulation of PNC and recent initiatives to reform financial institution regulation, including some of the matters discussed in this Risk Factor. Note 18 Regulatory Matters in the Notes To Consolidated Financial Statements in Item 8 of this Report also discusses some of the regulation applicable to us.
We are subject to regulatory capital and liquidity standards that affect our business, operations and ability to pay dividends or otherwise return capital to shareholders.
PNC and PNC Bank are subject to regulatory capital and liquidity requirements established by the Federal Reserve and the OCC, respectively. These regulatory capital and liquidity requirements are typically developed at an international level by the Basel Committee on Banking Supervision (Basel Committee) and then applied, with adjustments, in each country by the appropriate domestic regulatory bodies. Domestic regulatory agencies have the ability to apply stricter capital and liquidity standards than those developed by Basel Committee. In several instances, the U.S. banking agencies have done so with respect to U.S. banking organizations.
Requirements to maintain specified levels of capital and liquidity, and regulatory expectations as to the quality of our capital and liquidity, impact our business activities and may prevent us from taking advantage of opportunities in the best interest of shareholders or force us to take actions contrary to their interests. For example, PNC’s ability to pay or increase dividends or otherwise return capital to shareholders is subject to the Federal Reserve’s CCAR program. In addition, capital and liquidity requirements may impact the amount and type of loans we make. We may be constrained in our ability to expand, either organically or through acquisitions. We may be forced to sell or refrain from acquiring assets where the capital requirements appear inconsistent with the assets’ underlying risks. In addition, liquidity standards require us to maintain holdings of highly liquid short-term investments, thereby reducing our ability to invest in longer-term or less liquid assets, even if more desirable from an earnings, balance sheet or interest rate risk management perspective.
The Basel Committee continues to engage in capital- and liquidity-related initiatives. For example, the Basel Committee in 2017 finalized additional, significant changes to the international capital framework for banking organizations. The changes would impact the market risk capital requirements for trading positions, the standardized risk weighting approach for credit risk and the measurement of operational risk. In addition, among other things, the changes would establish a standardized approach floor for capital ratios calculated by banking organizations that use the advanced approaches for the risk weighting of assets. Moreover, the Basel Committee continues to consider other changes to the international regulatory capital framework to enhance the transparency and consistency of capital requirements among banks and jurisdictions, including, among others, the treatment of securitization positions. As it is unclear, at this time, whether or how these initiatives will be implemented in the U.S., we are unable to estimate what potential impact such initiatives may have on us.
The liquidity standards applicable to large U.S. banking organizations also are expected to be supplemented in the coming years. For example, in May 2016, the U.S. banking agencies proposed rules to implement the Net Stable Funding Ratio (NSFR), which is designed to ensure that banking organizations maintain a stable, long-term funding profile in relation to their asset composition and off-balance sheet activities. The U.S. rules have not yet been finalized, and recent proposals would adjust the scope and effect of the originally-proposed U.S. rules. Thus, the potential impact of the NSFR on us remains unclear.
Regulatory capital and liquidity requirements are subject to regular review and revision by the Basel Committee and the U.S. banking agencies. While the 2019 Tailoring Rules adjusted the capital and liquidity requirements applicable to PNC to better match our risk profile, future changes to the capital and liquidity rules may require PNC or PNC Bank to maintain more or higher quality capital or greater liquidity, which would likely increase some of the potential adverse effects described above.
The regulatory capital and liquidity frameworks as well as certain other prudential requirements and standards that are applicable to PNC are discussed in the Supervision and Regulation section included in Item 1 of this Report and the Liquidity and Capital Management portion of the Risk Management section of Item 7 of this Report.
The likely discontinuance of the submission of rates for the calculation of LIBOR presents risks to the financial instruments originated, held or serviced by PNC that use LIBOR as a reference rate.
As is the case with most large financial institutions, a significant portion of our transactions involve interest where the interest rate varies or adjusts over time. Variable or adjusting interest rates are calculated by adding a contractually defined credit spread to a base or reference rate. LIBOR is used as a reference rate for a substantial majority of our transactions involving variable or adjustable interest. Transactions tied to LIBOR include many of those in which we lend money, both to consumers and to businesses, or where

18 The PNC Financial Services Group, Inc. – 2019 Form 10-K
we issue securities or purchase and sell securities issued by others, as well as many derivative transactions that we enter into to manage our or our customers’ risk. We also service financial instruments entered into by others that use LIBOR as the reference rate.
LIBOR is derived from the rates at which LIBOR panel banks borrow from other global banks. Panel banks submit rate information to an administrator that uses this information to calculate LIBOR. The rates submitted by panel banks on which LIBOR is based reflect the credit risk associated with the submitting banks, and LIBOR is accordingly viewed as a “credit-sensitive” rate. LIBOR is the subject of recent national and international regulatory guidance and proposals for reform. The United Kingdom Financial Conduct Authority, which regulates the process for setting LIBOR, announced in July 2017 that it intends to no longer persuade or compel panel banks to submit rates to the administrator after 2021. Accordingly, we and others are preparing for the likelihood of LIBOR cessation at year end 2021.
There are ongoing efforts to establish one or more alternative reference rates to replace LIBOR assuming its cessation. If a rate does not achieve wide acceptance as the alternative to LIBOR, there likely will be disruption to the markets relying on the availability of a broadly accepted reference rate. At present, the Secured Overnight Financing Rate (or SOFR) is considered the most likely alternative reference rate suitable for replacing LIBOR for most types of transactions, including derivatives, but issues remain with respect to its implementation. SOFR is derived from rates on overnight US Treasury repurchase or “repo” transactions, which are like overnight loans secured by U.S. Treasury bonds and is viewed as “riskless”. In other words, SOFR does not reflect credit risk as the underlying transactions are secured by U.S. Treasury securities. In addition, disruptions in that repo market may lead to some volatility in SOFR even when credit quality is stable. Although SOFR is a relatively new rate, there is historical information with respect to analogs to SOFR, and extrapolations regarding how SOFR may behave in the future are available.
Changing to SOFR or another riskless rate will contribute to the value transfer risk due to the differences in how riskless and credit-sensitive rates like LIBOR behave. Historically, in periods of economic or financial industry stress, riskless rates that are analogous to SOFR have been relatively stable. In contrast, LIBOR, which is designed to reflect the credit risk of banks, has widened relative to riskless rates, reflecting increased uncertainty regarding the credit-worthiness of banks. Accordingly, assuming that SOFR will behave like its historical analogs, an instrument that transitions from LIBOR to SOFR may not yield identical economic outcomes for each contracting party to an instrument had the instrument continued to reference LIBOR. Similarly, SOFR, because it is riskless, tends to be a lower rate than LIBOR.
When an instrument that uses LIBOR as a reference rate transitions to a new reference rate, there will likely often be value transfer between us and the other contracting parties to that instrument (such as borrower, derivative counterparty, or bond holder). Impacts from a change in reference rate would likely include changes to the yield on and value of loans or securities held by us, amounts paid on securities we have issued, amounts received and paid on derivative instruments we have entered into and the trading market for LIBOR-based securities. Depending on the extent and direction of these changes, they could be financially adverse or beneficial to us or to our counterparties. Any theoretical benefit to us could result in counterparty dissatisfaction, which, in turn could lead to litigation or other adverse consequences. As a result, over the life of a transaction that transitions from LIBOR to a new reference rate, our monetary obligations to our counterparty (or their obligations to us) and the yield we receive (or pay) from the transaction with that counterparty may change from that which would have resulted from a continuation of LIBOR.
Transitioning to a replacement rate will likely require an adjustment to contractual credit spreads (the amount added to the reference rate to determine the actual applicable interest rate) so that the new interest rate approximates the LIBOR-based rate. As the replacement reference rate will likely behave differently over time compared with LIBOR, it is likely that an adjusted credit spread that effectively results in a comparable interest rate to a LIBOR-based rate at some points in time will not do so at others.
Another set of risks associated with LIBOR cessation relates to how the transition from LIBOR to another rate will be effected. For some instruments, the method of transitioning to a new reference rate may be challenging. The challenges will be particularly acute where the contract does not provide for a transition on LIBOR cessation or the relevant contractual language relating to a potential transition is ambiguous or inadequate under the circumstances. Absent legislative solutions, where the contract does not appropriately provide for transition, we may seek to negotiate with impacted counterparties or, if not possible, affect reference rate transition through other means. Affecting transition under these circumstances may be challenging or ineffective and in some cases may involve concession on our part that has the effect of reducing the value of the instrument to us.
For instance, the vast majority of LIBOR-based interest rate swap derivative contracts do not currently contemplate the possibility that LIBOR will cease to exist. The International Swaps and Dealer Association (ISDA), the industry trade group for swaps, intends to issue new industry standard definitions that will contemplate the possibility of LIBOR cessation. These new definitions will establish the fallback rate, which is expected to be SOFR, as well as address, among other things, how to determine the credit spread adjustment when a LIBOR-based swap transitions to SOFR. Once effective, these definitions will apply to all newly executed derivatives contracts. ISDA intends to publish “protocols” pursuant to which industry participants can agree with any other industry participant that adheres to the protocols to adopt these new definitions into legacy derivatives contracts. While these protocols are likely to be widely adopted among active swap industry participants, it is possible that many “end users” of swaps, i.e., our borrowers who have

The PNC Financial Services Group, Inc. – 2019 Form 10-K 19
hedged their interest rate payment obligations, may not adhere to these protocols. For these end-user counterparties, one-on-one negotiation with each counterparty will be necessary in order to amend legacy swaps to address LIBOR cessation. If we are unable to agree to appropriate LIBOR cessation provisions with these swaps counterparties, there will be uncertainty as to how to value and effect our rights and obligations under our legacy swap contracts.
We have other contracts that also do not contemplate LIBOR cessation. Still other contracts do contemplate cessation but do so in a manner that may create other risks. For example, some provide for selecting replacement rates in a manner that presents significant challenges (such as by assuming that there would be a rate calculated substantially in the same manner as LIBOR is) or that gives us or another party absolute discretion to select a rate. Some provide for determination of a reference rate without providing for adjustment of the credit spread. In these types of cases, there will likely be uncertainty surrounding transition, with all of the risks described in this Risk Factor.
In connection with implementing the transition from LIBOR to alternative rates, there is a possibility of operational errors occurring during the transition such that the replacement rate is not applied in a timely manner or is incorrectly applied. This is particularly true given the volume of contracts that will require transition and the diversity of potential approaches to transition and given the possibility that the period during which the transition will need to take place may have a short duration.
The potential issues associated with the transition from LIBOR to another reference rate create the risk of dissatisfied customers or of impaired relationships with financial institution counterparties. This could result from a perception that the value transfer likely to occur as a result of transition from LIBOR to another rate favors PNC. It could also arise through disagreements as to the resolution of contractual issues related to the transition, including where the transition involves the use of discretion on our part, or the failure to come to terms on an appropriate replacement rate if necessary. In addition to the risk of loss of business in these circumstances, customers or other counterparties unhappy with the transition could bring lawsuits, potentially as class actions, against us, creating the risk of substantial damages as well as high litigation defense costs.
Similarly, our failure to successfully implement transition from LIBOR to alternative rates could result in regulatory scrutiny and actions by our regulators including fines and other supervisory sanctions.
While we expect LIBOR to continue to be available in substantially its current form until the end of 2021 or shortly before that, it is possible that LIBOR quotes will become unavailable prior to that point. This could result, for example, if a sufficient number of panel banks decline to make submissions to the LIBOR administrator. In that case, the risks associated with the transition to an alternative reference rate will be accelerated and magnified. These risks may also be increased due to the shorter time for preparing for the transition.
In order to address LIBOR cessation and the associated risks, we have established an enterprise LIBOR transition program, described in the Market Risk Management portion of the Risk Management section in Item 7 of this Report. Any failure of this program to appropriately assess and mitigate risk and deliver in a timely manner on operationalizing our ability to transition from LIBOR could magnify the risks previously outlined.
New customer privacy initiatives will impose additional operational burdens on PNC, may limit our ability to pursue desirable business initiatives and increase the risks associated with any future use of customer data.
Recently there has been an increase in legislative and regulatory efforts to protect the privacy of consumer data. Significant examples include the General Data Protection Regulation of the European Union and the California Consumer Privacy Act. These initiatives, among other things, limit how companies can use customer data and impose obligations on companies in their management of such data. Financial services companies such as PNC necessarily gather, maintain and use a significant amount of customer data. These types of initiatives increase compliance complexity and related costs, result in significant financial penalties for compliance failures, and limit our ability to develop new products or respond to technological changes. Such legal requirements also could heighten the reputational impact of perceived misuses of customer data by us, our vendors, or others who gain unauthorized access to our customer data. Other jurisdictions may adopt similar requirements that impose different and potentially inconsistent compliance burdens. The impacts will be greater to the extent requirements vary across jurisdictions.
Societal responses to climate change could adversely affect our business and performance, including indirectly through impacts on our customers.
Concerns over the long-term impacts of climate change have led and will continue to lead to governmental efforts around the world to mitigate those impacts. Consumers and businesses also are changing their behavior as a result of these concerns. PNC and its customers will need to respond to new laws and regulations as well as consumer and business preferences resulting from climate change concerns. We and our customers may face cost increases, asset value reductions, operating process changes, and the like. The impact on our customers will likely vary depending on their specific attributes, including their reliance on or role in carbon intensive activities as well as their exposure to the effects of climate change. Among the impacts to PNC could be a drop in demand for our

20 The PNC Financial Services Group, Inc. – 2019 Form 10-K
products and services, particularly in certain sectors. In addition, we could face reductions in creditworthiness on the part of some customers or in the value of assets securing loans, or pressure from individuals or groups to cease doing business with certain companies or sectors. The Risk Factor headed “We are at risk for an adverse impact on our business due to damage to our reputation” has further discussion of risks associated with activist pressure. Our efforts to take these risks into account in making lending and other decisions, including by increasing our business with climate-friendly companies, may not be effective in protecting us from the negative impact of new laws and regulations or changes in consumer or business behavior, including those resulting from activist pressure.
Risks Related to the Use of Technology
The use of technology is critical to our ability to maintain or enhance the competitiveness of our businesses.
As a large financial services company, we handle a substantial volume of customer and other financial transactions. As a result, we rely heavily on information systems to conduct our business and to process, record and monitor our transactions and those of our customers. Over time, we have seen more customer usage of technological solutions for financial needs as well as higher expectations of customers and regulators regarding effective and safe systems operation. In many cases, the effective use of technology increases efficiency and enables financial institutions to better serve customers. As a result of these factors, the financial services industry is undergoing rapid technological change with frequent introductions of new technology-driven products and services. Examples include expanded use of cloud computing, artificial intelligence and machine learning, virtual and augmented reality, biometric authentication, voice and natural language, and data protection enhancements, as well as increased online and mobile device interaction with customers. We expect these trends to continue for the foreseeable future. Change is coming both from traditional banking companies and non-bank financial technology companies offering financial products and services, particularly payment services and lending. Our ability to succeed is dependent on the technologies we employ and offer our customers and the extent to which we at least keep pace with, if not exceed, our competitors’ progress and our customers’ needs and expectations.
In response to actual and anticipated customer behavior and expectations, as well as competitive pressures, we have been investing in technology and connectivity. We are seeking to automate functions previously performed manually, facilitate the ability of customers to engage in financial transactions, and otherwise enhance the customer experience with respect to our products and services. This effort has involved the expenditure of considerable amounts of funds and other resources. A failure to maintain or enhance our competitive position with respect to technology, whether because we fail to anticipate customer expectations or because our technological developments fail to perform as desired or are not rolled out in a timely manner or because we fail to keep pace with our competitors, would likely cause us to lose market share or incur additional expense. Our ability to maintain or enhance our relative technological position is in part dependent on our ability to attract and retain talented employees in these fields, which, due to overall demand, is increasingly difficult.
Our use of technology is dependent on having the right to use the underlying intellectual property.
In some cases, we develop internally the intellectual property embedded in the technology we use. In others, we or our vendors license it from others. Regardless of the source of the intellectual property, if another person or entity were deemed to own intellectual property infringed by our activities, we could be responsible for significant damages covering past activities and substantial fees to continue to engage in these types of activities. It also is possible that we could be prevented from using technology important to our business for at least a period of time. In such a circumstance, there may be no alternative technology for us to use or an appropriate alternative technology might be expensive to obtain. Protections offered by those from whom we license technology against these risks may be inadequate to cover fully any losses. Over time, there have been instances where key technology used by PNC and other financial institutions has been alleged to have infringed patents held by others, and in some cases we, as well as other financial institutions, have suffered losses of the types described above.
We could suffer a material adverse impact from interruptions in the effective operation of our information systems and other technology.
The need to ensure proper functioning and resiliency of our information systems and other technology has become more important and more challenging, and the costs involved in that effort continue to be high. The risks of operational failures in the use of these systems result from a variety of factors. We are vulnerable to the impact of failures of our systems to operate as needed or intended. Failures leading to materially adverse impacts could include those resulting from human error, unexpected transaction volumes, or overall design or performance issues. In addition, our ability to use our technology effectively could be impacted due to bad weather, disasters, bad actors, terrorism and the like. Such events could affect our systems directly or limit our ability to use our technology due to effects on key underlying infrastructure. In some cases, the risk results from the potential for bad acts on the part of others, discussed in more detail in the Risk Factor headed “We are vulnerable to the risk of third party breaches of data security affecting the functioning of systems or the confidentiality of information, either at PNC or at third parties handling PNC information.”
We also rely on information systems maintained by other companies. We use other companies both to provide products and services directly to us and to assist in providing products and services to our customers. Others provide the infrastructure that supports, for example, communications, payment, clearing and settlement systems, or information processing and storage. These companies range

The PNC Financial Services Group, Inc. – 2019 Form 10-K 21
from those providing highly sophisticated information processing to those that provide fundamental services, such as electric power and telecommunications. In some cases, these other companies themselves utilize third parties to support their delivery of products and services to us and our customers. Systems maintained by or for these other companies are generally subject to many of the same risks we face with respect to our systems and thus their issues could have a negative impact on PNC. We necessarily have less ability to provide oversight over other companies’ information systems.
A number of our customers choose to use financial applications (apps) that allow them to view banking and other financial account information, often held at different financial institutions, on a single platform, to monitor the performance of their investments, to compare financial and investment products, to make payments or transfer funds, and otherwise to help manage their finances and investments. Financial apps typically ask users to provide their secure banking log-in information and credentials (username and password) so the apps can link to users’ accounts at financial institutions. Companies offering these apps frequently use third-party data aggregators – behind-the-scenes technology companies that serve as a data-gathering service provider – to deliver customer financial data that is used by the financial apps. To do this, data aggregators are provided with customers’ log-in information and credentials, which allows the aggregators to access the customers’ online account and “scrape” the customers’ data, often on a daily basis. That same information has the potential to facilitate fraud if it is not properly protected. In fact, the Director of the Financial Crimes Enforcement Network (FinCEN) has stated that FinCEN has seen high incidences of fraud, including automated clearing house (ACH) fraud, credit card fraud, and wire fraud, enabled through the use of synthetic identities and through account takeovers via these platforms. In some cases, cybercriminals appear to be using such data aggregators and integrators to facilitate account takeovers and fraudulent wires. PNC could face increased financial exposure due to fraudulent activity associated with the increased use of these apps and data aggregators. Even where PNC does not have responsibility for fraud losses associated with these apps and data aggregators, PNC could suffer increased reputational harm when such losses occur.
Although we regularly update and replace systems, both internal and third party, that we depend on as our needs evolve and technology improves, we continue to utilize some older systems that may not be as reliable as newer ones. In addition, the implementation of and transition to new or updated systems creates risks related to associated timing and costs, disruptions in functionality for customers and longer term failures to achieve desired improvements.
The occurrence of any failure, interruption or security breach of any of our information or communications systems, or the systems of other companies on which we rely, could result in a wide variety of adverse consequences to us. This risk is greater if the issue is widespread, extends for a significant period of time, or results in financial losses to our customers. The consequences of failures to operate systems properly can include disruptions to our ability to use our accounting, deposit, loan, payment and other systems. Such events could also cause errors in transactions or impair system functionality with customers, vendors or other parties. Possible adverse consequences also include damage to our reputation or a loss of customer business, which could occur even if the negative impact on customers was de minimis. We also could face litigation or additional regulatory scrutiny. This in turn could lead to liability or other sanctions, including fines and penalties or reimbursement of adversely affected customers. Even if we do not suffer any material adverse consequences as a result of events affecting us directly, information systems issues at other financial institutions could lead to a general loss of customer confidence in financial institutions, including us. Also, system problems, including those resulting from third party attacks, whether at PNC or at our competitors, would likely broadly increase legislative, regulatory and customer concerns regarding the functioning, safety and security of such systems. In that case, we would expect to incur even higher levels of costs with respect to prevention and mitigation of these risks.
We are vulnerable to the risk of third party breaches of data security affecting the functioning of systems or the confidentiality of information, either at PNC or at third parties handling PNC information.
We are faced with ongoing efforts by others to breach data security at financial institutions or with respect to financial transactions. The threat posed by these efforts is ever-present, with essentially continual attacks. Some of these involve efforts to enter our systems directly by going through or around our security protections. Others involve the use of social engineering schemes to gain access to confidential information from our employees, customers or vendors. Most corporate and commercial transactions are now handled electronically, and our retail customers increasingly use online access and mobile devices to bank with us. The ability to conduct business with us in this manner depends on the transmission and storage of confidential information in electronic form. As a result, efforts by bad actors to engage in various types of cyber attacks pose serious risks to our business and reputation. The same risks are presented by attacks potentially affecting information held by third parties on our behalf or accessed by third parties, including those offering financial apps, on behalf of our customers.
In the ordinary course, we maintain and process vast amounts of information about us, our customers and our employees. This information tends to be confidential or proprietary and much of it is highly sensitive. The highly sensitive information includes information sufficient to support identity theft and personal health information, as well as information regarding our business plans and financial performance that has not been made public. One way in which bad actors attempt to harm us is by seeking access to some of this confidential or proprietary information, often with the intent of stealing from or defrauding us or our customers. In other cases, they seek to disrupt our ability to conduct our business, including by destroying or impairing our access to information maintained by us.

22 The PNC Financial Services Group, Inc. – 2019 Form 10-K
Our customers often use their own devices, such as computers, smartphones and tablets, to do business with us and may provide their PNC customer information (including passwords) to a third party in connection with obtaining services from the third party, including those offering financial apps. Although we take steps to provide safety and security for our customers’ transactions with us and their customer information to the extent they are utilizing their own devices or providing third parties access to their accounts, our ability to assure such safety and security is necessarily limited.
As our customers regularly use PNC-issued credit and debit cards to pay for transactions with retailers and other businesses, there is also the risk of data security breaches at those other businesses covering PNC account information. When our customers use PNC issued cards to make purchases from those businesses, card account information often is provided to the business. If the business’s systems that process or store card account information are subject to a data security breach, holders of our cards who have made purchases from that business may experience fraud on their card accounts. We can be responsible for reimbursing our customers for such fraudulent transactions on customers’ card accounts, as well as for other costs related to data security compromise events, such as replacing cards associated with compromised card accounts, but to date such losses have not been material to us. In addition, we provide card transaction processing services to some merchant customers under agreements we have with payment networks such as Visa and Mastercard. Under these agreements, we may be responsible for certain losses and penalties if one of our merchant customers suffers a data security breach.
Over the last few years, several large companies disclosed that they had suffered substantial data security breaches compromising millions of user accounts and credentials. To date, our losses and costs related to these types of breaches, including those where some of the accounts affected were with PNC, have not been material. Other similar events in the future could be more significant to us. Moreover, to the extent more consumer confidential information becomes available to bad actors through the cumulative effect of data breaches at companies generally, bad actors may find it easier to use such information to gain access to our customer accounts.
There have been other recent publicly announced cyber attacks that were not focused on gaining access to credit card or user credential information but instead sought access to a range of other types of confidential information including internal emails and other forms of customer financial information. Ransomware attacks have sought to deny access to data and possibly shut down systems and devices maintained by target companies. In a ransomware attack, system data is encrypted or access is otherwise denied, accompanied by a demand for ransom to restore access to the data.
A number of companies have fallen victim to business email compromise (BEC) scams in recent years. BEC scams involve using social engineering to cause employees to wire funds to the perpetrators in the mistaken belief that the requests were made by a company executive or established vendor. While we have not experienced material losses from BEC scams to date, some of our commercial customers have been victimized. Attacks on our customers may put these relationships at risk, particularly if customers’ ability to continue operations is impaired due to the losses suffered.
Other attacks in recent years have included distributed denial of service (DDoS) attacks, in which individuals or organizations flood commercial websites with extraordinarily high volumes of traffic with the goal of disrupting the ability of commercial enterprises to process transactions and possibly making their websites unavailable to customers for extended periods of time. We (as well as other financial services companies) have been subject to such attacks.
In addition to threats from external sources, insider threats represent a significant risk to us. Insiders, including those having legitimate access to our systems and the information contained in them, have the easiest opportunity to make inappropriate use of the systems and information. Addressing that risk requires understanding not only how to protect us from unauthorized use and disclosure of data, but also how to engage behavioral analytics and other tools to identify potential internal threats before any damage is done.
To date, none of these types of attacks have had a material impact on us. Nonetheless, we cannot entirely block efforts by bad actors to harm us. And our efforts to prevent significant harm from attacks may be insufficient. As a result, we could suffer material financial and reputational losses in the future from any of these or other types of attacks. Attacks on others, some of which have led to serious adverse consequences, demonstrate the risks posed by new and evolving types of cyber attacks. Our ability to protect confidential or proprietary information is even more limited with respect to information held by third parties. We may suffer reputational damage or legal liability for unauthorized access to customer information held by third parties, even if we were in fact not responsible for preventing such access and had no reasonable way of preventing it.
We need effective programs to limit the risk of failures or breaches occurring in our information systems and to mitigate the impact when they do.
We have policies, procedures and systems (including cyber security and business continuity programs) designed to prevent or limit the effect of possible failures, interruptions or breaches in security of information systems. In recent years, we have devoted significant resources towards improving the reliability of our systems and their security against external and internal threats. We design our business continuity and other information and technology risk management programs to manage our capabilities to provide services in the case of an event resulting in material disruptions of business activities affecting our employees, facilities, technology or suppliers. We regularly seek to test the effectiveness of and enhance these policies, procedures and systems. Where the risk relates to products or services provided by others, we seek to engage in due diligence and monitoring to limit the risk. Nonetheless, we cannot guarantee the

The PNC Financial Services Group, Inc. – 2019 Form 10-K 23
effectiveness of our policies, procedures and systems to protect us in any particular future situation, nor the effectiveness of our oversight of risk at third parties. Should an adverse event affecting another company’s systems occur, we may not have financial protection from the other company sufficient to compensate us or otherwise protect us from the consequences.
Methods used by others to attack information systems change frequently (with generally increasing sophistication). A new method of attack often is not recognized until launched against a target. Attacks in some cases appear to be supported by foreign governments or other well-financed entities and often originate from less regulated and remote areas around the world. As a result, we may be unable to implement adequate preventive measures to address these methods in advance of attacks.
Even with our proactive and defensive measures in place, adverse events are likely to occur and there remains the risk that one or more such events would be material to PNC. Our ability to mitigate the adverse consequences of such occurrences is in part dependent on the quality of our business continuity planning, our ability to understand threats to us from a holistic perspective, and our ability to anticipate the timing and nature of any such event that occurs, with novel or unusual events posing a greater risk. It is also the case that an adverse event can go undetected for a period of time, with the adverse consequences likely greater the longer it takes to discover the problem. In many cases, it also depends on the preparedness and responses of national or regional governments, including emergency responders, or on the part of other organizations and businesses with which we deal.
Risks Related to the Business of Banking
Our business and financial results are subject to risks associated with the creditworthiness of our customers and counterparties.
Credit risk is inherent in the financial services business. It results from, among other things, extending credit to customers, purchasing securities, and entering into financial derivative transactions and certain guarantee contracts. Credit risk is one of our most significant risks, particularly given the high percentage of our assets represented directly or indirectly by loans and securities and the importance of lending activity to our overall business. We manage credit risk by assessing and monitoring the creditworthiness of our customers and counterparties, by diversifying our loan portfolio and by investing primarily in high quality securities.
A borrower’s ability to repay a loan can be adversely affected by many factors. Individual borrowers can be affected, for example, by declines in income, job losses, health issues or family issues. Commercial borrowers can be affected, for example, by poor business performance or catastrophe losses. Weakness in the economy or in financial markets would typically adversely impact the ability of our borrowers to repay outstanding loans. Borrowers with higher leverage (that is, higher ratios of indebtedness to total capitalization or income) have an increased risk that they will be unable to repay loans, particularly when economic conditions worsen. We are exposed to credit risk when we fail to evaluate properly at origination the likely ability of a borrower to repay a loan. Overestimating the current and potential value of any collateral pledged to support the loan also adds to our credit risk. A failure to identify declining creditworthiness of a borrower or declining collateral value at a time when remedial actions could reduce our exposure also increases credit risk. Any decrease in our borrowers’ ability to repay loans would result in higher levels of nonperforming loans, net charge-offs, provision for credit losses and valuation adjustments on loans held for sale. Managing credit risk effectively also relies on forecasts of future overall economic conditions, which are inherently imperfect. For several years, credit risk has been at low levels by historical standards. Recently, we have experienced some normalization of credit risk, although still at historically low levels. Continued normalization would adversely affect our results of operations, even if overall economic conditions and borrower creditworthiness remain strong.
In addition to credit risk associated with our lending activities, we have credit risk arising from many other types of business relationships. Routine transactions give us credit exposure to brokers and dealers, commercial banks, investment banks, mutual and hedge funds, other institutional clients, as well as vendors and other non-financial entities.
In the ordinary course of business, we often have heightened credit exposure to a particular industry, region or financial market. As an example, loans secured by commercial and residential real estate typically represent a significant percentage of our overall credit portfolio. They also represent a portion of the assets underlying our investment securities. Although there are limitations on the extent of total exposure to an individual or business borrower, we may have outsized exposure to a particular borrower experiencing financial distress. Events adversely affecting specific customers or counterparties, industries, regions or financial markets, including a decline in their creditworthiness or a worsening overall risk profile, could materially and adversely affect us. Declining economic conditions also may impact commercial borrowers more than consumer borrowers, or vice versa. The last recession, for example, impacted consumers, particularly with respect to residential mortgage loans, more than commercial borrowers. A future recession may have the opposite result. Thus, the mix of our loan portfolio may affect the severity of the impact of a future recession.
Our credit risk may be exacerbated when collateral held by us to secure obligations to us cannot be realized upon or is liquidated at prices that are not sufficient to recover the full amount of the loan or derivative exposure due us.
We reserve for credit losses on our loan and lease portfolio through our allowance for credit losses. We also have reserves for unfunded loan commitments and letters of credit. Changes are reflected in net income through provision for credit losses. An increase in credit risk would likely lead to an increase in provision for credit losses with a resulting reduction in our net income and would increase our allowance.

24 The PNC Financial Services Group, Inc. – 2019 Form 10-K
Effective January 1, 2020, we adopted required changes in accounting for credit losses as a result of the Current Expected Credit Losses (CECL) standard. Implementation of these changes is likely to result in an increase in period-to-period volatility in the amounts we recognize as provision for credit losses with a corresponding increase in period-to-period volatility in our net income. It is also likely to reduce the comparability across banking companies due to, for example, different economic assumptions used in underlying models as well as differences in product mix. The impact of the adoption of CECL is described in more detail in Note 1 Accounting Policies in the Notes To Consolidated Financial Statements in Item 8 of this Report.
Our business and financial performance are impacted significantly by market interest rates and movements in those rates.
As a result of the high percentage of our assets and liabilities that are in the form of interest-bearing or interest-related instruments, changes in interest rates, in the shape of the yield curve, or in spreads between different market interest rates can have a material effect on our business, our profitability and the value of our financial assets and liabilities. For example:
• Changes in interest rates or interest rate spreads affect the difference between the interest that we earn on assets and the interest that we pay on liabilities, which impacts our overall net interest income and margin as well as our profitability.
• Such changes can affect the ability of borrowers to meet obligations under variable or adjustable rate loans and other debt instruments, and can, in turn, increase our credit losses on those assets.
• Such changes can decrease the demand for interest rate-based products and services, including loans and deposit accounts. • Such changes affect our hedging of various forms of market and interest rate risk and may decrease the effectiveness of
those hedges in helping to manage such risks. • Movements in interest rates also affect mortgage prepayment speeds and could result in impairments of mortgage
servicing assets or otherwise affect the profitability of such assets. • Increases in interest rates likely lower the price we would receive on fixed-rate customer obligations if we were to sell
them.
The rates on some interest-bearing instruments adjust promptly in accordance with changes in market rates, while others adjust only periodically or are fixed throughout a defined term. As a result, the impact of changes in interest rates can be either increased or diluted due to differences in the relative variability of the rates paid on our liabilities in relation to the rates received on our assets. The extent to which we have elected to hedge interest rate risk through interest rate swaps also affects the impact of rate changes. We attempt to manage the balance sheet to increase our benefit or reduce negative impacts from future movements in interest rates, but failures to anticipate actual movements may have the opposite result.
While in general higher interest rates enhance our ability to grow our net interest income, there are risks associated with a rising interest rate environment. As a general matter, increasing rates tend to decrease the value of fixed rate financial instruments held on our balance sheet, as discussed in the Risk Factor headed “Our business and financial performance are vulnerable to the impact of changes in the values of financial assets.” Also, customers may be less willing overall to borrow at higher rates. Higher interest rates may indirectly affect the value of asset classes such as real estate typically financed through secured loans, with a resulting negative effect on collateral securing such loans. As another example, there may be increased competitive pressures as rates on deposit products rise. The benefits of higher interest rates are best achieved if we can increase the rates on loans and other assets faster than the rates on deposits and other liabilities increase. We may not be able to achieve this result in a rising rate environment.
On the other hand, lower interest rates tend to have a negative impact on our net interest margin and, unless compensated for by increases in interest-earning assets, on our net interest income.
We discuss the impact of governmental monetary policy on interest rates in the Risk Factor headed “The policies of the Federal Reserve and other governmental agencies have a significant impact on interest rates and overall financial market performance, which are important to our business and financial performance.”
Our business and financial performance are vulnerable to the impact of changes in the values of financial assets.
As a financial institution, a substantial majority of our assets and liabilities are financial in nature. Examples include loans, securities, servicing rights, deposits and borrowings. Such assets and liabilities will fluctuate in value, often significantly, due to movements in the financial markets or market volatility as well as developments specific to the asset or liability in question. Credit-based assets and liabilities will fluctuate in value due to changes in the perceived creditworthiness of borrowers or other counterparties and also due to changes in market interest rates.
Changes in loan prepayment speeds, which often occur when interest rates change, impact the value of our mortgage servicing rights, possibly adversely. Also, the underlying value of assets under lease or securing an obligation generally decreases due to increases in supply or decreases in demand for the asset or deterioration in the condition of the asset. This could negatively impact the ability to collect fully on the secured obligation.
In many cases, we mark our assets and liabilities to market on our financial statements, either through Net income and Retained earnings or through adjustments to Accumulated other comprehensive income. We may need to record losses in the value of financial

The PNC Financial Services Group, Inc. – 2019 Form 10-K 25
assets even where our expectation of realizing the face value of the underlying instrument has not changed. Other assets and liabilities are not marked to market. As a result, our balance sheet may not precisely represent the fair market value of our financial assets and liabilities.
In addition, asset management revenue is earned primarily based on a percentage of the value of the assets being managed and thus is impacted by general changes in market valuations. Thus, although we are not directly impacted by changes in the value of such assets, decreases in the value of those assets would affect related Noninterest income.
Risks Related to Estimates and Assumptions
Our asset and liability valuations and the determination of the amount of loss allowances and impairments taken on our assets are highly subjective. Inaccurate estimates could materially impact our results of operations or financial position.
We must use estimates, assumptions and judgments when assets and liabilities are measured and reported at fair value. Assets and liabilities carried at fair value inherently result in a higher degree of financial statement volatility. Changes in underlying factors or assumptions in any of the areas underlying our estimates could materially impact our future financial condition and results of operations. During periods of market disruption, it would be difficult to value certain assets if trading becomes less frequent and/or market data becomes less observable. There may be certain asset classes that were historically traded in active markets with significant observable data that rapidly become illiquid due to market volatility, a loss in market confidence or other factors. In addition, we have assets and liabilities carried at fair value that are estimated using unobservable inputs that are significant to the fair value of the assets or liabilities. The valuation of any asset or liability substantially based on unobservable inputs is necessarily less reliable than those based on active trading markets. Further, rapidly changing and unprecedented market conditions in any particular market could materially impact the valuation of assets as reported within our consolidated financial statements. Our ability to hedge exposure is in part dependent on our ability to value the related assets or liabilities.
The determination of the amount of loss allowances and asset impairments varies by asset type and is based upon our periodic evaluation and assessment of known and inherent risks associated with the respective asset class. Management updates its evaluations regularly and reflects changes in allowances and impairments in operations as such evaluations are revised. Although we have policies and procedures in place to determine loss allowance and asset impairments, due to the subjective nature of this area, the level of impairments taken and allowances reflected in our financial statements may not accurately reflect the actual level of risk and the amount of future losses.
There are risks resulting from the extensive use of models in our business.
We rely on quantitative models to measure risks and to estimate many financial values. We use models throughout much of our business, relying on them for much of our decision making. Examples of areas we use models include determining the pricing of various products, grading loans and extending credit, measuring interest rate and other market risks, predicting or estimating losses, assessing capital adequacy, and calculating economic and regulatory capital levels. We also use models to estimate the value of financial instruments and balance sheet items. The process of preparing for the implementation of CECL has required the development of significant new and complex models. We will depend on these going forward for our credit loss accounting.
Models generally evaluate the performance of various factors under anticipated future conditions, relying on historical data to help build the model and in part on assumptions as to the future, often with respect to macro-economic conditions, in order to generate the output. Poorly designed or implemented models, including in the choice of relevant historical data or future-looking assumptions, present the risk that our business decisions based on information incorporating model output will be adversely affected due to the inadequacy of that information. Also, information we provide to the public or to our regulators based on poorly designed or implemented models could be inaccurate or misleading. Some of the decisions that our regulators make, including those related to capital distributions to our shareholders, would likely be affected adversely if they perceive that the quality of the relevant models used is insufficient.
Risks Related to Our Need for Customers
Our success depends on our ability to attract and retain customers for our products and services.
Our performance is subject to risks associated with declines in customer demand for our products and services. As a result of the nature of those products and services, we are particularly at risk for losses of economic confidence or customer trust in us.
Economic and market developments may affect consumer and business confidence levels. If customers lose confidence due to concerns regarding the economy, the demand for our products and services could suffer. We may also fail to attract or retain customers if we are unable to develop and market products and services that meet evolving customer needs or demands or if we are unable to deliver them effectively and securely to our customers. This is particularly true to the extent that our competitors are better able to do so.

26 The PNC Financial Services Group, Inc. – 2019 Form 10-K
If we fail to attract and retain customers, demand for our loans and other financial products and services could decrease and we could experience adverse changes in payment patterns. We could lose interest income from a decline in credit usage and noninterest income from a decline in product sales, investments and other transactions. Our customers could remove money from checking, savings or other types of deposit accounts with us in favor of other banks or other types of investment products. Deposits are a low cost source of funds for us. Therefore, losing deposits could increase our funding costs and reduce our net interest income.
Our ability to attract and retain customer deposits is impacted by the levels of interest rates, as customers balance the benefits of bank accounts such as deposit insurance and some of the convenience associated with more traditional banking products against the possibility of higher yields from other investments. In general, if the spread between the rates we offer and those offered by alternatives to bank accounts widens, customers are often willing to forego the benefits of bank accounts for higher returns elsewhere. In such circumstances, we would need either to increase rates to levels that are seen as competitive or lose customers, in either case with a negative impact to net interest income. Loss of customers could also harm noninterest income by decreasing fee-bearing transaction volume. In addition, when rates are higher, customers tend to shift deposits from noninterest-bearing accounts to interest-bearing ones, thereby negatively impacting net interest income.
Our customers increasingly use third party financial applications that are expected to interface with their PNC accounts. This use leads to the risk that issues with respect to the effective functioning of that interface, regardless of cause, could result in a loss of customers as they seek banking relationships that work better with these other applications.
News or other publicity that harms our reputation, or harms the reputation of our industry generally, also could cause a loss of customers or a reduction in the extent to which customers do business with us. This is described further in the Risk Factor headed “We are at risk for an adverse impact on our business due to damage to our reputation.”
In our asset management business, investment performance is an important factor influencing the level of assets that we manage. Poor investment performance could hurt revenue and growth as existing clients might withdraw funds in favor of better performing products. Additionally, the ability to attract funds from existing and new clients might diminish. Overall economic conditions may limit the amount that customers are able or willing to invest as well as the value of the assets they do invest. The failure or negative performance of products of other financial institutions could lead to a loss of confidence in similar products offered by us without regard to the performance of our products. Such a negative contagion could lead to withdrawals, redemptions and liquidity issues in such products and have an adverse impact on our assets under management and asset management revenues and earnings.
We are at risk for an adverse impact on our business due to damage to our reputation.
Our ability to compete effectively, to attract and retain customers and employees, and to grow our business is dependent on maintaining our reputation and having the trust of our customers and employees. Many types of developments, if publicized, can negatively impact a company’s reputation with adverse consequences to its business.
Financial services companies are highly vulnerable to reputational damage when they are found to have harmed customers, particularly retail customers, through conduct that is seen as illegal, unfair, deceptive, manipulative or otherwise wrongful. There also may be reputational damage from human error or systems failures viewed as having harmed customers but not involving misconduct. The reputational impact is likely greater to the extent that the bad conduct, error or failure are pervasive, long-standing or affect a significant number of customers, particularly retail consumers. The negative impact of such reputational damage on our business may be disproportionate to the actual harm caused to customers. It may be severe even if we fully remediate any harm suffered by our customers. In addition, we could suffer reputational harm and a loss of customer trust as a result of conduct of others in the industry even where we have not engaged in the conduct. We use third parties to help in many aspects of our business, with the risk that their conduct can affect our reputation regardless of the degree to which we are responsible for it.
To an increasing extent, financial services companies, including PNC, are facing criticism from social and environmental activists, with accompanying reputational risk. Activists target companies in our industry for engaging in business with specific customers or with customers in particular industries, where the customers’ activities, even if legal, are perceived as having harmful impacts on matters such as environment, consumer health and safety, or society at large. Activist criticism has come in many forms, including protests at PNC facilities. PNC, together with many other financial services companies, have in recent years been criticized for financing companies engaged in, for example, extraction and distribution of fossil fuels, manufacture of nuclear and other weapons (including personal firearms), private prisons, and border control activities. Many of these issues are divisive without broad agreement as to the appropriate steps a company such as PNC should take and often with strong feelings on both sides. As a result, however we respond to such criticism, we expose ourselves to the risks that current or potential customers decline to do business with us or current or potential employees refuse to work for us. This can be true regardless of whether we are perceived by some as not having done enough to address activist concerns or by others as having inappropriately yielded to activist pressures. Activist pressure can also be a factor in decisions as to which business opportunities and customers we pursue, potentially resulting in foregone profit opportunities.
The speed with which information now moves through social media and non-mainstream news sources on the internet means that negative information about PNC can rapidly have a broadly adverse impact on our reputation. This is true whether or not the information is accurate. Once information has gone viral, it can be hard to counter it effectively, either by correcting inaccuracies or

The PNC Financial Services Group, Inc. – 2019 Form 10-K 27
communicating remedial steps taken for actual issues. The potential impact of negative information going viral means that material reputational harm can result from a single discrete or isolated incident.
We are also subject to the risk of reputational harm resulting from conduct of persons identified as our employees but acting outside of the scope of their employment, including through their activities on personal social media.
We operate in a highly competitive environment in terms of the products and services we offer and the geographic markets in which we conduct business, as well as the labor markets where we compete for talented employees.
We are subject to intense competition both from other financial institutions and from non-bank entities, including financial technology companies (often referred to as FinTech). In many cases, non-bank entities can engage in many activities similar to ours without being subject to the same types of regulation, supervision and restrictions as are applicable to banks. The competition we face is described in Item 1 of this Report under “Competition.”
Consolidation in our industry, including among smaller banks combining to form more competitive larger ones and between banks and non-bank entities, could result in PNC facing more intense competition, particularly in impacted regions or with respect to particular products.
Another increasingly competitive factor in the financial services industry is the ability to attract and retain talented employees across many of our businesses and support areas. This factor presents greater risk when we are expanding into new markets, developing new product lines, or significantly enhancing staffing in certain areas, particularly technology. This competition leads to increased expenses in affected business areas. Limitations on the manner in which regulated financial institutions can compensate their officers and employees, including those contained in pending rule proposals implementing requirements of Dodd-Frank, may make it more difficult for regulated financial institutions, including PNC, to compete with unregulated companies for talent.
A failure to adequately address the competitive pressures we face could make it harder for us to attract and retain customers across our businesses. On the other hand, meeting these competitive pressures could require us to incur significant additional expense or to accept risk beyond what we would otherwise view as desirable under the circumstances. In addition, in our interest rate sensitive businesses, competitive pressures to increase rates on deposits or decrease rates on loans could reduce our net interest margin, negatively impacting our net interest income.
Risks Related to Other Operational Issues
We depend on the effectiveness and integrity of employees, and the systems and controls for which they are responsible, to manage operational risks.
We are a large company that offers a wide variety of products and services to a broad and diverse group of customers. We rely on our employees to design, manage, and operate our systems and controls to assure that we properly enter into, record and manage processes, transactions and other relationships with customers, suppliers and other parties with whom we do business. In some cases, we rely on employees of third parties to perform these tasks. We also depend on employees and the systems and controls for which they are responsible to assure that we identify and mitigate the risks that are inherent in our relationships and activities. These concerns are increased when we change processes or procedures, introduce new products or services, or implement new technologies, as we may fail to adequately identify or manage operational risks resulting from such changes.
As a result of our necessary reliance on employees, whether ours or those of third parties, to perform these tasks and manage resulting risks, we are thus subject to human vulnerabilities. These range from innocent human error to misconduct or malfeasance, potentially leading to operational breakdowns or other failures. Our controls may not be adequate to prevent problems resulting from human involvement in our business, including risks associated with the design, operation and monitoring of automated systems.
Errors by our employees or others responsible for systems and controls on which we depend and any resulting failures of those systems and controls could result in significant harm to PNC. This could include customer remediation costs, regulatory fines or penalties, litigation or enforcement actions, or limitations on our business activities. We could also suffer damage to our reputation, as described under “We are at risk for an adverse impact on our business due to damage to our reputation.”
We use automation to help reduce some risks of human error. Recently, we have started taking greater advantage of machine learning, artificial intelligence and robotic process automation tools. Nonetheless, we continue to rely on many manual processes to conduct our business and manage our risks. In addition, use of automation tools does not eliminate the need for effective design and monitoring of their operation to make sure they operate as intended. Enhanced use of automation may present its own risks. These tools are dependent on the quality of the data used by the tool to learn and enhance the process for which it is responsible. Not only bad or missing data but also anomalous data can adversely affect the functioning of such tools. It is possible that humans in some cases are better able than highly automated tools to identify that anomalous data is being used or that results are themselves anomalous.

28 The PNC Financial Services Group, Inc. – 2019 Form 10-K
We rely on third party vendors, service providers and other counterparties to help support many aspects of our business. When we do so, our direct control of activities related to our business is reduced, which could introduce risk.
Our use of third parties to support our business needs typically means that we do not directly control the activities we are having them perform. Risks can arise through greater complexity and inadequate performance by the third party, specifically where that performance could affect us or our customers. Many of the kinds of risks presented by activities performed by third parties are described elsewhere in these Risk Factors. For example, we use outside companies to assist us in processing some confidential customer or employee information. In such a case, a cyber attack on such a company may result in access to our customers’ or employees’ information. We are also vulnerable, including to regulatory penalties, where an outside company fails to comply with legal requirements relevant to its work on our behalf. We may in any such circumstance suffer financial losses, legal consequences and injury to our reputation. Even if the other company makes us whole for financial losses, which is not necessarily the case, it is unlikely that it would be able to restore any injury to our reputation. As a result, the use of third parties to assist in our business activities heightens the risks to us inherent in those activities.
Other Key Risks
We are at risk for the impact of adverse results in legal proceedings.
Many aspects of our business involve substantial risk of legal liability. We have been named or threatened to be named as defendants in various lawsuits arising from our business activities. In addition, we are regularly the subject of governmental investigations and other forms of regulatory inquiry. We also are at risk when we have agreed to indemnify others for losses related to legal proceedings they face, such as in connection with the sale of a business or assets by us. The results of these legal proceedings could lead to significant monetary damages or penalties, restrictions on the way in which we conduct our business, or reputational harm.
Although we establish accruals for legal proceedings when information related to the loss contingencies represented by those matters indicates both that a loss is probable and that the amount of loss can be reasonably estimated, we do not have accruals for all legal proceedings where we face a risk of loss. In addition, due to the inherent subjectivity of the assessments and unpredictability of the outcome of legal proceedings, amounts accrued often do not represent the ultimate loss to us from the legal proceedings in question. Thus, our ultimate future losses may be higher, and possibly significantly so, than the amounts accrued for legal loss contingencies. We discuss further the unpredictability of legal proceedings and describe certain of our pending legal proceedings in Note 19 Legal Proceedings in the Notes To Consolidated Financial Statements in Item 8 of this Report.
As a result of our substantial minority equity interest in BlackRock, a publicly traded company, its business operations and financial performance can adversely affect PNC and our results.
Our investment in BlackRock represents a significant investment for PNC and contributes both income (through equity method accounting) and cash inflows (through dividends) to PNC. See Note 22 Segment Reporting in the Notes To Consolidated Financial Statements in Item 8 of this Report. In 2019, BlackRock contributed 15% of our net income. The value of our investment in BlackRock and its contribution to our financial results are vulnerable to poor financial performance or other issues at BlackRock affecting its business. In addition, we rely on BlackRock for its financial results that, as discussed above, are included in our financial statements. BlackRock is responsible for, and has control over, the preparation of its financial statements and its internal controls over financial reporting. PNC may be impacted by factors such as poor performance or other issues, as well as by financial reporting control failures, at BlackRock, with the extent of the impact on us and our financial results depending on the severity of the issue at BlackRock.
BlackRock is a public company that files separately with the SEC. In its filings with the SEC, BlackRock provides disclosure as to its business, including disclosure regarding its views as to the drivers of its financial performance and the most significant risks it faces. Its SEC filings also include certifications and disclosure regarding internal controls over financial reporting and disclosure controls.
We grow our business in part by acquiring other financial services businesses from time to time. Sometimes these are businesses with technologies or other assets valuable to us even if they do not themselves provide financial services to customers. These acquisitions present a number of risks and uncertainties related both to the acquisition transactions themselves and to the integration of the acquired businesses into PNC after closing.
Acquisitions of other companies or of financial assets and related deposits and other liabilities present risks and uncertainties to us in addition to those presented by the nature of the business acquired.
Acquisitions may be substantially more expensive or take longer to complete than anticipated. This risk includes unanticipated costs incurred in connection with the integration of the acquired business. Anticipated benefits (such as cost savings from synergies or strategic gains from being able to offer enhanced product sets) may take longer or require greater resources to achieve. In some cases, it may prove impossible to realize them in their entirety. The success of an acquisition generally is at least partially dependent on our ability to retain and expand upon the acquired company’s customer base. It is also frequently subject to risks related to human capital, including, if being retained, the quality of leadership of the acquired company.

The PNC Financial Services Group, Inc. – 2019 Form 10-K 29
Specific factors that can affect the ultimate results from acquisitions include, depending on the nature of the business acquired, the following:
• If the acquisition includes loan portfolios, the extent of credit losses following completion of the acquisition. • If a significant aspect of the value of an acquired business is intellectual property, the extent to which the intellectual
property may be protected and commercialized by PNC following the acquisition. • If the acquisition involves entering into new businesses or geographic or other markets, potential limitations on our ability
to take advantage of these opportunities as a result of our inexperience with respect to them. • The results of litigation and governmental investigations that may be pending at the time of the acquisition or be filed or
commenced thereafter, as a result of an acquisition or otherwise. It is often hard to predict the results of such legal proceedings. It may also be hard to anticipate what legal proceedings may be started following an acquisition.
Our ability to analyze the risks presented by prospective acquisitions, as well as our ability to prepare in advance of closing for integration, depends, in part, on the information we can gather with respect to the business we are acquiring. We may not have access to all of the information that would be desirable. Our pre-acquisition review of the business also impacts our ability to prepare for and execute on the integration of an acquired business. An acquired company’s financial and business information and data may not be maintained at the level of detail or comprehensiveness to meet all of our post-acquisition needs.
Our ability to pursue or complete attractive acquisition opportunities could be negatively impacted by regulatory issues, including delays in obtaining required approvals. Our ability to make large acquisitions in the future may be negatively impacted as well by regulatory rules or future regulatory initiatives designed to limit systemic risk and the potential for a financial institution to become “too big to fail.”
Our business and financial performance could be adversely affected, directly or indirectly, by disasters, natural or otherwise, by terrorist activities or by international hostilities.
Neither the occurrence nor the potential impact of disasters (whether caused naturally or by human conduct), pandemics, terrorist activities and international hostilities can be predicted. However, these occurrences could adversely impact us, for example, by causing significant damage to our facilities or preventing us from conducting our business in the ordinary course. Also, their impact on our borrowers, depositors, other customers, suppliers or other counterparties could result in indirect adverse effects on us. Other indirect adverse consequences from disasters, pandemics, terrorist activities or international hostilities could result from impacts to the financial markets, the economy in general or in any particular region, or key parts of the infrastructure (such as the power grid) on which we and our customers rely. These types of indirect effects, whether specific to our counterparties or more generally applicable, could lead, for example, to an increase in delinquencies, bankruptcies or defaults that could result in our experiencing higher levels of nonperforming assets, net charge-offs and provisions for credit losses. They could also cause a reduction in demand for lending or other services that we provide. To the extent that climate change increases the frequency or severity of adverse weather conditions, the impact from these types of natural disasters on us or our customers would be worse.
Our ability to mitigate the adverse consequences of such occurrences is in part dependent on the quality of our resiliency planning. This includes our ability to anticipate the nature of any such event that might occur. The adverse impact of disasters, pandemics, terrorist activities or international hostilities also could be increased to the extent that there is a lack of preparedness on the part of national or regional emergency responders or on the part of other organizations and businesses that we deal with, many of which we depend on but have limited or no control over.
ITEM 1B – UNRESOLVED STAFF COMMENTS
There are no SEC staff comments regarding PNC’s periodic or current reports under the Exchange Act that are pending resolution.
ITEM 2 – PROPERTIES
Our executive and primary administrative offices are currently located at The Tower at PNC Plaza, Pittsburgh, Pennsylvania. The 33-story structure is owned by PNC Bank, National Association.
We own or lease numerous other premises for use in conducting business activities, including operations centers, offices, and branches and other facilities. We consider the facilities owned or occupied under lease by our subsidiaries to be adequate for the purposes of our business operations. We include here by reference the additional information regarding our properties in Note 8 Premises, Equipment and Leasehold Improvements and Note 24 Leases in the Notes To Consolidated Financial Statements in Item 8 of this Report.
ITEM 3 – LEGAL PROCEEDINGS
See the information set forth in Note 19 Legal Proceedings in the Notes To Consolidated Financial Statements in Item 8 of this Report, which is incorporated here by reference.

30 The PNC Financial Services Group, Inc. – 2019 Form 10-K
ITEM 4 – MINE SAFETY DISCLOSURES
Not applicable
INFORMATION ABOUT OUR EXECUTIVE OFFICERS
Information regarding each of our executive officers as of February 21, 2020 is set forth below. Executive officers do not have a stated term of office. Each executive officer has held the position or positions indicated or another executive position with the same entity or one of its affiliates for the past five years unless otherwise indicated below.
Name Age Position with PNC Year Employed (a)
William S. Demchak 57 Chairman, President and Chief Executive Officer (b) 2002Michael J. Hannon 63 Executive Vice President and Chief Credit Officer 1982Vicki C. Henn 51 Executive Vice President and Chief Human Resources Officer 1994Gregory B. Jordan 60 Executive Vice President, General Counsel and Chief Administrative Officer 2013Stacy M. Juchno 44 Executive Vice President and General Auditor 2009Karen L. Larrimer 57 Executive Vice President, Chief Customer Officer and Head of Retail Banking 1995Michael P. Lyons 49 Executive Vice President, Head of Corporate & Institutional Banking and Head of Asset
Management Group2011
E William Parsley, III 54 Executive Vice President and Chief Operating Officer 2003Robert Q. Reilly 55 Executive Vice President and Chief Financial Officer 1987Joseph E. Rockey 55 Executive Vice President and Chief Risk Officer 1999Steven Van Wyk 61 Executive Vice President and Head of Technology and Innovation 2013Gregory H. Kozich 56 Senior Vice President and Controller 2010
(a) Where applicable, refers to year employed by predecessor company.(b) Mr. Demchak also serves as a director. Biographical information for Mr. Demchak is included in “Election of Directors (Item 1)” in our proxy statement for the
2020 annual meeting of shareholders. See Item 10 of this Report.
Michael J. Hannon has served as Executive Vice President since 2009, prior to which he was a Senior Vice President. He has served as Chief Credit Officer since 2001 and was Interim Chief Risk Officer from December 2011 to February 2012.
Vicki C. Henn has served as Executive Vice President and Chief Human Resources Officer of PNC since July 2014. Ms. Henn joined PNC in 1994 and has held numerous management positions. Prior to being named to her current position, Ms. Henn was a Senior Vice President, responsible for Human Resources for Retail Banking.
Gregory B. Jordan joined PNC in 2013 as Executive Vice President, General Counsel and Head of Regulatory and Government Affairs. In February 2016, Mr. Jordan was also appointed Chief Administrative Officer. Prior to joining PNC, he served as the Global Managing Partner for the last 13 years of his 29 year tenure at Reed Smith LLP.
Stacy M. Juchno has served as Executive Vice President and General Auditor of PNC since April 2014 and previously served as Senior Vice President and Finance Governance and Oversight Director.
Karen L. Larrimer was appointed Executive Vice President in 2013 and became head of PNC’s Retail Banking in 2016. She has also served as Chief Customer Officer since April 2014, prior to which she served as Chief Marketing Officer.
Michael P. Lyons has been an Executive Vice President since 2011 and is head of PNC’s Corporate & Institutional Banking and Asset Management Group. Prior to joining PNC in October 2011, from May 2010 until October 2011, Mr. Lyons was head of corporate development and strategic planning for Bank of America.
E William Parsley, III has served as Executive Vice President since 2009 and was appointed Chief Operating Officer in February 2018. Previously, he served as Treasurer and Chief Investment Officer since 2004 and head of Consumer Lending since the spring of 2016.
Robert Q. Reilly was appointed Chief Financial Officer in 2013. He served as the head of PNC’s Asset Management Group from 2005 until April 2013. Previously, he held numerous management roles in both Corporate Banking and Asset Management. He was appointed Executive Vice President in 2009.
Joseph E. Rockey was appointed Executive Vice President and Chief Risk Officer in January 2015. Prior to his appointment, Mr. Rockey led enterprise risk management and the Basel office within PNC’s risk management organization.

The PNC Financial Services Group, Inc. – 2019 Form 10-K 31
Steven Van Wyk joined PNC as Head of Technology and Operations in 2013 and was appointed Head of Technology and Innovation in April 2017. He was appointed Executive Vice President of PNC in 2013. From 2007 until joining PNC, Mr. Van Wyk served as Global Chief Operating Officer for ING.
Gregory H. Kozich has served as Controller of PNC since 2011. He was appointed as Senior Vice President in 2010. Prior to joining PNC in 2010, Mr. Kozich was with the Federal National Mortgage Association from 2005 until late 2010, most recently serving as its corporate controller.
PART II
ITEM 5 – MARKET FOR REGISTRANT’S COMMON EQUITY, RELATED STOCKHOLDER MATTERS AND ISSUER PURCHASES OF EQUITY SECURITIES
Our common stock is listed on the New York Stock Exchange and is traded under the symbol “PNC.” At the close of business on February 14, 2020, there were 51,186 common shareholders of record.
Holders of PNC common stock are entitled to receive dividends when declared by our Board of Directors out of funds legally available for this purpose. Our Board of Directors may not pay or set apart dividends on the common stock until dividends for all past dividend periods on any series of outstanding preferred stock and certain outstanding capital securities issued by the parent company have been paid or declared and set apart for payment. The Board of Directors presently intends to continue the policy of paying quarterly cash dividends. The amount of any future dividends will depend on economic and market conditions, our financial condition and operating results, and other factors, including contractual restrictions and applicable government regulations and policies (such as those relating to the ability of bank and non-bank subsidiaries to pay dividends to the parent company and regulatory capital limitations). The amount of our dividend is also currently subject to the results of the supervisory assessment of capital adequacy and capital planning processes undertaken by the Federal Reserve and our primary bank regulators as part of the Comprehensive Capital Analysis and Review (CCAR) process as described in the Supervision and Regulation section in Item 1 of this Report.
The Federal Reserve has the power to prohibit us from paying dividends without its approval. For further information concerning dividend restrictions and other factors that could limit our ability to pay dividends, as well as restrictions on loans, dividends or advances from bank subsidiaries to the parent company, see the Supervision and Regulation section in Item 1, Item 1A Risk Factors, the Liquidity and Capital Management portion of the Risk Management section in Item 7, and Note 10 Borrowed Funds, Note 15 Equity and Note 18 Regulatory Matters in the Notes To Consolidated Financial Statements in Item 8 of this Report, which we include here by reference.
We include here by reference the information regarding our compensation plans under which PNC equity securities are authorized for issuance as of December 31, 2019 in the table (with introductory paragraph and notes) in Item 12 of this Report.
Our stock transfer agent and registrar is:Computershare462 South 4th Street, Suite 1600Louisville, KY 40202800-982-7652www.computershare.com/pnc
Registered shareholders may contact Computershare regarding dividends and other shareholder services.
We include here by reference the information that appears under the Common Stock Performance Graph caption at the end of this Item 5.
Unregistered Sales of Equity Securities
None.
Equity Security Repurchases
Details of our repurchases of PNC common stock during the fourth quarter of 2019 are included in the following table:

32 The PNC Financial Services Group, Inc. – 2019 Form 10-K
In thousands, except per share data
2019 period Total shares purchased (a)Average pricepaid per share
Total shares purchased as part ofpublicly announced programs (b)
Maximum number of shares that may yet bepurchased under the programs (b)
October 1 – 31 2,774 $ 142.77 2,764 89,778November 1 – 30 1,768 $ 151.74 1,768 88,010December 1 – 31 1,918 $ 156.46 1,918 86,092
Total 6,460 $ 149.29 6,450 (a) Includes PNC common stock purchased in connection with our various employee benefit plans generally related to forfeitures of unvested restricted stock awards and shares
used to cover employee payroll tax withholding requirements. Note 11 Employee Benefit Plans and Note 12 Stock Based Compensation Plans in the Notes To Consolidated Financial Statements in Item 8 of this Report include additional information regarding our employee benefit and equity compensation plans that use PNC common stock.
(b) On April 4, 2019, our Board of Directors approved the establishment of a new stock repurchase program authorization in the amount of 100 million shares of PNC common stock, effective July 1, 2019. The previous 2015 authorization was terminated as of end of day on June 30, 2019. Under this authorization, repurchases may be made in open market or privately negotiated transactions, with the timing and exact amount of common stock repurchases depending on a number of factors including, among others, market and general economic conditions, regulatory capital considerations, alternative uses of capital, the potential impact on our credit ratings, and contractual and regulatory limitations, including the results of the supervisory assessment of capital adequacy and capital planning processes undertaken by the Federal Reserve as part of the CCAR process. In June 2019, we announced share repurchase programs of up to $4.3 billion for the four quarter period beginning with the third quarter of 2019, in accordance with PNC's 2019 capital plan. In January 2020, we announced an increase to these programs to repurchase up to an additional $1.0 billion in common shares through the end of the second quarter of 2020. The aggregate price of shares repurchased during the fourth quarter of 2019 was $1.0 billion. See the Liquidity and Capital Management portion of the Risk Management section in Item 7 of this Report for more information on the authorized share repurchase programs for the period July 1, 2019 through June 30, 2020.
Common Stock Performance Graph
This graph shows the cumulative total shareholder return (i.e., price change plus reinvestment of dividends) on our common stock during the five-year period ended December 31, 2019, as compared with: (1) a selected peer group as set forth below and referred to as the “Peer Group;” (2) an overall stock market index, the S&P 500 Index; and (3) a published industry index, the S&P 500 Banks. The yearly points marked on the horizontal axis of the graph correspond to December 31 of each year. The stock performance graph assumes that $100 was invested on January 1, 2015 for the five-year period and that dividends were reinvested. The table below the graph shows the resultant compound annual growth rate for the performance period.
Base PeriodAssumes $100 investment at Close of Market on December 31, 2014
Total Return = Price change plus reinvestment of dividends5-Year CompoundGrowth Rate
Dec. 2014 Dec. 2015 Dec. 2016 Dec. 2017 Dec. 2018 Dec. 2019
PNC $ 100 $ 106.81 $ 134.34 $ 169.22 $ 140.49 $ 197.94 14.63%S&P 500 Index $ 100 $ 101.37 $ 113.49 $ 138.26 $ 132.19 $ 173.80 11.69%S&P 500 Banks $ 100 $ 100.85 $ 125.36 $ 153.64 $ 128.38 $ 180.55 12.54%Peer Group $ 100 $ 99.30 $ 132.37 $ 157.91 $ 126.57 $ 170.67 11.28%
The Peer Group for the preceding chart and table consists of the following companies: Bank of America Corporation; Capital One Financial Corporation; Citizens Financial Group, Inc.; Fifth Third Bancorp; JPMorgan Chase & Co.; KeyCorp; M&T Bank Corporation; Regions Financial Corporation; The PNC Financial Services Group, Inc.; Truist Financial Corporation; U.S. Bancorp;

The PNC Financial Services Group, Inc. – 2019 Form 10-K 33
and Wells Fargo & Company. Originally, the Peer Group also included both SunTrust Banks, Inc. and BB&T Corporation. These entities merged to create Truist Financial Corporation on December 6, 2019. BB&T Corporation was the surviving entity in the merger, thus data used to produce the preceding chart and table reflects historical BB&T Corporation data for Truist Financial Corporation. Historical data for SunTrust Banks, Inc. is not included as a part of Truist Financial Corporation in the preceding chart and table. This Peer Group was approved for 2019 by the Board of Directors’ Personnel and Compensation Committee, and the Committee has approved the same peer group for 2020.
Each yearly point for the Peer Group is determined by calculating the cumulative total shareholder return for each company in the Peer Group from December 31, 2014 to December 31 of that year (End of Month Dividend Reinvestment Assumed) and then using the median of these returns as the yearly plot point.
In accordance with the rules of the SEC, this section, captioned “Common Stock Performance Graph,” is not incorporated by reference into any of our future filings made under the Securities Exchange Act of 1934 or the Securities Act of 1933. The Common Stock Performance Graph, including its accompanying table and footnotes, is not deemed to be soliciting material or to be filed under the Exchange Act or the Securities Act.
ITEM 6 – SELECTED FINANCIAL DATA
This Selected Financial Data should be reviewed in conjunction with the Consolidated Financial Statements and Notes included inItem 8 of this Report as well as the other disclosures in this Report concerning our historical financial performance, our futureprospects and the risks associated with our business and financial performance.
Year ended December 31Dollars in millions, except per share data 2019 2018 2017 2016 2015Summary of OperationsInterest income $ 13,762 $ 12,582 $ 10,814 $ 9,652 $ 9,323Interest expense 3,797 2,861 1,706 1,261 1,045Net interest income 9,965 9,721 9,108 8,391 8,278Noninterest income 7,862 7,411 7,221 6,771 6,947Total revenue 17,827 17,132 16,329 15,162 15,225Provision for credit losses 773 408 441 433 255Noninterest expense 10,574 10,296 10,398 9,476 9,463Income before income taxes and noncontrolling interests 6,480 6,428 5,490 5,253 5,507Income taxes 1,062 1,082 102 1,268 1,364Net income 5,418 5,346 5,388 3,985 4,143Less: Net income attributable to noncontrolling interests 49 45 50 82 37
Preferred stock dividends 236 236 236 209 220 Preferred stock discount accretion and redemptions 4 4 26 6 5
Net income attributable to common shareholders $ 5,129 $ 5,061 $ 5,076 $ 3,688 $ 3,881Per Common Share
Basic earnings $ 11.43 $ 10.79 $ 10.49 $ 7.42 $ 7.52Diluted earnings $ 11.39 $ 10.71 $ 10.36 $ 7.30 $ 7.39
Book value $ 104.59 $ 95.72 $ 91.94 $ 85.94 $ 81.84Cash dividends declared $ 4.20 $ 3.40 $ 2.60 $ 2.12 $ 2.01Effective tax rate (a) 16.4% 16.8% 1.9% 24.1% 24.8%Performance RatiosNet interest margin (b) 2.89% 2.97% 2.87% 2.73% 2.74%Noninterest income to total revenue 44% 43% 44% 45% 46%Efficiency 59% 60% 64% 62% 62%Return on: Average common shareholders' equity 11.50% 11.83% 12.09% 8.85% 9.50% Average assets 1.35% 1.41% 1.45% 1.10% 1.17%
(a) The effective tax rates are generally lower than the statutory rate due to the relationship of pretax income to tax credits and earnings that are not subject to tax.(b) Net interest margin is the total yield on interest-earning assets minus the total rate on interest-bearing liabilities and includes the benefit from use of noninterest-bearing sources. To
provide more meaningful comparisons of net interest margins, we use net interest income on a taxable-equivalent basis in calculating average yields used in the calculation of net interest margin by increasing the interest income earned on tax-exempt assets to make it fully equivalent to interest income earned on taxable investments. This adjustment is not permitted under GAAP in the Consolidated Income Statement. For additional information, see Reconciliation of Taxable-Equivalent Net Interest Income (Non-GAAP) Statistical Information (Unaudited) in Item 8 of this Report.
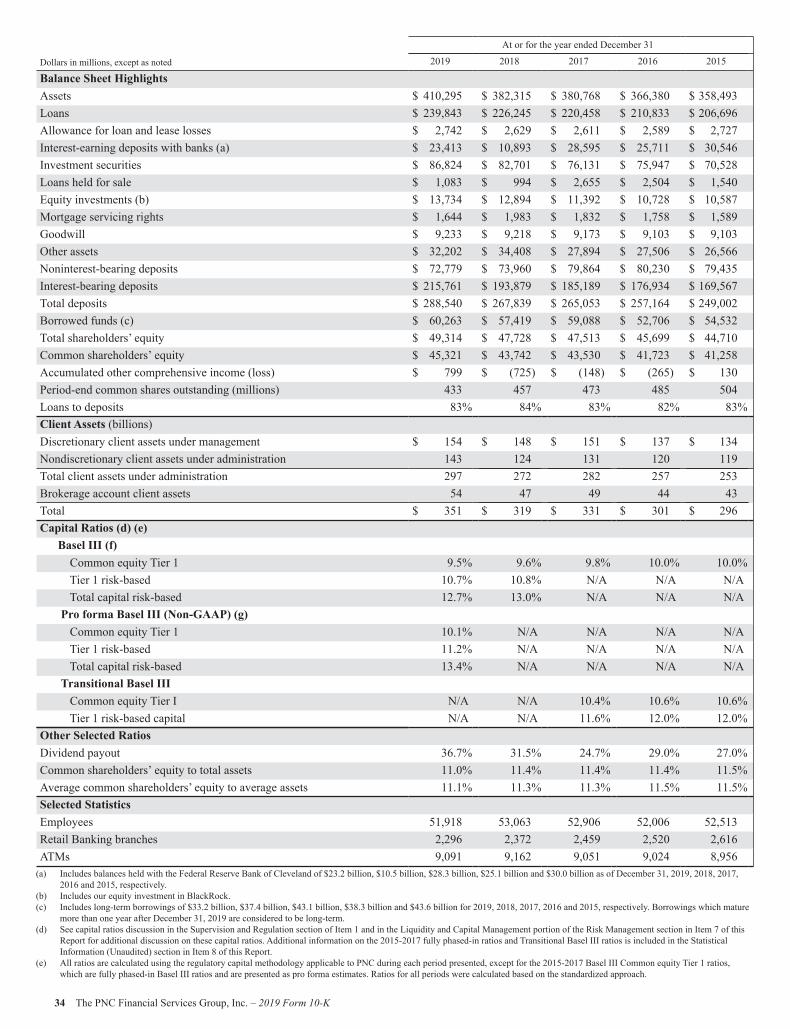
34 The PNC Financial Services Group, Inc. – 2019 Form 10-K
At or for the year ended December 31
Dollars in millions, except as noted 2019 2018 2017 2016 2015
Balance Sheet HighlightsAssets $ 410,295 $ 382,315 $ 380,768 $ 366,380 $ 358,493Loans $ 239,843 $ 226,245 $ 220,458 $ 210,833 $ 206,696Allowance for loan and lease losses $ 2,742 $ 2,629 $ 2,611 $ 2,589 $ 2,727Interest-earning deposits with banks (a) $ 23,413 $ 10,893 $ 28,595 $ 25,711 $ 30,546Investment securities $ 86,824 $ 82,701 $ 76,131 $ 75,947 $ 70,528Loans held for sale $ 1,083 $ 994 $ 2,655 $ 2,504 $ 1,540Equity investments (b) $ 13,734 $ 12,894 $ 11,392 $ 10,728 $ 10,587Mortgage servicing rights $ 1,644 $ 1,983 $ 1,832 $ 1,758 $ 1,589Goodwill $ 9,233 $ 9,218 $ 9,173 $ 9,103 $ 9,103Other assets $ 32,202 $ 34,408 $ 27,894 $ 27,506 $ 26,566Noninterest-bearing deposits $ 72,779 $ 73,960 $ 79,864 $ 80,230 $ 79,435Interest-bearing deposits $ 215,761 $ 193,879 $ 185,189 $ 176,934 $ 169,567Total deposits $ 288,540 $ 267,839 $ 265,053 $ 257,164 $ 249,002Borrowed funds (c) $ 60,263 $ 57,419 $ 59,088 $ 52,706 $ 54,532Total shareholders’ equity $ 49,314 $ 47,728 $ 47,513 $ 45,699 $ 44,710Common shareholders’ equity $ 45,321 $ 43,742 $ 43,530 $ 41,723 $ 41,258Accumulated other comprehensive income (loss) $ 799 $ (725) $ (148) $ (265) $ 130Period-end common shares outstanding (millions) 433 457 473 485 504Loans to deposits 83% 84% 83% 82% 83%Client Assets (billions)Discretionary client assets under management $ 154 $ 148 $ 151 $ 137 $ 134Nondiscretionary client assets under administration 143 124 131 120 119Total client assets under administration 297 272 282 257 253Brokerage account client assets 54 47 49 44 43Total $ 351 $ 319 $ 331 $ 301 $ 296Capital Ratios (d) (e) Basel III (f) Common equity Tier 1 9.5% 9.6% 9.8% 10.0% 10.0% Tier 1 risk-based 10.7% 10.8% N/A N/A N/A Total capital risk-based 12.7% 13.0% N/A N/A N/A Pro forma Basel III (Non-GAAP) (g) Common equity Tier 1 10.1% N/A N/A N/A N/A Tier 1 risk-based 11.2% N/A N/A N/A N/A Total capital risk-based 13.4% N/A N/A N/A N/A Transitional Basel III Common equity Tier I N/A N/A 10.4% 10.6% 10.6% Tier 1 risk-based capital N/A N/A 11.6% 12.0% 12.0%Other Selected RatiosDividend payout 36.7% 31.5% 24.7% 29.0% 27.0%Common shareholders’ equity to total assets 11.0% 11.4% 11.4% 11.4% 11.5%Average common shareholders’ equity to average assets 11.1% 11.3% 11.3% 11.5% 11.5%Selected StatisticsEmployees 51,918 53,063 52,906 52,006 52,513Retail Banking branches 2,296 2,372 2,459 2,520 2,616ATMs 9,091 9,162 9,051 9,024 8,956
(a) Includes balances held with the Federal Reserve Bank of Cleveland of $23.2 billion, $10.5 billion, $28.3 billion, $25.1 billion and $30.0 billion as of December 31, 2019, 2018, 2017, 2016 and 2015, respectively.
(b) Includes our equity investment in BlackRock.(c) Includes long-term borrowings of $33.2 billion, $37.4 billion, $43.1 billion, $38.3 billion and $43.6 billion for 2019, 2018, 2017, 2016 and 2015, respectively. Borrowings which mature
more than one year after December 31, 2019 are considered to be long-term.(d) See capital ratios discussion in the Supervision and Regulation section of Item 1 and in the Liquidity and Capital Management portion of the Risk Management section in Item 7 of this
Report for additional discussion on these capital ratios. Additional information on the 2015-2017 fully phased-in ratios and Transitional Basel III ratios is included in the Statistical Information (Unaudited) section in Item 8 of this Report.
(e) All ratios are calculated using the regulatory capital methodology applicable to PNC during each period presented, except for the 2015-2017 Basel III Common equity Tier 1 ratios, which are fully phased-in Basel III ratios and are presented as pro forma estimates. Ratios for all periods were calculated based on the standardized approach.

The PNC Financial Services Group, Inc. – 2019 Form 10-K 35
(f) The 2019 and 2018 Basel III ratios for Common equity Tier 1 capital and Tier 1 risk-based capital reflect the full phase-in of all Basel III adjustments to these metrics applicable to PNC. The 2019 and 2018 Basel III Total capital risk-based ratios include nonqualifying trust preferred capital securities of $60 million and $80 million, respectively, that are subject to a phase-out period that runs through 2021.
(g) Pro forma Basel III ratios are calculated as if the 2019 Tailoring Rules, and PNC's election to opt-out of the inclusion of certain elements of accumulated other comprehensive income in regulatory capital, had been in effect on December 31, 2019. We believe that the pro forma Basel III ratios are a useful tool to assess the impact to our capital position after adoption of the 2019 Tailoring Rules.
ITEM 7 – MANAGEMENT’S DISCUSSION AND ANALYSIS OF FINANCIAL CONDITION AND RESULTS OF OPERATIONS (MD&A)
EXECUTIVE SUMMARY
Key Strategic Goals
At PNC we manage our company for the long term. We are focused on the fundamentals of growing customers, loans, deposits and revenue and improving profitability, while investing for the future and managing risk, expenses and capital. We continue to invest in our products, markets and brand, and embrace our commitments to our customers, shareholders, employees and the communities where we do business.
We strive to expand and deepen customer relationships by offering a broad range of deposit, credit and fee-based products and services. We are focused on delivering those products and services to our customers with the goal of addressing their financial objectives and putting customers’ needs first. Our business model is built on customer loyalty and engagement, understanding our customers’ financial goals and offering our diverse products and services to help them achieve financial well-being. Our approach is concentrated on organically growing and deepening client relationships across our businesses that meet our risk/return measures.
We are focused on our strategic priorities, which are designed to enhance value over the long term, and consist of:• Expanding our leading banking franchise to new markets and digital platforms;• Deepening customer relationships by delivering a superior banking experience and financial solutions; and• Leveraging technology to innovate and enhance products, services, security and processes.
Our capital priorities are to support client growth and business investment, maintain appropriate capital in light of economic conditions, the Basel III framework and other regulatory expectations, and return excess capital to shareholders. For more detail, see the Capital Highlights portion of this Executive Summary and the Liquidity and Capital Management portion of the Risk Management section of this Item 7 and the Supervision and Regulation section in Item 1 Business of this Report.
Key Factors Affecting Financial Performance
We face a variety of risks that may impact various aspects of our risk profile from time to time. The extent of such impacts may vary depending on factors such as the current business and economic conditions, political and regulatory environment and operational challenges. Many of these risks and our risk management strategies are described in more detail elsewhere in this Report.
Our financial performance is substantially affected by a number of external factors outside of our control, including the following:• Global and domestic economic conditions, including the continuity and stamina of the current U.S. economic expansion;• The monetary policy actions and statements of the Federal Reserve and the Federal Open Market Committee (FOMC);• The level of, and direction, timing and magnitude of movement in, interest rates and the shape of the interest rate yield curve;• The functioning and other performance of, and availability of liquidity in, U.S. and global financial markets, including capital
markets;• The impact of tariffs and other trade policies of the U.S. and its global trading partners;• Changes in the competitive and regulatory landscape;• The impact of legislative, regulatory and administrative initiatives and actions;• The impact of market credit spreads on asset valuations;• The ability of customers, counterparties and issuers to perform in accordance with contractual terms, and the resulting impact
on our asset quality;• Loan demand, utilization of credit commitments and standby letters of credit; and• The impact on customers and changes in customer behavior due to changing business and economic conditions or regulatory
or legislative initiatives.
In addition, our success will depend upon, among other things:• Effectively managing capital and liquidity including:
• Continuing to maintain and grow our deposit base as a low-cost stable funding source;• Prudent liquidity and capital management to meet evolving regulatory capital, capital planning, stress testing and
liquidity standards; and• Actions we take within the capital and other financial markets.

36 The PNC Financial Services Group, Inc. – 2019 Form 10-K
• Execution of our strategic priorities;• Management of credit risk in our portfolio;• Our ability to manage and implement strategic business objectives within the changing regulatory environment;• The impact of legal and regulatory-related contingencies; and• The appropriateness of reserves needed for critical accounting estimates and related contingencies.
For additional information, see the Cautionary Statement Regarding Forward-Looking Information section in this Item 7 and Item 1A Risk Factors in this Report.
Income Statement Highlights
Net income for 2019 was $5.4 billion, or $11.39 per diluted common share, an increase of 1% compared to $5.3 billion, or $10.71 per diluted common share, for 2018.
• Total revenue increased $695 million, or 4%, to $17.8 billion.• Net interest income increased $244 million, or 3%, to $10.0 billion.• Net interest margin decreased to 2.89% for 2019 compared to 2.97% for 2018.• Noninterest income increased $451 million, or 6%, to $7.9 billion.
• Provision for credit losses was $773 million in 2019 compared to $408 million for 2018.• Noninterest expense increased $278 million, or 3%, to $10.6 billion.• We generated positive operating leverage in 2019 of 1.4%.• Earnings per diluted common share increased reflecting lower average common shares outstanding due to share repurchases,
and higher net income.
For additional detail, see the Consolidated Income Statement Review section of this Item 7.
Balance Sheet Highlights
Our balance sheet was strong and well positioned at December 31, 2019 and 2018. In comparison to December 31, 2018:• Total loans increased $13.6 billion, or 6%, to $239.8 billion.
• Total commercial lending grew $8.3 billion, or 5%, to $160.6 billion.• Total consumer lending increased $5.3 billion, or 7%, to $79.2 billion.
• Total deposits increased $20.7 billion, or 8%, to $288.5 billion.• Investment securities increased $4.1 billion, or 5%, to $86.8 billion.• Interest earning deposits with banks, primarily with the Federal Reserve Bank, increased $12.5 billion to $23.4 billion.• Borrowed funds of $60.3 billion increased $2.8 billion, or 5%.• Shareholders' equity increased $1.6 billion, or 3%, to $49.3 billion.
For additional detail, see the Consolidated Balance Sheet Review section of this Item 7.
Credit Quality Highlights
Overall credit quality remained historically strong.• At December 31, 2019 compared to December 31, 2018:
Nonperforming assets of $1.8 billion decreased $56 million, or 3%. Overall loan delinquencies of $1.5 billion increased $19 million, or 1%.
• Net charge-offs of $642 million in 2019 increased 53% compared to net charge-offs of $420 million for 2018.• The allowance for loan and lease losses to total loans was 1.14% at December 31, 2019 and 1.16% at December 31, 2018.
For additional detail, see the Credit Risk Management portion of the Risk Management section of this Item 7.
Capital Highlights
We maintained a strong capital position during 2019 and continued to return capital to shareholders.• The Basel III common equity Tier 1 capital ratio was 9.5% at December 31, 2019 compared with 9.6% at December 31, 2018.• In 2019, we returned $5.4 billion of capital to shareholders through repurchases of 25.9 million common shares for $3.5
billion and dividends on common shares of $1.9 billion.• In June 2019, we announced share repurchase programs of up to $4.3 billion for the four quarter period beginning with the
third quarter of 2019. In January 2020, we announced an increase to these programs of up to $1.0 billion in additional common share repurchases through the end of second quarter of 2020.
• The quarterly cash dividend on common stock was increased from $.95 to $1.15 per share effective with the August 5, 2019 dividend payment date.

The PNC Financial Services Group, Inc. – 2019 Form 10-K 37
Our ability to take certain capital actions, including plans to pay or increase common stock dividends or to repurchase shares under current or future programs, is subject to the results of the supervisory assessment of capital adequacy undertaken by the Federal Reserve as part of the Comprehensive Capital Analysis and Review (CCAR) process. For additional information, see the Supervision and Regulation section in Item 1 Business of this Report.
See the Liquidity and Capital Management portion of the Risk Management section of this Item 7 for more detail on our 2019 capital and liquidity actions as well as our capital ratios. Business Outlook
Statements regarding our business outlook are forward-looking within the meaning of the Private Securities Litigation Reform Act of 1995. Our forward-looking financial statements are subject to the risk that economic and financial market conditions will be substantially different than those we are currently expecting and do not take into account potential legal and regulatory contingencies. These statements are based on our view that:
• The U.S. economy grew at a solid pace in 2019 albeit more slowly than in 2018. Economic growth is expected to slow noticeably in 2020.
• Job growth will continue in 2020, but at a slower pace from 2019 due to both difficulty in finding workers and slower economic growth. The unemployment rate is expected to remain near its current level in the near term, but the labor market will remain tight, pushing wages higher and supporting continued gains in consumer spending.
• Inflation is expected to continue to slow in the near term because of lower commodity prices associated with coronavirus. Inflation is expected to gradually increase in 2021.
• Our current baseline forecast expects the federal funds rate to remain unchanged in 2020. The federal funds rate is modestly positive for near-term economic growth in its current range of 1.50% to 1.75%.
Near-term risks are to the downside, including a further softening in the global economy, perhaps due to coronavirus; a further escalation in trade tensions; and geopolitical concerns. The federal funds rate is more likely to end 2020 below its current range than above it. But there are some upside opportunities as well, such as a comprehensive U.S.-China trade deal and stronger labor force growth.
See the Cautionary Statement Regarding Forward-Looking Information section in this Item 7 and Item 1A Risk Factors in this Report for other factors that could cause future events to differ, perhaps materially, from those anticipated in these forward-looking statements.
For information on financial results for the fourth quarter of 2019, see the Selected Quarterly Financial Data section in the Statistical Information (Unaudited) section of Item 8 of this Report.
For full year 2020, compared to full year 2019 where appropriate, we expect:• Average loan growth to be between 4% and 5%;• Revenue growth on the low end of low-single digits, on a percentage basis, including approximately 1% of net interest
income growth;• Noninterest expense to remain stable;• The effective tax rate to be approximately 17.5%; and• To generate positive operating leverage of approximately 1% in 2020.
For the first quarter of 2020, compared to the fourth quarter of 2019 where appropriate, we expect:• Average loans to be up approximately 1%;• Net interest income to decline approximately 2%, reflecting the first quarter of 2020 decline in interest rates as well as one
less day in the quarter;• Fee income to be down approximately 6%, which includes the impact of a charitable contribution by BlackRock as previously
announced in its Form 8-K filed on February 13, 2020. Fee income consists of asset management, consumer services, corporate services, residential mortgage and service charges on deposits;
• Other noninterest income to be between $300 million and $350 million, excluding net securities gains and activities related to Visa Class B common shares;
• Noninterest expense to be down in the mid-single digit range, on a percentage basis; and• Provision for credit losses to be between $225 million and $300 million.

38 The PNC Financial Services Group, Inc. – 2019 Form 10-K
CONSOLIDATED INCOME STATEMENT REVIEW
Our Consolidated Income Statement is presented in Item 8 of this Report. For additional detail of the comparison of 2018 over 2017, see Item 7 of our 2018 Form 10-K.
Net income for 2019 was $5.4 billion, or $11.39 per diluted common share, an increase of $72 million or 1% compared with $5.3 billion, or $10.71 per diluted common share, for 2018. The increase was driven by higher noninterest income and net interest income, partially offset by increases in provision for credit losses and noninterest expense.
Net Interest Income
Table 1: Summarized Average Balances and Net Interest Income (a)
2019 2018
Year ended December 31Dollars in millions
AverageBalances
AverageYields/
Rates
InterestIncome/Expense
AverageBalances
AverageYields/
Rates
InterestIncome/Expense
AssetsInterest-earning assets
Investment securities $ 83,666 2.93% $ 2,450 $ 78,784 2.91% $ 2,289Loans 235,016 4.51% 10,604 223,278 4.33% 9,667Interest-earning deposits with banks 16,878 2.09% 353 20,603 1.84% 379Other 12,425 3.69% 458 8,093 4.47% 362
Total interest-earning assets/interest income $ 347,985 3.98% 13,865 $ 330,758 3.84% 12,697LiabilitiesInterest-bearing liabilities
Interest-bearing deposits $ 204,588 .97% 1,986 $ 186,361 .66% 1,229Borrowed funds 61,528 2.94% 1,811 59,306 2.75% 1,632
Total interest-bearing liabilities/interest expense $ 266,116 1.43% 3,797 $ 245,667 1.16% 2,861Net interest income/margin (Non-GAAP) 2.89% 10,068 2.97% 9,836Taxable-equivalent adjustments (103) (115)
Net interest income (GAAP) $ 9,965 $ 9,721(a) Interest income calculated as taxable-equivalent interest income. To provide more meaningful comparisons of interest income and yields for all interest-earning assets, as
well as net interest margins, we use interest income on a taxable-equivalent basis in calculating average yields and net interest margins by increasing the interest income earned on tax-exempt assets to make it fully equivalent to interest income earned on taxable investments. This adjustment is not permitted under GAAP on the Consolidated Income Statement. For more information, see Reconciliation of Taxable-Equivalent Net Interest Income (Non-GAAP) in the Statistical Information (Unaudited) section in Item 8 of this Report.
Changes in net interest income and margin result from the interaction of the volume and composition of interest-earning assets and related yields, interest-bearing liabilities and related rates paid, and noninterest-bearing sources of funding. See the Statistical Information (Unaudited) – Average Consolidated Balance Sheet And Net Interest Analysis and Analysis Of Year-To-Year Changes In Net Interest Income in Item 8 of this Report.
Net interest income increased $244 million, or 3%, in 2019 compared with 2018 as higher loan and securities yields and balances were partially offset by higher funding costs. Net interest margin of 2.89% decreased 8 basis points in 2019 compared to 2018, driven by the declining rate environment in 2019.
Average investment securities increased $4.9 billion, or 6%, reflecting net purchases of agency residential mortgage-backed securities of $4.1 billion, U.S. Treasury and government agency securities of $1.3 billion and commercial mortgage-backed securities of $.9 billion, partially offset by decreases of $.9 billion to other securities, $.4 billion to non-agency residential mortgage backed securities and $.1 billion to asset-backed securities . Average investment securities represented 24% of average interest-earning assets in both 2019 and 2018.
Average loans grew $11.7 billion, or 5%, driven by commercial and consumer lending growth. Average commercial lending increased $9.3 billion, or 6%, to $159.3 billion reflecting strong growth in our Corporate Banking and Business Credit businesses in our Corporate & Institutional Banking segment. Average consumer lending increased $2.4 billion, or 3%, to $75.7 billion as growth in residential real estate, auto, credit card and unsecured installment loans was partially offset by declines in home equity and education loans. Lower home equity loans reflected paydowns and payoffs that exceeded new originated volume and continued runoff of brokered home equity loans. Additionally, government guaranteed education loans continued to run off. Average loans represented 68% of average interest-earning assets in both 2019 and 2018.
Average interest-bearing deposits grew $18.2 billion, or 10%, reflecting overall deposit and customer growth. The increase included a shift from noninterest-bearing deposits, which declined $4.1 billion, or 5%, to interest-bearing deposits. Within average interest-

The PNC Financial Services Group, Inc. – 2019 Form 10-K 39
bearing deposits, average savings deposits increased $11.0 billion, due in part to a shift to relationship-based savings products from money market deposits, which decreased $.8 billion, and to growth from the retail national expansion strategy. Additionally, average interest-bearing demand deposits grew $5.1 billion and average time deposits grew $2.9 billion. Average interest-bearing deposits represented 77% of average interest-bearing liabilities in 2019 compared to 76% in 2018.
Further details regarding average loans and deposits are included in the Business Segments Review section of this Item 7.
Average borrowed funds increased $2.2 billion, or 4%, primarily due to higher federal funds purchased of $2.1 billion and Federal Home Loan Bank (FHLB) borrowings of $1.3 billion, partially offset by a decline in bank notes and senior debt of $1.1 billion. See the Consolidated Balance Sheet Review portion of this Item 7 for additional detail on the level and composition of borrowed funds.
Noninterest Income
Table 2: Noninterest Income
Year ended December 31 ChangeDollars in millions 2019 2018 $ %
Noninterest incomeAsset management $ 1,850 $ 1,825 $ 25 1 %Consumer services 1,555 1,502 53 4 %Corporate services 1,914 1,849 65 4 %Residential mortgage 368 316 52 16 %Service charges on deposits 702 714 (12) (2)%Other 1,473 1,205 268 22 %Total noninterest income $ 7,862 $ 7,411 $ 451 6 %
Noninterest income as a percentage of total revenue was 44% for 2019 and 43% for 2018.
Asset management revenue increased driven by higher earnings from our equity investment in BlackRock. Increases in the average equity markets also contributed to revenue growth in 2019. These increases were partially offset by lower asset management fees related to the sales of businesses and the impact of lower yielding assets under management. PNC's discretionary client assets under management increased to $154 billion at December 31, 2019 compared with $148 billion at December 31, 2018 primarily attributable to higher equity markets partially offset by the impact of the sales of businesses.
Consumer services revenue increased primarily due to growth in debit and credit card fees, net of rewards, and higher brokerage fees, reflecting continued momentum in both transaction activity and customer growth.
Growth in corporate services revenue reflected broad-based increases, including higher treasury management product revenue, partially offset by a decline in loan syndication revenue.
Residential mortgage revenue increased due to a higher benefit from residential mortgage servicing rights valuation, net of economic hedge, and higher loan sales revenue driven by increased loan origination volume.
Service charges on deposits declined, reflecting our ongoing efforts to simplify products and reduce transaction fees for our customers.
Other noninterest income increased due to higher gains on asset sales, including gains on sales of the retirement recordkeeping business and components of the PNC Capital Advisors investment management business, including its PNC family of proprietary mutual funds, and higher net securities gains. In addition, revenue from private equity investments and capital markets-related revenue increased. These increases were partially offset by negative derivative fair value adjustments related to Visa Class B common shares.
Other noninterest income typically fluctuates from period to period depending on the nature and magnitude of transactions completed. Further details regarding our customer-related trading activities are included in the Market Risk Management – Customer-Related Trading Risk portion of the Risk Management section of this Item 7. Further details regarding private and other equity investments are included in the Market Risk Management – Equity and Other Investment Risk section, and further details regarding gains or losses related to our equity investment in BlackRock are included in the Business Segments Review section of this Item 7.
Provision for Credit Losses
The provision for credit losses was $773 million in 2019 compared to $408 million in 2018 driven by increases in both commercial and consumer. The commercial provision increase was driven by loan growth and reserves attributed to certain commercial credits.

40 The PNC Financial Services Group, Inc. – 2019 Form 10-K
The increase in the consumer provision was primarily a result of higher auto loan and credit card reserves due to loan growth and portfolio losses, and higher reserves for unsecured installment loans partially offset by a lower provision for home equity loans.
The Credit Risk Management portion of the Risk Management section of this Item 7 includes additional information regarding factors impacting the provision for credit losses.
Noninterest Expense
Table 3: Noninterest Expense
Year ended December 31 ChangeDollars in millions 2019 2018 $ %
Noninterest expensePersonnel $ 5,647 $ 5,471 $ 176 3 %Occupancy 834 818 16 2 %Equipment 1,210 1,103 107 10 %Marketing 301 285 16 6 %Other 2,582 2,619 (37) (1)%Total noninterest expense $ 10,574 $ 10,296 $ 278 3 %
Noninterest expense increased reflecting continued investments in our strategies, technology and employees. The increase in personnel expense was driven by business growth and higher benefits expense including a year-end employee award of an additional contribution to health savings accounts. Equipment expense increased reflecting primarily technology-related write-offs, including for decommissioned compliance and regulatory software that resulted from the 2019 Tailoring Rules. Other expense decreased primarily as a result of lower Federal Deposit Insurance Corporation (FDIC) deposit insurance cost from the elimination of the surcharge assessment.
During 2019, we completed actions and achieved our 2019 continuous improvement program savings goal of $300 million. In 2020, our goal will once again be $300 million in cost savings, which we expect to contribute to the funding of our business and technology investments.
Effective Income Tax Rate
The effective income tax rate was 16.4% for 2019 compared with 16.8% for 2018.
The effective tax rate is generally lower than the statutory rate primarily due to tax credits we receive from our investments in low income housing and new markets investments, as well as earnings on other tax exempt investments.
Additional information regarding our effective tax rate is included in the Reconciliation of Statutory and Effective Tax Rates table in Note 17 Income Taxes in Item 8 of this Report.

The PNC Financial Services Group, Inc. – 2019 Form 10-K 41
CONSOLIDATED BALANCE SHEET REVIEW
Table 4: Summarized Balance Sheet Data
December 31 December 31 ChangeDollars in millions 2019 2018 $ %Assets
Interest-earning deposits with banks $ 23,413 $ 10,893 $ 12,520 115 %Loans held for sale 1,083 994 89 9 %Investment securities 86,824 82,701 4,123 5 %Loans 239,843 226,245 13,598 6 %Allowance for loan and lease losses (2,742) (2,629) (113) (4)%Mortgage servicing rights 1,644 1,983 (339) (17)%Goodwill 9,233 9,218 15 —Other, net 50,997 52,910 (1,913) (4)%
Total assets $ 410,295 $ 382,315 $ 27,980 7 %Liabilities
Deposits $ 288,540 $ 267,839 $ 20,701 8 %Borrowed funds 60,263 57,419 2,844 5 %Other 12,149 9,287 2,862 31 %
Total liabilities 360,952 334,545 26,407 8 %Equity
Total shareholders’ equity 49,314 47,728 1,586 3 %Noncontrolling interests 29 42 (13) (31)%
Total equity 49,343 47,770 1,573 3 %Total liabilities and equity $ 410,295 $ 382,315 $ 27,980 7 %
The summarized balance sheet data in Table 4 is based upon our Consolidated Balance Sheet in Item 8 of this Report. For additional detail of the comparison of 2018 over 2017, see Item 7 of our 2018 Form 10-K.
Our balance sheet at December 31, 2019 increased compared to December 31, 2018 and we maintained strong capital and liquidity positions.
• Total assets increased as a result of loan growth, higher interest-earning deposits with banks and higher investment securities;• Total liabilities increased due to deposit growth and higher borrowed funds;• Total equity increased due to higher retained earnings driven by net income substantially offset by share repurchases and
common and preferred dividends and as a result of higher accumulated other comprehensive income (AOCI).
The following discussion provides additional information about the major components of our balance sheet. Information regarding our capital and regulatory compliance is included in the Liquidity and Capital Management portion of the Risk Management section of this Item 7 and in Note 18 Regulatory Matters in our Notes To Consolidated Financial Statements included in this Report.
Loans
Table 5: Loans
December 31 December 31 ChangeDollars in millions 2019 2018 $ %Commercial lending
Commercial $ 125,337 $ 116,834 $ 8,503 7 %Commercial real estate 28,110 28,140 (30) —Equipment lease financing 7,155 7,308 (153) (2)%
Total commercial lending 160,602 152,282 8,320 5 %Consumer lending
Home equity 25,085 26,123 (1,038) (4)%Residential real estate 21,821 18,657 3,164 17 %Automobile 16,754 14,419 2,335 16 %Credit card 7,308 6,357 951 15 %Education 3,336 3,822 (486) (13)%Other consumer 4,937 4,585 352 8 %
Total consumer lending 79,241 73,963 5,278 7 %Total loans $ 239,843 $ 226,245 $ 13,598 6 %
Loans at December 31, 2019 reflected growth in both commercial and consumer lending compared to December 31, 2018.
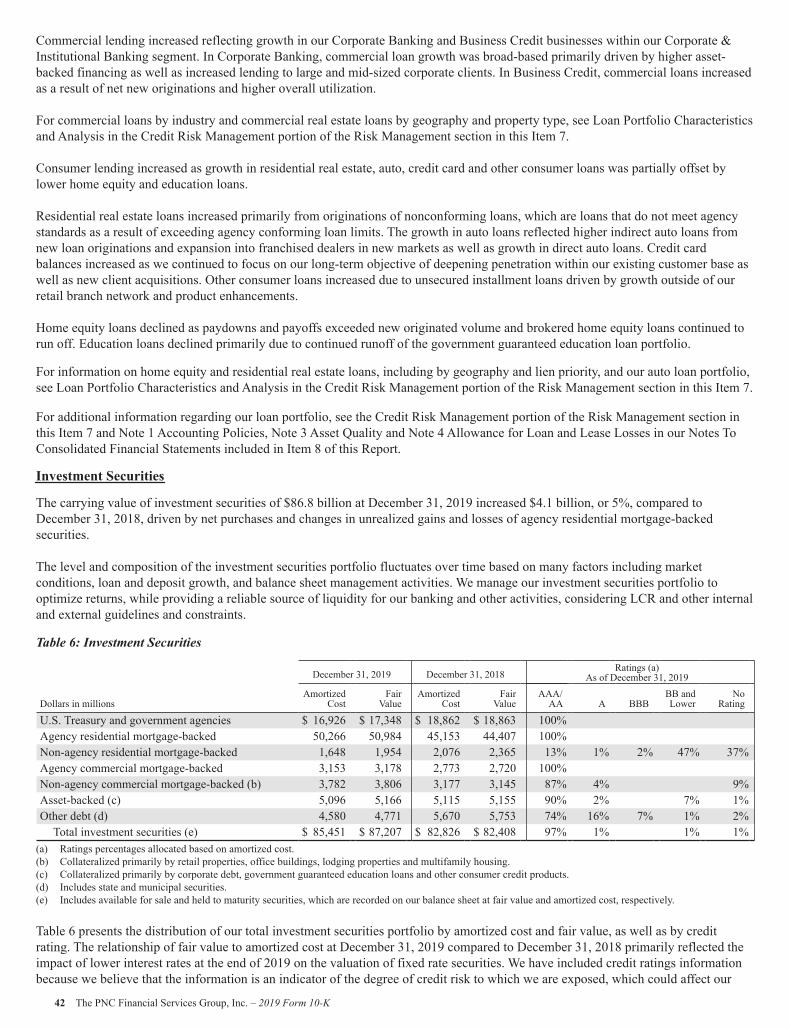
42 The PNC Financial Services Group, Inc. – 2019 Form 10-K
Commercial lending increased reflecting growth in our Corporate Banking and Business Credit businesses within our Corporate & Institutional Banking segment. In Corporate Banking, commercial loan growth was broad-based primarily driven by higher asset-backed financing as well as increased lending to large and mid-sized corporate clients. In Business Credit, commercial loans increased as a result of net new originations and higher overall utilization.
For commercial loans by industry and commercial real estate loans by geography and property type, see Loan Portfolio Characteristics and Analysis in the Credit Risk Management portion of the Risk Management section in this Item 7.
Consumer lending increased as growth in residential real estate, auto, credit card and other consumer loans was partially offset by lower home equity and education loans.
Residential real estate loans increased primarily from originations of nonconforming loans, which are loans that do not meet agency standards as a result of exceeding agency conforming loan limits. The growth in auto loans reflected higher indirect auto loans from new loan originations and expansion into franchised dealers in new markets as well as growth in direct auto loans. Credit card balances increased as we continued to focus on our long-term objective of deepening penetration within our existing customer base as well as new client acquisitions. Other consumer loans increased due to unsecured installment loans driven by growth outside of our retail branch network and product enhancements.
Home equity loans declined as paydowns and payoffs exceeded new originated volume and brokered home equity loans continued to run off. Education loans declined primarily due to continued runoff of the government guaranteed education loan portfolio.
For information on home equity and residential real estate loans, including by geography and lien priority, and our auto loan portfolio, see Loan Portfolio Characteristics and Analysis in the Credit Risk Management portion of the Risk Management section in this Item 7.
For additional information regarding our loan portfolio, see the Credit Risk Management portion of the Risk Management section in this Item 7 and Note 1 Accounting Policies, Note 3 Asset Quality and Note 4 Allowance for Loan and Lease Losses in our Notes To Consolidated Financial Statements included in Item 8 of this Report.
Investment Securities
The carrying value of investment securities of $86.8 billion at December 31, 2019 increased $4.1 billion, or 5%, compared to December 31, 2018, driven by net purchases and changes in unrealized gains and losses of agency residential mortgage-backed securities.
The level and composition of the investment securities portfolio fluctuates over time based on many factors including market conditions, loan and deposit growth, and balance sheet management activities. We manage our investment securities portfolio to optimize returns, while providing a reliable source of liquidity for our banking and other activities, considering LCR and other internal and external guidelines and constraints.
Table 6: Investment Securities
December 31, 2019 December 31, 2018Ratings (a)
As of December 31, 2019
Dollars in millionsAmortized
CostFair
ValueAmortized
CostFair
ValueAAA/
AA A BBBBB andLower
NoRating
U.S. Treasury and government agencies $ 16,926 $ 17,348 $ 18,862 $ 18,863 100%Agency residential mortgage-backed 50,266 50,984 45,153 44,407 100%Non-agency residential mortgage-backed 1,648 1,954 2,076 2,365 13% 1% 2% 47% 37%Agency commercial mortgage-backed 3,153 3,178 2,773 2,720 100%Non-agency commercial mortgage-backed (b) 3,782 3,806 3,177 3,145 87% 4% 9%Asset-backed (c) 5,096 5,166 5,115 5,155 90% 2% 7% 1%Other debt (d) 4,580 4,771 5,670 5,753 74% 16% 7% 1% 2%
Total investment securities (e) $ 85,451 $ 87,207 $ 82,826 $ 82,408 97% 1% 1% 1%(a) Ratings percentages allocated based on amortized cost.(b) Collateralized primarily by retail properties, office buildings, lodging properties and multifamily housing.(c) Collateralized primarily by corporate debt, government guaranteed education loans and other consumer credit products.(d) Includes state and municipal securities.(e) Includes available for sale and held to maturity securities, which are recorded on our balance sheet at fair value and amortized cost, respectively.
Table 6 presents the distribution of our total investment securities portfolio by amortized cost and fair value, as well as by credit rating. The relationship of fair value to amortized cost at December 31, 2019 compared to December 31, 2018 primarily reflected the impact of lower interest rates at the end of 2019 on the valuation of fixed rate securities. We have included credit ratings information because we believe that the information is an indicator of the degree of credit risk to which we are exposed, which could affect our

The PNC Financial Services Group, Inc. – 2019 Form 10-K 43
risk-weighted assets and, therefore, our risk-based regulatory capital ratios under the regulatory capital rules. Changes in credit ratings classifications could indicate increased or decreased credit risk and could be accompanied by a reduction or increase in the fair value of our investment securities portfolio.
The duration of investment securities was 2.6 years at December 31, 2019. We estimate that at December 31, 2019 the effective duration of investment securities was 2.8 years for an immediate 50 basis points parallel increase in interest rates and 2.4 years for an immediate 50 basis points parallel decrease in interest rates. Comparable amounts at December 31, 2018 for the effective duration of investment securities were 3.5 years and 3.2 years, respectively.
Based on expected prepayment speeds, the weighted-average expected maturity of the investment securities portfolio was 4.1 years at December 31, 2019 compared to 5.3 years at December 31, 2018.
Table 7: Weighted-Average Expected Maturities of Mortgage and Asset-Backed Debt Securities
December 31, 2019 Years
Agency residential mortgage-backed 4.2Non-agency residential mortgage-backed 6.7Agency commercial mortgage-backed 4.6Non-agency commercial mortgage-backed 2.8Asset-backed 2.0
Additional information regarding our investment securities is included in Note 5 Investment Securities and Note 6 Fair Value in the Notes To Consolidated Financial Statements included in this Report.
Funding Sources
Table 8: Details of Funding Sources
December 31 December 31 ChangeDollars in millions 2019 2018 $ %Deposits
Noninterest-bearing $ 72,779 $ 73,960 $ (1,181) (2)%Interest-bearing
Money market 54,115 53,368 747 1 %Demand 71,692 65,211 6,481 10 %Savings 68,291 56,793 11,498 20 %Time deposits 21,663 18,507 3,156 17 %
Total interest-bearing deposits 215,761 193,879 21,882 11 %Total deposits 288,540 267,839 20,701 8 %Borrowed funds
Federal Home Loan Bank (FHLB) borrowings 16,341 21,501 (5,160) (24)%Bank notes and senior debt 29,010 25,018 3,992 16 %Subordinated debt 6,134 5,895 239 4 %Other 8,778 5,005 3,773 75 %
Total borrowed funds 60,263 57,419 2,844 5 %Total funding sources $ 348,803 $ 325,258 $ 23,545 7 %
Total deposits increased as growth in interest-bearing deposits was slightly offset by a decrease in noninterest-bearing deposits. The increase in interest-bearing deposits reflected overall growth in both commercial and consumer deposits, including from the retail national expansion strategy which contributed to the increase in savings. Interest-bearing demand deposits at December 31, 2019 included $4.1 billion of balances related to a new sweep deposit product offering for current asset management clients.
Borrowed funds increased in the comparison as a decline in FHLB borrowings was more than offset by increases in bank notes and senior debt and federal funds purchased. The level and composition of borrowed funds fluctuates over time based on many factors including market conditions, loan, investment securities and deposit growth and capital considerations. We manage our borrowed funds to provide a reliable source of liquidity for our banking and other activities, considering LCR and other internal and external guidelines and constraints.

44 The PNC Financial Services Group, Inc. – 2019 Form 10-K
See the Liquidity and Capital Management portion of the Risk Management section of this Item 7 for additional information regarding our 2019 liquidity and capital activities.
Shareholders’ Equity
Total shareholders’ equity was $49.3 billion at December 31, 2019, an increase of $1.6 billion compared to December 31, 2018. The increase resulted from net income of $5.4 billion and higher AOCI of $1.5 billion primarily related to net unrealized securities gains, partially offset by common share repurchases of $3.5 billion and common and preferred dividends of $2.1 billion.
Common shares outstanding were 433 million at December 31, 2019 and 457 million at December 31, 2018 as repurchases of 25.9 million shares during 2019 were partially offset by stock-based compensation activity.
BUSINESS SEGMENTS REVIEW
We have four reportable business segments:• Retail Banking• Corporate & Institutional Banking• Asset Management Group• BlackRock
Business segment results and a description of each business are included in Note 22 Segment Reporting included in the Notes To Consolidated Financial Statements in Item 8 of this Report. Certain amounts included in this Business Segments Review differ from those amounts shown in Note 22, primarily due to the presentation in this Item 7 of business net interest income on a taxable-equivalent basis. Note 22 presents results of businesses for 2019, 2018 and 2017.
Net interest income in business segment results reflects our internal funds transfer pricing methodology. Assets receive a funding charge and liabilities and capital receive a funding credit based on a transfer pricing methodology that incorporates product repricing characteristics, tenor and other factors.
Total business segment financial results differ from total consolidated net income. The impact of these differences is reflected in the “Other” category as shown in Table 99 in Note 22 Segment Reporting in Item 8 of this Report. “Other” includes residual activities that do not meet the criteria for disclosure as a separate reportable business, such as asset and liability management activities including net securities gains or losses, other-than-temporary impairment of investment securities, certain trading activities, certain runoff consumer loan portfolios, private equity investments, intercompany eliminations, certain corporate overhead, tax adjustments that are not allocated to business segments, gains or losses related to BlackRock transactions, exited businesses, and differences between business segment performance reporting and financial statement reporting (GAAP), including the presentation of net income attributable to noncontrolling interests as the segments’ results exclude their portion of net income attributable to noncontrolling interests.

The PNC Financial Services Group, Inc. – 2019 Form 10-K 45
Retail BankingRetail Banking's core strategy is to acquire and retain customers who maintain their primary checking and transaction relationships with us. We seek to deepen relationships by meeting the broad range of our customers’ financial needs with savings, liquidity, lending, investment and retirement solutions. A strategic priority for us is to differentiate the customer experience and drive transformation and automation. A key element of our strategy is to expand the use of lower-cost alternative distribution channels, with an emphasis on digital capabilities, while continuing to optimize the traditional branch network. In addition, we have a disciplined process to continually improve the engagement of both our employees and customers, which is a strong driver of customer growth, retention and relationship expansion. In 2018, we launched our national expansion strategy designed to grow customers with digitally-led banking and an ultra-thin branch network in markets outside of our existing retail branch network and began offering our digital high yield savings deposit product and opened our first solution center. Solution centers are an emerging branch operating model with a distinctive physical layout, where routine transactions are supported through a combination of technology and skilled banker assistance to create personalized customer experiences. The primary focus of the solution center is to bring a community element to our digital banking capabilities. The solution center provides a collaborative environment that connects our customers with our digital solutions and services, beyond deposits and withdrawals.
Table 9: Retail Banking Table
(Unaudited)Year ended December 31 ChangeDollars in millions, except as noted 2019 2018 $ %
Income StatementNet interest income $ 5,520 $ 5,119 $ 401 8 %Noninterest income 2,648 2,631 17 1 %
Total revenue 8,168 7,750 418 5 %Provision for credit losses 517 373 144 39 %Noninterest expense 6,061 5,978 83 1 %
Pretax earnings 1,590 1,399 191 14 %Income taxes 377 335 42 13 %
Earnings $ 1,213 $ 1,064 $ 149 14 %Average Balance SheetLoans held for sale $ 627 $ 636 $ (9) (1)%Loans
Consumer lendingHome equity $ 22,657 $ 23,991 $ (1,334) (6)%Residential real estate 16,196 13,985 2,211 16 %Automobile 15,510 13,827 1,683 12 %Education 3,611 4,135 (524) (13)%Credit cards 6,550 5,838 712 12 %Other 2,244 1,843 401 22 %
Total consumer lending 66,768 63,619 3,149 5 %Commercial and commercial real estate 10,410 10,383 27 —
Total loans $ 77,178 $ 74,002 $ 3,176 4 %Total assets $ 92,959 $ 89,739 $ 3,220 4 %Deposits
Noninterest-bearing demand $ 31,675 $ 30,670 $ 1,005 3 %Interest-bearing demand 42,077 42,042 35 —Money market 25,317 29,798 (4,481) (15)%Savings 56,722 47,019 9,703 21 %Certificates of deposit 12,613 12,007 606 5 %
Total deposits $ 168,404 $ 161,536 $ 6,868 4 %Performance RatiosReturn on average assets 1.30% 1.19%Noninterest income to total revenue 32% 34%Efficiency 74% 77%
(continued on following page)

46 The PNC Financial Services Group, Inc. – 2019 Form 10-K
(continued from previous page)
Year ended December 31 ChangeDollars in millions, except as noted 2019 2018 $ %
Supplemental Noninterest Income InformationConsumer services (a) $ 1,174 $ 1,128 $ 46 4 %Brokerage (b) $ 356 $ 350 $ 6 2 %Residential mortgage $ 368 $ 316 $ 52 16 %Service charges on deposits $ 687 $ 688 $ (1) —Residential Mortgage InformationResidential mortgage servicing statistics (in billions, except as noted) (c)
Serviced portfolio balance (d) $ 120 $ 125 $ (5) (4)%Serviced portfolio acquisitions $ 12 $ 12 $ — —MSR asset value (d) $ 1.0 $ 1.3 $ (.3) (23)%MSR capitalization value (in basis points) (d) 83 100 (17) (17)%Servicing income: (in millions)
Servicing fees, net (e) $ 178 $ 181 $ (3) (2)%Mortgage servicing rights valuation, net of economic hedge $ 47 $ 3 $ 44 *
Residential mortgage loan statisticsLoan origination volume (in billions) $ 11.5 $ 7.4 $ 4.1 55 %Loan sale margin percentage 2.41% 2.41%Percentage of originations represented by:
Purchase volume (f) 47% 67%Refinance volume 53% 33%
Other Information (d)Customer-related statistics (average)
Non-teller deposit transactions (g) 57% 55%Digital consumer customers (h) 69% 66%
Credit-related statisticsNonperforming assets (i) $ 1,046 $ 1,126 $ (80) (7)%Net charge-offs $ 534 $ 420 $ 114 27 %
Other statisticsATMs 9,091 9,162 (71) (1)%Branches (j) 2,296 2,372 (76) (3)%Brokerage account client assets (in billions) (k) $ 54 $ 47 $ 7 15 %
* - Not Meaningful(a) Excludes brokerage noninterest income, which is included in Consumer services on our Consolidated Income Statement. (b) Included in Consumer services on our Consolidated Income Statement. (c) Represents mortgage loan servicing balances for third parties and the related income. (d) Presented as of December 31, except for customer-related statistics, which are averages for the year ended, and net charge-offs, which are for the year ended. (e) Servicing fees net of impact of decrease in MSR value due to passage of time, including the impact from both regularly scheduled loan payments, prepayments, and loans
that were paid down or paid off during the period. (f) Mortgages with borrowers as part of residential real estate purchase transactions. (g) Percentage of total consumer and business banking deposit transactions processed at an ATM or through our mobile banking application. (h) Represents consumer checking relationships that process the majority of their transactions through non-teller channels. (i) Includes nonperforming loans of $1.0 billion and $1.1 billion at December 31, 2019 and 2018, respectively.(j) Excludes stand-alone mortgage offices and satellite offices (e.g., drive-ups, electronic branches and retirement centers) that provide limited products and/or services. (k) Includes cash and money market balances.
Retail Banking earned $1.2 billion in 2019 compared with $1.1 billion in 2018. The increase in earnings was attributable to higher net interest income and noninterest income partially offset by an increase in provision for credit losses and higher noninterest expense.
Net interest income increased primarily due to wider interest rate spreads on the value of deposits as well as growth in deposit and loan balances.
Noninterest income increased largely due to growth in residential mortgage revenue attributable to a higher benefit from residential mortgage servicing rights valuation, net of economic hedge, and increased loan sales revenue from higher origination volumes. Higher noninterest income also reflected growth in consumer services, including debit and credit card, brokerage fees, and merchant services. These increases were partially offset by negative derivative fair value adjustments related to Visa Class B common shares of $100 million in 2019 compared with positive adjustments of $35 million in 2018.

The PNC Financial Services Group, Inc. – 2019 Form 10-K 47
Provision for credit losses increased in 2019 compared to 2018 primarily as a result of higher auto loan and credit card reserves due to loan growth and portfolio losses, and higher reserves for unsecured installment loans partially offset by a lower provision for home equity loans.
Higher noninterest expense primarily resulted from an increase in ATM expense driven by enhanced checking product benefits, higher equipment expense, and increased customer transaction related costs.
The deposit strategy of Retail Banking is to remain disciplined on pricing and focused on growing and retaining relationship-based balances, executing on market-specific deposit growth strategies and providing a source of low-cost funding and liquidity to PNC. In 2019, average total deposits increased compared to 2018 primarily driven by savings deposits which increased due, in part, to a shift from money market deposits to relationship-based savings products as well as growth in consumer deposits, including from our national expansion. The increase in deposits was also attributable to higher noninterest-bearing demand deposits and certificates of deposit reflecting shifts in consumer preferences to time deposits.
Retail Banking average total loans grew in 2019 compared with 2018: • Average residential mortgages increased primarily as a result of growth in nonconforming residential mortgage loans.• Average auto loans increased primarily due to strong new indirect auto loan volumes, including in our Southeast and
expansion markets, as well as growth in direct auto loans.• Average credit card balances increased as we continued to focus on our long-term objective of deepening penetration within
our existing customer base as well as new client acquisition.• Average home equity loans decreased as paydowns and payoffs on loans exceeded new originated volume.• Average education loans decreased driven by a decline in the runoff portfolio of government guaranteed education loans.
Our national expansion initiative launched in 2018 with deposit products led by a digital high yield savings account. Following the first solution center opening in Kansas City in 2018, four additional solution centers were opened in 2019 with a second in Kansas City and three in the Dallas/Fort Worth market.
Retail Banking continues to enhance the customer experience with refinements to product and service offerings that drive value for consumers and small businesses. We are focused on meeting the financial needs of our customers by providing a broad range of liquidity, banking and investment products. Retail Banking continued to execute on its strategy of transforming the customer experience through transaction channel migration, branch network and home lending process transformations and multi-channel engagement and service strategies.
• Approximately 69% of consumer customers used non-teller channels for the majority of their transactions in 2019 compared with 66% in 2018.
• Deposit transactions via ATM and mobile channels increased to 57% of total deposit transactions in 2019 from 55% in 2018.
Retail Banking continues to make progress on its multi-year initiative to redesign the home lending process, including integrating mortgage and home equity lending into a common platform. Technology enhancements supported increased residential mortgage origination volume. In addition, we enhanced the home equity origination process to make it easier and to reach additional customers by offering the product in new states. The improvements and expansion will continue throughout 2020.
Corporate & Institutional Banking
Corporate & Institutional Banking’s strategy is to be the leading relationship-based provider of traditional banking products and services to its customers through the economic cycles. We aim to grow our market share and drive higher returns by delivering value-added solutions that help our clients better run their organizations, all while maintaining prudent risk and expense management. We continue to focus on building client relationships where the risk-return profile is attractive.

48 The PNC Financial Services Group, Inc. – 2019 Form 10-K
Table 10: Corporate & Institutional Banking Table
(Unaudited)Year ended December 31 ChangeDollars in millions, except as noted 2019 2018 $ %
Income Statement Net interest income $ 3,714 $ 3,637 $ 77 2 %Noninterest income 2,537 2,406 131 5 %
Total revenue 6,251 6,043 208 3 %Provision for credit losses 284 85 199 234 %Noninterest expense 2,813 2,706 107 4 %
Pretax earnings 3,154 3,252 (98) (3)%Income taxes 706 744 (38) (5)%
Earnings $ 2,448 $ 2,508 $ (60) (2)%Average Balance SheetLoans held for sale $ 505 $ 739 $ (234) (32)%Loans
Commercial lending Commercial $ 112,809 $ 103,285 $ 9,524 9 % Commercial real estate 26,340 26,569 (229) (1)% Equipment lease financing 7,255 7,437 (182) (2)%Total commercial lending 146,404 137,291 9,113 7 %Consumer 15 42 (27) (64)%
Total loans $ 146,419 $ 137,333 $ 9,086 7 %Total assets $ 164,243 $ 154,119 $ 10,124 7 %Deposits
Noninterest-bearing demand $ 39,141 $ 44,099 $ (4,958) (11)%Interest-bearing demand 19,487 15,114 4,373 29 %Money market 28,091 24,060 4,031 17 %Other 6,676 5,136 1,540 30 %
Total deposits $ 93,395 $ 88,409 $ 4,986 6 %Performance RatiosReturn on average assets 1.49% 1.63%Noninterest income to total revenue 41% 40%Efficiency 45% 45% Other InformationConsolidated revenue from: (a)
Treasury Management (b) $ 1,866 $ 1,779 $ 87 5 %Capital Markets (b) $ 1,140 $ 1,088 $ 52 5 %Commercial mortgage banking activities:
Commercial mortgage loans held for sale (c) $ 97 $ 107 $ (10) (9)%Commercial mortgage loan servicing income (d) 261 247 14 6 %Commercial mortgage servicing rights valuation, net of economic hedge (e) 19 27 (8) (30)%Total $ 377 $ 381 $ (4) (1)%
Commercial mortgage servicing rights asset value (f) $ 649 $ 726 $ (77) (11)%Average Loans by C&IB Business (g)
Corporate Banking $ 74,016 $ 66,503 $ 7,513 11 %Real Estate 37,149 37,571 (422) (1)%Business Credit 22,586 20,800 1,786 9 %Commercial Banking 7,984 8,109 (125) (2)%Other 4,684 4,350 334 8 %
Total average loans $ 146,419 $ 137,333 $ 9,086 7 %Credit-related statisticsNonperforming assets (f) (h) $ 444 $ 377 $ 67 18 %Net charge-offs $ 105 $ 10 $ 95 950 %
(a) See the additional revenue discussion regarding treasury management, capital markets-related products and services, and commercial mortgage banking activities in the Product Revenue section of this Corporate & Institutional Banking section.
(b) Amounts reported in net interest income and noninterest income. (c) Represents other noninterest income for valuations on commercial mortgage loans held for sale and related commitments, derivative valuations, originations fees, gains on
sale of loans held for sale and net interest income on loans held for sale. (d) Represents net interest income and noninterest income (primarily in corporate service fees) from loan servicing net of reduction in commercial mortgage servicing rights due
to amortization expense and payoffs. Commercial mortgage servicing rights valuation, net of economic hedge is shown separately.

The PNC Financial Services Group, Inc. – 2019 Form 10-K 49
(e) Amounts are reported in corporate service fees. (f) As of December 31.(g) As a result of our first quarter 2019 C&IB business realignment, average loans previously reported as Equipment Finance were reclassified to other C&IB businesses for all
periods presented.(h) Primarily nonperforming loans of $.4 billion and $.3 billion at December 31, 2019 and 2018, respectively. Corporate & Institutional Banking earned $2.4 billion in 2019 compared to $2.5 billion in 2018. Higher revenue was more than offset by an increase in the provision for credit losses and higher noninterest expense.
Net interest income increased in the comparison primarily due to higher average loan and deposit balances, partially offset by narrower interest rate spreads on the value of loans.
Growth in noninterest income in the comparison reflected broad-based increases including higher treasury management product revenue and higher capital markets-related revenue.
The increase in provision for credit losses was primarily driven by loan growth and reserves attributed to certain commercial credits. Nonperforming assets and net charge-offs in 2019 increased from recent historic lows.
Noninterest expense increased in the comparison largely due to investments in strategic initiatives and variable costs associated with increased business activity.
Average loans increased compared with 2018 due to strong growth in Corporate Banking and Business Credit:• Corporate Banking provides lending, treasury management and capital markets-related products and services to mid-sized
and large corporations, and government and not-for-profit entities. Average loans for this business grew reflecting strong production in asset-backed financing as well as increased lending to large and mid-sized corporate clients.
• PNC Business Credit provides asset-based lending. The loan portfolio is relatively high yielding, with acceptable risk as the loans are mainly secured by short-term assets. Average loans for this business increased primarily due to net new originations and higher utilization.
• PNC Real Estate provides banking, financing and servicing solutions for commercial real estate clients across the country. Average loans for this business decreased slightly primarily driven by project loan payoffs, partially offset by higher commercial mortgage balances.
• Commercial Banking provides lending, treasury management and capital markets-related products and services to smaller corporations and businesses. Average loans for this business were relatively unchanged.
The deposit strategy of Corporate & Institutional Banking is to remain disciplined on pricing and focused on growing and retaining relationship-based balances over time, executing on customer and segment-specific deposit growth strategies and continuing to provide funding and liquidity to PNC. Average total deposits increased in the comparison driven by growth in interest-bearing deposits including a shift from noninterest-bearing deposits. We continue to monitor and balance the relationship between rates paid and the overall profitability of our deposit balances.
Corporate & Institutional Banking expanded its Corporate Banking business, focused on the middle market and larger sectors, into the Boston and Phoenix markets in 2019. This followed offices opened in Denver, Houston and Nashville in 2018, and offices opened in Dallas, Kansas City and Minneapolis in 2017. These locations complement Corporate & Institutional Banking national businesses with a significant presence in these cities, and build on past successes in the markets where PNC’s retail banking presence was limited, such as in the Southeast. Our full suite of commercial products and services is offered in these locations. We also plan to expand into the Portland and Seattle markets in 2020.
Product RevenueIn addition to credit and deposit products for commercial customers, Corporate & Institutional Banking offers other services, including treasury management, capital markets-related products and services, and commercial mortgage banking activities, for customers of all business segments. On a consolidated basis, the revenue from these other services is included in net interest income, corporate service fees and other noninterest income. From a business segment perspective, the majority of the revenue and expense related to these services is reflected in the Corporate & Institutional Banking segment results and the remainder is reflected in the results of other businesses. The Other Information section in Table 10 reflects the consolidated revenue to PNC for these services. A discussion of the consolidated revenue from these services follows.
The Treasury Management business provides payables, receivables, deposit and account services, liquidity and investments, and online and mobile banking products and services to our clients. Treasury management revenue is reported in noninterest income and net interest income. Noninterest income includes treasury management product revenue less earnings credits provided to customers on compensating deposit balances used to pay for products and services. Net interest income primarily includes revenue from all treasury

50 The PNC Financial Services Group, Inc. – 2019 Form 10-K
management customer deposit balances. Compared with 2018, treasury management revenue increased primarily due to higher product revenue and higher deposit balances.
Capital markets-related products and services include foreign exchange, derivatives, securities underwriting, loan syndications, mergers and acquisitions advisory and equity capital markets advisory related services. The increase in capital markets-related revenue in the comparison was broad based across most products and services and included higher asset-backed finance structuring fees, underwriting fees, and customer-related derivatives fees, partially offset by lower loan syndication revenue.
Commercial mortgage banking activities include revenue derived from commercial mortgage servicing (both net interest income and noninterest income) and revenue derived from commercial mortgage loans held for sale and related hedges. Total revenue from commercial mortgage banking activities decreased in the comparison due to lower revenue from commercial mortgage loans held for sale and related hedges and a lower benefit from commercial mortgage servicing rights valuation, net of economic hedge, mostly offset by higher commercial mortgage loan servicing income.

The PNC Financial Services Group, Inc. – 2019 Form 10-K 51
Asset Management Group
Asset Management Group is focused on being a premier bank-held individual and institutional asset manager in each of the markets it serves. The business seeks to deliver high quality banking, trust and investment management services to our high net worth, ultra high net worth and institutional client sectors through a broad array of products and services. Asset Management Group’s priorities are to serve our clients' financial objectives, grow and deepen customer relationships and deliver solid financial performance with prudent risk and expense management.
Table 11: Asset Management Group Table
(Unaudited)Year ended December 31 ChangeDollars in millions, except as noted 2019 2018 $ %Income StatementNet interest income $ 288 $ 287 $ 1 —Noninterest income 991 892 99 11 %
Total revenue 1,279 1,179 100 8 %Provision for credit losses (1) 2 (3) (150)%Noninterest expense 939 913 26 3 %
Pretax earnings 341 264 77 29 %Income taxes 79 62 17 27 %
Earnings $ 262 $ 202 $ 60 30 %Average Balance SheetLoans
Consumer lendingResidential real estate $ 1,923 $ 1,588 $ 335 21 %Other 4,232 4,656 (424) (9)%
Total consumer lending 6,155 6,244 (89) (1)%Commercial and commercial real estate 759 727 32 4 %
Total loans $ 6,914 $ 6,971 $ (57) (1)%Total assets $ 7,360 $ 7,423 $ (63) (1)%Deposits
Noninterest-bearing demand $ 1,360 $ 1,458 $ (98) (7)%Interest-bearing demand 4,060 3,323 737 22 %Money market 1,832 2,253 (421) (19)%Savings 6,216 4,890 1,326 27 %Other 822 466 356 76 %
Total deposits $ 14,290 $ 12,390 $ 1,900 15 %Performance RatiosReturn on average assets 3.56% 2.72%Noninterest income to total revenue 77% 76%Efficiency 73% 77% Supplemental Noninterest Income InformationAsset management fees $ 862 $ 883 $ (21) (2)%Other InformationNonperforming assets (a) (b) $ 39 $ 46 $ (7) (15)%Net charge-offs $ 5 $ 9 $ (4) (44)%Client Assets Under Administration (in billions) (a) (c)Discretionary client assets under management $ 154 $ 148 $ 6 4 %Nondiscretionary client assets under administration 143 124 19 15 %
Total $ 297 $ 272 $ 25 9 %Discretionary client assets under management
Personal $ 99 $ 87 $ 12 14 %Institutional 55 61 (6) (10)%
Total $ 154 $ 148 $ 6 4 %(a) As of December 31.(b) Includes nonperforming loans of $38 million at December 31, 2019 and $45 million at December 31, 2018.(c) Excludes brokerage account client assets.

52 The PNC Financial Services Group, Inc. – 2019 Form 10-K
Asset Management Group earned $262 million in 2019 compared with $202 million in 2018. Earnings increased primarily due to higher revenue partially offset by higher noninterest expense.
Growth in noninterest income was driven by the gains on sale of the retirement recordkeeping business and the sale of components of the PNC Capital Advisors investment management business, including its PNC family of proprietary mutual funds. Increases in the average equity markets also contributed to noninterest income growth in 2019. These increases were partially offset by lower asset management fees as a result of the business sales and the impact of lower yielding assets under management.
The increase in noninterest expense was primarily attributable to higher personnel expenses and costs associated with the sale transactions, including asset write-offs.
Asset Management Group’s discretionary client assets under management increased primarily attributable to higher equity markets as of December 31, 2019.
The Asset Management Group strives to be the leading relationship-based provider of investment, planning, banking and fiduciary services to wealthy individuals and institutions by proactively delivering value-added ideas and solutions and exceptional service.
Wealth Management and Hawthorn have nearly 100 offices operating in seven out of the ten most affluent states in the U.S. with a majority co-located with retail banking branches. The businesses provide customized investment management, wealth planning, trust and estate administration and private banking solutions to affluent individuals and ultra-affluent families.
Institutional Asset Management provides outsourced chief investment officer, custody, private real estate, cash and fixed income client solutions, and fiduciary retirement advisory services to institutional clients including corporations, healthcare systems, insurance companies, unions, municipalities and non-profits.
BlackRock(Unaudited)
Information related to our equity investment in BlackRock follows:
Table 12: BlackRock Table
Year ended December 31Dollars in millions 2019 2018Business segment earnings (a) $ 838 $ 781PNC’s economic interest in BlackRock (b) 22% 22%
(a) Represents our share of BlackRock’s reported GAAP earnings net of income taxes on those earnings incurred by us.(b) At December 31.
In billions December 31, 2019 December 31, 2018
Carrying value of our investment in BlackRock (c) $ 8.7 $ 8.2Market value of our investment in BlackRock (d) $ 17.5 $ 13.7
(c) We account for our investment in BlackRock under the equity method of accounting, exclusive of a related deferred tax liability of $1.8 billion at December 31, 2019 and $1.7 billion at December 31, 2018. Our voting interest in BlackRock common stock was approximately 22% at December 31, 2019.
(d) Does not include liquidity discount.

The PNC Financial Services Group, Inc. – 2019 Form 10-K 53
RISK MANAGEMENT
Enterprise Risk Management
We encounter risk as part of the normal course of operating our business. Accordingly, we design risk management processes to help manage this risk. We manage risk in light of our risk appetite to optimize long-term shareholder value while supporting our employees, customers and communities.
Our Enterprise Risk Management (ERM) Framework is structurally aligned with enhanced prudential standards that establish minimum requirements for the design and implementation of a risk management framework. This Risk Management section describes our ERM Framework which consists of risk culture, enterprise strategy (including risk appetite, strategic planning, capital planning and stress testing), risk governance and oversight, risk identification, risk assessments, risk controls and monitoring, and risk aggregation and reporting. The overall Risk Management section of this Item 7 also provides an analysis of our key areas of risk, which include but are not limited to credit, liquidity and capital, market and operational. Our use of financial derivatives as part of our overall asset and liability risk management process is also addressed within this Risk Management section.
We operate within a rapidly evolving regulatory environment. Accordingly, we are actively focused on the timely adoption of applicable regulatory pronouncements within our ERM Framework.
We view risk management as a cohesive combination of the following risk elements which form our ERM Framework:

54 The PNC Financial Services Group, Inc. – 2019 Form 10-K
Risk CultureA strong risk culture helps us make well-informed decisions, ensures individuals conform to the established culture, reduces an individual’s ability to do something for personal gain, and rewards employees working toward a common goal rather than individual interests. Our risk culture reinforces the appropriate protocols for responsible and ethical behavior. These protocols are especially critical in terms of our risk awareness, risk-taking behavior and risk management practices.
Managing risk is every employee’s responsibility. All of our employees individually and collectively are responsible for ensuring the organization is performing with the utmost integrity, is applying sound risk management practices and is striving to achieve our stated objectives rather than pursuing individual interests. All employees are also responsible for understanding our Enterprise Risk Appetite Statement, the ERM Framework and how risk management applies to their respective roles and responsibilities. Employees are encouraged to collaborate across groups to identify and mitigate risks and elevate issues as required. We reinforce risk management responsibilities through a performance management system where employee performance goals include risk management objectives and incentives for employees to reinforce balanced measures of risk-adjusted performance.
Proactive communication, between groups and up to the Board of Directors, facilitates timely identification and resolution of risk issues. Our multi-level risk committee structure provides formal channels to identify and report risk.
Enterprise StrategyWe ensure that our overall enterprise strategy is within acceptable risk parameters through our risk appetite, strategic planning, capital planning and stress testing processes. These components are reviewed and approved at least annually by the Board of Directors.
Risk Appetite: Our risk appetite represents the organization’s desired enterprise risk position, set within our capital based risk and liquidity capacity to achieve our strategic objectives and business plans. The Enterprise Risk Appetite Statement qualitatively describes the aggregate level of risk we are willing to accept in order to execute our business strategies. Qualitative guiding principles further define each of the risks within our taxonomy to support the risk appetite statement. Risk appetite metrics and limits, including forward-looking metrics, quantitatively measure whether we are operating within our stated Risk Appetite. Our risk appetite metrics reflect material risks, align with our established Risk Appetite Framework, balance risk and reward, leverage analytics, and adjust in a timely manner to changes in the external and internal risk environments.
Strategic Planning: Our enterprise and line of business strategic plans outline major objectives, strategies and goals which are expected to be achieved over the next five years while seeking to ensure we remain compliant with all capital, risk appetite and liquidity targets and guidelines. Our CEO and CFO lead the development of the corporate strategic plan, the strategic objectives and the comprehensive identification of material risks that could hinder successful implementation and execution of strategies. Strategic planning is linked to our risk management and capital planning processes.
Capital Planning and Stress Testing: Capital planning helps to ensure we are maintaining safe and sound operations and viability. The capital planning process and the resulting capital plan evolve as our overall risks, activities and risk management practices change. Capital planning aligns with our strategic planning process.
Stress testing is an essential element of the capital planning process. Effective stress testing enables us to consider the estimated effect on capital of various hypothetical scenarios.
Risk Governance and FrameworkWe employ a comprehensive risk management governance framework to help ensure that risks are identified, balanced decisions are made that consider risk and return, and risks are adequately monitored and managed. Risk committees established within this risk governance and oversight framework provide oversight for risk management activities at the Board of Directors, executive, corporate and business levels. Committee composition is designed to provide effective oversight balanced across the three lines of defense in accordance with the OCC’s heightened risk management and governance standards and guidelines. See discussion of the enhanced prudential standards in the Supervision and Regulation section in Item 1 of this Report.
To ensure the appropriate risks are being taken and effectively managed and controlled, risk is managed across three lines of defense. The Board of Directors’ and each line of defense’s responsibilities are detailed below:
Board of Directors – The Board of Directors oversees our risk-taking activities and is responsible for exercising sound, independent judgment when assessing risk.
First line of defense – The front line units are accountable for identifying, owning and managing risks to within acceptable levels while adhering to the risk management framework established by the Independent Risk Management department. Our businesses strive to enhance risk management and internal control processes within their areas. Integrated and comprehensive processes are designed to adequately identify, measure, manage, monitor and report risks which may significantly impact each business.

The PNC Financial Services Group, Inc. – 2019 Form 10-K 55
Second line of defense – The second line of defense is independent from the first line of defense and is responsible for establishing the standards for identifying, measuring, monitoring, controlling and reporting aggregate risks. As the second line of defense, the independent risk areas monitor the risks generated by the first line of defense, review and challenge the implementation of effective risk management practices, and report any issues or exceptions. The risk areas help to ensure processes and controls owned by the businesses are designed and operating as intended, and they may intervene directly in modifying and developing first line of defense risk processes and controls.
Third line of defense – As the third line of defense, Internal Audit is independent from the first and second lines of defense. Internal Audit provides the Board of Directors and executive management comprehensive assurance on the effectiveness of risk management practices across the organization.
Within the three lines of defense, the independent risk organization has sufficient authority to influence material decisions. Our business oversight and decision-making is supported through a governance structure at the Board of Directors and management level. Specific responsibilities include:
Board of Directors – Our Board of Directors oversees our business and affairs as managed by our officers and employees. The Board of Directors may receive assistance in carrying out its duties and may delegate authority through the following standing committees:• Audit Committee: monitors the integrity of our consolidated financial statements; monitors internal control over financial
reporting; monitors compliance with our code of ethics; evaluates and monitors the qualifications and independence of our independent auditors; and evaluates and monitors the performance of our Internal Audit function and our independent auditors.
• Nominating and Governance Committee: oversees the implementation of sound corporate governance principles and practices while promoting our best interests and those of our shareholders
• Personnel and Compensation Committee: oversees the compensation of our executive officers and other specified responsibilities related to personnel and compensation matters affecting us. The committee is also responsible for evaluating the relationship between risk-taking activities and incentive compensation plans.
• Risk Committee: oversees enterprise-wide risk structure and the processes established to identify, measure, monitor and manage the organization’s risks and evaluates and approves our risk governance framework. The Risk Committee has formed a Technology Subcommittee and a Compliance Subcommittee to facilitate Board-level oversight of risk management in these areas.
Executive Committee – The Executive Committee is responsible for guiding the creation and execution of our business strategy across the company. With this responsibility, the Executive Committee executes various strategic approval and review activities, with a focus on capital deployment, business performance and risk management.
Corporate Committees – The Corporate Committees operate at the senior management level and are designed to facilitate the review, evaluation, oversight and approval of key risk activities.
Working Committees – The Working Committees are generally subcommittees of the Corporate Committees. Working Committees are intended to assist in the implementation of key enterprise-level activities within a business or function and support the oversight of the businesses key risk activities.
Transactional Committees – Transactional Committees are generally created for the specific purpose of approving individual transactions or movements on the organization’s balance sheet.
Policies and Procedures – We have established risk management Policies and Procedures to support our ERM Framework, articulate our risk culture, define the parameters and processes within which employees are to manage risk and conduct our business activities and to provide direction, guidance and clarity on roles and responsibilities to management and the Board of Directors. These Policies and Procedures are organized in a multi-tiered framework and require periodic review and approval by relevant Committees or management.
Risk IdentificationRisk identification takes place across a variety of risk types throughout the organization. These risk types consist of, but are not limited to, credit, liquidity and capital, market, operational and compliance. Risks are identified based on a balanced use of analytical tools and management judgment for both on- and off-balance sheet exposures. Our governance structure supports risk identification by facilitating assessment of key risk issues, emerging risks and idiosyncratic risks and implementation of mitigation strategies as appropriate. These risks are prioritized based on quantitative and qualitative analysis and assessed against the risk appetite. Multiple tools and approaches are used to help identify and prioritize risks, including Risk Appetite Metrics, Key Risk Indicators, Key Performance Indicators, Risk Control and Self-Assessments, scenario analysis, stress testing and special investigations.

56 The PNC Financial Services Group, Inc. – 2019 Form 10-K
Risks are aggregated and assessed within and across risk functions or businesses. The aggregated risk information is reviewed and reported at an enterprise level for adherence to the Risk Appetite Framework and approved by the Board of Directors or by appropriate committees. This enterprise aggregation and reporting approach promotes the identification and appropriate escalation of material risks across the organization and supports an understanding of the cumulative impact of risk in relation to our risk appetite.
Risk AssessmentOnce risks are identified, they are evaluated based on quantitative and qualitative analysis to determine whether they are material. Risk assessments support the overall management of an effective ERM Framework and allow us to control and monitor our actual risk level and risk management effectiveness through the use of risk measures. Comprehensive, accurate and timely assessments of risk are essential to an effective ERM Framework. Effective risk measurement practices will uncover recurring risks that have been experienced in the past; make the known risks easy to see, understand, compare and report; and reveal unanticipated risks that may not be easy to understand or predict.
Risk Controls and MonitoringOur ERM Framework consists of policies, processes, personnel and control systems. Risk controls and limits provide the linkage from our Risk Appetite Statement and associated guiding principles to the risk-taking activities of our businesses. In addition to risk appetite limits, a system of more detailed internal controls exists which oversees and monitors our various processes and functions. These control systems measure performance, help employees make correct decisions, help ensure information is accurate and reliable, and document compliance with laws and regulations.
We design our monitoring and evaluation of risks and controls to provide assurance that policies, procedures and controls are effective and also to result in the identification of control improvement recommendations. Risk monitoring is a daily, ongoing process used by both the first and second line of defense to ensure compliance with our ERM Framework. Risk monitoring is accomplished in many ways, including performing risk assessments at the prime process and risk assessment unit level, monitoring an area’s key controls, the timely reporting of issues, and establishing a quality control and/or quality assurance function, as applicable.
Risk Aggregation and ReportingRisk reporting is a comprehensive way to: (i) aggregate risks; (ii) identify concentrations; (iii) help ensure we remain within our established risk appetite; (iv) serve as a basis for monitoring our risk profile in relation to our risk appetite and (v) communicate risks to the Board of Directors and executive management.
Risk reports are produced at the line of business, functional risk and enterprise levels. The enterprise level risk report aggregates risks identified in the functional and business reports to define the enterprise risk profile. The enterprise risk profile is a point-in-time assessment of enterprise risk and represents our overall risk position in relation to the desired enterprise risk appetite. The determination of the enterprise risk profile is based on analysis of quantitative reporting of risk limits and other measures along with qualitative assessments. Quarterly aggregation of our risk profile enables a clear view of our risk level relative to our quantitative risk appetite. The enterprise level report is provided through the governance structure to the Board of Directors. Each individual risk report includes an assessment of inherent risk, quality of risk management, residual risk, risk appetite and risk outlook. The enterprise level risk report includes an aggregate view of risks identified in the individual report and provides a summary of our overall risk profile compared to our risk appetite.
Credit Risk Management
Credit risk represents the possibility that a customer, counterparty or issuer may not perform in accordance with contractual terms. Credit risk is inherent in the financial services business and results from extending credit to customers, purchasing securities, and entering into financial derivative transactions and certain guarantee contracts. Credit risk is one of our most significant risks. Our processes for managing credit risk are embedded in our risk culture and in our decision-making processes using a systematic approach whereby credit risks and related exposures are identified and assessed, managed through specific policies and processes, measured and evaluated against our risk appetite and credit concentration limits, and reported, along with specific mitigation activities, to management and the Board of Directors through our governance structure. Our most significant concentration of credit risk is in our loan portfolio.
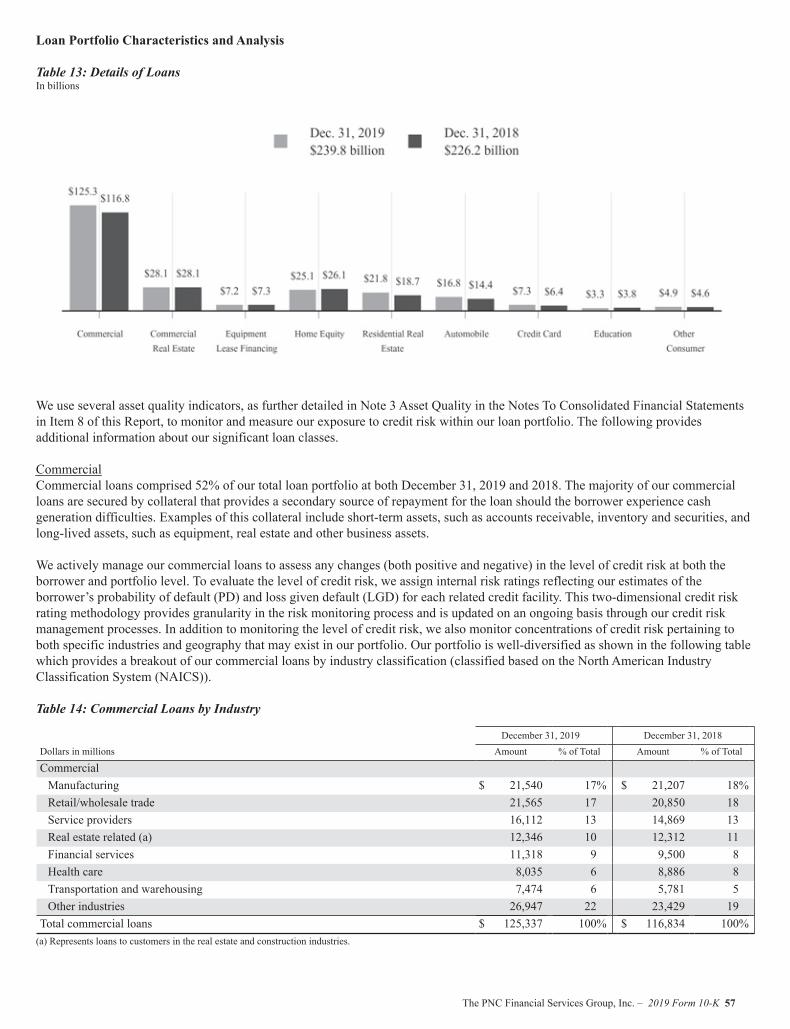
The PNC Financial Services Group, Inc. – 2019 Form 10-K 57
Loan Portfolio Characteristics and Analysis
Table 13: Details of LoansIn billions
We use several asset quality indicators, as further detailed in Note 3 Asset Quality in the Notes To Consolidated Financial Statements in Item 8 of this Report, to monitor and measure our exposure to credit risk within our loan portfolio. The following provides additional information about our significant loan classes.
CommercialCommercial loans comprised 52% of our total loan portfolio at both December 31, 2019 and 2018. The majority of our commercial loans are secured by collateral that provides a secondary source of repayment for the loan should the borrower experience cash generation difficulties. Examples of this collateral include short-term assets, such as accounts receivable, inventory and securities, and long-lived assets, such as equipment, real estate and other business assets.
We actively manage our commercial loans to assess any changes (both positive and negative) in the level of credit risk at both the borrower and portfolio level. To evaluate the level of credit risk, we assign internal risk ratings reflecting our estimates of the borrower’s probability of default (PD) and loss given default (LGD) for each related credit facility. This two-dimensional credit risk rating methodology provides granularity in the risk monitoring process and is updated on an ongoing basis through our credit risk management processes. In addition to monitoring the level of credit risk, we also monitor concentrations of credit risk pertaining to both specific industries and geography that may exist in our portfolio. Our portfolio is well-diversified as shown in the following table which provides a breakout of our commercial loans by industry classification (classified based on the North American Industry Classification System (NAICS)).
Table 14: Commercial Loans by Industry
December 31, 2019 December 31, 2018Dollars in millions Amount % of Total Amount % of Total
CommercialManufacturing $ 21,540 17% $ 21,207 18%Retail/wholesale trade 21,565 17 20,850 18Service providers 16,112 13 14,869 13Real estate related (a) 12,346 10 12,312 11Financial services 11,318 9 9,500 8Health care 8,035 6 8,886 8Transportation and warehousing 7,474 6 5,781 5Other industries 26,947 22 23,429 19
Total commercial loans $ 125,337 100% $ 116,834 100%(a) Represents loans to customers in the real estate and construction industries.

58 The PNC Financial Services Group, Inc. – 2019 Form 10-K
Environmental and social risks are incorporated into the transaction and portfolio management policies and procedures that govern our underwriting and portfolio management practices. All Corporate & Institutional Banking transactions are subject to an Environmental and Social Risk Management assessment designed to help us better identify and mitigate environmental and human rights risks early in the credit application process. Transactions identified as having a potential environmental or human rights risk are evaluated to determine whether enhanced due diligence is warranted. We have also chosen to limit new originations in sectors that are no longer consistent with our strategic direction, such as mountain-top removal coal mining and private prisons. We periodically review environmental and social risk topics in PNC’s Credit Portfolio Strategy Committee, and outcomes of these reviews may result in changes to our due diligence, origination requirements, or limits on credit exposure. Our approach to identifying environmental and social risks is regularly reviewed by senior management and overseen by our Board of Directors. PNC will continue to refine its approach as banking conditions, regulatory requirements, investors’ perspectives and our strategic direction evolve.
Commercial Real EstateCommercial real estate loans comprised $17.0 billion related to commercial mortgages, $5.6 billion of real estate project loans and $5.5 billion of intermediate term financing loans as of December 31, 2019. Comparable amounts were $14.4 billion, $6.6 billion and $7.1 billion, respectively, as of December 31, 2018.
We monitor credit risk associated with our commercial real estate loans similar to commercial loans by analyzing PD and LGD. Additionally, risks associated with these types of credit activities tend to be correlated to the loan structure, collateral location, project progress and business environment. These attributes are also monitored and utilized in assessing credit risk. The portfolio is geographically diverse due to the nature of our business involving clients throughout the U.S. The following table presents our commercial real estate loans by geography and property type.
Table 15: Commercial Real Estate Loans by Geography and Property Type
December 31, 2019 December 31, 2018Dollars in millions Amount % of Total Amount % of Total
GeographyCalifornia $ 4,393 16% $ 4,154 15%Florida 2,557 9 2,157 8Maryland 1,889 7 1,966 7Texas 1,717 6 1,531 5Virginia 1,547 6 1,682 6Pennsylvania 1,310 4 1,214 4Ohio 1,307 4 1,053 4New Jersey 1,106 4 884 3North Carolina 1,015 4 915 3Illinois 1,001 4 1,368 5Other 10,268 36 11,216 40
Total commercial real estate loans $ 28,110 100% $ 28,140 100%Property Type
Multifamily $ 9,003 32% $ 8,770 31%Office 7,641 27 7,279 26Retail 3,702 13 4,065 14Industrial/Warehouse 2,003 7 1,678 6Hotel/Motel 1,813 7 1,686 6Senior Housing 1,123 4 1,092 4Mixed Use 943 3 933 3Other 1,882 7 2,637 10
Total commercial real estate loans $ 28,110 100% $ 28,140 100%
Home EquityHome equity loans comprised $13.9 billion of primarily variable-rate home equity lines of credit and $11.2 billion of closed-end home equity installment loans at December 31, 2019. Comparable amounts were $15.5 billion and $10.6 billion, respectively, as of December 31, 2018.
We track borrower performance monthly, including obtaining original loan-to-value ratios (LTV), updated FICO scores at least quarterly, updated LTVs at least semi-annually, and other credit metrics at least quarterly, including the historical performance of any related mortgage loans regardless of lien position that we do or do not hold. This information is used for internal reporting and risk management. For internal reporting and risk management we also segment the population into pools based on product type (e.g., home

The PNC Financial Services Group, Inc. – 2019 Form 10-K 59
equity loans, brokered home equity loans, home equity lines of credit, brokered home equity lines of credit). As part of our overall risk analysis and monitoring, we also segment the portfolio based upon the loan delinquency, nonperforming status, modification and bankruptcy status, FICO scores, LTV, lien position and geographic concentration.
The credit quality of newly originated loans in 2019 was strong overall with a weighted-average LTV on originations of 68% and a weighted-average FICO score of 768.
The credit performance of the majority of the home equity portfolio where we hold the first lien position is superior to the portion of the portfolio where we hold the second lien position, but do not hold the first lien. Lien position information is generally determined at the time of origination and monitored on an ongoing basis for risk management purposes. We use an industry-leading third-party service provider to obtain updated loan information, including lien and collateral data that is aggregated from public and private sources.
The following table presents our home equity loans by geography and lien type.
Table 16: Home Equity Loans by Geography and by Lien Type
December 31, 2019 December 31, 2018Dollars in millions Amount % of Total Amount % of Total
GeographyPennsylvania $ 5,812 23% $ 6,160 24%New Jersey 3,728 15 3,935 15Ohio 2,899 12 3,095 12Illinois 1,544 6 1,634 6Maryland 1,420 6 1,481 6Michigan 1,371 5 1,340 5Florida 1,340 5 1,227 5North Carolina 1,092 4 1,161 4Kentucky 990 4 1,040 4Indiana 820 3 845 3Other 4,069 17 4,205 16
Total home equity loans $ 25,085 100% $ 26,123 100%Lien type
1st lien 59% 58%2nd lien 41 42
Total 100% 100%
Residential Real Estate Residential real estate loans primarily consisted of residential mortgage loans at both December 31, 2019 and 2018.
We track borrower performance of this portfolio monthly similarly to home equity loans. This information is used for internal reporting and risk management. For internal reporting and risk management we also segment the mortgage portfolio into pools based on product type (e.g., nonconforming, conforming). As part of our overall risk analysis and monitoring, we also segment the portfolio based upon loan delinquency, nonperforming status, modification and bankruptcy status, FICO scores, LTV and geographic concentrations. Loan performance is evaluated by source originators and loan servicers.
The credit quality of newly originated loans that we retained on our balance sheet in 2019 was strong overall as evidenced by a weighted-average LTV on originations of 70% and a weighted-average FICO score of 769.

60 The PNC Financial Services Group, Inc. – 2019 Form 10-K
The following table presents our residential real estate loans by geography.
Table 17: Residential Real Estate Loans by Geography
December 31, 2019 December 31, 2018Dollars in millions Amount % of Total Amount % of Total
GeographyCalifornia $ 6,800 31% $ 4,666 25%New Jersey 1,779 8 1,649 9Florida 1,580 7 1,544 8Illinois 1,118 5 1,161 6Pennsylvania 1,113 5 1,031 6New York 1,008 5 956 5Maryland 923 4 913 5North Carolina 877 4 854 5Virginia 868 4 825 4Ohio 704 3 682 4Other 5,051 24 4,376 23
Total residential real estate loans $ 21,821 100% $ 18,657 100%
We originate residential mortgage loans nationwide through our national mortgage business as well as within our branch network. Residential mortgage loans underwritten to agency standards, including conforming loan amount limits, are typically sold with servicing retained by us. We also originate nonconforming residential mortgage loans that do not meet agency standards, which we retain on our balance sheet. The nonconforming residential mortgage portfolio had strong credit quality at December 31, 2019 with an average original LTV of 70% and an average original FICO score of 772. Our portfolio of nonconforming residential mortgage loans totaled $16.0 billion at December 31, 2019 with 38% located in California.
AutomobileWithin auto loans, $15.1 billion resided in the indirect auto portfolio while $1.7 billion were in the direct auto portfolio as of December 31, 2019. Comparable amounts as of December 31, 2018 were $12.9 billion and $1.5 billion, respectively. The indirect auto portfolio relates to loan applications originated through franchised dealers, including from expansion into new markets. This business is strategically aligned with our core retail banking business.
We continue to focus on borrowers with strong credit profiles as evidenced by a weighted-average loan origination FICO score of 757 during 2019 and 740 during 2018 for indirect auto loans, and 769 during 2019 and 762 during 2018 for direct auto loans. The weighted-average term of loan originations during 2019 was 74 months for indirect auto loans and 63 months for direct auto loans. We offer both new and used auto financing to customers through our various channels. At December 31, 2019, the portfolio was composed of 55% new vehicle loans and 45% used vehicle loans. Comparable amounts at December 31, 2018 were 53% and 47%, respectively.
The auto loan portfolio's performance is measured monthly, including updated collateral values that are obtained monthly and updated FICO scores that are obtained at least quarterly. For internal reporting and risk management, we analyze the portfolio by product channel and product type and regularly evaluate default and delinquency experience. As part of our overall risk analysis and monitoring, we segment the portfolio by loan structure, collateral attributes and credit metrics which include FICO score, LTV and term.
Nonperforming Assets and Loan Delinquencies
Nonperforming AssetsNonperforming assets include nonperforming loans and leases for which ultimate collectability of the full amount of contractual principal and interest is not probable and include nonperforming troubled debt restructurings (TDRs), other real estate owned (OREO) and foreclosed assets. Loans held for sale, certain government insured or guaranteed loans, purchased impaired loans and loans accounted for under the fair value option are excluded from nonperforming loans. Additional information regarding our nonperforming loans and nonaccrual policies is included in Note 1 Accounting Policies in the Notes To Consolidated Financial Statements in Item 8 of this Report. A summary of the major categories of nonperforming assets are presented in Table 18. See Note 3 Asset Quality in the Notes To Consolidated Financial Statements in Item 8 of this Report for further detail of nonperforming asset categories.

The PNC Financial Services Group, Inc. – 2019 Form 10-K 61
Table 18: Nonperforming Assets by Type
December 312019
December 312018
ChangeDollars in millions $ %
Nonperforming loans Commercial lending $ 501 $ 432 $ 69 16%Consumer lending (a) 1,134 1,262 (128) (10)%
Total nonperforming loans 1,635 1,694 (59) (3)%OREO and foreclosed assets 117 114 3 3%Total nonperforming assets $ 1,752 $ 1,808 $ (56) (3)%TDRs included in nonperforming loans $ 843 $ 863 $ (20) (2)%Percentage of total nonperforming loans 52% 51% Nonperforming loans to total loans .68% .75%Nonperforming assets to total loans, OREO and foreclosed assets .73% .80%Nonperforming assets to total assets .43% .47%Allowance for loan and lease losses to total nonperforming loans 168% 155% (a) Excludes most unsecured consumer loans and lines of credit, which are charged off after 120 to 180 days past due and are not placed on nonperforming status.
Table 19: Change in Nonperforming Assets
In millions 2019 2018
January 1 $ 1,808 $ 2,035New nonperforming assets 1,342 1,110Charge-offs and valuation adjustments (664) (556)Principal activity, including paydowns and payoffs (472) (476)Asset sales and transfers to loans held for sale (95) (139)Returned to performing status (167) (166)December 31 $ 1,752 $ 1,808
As of December 31, 2019, approximately 88% of total nonperforming loans were secured by collateral which lessened reserve requirements and is expected to reduce credit losses. As of December 31, 2019, commercial lending nonperforming loans were carried at approximately 74% of their unpaid principal balance, due to charge-offs recorded to date, before consideration of the ALLL. Within consumer lending nonperforming loans, residential real estate TDRs comprised 79% and 81% of total residential real estate nonperforming loans at December 31, 2019 and 2018, respectively. Home equity TDRs comprised 49% of home equity nonperforming loans at December 31, 2019, up from 47% at December 31, 2018. TDRs generally remain in nonperforming status until a borrower has made at least six consecutive months of both principal and interest payments under the modified terms or ultimate resolution occurs. Loans where borrowers have been discharged from personal liability through Chapter 7 bankruptcy and have not formally reaffirmed their loan obligations to us and loans to borrowers not currently obligated to make both principal and interest payments under the restructured terms are not returned to accrual status.
At December 31, 2019, our largest nonperforming asset was $29 million in the Retail Trade industry and the ten largest individual nonperforming assets represented 10% of total nonperforming assets.
Loan DelinquenciesWe regularly monitor the level of loan delinquencies and believe these levels may be a key indicator of loan portfolio asset quality. Measurement of delinquency status is based on the contractual terms of each loan. Loans that are 30 days or more past due in terms of payment are considered delinquent. Loan delinquencies exclude loans held for sale and purchased impaired loans, but include government insured or guaranteed loans and loans accounted for under the fair value option.

62 The PNC Financial Services Group, Inc. – 2019 Form 10-K
Table 20: Accruing Loans Past Due (a)
Amount Percentage of Total Loans Outstanding December 31
2019December 31
2018Change December 31
2019December 31
2018Dollars in millions $ %Early stage loan delinquencies
Accruing loans past due 30 to 59 days $ 661 $ 585 $ 76 13 % .28% .26%Accruing loans past due 60 to 89 days 258 271 (13) (5)% .11% .12%
Total 919 856 63 7 % .38% .38%Late stage loan delinquencies
Accruing loans past due 90 days or more 585 629 (44) (7)% .24% .28%Total $ 1,504 $ 1,485 $ 19 1 % .63% .66%
(a) Past due loan amounts include government insured or guaranteed loans of $.6 billion at December 31, 2019 and $.7 billion at December 31, 2018.
Accruing loans past due 90 days or more continue to accrue interest because they are (i) well secured by collateral and are in the process of collection, (ii) managed in homogeneous portfolios with specified charge-off timeframes adhering to regulatory guidelines, or (iii) certain government insured or guaranteed loans. As such, they are excluded from nonperforming loans.
Troubled Debt Restructurings and Loan Modifications
Troubled Debt RestructuringsA TDR is a loan whose terms have been restructured in a manner that grants a concession to a borrower experiencing financial difficulties. TDRs result from our loss mitigation activities and include rate reductions, principal forgiveness, postponement/reduction of scheduled amortization and extensions, which are intended to minimize economic loss and to avoid foreclosure or repossession of collateral. Additionally, TDRs also result from court imposed concessions (e.g., a Chapter 7 bankruptcy where the debtor is discharged from personal liability to us and a court approved Chapter 13 bankruptcy repayment plan).
Table 21: Summary of Troubled Debt Restructurings (a)
December 312019
December 312018
ChangeIn millions $ %Total commercial lending $ 361 $ 409 $ (48) (12)%Total consumer lending 1,303 1,442 (139) (10)%
Total TDRs $ 1,664 $ 1,851 $ (187) (10)%Nonperforming $ 843 $ 863 $ (20) (2)%Accruing (b) 821 988 (167) (17)%
Total TDRs $ 1,664 $ 1,851 $ (187) (10)%(a) Amounts in table represent recorded investment, which includes the unpaid principal balance plus net accounting adjustments, less any charge-offs. Recorded investment
does not include any associated valuation allowance.(b) Accruing loans include consumer credit card loans and loans that have demonstrated a period of at least six months of performance under the restructured terms and are
excluded from nonperforming loans.
Excluded from TDRs are $1.0 billion and $1.1 billion of consumer loans held for sale, loans accounted for under the fair value option and pooled purchased impaired loans, as well as certain government insured or guaranteed loans at December 31, 2019 and 2018, respectively. Nonperforming TDRs represented approximately 52% and 51% of total nonperforming loans at December 31, 2019 and 2018, respectively, while representing 51% and 47% of total TDRs at December 31, 2019 and 2018, respectively. The remaining portion of TDRs represents TDRs that have been returned to accrual status after performing under the restructured terms for at least six consecutive months.
See Note 3 Asset Quality in the Notes To Consolidated Financial Statements in Item 8 of this Report for additional information on TDRs.
Commercial Loan ModificationsModifications of terms for commercial loans are based on individual facts and circumstances. Commercial loan modifications may involve reduction of the interest rate, extension of the loan term and/or forgiveness of principal. We evaluate these modifications for TDR classification based upon whether we granted a concession to a borrower experiencing financial difficulties.
Consumer Loan ModificationsWe modify loans under government and PNC-developed programs based upon our commitment to help eligible homeowners and borrowers avoid foreclosure, where appropriate. Initially, a borrower is evaluated for a modification under a government program. If a borrower does not qualify under a government program, the borrower is then evaluated under a PNC program. Our programs utilize both temporary and permanent modifications and typically reduce the interest rate, extend the term and/or defer principal. Loans that

The PNC Financial Services Group, Inc. – 2019 Form 10-K 63
are either temporarily or permanently modified under programs involving a change to loan terms are generally classified as TDRs. Further, loans that have certain types of payment plans and trial payment arrangements which do not include a contractual change to loan terms may be classified as TDRs.
A temporary modification, with a term up to 24 months, involves a change in original loan terms for a period of time and reverts to a calculated exit rate for the remaining term of the loan as of a specific date. A permanent modification, with a term greater than 24 months, is a modification in which the terms of the original loan are changed. Permanent modification programs generally result in principal forgiveness, interest rate reduction, term extension, capitalization of past due amounts, interest-only period or deferral of principal.
We also monitor the success rates and delinquency status of our loan modification programs to assess their effectiveness in serving our borrowers’ and servicing customers’ needs while mitigating credit losses.
Allowances for Loan and Lease Losses and Unfunded Loan Commitments and Letters of Credit
On January 1, 2020 we adopted Accounting Standards Update (ASU) 2016-13 - Credit Losses (CECL). The following discussion refers to our Allowance for Loan and Leases Losses and Unfunded Loan Commitments and Letters of Credit prior to the adoption. For additional information on our implementation of CECL refer to Note 1 Accounting Policies in Item 8 of this Report.
We maintain an ALLL to absorb losses from the loan and lease portfolio and determine this allowance based on quarterly assessments of the estimated probable credit losses incurred in the loan and lease portfolio. Our total ALLL of $2.7 billion at December 31, 2019 consisted of $1.8 billion and $.9 billion established for the commercial lending and consumer lending categories, respectively. We maintain the ALLL at a level that we believe to be appropriate to absorb estimated probable credit losses incurred in the loan and lease portfolio as of the balance sheet date. The reserve calculation and determination process is dependent on the use of key assumptions. Key reserve assumptions and estimation processes react to and are influenced by observed changes in loan and lease portfolio performance experience, the financial strength of the borrower, and economic conditions. Key reserve assumptions and estimation processes are periodically updated.
Reserves are established for non-impaired commercial loan classes based primarily on PD and LGD. Our commercial pool reserve methodology is sensitive to changes in key risk parameters such as PD and LGD. The results of these parameters are then applied to the loan balance to determine the amount of the respective reserves. The majority of the commercial portfolio is secured by collateral, including loans to asset-based lending customers, which generally demonstrate lower LGDs compared to loans not secured by collateral. Our PDs and LGDs are primarily determined using internal commercial loan loss data. This internal data is supplemented with third-party data and management judgment, as deemed necessary. We continue to evaluate and enhance our use of internal commercial loss data and will periodically update our PDs and LGDs as well as consider third-party data, regulatory guidance and management judgment.
Allowances for non-impaired consumer loan classes are primarily based upon transition matrices, including using a roll-rate model. The roll-rate model uses statistical relationships, calculated from historical data that estimate the movement of loan outstandings through the various stages of delinquency and ultimately charge-off.
We establish specific allowances for loans considered impaired using methods prescribed by GAAP. All impaired loans are subject to individual analysis, except leases and large groups of smaller-balance homogeneous loans which may include, but are not limited to, credit card, residential real estate secured and consumer installment loans. Specific allowances for individual loans (including commercial and consumer TDRs) are determined based on an analysis of the present value of expected future cash flows from the loans discounted at their effective interest rate, observable market price or the fair value of the underlying collateral.
A portion of the ALLL is related to qualitative measurement factors. These factors may include, but are not limited to, the following:• Industry concentrations and conditions,• Changes in market conditions,• Recent credit quality trends,• Recent loss experience in particular portfolios, including specific and unique events,• Recent macro-economic factors,• Model imprecision,• Changes in lending policies and procedures,• Timing of available information, including the performance of first lien positions, and• Limitations of available historical data.
Our determination of the ALLL for non-impaired loans is sensitive to the risk grades assigned to commercial loans and loss rates for consumer loans. There are several other qualitative and quantitative factors considered in determining the ALLL. Periodically, reserve

64 The PNC Financial Services Group, Inc. – 2019 Form 10-K
sensitivity analyses are performed. Such analyses provide insight into the impact of adverse changes to risk grades and loss rates. Given the current processes used, we believe the risk grades and loss rates currently assigned are appropriate.
Purchased impaired loans are initially recorded at fair value and applicable accounting guidance prohibits the carryover or creation of valuation allowances at acquisition. Because the initial fair values of these loans already reflect a credit component, additional reserves are established when performance is expected to be worse than our expectations as of the acquisition date. At December 31, 2019, we had established reserves of $.3 billion for purchased impaired loans. In addition, loans (purchased impaired and non-impaired) acquired after January 1, 2009 were recorded at fair value. No allowance for loan losses was carried over and no allowance was created at the date of acquisition.
In determining the appropriateness of the ALLL, we make specific allocations to impaired loans and allocations to portfolios of commercial and consumer loans. We also allocate reserves to provide coverage for probable losses incurred in the portfolio at the balance sheet date based upon current market conditions, which may not be reflected in historical loss data. Commercial lending is the largest category of credits and the determination of its ALLL is sensitive to changes in assumptions and judgments.
In addition to the ALLL, we maintain an allowance for unfunded loan commitments and letters of credit. We report this allowance as a liability on our Consolidated Balance Sheet. We maintain the allowance for unfunded loan commitments and letters of credit at a level we believe is appropriate to absorb estimated probable losses on these unfunded credit facilities. We determine this amount using estimates of the probability of the ultimate funding and losses related to those credit exposures. Other than the estimation of the probability of funding, this methodology is very similar to the one we use for determining our ALLL.
See Note 1 Accounting Policies and Note 3 Asset Quality in the Notes To Consolidated Financial Statements in Item 8 of this Report for further information on certain key asset quality indicators that we use to evaluate our portfolios and establish the allowances.
Table 22: Allowance for Loan and Lease Losses
Dollars in millions 2019 2018
January 1 $ 2,629 $ 2,611Total net charge-offs (642) (420)Provision for credit losses 773 408Net decrease / (increase) in allowance for unfunded loan commitments and letters of credit (33) 12Other 15 18
December 31 $ 2,742 $ 2,629Net charge-offs to average loans (for the year ended) .27% .19%ALLL to total loans 1.14% 1.16%Commercial lending net charge-offs $ (138) $ (25)Consumer lending net charge-offs (504) (395)
Total net charge-offs $ (642) $ (420)Net charge-offs to average loans (for the year ended)
Commercial lending .09% .02%Consumer lending .67% .54%
The ALLL balance increases or decreases across periods in relation to fluctuating risk factors, including asset quality trends, net charge-offs and changes in aggregate portfolio balances. During 2019, overall credit quality remained historically strong, which resulted in an essentially flat ratio of ALLL to total loans as of December 31, 2019 compared to December 31, 2018.

The PNC Financial Services Group, Inc. – 2019 Form 10-K 65
The following table summarizes our loan charge-offs and recoveries.
Table 23: Loan Charge-Offs and Recoveries
Year ended December 31Dollars in millions
GrossCharge-offs Recoveries
Net Charge-offs /(Recoveries)
Percent ofAverage Loans
2019Commercial $ 183 $ 59 $ 124 .10 %Commercial real estate 18 11 7 .02 %Equipment lease financing 15 8 7 .10 %Home equity 68 74 (6) (.02)%Residential real estate 9 14 (5) (.02)%Automobile 261 114 147 .95 %Credit card 263 27 236 3.60 %Education 26 8 18 .50 %Other consumer 131 17 114 2.41 %
Total $ 974 $ 332 $ 642 .27 %2018Commercial $ 108 $ 67 $ 41 .04 %Commercial real estate 8 24 (16) (.06)%Equipment lease financing 8 8 —Home equity 110 98 12 .04 %Residential real estate 6 21 (15) (.08)%Automobile 171 77 94 .68 %Credit card 217 24 193 3.30 %Education 31 8 23 .56 %Other consumer 105 17 88 1.98 %
Total $ 764 $ 344 $ 420 .19 %
Total net charge-offs increased $222 million, or 53%, in 2019 compared to 2018. The increase in net charge-offs was primarily attributable to loan growth, some credit normalization in our portfolio and the impact of certain individual credits in commercial loans.
See Note 1 Accounting Policies and Note 4 Allowance for Loan and Lease Losses in the Notes To Consolidated Financial Statements in Item 8 of this Report for further information on the ALLL. Additionally, see Note 1 Accounting Policies for information on our implementation of Accounting Standards Update (ASU) 2016-13 - Credit Losses, including the impact of adoption at January 1, 2020 on our reserves and other selected financial information.
Liquidity and Capital Management
Liquidity risk has two fundamental components. The first is potential loss assuming we were unable to meet our funding requirements at a reasonable cost. The second is the potential inability to operate our businesses because adequate contingent liquidity is not available. We manage liquidity risk at the consolidated company level (bank, parent company and nonbank subsidiaries combined) to help ensure that we can obtain cost-effective funding to meet current and future obligations under both normal “business as usual” and stressful circumstances, and to help ensure that we maintain an appropriate level of contingent liquidity.
Management monitors liquidity through a series of early warning indicators that may indicate a potential market, or PNC-specific, liquidity stress event. In addition, management performs a set of liquidity stress tests over multiple time horizons with varying levels of severity and maintains a contingency funding plan to address a potential liquidity stress event. In the most severe liquidity stress simulation, we assume that our liquidity position is under pressure, while the market in general is under systemic pressure. The simulation considers, among other things, the impact of restricted access to both secured and unsecured external sources of funding, accelerated runoff of customer deposits, valuation pressure on assets and heavy demand to fund committed obligations. Parent company liquidity guidelines are designed to help ensure that sufficient liquidity is available to meet our parent company obligations over the succeeding 24-month period. Liquidity-related risk limits are established within our Enterprise Liquidity Management Policy and supporting policies. Management committees, including the Asset and Liability Committee, and the Board of Directors and its Risk Committee regularly review compliance with key established limits.
In addition to these liquidity monitoring measures and tools described above, we also monitor our liquidity by reference to the Liquidity Coverage Ratio (LCR) which is further described in the Supervision and Regulation section in Item 1 of this Report. PNC and PNC Bank calculate the LCR on a daily basis and as of December 31, 2019, the LCR for PNC and PNC Bank exceeded the requirement of 100%.

66 The PNC Financial Services Group, Inc. – 2019 Form 10-K
We provide additional information regarding regulatory liquidity requirements, including information on the 2019 Tailoring Rules, and their potential impact on us in the Supervision and Regulation section of Item 1 Business and Item 1A Risk Factors of this Report.
Sources of LiquidityOur largest source of liquidity on a consolidated basis is the customer deposit base generated by our banking businesses. These deposits provide relatively stable and low-cost funding. Total deposits increased to $288.5 billion at December 31, 2019 from $267.8 billion at December 31, 2018 driven by growth in interest-bearing deposits partially offset by a decrease in noninterest-bearing deposits. See the Funding Sources section of the Consolidated Balance Sheet Review in this Item 7 for additional information related to our deposits. Additionally, certain assets determined by us to be liquid as well as unused borrowing capacity from a number of sources are also available to manage our liquidity position.
At December 31, 2019, our liquid assets consisted of cash and due from banks and short-term investments (federal funds sold, resale agreements, trading securities and interest-earning deposits with banks) totaling $34.1 billion and securities available for sale totaling $69.2 billion. The level of liquid assets fluctuates over time based on many factors, including market conditions, loan and deposit growth and balance sheet management activities. Our liquid assets included $14.0 billion of securities available for sale and trading securities pledged as collateral to secure public and trust deposits, repurchase agreements and for other purposes. In addition, $.6 billion of securities held to maturity were also pledged as collateral for these purposes.
We also obtain liquidity through various forms of funding, including long-term debt (senior notes, subordinated debt and FHLB borrowings) and short-term borrowings (federal funds purchased, securities sold under repurchase agreements, commercial paper and other short-term borrowings). See Note 10 Borrowed Funds in the Notes To Consolidated Financial Statements in Item 8 and the Funding Sources section of the Consolidated Balance Sheet Review in this Item 7 for additional information related to our borrowings.
Total senior and subordinated debt, on a consolidated basis, increased due to the following activity:
Table 24: Senior and Subordinated Debt
In billions 2019January 1 $ 30.9Issuances 9.7Calls and maturities (6.3)Other .8December 31 $ 35.1
Bank LiquidityUnder PNC Bank’s 2014 bank note program, as amended, PNC Bank may from time to time offer up to $40.0 billion aggregate principal amount outstanding at any one time of its unsecured senior and subordinated notes with maturity dates more than nine months (in the case of senior notes) and five years or more (in the case of subordinated notes) from their date of issue. At December 31, 2019, PNC Bank had $25.0 billion of notes outstanding under this program of which $20.0 billion were senior bank notes and $5.0 billion were subordinated bank notes. The following table details issuances for the three months ended December 31, 2019.

The PNC Financial Services Group, Inc. – 2019 Form 10-K 67
Table 25: PNC Bank Notes Issued
Issuance Date Amount Description of Issuance
October 22, 2019 $750 million Subordinated notes with a maturity date of October 22, 2029. Interest is payable semi-annually at a fixedrate of 2.70% per annum, on April 22 and October 22 of each year, beginning April 22, 2020.
December 9, 2019 $750 million Senior floating rate notes with a maturity date of December 9, 2022. Redeemable in whole, but not inpart, on or after December 9, 2021, and in whole or in part on or after November 9, 2022. Interest ispayable quarterly, at the 3-month LIBOR rate plus 43 basis points, on March 9, June 9, September 9 andDecember 9 of each year, beginning March 9, 2020.
December 9, 2019 $650 million Senior fixed-to-floating rate notes with a maturity date of December 9, 2022. Redeemable in whole, but not in part, on December 9, 2021, and in whole or in part on or after November 9, 2022. From the issue date of the notes to, but excluding, December 9, 2021, interest is payable semi-annually at a fixed rate of 2.028% per annum on December 9 and June 9 of each year, beginning June 9, 2020. Beginning on December 9, 2021, interest is payable quarterly, at the 3-month LIBOR rate, reset quarterly, plus 42 basis points, on March 9, June 9, September 9, and December 9, beginning on March 9, 2022.
See Note 25 Subsequent Events for information on the February 2020 issuances of $1.0 billion of senior floating rate notes and $500 million of senior fixed-to-floating rate notes by PNC Bank.
PNC Bank maintains additional secured borrowing capacity with the FHLB-Pittsburgh and through the Federal Reserve Bank discount window. The Federal Reserve Bank, however, is not viewed as a primary means of funding our routine business activities, but rather as a potential source of liquidity in a stressed environment or during a market disruption. At December 31, 2019, our unused secured borrowing capacity at the FHLB-Pittsburgh and the Federal Reserve Bank totaled $51.4 billion.
PNC Bank has the ability to offer up to $10.0 billion of its commercial paper to provide additional liquidity. As of December 31, 2019, there were no issuances outstanding under this program.
Parent Company LiquidityIn addition to managing liquidity risk at the bank level, we monitor the parent company’s liquidity. The parent company’s contractual obligations consist primarily of debt service related to parent company borrowings and funding non-bank affiliates. Additionally, the parent company maintains adequate liquidity to fund discretionary activities such as paying dividends to our shareholders, share repurchases and acquisitions.
As of December 31, 2019, available parent company liquidity totaled $6.7 billion. Parent company liquidity is primarily held in intercompany short-term investments, the terms of which provide for the availability of cash in 31 days or less. Investments with longer durations may also be acquired, but if so, the related maturities are aligned with scheduled cash needs, such as the maturity of parent company debt obligations.
The principal source of parent company liquidity is the dividends it receives from PNC Bank, which may be impacted by the following:
• Bank-level capital needs;• Laws and regulations;• Corporate policies;• Contractual restrictions; and• Other factors.
There are statutory and regulatory limitations on the ability of a national bank to pay dividends or make other capital distributions or to extend credit to the parent company or its non-bank subsidiaries. The amount available for dividend payments by PNC Bank to the parent company without prior regulatory approval was approximately $3.1 billion at December 31, 2019. See Note 18 Regulatory Matters in the Notes To Consolidated Financial Statements in Item 8 of this Report for a further discussion of these limitations.
In addition to dividends from PNC Bank, other sources of parent company liquidity include cash and investments, as well as dividends and loan repayments from other subsidiaries and dividends or distributions from equity investments. We can also generate liquidity for the parent company and PNC’s non-bank subsidiaries through the issuance of debt and equity securities, including certain capital instruments, in public or private markets and commercial paper. Authorized by the Board of Directors, the parent company has the ability to offer up to $5.0 billion of commercial paper to provide additional liquidity. As of December 31, 2019 there were no commercial paper issuances outstanding.
The parent company has an effective shelf registration statement pursuant to which we can issue additional debt, equity and other capital instruments. On November 1, 2019, the parent company issued $650 million of senior notes with a maturity date of November 1, 2024, redeemable in whole or in part, on or after October 2, 2024. Interest is payable semi-annually at a fixed rate of 2.20% per

annum, on May 1 and November 1 of each year, beginning May 1, 2020. In addition, see Note 25 Subsequent Events in the Notes To Consolidated Financial Statements in Item 8 of this Report for more information on the January 22, 2020 issuance of $2.0 billion of senior notes by the parent company utilizing this shelf registration statement.
Parent company senior and subordinated debt outstanding totaled $9.8 billion at December 31, 2019 compared with $6.7 billion at December 31, 2018.
Contractual Obligations and CommitmentsThe following tables set forth contractual obligations and various other commitments as of December 31, 2019.
Table 26: Contractual Obligations
Payment Due By Period
December 31, 2019 – in millions TotalLess thanone year
One tothree years
Four tofive years
After fiveyears
Remaining contractual maturities of time deposits $ 21,663 $ 18,541 $ 2,211 $ 598 $ 313Borrowed funds (a) 60,263 27,079 16,396 5,368 11,420Minimum annual rentals on noncancellable operating leases 2,425 355 646 501 923Nonqualified pension and postretirement benefits 453 54 102 94 203Purchase obligations (b) 973 511 298 129 35
Total contractual cash obligations $ 85,777 $ 46,540 $ 19,653 $ 6,690 $ 12,894(a) Includes basis adjustment relating to accounting hedges and purchase accounting adjustments.(b) Includes purchase obligations for goods and services covered by noncancellable contracts and contracts including cancellation fees.
Table 27: Other Commitments (a)
Amount Of Commitment Expiration By Period
December 31, 2019 – in millionsTotal Amounts
CommittedLess than one
yearOne to
three yearsFour to
five yearsAfter
five years
Commitments to extend credit (b) $ 185,589 $ 86,126 $ 44,444 $ 54,244 $ 775Net outstanding standby letters of credit (c) 9,843 4,249 3,804 1,786 4Reinsurance agreements (d) 1,393 1 4 6 1,382Standby bond purchase agreements 1,295 425 621 249Other commitments (e) 1,498 1,098 301 80 19
Total commitments $ 199,618 $ 91,899 $ 49,174 $ 56,365 $ 2,180(a) Other commitments are funding commitments that could potentially require performance in the event of demands by third parties or contingent events. Loan commitments
are reported net of syndications, assignments and participations.(b) Commitments to extend credit, or net unfunded loan commitments, represent arrangements to lend funds or provide liquidity subject to specified contractual conditions.(c) Includes $4.1 billion of standby letters of credit that support remarketing programs for customers’ variable rate demand notes.(d) Reinsurance agreements are with third-party insurers related to insurance sold to our customers. Balances represent estimates based on availability of financial information.(e) Includes other commitments of $.5 billion that were not on our Consolidated Balance Sheet. The remaining $1.0 billion of other commitments were included in Other
liabilities on our Consolidated Balance Sheet.
Credit RatingsPNC’s credit ratings affect the cost and availability of short and long-term funding, collateral requirements for certain derivative instruments and the ability to offer certain products.
In general, rating agencies base their ratings on many quantitative and qualitative factors, including capital adequacy, liquidity, asset quality, business mix, level and quality of earnings, and the current legislative and regulatory environment, including implied government support. A decrease, or potential decrease, in credit ratings could impact access to the capital markets and/or increase the cost of debt, and thereby adversely affect liquidity and financial condition.
68 The PNC Financial Services Group, Inc. – 2019 Form 10-K

The PNC Financial Services Group, Inc. – 2019 Form 10-K 69
Table 28: Credit Ratings for PNC and PNC Bank
December 31, 2019 Moody’s Standard & Poor’s FitchPNCSenior debt A3 A- A+Subordinated debt A3 BBB+ APreferred stock Baa2 BBB- BBB-PNC BankSenior debt A2 A A+Subordinated debt A3 A- ALong-term deposits Aa2 A AA-Short-term deposits P-1 A-1 F1+Short-term notes P-1 A-1 F1
Capital ManagementWe manage our funding and capital positions by making adjustments to our balance sheet size and composition, issuing or redeeming debt, issuing equity or other capital instruments, executing treasury stock transactions and capital redemptions or repurchases, and managing dividend policies and retaining earnings.
In 2019, we returned $5.4 billion of capital to shareholders through repurchases of 25.9 million common shares for $3.5 billion and dividends on common shares of $1.9 billion.
We repurchase shares of PNC common stock under share repurchase authorization provided by our Board of Directors in the amount of up to 100 million shares and consistent with capital plans submitted to, and accepted by, the Federal Reserve. Repurchases are made on the open market or in privately negotiated transactions and the extent and timing of share repurchases under authorizations depend on a number of factors including, among others, market and general economic conditions, economic and regulatory capital considerations, alternative uses of capital, the potential impact on our credit ratings, contractual and regulatory limitations, and the results of supervisory assessments of capital adequacy and capital planning processes undertaken by the Federal Reserve and the OCC as part of the CCAR and Dodd-Frank capital stress testing (DFAST) processes.
In relation to the 2018 capital plan accepted by the Federal Reserve, we completed our share repurchase programs for the four quarter period ended June 30, 2019, with total repurchases of 21.4 million shares for $2.8 billion. Of the total repurchased, 11.9 million shares for $1.5 billion occurred in the first two quarters of 2019.
On April 4, 2019, our Board of Directors approved the establishment of a new stock repurchase program authorization in the amount of 100 million shares of PNC common stock, effective July 1, 2019. The previous 2015 authorization was terminated on June 30, 2019.
In connection with the 2019 CCAR process, we submitted our capital plan, as approved by our Board of Directors, to the Federal Reserve in April 2019. The Federal Reserve accepted the capital plan and did not object to our proposed capital actions. As provided for in the 2019 capital plan, we announced new share repurchase programs of up to $4.3 billion for the four quarter period beginning in the third quarter of 2019. In January 2020, we announced an increase to these programs of up to $1.0 billion in additional common share repurchases through the end of the second quarter of 2020. We repurchased 14.0 million common shares for $2.0 billion during the third and fourth quarters of 2019 under this share repurchase program.
The quarterly cash dividend was increased from $.95 to $1.15 per share effective with the August 5, 2019 dividend payment date.
See the Supervision and Regulation section of Item 1 Business in this Report for further information concerning the CCAR and DFAST process and the factors the Federal Reserve takes into consideration in its evaluation of capital plans.

70 The PNC Financial Services Group, Inc. – 2019 Form 10-K
Table 29: Basel III Capital
Dollars in millionsBasel III
December 31, 2019 (a)
Pro FormaBasel III (Non-GAAP)
(estimated)December 31, 2019 (b)
Common equity Tier 1 capitalCommon stock plus related surplus, net of treasury stock $ 2,307 $ 2,307Retained earnings 42,215 42,215Accumulated other comprehensive income (loss) for securities currently, and those transferredfrom, available for sale 1,067Accumulated other comprehensive income (loss) for pension and other postretirement plans
(408)Goodwill, net of associated deferred tax liabilities (9,030) (9,030)Other disallowed intangibles, net of deferred tax liabilities (224) (224)Other adjustments/(deductions) (173) (168)
Total common equity Tier 1 capital before threshold deductions 35,754 35,100Total threshold deductions (3,276)
Common equity Tier 1 capital $ 32,478 $ 35,100Additional Tier 1 capital
Preferred stock plus related surplus 3,993 3,993Other adjustments/(deductions) (165)
Tier 1 capital $ 36,306 $ 39,093Additional Tier 2 capital
Qualifying subordinated debt 3,905 4,396Trust preferred capital securities 60 60Eligible credit reserves includable in Tier 2 capital 3,060 3,060
Total Basel III capital $ 43,331 $ 46,609Risk-weighted assets
Basel III standardized approach risk-weighted assets (c) $ 340,799 $ 347,805Basel III advanced approaches risk-weighted assets (d) $ 318,722
Average quarterly adjusted total assets $ 397,446 $ 400,887Supplementary leverage exposure (e) $ 478,438 $ 482,161Basel III risk-based capital and leverage ratios (f)
Common equity Tier 1 9.5% 10.1%Tier 1 10.7% 11.2%Total (g) 12.7% 13.4%Leverage (h) 9.1% 9.8%Supplementary leverage ratio (i) 7.6% 8.1%
(a) The Basel III Common equity Tier 1 capital, Tier 1 risk-based capital, Leverage and Supplementary ratios as of December 31, 2019 reflect the full phase-in of all Basel III adjustments to these metrics applicable to PNC.
(b) Pro forma Basel III ratios are calculated as if the 2019 Tailoring Rules, and PNC's election to opt-out of the inclusion of certain elements of accumulated other comprehensive income in regulatory capital, had been in effect at December 31, 2019. We believe that the pro forma Basel III ratios are a useful tool to assess the impact to our capital position after adoption of the 2019 Tailoring Rules.
(c) Includes credit and market risk-weighted assets.(d) Basel III advanced approaches risk-weighted assets are calculated based on the Basel III advanced approaches rules, and include credit, market and operational risk-weighted
assets. (e) Supplementary leverage exposure is the sum of Adjusted average assets and certain off-balance sheet exposures including undrawn credit commitments and derivative
potential future exposures.(f) For comparative purposes only, the advanced approaches Basel III Common equity Tier 1, Tier 1 risk-based and Total risk-based ratios for December 31, 2019 were 10.2%,
11.4% and 12.7%, respectively.(g) The Basel III Total risk-based capital ratio includes $60 million of nonqualifying trust preferred capital securities that are subject to a phase-out period that runs through
2021.(h) Leverage ratio is calculated based on Tier 1 capital divided by Average quarterly adjusted total assets.(i) Supplementary leverage ratio is calculated based on Tier 1 capital divided by Supplementary leverage exposure. PNC and PNC Bank are subject to a 3% minimum
supplementary leverage ratio.
PNC’s Basel III regulatory risk-based capital ratios are calculated using the standardized approach for determining risk-weighted assets. Under the standardized approach for determining credit risk-weighted assets, exposures are generally assigned a pre-defined risk weight. Exposures to high volatility commercial real estate, past due exposures and equity exposures are generally subject to higher risk weights than other types of exposures.

The PNC Financial Services Group, Inc. – 2019 Form 10-K 71
Under the Basel III rules applicable to PNC during 2019, significant common stock investments in unconsolidated financial institutions (for PNC, primarily BlackRock), mortgage servicing rights and deferred tax assets must be deducted from common equity Tier 1 capital (net of associated deferred tax liabilities) to the extent they individually exceed 10%, or in the aggregate exceed 15%, of the institution's adjusted common equity Tier 1 capital. Also, PNC's Basel III regulatory capital during 2019 includes accumulated other comprehensive income (loss) related to securities currently, and those transferred from, available for sale, as well as pension and other postretirement plans.
As of January 1, 2020, the 2019 Tailoring Rules became effective for all bank holding companies (BHCs) with more than $100 billion in total consolidated assets, including PNC. For PNC, the most significant changes involve the election to exclude specific AOCI items from common equity Tier 1 capital and higher thresholds used to calculate common equity Tier 1 capital deductions. Effective January 1, 2020, PNC must deduct from common equity Tier 1 capital (net of associated deferred tax liabilities) significant investments in unconsolidated financial institutions (for PNC, primarily BlackRock), mortgage servicing rights and deferred tax assets to the extent such items individually exceed 25% of the institution’s adjusted common equity Tier 1 capital. See the Supervision and Regulation section in Item 1 for more detail, and Table 29 for pro forma capital ratios calculated based on if the 2019 Tailoring Rules had been in effect at December 31, 2019.
Federal banking regulators have stated that they expect the largest U.S. BHCs, including PNC, to have a level of regulatory capital well in excess of the regulatory minimum and have required the largest U.S. BHCs, including PNC, to have a capital buffer sufficient to withstand losses and allow them to meet the credit needs of their customers through estimated stress scenarios. We seek to manage our capital consistent with these regulatory principles, and believe that our December 31, 2019 capital levels were aligned with them.
At December 31, 2019, PNC and PNC Bank, our sole bank subsidiary, were both considered “well capitalized,” based on applicable U.S. regulatory capital ratio requirements. To qualify as “well capitalized”, PNC must have Basel III capital ratios of at least 6% for Tier 1 risk-based capital and 10% for Total risk-based capital, and PNC Bank must have Basel III capital ratios of at least 6.5% for Common equity Tier 1 risk-based capital, 8% for Tier 1 risk-based capital, 10% for Total risk-based capital and a Leverage ratio of at least 5%.
We provide additional information regarding regulatory capital requirements, including information on the 2019 Tailoring Rules, and some of their potential impacts on us in the Supervision and Regulation section of Item 1 Business, Item 1A Risk Factors and Note 18 Regulatory Matters in the Notes To Consolidated Financial Statements in Item 8 of this Report. See the Statistical Information (Unaudited) section in Item 8 of this Report for details on our December 31, 2017, 2016, and 2015 Transitional Basel III and Fully Phased-in Basel III Common equity Tier 1 capital ratios.
Market Risk Management
Market risk is the risk of a loss in earnings or economic value due to adverse movements in market factors such as interest rates, credit spreads, foreign exchange rates, commodity prices and equity prices. We are exposed to market risk primarily by our involvement in the following activities, among others:
• Traditional banking activities of gathering deposits and extending loans;• Equity and other investments and activities whose economic values are directly impacted by market factors; and• Fixed income securities, derivatives and foreign exchange activities, as a result of customer activities and securities
underwriting.
We have established enterprise-wide policies and methodologies to identify, measure, monitor and report market risk. Market Risk Management provides independent oversight by monitoring compliance with established guidelines and reporting significant risks in the business to the Risk Committee of the Board of Directors.
Market Risk Management – Interest Rate RiskInterest rate risk results primarily from our traditional banking activities of gathering deposits and extending loans. Many factors, including economic and financial conditions, movements in interest rates and consumer preferences, affect the difference between the interest that we earn on assets and the interest that we pay on liabilities and the level of our noninterest-bearing funding sources. Due to the repricing term mismatches and embedded options inherent in certain of these products, changes in market interest rates not only affect expected near-term earnings, but also the economic values of these assets and liabilities.
Our Asset and Liability Management group centrally manages interest rate risk as prescribed in our risk management policies, which are approved by management’s Asset and Liability Committee and the Risk Committee of the Board of Directors.

72 The PNC Financial Services Group, Inc. – 2019 Form 10-K
Sensitivity results and market interest rate benchmarks for the fourth quarters of 2019 and 2018 follow.
Table 30: Interest Sensitivity Analysis
Fourth Quarter 2019 Fourth Quarter 2018
Net Interest Income Sensitivity Simulation (a)Effect on net interest income in first year from gradual interest rate change over the following 12 months of:
100 basis point increase 1.5 % 1.7 %100 basis point decrease (2.2)% (2.2)%
Effect on net interest income in second year from gradual interest rate change over the preceding 12 months of:
100 basis point increase 3.8 % 3.7 %100 basis point decrease (6.9)% (6.2)%
Duration of Equity Model (a)Base case duration of equity (in years) (3.7) (1.0)
Key Period-End Interest RatesOne-month LIBOR 1.76 % 2.50 %Three-month LIBOR 1.91 % 2.81 %Three-year swap 1.69 % 2.59 %
(a) Given the inherent limitations in certain of these measurement tools and techniques, results become less meaningful as interest rates approach zero.
In addition to measuring the effect on net interest income assuming parallel changes in current interest rates, we routinely simulate the effects of a number of nonparallel interest rate environments. Table 31 reflects the percentage change in net interest income over the next two 12-month periods assuming (i) the PNC Economist’s most likely rate forecast, (ii) implied market forward rates and (iii) yield curve slope flattening (a 100 basis point yield curve slope flattening between one-month and ten-year rates superimposed on current base rates) scenario.
All changes in forecasted net interest income are relative to results in a base rate scenario where current market rates are assumed to remain unchanged over the forecast horizon.
Table 31: Net Interest Income Sensitivity to Alternative Rate Scenarios
December 31, 2019PNC
EconomistMarket
ForwardSlope
FlatteningFirst year sensitivity (.9)% (.4)% (1.2)%Second year sensitivity (1.7)% .2 % (5.0)%
When forecasting net interest income, we make assumptions about interest rates and the shape of the yield curve, the volume and characteristics of new business and the behavior of existing on- and off-balance sheet positions. These assumptions determine the future level of simulated net interest income in the base interest rate scenario and the other interest rate scenarios presented in Tables 30 and 31. These simulations assume that as assets and liabilities mature, they are replaced or repriced at then current market rates.

The PNC Financial Services Group, Inc. – 2019 Form 10-K 73
The following graph presents the LIBOR/Swap yield curves for the base rate scenario and each of the alternate scenarios one year forward.
Table 32: Alternate Interest Rate Scenarios: One Year Forward
The fourth quarter 2019 interest sensitivity analyses indicate that our Consolidated Balance Sheet is positioned to benefit from an increase in interest rates and an upward sloping interest rate yield curve. We believe that we have the deposit funding base and balance sheet flexibility to adjust, where appropriate and permissible, to changing interest rates and market conditions.
As discussed in Item 1A Risk Factors, the planned discontinuance of the requirement that banks submit rates for the calculation of LIBOR after 2021 presents risks to the financial instruments originated, held or serviced by PNC that use LIBOR as a reference rate. PNC holds instruments and services its instruments and instruments owned by others that may be impacted by the likely discontinuance of LIBOR, including loans, investments, hedging products, floating-rate obligations, and other financial instruments that use LIBOR as a benchmark rate.
PNC has established a cross functional governance structure to oversee the overall strategy for the transition from LIBOR and mitigate risks associated with the transition. An initial LIBOR impact and risk assessment has been performed, which identified the associated risks across products, systems, models, and processes. PNC is actively monitoring its overall firm-wide exposure to LIBOR and using these results to plan transitional strategies and track progress versus these goals. PNC is also involved in industry discussions, preparing milestones for readiness and assessing progress against those milestones along with developing and delivering on internal and external LIBOR cessation communication plans. The transition from LIBOR as an interest rate benchmark will subject PNC to financial, legal, operational, and reputational risks.
Market Risk Management – Customer-Related Trading RiskWe engage in fixed income securities, derivatives and foreign exchange transactions to support our customers’ investing and hedging activities. These transactions, related hedges and the credit valuation adjustment related to our customer derivatives portfolio are marked-to-market daily and reported as customer-related trading activities. We do not engage in proprietary trading of these products.
We use value-at-risk (VaR) as the primary means to measure and monitor market risk in customer-related trading activities. VaR is used to estimate the probability of portfolio losses based on the statistical analysis of historical market risk factors. A diversified VaR reflects empirical correlations across different asset classes. We calculate a diversified VaR at a 95% confidence interval and the results for 2019 and 2018 were within our acceptable limits.
To help ensure the integrity of the models used to calculate VaR for each portfolio and enterprise-wide, we use a process known as backtesting. The backtesting process consists of comparing actual observations of gains or losses against the VaR levels that were calculated at the close of the prior day. Our VaR measure assumes that exposures remain constant and that recent market variability is a good predictor of future variability. Actual observations include customer related revenue and intraday hedging which helps to reduce losses and can reduce the number of instances actual losses exceed the prior day VaR measure. There were minimal instances during 2019 and 2018 under our diversified VaR measure where actual losses exceeded the prior day VaR measure and those losses were insignificant. Our portfolio and enterprise-wide VaR models utilize a historical approach with a 500 day look back period.
Customer-related trading revenue was $285 million in 2019 compared with $248 million in 2018 and is recorded in Other noninterest income and Other interest income on our Consolidated Income Statement. The increase was primarily due to higher derivative client sales revenues and improved client related trading results, which was partially offset by lower foreign exchange client revenues.

74 The PNC Financial Services Group, Inc. – 2019 Form 10-K
Market Risk Management – Equity And Other Investment RiskEquity investment risk is the risk of potential losses associated with investing in both private and public equity markets. In addition to extending credit, taking deposits, underwriting securities and trading financial instruments, we make and manage direct investments in a variety of transactions, including management buyouts, recapitalizations and growth financings in a variety of industries. We also have investments in affiliated and non-affiliated funds that make similar investments in private equity. The economic and/or book value of these investments and other assets are directly affected by changes in market factors.
Various PNC business units manage our equity and other investment activities. Our businesses are responsible for making investment decisions within the approved policy limits and associated guidelines.
A summary of our equity investments follows:
Table 33: Equity Investments Summary
Dollars in millionsDecember 31
2019December 31
2018Change
$ %BlackRock $ 8,558 $ 8,016 $ 542 7%Tax credit investments 2,218 2,219 (1) —Private equity and other 2,958 2,659 299 11%
Total $ 13,734 $ 12,894 $ 840 7%
BlackRockWe owned approximately 35 million common stock equivalent shares of BlackRock equity at December 31, 2019, accounted for under the equity method. The Business Segments Review section of this Item 7 includes additional information about BlackRock.
Tax Credit InvestmentsIncluded in our equity investments are direct tax credit investments and equity investments held by consolidated entities. These tax credit investment balances included unfunded commitments totaling $1.0 billion and $.8 billion at December 31, 2019 and 2018, respectively. These unfunded commitments are included in Other liabilities on our Consolidated Balance Sheet.
Note 2 Loan Sale and Servicing Activities and Variable Interest Entities in the Notes To Consolidated Financial Statements in Item 8 of this Report has further information on tax credit investments.
Private Equity and OtherThe majority of our other equity investments consists of our private equity portfolio. The private equity portfolio is an illiquid portfolio consisting of mezzanine and equity investments that vary by industry, stage and type of investment. Private equity investments carried at estimated fair value totaled $1.5 billion at December 31, 2019 and 2018, respectively. As of December 31, 2019, $1.3 billion was invested directly in a variety of companies and $.2 billion was invested indirectly through various private equity funds. See the Supervision and Regulation section in Item 1 of this Report for discussion of the potential impacts of the Volcker Rule on our interests in and of private funds covered by the Volcker Rule.
Included in our other equity investments are Visa Class B common shares, which are recorded at cost. Visa Class B common shares that we own are transferable only under limited circumstances until they can be converted into shares of the publicly-traded Class A common shares, which cannot happen until the resolution of the pending interchange litigation. Based upon the December 31, 2019 per share closing price of $187.90 for a Visa Class A common share, the estimated value of our total investment in the Class B common shares was approximately $1.1 billion at the current conversion rate of Visa B shares to Visa A shares, while our cost basis was not significant. See Note 6 Fair Value and Note 19 Legal Proceedings in the Notes To Consolidated Financial Statements in Item 8 of this Report for additional information regarding our Visa agreements. The estimated value does not represent fair value of the Visa B common shares given the shares' limited transferability and the lack of observable transactions in the marketplace.
We also have certain other equity investments, the majority of which represent investments in affiliated and non-affiliated funds with both traditional and alternative investment strategies. Net gains related to these investments were not significant during 2019 and 2018.
Impact of InflationOur assets and liabilities are primarily financial in nature and typically have varying maturity dates. Accordingly, future changes in prices do not affect the obligations to pay or receive fixed and determinable amounts of money. However, during periods of inflation, there may be a subsequent impact affecting certain fixed costs or expenses, an erosion of consumer and customer purchasing power, and fluctuations in the need or demand for our products and services. Should significant levels of inflation occur, our business could

The PNC Financial Services Group, Inc. – 2019 Form 10-K 75
potentially be impacted by, among other things, reducing our tolerance for extending credit or causing us to incur additional credit losses resulting from possible increased default rates.
Financial DerivativesWe use a variety of financial derivatives to both mitigate exposure to market (primarily interest rate) and credit risks inherent in our business activities, as well as to facilitate customer risk management activities. We manage these risks as part of our overall asset and liability management process and through our credit policies and procedures.
Financial derivatives involve, to varying degrees, market and credit risk. Derivatives represent contracts between parties that usually require little or no initial net investment and result in one party delivering cash or another type of asset to the other party based on a notional and an underlying as specified in the contract. Therefore, cash requirements and exposure to credit risk are significantly less than the notional amount on these instruments.
Further information on our financial derivatives is presented in Note 1 Accounting Policies, Note 6 Fair Value and Note 13 Financial Derivatives in the Notes To Consolidated Financial Statements in Item 8 of this Report.
Not all elements of market and credit risk are addressed through the use of financial derivatives, and such instruments may be ineffective for their intended purposes due to unanticipated market changes, among other reasons.
Operational Risk Management
Operational risk is the risk to the current or projected financial condition and resilience arising from inadequate or failed internal processes or systems, human errors or misconduct, or adverse external events. Operational risk is inherent to the entire organization.
Operational risk management is embedded in our culture and decision-making processes through a systematic approach whereby operational risks and exposures are: 1) identified and assessed; 2) managed through the design and implementation of controls; 3) measured and evaluated against our risk tolerance limits; and 4) appropriately reported to management and the Risk Committee. Strong operational risk management and well-informed risk-based decisions benefit us by improving the customer experience, enhancing compliance, reducing reputational risk, minimizing losses and establishing an appropriate amount of required operational risk capital held by us.
The Operational Risk Management Framework is designed to provide effective and consistent management of operational risk. The primary purpose of the framework is to enable us to understand our operational risks and manage them to the desired risk profile, in line with our Risk Appetite. Additionally, the guidance established within the framework enables management to make well-informed risk-based business decisions.
The framework provides a disciplined and structured process for us to manage operational risk across eight operational risk domains. These domains provide a comprehensive view of operational risk and allow us to discuss operational risk in a standard way, facilitating reporting and ongoing risk mitigation.
The operational risk domains are:• Operations: Risk resulting from inadequate or failed internal processes, misconduct or errors of people or fraud.• Compliance: Risk of legal or regulatory sanctions, financial loss, or damage to reputation resulting from failure to comply
with laws, regulations, rules, self-regulatory standards, or other regulatory requirements.• Data Management: Risk associated with incomplete or inaccurate data.• Model: Risk associated with the design, implementation, and ongoing use and management of a model.• Technology and Systems: Risk associated with the use, operation, and adoption of technology.• Information Security: Risk resulting from the failure to protect information and ensure appropriate access to, and use and
handling of information assets.• Business Continuity: Risk of potential disruptive events to business activities.• Third Party: Risk arising from failure of third party providers to conduct activity in a safe and sound manner and in
compliance with contract provisions and applicable laws and regulations.
We utilize operational risk management programs within the framework, including Risk Control and Self-Assessments, scenario analysis, and internal and external loss event review and analysis, to assess existing risks, determine potential/emerging risks and evaluate the effectiveness of internal controls. The program tools and methodology enable our business managers to identify potential risks and control gaps.
Lines of business are responsible for identifying, owning, managing and monitoring the operational risks and controls associated with its business activities and product or service offerings to within acceptable levels. Centralized functions, such as Business Continuity, Enterprise Third Party Management, and Information Security, are responsible for the development, implementation and management

76 The PNC Financial Services Group, Inc. – 2019 Form 10-K
of their individual programs and for the development and maintenance of the policies, procedures, methodologies, tools and technology utilized across the enterprise to identify, assess, monitor and report program risks. Additionally, independent risk management reviews and challenges line of business adherence to the framework to ensure proper controls are in place and appropriate risk mitigation plans are established as necessary.
Conduct, Reputational and Strategic RiskPNC’s risk culture seeks to reinforce the appropriate protocols for responsible and ethical behavior through sound processes and controls. In order to promote a robust risk culture, the Board and executive management establish code of conduct and professional standards to which all employees must adhere. A strong risk culture discourages misconduct and supports Conduct Risk management at PNC. Conduct Risk is defined as the risk that employees fail to comply with the ethical standards expected of them. Strong Conduct Risk management is important in supporting PNC’s reputation and PNC maintains a corporate culture that emphasizes complying with laws, regulations, and managing reputational risks. Reputational Risk is the risk to the franchise and/or shareholder value based on a negative perception of PNC by its stakeholders and/or the changing expectations of its stakeholders. While managing PNC’s reputation preserves PNC’s brand value, Strategic Risk is another component of the ERM Framework that is also critical to optimizing shareholder returns. Strategic Risk is the risk to earnings that may arise from adverse business decisions, improper implementation of business decisions and/or inadequate response to changes in the business environment. Strategic Risk is considered and assessed by our businesses in the annual strategic planning processes and monitored on an on-going basis as those plans are carried out.
Compliance RiskEnterprise Compliance is responsible for oversight of compliance risk for the organization. Compliance issues are identified and tracked through enterprise-wide monitoring and testing activities. Compliance risk issues are escalated through a comprehensive risk reporting process at both a business and enterprise level and incorporated, as appropriate, into the development and assessment of our operational risk profile. A management committee, co-chaired by the Chief Compliance Officer and the Chief Bank Secrecy Act (BSA)/Anti-Money Laundering (AML) Officer, is responsible for oversight of compliance and fiduciary risk management programs across PNC. Enterprise Compliance, through the Regulatory Change Program, helps PNC understand and proactively address emerging regulatory topics and risks as well as respond to changes in applicable laws and regulations. To understand emerging issues impacting the industry, Enterprise Compliance communicates regularly with various regulators having supervisory or regulatory responsibilities with respect to us, our subsidiaries, or businesses and participates in forums focused on regulatory and compliance matters in the financial services industry.
Information Security RiskThe Information Security component of our Operational Risk Management Framework is responsible for protecting information assets to achieve business objectives, which includes cyber security. PNC’s cyber security program is designed to identify risks to sensitive information, protect that information, detect threats and events, and maintain an appropriate response and recovery capability to help ensure resilience against information security incidents. The program includes, among other things, annual security and privacy training for all PNC employees and quarterly phishing exercises to raise employee awareness. Our security program is also regularly examined by federal regulators for compliance with financial regulations and standards. The program also establishes expectations for information asset management, system development security, identity and access management, incident management, threat and vulnerability management, security operations management, and third and fourth party security.
CRITICAL ACCOUNTING ESTIMATES AND JUDGMENTS
Our consolidated financial statements are prepared by applying certain accounting policies. Note 1 Accounting Policies in the Notes To Consolidated Financial Statements in Item 8 of this Report describes the most significant accounting policies that we use. Certain of these policies require us to make estimates or economic assumptions that may vary under different assumptions or conditions and such variations may significantly affect our reported results and financial position for the period or in future periods.
Fair Value Measurements
We must use estimates, assumptions and judgments when assets and liabilities are required to be recorded at, or adjusted to reflect, fair value. Assets and liabilities carried at fair value inherently result in a higher degree of financial statement volatility. Fair values and the information used to record valuation adjustments for certain assets and liabilities are based on either quoted market prices or are provided by independent third-party sources, including appraisers and valuation specialists, when available. When such third-party information is not available, we estimate fair value primarily by using cash flow and other financial modeling techniques. Changes in underlying factors, assumptions, or estimates in any of these areas could materially impact our future financial condition and results of operations.
We apply ASC 820 – Fair Value Measurements. This guidance defines fair value as the price that would be received to sell a financial asset or paid to transfer a financial liability in an orderly transaction between market participants at the measurement date. This guidance requires a three level hierarchy for disclosure of assets and liabilities recorded at fair value. The classification of assets and

The PNC Financial Services Group, Inc. – 2019 Form 10-K 77
liabilities within the hierarchy is based on whether the inputs to the valuation methodology used in the measurement are observable or unobservable. Level 3 assets and liabilities are those where the fair value is estimated using significant unobservable inputs.
For additional information on fair value measurements, see Note 6 Fair Value in the Notes To Consolidated Financial Statements in Item 8 of this Report.
Allowances for Loan and Lease Losses and Unfunded Loan Commitments and Letters of Credit
On January 1, 2020 we adopted Accounting Standards Update (ASU) 2016-13 - Credit Losses (CECL). The following discussion refers to our Allowance for Loan and Lease Losses and Unfunded Loan Commitments and Letters of Credit prior to the adoption. For additional information on our implementation of CECL refer to Note 1 Accounting Policies in Item 8 of this Report.
We maintain the ALLL and the Allowance for Unfunded Loan Commitments and Letters of Credit at levels that we believe to be appropriate to absorb estimated probable credit losses incurred in the loan and lease portfolios and on these unfunded credit facilities as of the balance sheet date. Our determination of the allowances is based on periodic evaluations of the loan and lease portfolios and unfunded credit facilities and other relevant factors. These critical estimates include significant use of our own historical data and complex methods to interpret them. We have an ongoing process to evaluate and enhance the quality, quantity and timeliness of our data and interpretation methods used in the determination of these allowances. These evaluations are inherently subjective, as they require material estimates and may be susceptible to significant change, and include, among others:
• Probability of default (PD);• Loss given default (LGD);• Exposure at default;• Movement through delinquency stages;• Amounts and timing of expected future cash flows;• Value of collateral; and• Qualitative factors, such as changes in current economic conditions, that may not be reflected in modeled results. For all
loans, the ALLL is the sum of three components: (i) asset specific/individual impaired reserves, (ii) quantitative (formulaic or pooled) reserves and (iii) qualitative (judgmental) reserves.
The reserve calculation and determination process is dependent on the use of key assumptions. Key reserve assumptions and estimation processes react to and are influenced by observed changes in loan portfolio performance experience, the financial strength of the borrower, and economic conditions. For unfunded commitments, the reserve estimate also includes estimation of the probability of funding. Key reserve assumptions are periodically updated.
To the extent actual outcomes differ from our estimates, additional provision for credit losses may be required that would reduce future earnings. See the following for additional information:
• Allowances For Loan And Lease Losses And Unfunded Loan Commitments And Letters Of Credit in the Credit Risk Management section of this Item 7; and
• Note 1 Accounting Policies and Note 4 Allowance for Loan and Lease Losses in the Notes To Consolidated Financial Statements and Allocation of Allowance for Loan and Lease Losses in the Statistical Information (Unaudited) section of Item 8 of this Report.
Residential and Commercial Mortgage Servicing Rights
We elect to measure our residential and commercial mortgage servicing rights (MSRs) at fair value. This election was made to be consistent with our risk management strategy to hedge changes in the fair value of these assets. The fair value of residential and commercial MSRs is estimated by using a discounted cash flow valuation model which calculates the present value of estimated future net servicing cash flows, taking into consideration actual and expected mortgage loan prepayment rates, discount rates, servicing costs, and other factors which are determined based on current market conditions.
We employ risk management strategies designed to protect the value of MSRs from changes in interest rates and related market factors. The values of the residential and commercial MSRs are economically hedged with securities and derivatives, including interest-rate swaps, options, and forward mortgage-backed and futures contracts. As interest rates change, these financial instruments are expected to have changes in fair value negatively correlated to the change in fair value of the hedged MSR portfolios. The hedge relationships are actively managed in response to changing market conditions over the life of the MSRs. Selecting appropriate financial instruments to economically hedge residential or commercial MSRs requires significant management judgment to assess how mortgage rates and prepayment speeds could affect the future values of MSRs. Hedging results can frequently be less predictable in the short term, but over longer periods of time are expected to protect the economic value of the MSRs.
For additional information on our residential and commercial MSRs, see Note 6 Fair Value and Note 7 Goodwill and Mortgage Servicing Rights in the Notes To Consolidated Financial Statements in Item 8 of this Report.

78 The PNC Financial Services Group, Inc. – 2019 Form 10-K
Recently Issued Accounting Standards
AccountingStandards
Update (ASU) Description Financial Statement ImpactGoodwill - ASU 2017-04
Issued January 2017
• Required effective date of January 1, 2020.• Eliminates Step 2 from the goodwill impairment test to
simplify the subsequent measurement of goodwill under which a loss was recognized only if the estimated implied fair value of the goodwill is below its carrying value.
• Requires impairment to be recognized if the reporting unit's carrying value exceeds the fair value.
• We adopted this standard on January 1, 2020.• We do not expect the adoption of this standard to impact our
consolidated results of operations or our consolidated financial position.
Recently Adopted Accounting Pronouncements
See Note 1 Accounting Policies in the Notes To Consolidated Financial Statements in Item 8 of this Report regarding the impact of new accounting pronouncements which we have adopted.
OFF-BALANCE SHEET ARRANGEMENTS AND VARIABLE INTEREST ENTITIES
We engage in a variety of activities that involve entities that are not consolidated or otherwise reflected in our Consolidated Balance Sheet that are generally referred to as “off-balance sheet arrangements.” Additional information on these types of activities is included in the following sections of this Report:
• Contractual Obligations and Commitments included within the Risk Management section of this Item 7; and• Note 2 Loan Sale and Servicing Activities and Variable Interest Entities;• Note 10 Borrowed Funds;• Note 15 Equity; and• Note 20 Commitments, all of which are in the Notes To Consolidated Financial Statements included in Item 8 of this Report.
A summary and further description of variable interest entities (VIEs) as of December 31, 2019 and 2018 is included in Note 1 Accounting Policies and Note 2 Loan Sale and Servicing and Variable Interest Entities in the Notes To Consolidated Financial Statements included in Item 8 of this Report.
Trust Preferred Securities
See Note 10 Borrowed Funds in the Notes To Consolidated Financial Statements in Item 8 of this Report for additional information on trust preferred securities issued by PNC Capital Trust C including information on contractual limitations potentially imposed on payments (including dividends) with respect to PNC's equity securities.
GLOSSARY OF TERMS
Adjusted average total assets – Primarily consisted of total average quarterly (or annual) assets plus/less unrealized losses (gains) on investment securities, less goodwill and certain other intangible assets (net of eligible deferred taxes).
Basel III common equity Tier 1 capital – Common stock plus related surplus, net of treasury stock, plus retained earnings, plus accumulated other comprehensive income for securities currently, and those transferred from, available for sale and pension and other postretirement benefit plans, subject to phase-in limits, less goodwill, net of associated deferred tax liabilities, less other disallowed intangibles, net of deferred tax liabilities and plus/less other adjustments. Significant common stock investments in unconsolidated financial institutions, as well as mortgage servicing rights and deferred tax assets, must then be deducted to the extent such items individually exceed 10%, or in the aggregate exceed 15%, of our adjusted Basel III common equity Tier 1 capital.
Basel III common equity Tier 1 capital ratio – Common equity Tier 1 capital divided by period-end risk-weighted assets (as applicable).
Basel III Tier 1 capital – Common equity Tier 1 capital, plus qualifying preferred stock, plus certain trust preferred capital securities, plus certain noncontrolling interests that are held by others and plus/less other adjustments.
Basel III Tier 1 capital ratio – Tier 1 capital divided by period-end risk-weighted assets (as applicable).
Basel III Total capital – Tier 1 capital plus qualifying subordinated debt, plus certain trust preferred securities, plus, under the Basel III transitional rules and the standardized approach, the allowance for loan and lease losses included in Tier 2 capital and other.
Basel III Total capital ratio – Basel III Total capital divided by period-end risk-weighted assets (as applicable).

The PNC Financial Services Group, Inc. – 2019 Form 10-K 79
Charge-off – Process of removing a loan or portion of a loan from our balance sheet because it is considered uncollectible. We also record a charge-off when a loan is transferred from portfolio holdings to held for sale by reducing the loan carrying amount to the fair value of the loan, if fair value is less than carrying amount.
Combined loan-to-value ratio (CLTV) – This is the aggregate principal balance(s) of the mortgages on a property divided by its appraised value or purchase price.
Common shareholders’ equity – Total shareholders’ equity less the liquidation value of preferred stock.
Credit valuation adjustment – Represents an adjustment to the fair value of our derivatives for our own and counterparties’ non-performance risk.
Criticized commercial loans – Loans with potential or identified weaknesses based upon internal risk ratings that comply with the regulatory classification definitions of “Special Mention,” “Substandard” or “Doubtful.”
Discretionary client assets under management – Assets over which we have sole or shared investment authority for our customers/clients. We do not include these assets on our Consolidated Balance Sheet. Duration of equity – An estimate of the rate sensitivity of our economic value of equity. A negative duration of equity is associated with asset sensitivity (i.e., positioned for rising interest rates), while a positive value implies liability sensitivity (i.e., positioned for declining interest rates). For example, if the duration of equity is -1.5 years, the economic value of equity increases by 1.5% for each 100 basis point increase in interest rates.
Earning assets – Assets that generate income, which include: interest-earning deposits with banks; loans held for sale; loans; investment securities; and certain other assets.
Effective duration – A measurement, expressed in years, that, when multiplied by a change in interest rates, would approximate the percentage change in value of on- and off- balance sheet positions.
Efficiency – Noninterest expense divided by total revenue.
Fair value – The price that would be received to sell an asset or paid to transfer a liability in an orderly transaction between market participants at the measurement date.
Fee income – Refers to the following categories within Noninterest income: Asset management; Consumer services; Corporate services; Residential mortgage; and Service charges on deposits.
FICO score – A credit bureau-based industry standard score created by Fair Isaac Co. which predicts the likelihood of borrower default. We use FICO scores both in underwriting and assessing credit risk in our consumer lending portfolio. Lower FICO scores indicate likely higher risk of default, while higher FICO scores indicate likely lower risk of default. FICO scores are updated on a periodic basis.
Foreign exchange contracts – Contracts that provide for the future receipt and delivery of foreign currency at previously agreed-upon terms.
Futures and forward contracts – Contracts in which the buyer agrees to purchase and the seller agrees to deliver a specific financial instrument at a predetermined price or yield. May be settled either in cash or by delivery of the underlying financial instrument.
GAAP – Accounting principles generally accepted in the United States of America.
Home price index (HPI) – A broad measure of the movement of single-family house prices in the U.S.
Impaired loans – Loans are determined to be impaired when, based on current information and events, it is probable that all contractually required payments will not be collected. Impaired loans include commercial nonperforming loans and consumer and commercial TDRs, regardless of nonperforming status. Excluded from impaired loans are nonperforming leases, loans held for sale, loans accounted for under the fair value option, smaller balance homogenous type loans and purchased impaired loans.
Interest rate swap contracts – Contracts that are entered into primarily as an asset/liability management strategy to reduce interest rate risk. Interest rate swap contracts are exchanges of interest rate payments, such as fixed-rate payments for floating-rate payments, based on notional principal amounts.

80 The PNC Financial Services Group, Inc. – 2019 Form 10-K
Intrinsic value – The difference between the price, if any, required to be paid for stock issued pursuant to an equity compensation arrangement and the fair market value of the underlying stock.
Leverage ratio – Basel III Tier 1 capital divided by average quarterly adjusted total assets.
LIBOR – Acronym for London InterBank Offered Rate. LIBOR is the average interest rate charged when banks in the London wholesale money market (or interbank market) borrow unsecured funds from each other. LIBOR rates are used as a benchmark for interest rates on a global basis. Our product set includes loans priced using LIBOR as a benchmark.
Loan-to-value ratio (LTV) – A calculation of a loan’s collateral coverage that is used both in underwriting and assessing credit risk in our lending portfolio. LTV is the sum total of loan obligations secured by collateral divided by the market value of that same collateral. Market value of the collateral is based on an independent valuation of the collateral. For example, a LTV of less than 90% is better secured and has less credit risk than a LTV of greater than or equal to 90%.
Loss given default (LGD) – An estimate of loss, net of recovery, based on collateral type, collateral value, loan exposure and other factors. Each loan has its own LGD. The LGD risk rating measures the percentage of exposure of a specific credit obligation that we expect to lose if default occurs. LGD is net of recovery, through any means, including but not limited to the liquidation of collateral or deficiency judgments rendered from foreclosure or bankruptcy proceedings.
Nonaccrual loans – Loans for which we do not accrue interest income. Nonaccrual loans include nonperforming loans, in addition to loans accounted for under fair value option and loans accounted for as held for sale for which full collection of contractual principal and/or interest is not probable.
Nondiscretionary client assets under administration – Assets we hold for our customers/clients in a nondiscretionary, custodial capacity. We do not include these assets on our Consolidated Balance Sheet. Nonperforming assets – Nonperforming assets include nonperforming loans, OREO and foreclosed assets. We do not accrue interest income on assets classified as nonperforming.
Nonperforming loans – Loans accounted for at amortized cost whose credit quality has deteriorated to the extent that full collection of contractual principal and interest is not probable, including TDRs which have not returned to performing status. Interest income is not recognized on nonperforming loans. Nonperforming loans exclude certain government insured or guaranteed loans for which we expect to collect substantially all principal and interest, loans held for sale, loans accounted for under the fair value option and purchased impaired loans. Purchased impaired loans are excluded as we are currently accreting interest income over the expected life of the loans.
Notional amount – A number of currency units, shares or other units specified in a derivative contract.
Operating leverage – The period to period dollar or percentage change in total revenue less the dollar or percentage change in noninterest expense. A positive variance indicates that revenue growth exceeded expense growth (i.e., positive operating leverage) while a negative variance implies expense growth exceeded revenue growth (i.e., negative operating leverage).
Options – Contracts that grant the purchaser, for a premium payment, the right, but not the obligation, to either purchase or sell the associated financial instrument at a set price during a specified period or at a specified date in the future.
Other real estate owned (OREO) and foreclosed assets –Assets taken in settlement of troubled loans primarily through deed-in-lieu of foreclosure or foreclosure. Foreclosed assets include real and personal property. Certain assets that have a government-guarantee which are classified as other receivables are excluded.
Probability of default (PD) – An internal risk rating that indicates the likelihood that a credit obligor will enter into default status.
Recovery – Cash proceeds received on a loan that we had previously charged off. We credit the amount received to the allowance for loan and lease losses.
Risk – The potential that an event or series of events could occur that would threaten our ability to achieve our strategic objectives, thereby negatively affecting shareholder value or reputation.
Risk appetite – A dynamic, forward-looking view on the aggregate amount of risk we are willing and able to take in executing business strategy in light of the current business environment.

The PNC Financial Services Group, Inc. – 2019 Form 10-K 81
Risk limits – Quantitative measures based on forward-looking assumptions that allocate our aggregate risk appetite (e.g., measure of loss or negative events) to business lines, legal entities, specific risk categories, concentrations and as appropriate, other levels.
Risk profile – The risk profile is a point-in-time assessment of risk. The profile represents overall risk position in relation to the desired risk appetite. The determination of the risk profile’s position is based on qualitative and quantitative analysis of reported risk limits, metrics, operating guidelines and qualitative assessments.
Risk-weighted assets – Computed by the assignment of specific risk-weights (as defined by the Board of Governors of the Federal Reserve System) to assets and off-balance sheet instruments.
SOFR - Acronym for Secured Overnight Financing Rate. SOFR is a reference rate that is based on overnight transactions in the U.S. Treasury repurchase market.
Servicing rights – An intangible asset or liability created by an obligation to service assets for others. Typical servicing rights include the right to receive a fee for collecting and forwarding payments on loans and related taxes and insurance premiums held in escrow.
Supplementary leverage exposure - The sum of adjusted average assets and certain off-balance sheet exposures, including undrawn credit commitments and derivative potential future exposures.
Supplementary leverage ratio – Basel III Tier 1 capital divided by Supplementary leverage exposure.
Taxable-equivalent interest income – The interest income earned on certain assets that is completely or partially exempt from federal income tax. These tax-exempt instruments typically yield lower returns than taxable investments. To provide more meaningful comparisons of yields and margins for all interest-earning assets, we use interest income on a taxable-equivalent basis in calculating average yields and net interest margins by increasing the interest income earned on tax-exempt assets to make it fully equivalent to interest income earned on other taxable investments. This adjustment is not permitted under GAAP on the Consolidated Income Statement.
Transitional Basel III common equity Tier 1 capital – Common equity Tier 1 capital calculated under Basel III using phased-in definitions and deductions applicable to us during the related presentation period and standardized approach risk-weighted assets.
Troubled debt restructuring (TDR) – A loan whose terms have been restructured in a manner that grants a concession to a borrower experiencing financial difficulties.
Value-at-risk (VaR) – A statistically-based measure of risk that describes the amount of potential loss which may be incurred due to adverse market movements. The measure is of the maximum loss which should not be exceeded on 95 out of 100 days for a 95% VaR.
Yield curve – A graph showing the relationship between the yields on financial instruments or market indices of the same credit quality with different maturities. For example, a “normal” or “positive” yield curve exists when long-term bonds have higher yields than short-term bonds. A “flat” yield curve exists when yields are the same for short-term and long-term bonds. A “steep” yield curve exists when yields on long-term bonds are significantly higher than on short-term bonds. An “inverted” or “negative” yield curve exists when short-term bonds have higher yields than long-term bonds.
CAUTIONARY STATEMENT REGARDING FORWARD-LOOKING INFORMATIONWe make statements in this Report, and we may from time to time make other statements, regarding our outlook for earnings, revenues, expenses, tax rates, capital and liquidity levels and ratios, asset levels, asset quality, financial position, and other matters regarding or affecting us and our future business and operations that are forward-looking statements within the meaning of the Private Securities Litigation Reform Act. Forward-looking statements are typically identified by words such as “believe,” “plan,” “expect,” “anticipate,” “see,” “look,” “intend,” “outlook,” “project,” “forecast,” “estimate,” “goal,” “will,” “should” and other similar words and expressions.
Forward-looking statements are necessarily subject to numerous assumptions, risks and uncertainties, which change over time. Future events or circumstances may change our outlook and may also affect the nature of the assumptions, risks and uncertainties to which our forward-looking statements are subject. Forward-looking statements speak only as of the date made. We do not assume any duty and do not undertake to update forward-looking statements. Actual results or future events could differ, possibly materially, from those anticipated in forward-looking statements, as well as from historical performance. As a result, we caution against placing undue reliance on any forward-looking statements.
82 The PNC Financial Services Group, Inc. – 2019 Form 10-K
Our forward-looking statements are subject to the following principal risks and uncertainties.• Our businesses, financial results and balance sheet values are affected by business and economic conditions, including the
following:– Changes in interest rates and valuations in debt, equity and other financial markets.– Disruptions in the U.S. and global financial markets.– Actions by the Federal Reserve Board, U.S. Treasury and other government agencies, including those that impact money
supply and market interest rates.– Changes in customer behavior due to changing business and economic conditions or legislative or regulatory initiatives.– Changes in customers’, suppliers’ and other counterparties’ performance and creditworthiness.– Impacts of tariffs and other trade policies of the U.S. and its global trading partners.– Slowing or reversal of the current U.S. economic expansion.– Commodity price volatility.Our forward-looking financial statements are subject to the risk that economic and financial market conditions will be substantially different than those we are currently expecting and do not take into account potential legal and regulatory contingencies. These statements are based on our views that:– The U.S. economy grew at a solid pace in 2019 albeit more slowly than in 2018. Economic growth is expected to slow
noticeably in 2020. – Job growth will continue in 2020, but at a slower pace from 2019 due to both difficulty in finding workers and slower
economic growth. The unemployment rate is expected to remain near its current level in the near term, but the labor market will remain tight, pushing wages higher and supporting continued gains in consumer spending.
– Inflation is expected to continue to slow in the near term because of lower commodity prices associated with coronavirus. Inflation is expected to gradually increase in 2021.
– Our current baseline forecast expects the federal funds rate to remain unchanged in 2020. The federal funds rate is modestly positive for near-term economic growth in its current range of 1.50% to 1.75%.
• Near-term risks are to the downside, including a further softening in the global economy, perhaps due to coronavirus; a further escalation in trade tensions; and geopolitical concerns. The federal funds rate is more likely to end 2020 below its current range than above it. But there are some upside opportunities as well, such as a comprehensive U.S.-China trade deal and stronger labor force growth.
• PNC’s ability to take certain capital actions, including returning capital to shareholders, is subject to review by the Federal Reserve Board as part of PNC’s comprehensive capital plan for the applicable period in connection with the Federal Reserve Board’s Comprehensive Capital Analysis and Review (CCAR) process and to the acceptance of such capital plan and non-objection to such capital actions by the Federal Reserve Board.
• PNC’s regulatory capital ratios in the future will depend on, among other things, the company’s financial performance, the scope and terms of final capital regulations then in effect and management actions affecting the composition of PNC’s balance sheet. In addition, PNC’s ability to determine, evaluate and forecast regulatory capital ratios, and to take actions (such as capital distributions) based on actual or forecasted capital ratios, will be dependent at least in part on the development, validation and regulatory review of related models.
• Legal and regulatory developments could have an impact on our ability to operate our businesses, financial condition, results of operations, competitive position, reputation, or pursuit of attractive acquisition opportunities. Reputational impacts could affect matters such as business generation and retention, liquidity, funding, and ability to attract and retain management. These developments could include:– Changes to laws and regulations, including changes affecting oversight of the financial services industry, consumer
protection, bank capital and liquidity standards, pension, bankruptcy and other industry aspects, and changes in accounting policies and principles.
– Unfavorable resolution of legal proceedings or other claims and regulatory and other governmental investigations or other inquiries. These matters may result in monetary judgments or settlements or other remedies, including fines, penalties, restitution or alterations in our business practices, and in additional expenses and collateral costs, and may cause reputational harm to PNC.
– Results of the regulatory examination and supervision process, including our failure to satisfy requirements of agreements with governmental agencies.
– Impact on business and operating results of any costs associated with obtaining rights in intellectual property claimed by others and of adequacy of our intellectual property protection in general.
• Business and operating results are affected by our ability to identify and effectively manage risks inherent in our businesses, including, where appropriate, through effective use of systems and controls, third-party insurance, derivatives, and capital management techniques, and to meet evolving regulatory capital and liquidity standards.
• Business and operating results also include impacts relating to our equity interest in BlackRock, Inc. and rely to a significant extent on information provided to us by BlackRock. Risks and uncertainties that could affect BlackRock are discussed in more detail by BlackRock in its SEC filings.
• We grow our business in part through acquisitions and new strategic initiatives. Risks and uncertainties include those presented by the nature of the business acquired and strategic initiative, including in some cases those associated with our

The PNC Financial Services Group, Inc. – 2019 Form 10-K 83
entry into new businesses or new geographic or other markets and risks resulting from our inexperience in those new areas, as well as risks and uncertainties related to the acquisition transactions themselves, regulatory issues, and the integration of the acquired businesses into PNC after closing.
• Competition can have an impact on customer acquisition, growth and retention and on credit spreads and product pricing, which can affect market share, deposits and revenues. Our ability to anticipate and respond to technological changes can also impact our ability to respond to customer needs and meet competitive demands.
• Business and operating results can also be affected by widespread natural and other disasters, pandemics, dislocations, terrorist activities, system failures, security breaches, cyberattacks or international hostilities through impacts on the economy and financial markets generally or on us or our counterparties specifically.
We provide greater detail regarding these as well as other factors in this Report, including in Item 1A Risk Factors, the Risk Management section of Item 7, and Note 19 Legal Proceedings and Note 20 Commitments in the Notes To Consolidated Financial Statements in Item 8 of this Report. Our forward-looking statements may also be subject to other risks and uncertainties, including those discussed elsewhere in this Report or in our other filings with the SEC.
ITEM 7A – QUANTITATIVE AND QUALITATIVE DISCLOSURES ABOUT MARKET RISK This information is set forth in the Risk Management section of Item 7 and in Note 1 Accounting Policies, Note 6 Fair Value and Note 13 Financial Derivatives in the Notes To Consolidated Financial Statements in Item 8 of this Report.

84 The PNC Financial Services Group, Inc. – 2019 Form 10-K
ITEM 8 – FINANCIAL STATEMENTS AND SUPPLEMENTARY DATA
REPORT OF INDEPENDENT REGISTERED PUBLIC ACCOUNTING FIRMTo the Board of Directors and Shareholders of The PNC Financial Services Group, Inc.
Opinions on the Financial Statements and Internal Control over Financial Reporting
We have audited the accompanying consolidated balance sheets of The PNC Financial Services Group, Inc. and its subsidiaries (the “Company”) as of December 31, 2019 and 2018, and the related consolidated statements of income, comprehensive income, changes in equity and cash flows for each of the three years in the period ended December 31, 2019, including the related notes (collectively referred to as the “consolidated financial statements”). We also have audited the Company's internal control over financial reporting as of December 31, 2019, based on criteria established in Internal Control - Integrated Framework (2013) issued by the Committee of Sponsoring Organizations of the Treadway Commission (COSO).
In our opinion, the consolidated financial statements referred to above present fairly, in all material respects, the financial position of the Company as of December 31, 2019 and 2018, and the results of its operations and its cash flows for each of the three years in the period ended December 31, 2019 in conformity with accounting principles generally accepted in the United States of America. Also in our opinion, the Company maintained, in all material respects, effective internal control over financial reporting as of December 31, 2019, based on criteria established in Internal Control - Integrated Framework (2013) issued by the COSO.
Basis for Opinions
The Company's management is responsible for these consolidated financial statements, for maintaining effective internal control over financial reporting, and for its assessment of the effectiveness of internal control over financial reporting, included in Management’s Report on Internal Control over Financial Reporting appearing under Item 9A. Our responsibility is to express opinions on the Company’s consolidated financial statements and on the Company's internal control over financial reporting based on our audits. We are a public accounting firm registered with the Public Company Accounting Oversight Board (United States) (PCAOB) and are required to be independent with respect to the Company in accordance with the U.S. federal securities laws and the applicable rules and regulations of the Securities and Exchange Commission and the PCAOB.
We conducted our audits in accordance with the standards of the PCAOB. Those standards require that we plan and perform the audits to obtain reasonable assurance about whether the consolidated financial statements are free of material misstatement, whether due to error or fraud, and whether effective internal control over financial reporting was maintained in all material respects.
Our audits of the consolidated financial statements included performing procedures to assess the risks of material misstatement of the consolidated financial statements, whether due to error or fraud, and performing procedures that respond to those risks. Such procedures included examining, on a test basis, evidence regarding the amounts and disclosures in the consolidated financial statements. Our audits also included evaluating the accounting principles used and significant estimates made by management, as well as evaluating the overall presentation of the consolidated financial statements. Our audit of internal control over financial reporting included obtaining an understanding of internal control over financial reporting, assessing the risk that a material weakness exists, and testing and evaluating the design and operating effectiveness of internal control based on the assessed risk. Our audits also included performing such other procedures as we considered necessary in the circumstances. We believe that our audits provide a reasonable basis for our opinions.
Definition and Limitations of Internal Control over Financial Reporting
A company’s internal control over financial reporting is a process designed to provide reasonable assurance regarding the reliability of financial reporting and the preparation of financial statements for external purposes in accordance with generally accepted accounting principles. A company’s internal control over financial reporting includes those policies and procedures that (i) pertain to the maintenance of records that, in reasonable detail, accurately and fairly reflect the transactions and dispositions of the assets of the company; (ii) provide reasonable assurance that transactions are recorded as necessary to permit preparation of financial statements in accordance with generally accepted accounting principles, and that receipts and expenditures of the company are being made only in accordance with authorizations of management and directors of the company; and (iii) provide reasonable assurance regarding prevention or timely detection of unauthorized acquisition, use, or disposition of the company’s assets that could have a material effect on the financial statements.
Because of its inherent limitations, internal control over financial reporting may not prevent or detect misstatements. Also, projections of any evaluation of effectiveness to future periods are subject to the risk that controls may become inadequate because of changes in conditions, or that the degree of compliance with the policies or procedures may deteriorate.

The PNC Financial Services Group, Inc. – 2019 Form 10-K 85
Critical Audit Matters
The critical audit matters communicated below are matters arising from the current period audit of the consolidated financial statements that were communicated or required to be communicated to the audit committee and that (i) relate to accounts or disclosures that are material to the consolidated financial statements and (ii) involved our especially challenging, subjective, or complex judgments. The communication of critical audit matters does not alter in any way our opinion on the consolidated financial statements, taken as a whole, and we are not, by communicating the critical audit matters below, providing separate opinions on the critical audit matters or on the accounts or disclosures to which they relate.
Valuation of the Allowance for Loan and Lease Losses - Commercial Collectively Evaluated
As described in Notes 1 and 4 to the consolidated financial statements, the Company maintains the commercial allowance for loan and lease losses (“ALLL”) at a level to absorb estimated probable credit losses incurred in the loan and lease portfolio as of the balance sheet date. The allowance for commercial loans collectively evaluated for impairment was approximately $1.7 billion as of December 31, 2019. The commercial lending quantitative component is determined using a statistical loss model, which is dependent upon the use of key assumptions such as management’s internal risk ratings reflecting their best estimate of the borrower’s probability of default and the loss given default. Management assigns the probability of default and loss given default based upon borrower and transaction characteristics. These statistical parameters are determined based on internal historical data supplemented with third party data and management judgment.
The principal considerations for our determination that performing procedures relating to the valuation of the ALLL - commercial collectively evaluated is a critical audit matter are (i) the valuation involved the application of significant judgment by management, which led to a high degree of auditor subjectivity in performing audit procedures and in evaluating audit evidence related to significant assumptions, including management’s risk ratings; (ii) significant audit effort was necessary in performing audit procedures; and (iii) the audit effort involved professionals with specialized skill and knowledge to assist with the evaluation of audit evidence.
Addressing the matter involved performing procedures and evaluating audit evidence in connection with forming our overall opinion on the consolidated financial statements. These procedures included testing the effectiveness of controls relating to the valuation of the ALLL - commercial collectively evaluated, which included controls over the assignment and review of internal risk ratings reflecting management’s best estimate of the borrower’s probability of default and loss given default. These procedures also included, among others, testing management’s process for determining the commercial collectively evaluated allowance by evaluating the appropriateness of the methodology, testing the completeness and accuracy of principal balance data subject to the allowance calculation, and evaluating the reasonableness of significant assumptions, including internal risk ratings. Evaluating the reasonableness of significant assumptions included the involvement of professionals with specialized skill and knowledge to assist in determining whether the internal risk ratings assigned were developed consistently with the Company’s defined risk rating criteria for a sample of credit facilities.
Fair Value of Level 3 Non-Agency Residential Mortgage-Backed Securities Available for Sale
As described in Note 6 to the consolidated financial statements, the Company accounts for Level 3 non-agency residential mortgage-backed securities available for sale at fair value, which totals approximately $1.7 billion as of December 31, 2019. Management generally estimates fair value using pricing obtained from third-party vendors or, in some cases, using a dealer quote. The third-party vendors use a discounted cash flow approach that incorporates significant unobservable inputs and observable market activity where available. The significant unobservable inputs used to estimate the fair value of the securities are the constant prepayment rate, constant default rate, loss severity and spread over the benchmark curve.
The principal considerations for our determination that performing procedures relating to the fair value of Level 3 non-agency residential mortgage-backed securities available for sale is a critical audit matter are (i) the valuation involved the application of significant judgment by management, which led to a high degree of auditor judgment and subjectivity in performing audit procedures and in evaluating audit evidence related to the fair value of non-agency residential mortgage-backed securities available for sale; (ii) significant audit effort was necessary in performing audit procedures; and (iii) the audit effort involved professionals with specialized skill and knowledge to assist with performing procedures and evaluating audit evidence obtained.
Addressing the matter involved performing procedures and evaluating audit evidence in connection with forming our overall opinion on the consolidated financial statements. These procedures included testing the effectiveness of controls relating to the fair value of Level 3 non-agency residential mortgage-backed securities, including controls over the price validation of the securities. These procedures also included, among others, obtaining pricing from sources other than those used by management, where available. Additionally, for a sample of securities, professionals with specialized skill and knowledge were involved to assist in developing an independent estimate of fair value using independent assumptions, including the constant prepayment rate, constant default rate, loss severity and spread over the benchmark curve. The independently obtained prices or the independent estimates were compared to management’s prices to evaluate the reasonableness of the estimate.

86 The PNC Financial Services Group, Inc. – 2019 Form 10-K
Fair Value of Residential Mortgage Servicing Rights
As described in Notes 6 and 7 to the consolidated financial statements, the Company accounts for its residential mortgage servicing rights (“residential MSRs”) at fair value, which totals approximately $1.0 billion as of December 31, 2019. Residential MSRs are valued using a discounted cash flow model. The valuation derived from the discounted cash flow methodology is benchmarked for reasonableness by comparison against opinions of value from independent brokers. The significant unobservable inputs related to the valuation of residential MSRs are the constant prepayment rates and the spread over the benchmark curve.
The principal considerations for our determination that performing procedures relating to the fair value of residential mortgage servicing rights is a critical audit matter are (i) the valuation involved the application of significant judgment by management, which led to a high degree of auditor judgment and subjectivity in performing audit procedures and in evaluating audit evidence related to the residential mortgage servicing rights; (ii) significant audit effort was necessary in performing audit procedures; and (iii) the audit effort involved professionals with specialized skill and knowledge to assist with performing procedures and evaluating audit evidence obtained.
Addressing the matter involved performing procedures and evaluating audit evidence in connection with forming our overall opinion on the consolidated financial statements. These procedures included testing the effectiveness of controls relating to the fair value of residential mortgage servicing rights, including controls over the Company’s valuation, as well as the comparison of the valuation to opinions of value from third party independent brokers. These procedures also included, among others, using professionals with specialized skill and knowledge to assist in testing management’s process by evaluating the appropriateness of management’s valuation methodologies, and the reasonableness of calculations and the significant assumptions of constant prepayment rates and the spread over the benchmark curve.
/s/ PricewaterhouseCoopers LLP Pittsburgh, PennsylvaniaFebruary 28, 2020
We have served as the Company’s auditor since 2007.

The PNC Financial Services Group, Inc. – 2019 Form 10-K 87
CONSOLIDATED INCOME STATEMENTTHE PNC FINANCIAL SERVICES GROUP, INC.
Year ended December 31In millions, except per share data 2019 2018 2017
Interest IncomeLoans $ 10,525 $ 9,580 $ 8,238Investment securities 2,426 2,261 1,998Other 811 741 578
Total interest income 13,762 12,582 10,814Interest ExpenseDeposits 1,986 1,229 623Borrowed funds 1,811 1,632 1,083
Total interest expense 3,797 2,861 1,706Net interest income 9,965 9,721 9,108
Noninterest IncomeAsset management 1,850 1,825 1,942Consumer services 1,555 1,502 1,415Corporate services 1,914 1,849 1,742Residential mortgage 368 316 350Service charges on deposits 702 714 695Other 1,473 1,205 1,077
Total noninterest income 7,862 7,411 7,221Total revenue 17,827 17,132 16,329
Provision For Credit Losses 773 408 441Noninterest ExpensePersonnel 5,647 5,471 5,268Occupancy 834 818 868Equipment 1,210 1,103 1,065Marketing 301 285 244Other 2,582 2,619 2,953
Total noninterest expense 10,574 10,296 10,398Income before income taxes and noncontrolling interests 6,480 6,428 5,490Income taxes 1,062 1,082 102
Net income 5,418 5,346 5,388Less: Net income attributable to noncontrolling interests 49 45 50
Preferred stock dividends 236 236 236Preferred stock discount accretion and redemptions 4 4 26
Net income attributable to common shareholders $ 5,129 $ 5,061 $ 5,076Earnings Per Common Share
Basic $ 11.43 $ 10.79 $ 10.49Diluted $ 11.39 $ 10.71 $ 10.36
Average Common Shares OutstandingBasic 447 467 481Diluted 448 470 486
See accompanying Notes To Consolidated Financial Statements.

88 The PNC Financial Services Group, Inc. – 2019 Form 10-K
CONSOLIDATED STATEMENT OF COMPREHENSIVE INCOMETHE PNC FINANCIAL SERVICES GROUP, INC.
Year ended December 31In millions 2019 2018 2017
Net income $ 5,418 $ 5,346 $ 5,388Other comprehensive income (loss), before tax and net of reclassifications into Net income:
Net unrealized gains (losses) on non-OTTI securities 1,465 (526) 16Net unrealized gains (losses) on OTTI securities 24 (14) 172Net unrealized gains (losses) on cash flow hedge derivatives 297 (178) (287)Pension and other postretirement benefit plan adjustments 158 16 169Other 22 (37) 61
Other comprehensive income (loss), before tax and net of reclassifications into Net income 1,966 (739) 131Income tax benefit (expense) related to items of other comprehensive income (442) 156 (14)
Other comprehensive income (loss), after tax and net of reclassifications into Net income 1,524 (583) 117Comprehensive income 6,942 4,763 5,505
Less: Comprehensive income attributable to noncontrolling interests 49 45 50Comprehensive income attributable to PNC $ 6,893 $ 4,718 $ 5,455
See accompanying Notes To Consolidated Financial Statements.
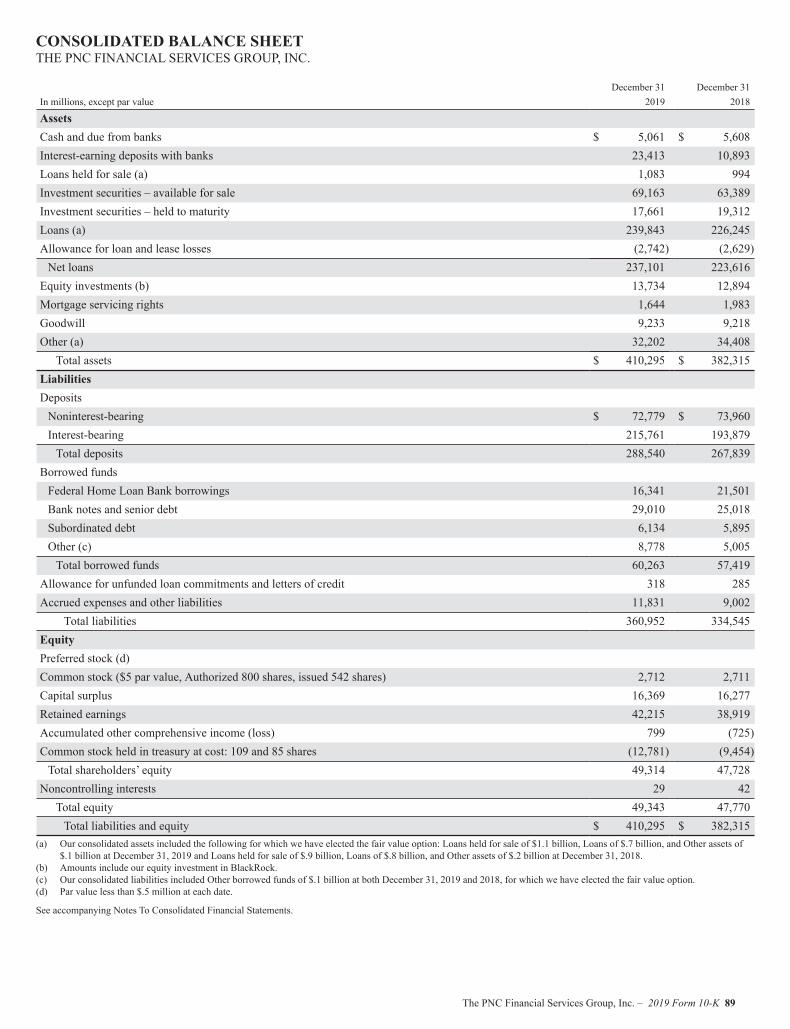
The PNC Financial Services Group, Inc. – 2019 Form 10-K 89
CONSOLIDATED BALANCE SHEETTHE PNC FINANCIAL SERVICES GROUP, INC.
December 31 December 31In millions, except par value 2019 2018
AssetsCash and due from banks $ 5,061 $ 5,608Interest-earning deposits with banks 23,413 10,893Loans held for sale (a) 1,083 994Investment securities – available for sale 69,163 63,389Investment securities – held to maturity 17,661 19,312Loans (a) 239,843 226,245Allowance for loan and lease losses (2,742) (2,629)
Net loans 237,101 223,616Equity investments (b) 13,734 12,894Mortgage servicing rights 1,644 1,983Goodwill 9,233 9,218Other (a) 32,202 34,408
Total assets $ 410,295 $ 382,315LiabilitiesDeposits
Noninterest-bearing $ 72,779 $ 73,960Interest-bearing 215,761 193,879
Total deposits 288,540 267,839Borrowed funds
Federal Home Loan Bank borrowings 16,341 21,501Bank notes and senior debt 29,010 25,018Subordinated debt 6,134 5,895Other (c) 8,778 5,005
Total borrowed funds 60,263 57,419Allowance for unfunded loan commitments and letters of credit 318 285Accrued expenses and other liabilities 11,831 9,002
Total liabilities 360,952 334,545EquityPreferred stock (d)Common stock ($5 par value, Authorized 800 shares, issued 542 shares) 2,712 2,711Capital surplus 16,369 16,277Retained earnings 42,215 38,919Accumulated other comprehensive income (loss) 799 (725)Common stock held in treasury at cost: 109 and 85 shares (12,781) (9,454)
Total shareholders’ equity 49,314 47,728Noncontrolling interests 29 42
Total equity 49,343 47,770Total liabilities and equity $ 410,295 $ 382,315
(a) Our consolidated assets included the following for which we have elected the fair value option: Loans held for sale of $1.1 billion, Loans of $.7 billion, and Other assets of $.1 billion at December 31, 2019 and Loans held for sale of $.9 billion, Loans of $.8 billion, and Other assets of $.2 billion at December 31, 2018.
(b) Amounts include our equity investment in BlackRock.(c) Our consolidated liabilities included Other borrowed funds of $.1 billion at both December 31, 2019 and 2018, for which we have elected the fair value option.(d) Par value less than $.5 million at each date.
See accompanying Notes To Consolidated Financial Statements.

90 The PNC Financial Services Group, Inc. – 2019 Form 10-K
CONSOLIDATED STATEMENT OF CHANGES IN EQUITYTHE PNC FINANCIAL SERVICES GROUP, INC.
Shareholders’ Equity
In millions
SharesOutstanding
CommonStock
CommonStock
CapitalSurplus -Preferred
Stock
CapitalSurplus -CommonStock and
OtherRetainedEarnings
AccumulatedOther
ComprehensiveIncome (Loss)
TreasuryStock
NoncontrollingInterests
TotalEquity
Balance at December 31, 2016 (a) 485 $ 2,709 $ 3,977 $ 12,674 $ 31,670 $ (265) $ (5,066) $ 1,155 $ 46,854Net income 5,338 50 5,388Other comprehensive income (loss), net of tax 117 117Cash dividends declared
Common (1,266) (1,266)Preferred (236) (236)
Preferred stock discount accretion 6 (6)Redemption of noncontrolling interests (b) (19) (981) (1,000)Common stock activity (c) 1 17 18Treasury stock activity (12) (309) (1,838) (2,147)Other 2 7 (152) (143)Balance at December 31, 2017 (a) 473 $ 2,710 $ 3,985 $ 12,389 $ 35,481 $ (148) $ (6,904) $ 72 $ 47,585Cumulative effect of ASU adoptions (d) (22) 6 (16)Balance at January 1, 2018 (a) 473 $ 2,710 $ 3,985 $ 12,389 $ 35,459 $ (142) $ (6,904) $ 72 $ 47,569Net income 5,301 45 5,346Other comprehensive income (loss), net of tax (583) (583)Cash dividends declared
Common (1,601) (1,601)Preferred (236) (236)
Preferred stock discount accretion 4 (4)Common stock activity (c) 1 19 20Treasury stock activity (16) (101) (2,550) (2,651)Other (3) (16) (75) (94)Balance at December 31, 2018 (a) 457 $ 2,711 $ 3,986 $ 12,291 $ 38,919 $ (725) $ (9,454) $ 42 $ 47,770Cumulative effect of ASU adoptions (e) 62 62Balance at January 1, 2019 (a) 457 $ 2,711 $ 3,986 $ 12,291 $ 38,981 $ (725) $ (9,454) $ 42 $ 47,832Net income 5,369 49 5,418Other comprehensive income (loss), net of tax 1,524 1,524Cash dividends declared
Common (1,895) (1,895)Preferred (236) (236)
Preferred stock discount accretion 4 (4)Common stock activity (c) 1 20 21Treasury stock activity (24) 3 (3,327) (3,324)Other 3 62 (62) 3Balance at December 31, 2019 (a) 433 $ 2,712 $ 3,993 $ 12,376 $ 42,215 $ 799 $ (12,781) $ 29 $ 49,343
(a) The par value of our preferred stock outstanding was less than $.5 million at each date and, therefore, is excluded from this presentation.(b) Relates to the redemption of Perpetual Trust Securities in the first quarter of 2017. See Note 15 in our 2017 Annual Report on Form 10-K for additional information.(c) Common stock activity totaled less than .5 million shares issued.(d) Represents the cumulative effect of adopting ASU 2014-09, ASU 2016-01, ASU 2017-12 and ASU 2018-02. See the Recently Adopted Accounting Standards portion of Note
1 Accounting Policies in our 2018 Form 10-K for additional detail on the adoption of these ASUs.(e) Represents the impact of the adoption of ASU 2016-02 related primarily to deferred gains on previous sale-leaseback transactions. See the Recently Adopted Accounting
Standards portion of Note 1 Accounting Policies for additional detail.
See accompanying Notes To Consolidated Financial Statements.

The PNC Financial Services Group, Inc. – 2019 Form 10-K 91
CONSOLIDATED STATEMENT OF CASH FLOWSTHE PNC FINANCIAL SERVICES GROUP, INC.
Year ended December 31
In millions 2019 2018 2017
Operating ActivitiesNet income $ 5,418 $ 5,346 $ 5,388Adjustments to reconcile net income to net cash provided (used) by operating activities
Provision for credit losses 773 408 441Depreciation and amortization 1,315 1,129 1,117Deferred income taxes 303 133 (403)Changes in fair value of mortgage servicing rights 645 172 323Undistributed earnings of BlackRock (531) (525) (727)
Net change in
Trading securities and other short-term investments 560 (893) 305Loans held for sale (123) 1,635 (1,148)Other assets (788) 108 647Accrued expenses and other liabilities 132 295 (704)
Other (341) 32 340Net cash provided (used) by operating activities $ 7,363 $ 7,840 $ 5,579
Investing ActivitiesSales
Securities available for sale $ 7,755 $ 7,505 $ 5,647Loans 1,664 1,323 2,001
Repayments/maturities
Securities available for sale 11,974 9,388 10,734Securities held to maturity 3,348 2,447 2,948
Purchases
Securities available for sale (23,739) (23,418) (13,605)Securities held to maturity (1,751) (3,370) (5,605)Loans (1,027) (690) (841)
Net change in
Federal funds sold and resale agreements 4,899 (5,837) (245)Interest-earning deposits with banks (12,520) 17,702 (2,884)Loans (14,963) (7,335) (10,483)
Net cash (paid for) received from acquisition and divestiture activity 75 (1,342)Other (705) (1,684) (1,220)
Net cash provided (used) by investing activities $ (24,990) $ (3,969) $ (14,895)
(continued on following page)

92 The PNC Financial Services Group, Inc. – 2019 Form 10-K
CONSOLIDATED STATEMENT OF CASH FLOWSTHE PNC FINANCIAL SERVICES GROUP, INC.(continued from previous page)
Year ended December 31In millions 2019 2018 2017
Financing ActivitiesNet change in
Noninterest-bearing deposits $ (1,166) $ (6,016) $ (264)Interest-bearing deposits 21,882 8,690 8,255Federal funds purchased and repurchase agreements 4,260 392 (148)Federal Home Loan Bank borrowings 4,800 1,500Commercial paper (100) 100Other borrowed funds (495) 20 459
Sales/issuancesFederal Home Loan Bank borrowings 12,040 9,500 11,000Bank notes and senior debt 8,977 3,238 7,062Subordinated debt 744 1,243Other borrowed funds 1,131 500 427Preferred stockCommon and treasury stock 90 69 132
Repayments/maturitiesFederal Home Loan Bank borrowings (22,000) (10,536) (7,512)Bank notes and senior debt (5,600) (6,175) (1,800)Subordinated debt (700) (575) (2,758)Other borrowed funds (1,174) (548) (318)
Redemption of noncontrolling interests (1,000)Acquisition of treasury stock (3,578) (2,877) (2,447)Preferred stock cash dividends paid (236) (236) (236)Common stock cash dividends paid (1,895) (1,601) (1,266)
Net cash provided (used) by financing activities $ 17,080 $ (3,512) $ 9,686Net Increase (Decrease) In Cash And Due From Banks $ (547) $ 359 $ 370
Cash and due from banks at beginning of period 5,608 5,249 4,879Cash and due from banks at end of period $ 5,061 $ 5,608 $ 5,249
Supplemental DisclosuresInterest paid $ 3,742 $ 2,835 $ 1,743Income taxes paid $ 430 $ 372 $ 72Income taxes refunded $ 17 $ 468 $ 24Leased assets obtained in exchange for new operating lease liabilities $ 317Right-of-use assets recognized at adoption of ASU 2016-02 $ 2,004
Non-cash Investing and Financing ItemsTransfer from loans to loans held for sale, net $ 958 $ 403 $ 419Transfer from loans to foreclosed assets $ 174 $ 193 $ 215Transfer from trading securities to available for sale securities $ 328 $ 192
See accompanying Notes To Consolidated Financial Statements.

The PNC Financial Services Group, Inc. – 2019 Form 10-K 93
NOTES TO CONSOLIDATED FINANCIAL STATEMENTSTHE PNC FINANCIAL SERVICES GROUP, INC. BUSINESS
The PNC Financial Services Group, Inc. (PNC) is one of the largest diversified financial services companies in the United States (U.S.) and is headquartered in Pittsburgh, Pennsylvania.
We have businesses engaged in retail banking, including residential mortgage, corporate and institutional banking and asset management, providing many of our products and services nationally. Our retail branch network is located primarily in markets across the Mid-Atlantic, Midwest and Southeast. We also have strategic international offices in four countries outside the U.S.
NOTE 1 ACCOUNTING POLICIES
Basis of Financial Statement Presentation
Our consolidated financial statements include the accounts of the parent company and its subsidiaries, most of which are wholly-owned, certain partnership interests, and variable interest entities.
We prepared these consolidated financial statements in accordance with accounting principles generally accepted in the United States of America (GAAP). We have eliminated intercompany accounts and transactions.
We have also considered the impact of subsequent events on these consolidated financial statements.
Use of Estimates
We prepared these consolidated financial statements using financial information available at the time of preparation, which requires us to make estimates and assumptions that affect the amounts reported. Our most significant estimates pertain to our fair value measurements and allowances for loan and lease losses and unfunded loan commitments and letters of credit. Actual results may differ from the estimates and the differences may be material to the consolidated financial statements.
Investment in BlackRock, Inc.
We account for our investment in the common stock and Series B Preferred Stock of BlackRock (deemed to be in-substance common stock) under the equity method of accounting. The investment in BlackRock is reflected on our Consolidated Balance Sheet in Equity investments, while our equity in earnings of BlackRock is reported on our Consolidated Income Statement in Asset management noninterest income.
Variable Interest Entities
A variable interest entity (VIE) is a corporation, partnership, limited liability company, or any other legal structure used to conduct activities or hold assets generally that either:
• Does not have equity investors with voting rights that can directly or indirectly make decisions about the entity’s activities through those voting rights or similar rights; or
• Has equity investors that do not provide sufficient equity for the entity to finance its activities without additional subordinated financial support.
A VIE often holds financial assets, including loans or receivables, real estate or other property.
VIEs are assessed for consolidation under ASC 810 – Consolidation when we hold a variable interest in these entities. We consolidate a VIE if we are its primary beneficiary. The primary beneficiary of a VIE is determined to be the party that meets both of the following criteria: (i) has the power to make decisions that most significantly affect the economic performance of the VIE; and (ii) has the obligation to absorb losses or the right to receive benefits that in either case could potentially be significant to the VIE. Upon consolidation of a VIE, we recognize all of the VIE’s assets, liabilities and noncontrolling interests on our Consolidated Balance Sheet. On a quarterly basis, we determine whether any changes occurred requiring a reassessment of whether we are the primary beneficiary of an entity.
See Note 2 Loan Sale and Servicing Activities and Variable Interest Entities for information about VIEs that we consolidate as well as those that we do not consolidate but in which we hold a significant variable interest.

94 The PNC Financial Services Group, Inc. – 2019 Form 10-K
Revenue Recognition
We earn interest and noninterest income from various sources, including:• Lending;• Securities portfolio;• Asset management;• Customer deposits;• Loan sales, loan securitizations, and servicing;• Brokerage services;• Sale of loans and securities;• Certain private equity activities; and• Securities, derivatives and foreign exchange activities.
In addition, we earn fees and commissions from:• Issuing loan commitments, standby letters of credit and financial guarantees;• Deposit account services;• Merchant services;• Selling various insurance products;• Providing treasury management services;• Providing merger and acquisition advisory and related services;• Debit and credit card transactions; and• Participating in certain capital markets transactions.
Our Asset management noninterest income also includes our share of the earnings of BlackRock recognized under the equity method of accounting.
Service charges on deposit accounts are recognized when earned. Brokerage fees and gains and losses on the sale of securities and certain derivatives are recognized on a trade-date basis.
We record private equity income or loss based on changes in the valuation of the underlying investments or when we dispose of our interest.
We recognize gain/(loss) on changes in the fair value of certain financial instruments where we have elected the fair value option. These financial instruments include certain commercial and residential mortgage loans originated for sale, certain residential mortgage portfolio loans and resale agreements. We also recognize gain/(loss) on changes in the fair value of residential and commercial mortgage servicing rights (MSRs).
We recognize revenue from servicing residential mortgages, commercial mortgages and other consumer loans for others as earned based on the specific contractual terms. These revenues are reported on the Consolidated Income Statement in the line items Residential mortgage, Corporate services and Consumer services. We recognize revenue from securities, derivatives and foreign exchange customer-related trading, as well as securities underwriting activities, as these transactions occur or as services are provided. We generally recognize gains from the sale of loans upon meeting the derecognition criteria for transfers of financial assets. Mortgage revenue recognized is reported net of mortgage repurchase reserves.
For the fee-based revenue within the scope of ASC Topic 606 - Revenue from Contracts with Customers, revenue is recognized when or as those services are transferred to the customer. See Note 23 Fee-Based Revenue from Contracts with Customers for additional information related to revenue within the scope of Topic 606.
Cash and Cash Equivalents
Cash and due from banks are considered cash and cash equivalents for financial reporting purposes because they represent a primary source of liquidity.
Investments
We hold interests in various types of investments. The accounting for these investments is dependent on a number of factors including, but not limited to, items such as:
• Ownership interest;• Our plans for the investment; and• The nature of the investment.

The PNC Financial Services Group, Inc. – 2019 Form 10-K 95
Debt Securities
Debt securities are recorded on a trade-date basis. We classify debt securities as held to maturity and carry them at amortized cost if we have the positive intent and ability to hold the securities to maturity. Debt securities that we purchase for certain risk management activities or customer-related trading activities are carried at fair value and classified as trading securities and are reported in the Other assets line item on our Consolidated Balance Sheet. Realized and unrealized gains and losses on trading securities are included in Other noninterest income.
Debt securities not classified as held to maturity or trading are designated as securities available for sale and carried at fair value with unrealized gains and losses, net of income taxes, reflected in Accumulated other comprehensive income (AOCI). On at least a quarterly basis, we review all debt securities that are in an unrealized loss position for other than temporary impairment (OTTI). An investment security is deemed impaired if the fair value of the investment is less than its amortized cost. Amortized cost includes adjustments (if any) made to the cost basis of an investment for accretion, amortization, previous other-than-temporary impairments and hedging gains and losses. After an investment security is determined to be impaired, we evaluate whether the decline in value is other-than-temporary. Declines in the fair value of available for sale and held to maturity debt securities that are deemed other-than-temporary and are attributable to credit deterioration are recognized in Other noninterest income on our Consolidated Income Statement in the period in which the determination is made. Declines in fair value which are deemed other-than-temporary and attributable to factors other than credit deterioration are recognized in AOCI on our Consolidated Balance Sheet.
We include all interest on debt securities, including amortization of premiums and accretion of discounts on investment securities, in net interest income using the constant effective yield method generally calculated over the contractual lives of the securities. Effective yields reflect either the effective interest rate implicit in the security at the date of acquisition or the effective interest rate determined based on improved cash flows subsequent to impairment. We compute gains and losses realized on the sale of available for sale debt securities on a specific security basis. These securities gains/(losses) are included in Other noninterest income on the Consolidated Income Statement.
Equity Securities and Partnership Interests
We account for equity securities, equity investments other than BlackRock, private equity investments, and investments in limited partnerships, limited liability companies and other investments that are not required to be consolidated under one of the following methods:
• We use the equity method for general and limited partner ownership interests and limited liability companies in which we are considered to have significant influence over the operations of the investee. Under the equity method, we record our equity ownership share of net income or loss of the investee in Noninterest income and any dividends received on equity method investments are recorded as a reduction to the investment balance. When an equity investment experiences an other-than-temporary decline in value, we may be required to record a loss on the investment.
• We measure equity securities that have a readily determinable fair value at fair value through Net income. Both realized and unrealized gains and losses are included in Noninterest income. Dividend income on these equity securities is included in Other interest income on our Consolidated Income Statement.
• We generally use the practicability exception to fair value measurement for all other investments without a readily determinable fair value. When we elect this alternative measurement method, the carrying value is adjusted for impairment, if any, plus or minus changes in value resulting from observable price changes in orderly transactions for identical or similar instruments of the same issuer. These investments are written down to fair value if a qualitative assessment indicates impairment and the fair value is less than the carrying value. The amount of the write-down is accounted for as a loss included in Noninterest income. Distributions received on these investments are included in Noninterest income.
Investments described above are included in Equity investments on our Consolidated Balance Sheet.
Private Equity Investments
We report private equity investments, which include direct investments in companies, affiliated partnership interests and indirect investments in private equity funds, at estimated fair value. These estimates are based on available information and may not necessarily represent amounts that we will ultimately realize through distribution, sale or liquidation of the investments. Fair values of publicly-traded direct investments are determined using quoted market prices and are subject to various discount factors arising from security level restrictions, when appropriate. The valuation procedures applied to direct investments and indirect investments are detailed in Note 6 Fair Value. We include all private equity investments within Equity investments on our Consolidated Balance Sheet. Changes in fair value of private equity investments are recognized in Other noninterest income.
We consolidate affiliated partnerships when we have determined that we have control of the partnership or are the primary beneficiary if the entity is a VIE. The portion we do not own is reflected in Noncontrolling interests on our Consolidated Balance Sheet.

96 The PNC Financial Services Group, Inc. – 2019 Form 10-K
Loans
Loans are classified as held for investment when management has both the intent and ability to hold the loan for the foreseeable future, or until maturity or payoff. Management’s intent and view of the foreseeable future may change based on changes in business strategies, the economic environment, market conditions and the availability of government programs.
Measurement of delinquency status is based on the contractual terms of each loan. Loans that are 30 days or more past due in terms of payment are considered delinquent.
Except as described below, loans held for investment are stated at recorded investment, which represents the principal amounts outstanding, net of unearned income, unamortized deferred fees and costs on originated loans, and premiums or discounts on purchased loans. Interest on performing loans (excluding interest on purchased impaired loans, which is further discussed below) is accrued based on the principal amount outstanding and recorded in Interest income as earned using the constant effective yield method. Loan origination fees, direct loan origination costs, and loan premiums and discounts are deferred and accreted or amortized into Net interest income using the constant effective yield method, over the contractual life of the loan.
In addition to originating loans, we also acquire loans through portfolio purchases or acquisitions of other financial services companies. For certain acquired loans that have experienced a deterioration of credit quality, we follow the guidance contained in ASC 310-30 – Loans and Debt Securities Acquired with Deteriorated Credit Quality. Under this guidance, acquired purchased impaired loans are to be recorded at fair value without the carryover of any existing valuation allowances. When evidence of credit quality deterioration and evidence that it is probable that we will be unable to collect all contractual amounts due exist, we consider the loans to be purchased credit impaired and we estimate the amount and timing of undiscounted expected cash flows at acquisition for each loan either individually or on a pool basis. The excess of undiscounted cash flows expected to be collected on a purchased impaired loan (or pool of loans) over its carrying value represents the accretable yield which is recognized into interest income over the remaining life of the loan (or pool of loans) using the constant effective yield method. Subsequent decreases in expected cash flows that are attributable, at least in part, to credit quality are recognized as impairments through a charge to the provision for credit losses resulting in an increase in the Allowance for Loan and Lease Losses (ALLL). Subsequent increases in expected cash flows are recognized as a provision recapture of previously recorded ALLL or prospectively through an adjustment of the loan’s or pool’s yield over its remaining life.
Loans Held for Sale
We designate loans as held for sale when we have the intent to sell them. We transfer loans to the Loans held for sale category at the lower of cost or estimated fair value less cost to sell. At the time of transfer, write-downs on the loans are recorded as charge-offs. We establish a new cost basis upon transfer. Any subsequent lower-of-cost-or-market adjustment is determined on an individual loan basis and is recognized as a valuation allowance with any charges included in Other noninterest income.
We have elected to account for certain commercial and residential mortgage loans held for sale at fair value. The changes in the fair value of the commercial mortgage loans are measured and recorded in Other noninterest income while the residential mortgage loans are measured and recorded in Residential mortgage noninterest income each period. See Note 6 Fair Value for additional information.
Interest income with respect to loans held for sale is accrued based on the principal amount outstanding and the loan’s contractual interest rate.
In certain circumstances, loans designated as held for sale may be transferred to held for investment based on a change in strategy. We transfer these loans at the lower of cost or estimated fair value; however, any loans originated or purchased for held for sale and designated at fair value remain at fair value for the life of the loan.
Leases
We provide financing for various types of equipment, including aircraft, energy and power systems, and vehicles through a variety of lease arrangements. Direct financing leases are carried at the aggregate of lease payments plus estimated residual value of the leased equipment, less unearned income. Leveraged leases, a form of financing leases, are carried net of nonrecourse debt. We recognize income over the term of the lease using the constant effective yield method. Lease residual values are reviewed for impairment at least annually. Gains or losses on the sale of leased assets are included in Other noninterest income while valuation adjustments on lease residuals are included in Other noninterest expense.
We adopted Accounting Standards Update (ASU) 2016-02 – Leases as of January 1, 2019 and recognized lease liabilities and right-of-use (ROU) assets of $2.1 billion and $2.0 billion, respectively. In addition, we recognized a one-time pre-tax adjustment of $83 million to retained earnings, related primarily to deferred gains on previous sale-leaseback transactions.

The PNC Financial Services Group, Inc. – 2019 Form 10-K 97
Loan Sales, Loan Securitizations and Retained Interests
We recognize the sale of loans or other financial assets when the transferred assets are legally isolated from our creditors and the appropriate accounting criteria are met. We have sold mortgage and other loans through securitization transactions. In a securitization, financial assets are transferred into trusts or to special purpose entities (SPEs) in transactions to effectively legally isolate the assets from us.
In a securitization, the trust or SPE issues beneficial interests in the form of senior and subordinated securities backed or collateralized by the assets sold to the trust. The senior classes of the asset-backed securities typically receive investment grade credit ratings at the time of issuance. These ratings are generally achieved through the creation of lower-rated subordinated classes of asset-backed securities, as well as subordinated or residual interests. In certain cases, we may retain a portion or all of the securities issued, interest-only strips, one or more subordinated tranches, servicing rights and, in some cases, cash reserve accounts. Securitized loans are removed from the balance sheet and a net gain or loss is recognized in Noninterest income at the time of initial sale. Gains or losses recognized on the sale of the loans depend on the fair value of the loans sold and the retained interests at the date of sale. We generally estimate the fair value of the retained interests based on the present value of future expected cash flows using assumptions as to discount rates, interest rates, prepayment speeds, credit losses and servicing costs, if applicable.
With the exception of loan sales to certain U.S. government-chartered entities, our loan sales and securitizations are generally structured without recourse to us except for representations and warranties and with no restrictions on the retained interests. We originate, sell and service commercial mortgage loans under the Federal National Mortgage Association (FNMA) Delegated Underwriting and Servicing (DUS) program. Under the provisions of the DUS program, we participate in a loss-sharing arrangement with FNMA. When we are obligated for loss-sharing or recourse, our policy is to record such liabilities initially at fair value and subsequently reserve for estimated losses in accordance with guidance contained in applicable GAAP.

98 The PNC Financial Services Group, Inc. – 2019 Form 10-K
Nonperforming Loans and Leases
The matrix below summarizes our policies for classifying certain loans as nonperforming loans and/or discontinuing the accrual of loan interest income.
Commercial LendingLoans Classified asNonperforming and Accountedfor as Nonaccrual
• Loans accounted for at amortized cost where:– The loan is 90 days or more past due.– The loan is rated substandard or worse due to the determination that full collection of principal and interest is not probable as demonstrated by the following conditions:
• The collection of principal or interest is 90 days or more past due;• Reasonable doubt exists as to the certainty of the borrower’s future debt service ability, according to the terms of the credit arrangement, regardless of whether 90 days have passed or not;• The borrower has filed or will likely file for bankruptcy;• The bank advances additional funds to cover principal or interest;• We are in the process of liquidating a commercial borrower; or• We are pursuing remedies under a guarantee.
Loans Excluded fromNonperforming Classificationbut Accounted for as Nonaccrual
• Loans accounted for under the fair value option and full collection of principal and interest is not probable.• Loans accounted for at the lower of cost or market less costs to sell (held for sale) and full collection of principal and interest is not probable.
Loans Excluded fromNonperforming Classificationand Nonaccrual Accounting
• Loans that are well secured and in the process of collection.
Consumer LendingLoans Classified asNonperforming and Accountedfor as Nonaccrual
• Loans accounted for at amortized cost where full collection of contractual principal and interest is not deemed probable as demonstrated in the policies below:
– The loan is 90 days past due for home equity and installment loans, and 180 days past due for well secured residential real estate loans;– The loan has been modified and classified as a troubled debt restructuring (TDR);– Notification of bankruptcy has been received;– The bank holds a subordinate lien position in the loan and the first lien mortgage loan is seriously stressed (i.e., 90 days or more past due);– Other loans within the same borrower relationship have been placed on nonaccrual or charge-offs have been taken on them;– The bank has ordered the repossession of non-real estate collateral securing the loan; or– The bank has charged-off the loan to the value of the collateral.
Loans Excluded fromNonperforming Classificationbut Accounted for as Nonaccrual
• Loans accounted for under the fair value option and full collection of principal and interest is not probable.• Loans accounted for at the lower of cost or market less costs to sell (held for sale) and full collection of principal and interest is not probable.
Loans Excluded fromNonperforming Classificationand Nonaccrual Accounting
• Purchased impaired loans because interest income is accreted through the accounting model.• Certain government insured loans where substantially all principal and interest is insured.• Residential real estate loans that are well secured and in the process of collection.• Consumer loans and lines of credit, not secured by residential real estate or automobiles, as permitted by regulatory guidance.
See Note 3 Asset Quality in this Report for additional detail on nonperforming assets and asset quality indicators for commercial and consumer loans.
Commercial LendingWe generally charge off Commercial Lending (Commercial, Commercial Real Estate, and Equipment Lease Financing) nonperforming loans when we determine that a specific loan, or portion thereof, is uncollectible. This determination is based on the specific facts and circumstances of the individual loans. In making this determination, we consider the viability of the business or project as a going concern, the past due status when the asset is not well-secured, the expected cash flows to repay the loan, the value of the collateral, and the ability and willingness of any guarantors to perform.
Additionally, in general, for smaller commercial loans of $1 million or less, a partial or full charge-off occurs at 120 days past due for term loans and 180 days past due for revolvers. Certain small business credit card balances that are placed on nonaccrual status when they become 90 days or more past due are charged-off at 180 days past due.
Consumer LendingHome equity installment loans, home equity lines of credit, and residential real estate loans that are not well-secured and in the process of collection are charged-off at no later than 180 days past due. At that time, the basis in the loan is reduced to the fair value of the collateral less costs to sell. In addition to this policy, the bank recognizes a charge-off on a secured consumer loan when:
• The bank holds a subordinate lien position in the loan and a foreclosure notice has been received on the first lien loan;• The bank holds a subordinate lien position in the loan which is 30 days or more past due with a combined loan to value ratio
of greater than or equal to 110% and the first lien loan is seriously stressed (i.e., 90 days or more past due);• The loan is modified or otherwise restructured in a manner that results in the loan becoming collateral dependent;

The PNC Financial Services Group, Inc. – 2019 Form 10-K 99
• Notification of bankruptcy has been received within the last 60 days;• The borrower has been discharged from personal liability through Chapter 7 bankruptcy and has not formally reaffirmed his
or her loan obligation to us; or• The collateral securing the loan has been repossessed and the value of the collateral is less than the recorded investment of the
loan outstanding.
For loans that continue to meet any of the above policies, collateral values are updated annually and subsequent declines in collateral values are charged-off resulting in incremental provision for credit loss.
Most consumer loans and lines of credit, not secured by residential real estate, are charged off after 120-180 days past due.
Accounting for Nonperforming Assets and Leases and Other Nonaccrual LoansFor accrual loans, interest income is accrued on a daily basis and certain fees and costs are deferred upon origination and recognized in income over the term of the loan utilizing an effective yield method. For nonaccrual loans, interest income accrual and deferred fee/cost recognition is discontinued. Additionally, the current year accrued and uncollected interest is reversed through Net interest income and prior year accrued and uncollected interest is charged-off. Nonaccrual loans may also be charged-off to reduce the basis to the fair value of collateral less costs to sell.
If payment is received on a nonaccrual loan, generally the payment is first applied to the recorded investment; payments are then applied to recover any charged-off amounts related to the loan. Finally, if both recorded investment and any charge-offs have been recovered, then the payment will be recorded as interest income. For certain nonaccrual consumer loans, the receipt of interest payments is recognized as interest income on a cash basis. Cash basis income recognition is applied if a loan’s recorded investment is deemed fully collectible and the loan has performed under contractual terms for at least six months.
For TDRs, payments are applied based upon their contractual terms unless the related loan is deemed non-performing. TDRs are generally included in nonperforming and nonaccrual loans. However, after a reasonable period of time in which the loan performs under restructured terms and meets other performance indicators, it is returned to performing/accruing status. This return to performing/accruing status demonstrates that the bank expects to collect all of the loan’s remaining contractual principal and interest. TDRs resulting from i) borrowers that have been discharged from personal liability through Chapter 7 bankruptcy and have not formally reaffirmed their loan obligations to us and ii) borrowers that are not currently obligated to make both principal and interest payments under the restructured terms are not returned to accrual status.
Other nonaccrual loans are generally not returned to accrual status until the borrower has performed in accordance with the contractual terms and other performance indicators for at least six months, the period of time which was determined to demonstrate the expected collection of the loan’s remaining contractual principal and interest. When a nonperforming loan is returned to accrual status, it is then considered a performing loan.
See Note 3 Asset Quality and Note 4 Allowance for Loan and Lease Losses in this Report for additional TDR information.
Foreclosed assets consist of any asset seized or property acquired through a foreclosure proceeding or acceptance of a deed-in-lieu of foreclosure. Other real estate owned comprises principally commercial and residential real estate properties obtained in partial or total satisfaction of loan obligations. After obtaining a foreclosure judgment, or in some jurisdictions the initiation of proceedings under a power of sale in the loan instruments, the property will be sold. When we are awarded title or completion of deed-in-lieu of foreclosure, we transfer the loan to foreclosed assets included in Other assets on our Consolidated Balance Sheet. Property obtained in satisfaction of a loan is initially recorded at estimated fair value less cost to sell. Based upon the estimated fair value less cost to sell, the recorded investment of the loan is adjusted and, typically, a charge-off/recovery is recognized to the ALLL. We estimate fair values primarily based on appraisals, or sales agreements with third parties. Subsequently, foreclosed assets are valued at the lower of the amount recorded at acquisition date or estimated fair value less cost to sell. Valuation adjustments on these assets and gains or losses realized from disposition of such property are reflected in Other noninterest expense.
For certain mortgage loans that have a government agency guarantee, we establish a separate other receivable upon foreclosure. The receivable is measured based on the loan balance (inclusive of principal and interest) that is expected to be recovered from the guarantor.
Allowance for Loan and Lease Losses
We maintain the ALLL at a level that we believe to be appropriate to absorb estimated probable credit losses incurred in the loan and lease portfolios as of the balance sheet date. Our determination of the allowance is based on periodic evaluations of these loan and lease portfolios and other relevant factors. This critical estimate includes significant use of our own historical data and complex methods to interpret this data. These evaluations are inherently subjective, as they require material estimates and may be susceptible to significant change, and include, among others:
• Probability of default (PD);

100 The PNC Financial Services Group, Inc. – 2019 Form 10-K
• Loss given default (LGD);• Exposure at default (EAD);• Movement through delinquency stages;• Amounts and timing of expected future cash flows;• Value of collateral; and• Qualitative factors, such as changes in current economic conditions, that may not be reflected in modeled results.
For all loans, except purchased impaired loans, the ALLL is the sum of three components: (i) asset specific/individual impaired reserves, (ii) quantitative (formulaic or pooled) reserves and (iii) qualitative (judgmental) reserves.
The reserve calculation and determination process is dependent on the use of key assumptions. Key reserve assumptions and estimation processes react to and are influenced by observed changes in loan portfolio performance experience, the financial strength of the borrowers, and economic conditions. Key reserve assumptions are periodically updated.
See Note 4 Allowance for Loan and Lease Losses for additional detail on our ALLL.
Asset Specific/Individual ComponentNonperforming loans that are considered impaired under ASC 310 – Receivables, which include all commercial and consumer TDRs, are evaluated for a specific reserve. Specific reserve allocations are determined as follows:
• For commercial nonperforming loans and commercial TDRs greater than or equal to a defined dollar threshold, specific reserves are based on an analysis of the present value of the loan’s expected future cash flows, the loan’s observable market price or the fair value of the collateral.
• For commercial nonperforming loans and commercial TDRs below the defined dollar threshold, the individual loan’s LGD percentage is multiplied by the loan balance and the results are aggregated for purposes of measuring specific reserve impairment.
• Consumer nonperforming loans are collectively reserved for unless classified as consumer TDRs. For consumer TDRs, specific reserves are determined through an analysis of the present value of the loan’s expected future cash flows, except for those instances where loans have been deemed collateral dependent, including loans where borrowers have been discharged from personal liability through Chapter 7 bankruptcy and have not formally reaffirmed their loan obligations to us. Once that determination has been made, those TDRs are charged down to the fair value of the collateral less costs to sell at each period end.
Commercial Lending Quantitative ComponentThe estimates of the quantitative component of ALLL for incurred losses within the commercial lending portfolio are determined through quantitative loss modeling utilizing PD, LGD and outstanding balance of the loan. Based upon borrower and transaction characteristics, we assign PDs and LGDs. Each of these parameters is determined based on internal historical data, supplemented with third party data and management judgment, as deemed necessary. PD is influenced by such factors as leverage, liquidity, industry, obligor financial structure, access to capital and cash flow. LGD is influenced by collateral type, original and/or updated loan-to-value ratio (LTV), facility structure and other factors.
Consumer Lending Quantitative ComponentQuantitative estimates within the consumer lending portfolio segment are calculated primarily using transition matrices, including using a roll-rate model. The roll-rate model uses statistical relationships, calculated from historical data that estimate the movement of loan outstandings through the various stages of delinquency and ultimately charge-off over our loss emergence period.
Qualitative ComponentWhile our reserve methodologies strive to reflect all relevant risk factors, there continues to be uncertainty associated with, but not limited to, potential imprecision in the estimation process due to the inherent time lag of obtaining information and normal variations between estimates and actual outcomes. We may adjust our reserve for such risks. The ALLL also includes factors that may not be directly measured in the determination of specific or pooled reserves. Such qualitative factors may include:
• Industry concentrations and conditions;• Changes in market conditions;• Recent credit quality trends;• Recent loss experience in particular portfolios, including specific and unique events;• Recent macro-economic factors;• Model imprecision;• Changes in lending policies and procedures;• Timing of available information, including the performance of first lien positions; and• Limitations of available historical data.

The PNC Financial Services Group, Inc. – 2019 Form 10-K 101
Allowance for Purchased Non-Impaired LoansALLL for purchased non-impaired loans is determined based upon a comparison between the methodologies described above and the remaining acquisition date fair value discount, if any, that has yet to be accreted into interest income. After making the comparison, an ALLL is recorded for the amount greater than the discount, or no ALLL is recorded if the discount is greater.
Allowance for Purchased Impaired LoansALLL for purchased impaired loans is determined in accordance with ASC 310-30 by comparing the net present value of management’s best estimate of cash flows expected to be collected over the life of the pool of loans to the recorded investment for a given pool of loans. In cases where the net present value of expected cash flows is lower than the recorded investment, ALLL is established.
Allowance for Unfunded Loan Commitments and Letters of Credit
We maintain the allowance for unfunded loan commitments and letters of credit at a level we believe is appropriate to absorb estimated probable credit losses incurred on these unfunded credit facilities as of the balance sheet date. We determine the allowance based on periodic evaluations of the unfunded credit facilities, including an assessment of the probability of commitment usage, credit risk factors, and, solely for commercial lending, the terms and expiration dates of the unfunded credit facilities. Other than the estimation of the probability of funding, the reserve for unfunded loan commitments is estimated in a manner similar to the methodology used for determining reserves for funded exposures. The allowance for unfunded loan commitments and letters of credit is recorded as a liability on the Consolidated Balance Sheet. Net adjustments to the allowance for unfunded loan commitments and letters of credit are included in the provision for credit losses.
Mortgage Servicing Rights
We provide servicing under various loan servicing contracts for commercial and residential loans. These contracts are either purchased in the open market or retained as part of a loan securitization or loan sale. All acquired or originated servicing rights are measured at fair value. Fair value is based on the present value of the expected future net cash flows, including assumptions as to:
• Deposit balances and interest rates for escrow and commercial reserve earnings;• Discount rates;• Estimated prepayment speeds; and• Estimated servicing costs.
We measure commercial and residential MSRs at fair value in order to reduce any potential measurement mismatch between our economic hedges and the MSRs. We manage the risk by hedging the fair value of MSRs with derivatives and securities which are expected to increase in value when the value of the servicing right declines. Changes in the fair value of MSRs are recognized as gains/(losses). The fair value of these servicing rights is estimated by using a discounted cash flow valuation model which calculates the present value of estimated future net servicing cash flows, taking into consideration actual and expected mortgage loan prepayment rates, discount rates, servicing costs, and other factors which are determined based on current market conditions.
Fair Value of Financial Instruments
The fair value of financial instruments and the methods and assumptions used in estimating fair value amounts and financial assets and liabilities for which fair value was elected are detailed in Note 6 Fair Value.
Goodwill
Goodwill arising from business acquisitions represents the value attributable to unidentifiable intangible elements in the business acquired. At least annually, in the fourth quarter, or more frequently if events occur or circumstances have changed significantly from the annual test date, management performs our goodwill impairment test at a reporting unit level.
If, after considering all relevant events and circumstances, PNC determines it is not more-likely-than-not that the fair value of a reporting unit is less than its carrying amount, then performing a quantitative impairment test is not necessary. If PNC elects to bypass the qualitative analysis, or concludes via qualitative analysis that it is more-likely-than-not that the fair value of a reporting unit is less than its carrying amount, a two-step goodwill impairment test is performed. In the first step, inputs are generated and used in calculating the fair value of the reporting unit, which is compared to its carrying amount. The fair value of our reporting units is determined by using discounted cash flows and/or market comparability methodologies. If the fair value is greater than the carrying amount, then the reporting unit's goodwill is deemed not to be impaired. If the fair value is less than the carrying amount, then the second step is performed. In the second step, the implied fair value of reporting unit goodwill, which is determined as if the reporting unit had been acquired in a business combination, would be compared to the carrying amount of that goodwill. If the carrying amount of goodwill exceeds the implied fair value of goodwill, the difference is recognized as an impairment loss.

102 The PNC Financial Services Group, Inc. – 2019 Form 10-K
Depreciation and Amortization
For financial reporting purposes, we depreciate premises and equipment, net of salvage value, principally using the straight-line method over their estimated useful lives.
We use estimated useful lives for furniture and equipment ranging from one to 10 years, and depreciate buildings over an estimated useful life of up to 40 years. We amortize leasehold improvements over their estimated useful lives of up to 15 years or the respective lease terms, whichever is shorter.
We purchase, as well as internally develop and customize, certain software to enhance or perform internal business functions. Software development costs incurred in the planning and post-development project stages are charged to Noninterest expense. Costs associated with designing software configuration and interfaces, installation, coding programs and testing systems are capitalized and amortized using the straight-line method over periods ranging from one to 10 years.
We review the remaining useful lives and carrying values of premises and equipment to determine whether an event has occurred that would indicate a change in useful life is warranted or if any impairment exists.
Other Comprehensive Income
Other comprehensive income, on an after-tax basis, primarily consists of unrealized gains or losses, excluding OTTI attributable to credit deterioration, on investment securities classified as available for sale, unrealized gains or losses on derivatives designated as cash flow hedges, and changes in pension and other postretirement benefit plan liability adjustments. Details of each component are included in Note 16 Other Comprehensive Income.
Treasury Stock
We record common stock purchased for treasury at cost. At the date of subsequent reissue, the treasury stock account is reduced by the cost of such stock on the first-in, first-out basis.
Derivative Instruments and Hedging Activities
We use a variety of financial derivatives to both mitigate exposure to market (primarily interest rate) and credit risks inherent in our business activities, as well as to facilitate customer risk management activities. We manage these risks as part of our asset and liability management process and through credit policies and procedures.
We recognize all derivative instruments at fair value as either Other assets or Other liabilities on the Consolidated Balance Sheet and the related cash flows in the Operating Activities section of the Consolidated Statement of Cash Flows. Adjustments for counterparty credit risk are included in the determination of fair value. The accounting for changes in the fair value of a derivative instrument depends on whether it has been designated and qualifies as part of a cash flow or net investment hedging relationship. For all other derivatives, changes in fair value are recognized in earnings.
We utilize a net presentation for derivative instruments on the Consolidated Balance Sheet taking into consideration the effects of legally enforceable master netting agreements. Cash collateral exchanged with counterparties is also netted against the applicable derivative exposures by offsetting obligations to return, or general rights to reclaim, cash collateral against the fair values of the net derivatives being collateralized.
For those derivative instruments that are designated and qualify as accounting hedges, we designate the hedging instrument, based on the exposure being hedged, as a fair value hedge, a cash flow hedge or a hedge of the net investment in a foreign operation.
We formally document the relationship between the hedging instruments and hedged items, as well as the risk management objective and strategy, before undertaking an accounting hedge. To qualify for hedge accounting, the derivatives and related hedged items must be designated as a hedge at inception of the hedge relationship. In addition, a derivative must be highly effective at reducing the risk associated with the exposure being hedged. For accounting hedge relationships, we formally assess, both at the inception of the hedge and on an ongoing basis, if the derivatives are highly effective in offsetting designated changes in the fair value or cash flows of the hedged item. If it is determined that the derivative instrument is not highly effective, hedge accounting is discontinued. We assess effectiveness using statistical regression analysis. Where the critical terms of the derivative and hedged item match, effectiveness may be assessed qualitatively.
For derivatives that are designated as fair value hedges (i.e., hedging the exposure to changes in the fair value of an asset or a liability attributable to a particular risk, such as changes in LIBOR), changes in the fair value of the hedging instrument are recognized in earnings and offset by also recognizing in earnings the changes in the fair value of the hedged item attributable to the hedged risk. To the extent the change in fair value of the derivative does not offset the change in fair value of the hedged item, the difference is reflected in the Consolidated Income Statement in the same income statement line as the hedged item.

The PNC Financial Services Group, Inc. – 2019 Form 10-K 103
For derivatives designated as cash flow hedges (i.e., hedging the exposure to variability in expected future cash flows), the gain or loss on derivatives is reported as a component of AOCI and subsequently reclassified to income in the same period or periods during which the hedged cash flows affect earnings and recorded in the same income statement line item as the hedged cash flows. For derivatives designated as a hedge of net investment in a foreign operation, the gain or loss on the derivatives is reported as a component of AOCI.
We discontinue hedge accounting when it is determined that the derivative no longer qualifies as an effective hedge; the derivative expires or is sold, terminated or exercised; or the derivative is de-designated as a fair value or cash flow hedge or, for a cash flow hedge, it is no longer probable that the forecasted transaction will occur by the end of the originally specified time period.
We purchase or originate financial instruments that contain an embedded derivative. For financial instruments not measured at fair value with changes in fair value reported in earnings, we assess, at inception of the transaction, if the economic characteristics of the embedded derivative are clearly and closely related to the economic characteristics of the host contract, and whether a separate instrument with the same terms as the embedded derivative would be a derivative. If the embedded derivative is not clearly and closely related to the host contract and meets the definition of a derivative, the embedded derivative is recorded separately from the host contract with changes in fair value recorded in earnings, unless we elect to account for the hybrid instrument at fair value.
We have elected, on an instrument-by-instrument basis, fair value measurement for certain financial instruments with embedded derivatives.
We enter into commitments to originate residential and commercial mortgage loans for sale. We also enter into commitments to purchase or sell commercial and residential real estate loans. These commitments are accounted for as free-standing derivatives which are recorded at fair value in Other assets or Other liabilities on the Consolidated Balance Sheet. Any gain or loss from the change in fair value after the inception of the commitment is recognized in Noninterest income.
Income Taxes
We account for income taxes under the asset and liability method. Deferred tax assets and liabilities are determined based on differences between the financial reporting and tax bases of assets and liabilities and are measured using the enacted tax rates and laws that we expect will apply at the time when we believe the differences will reverse. Changes in tax rates and tax law are accounted for in the period of enactment. Thus, at the enactment date, deferred taxes are remeasured and the change is recognized in Income Tax expense. The recognition of deferred tax assets requires an assessment to determine the realization of such assets. Realization refers to the incremental benefit achieved through the reduction in future taxes payable or refunds receivable from the deferred tax assets, assuming that the underlying deductible differences and carryforwards are the last items to enter into the determination of future taxable income. We establish a valuation allowance for tax assets when it is more likely than not that they will not be realized, based upon all available positive and negative evidence.
We use the deferral method of accounting on investments that generate investment tax credits. Under this method, the investment tax credits are recognized as a reduction to the related asset.
Earnings Per Common Share
Basic earnings per common share is calculated using the two-class method to determine income attributable to common shareholders. Unvested share-based payment awards that contain nonforfeitable rights to dividends or dividend equivalents are considered participating securities under the two-class method. Distributed dividends and dividend equivalents related to participating securities and an allocation of undistributed net income to participating securities reduce the amount of income attributable to common shareholders. Income attributable to common shareholders is then divided by the weighted-average common shares outstanding for the period.
Diluted earnings per common share is calculated under the more dilutive of either the treasury method or the two-class method. For the diluted calculation, we increase the weighted-average number of shares of common stock outstanding by the assumed conversion of outstanding convertible preferred stock from the beginning of the year or date of issuance, if later, and the number of shares of common stock that would be issued assuming the exercise of stock options and warrants and the issuance of incentive shares using the treasury stock method. These adjustments to the weighted-average number of shares of common stock outstanding are made only when such adjustments will dilute earnings per common share. See Note 14 Earnings Per Share for additional information.

104 The PNC Financial Services Group, Inc. – 2019 Form 10-K
Recently Adopted Accounting Standards
Accounting StandardsUpdate (ASU) Description Financial Statement Impact
Leases - ASU 2016-02
Issued February 2016
• Requires lessees to recognize a right-of-use asset and related lease liability for all leases with lease terms of more than 12 months.
• Recognition, measurement and presentation of expenses and cash flows arising from a lease by a lessee will depend on its classification as a finance or operating lease.
• Targeted changes have been made to the lessor accounting model to align the guidance with the new lessee model and revenue recognition guidance.
• Permits option to adopt using a modified retrospective approach through a cumulative-effect adjustment to retained earnings at adoption.
• Adopted January 1, 2019 under the modified retrospective approach.
• Amended presentation and disclosures are made prospectively. Refer to the lease disclosures in this Note 1 and Note 24 Leases for additional information.
• The impact of adoption was immaterial to PNC's consolidated income statement.
• The impact of adoption of the changes to the lessor accounting model did not have a material impact on our financial statements.
Accounting Standards Update (ASU) Description Financial Statement Impact
Credit Losses - ASU 2016-13
Issued June 2016
Codification Improvements - ASU 2019-04
Various improvements related to Credit Losses (Topics 1, 2 and 5)
Issued April 2019
Targeted Transition Relief - Credit Losses - ASU 2019-05
Issued May 2019
Codification Improvements - ASU 2019-11
Issued November 2019
• Required effective date of January 1, 2020.• Commonly referred to as the Current Expected Credit
Losses (CECL) standard.• Replaces measurement, recognition and disclosure
guidance for credit related reserves (i.e., ALLL and the allowance for unfunded loan commitments and letters of credit) and OTTI for debt securities.
• Requires the use of an expected credit loss methodology; specifically, current expected credit losses for the remaining life of the asset will be recognized starting from the time of origination or acquisition.
• Methodology applies to loans, net investment in leases, debt securities and certain financial assets not accounted for at fair value through net income. It will also apply to off-balance sheet credit exposures except for unconditionally cancellable commitments.
• In-scope assets will be presented at the net amount expected to be collected after the deduction or addition of the allowance for credit losses (ACL) from the amortized cost basis of the assets.
• Requires inclusion of expected recoveries of previously charged-off amounts for in-scope assets.
• Requires enhanced credit quality disclosures including disaggregation of credit quality indicators by vintage.
• Requires a modified retrospective approach through a cumulative-effect adjustment to retained earnings at adoption.
Subsequent event• We adopted the CECL standard on January 1, 2020.• Based on current and forecasted economic conditions and
portfolio balances as of January 1, 2020, the adoption of the CECL standard resulted in an ACL of $3.7 billion. See Table 34 for details of the ACL composition and a summary of the impact of adoption. The overall change in total reserves at December 31, 2019 was primarily due to the move to a life of loan reserve estimate as well as methodology changes required under CECL.
• Our ACL estimate uses various models and estimation techniques based on our historical loss experience, current borrower characteristics, current conditions, reasonable and supportable forecasts and other relevant factors. Expected losses in our reasonable and supportable forecast period of three years are estimated using four macroeconomic scenarios and their estimated probabilities. These scenarios are produced by our economics team using a combination of structural models and expert judgment and are designed to reflect a range of plausible economic conditions and emerging business cycles over the next three years. After the end of the reasonable and supportable forecast period, expected losses are reverted to historical average losses, using a reversion period where applicable.
• ACL also includes identified qualitative factors related to idiosyncratic risk factors, changes in current economic conditions that may not be reflected in quantitatively derived results, and other relevant factors to ensure the ACL reflects our best estimate of current expected credit losses.
• We expect that our CECL estimate will be sensitive to various factors, including, but not limited to, the following major factors:
- Current economic conditions and borrower quality: Our forecast of expected losses depends on conditions and portfolio quality as of the estimation date. As current conditions evolve, forecasted losses could be materially affected.
- Scenario weights and design: Our loss estimates are sensitive to the shape and severity of macroeconomic forecasts and thus vary significantly between upside and downside scenarios. Changes to probability weights assigned to these scenarios and timing of peak business cycles reflected by the scenarios could materially affect our loss estimates.
- Portfolio volume and mix: Changes to the volume and mix in our portfolios could materially affect our estimates, as CECL reserves would be recognized at origination or acquisition.
• We implemented the CECL standard using the modified retrospective approach, and did not elect to maintain purchased credit impaired accounting upon adoption. We elected the one-time fair value option election for some of our purchased credit impaired loans and nonperforming assets.

The PNC Financial Services Group, Inc. – 2019 Form 10-K 105
Accounting Standards Update (ASU) Description Financial Statement Impact
Codification Improvements - ASU 2019-04
Topic 3: Codification Improvements to ASU 2017-12 and Other Hedging Items
Issued April 2019
• Required effective date of January 1, 2020. • Targeted improvements related to: - Partial-term fair value hedges of interest rate risk - Amortization of fair value hedge basis adjustments - Disclosure of fair value hedge basis adjustments - Consideration of the hedged contractually specified
interest rate under the hypothetical derivative method
- Application of a first-payments-received cash flow hedging technique to overall cash flows on a group of variable interest payments
- Update to transition guidance for ASU 2017-12• This ASU permits a one-time transfer out of held to
maturity securities to provide entities the opportunity to hedge fixed rate, prepayable securities under a last of layer hedging strategy (although an entity is not required to hedge such securities subsequent to transfer).
Subsequent event• We adopted this standard on January 1, 2020.• As permitted by the eligibility requirements in this guidance, at
adoption we elected to transfer debt securities with an amortized cost of $16.2 billion (fair value of $16.5 billion) from held to maturity to the available for sale portfolio. The transfer resulted in a pretax increase to AOCI of $306 million. There were no other impacts to PNC's consolidated financial statements from the adoption of this guidance.
The following table presents the impact of adopting CECL on January 1, 2020 on our allowance and retained earnings.
Table 34: Impact of the CECL Standard Adoption
ALLL (a) ACL (a)
In millions December 31, 2019 Transition Adjustment January 1, 2020
Allowance (a)Loans and leases
Commercial lending $ 1,812 $ (304) $ 1,508Consumer lending 930 767 1,697
Total loans and leases allowance 2,742 463 3,205Off-balance sheet credit exposures (b) 318 179 497Other — 19 19
Total allowance $ 3,060 $ 661 $ 3,721
In millions December 31, 2019 Transition Adjustment January 1, 2020
Impact to retained earnings (c) $ 42,215 $ (671) $ 41,544 (a) Amounts at December 31, 2019 represent the ALLL and the allowance for unfunded loan commitments and letters of credit. The amounts at January 1, 2020 represent the
ACL. (b) Off-balance sheet credit exposures are primarily unfunded loan commitments and letters of credit. (c) Transition adjustment includes the increase in the total allowance of $.7 billion and the impact of the fair value option election of $.2 billion, offset by the tax impact of $.2
billion.

106 The PNC Financial Services Group, Inc. – 2019 Form 10-K
NOTE 2 LOAN SALE AND SERVICING ACTIVITIES AND VARIABLE INTEREST ENTITIES
Loan Sale and Servicing Activities
We have transferred residential and commercial mortgage loans in securitization or sales transactions in which we have continuing involvement. These transfers have occurred through Agency securitization, Non-agency securitization, and loan sale transactions. Agency securitizations consist of securitization transactions with FNMA, Federal Home Loan Mortgage Corporation (FHLMC) and Government National Mortgage Association (GNMA) (collectively, the Agencies). FNMA and FHLMC generally securitize our transferred loans into mortgage-backed securities for sale into the secondary market through SPEs that they sponsor. As an authorized GNMA issuer/servicer, we pool Federal Housing Administration (FHA) and Department of Veterans Affairs (VA) insured loans into mortgage-backed securities for sale into the secondary market. In Non-agency securitizations, we have transferred loans into securitization SPEs. In other instances, third-party investors have also purchased our loans in loan sale transactions and in certain instances have subsequently sold these loans into securitization SPEs. Securitization SPEs utilized in the Agency and Non-agency securitization transactions are VIEs.
Our continuing involvement in the FNMA, FHLMC, and GNMA securitizations, Non-agency securitizations, and loan sale transactions generally consists of servicing, repurchasing previously transferred loans under certain conditions and loss share arrangements, and, in limited circumstances, holding of mortgage-backed securities issued by the securitization SPEs.
Depending on the transaction, we may act as the master, primary and/or special servicer to the securitization SPEs or third-party investors. Servicing responsibilities typically consist of collecting and remitting monthly borrower principal and interest payments, maintaining escrow deposits, performing loss mitigation and foreclosure activities, and, in certain instances, funding of servicing advances. Servicing advances, which are generally reimbursable, are made for principal and interest and collateral protection and are carried in Other assets at cost.
We earn servicing and other ancillary fees for our role as servicer and, depending on the contractual terms of the servicing arrangement, we can be terminated as servicer with or without cause. At the consummation date of each type of loan transfer where we retain the servicing, we recognize a servicing right at fair value. See Note 6 Fair Value and Note 7 Goodwill and Mortgage Servicing Rights for further discussion of our servicing rights.
Certain loans transferred to the Agencies contain removal of account provisions (ROAPs). Under these ROAPs, we hold an option to repurchase at par individual delinquent loans that meet certain criteria. In other limited cases, GNMA has granted us the right to repurchase current loans when we intend to modify the borrower’s interest rate under established guidelines. When we have the unilateral ability to repurchase a loan, effective control over the loan has been regained and we recognize an asset (in either Loans or Loans held for sale) and a corresponding liability (in Other borrowed funds) on the balance sheet regardless of our intent to repurchase the loan.
The Agency and Non-agency mortgage-backed securities issued by the securitization SPEs that are purchased and held on our balance sheet are typically purchased in the secondary market. We do not retain any credit risk on our Agency mortgage-backed security positions as FNMA, FHLMC and the U.S. Government (for GNMA) guarantee losses of principal and interest.
We also have involvement with certain Agency and Non-agency commercial securitization SPEs where we have not transferred commercial mortgage loans. These SPEs were sponsored by independent third-parties and the loans held by these entities were purchased exclusively from other third-parties. Generally, our involvement with these SPEs is as servicer with servicing activities consistent with those described above.
We recognize a liability for our loss exposure associated with contractual obligations to repurchase previously transferred loans due to possible breaches of representations and warranties and also for loss sharing arrangements (recourse obligations) with the Agencies. Other than providing temporary liquidity under servicing advances and our loss exposure associated with our repurchase and recourse obligations, we have not provided nor are we required to provide any type of credit support, guarantees or commitments to the securitization SPEs or third-party investors in these transactions.

The PNC Financial Services Group, Inc. – 2019 Form 10-K 107
The following table provides cash flows associated with our loan sale and servicing activities:
Table 35: Cash Flows Associated with Loan Sale and Servicing Activities
In millionsResidential Mortgages
Commercial Mortgages (a)
Cash Flows - Year ended December 31, 2019Sales of loans (b) $ 4,259 $ 3,540Repurchases of previously transferred loans (c) $ 321 $ 30Servicing fees (d) $ 352 $ 130Servicing advances recovered/(funded), net $ 45 $ 63Cash flows on mortgage-backed securities held (e) $ 4,362 $ 84Cash Flows - Year ended December 31, 2018Sales of loans (b) $ 4,474 $ 4,140Repurchases of previously transferred loans (c) $ 393 $ 32Servicing fees (d) $ 362 $ 135Servicing advances recovered/(funded), net $ 45 $ (3)Cash flows on mortgage-backed securities held (e) $ 1,964 $ 109
(a) Represents cash flow information associated with both commercial mortgage loan transfer and servicing activities.(b) Gains/losses recognized on sales of loans were insignificant for the periods presented.(c) Includes both residential and commercial mortgage government insured or guaranteed loans eligible for repurchase through the exercise of our ROAP option, as well as
residential mortgage loans repurchased due to alleged breaches of origination covenants or representations and warranties made to purchasers.(d) Includes contractually specified servicing fees, late charges and ancillary fees.(e) Represents cash flows on securities where we transferred to, and/or service loans for, a securitization SPE and we hold securities issued by that SPE. The carrying values of
such securities held were $17.8 billion in residential mortgage-backed securities and $.6 billion in commercial mortgage-backed securities at December 31, 2019 and $13.3 billion in residential mortgage-backed securities and $.6 billion in commercial mortgage-backed securities at December 31, 2018.
Table 36 presents information about the principal balances of transferred loans that we service and are not recorded on our Consolidated Balance Sheet. We would only experience a loss on these transferred loans if we were required to repurchase a loan, where the repurchase price exceeded the loan's fair value, due to a breach in representations and warranties or a loss sharing arrangement associated with our continuing involvement with these loans. The estimate of losses related to breaches in representations and warranties was insignificant at December 31, 2019 and 2018.
Table 36: Principal Balance, Delinquent Loans and Net Charge-offs Related to Serviced Loans For Others
In millions Residential Mortgages Commercial Mortgages (a)
December 31, 2019Total principal balance $ 49,323 $ 42,414Delinquent loans (b) $ 492 $ 64December 31, 2018Total principal balance $ 54,028 $ 47,969Delinquent loans (b) $ 622 $ 234Year ended December 31, 2019Net charge-offs (c) $ 40 $ 520Year ended December 31, 2018Net charge-offs (c) $ 47 $ 269
(a) Represents information at the securitization level in which we have sold loans and we are the servicer for the securitization.(b) Serviced delinquent loans are 90 days or more past due or are in process of foreclosure.(c) Net charge-offs for Residential mortgages represent credit losses less recoveries distributed and as reported to investors during the period. Net charge-offs for Commercial
mortgages represent credit losses less recoveries distributed and as reported by the trustee for commercial mortgage backed securitizations. Realized losses for Agency securitizations are not reflected as we do not manage the underlying real estate upon foreclosure and, as such, do not have access to loss information.
Variable Interest Entities (VIEs)
We are involved with various entities in the normal course of business that are deemed to be VIEs. We assess VIEs for consolidation based upon the accounting policies described in Note 1 Accounting Policies. Our consolidated VIEs were insignificant at both December 31, 2019 and 2018. We have not provided additional financial support to these entities which we are not contractually required to provide.
The following table provides a summary of non-consolidated VIEs with which we have significant continuing involvement but are not the primary beneficiary. We have excluded certain transactions with non-consolidated VIEs from the balances presented in Table 37 where we have determined that our continuing involvement is not significant. We do not consider our continuing involvement to be significant when it relates to a VIE where we only invest in securities issued by the VIE and were not involved in the design of the VIE or where no transfers have occurred between us and the VIE. In addition, where we only have lending arrangements in the normal

108 The PNC Financial Services Group, Inc. – 2019 Form 10-K
course of business with entities that could be VIEs, we have excluded these transactions with non-consolidated entities from the balances presented in Table 37. These loans are included as part of the asset quality disclosures that we make in Note 3 Asset Quality.
Table 37: Non-Consolidated VIEs
In millions PNC Risk of Loss (a)Carrying Value of Assets
Owned by PNC Carrying Value of Liabilities
Owned by PNC
December 31, 2019 Mortgage-backed securitizations (b) $ 19,287 $ 19,287 (c) Tax credit investments and other 3,131 3,028 (d) $ 1,101 (e)
Total $ 22,418 $ 22,315 $ 1,101 December 31, 2018 Mortgage-backed securitizations (b) $ 14,266 $ 14,266 (c) Tax credit investments and other 2,949 2,911 (d) $ 806 (e)
Total $ 17,215 $ 17,177 $ 806 (a) Represents loans, investments and other assets related to non-consolidated VIEs, net of collateral (if applicable). The risk of loss excludes any potential tax recapture
associated with tax credit investments.(b) Amounts reflect involvement with securitization SPEs where we transferred to, and/or service loans for, an SPE and we hold securities issued by that SPE. Values disclosed
in the PNC Risk of Loss column represent our maximum exposure to loss for those securities’ holdings.(c) Included in Investment securities, Mortgage servicing rights and Other assets on our Consolidated Balance Sheet.(d) Included in Investment securities, Loans, Equity investments and Other assets on our Consolidated Balance Sheet.(e) Included in Deposits and Other liabilities on our Consolidated Balance Sheet. Mortgage-Backed Securitizations
In connection with each Agency and Non-agency residential and commercial mortgage-backed securitization discussed above, we evaluate each SPE utilized in these transactions for consolidation. In performing these assessments, we evaluate our level of continuing involvement in these transactions as the nature of our involvement ultimately determines whether or not we hold a variable interest and/or are the primary beneficiary of the SPE. Factors we consider in our consolidation assessment include the significance of (i) our role as servicer, (ii) our holdings of mortgage-backed securities issued by the securitization SPE and (iii) the rights of third-party variable interest holders.
The first step in our assessment is to determine whether we hold a variable interest in the securitization SPE. We hold variable interests in Agency and Non-agency securitization SPEs through our holding of residential and commercial mortgage-backed securities issued by the SPEs and/or our recourse obligations. Each SPE in which we hold a variable interest is evaluated to determine whether we are the primary beneficiary of the entity. For Agency securitization transactions, our contractual role as servicer does not give us the power to direct the activities that most significantly affect the economic performance of the SPEs. Thus, we are not the primary beneficiary of these entities. For Non-agency securitization transactions, we would be the primary beneficiary to the extent our servicing activities give us the power to direct the activities that most significantly affect the economic performance of the SPE and we hold a more than insignificant variable interest in the entity.
Details about the Agency and Non-agency securitization SPEs where we hold a variable interest and are not the primary beneficiary are included in Table 37. Our maximum exposure to loss as a result of our involvement with these SPEs is the carrying value of the mortgage-backed securities, servicing assets, servicing advances and our liabilities associated with our recourse obligations. Creditors of the securitization SPEs have no recourse to our assets or general credit.
Tax Credit Investments and Other
For tax credit investments in which we do not have the right to make decisions that will most significantly impact the economic performance of the entity, we are not the primary beneficiary and thus do not consolidate the entity. These investments are disclosed in Table 37. The table also reflects our maximum exposure to loss exclusive of any potential tax credit recapture. Our maximum exposure to loss is equal to our legally binding equity commitments adjusted for recorded impairment, partnership results or amortization for qualifying low income housing tax credit investments when applicable. For all legally binding unfunded equity commitments, we increase our recognized investment and recognize a liability. As of December 31, 2019, we had a liability for unfunded commitments of $.6 billion related to investments in qualified affordable housing projects which is reflected in Other liabilities on our Consolidated Balance Sheet.
Table 37 also includes our involvement in lease financing transactions with limited liability companies (LLCs) engaged in solar power generation that, to a large extent, provided returns in the form of tax credits. The outstanding financings and operating lease assets are reflected as Loans and Other assets, respectively, on our Consolidated Balance Sheet, whereas related liabilities are reported in Deposits and Other liabilities.

The PNC Financial Services Group, Inc. – 2019 Form 10-K 109
We make certain equity investments in various tax credit limited partnerships or LLCs. The purpose of these investments is to achieve a satisfactory return on capital and to assist us in achieving goals associated with the Community Reinvestment Act. During 2019 we recognized $.2 billion of amortization, $.2 billion of tax credits and $.1 billion of other tax benefits associated with qualified investments in low income housing tax credits within Income taxes.
NOTE 3 ASSET QUALITY
We closely monitor economic conditions and loan performance trends to manage and evaluate our exposure to credit risk. Trends in delinquency rates may be a key indicator, among other considerations, of credit risk within the loan portfolios. The measurement of delinquency status is based on the contractual terms of each loan. Loans that are 30 days or more past due in terms of payment are considered delinquent.
Nonperforming assets include nonperforming loans and leases, other real estate owned (OREO) and foreclosed assets. Nonperforming loans are those loans accounted for at amortized cost whose credit quality has deteriorated to the extent that full collection of contractual principal and interest is not probable. Interest income is not recognized on these loans. Loans accounted for under the fair value option are reported as performing loans. However, when nonaccrual criteria is met, interest income is not recognized on these loans. Additionally, certain government insured or guaranteed loans for which we expect to collect substantially all principal and interest are not reported as nonperforming loans and continue to accrue interest. Purchased impaired loans are excluded from nonperforming loans as we are currently accreting interest income over the expected life of the loans.
See Note 1 Accounting Policies for additional information on our loan related policies.

110 The PNC Financial Services Group, Inc. – 2019 Form 10-K
The following tables display the delinquency status of our loans and our nonperforming assets at December 31, 2019 and 2018, respectively.
Table 38: Analysis of Loan Portfolio (a)
Accruing
Dollars in millions
Current or LessThan 30 Days
Past Due
30-59Days
Past Due
60-89Days
Past Due
90 DaysOr MorePast Due
TotalPast
Due (b) Nonperforming
Loans
Fair ValueOption
NonaccrualLoans (c)
PurchasedImpaired
LoansTotal
Loans (d)
December 31, 2019 Commercial Lending
Commercial $ 124,695 $ 102 $ 30 $ 85 $ 217 $ 425 $125,337Commercial real estate 28,061 4 1 5 44 28,110Equipment lease financing 7,069 49 5 54 32 7,155
Total commercial lending 159,825 155 36 85 276 501 160,602Consumer Lending
Home equity 23,791 58 24 82 669 $ 543 25,085Residential real estate 19,640 140 69 315 524 (b) 315 $ 166 1,176 21,821Automobile 16,376 178 47 18 243 135 16,754Credit card 7,133 60 37 67 164 11 7,308Education 3,156 55 34 91 180 (b) 3,336Other consumer 4,898 15 11 9 35 4 4,937
Total consumer lending 74,994 506 222 500 1,228 1,134 166 1,719 79,241Total $ 234,819 $ 661 $ 258 $ 585 $ 1,504 $ 1,635 $ 166 $ 1,719 $239,843
Percentage of total loans 97.90% .28% .11% .24% .63% .68% .07% .72% 100.00%December 31, 2018
Commercial Lending Commercial $ 116,300 $ 82 $ 54 $ 52 $ 188 $ 346 $116,834Commercial real estate 28,056 6 3 9 75 28,140Equipment lease financing 7,229 56 12 68 11 7,308
Total commercial lending 151,585 144 69 52 265 432 152,282Consumer Lending
Home equity 24,556 66 25 91 797 $ 679 26,123Residential real estate 16,216 135 73 363 571 (b) 350 $ 182 1,338 18,657Automobile 14,165 113 29 12 154 100 14,419Credit card 6,222 46 29 53 128 7 6,357Education 3,571 69 41 141 251 (b) 3,822Other consumer 4,552 12 5 8 25 8 4,585
Total consumer lending 69,282 441 202 577 1,220 1,262 182 2,017 73,963Total $ 220,867 $ 585 $ 271 $ 629 $ 1,485 $ 1,694 $ 182 $ 2,017 $226,245
Percentage of total loans 97.62% .26% .12% .28% .66% .75% .08% .89% 100.00%(a) Amounts in table represent recorded investment and exclude loans held for sale. Recorded investment does not include any associated valuation allowance.(b) Past due loan amounts exclude purchased impaired loans, even if contractually past due (or if we do not expect to receive payment in full based on the original contractual
terms), as we are currently accreting interest income over the expected life of the loans. Past due loan amounts include government insured or guaranteed Residential real estate loans totaling $.4 billion and $.5 billion at December 31, 2019 and 2018, respectively, and Education loans totaling $.2 billion at both December 31, 2019 and 2018.
(c) Consumer loans accounted for under the fair value option for which we do not expect to collect substantially all principal and interest are subject to nonaccrual accounting and classification upon meeting any of our nonaccrual policies. Given that these loans are not accounted for at amortized cost, these loans have been excluded from the nonperforming loan population.
(d) Net of unearned income, unamortized deferred fees and costs on originated loans, and premiums or discounts on purchased loans totaling $1.1 billion and $1.2 billion December 31, 2019 and 2018, respectively.
In the normal course of business, we originate or purchase loan products with contractual characteristics that, when concentrated, may increase our exposure as a holder of those loan products. Possible product features that may create a concentration of credit risk would include a high original or updated loan-to-value (LTV) ratio, terms that may expose the borrower to future increases in repayments above increases in market interest rates, and interest-only loans, among others.
We originate interest-only loans to commercial borrowers. Such credit arrangements are usually designed to match borrower cash flow expectations (e.g., working capital lines, revolvers). These products are standard in the financial services industry and product features

The PNC Financial Services Group, Inc. – 2019 Form 10-K 111
are considered during the underwriting process to mitigate the increased risk that the interest-only feature may result in borrowers not being able to make interest and principal payments when due. We do not believe that these product features create a concentration of credit risk.
At December 31, 2019, we pledged $16.9 billion of commercial loans to the Federal Reserve Bank and $68.0 billion of residential real estate and other loans to the Federal Home Loan Bank as collateral for the ability to borrow, if necessary. The comparable amounts at December 31, 2018 were $17.3 billion and $63.2 billion, respectively. Amounts pledged reflect the unpaid principal balances.
Table 39: Nonperforming Assets
Dollars in millionsDecember 31
2019December 31
2018
Nonperforming loansTotal commercial lending $ 501 $ 432Total consumer lending (a) 1,134 1,262
Total nonperforming loans 1,635 1,694OREO and foreclosed assets 117 114Total nonperforming assets $ 1,752 $ 1,808Nonperforming loans to total loans .68% .75%Nonperforming assets to total loans, OREO and foreclosed assets .73% .80%Nonperforming assets to total assets .43% .47%Interest on nonperforming loans (b)
Computed on original terms $ 124 $ 123Recognized prior to nonperforming status $ 17 $ 17
(a) Excludes most unsecured consumer loans and lines of credit, which are charged off after 120 to 180 days past due and are not placed on nonperforming status.(b) Amounts are for the year ended.
Nonperforming loans also include certain loans whose terms have been restructured in a manner that grants a concession to a borrower experiencing financial difficulties. In accordance with applicable accounting guidance, these loans are considered TDRs. See Note 1 Accounting Policies and the TDR section of this Note 3 for additional information on TDRs.
Total nonperforming loans in Table 39 include TDRs of $.9 billion at both December 31, 2019 and 2018. TDRs that are performing, including consumer credit card TDR loans, totaled $.8 billion and $1.0 billion at December 31, 2019 and 2018, respectively, and are excluded from nonperforming loans.
Additional Asset Quality Indicators
We have two portfolio segments – Commercial Lending and Consumer Lending. Each of these segments comprises multiple loan classes. Classes are characterized by similarities in initial measurement, risk attributes and the manner in which we monitor and assess credit risk. The Commercial Lending segment is composed of the commercial, commercial real estate and equipment lease financing loan classes. The Consumer Lending segment is composed of the home equity, residential real estate, automobile, credit card, education and other consumer loan classes.
Commercial Lending Loan Classes
Commercial Loan ClassFor commercial loans, we monitor the performance of the borrower in a disciplined and regular manner based upon the level of credit risk inherent in the loan. To evaluate the level of credit risk, we assign internal risk ratings reflecting our estimates of the borrower’s PD and LGD for each related credit facility. This two-dimensional credit risk rating methodology provides granularity in the risk monitoring process on an ongoing basis. These ratings are reviewed and updated, generally at least once per year. Additionally, no less frequently than on an annual basis, we review PD rates related to each rating grade based upon internal historical data. These rates are updated as needed and augmented by market data as deemed necessary. For small balance homogeneous pools of commercial loans, mortgages and leases, we apply statistical modeling to assist in determining the PD within these pools. Further, on a periodic basis, we update our LGD estimation methodology based upon historical data. The combination of the PD and LGD ratings assigned to commercial loans, capturing both the combination of expectations of default and loss severity in event of default, reflects the relative estimated likelihood of loss at the reporting date. In general, loans with better PD and LGD tend to have a lower likelihood of loss compared to loans with worse PD and LGD. The loss amount also considers an estimate of EAD, which we also periodically update based upon historical data.

112 The PNC Financial Services Group, Inc. – 2019 Form 10-K
Based upon the amount of the lending arrangement and our risk rating assessment, we follow a formal schedule of written periodic review. Quarterly, we conduct formal reviews of a market’s or business unit’s loan portfolio, focusing on those loans which we perceive to be of higher risk, based upon PDs and LGDs, or loans for which credit quality is weakening. If circumstances warrant, it is our practice to review any customer obligation and its level of credit risk more frequently. We attempt to proactively manage our loans by using various procedures that are customized to the risk of a given loan, including ongoing outreach, contact, and assessment of obligor financial conditions, collateral inspection and appraisal.
Commercial Real Estate Loan ClassWe manage credit risk associated with our commercial real estate loan class similar to commercial loans by analyzing PD and LGD. Additionally, risks associated with commercial real estate activities tend to be correlated to the loan structure and collateral location, project progress and business environment. As a result, these attributes are also monitored and utilized in assessing credit risk.
As with the commercial class, a formal schedule of periodic review is also performed to assess market/geographic risk and business unit/industry risk. Often as a result of these overviews, increased scrutiny can be placed on areas of higher risk, including adverse changes in risk ratings, deteriorating operating trends, and/or areas that concern management. These reviews are designed to assess risk and take actions to mitigate our exposure to such risks.
Equipment Lease Financing Loan ClassWe manage credit risk associated with our equipment lease financing loan class similar to commercial loans by analyzing PD and LGD.
Based upon the dollar amount of the lease and the level of credit risk, we follow a formal schedule of periodic review. Generally, this occurs quarterly, although we have established practices to review such credit risk more frequently if circumstances warrant. Our review process entails analysis of the following factors: equipment value/residual value, exposure levels, jurisdiction risk, industry risk and guarantor requirements as applicable.
Table 40: Commercial Lending Asset Quality Indicators (a)
In millions Pass Rated Criticized Total Loans
December 31, 2019Commercial $ 119,761 $ 5,576 $ 125,337Commercial real estate 27,424 686 28,110Equipment lease financing 6,891 264 7,155
Total commercial lending $ 154,076 $ 6,526 $ 160,602December 31, 2018
Commercial $ 111,276 $ 5,558 $ 116,834Commercial real estate 27,682 458 28,140Equipment lease financing 7,180 128 7,308
Total commercial lending $ 146,138 $ 6,144 $ 152,282(a) Loans are classified as Pass Rated and Criticized based on the regulatory classification definitions. The Criticized classification includes loans that were rated special
mention, substandard or doubtful as of December 31, 2019 and 2018. We use PD and LGD to rate loans in the commercial lending portfolio.
Consumer Lending Loan Classes
Home Equity and Residential Real Estate Loan ClassesWe use several credit quality indicators, including delinquency information, nonperforming loan information, updated credit scores, and originated and updated LTV ratios to monitor and manage credit risk within the home equity and residential real estate loan classes. A summary of asset quality indicators follows:
Delinquency/Delinquency Rates: We monitor trending of delinquency/delinquency rates for home equity and residential real estate loans. See Table 38 for additional information.
Nonperforming Loans: We monitor trending of nonperforming loans for home equity and residential real estate loans. See Table 38 for additional information.
Credit Scores: We use a national third-party provider to update FICO credit scores for home equity loans and lines of credit and residential real estate loans at least quarterly. The updated scores are incorporated into a series of credit management reports, which are utilized to monitor the risk in the loan classes.

The PNC Financial Services Group, Inc. – 2019 Form 10-K 113
LTV (inclusive of combined loan-to-value (CLTV) for first and subordinate lien positions): At least annually, we update the property values of real estate collateral and calculate an updated LTV ratio. For open-end credit lines secured by real estate in regions experiencing significant declines in property values, more frequent valuations may occur. We examine LTV migration and stratify LTV into categories to monitor the risk in the loan classes.
We use a combination of original LTV and updated LTV for internal risk management and reporting purposes (e.g., line management, loss mitigation strategies). In addition to the fact that estimated property values by their nature are estimates, given certain data limitations it is important to note that updated LTVs may be based upon management’s assumptions (e.g., if an updated LTV is not provided by the third-party service provider, house price index (HPI) changes will be incorporated in arriving at management’s estimate of updated LTV).
Updated LTV is estimated using modeled property values. The related estimates and inputs are based upon an approach that uses a combination of third-party automated valuation models, broker price opinions, HPI indices, property location, internal and external balance information, origination data and management assumptions. We generally utilize origination lien balances provided by a third-party, where applicable, which do not include an amortization assumption when calculating updated LTV. Accordingly, the results of the calculations do not represent actual appraised loan level collateral or updated LTV based upon lien balances held by others, and as such, are necessarily imprecise and subject to change as we refine our methodology.
The following table presents certain asset quality indicators for the home equity and residential real estate loan classes.
Table 41: Asset Quality Indicators for Home Equity and Residential Real Estate Loans
December 31, 2019 December 31, 2018
Home equityResidential real
estate Home equityResidential real
estateIn millions
Current estimated LTV ratios Greater than or equal to 125% $ 366 $ 112 $ 461 $ 116Greater than or equal to 100% to less than 125% 877 221 1,020 255Greater than or equal to 90% to less than 100% 1,047 340 1,174 335Less than 90% 22,068 19,305 22,644 15,922No LTV ratio available 184 83 145 6
Government insured or guaranteed loans 584 685Purchased impaired loans 543 1,176 679 1,338
Total loans $ 25,085 $ 21,821 $ 26,123 $ 18,657Updated FICO Scores
Greater than 660 $ 22,245 $ 19,341 $ 22,996 $ 15,956Less than or equal to 660 2,019 569 2,210 585No FICO score available 278 151 238 93
Government insured or guaranteed loans 584 685Purchased impaired loans 543 1,176 679 1,338
Total loans $ 25,085 $ 21,821 $ 26,123 $ 18,657
Automobile, Credit Card, Education and Other Consumer Loan ClassesWe monitor a variety of asset quality information in the management of these consumer loan classes. For all loan types, we generally use a combination of internal loan parameters as well as an updated FICO score. We use FICO scores as a primary asset quality indicator for automobile and credit card loans, as well as non-government guaranteed or non-insured education loans and other secured and unsecured lines and loans. Internal credit metrics, such as delinquency status, are relied upon heavily as asset quality indicators for government guaranteed or insured education loans and consumer loans to high net worth individuals, as internal credit metrics tend to be more relevant than FICO scores for these types of loans.
Along with the monitoring of delinquency trends and losses for each class, FICO credit score updates are obtained at least quarterly along with a variety of credit bureau attributes. Loans with high FICO scores tend to have a lower likelihood of loss. Conversely, loans with low FICO scores tend to have a higher likelihood of loss.
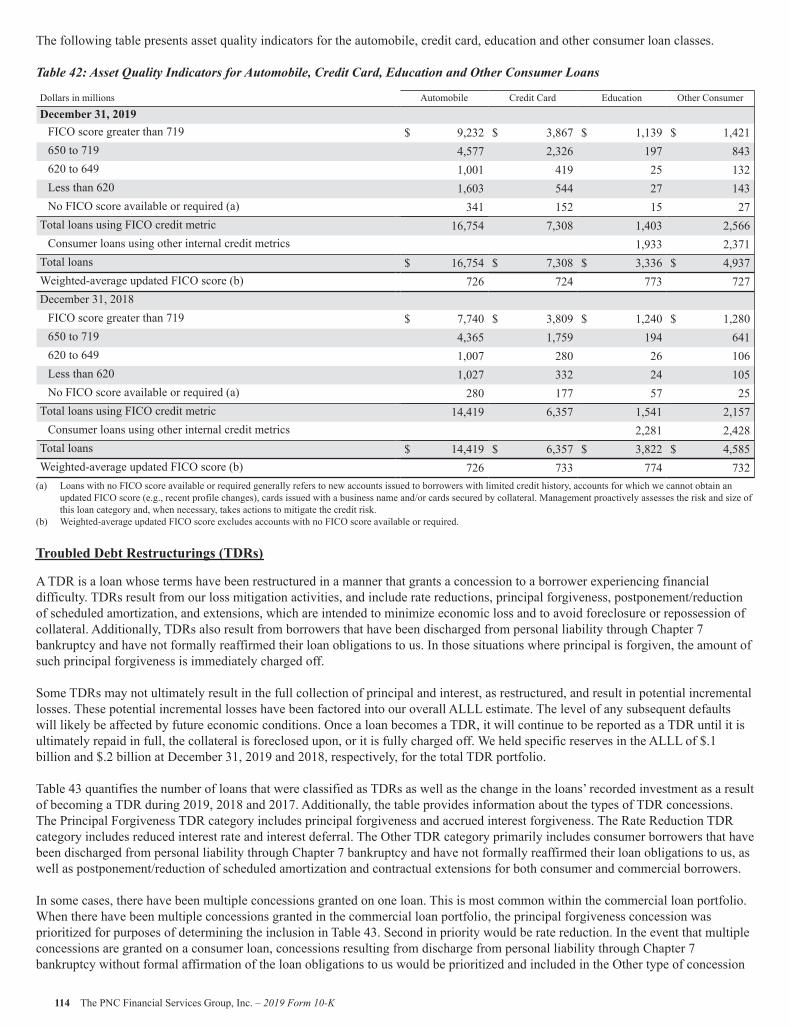
114 The PNC Financial Services Group, Inc. – 2019 Form 10-K
The following table presents asset quality indicators for the automobile, credit card, education and other consumer loan classes.
Table 42: Asset Quality Indicators for Automobile, Credit Card, Education and Other Consumer Loans
Dollars in millions Automobile Credit Card Education Other Consumer
December 31, 2019FICO score greater than 719 $ 9,232 $ 3,867 $ 1,139 $ 1,421650 to 719 4,577 2,326 197 843620 to 649 1,001 419 25 132Less than 620 1,603 544 27 143No FICO score available or required (a) 341 152 15 27
Total loans using FICO credit metric 16,754 7,308 1,403 2,566Consumer loans using other internal credit metrics 1,933 2,371
Total loans $ 16,754 $ 7,308 $ 3,336 $ 4,937Weighted-average updated FICO score (b) 726 724 773 727December 31, 2018
FICO score greater than 719 $ 7,740 $ 3,809 $ 1,240 $ 1,280650 to 719 4,365 1,759 194 641620 to 649 1,007 280 26 106Less than 620 1,027 332 24 105No FICO score available or required (a) 280 177 57 25
Total loans using FICO credit metric 14,419 6,357 1,541 2,157Consumer loans using other internal credit metrics 2,281 2,428
Total loans $ 14,419 $ 6,357 $ 3,822 $ 4,585Weighted-average updated FICO score (b) 726 733 774 732
(a) Loans with no FICO score available or required generally refers to new accounts issued to borrowers with limited credit history, accounts for which we cannot obtain an updated FICO score (e.g., recent profile changes), cards issued with a business name and/or cards secured by collateral. Management proactively assesses the risk and size of this loan category and, when necessary, takes actions to mitigate the credit risk.
(b) Weighted-average updated FICO score excludes accounts with no FICO score available or required.
Troubled Debt Restructurings (TDRs)
A TDR is a loan whose terms have been restructured in a manner that grants a concession to a borrower experiencing financial difficulty. TDRs result from our loss mitigation activities, and include rate reductions, principal forgiveness, postponement/reduction of scheduled amortization, and extensions, which are intended to minimize economic loss and to avoid foreclosure or repossession of collateral. Additionally, TDRs also result from borrowers that have been discharged from personal liability through Chapter 7 bankruptcy and have not formally reaffirmed their loan obligations to us. In those situations where principal is forgiven, the amount of such principal forgiveness is immediately charged off.
Some TDRs may not ultimately result in the full collection of principal and interest, as restructured, and result in potential incremental losses. These potential incremental losses have been factored into our overall ALLL estimate. The level of any subsequent defaults will likely be affected by future economic conditions. Once a loan becomes a TDR, it will continue to be reported as a TDR until it is ultimately repaid in full, the collateral is foreclosed upon, or it is fully charged off. We held specific reserves in the ALLL of $.1 billion and $.2 billion at December 31, 2019 and 2018, respectively, for the total TDR portfolio.
Table 43 quantifies the number of loans that were classified as TDRs as well as the change in the loans’ recorded investment as a result of becoming a TDR during 2019, 2018 and 2017. Additionally, the table provides information about the types of TDR concessions. The Principal Forgiveness TDR category includes principal forgiveness and accrued interest forgiveness. The Rate Reduction TDR category includes reduced interest rate and interest deferral. The Other TDR category primarily includes consumer borrowers that have been discharged from personal liability through Chapter 7 bankruptcy and have not formally reaffirmed their loan obligations to us, as well as postponement/reduction of scheduled amortization and contractual extensions for both consumer and commercial borrowers.
In some cases, there have been multiple concessions granted on one loan. This is most common within the commercial loan portfolio. When there have been multiple concessions granted in the commercial loan portfolio, the principal forgiveness concession was prioritized for purposes of determining the inclusion in Table 43. Second in priority would be rate reduction. In the event that multiple concessions are granted on a consumer loan, concessions resulting from discharge from personal liability through Chapter 7 bankruptcy without formal affirmation of the loan obligations to us would be prioritized and included in the Other type of concession

The PNC Financial Services Group, Inc. – 2019 Form 10-K 115
in Table 43. After that, consumer loan concessions would follow the previously discussed priority of concessions for the commercial loan portfolio.
Table 43: Financial Impact and TDRs by Concession Type (a)
Number
of Loans
Pre-TDRRecorded
Investment (b)
Post-TDR Recorded Investment (c)During the year ended December 31, 2019Dollars in millions
PrincipalForgiveness
RateReduction Other Total
Total commercial lending 75 $ 278 $ 11 $ 241 $ 252Total consumer lending 14,548 172 97 64 161
Total TDRs 14,623 $ 450 $ 108 $ 305 $ 413During the year ended December 31, 2018Dollars in millions Total commercial lending 85 $ 272 $ 2 $ 67 $ 179 $ 248Total consumer lending 12,096 163 1 86 63 150
Total TDRs 12,181 $ 435 $ 3 $ 153 $ 242 $ 398During the year ended December 31, 2017Dollars in millions Total commercial lending 120 $ 293 $ 18 $ 7 $ 227 $ 252Total consumer lending 11,993 248 146 97 243
Total TDRs 12,113 $ 541 $ 18 $ 153 $ 324 $ 495(a) Impact of partial charge-offs at TDR date are included in this table.(b) Represents the recorded investment of the loans as of the quarter end prior to TDR designation, and excludes immaterial amounts of accrued interest receivable.(c) Represents the recorded investment of the TDRs as of the end of the quarter in which the TDR occurs, and excludes immaterial amounts of accrued interest receivable.
After a loan is determined to be a TDR, we continue to track its performance under its most recent restructured terms. We consider a TDR to have subsequently defaulted when it becomes 60 days past due after the most recent date the loan was restructured. The recorded investment of loans that were both (i) classified as TDRs or were subsequently modified during each 12-month period preceding January 1, 2019, 2018 and 2017, and (ii) subsequently defaulted during the 12-month period following each of January 1, 2019, 2018 and 2017, totaled $.1 billion for all periods presented.
Impaired Loans
Impaired loans include commercial and consumer nonperforming loans and TDRs, regardless of nonperforming status. TDRs that were previously recorded at amortized cost and are now classified and accounted for as held for sale are also included. Excluded from impaired loans are nonperforming leases, loans accounted for as held for sale other than the TDRs described in the preceding sentence, loans accounted for under the fair value option, smaller balance homogeneous type loans and purchased impaired loans. We did not recognize any interest income on impaired loans that have not returned to performing status, while they were impaired during 2019 and 2018. Table 44 provides further detail on impaired loans individually evaluated for impairment and the associated ALLL. Certain commercial and consumer impaired loans do not have a related ALLL as the valuation of these impaired loans exceeded the recorded investment.

116 The PNC Financial Services Group, Inc. – 2019 Form 10-K
Table 44: Impaired Loans
In millionsUnpaid Principal
BalanceRecorded
InvestmentAssociatedAllowance
Average RecordedInvestment (a)
December 31, 2019Impaired loans with an associated allowance
Total commercial lending $ 527 $ 386 $ 98 $ 371Total consumer lending 702 668 93 753
Total impaired loans with an associated allowance 1,229 1,054 191 1,124Impaired loans without an associated allowance
Total commercial lending 228 195 276Total consumer lending 1,022 635 623
Total impaired loans without an associated allowance 1,250 830 899Total impaired loans $ 2,479 $ 1,884 $ 191 $ 2,023
December 31, 2018Impaired loans with an associated allowance
Total commercial lending $ 440 $ 315 $ 73 $ 349Total consumer lending 863 817 136 904
Total impaired loans with an associated allowance 1,303 1,132 209 1,253Impaired loans without an associated allowance
Total commercial lending 413 326 294Total consumer lending 1,042 625 645
Total impaired loans without an associated allowance 1,455 951 939Total impaired loans $ 2,758 $ 2,083 $ 209 $ 2,192
(a) Average recorded investment is for the years ended December 31, 2019 and 2018.

The PNC Financial Services Group, Inc. – 2019 Form 10-K 117
NOTE 4 ALLOWANCE FOR LOAN AND LEASE LOSSES
We maintain the ALLL at levels that we believe to be appropriate to absorb estimated probable credit losses incurred in the portfolios as of the balance sheet date. We have two portfolio segments – Commercial Lending and Consumer Lending, and develop and document the ALLL under separate methodologies for each of these portfolio segments. See Note 1 Accounting Policies for a description of the accounting policies for the ALLL. A rollforward of the ALLL and associated loan data follows.
Table 45: Rollforward of Allowance for Loan and Lease Losses and Associated Loan Data
2019 2018 2017
At or for the year ended December 31Dollars in millions
CommercialLending
ConsumerLending Total
CommercialLending
ConsumerLending Total
CommercialLending
ConsumerLending Total
Allowance for Loan and Lease LossesJanuary 1 $ 1,663 $ 966 $ 2,629 $ 1,582 $ 1,029 $ 2,611 $ 1,534 $ 1,055 $ 2,589Charge-offs (216) (758) (974) (124) (640) (764) (221) (565) (786)Recoveries 78 254 332 99 245 344 116 213 329
Net (charge-offs) (138) (504) (642) (25) (395) (420) (105) (352) (457)Provision for credit losses 320 453 773 97 311 408 147 294 441Net decrease / (increase) in allowance
for unfunded loan commitments andletters of credit (34) 1 (33) 11 1 12 5 (1) 4
Other 1 14 15 (2) 20 18 1 33 34December 31 $ 1,812 $ 930 $ 2,742 $ 1,663 $ 966 $ 2,629 $ 1,582 $ 1,029 $ 2,611
TDRs individually evaluated forimpairment $ 40 $ 93 $ 133 $ 25 $ 136 $ 161 $ 35 $ 195 $ 230
Other loans individually evaluated forimpairment 58 58 48 48 41 41
Loans collectively evaluated forimpairment 1,714 563 2,277 1,590 555 2,145 1,506 561 2,067
Purchased impaired loans 274 274 275 275 273 273December 31 $ 1,812 $ 930 $ 2,742 $ 1,663 $ 966 $ 2,629 $ 1,582 $ 1,029 $ 2,611
Loan PortfolioTDRs individually evaluated for
impairment $ 361 $ 1,303 $ 1,664 $ 409 $ 1,442 $ 1,851 $ 409 $ 1,652 $ 2,061Other loans individually evaluated for
impairment 220 220 232 232 310 310Loans collectively evaluated for
impairment 160,021 75,477 235,498 151,641 69,722 221,363 146,720 68,102 214,822Fair value option loans (a) 742 742 782 782 869 869Purchased impaired loans 1,719 1,719 2,017 2,017 2,396 2,396
December 31 $ 160,602 $ 79,241 $ 239,843 $ 152,282 $ 73,963 $ 226,245 $ 147,439 $ 73,019 $ 220,458Portfolio segment ALLL as a
percentage of total ALLL 66% 34% 100% 63% 37% 100% 61% 39% 100%Ratio of ALLL to total loans 1.13% 1.17% 1.14% 1.09% 1.31% 1.16% 1.07% 1.41% 1.18%
(a) Loans accounted for under the fair value option are not evaluated for impairment as these loans are accounted for at fair value. Accordingly there is no allowance recorded on these loans.
Net interest income less the provision for credit losses was $9.2 billion, $9.3 billion and $8.7 billion for 2019, 2018 and 2017, respectively.

118 The PNC Financial Services Group, Inc. – 2019 Form 10-K
NOTE 5 INVESTMENT SECURITIES
Table 46: Investment Securities Summary
December 31, 2019 December 31, 2018
In millionsAmortized
CostUnrealized Fair
ValueAmortized
CostUnrealized Fair
ValueGains Losses Gains LossesSecurities Available for Sale
U.S. Treasury and government agencies $ 16,150 $ 382 $ (16) $ 16,516 $ 18,104 $ 133 $ (137) $ 18,100Residential mortgage-backed
Agency 35,847 517 (43) 36,321 29,413 104 (524) 28,993Non-agency 1,515 302 (3) 1,814 1,924 300 (13) 2,211
Commercial mortgage-backedAgency 3,094 42 (18) 3,118 2,630 13 (66) 2,577Non-agency 3,352 29 (9) 3,372 2,689 5 (37) 2,657
Asset-backed 5,044 78 (8) 5,114 4,933 59 (20) 4,972Other 2,788 121 (1) 2,908 3,821 96 (38) 3,879
Total securities available for sale $ 67,790 $ 1,471 $ (98) $ 69,163 $ 63,514 $ 710 $ (835) $ 63,389Securities Held to Maturity
U.S. Treasury and government agencies $ 776 $ 56 $ 832 $ 758 $ 28 $ (23) $ 763Residential mortgage-backed
Agency 14,419 270 (26) 14,663 15,740 32 (358) 15,414Non-agency 133 7 140 152 2 154
Commercial mortgage-backedAgency 59 1 60 143 1 (1) 143Non-agency 430 4 434 488 1 (1) 488
Asset-backed 52 52 182 1 183Other 1,792 85 (14) 1,863 1,849 53 (28) 1,874
Total securities held to maturity $ 17,661 $ 423 $ (40) $ 18,044 $ 19,312 $ 118 $ (411) $ 19,019
The fair value of investment securities is impacted by interest rates, credit spreads, market volatility and liquidity conditions. Net unrealized gains and losses in the securities available for sale portfolio are included in Shareholders’ equity as AOCI unless credit-related. Securities held to maturity are carried at amortized cost. Investment securities at December 31, 2019 included $549 million of net unsettled purchases which represent non-cash investing activity, and accordingly, are not reflected on the Consolidated Statement of Cash Flows. The comparable amount for December 31, 2018 was $430 million.
At December 31, 2019, AOCI included an insignificant amount of pretax gains from derivatives that hedged the purchase of investment securities classified as held to maturity. The gains will be accreted into interest income as an adjustment of yield on the securities.
Table 47 presents gross unrealized losses and fair value of debt securities at December 31, 2019 and 2018. The securities are segregated between investments that have been in a continuous unrealized loss position for less than twelve months and twelve months or more based on the point in time that the fair value declined below the amortized cost basis. The table includes debt securities where a portion of other than temporary impairment (OTTI) has been recognized in AOCI.

The PNC Financial Services Group, Inc. – 2019 Form 10-K 119
Table 47: Gross Unrealized Loss and Fair Value of Debt Securities
Unrealized loss positionless than 12 months
Unrealized loss position12 months or more Total
In millionsUnrealized
LossFair
ValueUnrealized
LossFair
ValueUnrealized
LossFair
ValueDecember 31, 2019Securities Available for Sale
U.S. Treasury and government agencies $ (14) $ 2,451 $ (2) $ 607 $ (16) $ 3,058Residential mortgage-backed
Agency (6) 2,832 (37) 4,659 (43) 7,491Non-agency (3) 102 (3) 102
Commercial mortgage-backedAgency (6) 852 (12) 953 (18) 1,805Non-agency (4) 1,106 (5) 230 (9) 1,336
Asset-backed (3) 660 (5) 561 (8) 1,221Other (1) 403 (1) 403
Total securities available for sale $ (33) $ 7,901 $ (65) $ 7,515 $ (98) $ 15,416Securities Held to Maturity
Residential mortgage-backed - Agency (26) 2,960 (26) 2,960Other (1) 22 (13) 105 (14) 127
Total securities held to maturity $ (1) $ 22 $ (39) $ 3,065 $ (40) $ 3,087December 31, 2018Securities Available for Sale
U.S. Treasury and government agencies $ (21) $ 4,125 $ (116) $ 5,423 $ (137) $ 9,548Residential mortgage-backed
Agency (57) 4,823 (467) 13,830 (524) 18,653Non-agency (1) 74 (12) 310 (13) 384
Commercial mortgage-backedAgency (1) 65 (65) 1,516 (66) 1,581Non-agency (23) 1,809 (14) 498 (37) 2,307
Asset-backed (11) 2,149 (9) 1,032 (20) 3,181Other (12) 868 (26) 1,293 (38) 2,161
Total securities available for sale $ (126) $ 13,913 $ (709) $ 23,902 $ (835) $ 37,815Securities Held to Maturity
U.S. Treasury and government agencies $ (23) $ 446 $ (23) $ 446Residential mortgage-backed - Agency $ (58) $ 4,191 (300) 7,921 (358) 12,112Commercial mortgage-backed
Agency (1) 88 (1) 88Non-agency (1) 152 (1) 152
Other (2) 75 (26) 123 (28) 198Total securities held to maturity $ (62) $ 4,506 $ (349) $ 8,490 $ (411) $ 12,996
Evaluating Investment Securities for Other-than-Temporary Impairment
For the securities in Table 47, as of December 31, 2019 we do not intend to sell and believe we will not be required to sell the securities prior to recovery of the amortized cost basis.
On at least a quarterly basis, we review all debt securities that are in an unrealized loss position for OTTI, as discussed in Note 1 Accounting Policies. For those securities on our Consolidated Balance Sheet at December 31, 2019, where during our quarterly security-level impairment assessments we determined losses represented OTTI, we have recorded cumulative credit losses of $1.1 billion in earnings and accordingly have reduced the amortized cost of our securities.
The majority of these cumulative impairment charges related to non-agency residential mortgage-backed and asset-backed securities rated BB or lower. During 2019, 2018 and 2017, the OTTI credit losses recognized in noninterest income and the OTTI noncredit losses recognized in AOCI on securities were not significant.

120 The PNC Financial Services Group, Inc. – 2019 Form 10-K
Information relating to gross realized securities gains and losses from the sales of securities is set forth in the following table.
Table 48: Gains (Losses) on Sales of Securities Available for Sale
Year ended December 31In millions Gross Gains Gross Losses Net Gains Tax Expense
2019 $ 69 $ (21) $ 48 $ 102018 $ 57 $ (57)2017 $ 38 $ (31) $ 7 $ 2
The following table presents, by remaining contractual maturity, the amortized cost, fair value and weighted-average yield of debt securities at December 31, 2019.
Table 49: Contractual Maturity of Securities
December 31, 2019 1 Year orLess
After 1 Yearthrough 5 Years
After 5 Yearsthrough 10 Years
After 10Years TotalDollars in millions
Securities Available for SaleU.S. Treasury and government agencies $ 2,198 $ 10,189 $ 2,984 $ 779 $ 16,150Residential mortgage-backed
Agency 2 65 1,194 34,586 35,847Non-agency 1,515 1,515
Commercial mortgage-backedAgency 8 565 490 2,031 3,094Non-agency 75 350 2,927 3,352
Asset-backed 8 2,511 1,267 1,258 5,044Other 337 1,314 486 651 2,788
Total securities available for sale at amortized cost $ 2,553 $ 14,719 $ 6,771 $ 43,747 $ 67,790Fair value $ 2,573 $ 14,881 $ 6,924 $ 44,785 $ 69,163Weighted-average yield, GAAP basis 2.94% 2.28% 2.66% 3.19% 2.93%Securities Held to MaturityU.S. Treasury and government agencies $ 198 $ 300 $ 278 $ 776Residential mortgage-backed
Agency 55 516 13,848 14,419Non-agency 133 133
Commercial mortgage-backedAgency 10 49 59Non-agency 430 430
Asset-backed 6 19 27 52Other $ 45 785 625 337 1,792
Total securities held to maturity at amortized cost $ 45 $ 1,054 $ 1,460 $ 15,102 $ 17,661Fair value $ 45 $ 1,089 $ 1,543 $ 15,367 $ 18,044Weighted-average yield, GAAP basis 3.75% 3.59% 3.53% 3.32% 3.35%
Weighted-average yields are based on amortized cost with effective yields weighted for the contractual maturity of each security. At December 31, 2019, there were no securities of a single issuer, other than the FNMA and FHLMC, that exceeded 10% of Total shareholders’ equity. The FNMA and FHLMC investments had a total amortized cost of $40.5 billion and $7.7 billion and fair value of $41.1 billion and $7.7 billion, respectively.
The following table presents the fair value of securities that have been either pledged to or accepted from others to collateralize outstanding borrowings.
Table 50: Fair Value of Securities Pledged and Accepted as Collateral
In millionsDecember 31
2019December 31
2018Pledged to others $ 14,609 $ 7,597Accepted from others:
Permitted by contract or custom to sell or repledge (a) $ 2,349 $ 6,905Permitted amount repledged to others $ 360 $ 923
(a) Includes $2.0 billion and $6.0 billion in fair value of securities accepted from others to collateralize short-term investments in resale agreements that were not repledged to others at December 31, 2019 and December 31, 2018, respectively.

The PNC Financial Services Group, Inc. – 2019 Form 10-K 121
The securities pledged to others include positions held in our portfolio of investment securities, trading securities, and securities accepted as collateral from others that we are permitted by contract or custom to sell or repledge and were used to secure public and trust deposits and repurchase agreements, as well as for other purposes.
NOTE 6 FAIR VALUE
Fair Value Measurement
We measure certain financial assets and liabilities at fair value. Fair value is defined as the price that would be received to sell an asset or the price that would be paid to transfer a liability on the measurement date, and is determined using an exit price in the principal or most advantageous market for the asset or liability in an orderly transaction between market participants. The fair value hierarchy established by GAAP requires us to maximize the use of observable inputs when measuring fair value. The three levels of the fair value hierarchy are:
• Level 1: Fair value is determined using a quoted price in an active market for identical assets or liabilities. Level 1 assets and liabilities may include debt securities, equity securities and listed derivative contracts that are traded in an active exchange market, and certain U.S. Treasury securities that are actively traded in over-the-counter markets.
• Level 2: Fair value is estimated using inputs other than quoted prices included within Level 1 that are observable for assets or liabilities, either directly or indirectly. The majority of Level 2 assets and liabilities include debt securities and listed derivative contracts with quoted prices that are traded in markets that are not active, and certain debt and equity securities and over-the-counter derivative contracts whose fair value is determined using a pricing model without significant unobservable inputs.
• Level 3: Fair value is estimated using unobservable inputs that are significant to the fair value of the assets or liabilities. Level 3 assets and liabilities include financial instruments whose value is determined using pricing models and discounted cash flow methodologies, or similar techniques for which the significant valuation inputs are not observable and the determination of fair value requires significant management judgment or estimation.
We characterize active markets as those where transaction volumes are sufficient to provide objective pricing information, with reasonably narrow bid/ask spreads, and where dealer quotes received do not vary widely and are based on current information. Inactive markets are typically characterized by low transaction volumes, price quotations that vary substantially among market participants or are not based on current information, wide bid/ask spreads, a significant increase in implied liquidity risk premiums, yields, or performance indicators for observed transactions or quoted prices compared to historical periods, a significant decline or absence of a market for new issuance, or any combination of the above factors. We also consider nonperformance risks, including credit risk, as part of our valuation methodology for all assets and liabilities measured at fair value.
Assets and liabilities measured at fair value, by their nature, result in a higher degree of financial statement volatility. Assets and liabilities classified within Level 3 inherently require the use of various assumptions, estimates and judgments when measuring their fair value. As observable market activity is commonly not available to use when estimating the fair value of Level 3 assets and liabilities, we must estimate fair value using various modeling techniques. These techniques include the use of a variety of inputs/assumptions including credit quality, liquidity, interest rates or other relevant inputs across the entire population of our Level 3 assets and liabilities. Changes in the significant underlying factors or assumptions (either an increase or a decrease) in any of these areas underlying our estimates may result in a significant increase/decrease in the Level 3 fair value measurement of a particular asset and/or liability from period to period.
Any models used to determine fair values or to validate dealer quotes are subject to review and independent testing as part of our model validation and internal control testing processes. Our Model Risk Management Group reviews significant models on at least an annual basis. In addition, the Valuation Committee approves valuation methodologies and reviews the results of independent valuation reviews and processes for assets and liabilities measured at fair value on a recurring basis. Assets and Liabilities Measured at Fair Value on a Recurring Basis
Residential Mortgage Loans Held for SaleWe account for certain residential mortgage loans originated for sale at fair value on a recurring basis. The election of the fair value option aligns the accounting for the residential mortgages with the related hedges. Residential mortgage loans are valued based on quoted market prices, where available, prices for other traded mortgage loans with similar characteristics, and purchase commitments and bid information received from market participants. The prices are adjusted as necessary to include the embedded servicing value in the loans and to take into consideration the specific characteristics of certain loans that are priced based on the pricing of similar loans. These adjustments represent unobservable inputs to the valuation but are not considered significant given the relative insensitivity of the value to changes in these inputs to the fair value of the loans. Accordingly, the majority of residential mortgage loans held for sale are classified as Level 2.

122 The PNC Financial Services Group, Inc. – 2019 Form 10-K
Commercial Mortgage Loans Held for SaleWe account for certain commercial mortgage loans classified as held for sale in whole loan transactions at fair value. We determine the fair value of commercial mortgage loans held for sale based upon discounted cash flows. Fair value is determined using sale valuation assumptions that management believes a market participant would use in pricing the loans. Valuation assumptions may include observable inputs based on the benchmark interest rate swap curve, whole loan sales and agency sales transactions. The significant unobservable input for commercial mortgage loans held for sale, excluding those to be sold to agencies, is management’s assumption of the spread applied to the benchmark rate. The spread over the benchmark curve includes management’s assumptions of the impact of credit and liquidity risk. Significant increases (decreases) in the spread applied to the benchmark would result in a significantly lower (higher) asset value. The wide range of the spread over the benchmark curve is due to the varying risk and underlying property characteristics within our portfolio. Based on the significance of the unobservable input we classified this portfolio as Level 3.
For loans to be sold to agencies with servicing retained, the fair value is adjusted for the estimated servicing cash flows, which is an unobservable input. This adjustment is not considered significant given the relative insensitivity of the value to changes in the input to the fair value of the loans. Accordingly, commercial mortgage loans held for sale to agencies are classified as Level 2.
Securities Available for Sale and Trading SecuritiesSecurities accounted for at fair value include both the available for sale and trading portfolios. We primarily use prices obtained from pricing services, dealer quotes or recent trades to determine the fair value of securities. The majority of securities were priced by third-party vendors. The third-party vendors use a variety of methods when pricing securities that incorporate relevant market data to arrive at an estimate of what a buyer in the marketplace would pay for a security under current market conditions. We monitor and validate the reliability of vendor pricing on an ongoing basis through pricing methodology reviews, including detailed reviews of the assumptions and inputs used by the vendor to price individual securities, and through price validation testing. Securities not priced by one of our pricing vendors may be valued using a dealer quote, which are also subject to price validation testing. Price validation testing is performed independent of the risk-taking function and involves corroborating the prices received from third-party vendors and dealers with prices from another third party or through other sources, such as internal valuations or sales of similar securities. Security prices are also validated through actual cash settlement upon sale of a security.
Securities are classified within the fair value hierarchy after giving consideration to the activity level in the market for the security type and the observability of the inputs used to determine the fair value. When a quoted price in an active market exists for the identical security, this price is used to determine fair value and the security is classified within Level 1 of the hierarchy. Level 1 securities include U.S. Treasury securities.
When a quoted price in an active market for the identical security is not available, fair value is estimated using either an alternative market approach, such as a recent trade or matrix pricing, or an income approach, such as a discounted cash flow pricing model. If the inputs to the valuation are based primarily on market observable information, then the security is classified within Level 2 of the hierarchy. Level 2 securities include agency debt securities, agency residential mortgage-backed securities, agency and non-agency commercial mortgage-backed securities, certain non-agency residential mortgage-backed securities, asset-backed securities collateralized by non-mortgage-related corporate and consumer loans, and other debt securities. Level 2 securities are predominantly priced by third parties, either by a pricing vendor or dealer.
In certain cases where there is limited activity or less transparency around the inputs to the valuation, securities are classified within Level 3 of the hierarchy. Securities classified as Level 3 consist primarily of non-agency residential mortgage-backed and asset-backed securities collateralized by first- and second-lien residential mortgage loans. Fair value for these securities is primarily estimated using pricing obtained from third-party vendors. In some cases, fair value is estimated using a dealer quote, by reference to prices of securities of a similar vintage and collateral type or by reference to recent sales of similar securities. Market activity for these security types is limited with little price transparency. As a result, these securities are generally valued by the third-party vendor using a discounted cash flow approach that incorporates significant unobservable inputs and observable market activity where available. Significant inputs to the valuation include prepayment projections and credit loss assumptions (default rate and loss severity) and discount rates that are deemed representative of current market conditions. Significant increases (decreases) in any of those assumptions in isolation would result in a significantly lower (higher) fair value measurement.
Certain infrequently traded debt securities within Other debt securities available for sale and Trading securities are also classified in Level 3 and are included in the Insignificant Level 3 assets, net of liabilities line item in Table 53. The significant unobservable inputs used to estimate the fair value of these securities include an estimate of expected credit losses and a discount for liquidity risk. These inputs are incorporated into the fair value measurement by either increasing the spread over the benchmark curve or by applying a credit and liquidity discount to the par value of the security. Significant increases (decreases) in credit and/or liquidity risk could result in a significantly lower (higher) fair value estimate.

The PNC Financial Services Group, Inc. – 2019 Form 10-K 123
LoansLoans accounted for at fair value consist primarily of residential mortgage loans. These loans are generally valued similarly to residential mortgage loans held for sale and are classified as Level 2. However, similar to residential mortgage loans held for sale, if these loans are repurchased and unsalable, they are classified as Level 3. In addition, repurchased VA loans, where only a portion of the principal will be reimbursed, are classified as Level 3. The fair value is determined using a discounted cash flow calculation based on our historical loss rate. We have elected to account for certain home equity lines of credit at fair value. These loans are classified as Level 3. Significant inputs to the valuation of these loans include credit and liquidity discount, cumulative default rate, loss severity and gross discount rate and are deemed representative of current market conditions. Significant increases (decreases) in any of these assumptions would result in a significantly lower (higher) fair value measurement.
Equity InvestmentsEquity investments includes money market mutual funds as well as direct and indirect private equity investments. Money market mutual funds are valued based on quoted prices in active markets for identical securities and classified within Level 1 of the hierarchy. The valuation of direct and indirect private equity investments requires significant management judgment due to the absence of quoted market prices, inherent lack of liquidity and the long-term nature of such investments. Various valuation techniques are used for direct investments, including multiples of adjusted earnings of the entity, independent appraisals, anticipated financing and sale transactions with third parties, or the pricing used to value the entity in a recent financing transaction. A multiple of adjusted earnings calculation is the valuation technique utilized most frequently and is the most significant unobservable input used in such calculation. Significant decreases (increases) in the multiple of earnings could result in a significantly lower (higher) fair value measurement. Direct equity investments are classified as Level 3.
Indirect investments are not redeemable; however, we receive distributions over the life of the partnerships from liquidation of the underlying investments by the investee, which we expect to occur over the next 12 years. We value indirect investments in private equity funds using the net asset value (NAV) practical expedient as provided in the financial statements that we receive from fund managers. Due to the time lag in our receipt of the financial information and based on a review of investments and valuation techniques applied, adjustments to the manager-provided value are made when available recent portfolio company information or market information indicates a significant change in value from that provided by the manager of the fund. Indirect investments valued using NAV are not classified in the fair value hierarchy.
Mortgage Servicing Rights (MSRs)MSRs are carried at fair value on a recurring basis. Assumptions incorporated into the MSRs valuation model reflect management’s best estimate of factors that a market participant would use in valuing the MSRs. Although sales of MSRs do occur and can offer some market insight, MSRs do not trade in an active, open market with readily observable prices so the precise terms and conditions of sales are not available.
Residential MSRsAs a benchmark for the reasonableness of our residential MSRs fair value, we obtained opinions of value from independent brokers. These brokers provided a range (+/-10 bps) based upon their own discounted cash flow calculations of our portfolio that reflect conditions in the secondary market and any recently executed servicing transactions. We compare our internally-developed residential MSRs value to the ranges of values received from the brokers. If our residential MSRs fair value falls outside of the brokers’ ranges, management will assess whether a valuation adjustment is warranted. For the periods presented, our residential MSRs value did not fall outside of the brokers’ ranges. We consider our residential MSRs value to represent a reasonable estimate of fair value.
Due to the nature of the unobservable valuation inputs, residential MSRs are classified as Level 3. The significant unobservable inputs used in the fair value measurement of residential MSRs are constant prepayment rates and spread over the benchmark curve. Significant increases (decreases) in prepayment rates and spread over the benchmark curve would result in lower (higher) fair market value of residential MSRs.
Commercial MSRsThe fair value of commercial MSRs is estimated by using a discounted cash flow model incorporating unobservable inputs for assumptions such as constant prepayment rates, discount rates and other factors. Due to the nature of the unobservable valuation inputs and the limited availability of market pricing, commercial MSRs are classified as Level 3. Significant increases (decreases) in constant prepayment rates and discount rates would result in significantly lower (higher) commercial MSR value determined based on current market conditions and expectations.
Financial DerivativesExchange-traded derivatives are valued using quoted market prices and are classified as Level 1. The majority of derivatives that we enter into are executed over-the-counter and are valued using internal models. These derivatives are primarily classified as Level 2, as the readily observable market inputs to these models are validated to external sources, such as industry pricing services, or are corroborated through recent trades, dealer quotes, yield curves, implied volatility or other market-related data. Level 2 financial derivatives are primarily estimated using a combination of Eurodollar future prices and observable benchmark interest rate swaps to construct projected discounted cash flows.

124 The PNC Financial Services Group, Inc. – 2019 Form 10-K
Financial derivatives that are priced using significant management judgment or assumptions are classified as Level 3. Unobservable inputs related to interest rate contracts include probability of funding of residential mortgage loan commitments and estimated servicing cash flows of commercial and residential mortgage loan commitments. Probability of default and loss severity are the significant unobservable inputs used in the valuation of risk participation agreements. The fair values of Level 3 assets and liabilities related to these interest rate contract financial derivatives as of December 31, 2019 and 2018 are included in the Insignificant Level 3 assets, net of liabilities line item in Table 53 of this Note 6.
In connection with the sales of portions of our Visa Class B common shares, we entered into swap agreements with the purchasers of the shares to retain any future risk of decreases in the conversion rate of Class B common shares to Class A common shares resulting from increases in the escrow funded by Visa to pay for the costs of resolution of specified litigation (see Note 19 Legal Proceedings). These swaps also require PNC to make periodic payments based on the market price of the Class A common shares at a fixed rate of interest (in certain cases subject to step-up provisions) until the Visa litigation is resolved. An increase in the estimated length of litigation resolution date, a decrease in the estimated conversion rate, or an increase in the estimated growth rate of the Class A share price will each have a negative impact on the fair value of the swaps and vice versa.
The fair values of our derivatives include a credit valuation adjustment to reflect our own and our counterparties’ nonperformance risk. Our credit valuation adjustment is computed using new loan pricing and considers externally available bond spreads, in conjunction with internal historical recovery observations.
Other Assets and LiabilitiesOther assets held at fair value on a recurring basis primarily include assets related to PNC’s deferred compensation and supplemental incentive savings plans.
The assets related to PNC’s deferred compensation and supplemental incentive savings plans primarily consist of a prepaid forward contract referencing an amount of shares of PNC stock, equity mutual funds and fixed income funds, and are valued based on the underlying investments. These assets are valued either by reference to the market price of PNC’s stock or by using the quoted market prices for investments other than PNC’s stock and are classified in Levels 1 and 2.
All Level 3 other assets and liabilities are included in the Insignificant Level 3 assets, net of liabilities line item in Table 53 in this Note 6.
Other Borrowed FundsOther borrowed funds primarily consist of U.S. Treasury securities sold short which are classified as Level 1. Other borrowed funds also includes the related liability for certain repurchased loans for which we have elected the fair value option and are classified as either Level 2 or Level 3, consistent with the level classification of the corresponding loans. All Level 3 amounts are included in the Insignificant Level 3 assets, net of liabilities line item in Table 53 in this Note 6.

The PNC Financial Services Group, Inc. – 2019 Form 10-K 125
The following table summarizes our assets and liabilities measured at fair value on a recurring basis, including instruments for which we have elected the fair value option.
Table 51: Fair Value Measurements – Recurring Basis Summary
December 31, 2019 December 31, 2018
In millions Level 1 Level 2 Level 3Total
Fair Value Level 1 Level 2 Level 3Total
Fair Value
AssetsResidential mortgage loans held for sale $ 817 $ 2 $ 819 $ 493 $ 2 $ 495Commercial mortgage loans held for sale 182 64 246 309 87 396Securities available for sale
U.S. Treasury and government agencies $ 16,236 280 16,516 $ 17,753 347 18,100Residential mortgage-backed
Agency 36,321 36,321 28,993 28,993Non-agency 73 1,741 1,814 83 2,128 2,211
Commercial mortgage-backedAgency 3,118 3,118 2,577 2,577Non-agency 3,372 3,372 2,657 2,657
Asset-backed 4,874 240 5,114 4,698 274 4,972Other 2,834 74 2,908 3,795 84 3,879
Total securities available for sale 16,236 50,872 2,055 69,163 17,753 43,150 2,486 63,389Loans 442 300 742 510 272 782Equity investments (a) 855 1,276 2,421 751 1,255 2,209Residential mortgage servicing rights 995 995 1,257 1,257Commercial mortgage servicing rights 649 649 726 726Trading securities (b) 433 2,787 3,220 2,137 1,777 2 3,916Financial derivatives (b) (c) 3,448 54 3,502 3 2,053 25 2,081Other assets 339 131 470 291 157 45 493
Total assets (d) $ 17,863 $ 58,679 $ 5,395 $ 82,227 $ 20,935 $ 48,449 $ 6,157 $ 75,744Liabilities
Other borrowed funds $ 385 $ 126 $ 7 $ 518 $ 868 $ 132 $ 7 $ 1,007Financial derivatives (c) (e) 1,819 200 2,019 1 2,021 268 2,290Other liabilities 137 137 58 58
Total liabilities (f) $ 385 $ 1,945 $ 344 $ 2,674 $ 869 $ 2,153 $ 333 $ 3,355(a) Certain investments that are measured at fair value using the NAV per share (or its equivalent) practical expedient have not been classified in the fair value hierarchy.(b) Included in Other assets on the Consolidated Balance Sheet.(c) Amounts at December 31, 2019 and 2018 are presented gross and are not reduced by the impact of legally enforceable master netting agreements that allow us to net positive
and negative positions and cash collateral held or placed with the same counterparty. See Note 13 Financial Derivatives for additional information related to derivative offsetting.
(d) Total assets at fair value as a percentage of total consolidated assets was 20% at both December 31, 2019 and 2018. Level 3 assets as a percentage of total assets at fair value was 7% and 8% as of December 31, 2019 and 2018, respectively. Level 3 assets as a percentage of total consolidated assets was 1% and 2% as of December 31, 2019 and 2018, respectively.
(e) Included in Other liabilities on the Consolidated Balance Sheet.(f) Total liabilities at fair value as a percentage of total consolidated liabilities was 1% at both December 31, 2019 and 2018. Level 3 liabilities as a percentage of total liabilities
at fair value was 13% and 10% as of December 31, 2019 and 2018, respectively. Level 3 liabilities as a percentage of total consolidated liabilities was less than 1% at both December 31, 2019 and 2018.

126 The PNC Financial Services Group, Inc. – 2019 Form 10-K
Reconciliations of assets and liabilities measured at fair value on a recurring basis using Level 3 inputs for 2019 and 2018 follow:
Table 52: Reconciliation of Level 3 Assets and Liabilities
Year Ended December 31, 2019
Total realized / unrealizedgains or losses for the
period (a) Unrealized
gains / losseson assets and
liabilities heldon
ConsolidatedBalance Sheet
at December31, 2019 (a) (b)
Level 3 Instruments OnlyIn millions
FairValue
Dec. 31,2018
Included in
Earnings
Includedin Other
comprehensiveincome Purchases Sales Issuances Settlements
Transfersinto
Level 3
Transfersout of
Level 3
FairValue
Dec. 31,2019
Assets Residential mortgage loans held for sale $ 2 $ 5 $ (2) $ (2) $ 16 $ (17) (c) $ 2 Commercial mortgage loans held for sale 87 $ 1 (24) 64 $ 1Securities available forsale
Residential mortgage- backed non-agency 2,128 73 $ 15 (475) 1,741Asset-backed 274 6 3 (43) 240Other 84 1 (6) 9 (3) (11) 74
Total securities available for sale 2,486 80 12 9 (3) (529) 2,055
Loans 272 13 142 (42) (54) (31) (c) 300 7Equity investments 1,255 262 374 (615) 1,276 57Residential mortgage servicing rights 1,257 (250) 114 $ 36 (162) 995 (235)Commercial mortgage servicing rights 726 (87) 103 53 (146) 649 (87)Trading securities 2 (2) Financial derivatives 25 70 22 (63) 54 94 Other assets 45 (45)
Total assets $ 6,157 $ 89 $ 12 $ 769 $ (662) $ 89 $ (1,027) $ 16 $ (48) $ 5,395 $ (163) Liabilities
Other borrowed funds $ 7 $ 52 $ (52) $ 7 Financial derivatives 268 $ 101 $ 10 (179) 200 $ 112 Other liabilities 58 68 $ 16 2 81 (88) 137 49
Total liabilities $ 333 $ 169 $ 16 $ 12 $ 133 $ (319) $ 344 $ 161 Net gains (losses) $ (80) (d) $ (324) (e)

The PNC Financial Services Group, Inc. – 2019 Form 10-K 127
Year Ended December 31, 2018
Total realized / unrealizedgains or losses for the
period (a) Unrealized
gains / losses onassets and
liabilities held onConsolidated
Balance Sheet atDecember
31, 2018 (a) (b)Level 3 Instruments OnlyIn millions
FairValue
Dec. 31,2017
Included in
Earnings
Includedin Other
comprehensiveincome Purchases Sales Issuances Settlements
Transfersinto
Level 3
Transfersout of
Level 3
Fair ValueDec. 31,
2018
Assets Residential mortgage loans held for sale $ 3 $ 4 $ (3) $ 14 $ (16) (c) $ 2 Commercial mortgage loans held for sale 107 $ (20) 87 $ 1Securities available for sale
Residential mortgage- backed non-agency 2,661 $ 53 $ (24) (562) 2,128Asset-backed 332 5 (7) (56) 274Other 87 5 6 7 (16) (5) 84
Total securities available for sale 3,080 63 (25) 7 (634) (5) 2,486
Loans 298 13 102 (25) (74) 10 (52) (c) 272 2 Equity investments 1,036 204 411 (396) 1,255 110 Residential mortgage servicing rights 1,164 90 129 $ 44 (170) 1,257 83 Commercial mortgage servicing rights 668 51 93 57 (143) 726 51Trading securities 2 2 Financial derivatives 10 59 4 (48) 25 47 Other assets 107 (14) (48) 45 (14)
Total assets $ 6,475 $ 466 $ (25) $ 750 $ (424) $ 101 $ (1,137) $ 24 $ (73) $ 6,157 $ 280 Liabilities
Other borrowed funds $ 11 $ 64 $ (68) $ 7 Financial derivatives 487 $ (53) $ 12 (178) 268 $ (42) Other liabilities 33 15 $ 12 103 (105) 58 13
Total liabilities $ 531 $ (38) $ 12 $ 12 $ 167 $ (351) $ 333 $ (29) Net gains (losses) $ 504 (d) $ 309 (e)
(a) Losses for assets are bracketed while losses for liabilities are not.(b) The amount of the total gains or losses for the period included in earnings that is attributable to the change in unrealized gains or losses related to those assets and liabilities held at the
end of the reporting period.(c) Residential mortgage loan transfers out of Level 3 are primarily driven by residential mortgage loans transferring to OREO as well as reclassification of mortgage loans held for sale to
held for investment.(d) Net gains (losses) realized and unrealized included in earnings related to Level 3 assets and liabilities included amortization and accretion. The amortization and accretion amounts were
included in Interest income on the Consolidated Income Statement and the remaining net gains (losses) realized and unrealized were included in Noninterest income on the Consolidated Income Statement.
(e) Net unrealized gains (losses) related to assets and liabilities held at the end of the reporting period were included in Noninterest income on the Consolidated Income Statement.
An instrument’s categorization within the hierarchy is based on the lowest level of input that is significant to the fair value measurement. Changes from one quarter to the next related to the observability of inputs to a fair value measurement may result in a reclassification (transfer) of assets or liabilities between hierarchy levels. Our policy is to recognize transfers in and transfers out as of the end of the reporting period.

128 The PNC Financial Services Group, Inc. – 2019 Form 10-K
Quantitative information about the significant unobservable inputs within Level 3 recurring assets and liabilities follows.
Table 53: Fair Value Measurements – Recurring Quantitative Information
December 31, 2019
Level 3 Instruments OnlyDollars in millions Fair Value Valuation Techniques Unobservable Inputs Range (Weighted Average)
Commercial mortgage loans held for sale $ 64 Discounted cash flow Spread over the benchmark curve (a) 530bps - 2,935bps (1,889bps)Residential mortgage-backed non-agency securities
1,741 Priced by a third-party vendorusing a discounted cash flowpricing model
Constant prepayment rate 1.0% - 36.2% (9.9%)Constant default rate 0.0% - 14.1% (4.3%)Loss severity 26.6% - 95.7% (51.9%)Spread over the benchmark curve (a) 188bps weighted-average
Asset-backed securities 240 Priced by a third-party vendorusing a discounted cash flowpricing model
Constant prepayment rate 1.0% - 22.0% (7.5%)Constant default rate 1.0% - 7.2% (3.4%)Loss severity 30.0% - 100.0% (57.6%)Spread over the benchmark curve (a) 215bps weighted-average
Loans 184 Consensus pricing (b) Cumulative default rate 3.6% - 100.0% (76.7%)Loss severity 0.0% - 100.0% (14.5%)Discount rate 5.0% - 8.0% (5.2%)
72 Discounted cash flow Loss severity 8.0% weighted-averageDiscount rate 4.8% weighted-average
44 Consensus pricing (b) Credit and Liquidity discount 0.0% - 99.0% (63.4%)Equity investments 1,276 Multiple of adjusted earnings Multiple of earnings 5.0x - 16.5x (8.5x)Residential mortgage servicing rights 995 Discounted cash flow Constant prepayment rate 0.0% - 53.8% (13.5%)
Spread over the benchmark curve (a) 320bps - 1,435bps (769bps)Commercial mortgage servicing rights 649 Discounted cash flow Constant prepayment rate 3.5% - 18.1% (4.6%)
Discount rate 5.6% - 8.1% (7.9%)Financial derivatives - Swaps related to sales of certain Visa Class B common shares
(176) Discounted cash flow Estimated conversion factor of VisaClass B shares into Class A shares 162.3% weighted-averageEstimated annual growth rate of VisaClass A share price 16.0%Estimated length of litigation resolutiondate Q1 2021
Insignificant Level 3 assets, net of liabilities (c)
(38)
Total Level 3 assets, net of liabilities (d) $ 5,051

The PNC Financial Services Group, Inc. – 2019 Form 10-K 129
December 31, 2018
Level 3 Instruments OnlyDollars in millions Fair Value Valuation Techniques Unobservable Inputs Range (Weighted Average)
Commercial mortgage loans held for sale $ 87 Discounted cash flow Spread over the benchmark curve (a) 535bps - 1,900bps (1,217bps)Residential mortgage-backed non-agency securities
2,128 Priced by a third-party vendorusing a discounted cash flowpricing model
Constant prepayment rate 1.0% - 33.0% (11.8%)Constant default rate 0.0% - 18.8% (5.1%)Loss severity 10.0% - 100.0% (50.8%)Spread over the benchmark curve (a) 216bps weighted-average
Asset-backed securities 274 Priced by a third-party vendorusing a discounted cash flowpricing model
Constant prepayment rate 1.0% - 19.0% (8.5%)Constant default rate 1.0% - 18.5% (4.0%)Loss severity 15.0% - 100.0% (63.8%)Spread over the benchmark curve (a) 198bps weighted-average
Loans 129 Consensus pricing (b) Cumulative default rate 11.0% - 100.0% (81.8%)Loss severity 0.0% - 100.0% (17.2%)Discount rate 5.5% - 8.3% (5.8%)
90 Discounted cash flow Loss severity 8.0% weighted-averageDiscount rate 5.8% weighted-average
53 Consensus pricing (b) Credit and Liquidity discount 0.0% - 99.0% (61.3%)Equity investments 1,255 Multiple of adjusted earnings Multiple of earnings 4.5x - 16.0x (8.4x)Residential mortgage servicing rights 1,257 Discounted cash flow Constant prepayment rate 0.0% - 54.5% (8.7%)
Spread over the benchmark curve (a) 492bps - 1,455bps (806bps)Commercial mortgage servicing rights 726 Discounted cash flow Constant prepayment rate 4.6% - 14.7% (5.7%)
Discount rate 6.9% - 8.5% (8.4%)Financial derivatives - Swaps related to sales of certain Visa Class B common shares
(210) Discounted cash flow Estimated conversion factor of VisaClass B shares into Class A shares 163.0% weighted-averageEstimated annual growth rate of VisaClass A share price 16.0%Estimated length of litigation resolutiondate Q4 2020
Insignificant Level 3 assets, net of liabilities (c)
35
Total Level 3 assets, net of liabilities (d) $ 5,824(a) The assumed yield spread over the benchmark curve for each instrument is generally intended to incorporate non-interest-rate risks, such as credit and liquidity risks.(b) Consensus pricing refers to fair value estimates that are generally internally developed using information such as dealer quotes or other third-party provided valuations or comparable
asset prices.(c) Represents the aggregate amount of Level 3 assets and liabilities measured at fair value on a recurring basis that are individually and in the aggregate insignificant. The amount includes
certain financial derivative assets and liabilities, trading securities, other securities, residential mortgage loans held for sale, other assets, other borrowed funds and other liabilities.(d) Consisted of total Level 3 assets of $5.4 billion and total Level 3 liabilities of $.3 billion as of December 31, 2019 and $6.1 billion and $.3 billion as of December 31, 2018, respectively.
Financial Assets Accounted for at Fair Value on a Nonrecurring Basis
We may be required to measure certain financial assets at fair value on a nonrecurring basis. These adjustments to fair value usually result from the application of lower of amortized cost or fair value accounting or write-downs of individual assets due to impairment and are included in Table 54.
Nonaccrual LoansNonaccrual loans represent the fair value of those loans which have been adjusted due to impairment. The impairment is primarily based on the appraised value of the collateral.
Appraisals are obtained by licensed or certified appraisers at least annually and more recently in certain instances. All third-party appraisals are reviewed and any adjustments to the initial appraisal are incorporated into the final issued appraisal report. In instances where an appraisal is not obtained, collateral value is determined consistent with external third-party appraisal standards by an internal person independent of the asset manager.
OREO and Foreclosed AssetsThe carrying value of OREO and foreclosed assets includes valuation adjustments recorded subsequent to the transfer to OREO and foreclosed assets. These valuation adjustments are based on the fair value less cost to sell of the property. Fair value is based on appraised value or sales price and the appraisal process for OREO and foreclosed assets is the same as described above for nonaccrual loans.
Long-Lived AssetsLong-lived assets consists of buildings for which valuation adjustments were recorded during the period. A facility classified as held and used is impaired to the extent its carrying value is not recoverable and exceeds fair value. Valuation adjustments on buildings held for sale are based on the fair value of the property less an estimated cost to sell and are recorded subsequent to the transfer of the asset

130 The PNC Financial Services Group, Inc. – 2019 Form 10-K
to held for sale status. Fair value is determined either by a third-party appraisal, recent sales offer, changes in market or property conditions, or, where we have agreed to sell the building to a third party, the contractual sales price. Impairment on these long-lived assets is recorded in Other noninterest expense on our Consolidated Income Statement.
Table 54: Fair Value Measurements – Nonrecurring (a) (b) (c)
Year ended December 31In millions
Fair Value Gains (Losses)2019 2018 2019 2018 2017
AssetsNonaccrual loans $ 136 $ 128 $ (76) $ (28) $ (8)OREO and foreclosed assets 57 59 (5) (7) (10)Long-lived assets 5 11 (3) (4) (168)
Total assets $ 198 $ 198 $ (84) $ (39) $ (186)(a) All Level 3 for the periods presented.(b) Valuation techniques applied were fair value of property or collateral.(c) Unobservable inputs used were appraised value/sales price, broker opinions or projected income/required improvement costs. Additional quantitative information was not
meaningful for the periods presented.
Financial Instruments Accounted for under Fair Value Option
We elect the fair value option to account for certain financial instruments. For more information on these financial instruments for which the fair value option election has been made, please refer to the Fair Value Measurement section of this Note 6. These financial instruments are initially measured at fair value. Gains and losses from initial measurement and any changes in fair value are subsequently recognized in earnings.
Interest income related to changes in the fair values of these financial instruments is recorded on the Consolidated Income Statement in Other interest income, except for certain Residential mortgage loans, for which income is also recorded in Loan interest income. Changes in the value on prepaid forward contracts included in Other Assets is reported in Noninterest expense and interest expense on the Other borrowed funds is reported in Borrowed funds interest expense.
Fair values and aggregate unpaid principal balances of items for which we elected the fair value option follow.
Table 55: Fair Value Option – Fair Value and Principal Balances
December 31, 2019 December 31, 2018
In millions Fair Value
AggregateUnpaid
PrincipalBalance Difference Fair Value
AggregateUnpaid
PrincipalBalance Difference
AssetsResidential mortgage loans held for sale
Performing loans $ 813 $ 792 $ 21 $ 489 $ 472 $ 17Accruing loans 90 days or more past due 2 2 2 2Nonaccrual loans 4 4 4 4
Total $ 819 $ 798 $ 21 $ 495 $ 478 $ 17Commercial mortgage loans held for sale (a)
Performing loans $ 245 $ 263 $ (18) $ 396 $ 411 $ (15)Nonaccrual loans 1 2 (1)
Total $ 246 $ 265 $ (19) $ 396 $ 411 $ (15)Residential mortgage loans
Performing loans $ 291 $ 304 $ (13) $ 279 $ 298 $ (19)Accruing loans 90 days or more past due 285 296 (11) 321 329 (8)Nonaccrual loans 166 265 (99) 182 292 (110)
Total $ 742 $ 865 $ (123) $ 782 $ 919 $ (137)Other assets $ 132 $ 125 $ 7 $ 156 $ 176 $ (20)
LiabilitiesOther borrowed funds $ 63 $ 64 $ (1) $ 64 $ 65 $ (1)
(a) There were no accruing loans 90 days or more past due within this category at December 31, 2019 or December 31, 2018.

The PNC Financial Services Group, Inc. – 2019 Form 10-K 131
The changes in fair value for items for which we elected the fair value option are as follows.
Table 56: Fair Value Option – Changes in Fair Value (a)
Year ended December 31In millions
Gains (Losses)2019 2018 2017
AssetsResidential mortgage loans held for sale $ 84 $ 38 $ 121Commercial mortgage loans held for sale $ 61 $ 67 $ 87Residential mortgage loans $ 23 $ 24 $ 27Other assets $ 40 $ (40) $ 60
(a) The impact on earnings of offsetting hedged items or hedging instruments is not reflected in these amounts.
Additional Fair Value Information Related to Financial Instruments Not Recorded at Fair Value
This section presents fair value information for all other financial instruments that are not recorded on the Consolidated Balance Sheet at fair value. We used the following methods and assumptions to estimate the fair value amounts for these financial instruments.
Cash and Due from Banks and Interest-earning Deposits with BanksDue to their short-term nature, the carrying amounts for Cash and due from banks and Interest-earning deposits with banks reported on our Consolidated Balance Sheet approximate fair value.
Securities Held to MaturityWe primarily use prices obtained from pricing services, dealer quotes or recent trades to determine the fair value of securities. Refer to the Fair Value Measurement section of this Note 6 for additional information relating to our pricing processes and procedures.
Net LoansFair values are estimated based on the discounted value of expected net cash flows incorporating assumptions about prepayment rates, net credit losses and servicing fees. Nonaccrual loans are valued at their estimated recovery value. Loans are presented net of the ALLL.
Other AssetsOther assets includes accrued interest receivable, cash collateral, federal funds sold and resale agreements, certain loans held for sale, and FHLB and FRB stock. The aggregate carrying value of our FHLB and FRB stock was $1.6 billion and $1.8 billion at December 31, 2019 and 2018, respectively, which approximated fair value at each date.
DepositsFor time deposits, fair values are estimated by discounting contractual cash flows using current market rates for instruments with similar maturities. For deposits with no defined maturity, such as noninterest-bearing and interest-bearing demand and interest-bearing money market and savings deposits, carrying values approximate fair values.
Borrowed FundsFor short-term borrowed funds, including federal funds purchased, commercial paper, repurchase agreements and certain other short-term borrowings and payables, carrying values approximated fair values. For long-term borrowed funds, quoted market prices are used, when available, to estimate fair value. When quoted market prices are not available, fair value is estimated based on current market interest rates and credit spreads for debt with similar terms and maturities.
Unfunded Loan Commitments and Letters of CreditThe fair value of unfunded loan commitments and letters of credit is determined from a market participant’s view including the impact of changes in interest rates and credit. We establish a liability on these facilities related to the creditworthiness of our counterparty.
Other LiabilitiesOther liabilities includes interest-bearing cash collateral held related to derivatives and other accrued liabilities. Due to its short-term nature, the carrying value of Other liabilities reported on our Consolidated Balance Sheet approximates fair value.

132 The PNC Financial Services Group, Inc. – 2019 Form 10-K
The carrying amounts and estimated fair values, as well as the level within the fair value hierarchy, of these financial instruments as of December 31, 2019 and 2018 are as follows.
Table 57: Additional Fair Value Information Related to Other Financial Instruments
In millionsCarryingAmount
Fair ValueTotal Level 1 Level 2 Level 3
December 31, 2019 AssetsCash and due from banks $ 5,061 $ 5,061 $ 5,061Interest-earning deposits with banks 23,413 23,413 $ 23,413Securities held to maturity 17,661 18,044 832 17,039 $ 173Net loans (excludes leases) 229,205 232,670 232,670Other assets 5,700 5,700 5,692 8
Total assets $ 281,040 $ 284,888 $ 5,893 $ 46,144 $ 232,851LiabilitiesTime deposits $ 21,663 $ 21,425 $ 21,425Borrowed funds 59,745 60,399 58,622 $ 1,777Unfunded loan commitments and letters of credit 318 318 318Other liabilities 506 506 506
Total liabilities $ 82,232 $ 82,648 $ 80,553 $ 2,095December 31, 2018AssetsCash and due from banks $ 5,608 $ 5,608 $ 5,608Interest-earning deposits with banks 10,893 10,893 $ 10,893Securities held to maturity 19,312 19,019 763 18,112 $ 144Net loans (excludes leases) 215,525 216,492 216,492Other assets 11,065 11,065 11,060 5
Total assets $ 262,403 $ 263,077 $ 6,371 $ 40,065 $ 216,641LiabilitiesTime deposits $ 18,507 $ 18,246 $ 18,246Borrowed funds 56,412 56,657 54,872 $ 1,785Unfunded loan commitments and letters of credit 285 285 285Other liabilities 393 393 393
Total liabilities $ 75,597 $ 75,581 $ 73,511 $ 2,070
The aggregate fair values in Table 57 represent only a portion of the total market value of our total assets and liabilities as, in accordance with the guidance related to fair values about financial instruments, we exclude the following:
• financial instruments recorded at fair value on a recurring basis (as they are disclosed in Table 51);• investments accounted for under the equity method;• equity securities without a readily determinable fair value that apply for the alternative measurement approach to fair value
under ASU 2016-01;• real and personal property;• lease financing;• loan customer relationships;• deposit customer intangibles;• mortgage servicing rights (MSRs);• retail branch networks;• fee-based businesses, such as asset management and brokerage;• trademarks and brand names;• trade receivables and payables due in one year or less; and• deposit liabilities with no defined or contractual maturities under ASU 2016-01.

The PNC Financial Services Group, Inc. – 2019 Form 10-K 133
NOTE 7 GOODWILL AND MORTGAGE SERVICING RIGHTS
Assets and liabilities of acquired entities are recorded at estimated fair value as of the acquisition date.
Goodwill
Allocations of Goodwill by business segment during 2019, 2018 and 2017 follow:
Table 58: Goodwill by Business Segment (a)
In millions Retail BankingCorporate &
Institutional BankingAsset Management
Group Total
December 31, 2019 (b) $ 5,795 $ 3,374 $ 64 $ 9,233December 31, 2018 (b) $ 5,795 $ 3,359 $ 64 $ 9,218December 31, 2017 $ 5,795 $ 3,314 $ 64 $ 9,173
(a) The BlackRock business segment did not have any allocated goodwill during 2019, 2018 and 2017.(b) Corporate & Institutional Banking's goodwill balances include the impacts of $15 million at December 31, 2019 and $45 million at December 31, 2018 resulting from
business acquisitions.
We review goodwill in each of our reporting units for impairment at least annually, in the fourth quarter, or more frequently if events occur or circumstances have changed significantly from the annual test date. Based on the results of our analysis, there were no impairment charges related to goodwill in 2019, 2018 or 2017.
Mortgage Servicing Rights
We recognize the right to service mortgage loans for others as an intangible asset when the servicing income we receive is more than adequate compensation. MSRs are purchased or originated when loans are sold with servicing retained. MSRs totaled $1.6 billion at December 31, 2019 and $2.0 billion at December 31, 2018, and consisted of loan servicing contracts for commercial and residential mortgages measured at fair value.
Commercial Mortgage Servicing RightsWe recognize gains/(losses) on changes in the fair value of commercial MSRs. Commercial MSRs are subject to changes in value from actual or expected prepayment of the underlying loans and defaults as well as market driven changes in interest rates. We manage this risk by economically hedging the fair value of commercial MSRs with securities, derivative instruments and resale agreements which are expected to increase (or decrease) in value when the value of commercial MSRs decreases (or increases).
The fair value of commercial MSRs is estimated by using a discounted cash flow model incorporating inputs for assumptions as to constant prepayment rates, discount rates and other factors determined based on current market conditions and expectations.
Changes in the commercial MSRs follow:
Table 59: Commercial Mortgage Servicing Rights
In millions 2019 2018 2017
January 1 $ 726 $ 668 $ 576Additions:
From loans sold with servicing retained 53 57 88Purchases 103 93 69
Changes in fair value due to:Time and payoffs (a) (146) (143) (111)Other (b) (87) 51 46
December 31 $ 649 $ 726 $ 668Related unpaid principal balance at December 31 $ 216,992 $ 180,496 $ 162,182Servicing advances at December 31 $ 157 $ 220 $ 217
(a) Represents decrease in MSR value due to passage of time, including the impact from both regularly scheduled loan principal payments and loans that were paid down or paid off during the period.
(b) Represents MSR value changes resulting primarily from market-driven changes in interest rates.
Residential Mortgage Servicing RightsResidential MSRs are subject to changes in value from actual or expected prepayment of the underlying loans and defaults as well as market driven changes in interest rates. We manage this risk by economically hedging the fair value of residential MSRs with

134 The PNC Financial Services Group, Inc. – 2019 Form 10-K
securities and derivative instruments which are expected to increase (or decrease) in value when the value of residential MSRs decreases (or increases).
The fair value of residential MSRs is estimated by using a discounted cash flow valuation model which calculates the present value of estimated future net servicing cash flows, taking into consideration actual and expected mortgage loan prepayment rates, discount rates, servicing costs, and other factors which are determined based on current market conditions.
Changes in the residential MSRs follow:
Table 60: Residential Mortgage Servicing Rights
In millions 2019 2018 2017
January 1 $ 1,257 $ 1,164 $ 1,182Additions:
From loans sold with servicing retained 36 44 55Purchases 114 129 185
Changes in fair value due to:Time and payoffs (a) (162) (170) (175)Other (b) (250) 90 (83)
December 31 $ 995 $ 1,257 $ 1,164Unpaid principal balance of loans serviced for others at December 31 $ 120,464 $ 125,388 $ 126,769Servicing advances at December 31 $ 111 $ 156 $ 201
(a) Represents decrease in MSR value due to passage of time, including the impact from both regularly scheduled loan principal payments and loans that were paid down or paid off during the period.
(b) Represents MSR value changes resulting from market-driven changes in interest rates.
Sensitivity AnalysisThe fair value of commercial and residential MSRs and significant inputs to the valuation models as of December 31, 2019 are shown in Tables 61 and 62. The expected and actual rates of mortgage loan prepayments are significant factors driving the fair value. Management uses both internal proprietary models and a third-party model to estimate future commercial mortgage loan prepayments and a third-party model to estimate future residential mortgage loan prepayments. These models have been refined based on current market conditions and management judgment. Future interest rates are another important factor in the valuation of MSRs. Management utilizes market implied forward interest rates to estimate the future direction of mortgage and discount rates. The forward rates utilized are derived from the current yield curve for U.S. dollar interest rate swaps and are consistent with pricing of capital markets instruments. Changes in the shape and slope of the forward curve in future periods may result in volatility in the fair value estimate.
A sensitivity analysis of the hypothetical effect on the fair value of MSRs to adverse changes in key assumptions is presented in Tables 61 and 62. These sensitivities do not include the impact of the related hedging activities. Changes in fair value generally cannot be extrapolated because the relationship of the change in the assumption to the change in fair value may not be linear. Also, the effect of a variation in a particular assumption on the fair value of the MSRs is calculated independently without changing any other assumption. In reality, changes in one factor may result in changes in another (e.g., changes in mortgage interest rates, which drive changes in prepayment rate estimates, could result in changes in the interest rate spread), which could either magnify or counteract the sensitivities.
The following tables set forth the fair value of commercial and residential MSRs and the sensitivity analysis of the hypothetical effect on the fair value of MSRs to immediate adverse changes of 10% and 20% in those assumptions:
Table 61: Commercial Mortgage Servicing Rights – Key Valuation Assumptions
Dollars in millionsDecember 31
2019December 31
2018
Fair value $ 649 $ 726Weighted-average life (years) 4.1 4.1Weighted-average constant prepayment rate 4.56% 5.65%
Decline in fair value from 10% adverse change $ 9 $ 10Decline in fair value from 20% adverse change $ 17 $ 19
Effective discount rate 7.91% 8.39%Decline in fair value from 10% adverse change $ 17 $ 19Decline in fair value from 20% adverse change $ 34 $ 39

The PNC Financial Services Group, Inc. – 2019 Form 10-K 135
Table 62: Residential Mortgage Servicing Rights – Key Valuation Assumptions
Dollars in millionsDecember 31
2019December 31
2018
Fair value $ 995 $ 1,257 Weighted-average life (years) 5.2 6.9 Weighted-average constant prepayment rate 13.51 % 8.69 %
Decline in fair value from 10% adverse change $ 46 $ 41 Decline in fair value from 20% adverse change $ 89 $ 79
Weighted-average option adjusted spread 769 bps 806 bps Decline in fair value from 10% adverse change $ 27 $ 37 Decline in fair value from 20% adverse change $ 52 $ 73
Fees from mortgage loan servicing, which includes contractually specified servicing fees, late fees and ancillary fees were $.5 billion for each of 2019, 2018 and 2017. We also generate servicing fees from fee-based activities provided to others for which we do not have an associated servicing asset. Fees from commercial and residential MSRs are reported on our Consolidated Income Statement in Corporate services and Residential mortgage, respectively.
NOTE 8 PREMISES, EQUIPMENT AND LEASEHOLD IMPROVEMENTS
Premises, equipment and leasehold improvements, stated at cost less accumulated depreciation and amortization, were as follows:
Table 63: Premises, Equipment and Leasehold Improvements
In millionsDecember 31
2019December 31
2018
Premises, equipment and leasehold improvements $ 14,681 $ 11,864Accumulated depreciation and amortization (6,953) (6,137)
Net book value $ 7,728 $ 5,727
The following table includes depreciation expense on premises, equipment and leasehold improvements, as well as amortization expense, excluding intangible assets, primarily for capitalized internally developed software.
Table 64: Depreciation and Amortization Expense
Year ended December 31In millions 2019 2018 2017
Depreciation $ 778 $ 754 $ 743Amortization 109 78 56
Total depreciation and amortization $ 887 $ 832 $ 799
NOTE 9 TIME DEPOSITS
Total time deposits of $21.7 billion at December 31, 2019 have future contractual maturities as follows:
Table 65: Time Deposits
In billions
2020 $ 18.62021 $ 1.62022 $ .62023 $ .42024 $ .22025 and thereafter $ .3

136 The PNC Financial Services Group, Inc. – 2019 Form 10-K
NOTE 10 BORROWED FUNDS
The following shows the carrying value of total borrowed funds of $60.3 billion at December 31, 2019 (including adjustments related to purchase accounting, accounting hedges and unamortized original issuance discounts) by remaining contractual maturity:
Table 66: Borrowed Funds
In billions
2020 $ 27.12021 $ 8.52022 $ 8.02023 $ 2.32024 $ 3.02025 and thereafter $ 11.4
The following table presents the contractual rates and maturity dates of our FHLB borrowings, senior debt and subordinated debt as of December 31, 2019 and the carrying values as of December 31, 2019 and 2018.
Table 67: FHLB Borrowings, Senior Debt and Subordinated Debt
Stated Rate Maturity Carrying ValueDollars in millions 2019 2019 2019 2018Parent Company
Senior debt 2.20%-5.13% 2020-2029 $ 8,843 $ 5,063Subordinated debt 3.90% 2024 777 1,447Junior subordinated debt 2.48% 2028 205 205
Subtotal 9,825 6,715Bank
FHLB (a) zero-6.35% 2020-2030 16,341 21,501Senior debt 1.38%-3.50% 2020-2043 20,167 19,955Subordinated debt 2.70%-4.20% 2022-2029 5,152 4,243
Subtotal 41,660 45,699Total $ 51,485 $ 52,414
(a) FHLB borrowings are generally collateralized by residential mortgage loans, other mortgage-related loans and investment securities.
In Table 67, the carrying values for Parent Company senior and subordinated debt include basis adjustments of $177 million and $34 million, respectively, whereas Bank senior and subordinated debt include basis adjustments of $167 million and $170 million, respectively, related to fair value accounting hedges as of December 31, 2019.
Certain borrowings are reported at fair value, refer to Note 6 Fair Value for more information on those borrowings.
Junior Subordinated Debentures
PNC Capital Trust C, a wholly-owned finance subsidiary of The PNC Financial Services Group, Inc., owns junior subordinated debentures issued by PNC with a carrying value of $205 million. In June 1998, PNC Capital Trust C issued $200 million of trust preferred securities which bear interest at an annual rate of 3 month LIBOR plus 57 basis points. The trust preferred securities are currently redeemable by PNC Capital Trust C at par. In accordance with GAAP, the financial statements of the Trust are not included in our consolidated financial statements.
The obligations of The PNC Financial Services Group, Inc., as the parent of the Trust, when taken collectively, are the equivalent of a full and unconditional guarantee of the obligations of the Trust under the terms of the trust preferred securities. Such guarantee is subordinate in right of payment in the same manner as other junior subordinated debt. There are certain restrictions on our overall ability to obtain funds from our subsidiaries. For additional disclosure on these funding restrictions, see Note 18 Regulatory Matters.
We are subject to certain restrictions, including restrictions on dividend payments, in connection with the outstanding junior subordinated debentures. Generally, if there is (i) an event of default under the debenture, (ii) we elect to defer interest on the debenture, (iii) we exercise our right to defer payments on the related trust preferred securities, or (iv) there is a default under our guarantee of such payment obligations, subject to certain limited exceptions, we would be unable during the period of such default or deferral to make payments on our debt securities that rank equal or junior to the debentures as well as to make payments on our equity securities, including dividend payments.

The PNC Financial Services Group, Inc. – 2019 Form 10-K 137
NOTE 11 EMPLOYEE BENEFIT PLANS
Pension and Postretirement Plans
We have a noncontributory, qualified defined benefit pension plan covering eligible employees. Benefits are determined using a cash balance formula where earnings credits are a percentage of eligible compensation. Earnings credit percentages for those employees who were plan participants on December 31, 2009 are frozen at the level earned to that point. Earnings credits for all employees who became participants on or after January 1, 2010 are a flat 3% of eligible compensation. All plan participants earn interest on their cash balances based on 30-year Treasury securities rates with those who were participants at December 31, 2009 earning a minimum rate. New participants on or after January 1, 2010 are not subject to the minimum rate. Beginning in 2018, the plan provides for a minimum annual earnings credit amount of $2,000, subject to eligibility criteria. Pension contributions to the plan are typically based on an actuarially determined amount necessary to fund total benefits payable to plan participants. Assets of the qualified pension plan are held in a separate Trust (Trust).
We also maintain nonqualified supplemental retirement plans for certain employees and provide certain health care and life insurance benefits for qualifying retired employees (postretirement benefits) through various plans. PNC reserves the right to terminate or make changes to these plans at any time. The nonqualified pension plan is unfunded. Contributions from PNC and, in the case of the postretirement benefit plans, participant contributions cover all benefits paid under the nonqualified pension plan and postretirement benefit plans. The postretirement plan provides benefits to certain retirees that are at least actuarially equivalent to those provided by Medicare Part D and accordingly, we receive a federal subsidy as shown in Table 68. In November of 2015, we established a voluntary employee beneficiary association (VEBA) to partially fund postretirement medical and life insurance benefit obligations.
We use a measurement date of December 31 for plan assets and benefit obligations. The qualified pension plan assets and benefit obligation were re-measured as of January 31, 2019 as a result of a plan amendment. A reconciliation of the changes in the projected benefit obligation for qualified pension, nonqualified pension and postretirement benefit plans as well as the change in plan assets for the qualified pension plan follows.

138 The PNC Financial Services Group, Inc. – 2019 Form 10-K
Table 68: Reconciliation of Changes in Projected Benefit Obligation and Change in Plan Assets
QualifiedPension
NonqualifiedPension
PostretirementBenefits
In millions 2019 2018 2019 2018 2019 2018
Accumulated benefit obligation at December 31 $ 4,740 $ 4,315 $ 259 $ 253Projected benefit obligation at January 1 $ 4,355 $ 4,789 $ 258 $ 286 $ 322 $ 355Service cost 115 116 3 3 4 5Interest cost 186 171 10 9 13 12Amendments 21Actuarial (gains)/losses and changes in assumptions 498 (424) 25 (16) 18 (28)Participant contributions 3 3Federal Medicare subsidy on benefits paid 1Benefits paid (288) (297) (31) (24) (27) (26)
Projected benefit obligation at December 31 $ 4,887 $ 4,355 $ 265 $ 258 $ 333 $ 322Fair value of plan assets at January 1 $ 4,963 $ 5,253 $ 232 $ 230Actual return on plan assets 979 (193) 15 3Employer contribution 200 $ 31 $ 24 24 21Participant contributions 3 3Federal Medicare subsidy on benefits paid 1Benefits paid (288) (297) (31) (24) (27) (26)
Fair value of plan assets at December 31 $ 5,654 $ 4,963 $ — $ — $ 247 $ 232Funded status $ 767 $ 608 $ (265) $ (258) $ (86) $ (90)Amounts recognized on the consolidated balance sheet
Noncurrent asset $ 767 $ 608Current liability $ (26) $ (26) $ (2) $ (2)Noncurrent liability (239) (232) (84) (88)Net amount recognized on the consolidated balance sheet $ 767 $ 608 $ (265) $ (258) $ (86) $ (90)
Amounts recognized in AOCI consist of:Prior service cost (credit) $ 29 $ 12 $ 2 $ 1Net actuarial loss (gain) 411 608 $ 78 $ 57 1 (7)
Amount of loss (gain) recognized in AOCI $ 440 $ 620 $ 78 $ 57 $ 3 $ (6)
PNC Pension Plan Assets
The long-term investment strategy for pension plan assets in our qualified pension plan (the Plan) is to:• Meet present and future benefit obligations to all participants and beneficiaries;• Cover reasonable expenses incurred to provide such benefits, including expenses incurred in the administration of the Trust
and the Plan;• Provide sufficient liquidity to meet benefit and expense payment requirements on a timely basis; and• Provide a total return that, over the long term, maximizes the ratio of trust assets to liabilities by maximizing investment
return, at an appropriate level of risk.
The Plan’s named investment fiduciary has the ability to make short to intermediate term asset allocation shifts under the dynamic asset allocation strategy based on factors such as the Plan’s funded status, the named investment fiduciary’s view of return on equities relative to long term expectations, the named investment fiduciary’s view on the direction of interest rates and credit spreads, and other relevant financial or economic factors which would be expected to impact the ability of the Trust to meet its obligation to participants and beneficiaries. Accordingly, the allowable asset allocation ranges have been updated to incorporate the flexibility required by the dynamic allocation policy.

The PNC Financial Services Group, Inc. – 2019 Form 10-K 139
The asset strategy allocations for the Plan at the end of 2019 and 2018, and the target allocation range at the end of 2019, by asset category, are as follows.
Table 69: Asset Strategy Allocations
Target Allocation
RangePercentage of Plan Assets by Strategy
at December 31 2019 2018
Asset CategoryDomestic Equity 20 – 40% 27% 27%International Equity 10 – 25% 17% 22%Private Equity 0 – 15% 10% 11%Total Equity 40 – 70% 54% 60%Domestic Fixed Income 10 – 40% 23% 18%High Yield Fixed Income 0 – 25% 8% 9%Total Fixed Income 10 – 65% 31% 27%Real estate 0 – 10% 5% 5%Other 0 – 15% 10% 8%Total 100% 100% 100%
The asset category represents the allocation of Plan assets in accordance with the investment objective of each of the Plan’s investment managers. Certain domestic equity investment managers utilize derivatives and fixed income securities as described in their Investment Management Agreements to achieve their investment objective under the Investment Policy Statement. Other investment managers may invest in eligible securities outside of their assigned asset category to meet their investment objectives. The actual percentage of the fair value of total Plan assets held as of December 31, 2019 for equity securities, fixed income securities, real estate and all other assets are 61%, 24%, 4% and 11%, respectively.
We believe that, over the long term, asset allocation is the single greatest determinant of risk. Asset allocation will deviate from the target percentages due to market movement, cash flows, investment manager performance and implementation of shifts under the dynamic asset allocation policy. Material deviations from the asset allocation targets can alter the expected return and risk of the Trust. However, frequent rebalancing of the asset allocation targets may result in significant transaction costs, which can impair the Trust’s ability to meet its investment objective. Accordingly, the Trust portfolio is periodically rebalanced to maintain asset allocation within the target ranges described above.
In addition to being diversified across asset classes, the Trust is diversified within each asset class. Secondary diversification provides a reasonable basis for the expectation that no single security or class of securities will have a disproportionate impact on the total risk and return of the Trust.
Where investment strategies permit the use of derivatives and/or currency management, language is incorporated in the managers’ guidelines to define allowable and prohibited transactions and/or strategies. Derivatives are typically employed by investment managers to modify risk/return characteristics of their portfolio(s), implement asset allocation changes in a cost effective manner, or reduce transaction costs. Under the managers’ investment guidelines, derivatives may not be used solely for speculation or leverage. Derivatives are to be used only in circumstances where they offer the most efficient economic means of improving the risk/reward profile of the portfolio.

140 The PNC Financial Services Group, Inc. – 2019 Form 10-K
Fair Value Measurements
As further described in Note 6 Fair Value, GAAP establishes the framework for measuring fair value, including a hierarchy used to classify the inputs used in measuring fair value.
A description of the valuation methodologies used for assets measured at fair value at both December 31, 2019 and 2018 follows:
Asset Valuation MethodologyMoney market funds • Valued at the net asset value of the shares held by the pension plan at year end.U.S. government and agency securities
Corporate debt
Common stock
• Valued at the closing price reported on the active market on which the individual securities are traded.• If quoted market prices are not available for the specific security, then fair values are estimated by using
pricing models or quoted prices of securities with similar characteristics. Such securities are generally classified within Level 2 of the valuation hierarchy but may be a Level 3 depending on the level of liquidity and activity in the market for the security.
Mutual funds • Valued based on third-party pricing of the fund which is not actively traded.Other investments
Derivative financial instruments
Group annuity contracts
Preferred stock
• Derivative financial instruments - recorded at estimated fair value as determined by third-party appraisals and pricing models.
• Group annuity contracts - measured at fair value by discounting the related cash flows based on current yields of similar instruments with comparable durations considering the credit-worthiness of the issuer.
• Preferred stock - Valued at the closing price reported on an active market on which the securities are traded.
Investments measured at NAV
Collective trust fund investments
Limited partnerships
• Collective trust fund investments - Valued based upon the units of such collective trust fund held by the Plan at year end multiplied by the respective unit value. The unit value of the collective trust fund is based upon significant observable inputs, although it is not based upon quoted marked prices in an active market. The underlying investments of the collective trust funds consist primarily of equity securities, debt obligations, short-term investments, and other marketable securities. Due to the nature of these securities, there are no unfunded commitments or redemption restrictions.
• Limited partnerships - Valued by investment managers based on recent financial information used to estimate fair value. The unit value of limited partnerships is based upon significant observable inputs, although it is not based upon quoted marked prices in an active market.
These methods may result in fair value calculations that may not be indicative of net realizable values or future fair values. Furthermore, while the pension plan believes its valuation methods are appropriate and consistent with other market participants, the use of different methodologies or assumptions to determine the fair value of certain financial instruments could result in a different fair value measurement at the reporting date.
The following table sets forth by level, within the fair value hierarchy, the Plan’s assets at fair value as of December 31, 2019 and 2018.
Table 70: Pension Plan Assets - Fair Value Hierarchy
December 31, 2019 December 31, 2018
In millions Level 1 Level 2 Level 3Total Fair
Value Level 1 Level 2 Level 3Total Fair
ValueInterest bearing cash $ 1 $ 1 $ 7 $ 2 $ 9Money market funds $ 456 456 149 149U.S. government and agency securities 582 135 $ 1 718 512 130 642Corporate debt 660 3 663 580 $ 6 586Common stock 620 1 4 625 623 6 629Mutual funds 253 253 236 236Other 126 126 4 42 4 50Investments measured at net asset value (a) 2,812 2,662Total $ 1,658 $ 1,176 $ 8 $ 5,654 $ 1,295 $ 996 $ 10 $ 4,963
(a) Certain investments that are measured at fair value using the NAV per share (or its equivalent) practical expedient have not been classified in the fair value hierarchy.

The PNC Financial Services Group, Inc. – 2019 Form 10-K 141
The following table provides information regarding our estimated future cash flows related to our various plans.
Table 71: Estimated Cash Flows
Pension Plans Postretirement BenefitsIn millions Qualified Pension Nonqualified Pension Gross PNC Benefit Payments
Estimated 2020 employer contributions $ 26 $ 28Estimated future benefit payments
2020 $ 300 $ 26 $ 282021 $ 315 $ 26 $ 272022 $ 329 $ 23 $ 262023 $ 327 $ 23 $ 252024 $ 316 $ 21 $ 252025-2029 $ 1,557 $ 92 $ 111
The qualified pension plan contributions are deposited into the Trust, and the qualified pension plan benefit payments are paid from the Trust. We do not expect to be required to make a contribution to the qualified plan for 2020 based on the funding calculations under the Pension Protection Act of 2006. For the other plans, total contributions and the benefit payments are the same and represent expected benefit amounts, which are paid from general assets. Postretirement benefits are net of participant contributions. Estimated cash flows reflect the partial funding of postretirement medical and life insurance obligations in the VEBA.
The components of net periodic benefit cost/(income) and other amounts recognized in Other comprehensive income (OCI) were as follows.
Table 72: Components of Net Periodic Benefit Cost (a)
Qualified Pension Plan Nonqualified Pension Plan Postretirement BenefitsYear ended December 31 – in millions 2019 (b) 2018 2017 2019 2018 2017 2019 2018 2017Net periodic cost consists of:Service cost $ 115 $ 116 $ 160 $ 3 $ 3 $ 3 $ 4 $ 5 $ 5Interest cost 186 171 179 10 9 10 13 12 14Expected return on plan assets (288) (306) (285) (5) (6) (5)Amortization of prior service cost/(credit) 4 1 (3) (1)Amortization of actuarial (gain)/loss 4 43 4 5 4 Net periodic cost (benefit) 21 (18) 94 17 17 17 12 11 13Other changes in plan assets and benefit obligations recognized in OCI:Current year prior service cost/(credit) 21 17 2Amortization of prior service (cost)/credit (4) (1) 3 1Current year actuarial loss/(gain) (193) 75 (264) 25 (16) 7 9 (25) (22)Amortization of actuarial gain/(loss) (4) (43) (4) (5) (4)
Total recognized in OCI (180) 74 (287) 21 (21) 3 9 (25) (19)Total amounts recognized in net periodic cost and OCI $ (159) $ 56 $ (193) $ 38 $ (4) $ 20 $ 21 $ (14) $ (6)
(a) The service cost component is included in Personnel expense on the Consolidated Income Statement. All other components are included in Other noninterest expense on the Consolidated Income Statement.
(b) Includes the effects of the qualified pension plan remeasurement as of January 31, 2019 as a result of a plan amendment.

142 The PNC Financial Services Group, Inc. – 2019 Form 10-K
The weighted-average assumptions used (as of the beginning of each year) to determine the net periodic costs shown in Table 72 were as follows.
Table 73: Net Periodic Costs - Assumptions
Net Periodic Cost DeterminationAs of January 1 2019 2018 2017Discount rate
Qualified pension (a) 4.30% 3.60% 4.00%Nonqualified pension 4.15% 3.45% 3.80%Postretirement benefits 4.20% 3.55% 3.90%
Rate of compensation increase (average) 3.50% 3.50% 3.50%Assumed health care cost trend rate
Initial trend 6.50% 6.75% 7.00%Ultimate trend 5.00% 5.00% 5.00%Year ultimate trend reached 2025 2025 2025
Expected long-term return on plan assets 5.75% 6.00% 6.38% (a) The 2019 qualified pension discount rate was 4.15% at the time of remeasurement on January 31, 2019 as a result of a plan amendment.
The weighted-average assumptions used (as of the end of each year) to determine year end obligations for pension and postretirement benefits were as follows.
Table 74: Other Pension Assumptions
Year ended December 31 2019 2018
Discount rateQualified pension 3.30% 4.30%Nonqualified pension 3.05% 4.15%Postretirement benefits 3.20% 4.20%
Rate of compensation increase (average) 4.25% 3.50%Assumed health care cost trend rate
Initial trend 6.25% 6.50%Ultimate trend 5.00% 5.00%Year ultimate trend reached 2025 2025
The discount rates are determined independently for each plan by comparing the expected future benefits that will be paid under each plan with yields available on high quality corporate bonds of similar duration. For this analysis, 10% of bonds with the highest yields and 40% with the lowest yields were removed from the bond universe. The expected return on plan assets is a long-term assumption established by considering historical and anticipated returns of the asset classes invested in by the pension plan and the allocation strategy currently in place among those classes. For purposes of setting and reviewing this assumption, “long- term” refers to the period over which the plan’s projected benefit obligations will be disbursed. We review this assumption at each measurement date and adjust it if warranted. Our selection process references certain historical data and the current environment, but primarily utilizes qualitative judgment regarding future return expectations. We also examine the assumption used by other companies with similar pension investment strategies. Taking into account all of these factors, the expected long-term return on plan assets for determining net periodic pension cost for 2019 was 5.75%. We are reducing our expected long-term return on assets to 5.50% for determining pension cost for 2020. This decision was made after considering the views of both internal and external capital market advisors, particularly with regard to the effects of the recent economic environment on long-term prospective equity and fixed income returns.
PNC’s net periodic benefit cost recognized for the plans is sensitive to the discount rate and expected long-term return on plan assets. With all other assumptions held constant, a .5% decline in the discount rate would have resulted in an immaterial increase in net periodic benefit cost for the qualified pension plan in 2019, and to be recognized in 2020. For the nonqualified pension plan and postretirement benefits, a .5% decline in the discount rate would also have resulted in an immaterial increase in net periodic benefit cost.
The health care cost trend rate assumptions shown in Tables 73 and 74 relate only to the postretirement benefit plans. The effect of a one-percentage-point increase or decrease in assumed health care cost trend rates would be insignificant.

The PNC Financial Services Group, Inc. – 2019 Form 10-K 143
Defined Contribution Plans
The PNC Incentive Savings Plan (ISP) is a qualified defined contribution plan that covers all of our eligible employees. Newly-hired full time employees and part-time employees who are eligible to participate in the ISP are automatically enrolled in the ISP with a deferral rate equal to 4% of eligible compensation in the absence of an affirmative election otherwise. Employee benefits expense related to the ISP was $139 million in 2019, $139 million in 2018 and $125 million in 2017, representing cash contributed to the ISP by PNC.
The ISP is a 401(k) Plan and includes an employee stock ownership (ESOP) feature. Employee contributions are invested in a number of investment options, including pre-mixed portfolios and individual core funds, available under the ISP at the direction of the employee.
NOTE 12 STOCK BASED COMPENSATION PLANS
We have long-term incentive award plans (Incentive Plans) that provide for the granting of incentive stock options, nonqualified stock options, stock appreciation rights, incentive shares/performance units, restricted shares, restricted share units, other share-based awards and dollar-denominated awards to executives and, other than incentive stock options, to non-employee directors. Certain Incentive Plan awards may be paid in stock, cash or a combination of stock and cash. We typically grant a substantial portion of our stock-based compensation awards during the first quarter of each year.
Incentive/Performance Unit Awards and Restricted Share/Restricted Share Unit Awards
The fair value of nonvested incentive/performance unit awards and restricted share/restricted share unit awards is initially determined based on prices not less than the market value of our common stock on the date of grant with a reduction for estimated forfeitures. The value of certain incentive/performance unit awards is subsequently remeasured based on the achievement of one or more financial and other performance goals. Additionally, certain incentive/performance unit awards require subsequent adjustment to their current market value due to certain discretionary risk review triggers.
The weighted-average grant date fair value of incentive/performance unit awards and restricted share/restricted share unit awards granted in 2019, 2018 and 2017 was $117.53, $149.38 and $122.10 per share, respectively. The total intrinsic value of incentive/performance unit and restricted share/restricted share unit awards vested during 2019, 2018 and 2017 was approximately $218 million, $254 million and $235 million, respectively. We recognize compensation expense for such awards ratably over the corresponding vesting and/or performance periods for each type of program.
Table 75: Nonvested Incentive/Performance Unit Awards and Restricted Share/Restricted Share Unit Awards Rollforward
Shares in thousands
Nonvested Incentive/Performance Units
SharesWeighted-Average
Grant Date Fair Value
Nonvested RestrictedShare/Restricted
Share UnitsWeighted-Average
Grant Date Fair Value
December 31, 2018 1,134 $ 104.02 3,104 $ 115.57Granted (a) 207 $ 115.36 1,560 $ 117.82Vested/Released (a) (494) $ 88.29 (1,278) $ 84.37Forfeitures (3) $ 105.43 (81) $ 132.03
December 31, 2019 844 $ 116.00 3,305 $ 128.29(a) Includes adjustments for achieving specific performance goals for Incentive/Performance Unit Share Awards granted in prior periods.
In Table 75, the units and related weighted-average grant date fair value of the incentive/performance unit share awards exclude the effect of dividends on the underlying shares, as those dividends will be paid in cash if and when the underlying shares are issued to the participants.
NOTE 13 FINANCIAL DERIVATIVES
We use a variety of financial derivatives to both mitigate exposure to market (primarily interest rate) and credit risks inherent in our business activities, as well as to facilitate customer risk management activities. We manage these risks as part of our overall asset and liability management process and through our credit policies and procedures. Derivatives represent contracts between parties that usually require little or no initial net investment and result in one party delivering cash or another type of asset to the other party based on a notional amount and an underlying as specified in the contract.
Derivative transactions are often measured in terms of notional amount, but this amount is generally not exchanged and it is not recorded on the balance sheet. The notional amount is the basis to which the underlying is applied to determine required payments under the derivative contract. The underlying is a referenced interest rate (commonly LIBOR), security price, credit spread or other

144 The PNC Financial Services Group, Inc. – 2019 Form 10-K
index. Residential and commercial real estate loan commitments associated with loans to be sold also qualify as derivative instruments.
The following table presents the notional amounts and gross fair values of all derivative assets and liabilities held by us.
Table 76: Total Gross Derivatives (a)
December 31, 2019 December 31, 2018
In millionsNotional /
Contract AmountAsset FairValue (b)
Liability FairValue (c)
Notional /Contract Amount
Asset FairValue (b)
Liability FairValue (c)
Derivatives used for hedgingInterest rate contracts (d):
Fair value hedges $ 30,663 $ 30,919 $ 7Cash flow hedges 23,642 $ 6 17,337 1
Foreign exchange contracts:Net investment hedges 1,102 $ 6 1,012 $ 10
Total derivatives designated for hedging $ 55,407 $ 6 $ 6 $ 49,268 $ 8 $ 10Derivatives not used for hedgingDerivatives used for mortgage banking activities (e):
Interest rate contracts:Swaps $ 52,007 $ 1 $ 43,084 $ 3Futures (f) 3,487 10,658Mortgage-backed commitments 7,738 60 $ 44 5,771 $ 47 39Other 3,134 32 23 6,509 10 3
Total interest rate contracts 66,366 93 67 66,022 57 45Derivatives used for customer-related activities:
Interest rate contracts:Swaps 249,075 2,769 1,187 218,496 1,352 1,432Futures (f) 703 914Mortgage-backed commitments 3,721 2 6 2,246 7 10Other 21,379 113 33 20,109 77 33
Total interest rate contracts 274,878 2,884 1,226 241,765 1,436 1,475Commodity contracts:
Swaps 5,204 234 229 4,813 244 238Other 4,203 72 72 1,418 67 67
Total commodity contracts 9,407 306 301 6,231 311 305Foreign exchange contracts and other 27,120 204 162 23,253 194 192
Total foreign exchange contracts and other 311,405 3,394 1,689 271,249 1,941 1,972Derivatives used for other risk management activities:
Foreign exchange contracts and other 10,201 9 257 7,908 75 263Total derivatives not designated for hedging $ 387,972 $ 3,496 $ 2,013 $ 345,179 $ 2,073 $ 2,280Total gross derivatives $ 443,379 $ 3,502 $ 2,019 $ 394,447 $ 2,081 $ 2,290Less: Impact of legally enforceable master netting agreements 690 690 688 688Less: Cash collateral received/paid 616 790 341 539Total derivatives $ 2,196 $ 539 $ 1,052 $ 1,063
(a) Centrally cleared derivatives are settled in cash daily and result in no derivative asset or derivative liability being recognized on our Consolidated Balance Sheet.(b) Included in Other assets on our Consolidated Balance Sheet.(c) Included in Other liabilities on our Consolidated Balance Sheet.(d) Represents primarily swaps.(e) Includes both residential and commercial mortgage banking activities.(f) Futures contracts settle in cash daily and, therefore, no derivative asset or derivative liability is recognized on our Consolidated Balance Sheet.
All derivatives are carried on our Consolidated Balance Sheet at fair value. Derivative balances are presented on the Consolidated Balance Sheet on a net basis taking into consideration the effects of legally enforceable master netting agreements and, when appropriate, any related cash collateral exchanged with counterparties. Further discussion regarding the offsetting rights associated with these legally enforceable master netting agreements is included in the Offsetting, Counterparty Credit Risk, and Contingent Features section below. Any nonperformance risk, including credit risk, is included in the determination of the estimated net fair value of the derivatives.

The PNC Financial Services Group, Inc. – 2019 Form 10-K 145
Further discussion on how derivatives are accounted for is included in Note 1 Accounting Policies.
Derivatives Designated As Hedging Instruments
Certain derivatives used to manage interest rate and foreign exchange risk as part of our asset and liability risk management activities are designated as accounting hedges. Derivatives hedging the risks associated with changes in the fair value of assets or liabilities are considered fair value hedges, derivatives hedging the variability of expected future cash flows are considered cash flow hedges, and derivatives hedging a net investment in a foreign subsidiary are considered net investment hedges. Designating derivatives as accounting hedges allows for gains and losses on those derivatives to be recognized in the same period and in the same income statement line item as the earnings impact of the hedged items.
Fair Value HedgesWe enter into receive-fixed, pay-variable interest rate swaps to hedge changes in the fair value of outstanding fixed-rate debt caused by fluctuations in market interest rates. We also enter into pay-fixed, receive-variable interest rate swaps and zero-coupon swaps to hedge changes in the fair value of fixed rate and zero-coupon investment securities caused by fluctuations in market interest rates. Gains and losses on the interest rate swaps designated in these hedge relationships, along with the offsetting gains and losses on the hedged items attributable to the hedged risk, are recognized in current earnings within the same income statement line item.
Cash Flow HedgesWe enter into receive-fixed, pay-variable interest rate swaps to modify the interest rate characteristics of designated commercial loans from variable to fixed in order to reduce the impact of changes in future cash flows due to market interest rate changes. We also periodically enter into forward purchase and sale contracts to hedge the variability of the consideration that will be paid or received related to the purchase or sale of investment securities. The forecasted purchase or sale is consummated upon gross settlement of the forward contract itself. For these cash flow hedges, gains and losses on the interest rate swaps and forward contracts are recorded in AOCI and are then reclassified into earnings in the same period the hedged cash flows affect earnings and within the same income statement line as the hedged cash flows.
In the 12 months that follow December 31, 2019, we expect to reclassify net derivative gains of $164 million pretax, or $129 million after-tax, from AOCI to interest income for both cash flow hedge strategies. This reclassified amount could differ from amounts actually recognized due to changes in interest rates, hedge de-designations, and the addition of other hedges subsequent to December 31, 2019. As of December 31, 2019, the maximum length of time over which forecasted transactions are hedged is ten years.

146 The PNC Financial Services Group, Inc. – 2019 Form 10-K
Further detail regarding gains (losses) related to our fair value and cash flow hedge derivatives is presented in the following table:
Table 77: Gains (Losses) Recognized on Fair Value and Cash Flow Hedges in the Consolidated Income Statement (a) (b)
Location and Amount of Gains (Losses) Recognized in Income Interest Income Interest Expense Noninterest IncomeIn millions Loans Investment Securities Borrowed Funds OtherYear ended December 31, 2019
Total amounts on the Consolidated Income Statement $ 10,525 $ 2,426 $ 1,811 $ 1,473Gains (losses) on fair value hedges recognized on:
Hedged items (c) $ 187 $ (808)Derivatives $ (178) $ 659Amounts related to interest settlements on derivatives $ 13 $ 79
Gains (losses) on cash flow hedges (d):Amount of derivative gains (losses) reclassified from AOCI $ 9 $ 9 $ 19
Year ended December 31, 2018Total amounts on the Consolidated Income Statement $ 9,580 $ 2,261 $ 1,632 $ 1,205
Gains (losses) on fair value hedges recognized on:Hedged items (c) $ (53) $ 151Derivatives $ 60 $ (262)Amounts related to interest settlements on derivatives $ 3 $ 80
Gains (losses) on cash flow hedges (d):Amount of derivative gains (losses) reclassified from AOCI $ 41 $ 11 $ 8
Year ended December 31, 2017Total amounts on the Consolidated Income Statement $ 8,238 $ 1,998 $ 1,083 $ 1,077
Gains (losses) on fair value hedges recognized on (e):Hedged items (c) $ (50) $ 268Derivatives $ 48 $ (284)Amounts related to interest settlements on derivatives $ (41) $ 234
Gains (losses) on cash flow hedges (d):Amount of derivative gains (losses) reclassified from AOCI $ 159 $ 21 $ 17
(a) For all periods presented, there were no components of derivative gains or losses excluded from the assessment of hedge effectiveness for any of the fair value or cash flow hedge strategies.
(b) All cash flow and fair value hedge derivatives were interest rate contracts for the periods presented.(c) Includes an insignificant amount of fair value hedge adjustments related to discontinued hedge relationships.(d) For all periods presented, there were no gains or losses from cash flow hedge derivatives reclassified to income because it became probable that the original forecasted
transaction would not occur.(e) The difference between the gains (losses) recognized in income on derivatives and their related hedged items represents the ineffective portion of the change in value of
our fair value hedged derivatives.
Further detail regarding gains (losses) on derivatives and related cash flows is presented in the following table:
Table 78: Hedged Items - Fair Value Hedges
December 31, 2019 December 31, 2018
In millionsCarrying Value of the
Hedged Items
Cumulative Fair ValueHedge Adjustment
included in the CarryingValue of Hedged Items (a)
Carrying Value of theHedged Items
Cumulative Fair ValueHedge Adjustment
included in the CarryingValue of Hedged Items (a)
Investment securities - Available for Sale (b) $ 5,666 $ 59 $ 6,216 $ (103)Borrowed funds $ 28,616 $ 548 $ 27,121 $ (260)
(a) Includes $(.3) billion and $(.5) billion of fair value hedge adjustments primarily related to discontinued borrowed funds hedge relationships at December 31, 2019 and 2018, respectively.
(b) Carrying value shown represents amortized cost.
Net Investment HedgesWe enter into foreign currency forward contracts to hedge non-U.S. dollar net investments in foreign subsidiaries against adverse changes in foreign exchange rates. We assess whether the hedging relationship is highly effective in achieving offsetting changes in the value of the hedge and hedged item by qualitatively verifying that the critical terms of the hedge and hedged item match at the inception of the hedging relationship and on an ongoing basis. Net investment hedge derivatives are classified as foreign exchange contracts. There were no components of derivative gains or losses excluded from the assessment of the hedge effectiveness for all periods presented. For 2018 and 2017, there was no net investment hedge ineffectiveness. Net gains (losses) on net investment hedge derivatives recognized in OCI were $(24) million in 2019, $76 million in 2018 and $(81) million in 2017.

The PNC Financial Services Group, Inc. – 2019 Form 10-K 147
Derivatives Not Designated As Hedging Instruments
Residential mortgage loans that will be sold in the secondary market, and the related loan commitments, which are considered derivatives, are accounted for at fair value. Changes in the fair value of the loans and commitments due to interest rate risk are hedged with forward contracts to sell mortgage-backed securities, as well as U.S. Treasury and Eurodollar futures and options. Gains and losses on the loans and commitments held for sale and the derivatives used to economically hedge them are included in Residential mortgage noninterest income on the Consolidated Income Statement.
Residential mortgage servicing rights are accounted for at fair value with changes in fair value influenced primarily by changes in interest rates. Derivatives used to hedge the fair value of residential mortgage servicing rights include interest rate futures, swaps, options, and forward contracts to purchase mortgage-backed securities. Gains and losses on residential mortgage servicing rights and the related derivatives used for hedging are included in Residential mortgage noninterest income.
Commercial mortgage loans held for sale and the related loan commitments, which are considered derivatives, are accounted for at fair value. Derivatives used to economically hedge these loans and commitments from changes in fair value due to interest rate risk and credit risk include forward loan sale contracts, interest rate swaps, and credit default swaps. Gains and losses on the commitments, loans and derivatives are included in Other noninterest income. Derivatives used to economically hedge the change in value of commercial mortgage servicing rights include interest rate futures, swaps and options. Gains or losses on these derivatives are included in Corporate services noninterest income.
The residential and commercial mortgage loan commitments associated with loans to be sold which are accounted for as derivatives are valued based on the estimated fair value of the underlying loan and the probability that the loan will fund within the terms of the commitment. The fair value also takes into account the fair value of the embedded servicing right.
We offer derivatives to our customers in connection with their risk management needs. These derivatives primarily consist of interest rate and commodity swaps, interest rate and commodity caps and floors, swaptions and foreign exchange contracts. We primarily manage our market risk exposure from customer transactions by entering into a variety of hedging transactions with third-party dealers. Gains and losses on customer-related derivatives are included in Other noninterest income.
Included in the customer, mortgage banking risk management, and other risk management portfolios are written interest-rate caps and floors entered into with customers and for risk management purposes. We receive an upfront premium from the counterparty and are obligated to make payments to the counterparty if the underlying market interest rate rises above or falls below a certain level designated in the contract. Our ultimate obligation under written options is based on future market conditions.
We have entered into risk participation agreements to share some of the credit exposure with other counterparties related to interest rate derivative contracts or to take on credit exposure to generate revenue. The notional amount of risk participation agreements sold was $8.0 billion at December 31, 2019 and $6.0 billion at December 31, 2018. Assuming all underlying third party customers referenced in the swap contracts defaulted, the exposure from these agreements would be $.3 billion at December 31, 2019 and $.2 billion at December 31, 2018 based on the fair value of the underlying swaps.
Further detail regarding the gains (losses) on derivatives not designated in hedging relationships is presented in the following table:
Table 79: Gains (Losses) on Derivatives Not Designated for Hedging
Year ended December 31In millions 2019 2018 2017
Derivatives used for mortgage banking activities:Interest rate contracts (a) $ 405 $ (56) $ 75
Derivatives used for customer-related activities:Interest rate contracts 125 99 95Foreign exchange contracts and other (b) 114 104 146
Gains (losses) from customer-related activities (c) 239 203 241Derivatives used for other risk management activities:
Foreign exchange contracts and other (c) (137) 268 (525)Total gains (losses) from derivatives not designated as hedging instruments $ 507 $ 415 $ (209)
(a) Included in Residential mortgage, Corporate services and Other noninterest income on our Consolidated Income Statement.(b) Includes an insignificant amount of gains (losses) on commodity contracts for all periods presented.(c) Included in Other noninterest income on our Consolidated Income Statement.

148 The PNC Financial Services Group, Inc. – 2019 Form 10-K
Offsetting, Counterparty Credit Risk, and Contingent Features
We generally utilize a net presentation on the Consolidated Balance Sheet for those derivative financial instruments entered into with counterparties under legally enforceable master netting agreements. The master netting agreements reduce credit risk by permitting the closeout netting of all outstanding derivative instruments under the master netting agreement with the same counterparty upon the occurrence of an event of default. The master netting agreement also may require the exchange of cash or marketable securities to collateralize either party’s net position. In certain cases, minimum thresholds must be exceeded before any collateral is exchanged. Collateral is typically exchanged daily on unsettled positions based on the net fair value of the positions with the counterparty as of the preceding day. Collateral representing initial margin, which is based on potential future exposure, is also required to be pledged by us in relation to derivative instruments with central clearing house counterparties. Any cash collateral exchanged with counterparties under these master netting agreements is also netted, when appropriate, against the applicable derivative fair values on the Consolidated Balance Sheet. However, the fair value of any securities held or pledged is not included in the net presentation on the balance sheet. In order for derivative instruments under a master netting agreement to be eligible for closeout netting under GAAP, we must conduct sufficient legal review to conclude with a well-founded basis that the offsetting rights included in the master netting agreement would be legally enforceable upon an event of default, including upon an event of bankruptcy, insolvency, or a similar proceeding of the counterparty. Enforceability is evidenced by a legal opinion that supports, with sufficient confidence, the enforceability of the master netting agreement in such circumstances.
Table 80 shows the impact legally enforceable master netting agreements had on our derivative assets and derivative liabilities as of December 31, 2019 and 2018. The table includes cash collateral held or pledged under legally enforceable master netting agreements. The table also includes the fair value of any securities collateral held or pledged under legally enforceable master netting agreements. Cash and securities collateral amounts are included in the table only to the extent of the related net derivative fair values.
Table 80 includes over-the-counter (OTC) derivatives and OTC derivatives cleared through a central clearing house. OTC derivatives represent contracts executed bilaterally with counterparties that are not settled through an organized exchange or directly cleared through a central clearing house. The majority of OTC derivatives are governed by the International Swaps and Derivatives Association (ISDA) documentation or other legally enforceable master netting agreements. OTC cleared derivatives represent contracts executed bilaterally with counterparties in the OTC market that are novated to a central clearing house who then becomes our counterparty. OTC cleared derivative instruments are typically settled in cash each day based on the prior day value.

The PNC Financial Services Group, Inc. – 2019 Form 10-K 149
Table 80: Derivative Assets and Liabilities Offsetting
In millionsGross
Fair Value
Amounts Offset on theConsolidated Balance Sheet
Net Fair Value
SecuritiesCollateral Held /
Pledged UnderMaster Netting
Agreements Net AmountsFair Value
Offset Amount Cash Collateral
December 31, 2019Derivative assets
Interest rate contracts:Over-the-counter cleared $ 14 $ 14 $ 14Over-the-counter 2,969 $ 365 $ 593 2,011 $ 215 1,796
Commodity contracts 306 198 18 90 90Foreign exchange and other contracts 213 127 5 81 81
Total derivative assets $ 3,502 $ 690 $ 616 $ 2,196 (a) $ 215 $ 1,981Derivative liabilities
Interest rate contracts:Over-the-counter cleared $ 14 $ 14 $ 14Over-the-counter 1,279 $ 475 $ 692 112 112
Commodity contracts 301 152 17 132 132Foreign exchange and other contracts 425 63 81 281 281
Total derivative liabilities $ 2,019 $ 690 $ 790 $ 539 (b) $ 539December 31, 2018
Derivative assetsInterest rate contracts:
Over-the-counter cleared $ 29 $ 29 $ 29Over-the-counter 1,472 $ 450 $ 117 905 $ 25 880
Commodity contracts 311 76 210 25 25Foreign exchange and other contracts 269 162 14 93 93
Total derivative assets $ 2,081 $ 688 $ 341 $ 1,052 (a) $ 25 $ 1,027Derivative liabilities
Interest rate contracts:Over-the-counter cleared $ 24 $ 24 $ 24Over-the-counter 1,496 $ 557 $ 489 450 $ 11 439
Commodity contracts 305 56 17 232 232Foreign exchange and other contracts 465 75 33 357 357
Total derivative liabilities $ 2,290 $ 688 $ 539 $ 1,063 (b) $ 11 $ 1,052(a) Represents the net amount of derivative assets included in Other assets on our Consolidated Balance Sheet.(b) Represents the net amount of derivative liabilities included in Other liabilities on our Consolidated Balance Sheet.
In addition to using master netting agreements and other collateral agreements to reduce credit risk associated with derivative instruments, we also seek to manage credit risk by evaluating credit ratings of counterparties and by using internal credit analysis, limits, and monitoring procedures.
At December 31, 2019, we held cash, U.S. government securities and mortgage-backed securities totaling $1.1 billion under master netting agreements and other collateral agreements to collateralize net derivative assets due from counterparties, and we pledged cash totaling $1.4 billion under these agreements to collateralize net derivative liabilities owed to counterparties and to meet initial margin requirements. These totals may differ from the amounts presented in the preceding offsetting table because these totals may include collateral exchanged under an agreement that does not qualify as a master netting agreement or because the total amount of collateral held or pledged exceeds the net derivative fair values with the counterparty as of the balance sheet date due to timing or other factors, such as initial margin. To the extent not netted against the derivative fair values under a master netting agreement, the receivable for cash pledged is included in Other assets and the obligation for cash held is included in Other liabilities on our Consolidated Balance Sheet. Securities held from counterparties are not recognized on our balance sheet. Likewise, securities we have pledged to counterparties remain on our balance sheet.
Certain derivative agreements contain various credit-risk related contingent provisions, such as those that require our debt to maintain a specified credit rating from one or more of the major credit rating agencies. If our debt ratings were to fall below such specified ratings, the counterparties to the derivative instruments could request immediate payment or demand immediate and ongoing full collateralization on derivative instruments in net liability positions. The aggregate fair value of all derivative instruments with credit-risk-related contingent features that were in a net liability position on December 31, 2019 was $1.7 billion for which we had posted collateral of $.5 billion in the normal course of business. The maximum additional amount of collateral we would have been required

150 The PNC Financial Services Group, Inc. – 2019 Form 10-K
to post if the credit-risk related contingent features underlying these agreements had been triggered on December 31, 2019 would be $1.2 billion.
NOTE 14 EARNINGS PER SHARE
Table 81: Basic and Diluted Earnings Per Common Share
In millions, except per share data 2019 2018 2017
BasicNet income $ 5,418 $ 5,346 $ 5,388Less:
Net income attributable to noncontrolling interests 49 45 50Preferred stock dividends 236 236 236Preferred stock discount accretion and redemptions 4 4 26
Net income attributable to common shareholders 5,129 5,061 5,076Less: Dividends and undistributed earnings allocated to participating securities 21 21 23
Net income attributable to basic common shareholders $ 5,108 $ 5,040 $ 5,053Basic weighted-average common shares outstanding 447 467 481Basic earnings per common share (a) $ 11.43 $ 10.79 $ 10.49
DilutedNet income attributable to basic common shareholders $ 5,108 $ 5,040 $ 5,053
Less: Impact of BlackRock earnings per share dilution 10 9 16Net income attributable to diluted common shareholders $ 5,098 $ 5,031 $ 5,037Basic weighted-average common shares outstanding 447 467 481Dilutive potential common shares 1 3 5Diluted weighted-average common shares outstanding 448 470 486Diluted earnings per common share (a) $ 11.39 $ 10.71 $ 10.36
(a) Basic and diluted earnings per share under the two-class method are determined on net income reported on the income statement less earnings allocated to nonvested restricted shares and restricted share units with nonforfeitable dividends and dividend rights (participating securities).
NOTE 15 EQUITY
Preferred Stock
The following table provides the number of preferred shares issued and outstanding, the liquidation value per share and the number of authorized preferred shares.
Table 82: Preferred Stock – Authorized, Issued and Outstanding
Preferred Shares
December 31Shares in thousands
Liquidationvalue per share 2019 2018
Authorized$1 par value 20,000 20,000
Issued and outstandingSeries B $ 40 1 1Series O $ 100,000 10 10Series P $ 100,000 15 15Series Q $ 100,000 5 5Series R $ 100,000 5 5Series S $ 100,000 5 5Total issued and outstanding 41 41

The PNC Financial Services Group, Inc. – 2019 Form 10-K 151
The following table discloses information related to the preferred stock outstanding as of December 31, 2019.
Table 83: Terms of Outstanding Preferred Stock
PreferredStock
IssueDate
Number ofDepositary
Shares Issued and
Outstanding
Fractional Interestin a share of
preferred stockrepresented by
each DepositaryShare Dividend Dates (a) Annual Per Share Dividend Rate
OptionalRedemption
Date (b)Series B (c) (c) N/A N/A Quarterly from March 10th $ 1.80 None
Series O (d) July 27, 2011 1 million 1/100th
Semi-annually beginningon February 1, 2012until August 1, 2021
Quarterly beginning on
November 1, 2021
6.75% until August 1, 2021
3 Mo. LIBOR plus 3.678% per annumbeginning on August 1, 2021
August 1, 2021
Series P (d) April 24, 2012 60 million 1/4,000th Quarterly beginning onAugust 1, 2012
6.125% until May 1, 20223 Mo. LIBOR plus 4.0675% per annum
beginning on May 1, 2022May 1, 2022
Series Q (d) September 21, 2012 October 9, 2012
18 million 1.2 million 1/4,000th Quarterly beginning on
December 1, 2012 5.375% December 1, 2017
Series R (d) May 7, 2013 500,000 1/100th
Semi-annually beginningon December 1, 2013 until
June 1, 2023
Quarterly beginning onSeptember 1, 2023
4.85% until June 1, 2023
3 Mo. LIBOR plus 3.04% per annum
beginning June 1, 2023
June 1, 2023
Series S (d) November 1, 2016 525,000 1/100th
Semi-annually beginningon May 1, 2017
until November 1, 2026
Quarterly beginning onFebruary 1, 2027
5.00% until November 1, 2026
3 Mo. LIBOR plus 3.30% per annumbeginning November 1, 2026
November 1, 2026
(a) Dividends are payable when, as, and if declared by our Board of Directors or an authorized committee of our Board of Directors.(b) Redeemable at our option on or after the date stated. With the exception of the Series B preferred stock, redeemable at our option within 90 days of a regulatory capital
treatment event as defined in the designations.(c) Cumulative preferred stock. Holders of Series B preferred stock are entitled to 8 votes per share, which is equal to the number of full shares of common stock into which the
Series B preferred stock is convertible. The Series B preferred stock was issued in connection with the consolidation of Pittsburgh National Corporation and Provident National Corporation in 1983.
(d) Non-Cumulative preferred stock.
Each outstanding series of preferred stock other than the Series B contains restrictions on our ability to pay dividends and make other shareholder payments. Subject to limited exceptions, if dividends are not paid on any such series of preferred stock, we cannot declare dividends on or repurchase shares of our common stock. In addition, if we would like to repurchase shares of preferred stock, such repurchases must be on a pro rata basis with respect to all such series of preferred stock.
The following table provides the dividends per share for PNC's common and preferred stock.
Table 84: Dividends Per Share
December 31 2019 2018 2017
Common Stock $ 4.20 $ 3.40 $ 2.60Preferred Stock Series B $ 1.80 $ 1.80 $ 1.80 Series O $ 6,750 $ 6,750 $ 6,750 Series P $ 6,125 $ 6,125 $ 6,125 Series Q $ 5,375 $ 5,375 $ 5,375 Series R $ 4,850 $ 4,850 $ 4,850 Series S $ 5,000 $ 5,000 $ 5,000
On January 2, 2020, we declared a quarterly common stock cash dividend of $1.15 per share payable on February 5, 2020.
Other Shareholders’ Equity Matters
At December 31, 2019, we had reserved approximately 83 million common shares to be issued in connection with certain stock plans.

152 The PNC Financial Services Group, Inc. – 2019 Form 10-K
On April 4, 2019, our Board of Directors approved the establishment of a new stock repurchase program authorization in the amount of 100 million shares of PNC common stock, which may be purchased on the open market or in privately negotiated transactions, effective July 1, 2019. The previous 2015 authorization was terminated as of end of day on June 30, 2019. Under these program authorizations, we repurchased 25.9 million shares in 2019 and 19.9 million shares in 2018. A maximum amount of 86.1 million shares remained available for repurchase under the new stock program authorization at December 31, 2019. This program authorization will remain in effect until fully utilized or until modified, superseded or terminated.

The PNC Financial Services Group, Inc. – 2019 Form 10-K 153
NOTE 16 OTHER COMPREHENSIVE INCOME
Details of other comprehensive income (loss) are as follows:
Table 85: Other Comprehensive Income (Loss)
In millions 2019 2018 2017
Net unrealized gains (losses) on non-OTTI securitiesIncrease in net unrealized gains (losses) on non-OTTI securities $ 1,505 $ (522) $ 29Less: Net gains (losses) realized as a yield adjustment reclassified to investment securities interest income 11 12 25Less: Net gains (losses) realized on sales of securities reclassified to noninterest income 29 (8) (12)Net increase (decrease), pre-tax 1,465 (526) 16Effect of income taxes (337) 121 (6)Net increase (decrease), after-tax 1,128 (405) 10Net unrealized gains (losses) on OTTI securitiesIncrease in net unrealized gains (losses) on OTTI securities 24 (14) 173Less: Net gains (losses) realized on sales of securities reclassified to noninterest income 2Less: OTTI losses realized on securities reclassified to noninterest income (1)Net increase (decrease), pre-tax 24 (14) 172Effect of income taxes (5) 3 (63)Net increase (decrease), after-tax 19 (11) 109Net unrealized gains (losses) on cash flow hedge derivativesIncrease in net unrealized gains (losses) on cash flow hedge derivatives 334 (118) (90)Less: Net gains (losses) realized as a yield adjustment reclassified to loan interest income 9 41 159Less: Net gains (losses) realized as a yield adjustment reclassified to investment securities interest income 9 11 21Less: Net gains (losses) realized on sales of securities reclassified to noninterest income 19 8 17Net increase (decrease), pre-tax 297 (178) (287)Effect of income taxes (68) 41 105Net increase (decrease), after-tax 229 (137) (182)Pension and other postretirement benefit plan adjustmentsNet pension and other postretirement benefit activity 146 10 126Amortization of actuarial loss (gain) reclassified to other noninterest expense 8 5 47Amortization of prior service cost (credit) reclassified to other noninterest expense 4 1 (4)Net increase (decrease), pre-tax 158 16 169Effect of income taxes (36) (4) (62)Net increase (decrease), after-tax 122 12 107OtherPNC’s portion of BlackRock’s OCI 5 (55) 52Net investment hedge derivatives (24) 76 (81)Foreign currency translation adjustments 41 (58) 90Net increase (decrease), pre-tax 22 (37) 61Effect of income taxes 4 (5) 12Net increase (decrease), after-tax 26 (42) 73Total other comprehensive income (loss), pre-tax 1,966 (739) 131Total other comprehensive income, tax effect (442) 156 (14)Total other comprehensive income (loss), after-tax $ 1,524 $ (583) $ 117

154 The PNC Financial Services Group, Inc. – 2019 Form 10-K
Table 86: Accumulated Other Comprehensive Income (Loss) Components
In millions, after-tax
Net unrealizedgains (losses) on
non-OTTIsecurities
Net unrealizedgains (losses) onOTTI securities
Net unrealizedgains (losses) oncash flow hedge
derivatives
Pension and otherpostretirement
benefit planadjustments Other Total
Balance at December 31, 2016 $ 52 $ 106 $ 333 $ (553) $ (203) $ (265)Net activity 10 109 (182) 107 73 117Balance at December 31, 2017 $ 62 $ 215 $ 151 $ (446) $ (130) $ (148)Cumulative effect of adopting ASU 2018-02 (a) 59 33 (96) 10 6Balance at January 1, 2018 121 215 184 (542) (120) (142)Net activity (405) (11) (137) 12 (42) (583)Balance at December 31, 2018 $ (284) $ 204 $ 47 $ (530) $ (162) $ (725)Net activity 1,128 19 229 122 26 1,524Balance at December 31, 2019 $ 844 $ 223 $ 276 $ (408) $ (136) $ 799
(a) Represents the cumulative impact of adopting ASU 2018-02 which permits the reclassification to retained earnings of the income tax effects stranded within AOCI. See the Recently Adopted Accounting Standards portion of Note 1 Accounting Policies in our 2018 Form 10-K for additional detail on this adoption.
NOTE 17 INCOME TAXES
The components of income tax expense are as follows:
Table 87: Components of Income Tax Expense
Year ended December 31In millions 2019 2018 2017
CurrentFederal $ 608 $ 773 $ 454State 151 176 51
Total current 759 949 505Deferred
Federal 299 123 (474)State 4 10 71
Total deferred 303 133 (403)Total $ 1,062 $ 1,082 $ 102

The PNC Financial Services Group, Inc. – 2019 Form 10-K 155
Significant components of deferred tax assets and liabilities are as follows:
Table 88: Deferred Tax Assets and Liabilities
December 31 – in millions 2019 2018Deferred tax assets
Allowance for loan and lease losses $ 661 $ 637Compensation and benefits 270 279Partnership investments 120 184Loss and credit carryforward 203 366Accrued expenses 195 207Lease obligations 545Other 161 193
Total gross deferred tax assets 2,155 1,866Valuation allowance (31) (37)
Total deferred tax assets 2,124 1,829Deferred tax liabilities
Leasing 1,703 1,169Goodwill and intangibles 194 196Fixed assets 412 379Mortgage servicing rights 99 179Net unrealized gains on securities and financial instruments 401BlackRock basis difference 1,845 1,726Other 176 119
Total deferred tax liabilities 4,830 3,768Net deferred tax liability $ 2,706 $ 1,939
A reconciliation between the statutory and effective tax rates follows:
Table 89: Reconciliation of Statutory and Effective Tax Rates
Year ended December 31 2019 2018 2017
Statutory tax rate 21.0% 21.0% 35.0%Increases (decreases) resulting from:
State taxes net of federal benefit 2.1 2.3 1.5Tax-exempt interest (1.2) (1.4) (2.5)Life insurance (.9) (.9) (1.8)Dividend received deduction (1.0) (.9) (1.8)Tax credits (3.5) (3.4) (4.2)Federal deferred tax revaluation (1.7) (21.7)Unrecognized tax benefits 1.1 (.1)Other (.1) .7 (2.5)
Effective tax rate 16.4% 16.8% 1.9%
The net operating loss carryforwards at December 31, 2019 and 2018 follow:
Table 90: Net Operating Loss Carryforwards
Dollars in millions December 31, 2019 December 31, 2018 Expiration
Net Operating Loss Carryforwards:Federal $ 402 $ 521 2032State $ 1,197 $ 1,577 2020-2039
The majority of the tax credit carryforwards expire in 2038 and were $149 million at December 31, 2019 and $323 million at December 31, 2018. Some federal and state net operating loss and credit carryforwards are from acquired entities and utilization is subject to various statutory limitations. We anticipate that we will be able to fully utilize our carryforwards for federal tax purposes, but we have recorded an insignificant valuation allowance against certain state tax carryforwards as of December 31, 2019.

156 The PNC Financial Services Group, Inc. – 2019 Form 10-K
Retained earnings included $.1 billion at both December 31, 2019 and 2018 in allocations for bad debt deductions of former thrift subsidiaries for which no income tax has been provided. Under current law, if certain subsidiaries use these bad debt reserves for purposes other than to absorb bad debt losses, they will be subject to Federal income tax at the current corporate tax rate.
A reconciliation of the beginning and ending balance of unrecognized tax benefits is as follows:
Table 91: Change in Unrecognized Tax Benefits
In millions 2019 2018 2017
Balance of gross unrecognized tax benefits at January 1 $ 207 $ 18 $ 22Increases:
Positions taken during a prior period 212 4Decreases:
Positions taken during a prior period (77) (16) (3)Settlements with taxing authorities (7) (4)Reductions resulting from lapse of statute of limitations (1)
Balance of gross unrecognized tax benefits at December 31 $ 130 $ 207 $ 18Favorable (unfavorable) impact if recognized $ 76 $ 76 $ 17
It is reasonably possible that the balance of unrecognized tax benefits could decrease in the next twelve months due to ongoing or completion of examinations by various tax authorities or the expiration of statutes of limitations.
We are subject to U.S. federal income tax as well as income tax in most states and some foreign jurisdictions. Table 92 summarizes the status of significant IRS examinations.
Table 92: IRS Tax Examination Status
Years under examination Status at December 31 Federal 2016 – 2017 Under Exam
In addition, we are under continuous examinations by various state taxing authorities. With few exceptions, we are no longer subject to state and local and foreign income tax examinations by taxing authorities for periods before 2013. For all open audits, any potential adjustments have been considered in establishing our unrecognized tax benefits as of December 31, 2019.
Our policy is to classify interest and penalties associated with income taxes as income tax expense. For 2019 and 2018, the amount of gross interest and penalties was insignificant. At December 31, 2019 and 2018, the related amounts of accrued interest and penalties were also insignificant.
NOTE 18 REGULATORY MATTERS
We are subject to the regulations of certain federal, state and foreign agencies and undergo periodic examinations by such regulatory authorities.
The ability to undertake new business initiatives (including acquisitions), the access to and cost of funding for new business initiatives, the ability to pay dividends, the ability to repurchase shares or other capital instruments, the level of deposit insurance costs, and the level and nature of regulatory oversight depend, in large part, on a financial institution’s capital strength.
At December 31, 2019 and 2018, PNC and PNC Bank, our domestic banking subsidiary, were both considered “well capitalized,” based on applicable U.S. regulatory capital ratio requirements.

The PNC Financial Services Group, Inc. – 2019 Form 10-K 157
The following table sets forth the Basel III regulatory capital ratios at December 31, 2019 and 2018, respectively for PNC and PNC Bank.
Table 93: Basel Regulatory Capital (a)
Amount Ratios
December 31Dollars in millions 2019 2018 2019 2018
“Well Capitalized”Requirements
Risk-based capitalCommon equity Tier 1
PNC $ 32,478 $ 30,905 9.5% 9.6% N/APNC Bank $ 32,215 $ 30,046 9.9% 9.8% 6.5%
Tier 1PNC $ 36,306 $ 34,735 10.7% 10.8% 6.0%PNC Bank $ 32,215 $ 30,046 9.9% 9.8% 8.0%
TotalPNC $ 43,331 $ 41,606 12.7% 13.0% 10.0%PNC Bank $ 39,074 $ 36,510 12.1% 11.9% 10.0%
LeveragePNC $ 36,306 $ 34,735 9.1% 9.4% N/APNC Bank $ 32,215 $ 30,046 8.3% 8.3% 5.0%
(a) Calculated using the regulatory capital methodology applicable to us during both 2019 and 2018.
The principal source of parent company cash flow is the dividends it receives from PNC Bank, which may be impacted by the following:
• Capital needs;• Laws and regulations;• Corporate policies;• Contractual restrictions; and• Other factors.
Also, there are statutory and regulatory limitations on the ability of national banks to pay dividends or make other capital distributions. The amount available for dividend payments to the parent company by PNC Bank without prior regulatory approval was approximately $3.1 billion at December 31, 2019.
Under federal law, a bank subsidiary generally may not extend credit to, or engage in other types of covered transactions (including the purchase of assets) with, the parent company or its non-bank subsidiaries on terms and under circumstances that are not substantially the same as comparable transactions with nonaffiliates. A bank subsidiary may not extend credit to, or engage in a covered transaction with, the parent company or a non-bank subsidiary if the aggregate amount of the bank’s extensions of credit and other covered transactions with the parent company or non-bank subsidiary exceeds 10% of the capital stock and surplus of such bank subsidiary or the aggregate amount of the bank’s extensions of credit and other covered transactions with the parent company and all non-bank subsidiaries exceeds 20% of the capital stock and surplus of such bank subsidiary. Such extensions of credit, with limited exceptions, must be at least fully collateralized in accordance with specified collateralization thresholds, with the thresholds varying based on the type of assets serving as collateral. In certain circumstances, federal regulatory authorities may impose more restrictive limitations.
Federal Reserve Board regulations require depository institutions to maintain cash reserves with a Federal Reserve Bank. At December 31, 2019, the balance outstanding at the Federal Reserve Bank was $23.2 billion.
NOTE 19 LEGAL PROCEEDINGS
We establish accruals for legal proceedings, including litigation and regulatory and governmental investigations and inquiries, when information related to the loss contingencies represented by those matters indicates both that a loss is probable and that the amount of loss can be reasonably estimated. Any such accruals are adjusted thereafter as appropriate to reflect changed circumstances. When we are able to do so, we also determine estimates of possible losses or ranges of possible losses, whether in excess of any related accrued liability or where there is no accrued liability, for disclosed legal proceedings (“Disclosed Matters,” which are those matters disclosed in this Note 19). For Disclosed Matters where we are able to estimate such possible losses or ranges of possible losses, as of December 31, 2019, we estimate that it is reasonably possible that we could incur losses in excess of related accrued liabilities, if any, in an aggregate amount less than $100 million. The estimates included in this amount are based on our analysis of currently available information and are subject to significant judgment and a variety of assumptions and uncertainties. As new information is obtained we may change our estimates. Due to the inherent subjectivity of the assessments and unpredictability of outcomes of legal proceedings, any amounts accrued or included in this aggregate amount may not represent the ultimate loss to us from the legal proceedings in

158 The PNC Financial Services Group, Inc. – 2019 Form 10-K
question. Thus, our exposure and ultimate losses may be higher, and possibly significantly so, than the amounts accrued or this aggregate amount.
In our experience, legal proceedings are inherently unpredictable. One or more of the following factors frequently contribute to this inherent unpredictability: the proceeding is in its early stages; the damages sought are unspecified, unsupported or uncertain; it is unclear whether a case brought as a class action will be allowed to proceed on that basis or, if permitted to proceed as a class action, how the class will be defined; the other party is seeking relief other than or in addition to compensatory damages (including, in the case of regulatory and governmental investigations and inquiries, the possibility of fines and penalties); the matter presents meaningful legal uncertainties, including novel issues of law; we have not engaged in meaningful settlement discussions; discovery has not started or is not complete; there are significant facts in dispute; the possible outcomes may not be amenable to the use of statistical or quantitative analytical tools; predicting possible outcomes depends on making assumptions about future decisions of courts or regulatory bodies or the behavior of other parties; and there are a large number of parties named as defendants (including where it is uncertain how damages or liability, if any, will be shared among multiple defendants). Generally, the less progress that has been made in the proceedings or the broader the range of potential results, the harder it is for us to estimate losses or ranges of losses that it is reasonably possible we could incur.
As a result of these types of factors, we are unable, at this time, to estimate the losses that are reasonably possible to be incurred or ranges of such losses with respect to some of the matters disclosed, and the aggregate estimated amount provided above does not include an estimate for every Disclosed Matter. Therefore, as the estimated aggregate amount disclosed above does not include all of the Disclosed Matters, the amount disclosed above does not represent our maximum reasonably possible loss exposure for all of the Disclosed Matters. The estimated aggregate amount also does not reflect any of our exposure to matters not so disclosed, as discussed below under “Other.”
We include in some of the descriptions of individual Disclosed Matters certain quantitative information related to the plaintiff’s claim against us as alleged in the plaintiff’s pleadings or other public filings or otherwise publicly available information. While information of this type may provide insight into the potential magnitude of a matter, it does not necessarily represent our estimate of reasonably possible loss or our judgment as to any currently appropriate accrual.
Some of our exposure in Disclosed Matters may be offset by applicable insurance coverage. We do not consider the possible availability of insurance coverage in determining the amounts of any accruals (although we record the amount of related insurance recoveries that are deemed probable up to the amount of the accrual) or in determining any estimates of possible losses or ranges of possible losses.
Interchange Litigation
Beginning in June 2005, a series of antitrust lawsuits were filed against Visa®, Mastercard®, and several major financial institutions, including cases naming National City (since merged into The PNC Financial Services Group, Inc.) and its subsidiary, National City Bank of Kentucky (since merged into National City Bank which in turn was merged into PNC Bank). The plaintiffs in these cases are merchants operating commercial businesses throughout the U.S., as well as trade associations. Some of these cases (including those naming National City entities) were brought as class actions on behalf of all persons or business entities that have accepted Visa or Mastercard. The cases have been consolidated for pre-trial proceedings in the U.S. District Court for the Eastern District of New York under the caption In re Payment Card Interchange Fee and Merchant-Discount Antitrust Litigation (Master File No. 1:05-md-1720-MKB-JO).
In July 2012, the parties entered into a memorandum of understanding with the class plaintiffs and an agreement in principle with certain individual plaintiffs with respect to a settlement of these cases, under which the defendants agreed to pay approximately $6.6 billion collectively to the class and individual settling plaintiffs and agreed to changes in the terms applicable to their respective card networks (including an eight-month reduction in default credit interchange rates). The parties entered into a definitive agreement with respect to this settlement in October 2012. The court granted final approval of the settlement in December 2013. Several objectors appealed the order of approval to the U.S. Court of Appeals for the Second Circuit, which issued an order in June 2016, reversing approval of the settlement and remanding for further proceedings. In November 2016, the plaintiffs filed a petition for a writ of certiorari with the U.S. Supreme Court to challenge the court of appeal’s decision. The Supreme Court denied the petition in March 2017.
As a result of the reversal of the approval of the settlement, the class actions have resumed in the district court. In November 2016, the district court appointed separate interim class counsel for a proposed class seeking damages and a proposed class seeking equitable (injunctive) relief. In February 2017, each of these counsel filed a proposed amended and supplemental complaint on behalf of its respective proposed class. These complaints make similar allegations, including that the defendants conspired to monopolize and to fix the prices for general purpose card network services, that the restructuring of Visa and Mastercard, each of which included an initial public offering, violated the antitrust laws, and that the defendants otherwise imposed unreasonable restraints on trade, resulting in the

The PNC Financial Services Group, Inc. – 2019 Form 10-K 159
payment of inflated interchange fees and other fees, which also violated the antitrust laws. In their complaints, collectively the plaintiffs seek, among other things, injunctive relief, unspecified damages (trebled under the antitrust laws) and attorneys’ fees. PNC is named as a defendant in the complaint seeking damages but is not named as a defendant in the complaint that seeks equitable relief.
In September 2017, the magistrate judge at the district court granted in part and denied in part the plaintiffs’ motions to file their proposed amended complaints. The dispute over amendment arose in part from the decision in United States v. American Express, Co., 838 F.3d 179 (2d Cir. 2016), in which the court held that the relevant market in a similar complaint against American Express is “two-sided,” i.e., requires consideration of effects on consumers as well as merchants. In June 2018, the U.S. Supreme Court affirmed (under the caption Ohio v. American Express Co.) the court of appeals decision. Previously, the plaintiffs in this litigation had alleged a one-sided market, and, as a result of the court’s decision in American Express, they sought leave to add claims based on a two-sided market. The order allowed the complaint to be amended to include allegations pertaining to a two-sided market only to the extent those claims are not time-barred, but held that the two-sided market allegations do not relate back to the time of the original complaint and are not subject to tolling. In October 2017, the plaintiffs appealed this order to the presiding district court judge. In August 2018, the judge overruled this decision, finding that the two-sided market allegations do relate back.
In September 2018, the relevant parties entered an amended definitive agreement to resolve the claims of the class seeking damages. In this amended settlement agreement, the parties agreed, among other things, to the following terms:
• An additional settlement payment from all defendants of $900 million, with Visa’s share of the additional settlement payment being $600 million. The additional settlement payment will be added to the approximately $5.3 billion previously paid by the defendants pursuant to the original 2012 settlement agreement.
• Up to $700 million may be returned to the defendants (with up to $467 million to Visa) if more than 15% of class members
(by payment volume) opt out of the class. As more than 15% of class members opted out of the class, $700 million has been returned to the defendants ($467 million to Visa).
This amended settlement agreement is subject to court approval. Following preliminary approval in January 2019, and after class notice, the submission of opt-outs, and the filing of objections, the district court granted final approval of the settlement in December 2019. Several objectors have appealed the district court’s order granting final approval to the U.S. Court of Appeals for the Second Circuit. Some merchants that opted out from the settlement have brought lawsuits against Visa and Mastercard and one or more of the other issuing banks. Resolution by Visa of claims by merchants that opted out of the settlement, including those that file lawsuits, have been or will be paid from the Visa litigation escrow account.
National City and National City Bank entered into judgment and loss sharing agreements with Visa and certain other banks with respect to all of the above referenced litigation. We were not originally named as defendants in any of the Visa or Mastercard related antitrust litigation nor were we initially parties to the judgment or loss sharing agreements. However, we became responsible for National City’s and National City Bank’s position in the litigation and responsibilities under the agreements through our acquisition of National City. In addition, following Visa’s reorganization in 2007 in contemplation of its initial public offering, U.S. Visa members received shares of Class B Visa common stock, convertible upon resolution of specified litigation, including the remaining litigation described above, into shares of Class A Visa common stock, with the conversion rate adjusted to reflect amounts paid or escrowed to resolve the specified litigation, and also remained responsible for indemnifying Visa against the specified litigation. Our Class B Visa common stock is all subject to this conversion adjustment provision, and we are now responsible for the indemnification obligations of our predecessors as well as ourselves. We have also entered into a Mastercard Settlement and Judgment Sharing Agreement with Mastercard and other financial institution defendants and an Omnibus Agreement Regarding Interchange Litigation Sharing and Settlement Sharing with Visa, Mastercard and other financial institution defendants. The Omnibus Agreement, in substance, apportions resolution of the claims in this litigation into a Visa portion and a Mastercard portion, with the Visa portion being two-thirds and the Mastercard portion being one-third. This apportionment only applies in the case of either a global settlement involving all defendants or an adverse judgment against the defendants, to the extent that damages either are related to the merchants’ inter-network conspiracy claims or are otherwise not attributed to specific Mastercard or Visa conduct or damages. The Mastercard portion (or any Mastercard-related liability not subject to the Omnibus Agreement) will then be apportioned under the Mastercard Settlement and Judgment Sharing Agreement among Mastercard and PNC and the other financial institution defendants that are parties to this agreement. The responsibility for the Visa portion (or any Visa-related liability not subject to the Omnibus Agreement) will be apportioned under the pre-existing indemnification responsibilities and judgment and loss sharing agreements.
Residential Mortgage-Backed Securities Indemnification Demands
We have received indemnification demands from several entities sponsoring residential mortgage-backed securities and their affiliates where purchasers of the securities, trustees for the securitization trusts, or monoline insurers have asserted claims against the sponsors and other parties involved in the securitization transactions. National City Mortgage and its predecessors had sold whole loans to the sponsors or their affiliates that were allegedly included in certain of these securitization transactions. According to the indemnification

160 The PNC Financial Services Group, Inc. – 2019 Form 10-K
demands, the claims for which indemnity is being sought are based on alleged misstatements and omissions in the offering documents for these transactions or breaches of representations and warranties relating to the loans made in connection with the transactions. The indemnification demands assert that agreements governing the sale of these loans or the securitization transactions to which National City Mortgage was a party require us to indemnify the sponsors and their affiliates for losses suffered in connection with these claims. The parties have settled several of these disputes. Several of the entities asserting a right to indemnification submitted a demand for our purported share of the settlement amount of claims asserted against it and its affiliates. There has not been any determination that the parties seeking indemnification have any liability to the plaintiffs in connection with the other claims and the amount, if any, for which we are responsible in the settled cases has not been determined.
Pre-need Funeral Arrangements
National City Bank and PNC Bank are defendants in a lawsuit filed in the U.S. District Court for the Eastern District of Missouri under the caption Jo Ann Howard and Associates, P.C., et al. v. Cassity, et al. (No. 4:09-CV-1252-ERW) arising out of trustee services provided by Allegiant Bank, a National City Bank and PNC Bank predecessor, with respect to Missouri trusts that held pre-need funeral contract assets. Under a pre-need funeral contract, a customer pays an amount up front in exchange for payment of funeral expenses following the customer’s death. In a number of states, including Missouri, pre-need funeral contract sellers are required to deposit a portion of the proceeds of the sale of pre-need funeral contracts in a trust account.
The lawsuit was filed in August 2009 by the Special Deputy Receiver for three insolvent affiliated companies, National Prearranged Services, Inc. a seller of pre-need funeral contracts (NPS), Lincoln Memorial Life Insurance Company (Lincoln), and Memorial Service Life Insurance Company (Memorial). Seven individual state life and health insurance guaranty associations, who claim they are liable under state law for payment of certain benefits under life insurance policies sold by Lincoln and Memorial, and the National Organization of Life & Health Guaranty Associations have also joined the action as plaintiffs. In addition to National City Bank and PNC Bank (added following filing of the lawsuit as successor-in-interest to National City Bank) (the PNC defendants), other defendants included members of the Cassity family, who controlled NPS, Lincoln, and Memorial; officers and directors of NPS, Lincoln, and Memorial; auditors and attorneys for NPS, Lincoln, and Memorial; the trustees of each of the trusts that held pre-need funeral contract assets; and the investment advisor to the Pre-need Trusts. NPS retained several banks to act as trustees for the trusts holding NPS pre-need funeral contract assets (the NPS Trusts), with Allegiant Bank acting as one of these trustees with respect to seven Missouri NPS Trusts. All of the other defendants have settled with the plaintiffs, are otherwise no longer a party to the lawsuit, or are insolvent.
In their Third Amended Complaint, filed in 2012 following the granting by the court in part of motions to dismiss made by the PNC defendants and the other NPS Trust trustees, the plaintiffs allege that Allegiant Bank breached its fiduciary duties and acted negligently as the trustee for the Missouri NPS Trusts. In part as a result of these breaches, the plaintiffs allege, members of the Cassity family, acting in concert with other defendants, were able to improperly remove millions of dollars from the NPS Trusts, which in turn caused NPS, Lincoln, and Memorial to become insolvent. The complaint alleges $600 million in present and future losses to the plaintiffs due to the insolvency of NPS, Lincoln, and Memorial. The lawsuit seeks, among other things, unspecified actual and punitive damages, various equitable remedies including restitution, attorneys’ fees, costs of suit and interest.
In July 2013, five of the six defendants in a parallel federal criminal action, including two members of the Cassity family, entered into plea agreements with the U.S. to resolve criminal charges arising out of their conduct at NPS, Lincoln and Memorial. In August 2013, after a jury trial, the sixth defendant, the investment advisor to the NPS Trusts, was convicted on all criminal counts against him. The criminal charges against the defendants alleged, among other thing, a scheme to defraud Allegiant Bank and the other trustees of the NPS Trusts.
In May 2014, the court granted the plaintiffs’ motion to disallow the PNC defendants’ affirmative defense relating to the plaintiffs’ alleged failure to mitigate damages. In July 2014, the PNC defendants’ motion for reconsideration was denied. In September 2014, the plaintiffs filed a motion seeking leave to amend their complaint to reassert aiding and abetting claims, previously dismissed by the court in 2012. The court denied this motion in December 2014. Also in December 2014, the court granted in part and denied in part the PNC defendants’ motion for summary judgment.
In March 2015, following a jury trial, the court entered a judgment against the PNC defendants in the amount of $356 million in compensatory damages and $36 million in punitive damages. In April 2015, the plaintiffs filed motions with the court seeking $179 million in pre-judgment interest. Also, in April 2015, the PNC defendants filed motions with the court to reduce the compensatory damages by the amounts paid in settlement by other defendants, to strike the punitive damages award, for judgment as a matter of law, and for a new trial. In November 2015, the court granted the motion to reduce the compensatory damages by amounts paid in settlement by other defendants and denied the other motions by the PNC defendants, with the judgment being reduced as a result to a total of $289 million, and also denied the plaintiffs’ motion for pre-judgment interest.

The PNC Financial Services Group, Inc. – 2019 Form 10-K 161
In December 2015, the PNC defendants appealed the judgment to the U.S. Court of Appeals for the Eighth Circuit. Also in December 2015, the plaintiffs cross-appealed from the court's orders reducing the judgment by amounts paid in settlement by other defendants, denying plaintiffs’ motion for pre-judgment interest, and dismissing the plaintiffs’ aiding and abetting claims. In August 2017, the court of appeals reversed the judgment to the extent that it was based on tort rather than trust law. The court accordingly held that any damages awarded to the plaintiff will be limited to losses to the trusts in Missouri caused by Allegiant’s breaches during the time it acted as trustee; plaintiffs cannot recover for damages to the Missouri trusts after Allegiant’s trusteeship or outside of the Missouri trusts, which had been included in the judgment under appeal. The court of appeals otherwise affirmed the judgment, including the dismissal of the aiding and abetting claims, and remanded the case to the district court for further proceedings in light of its decision. In September 2017, plaintiffs filed a motion for rehearing by the panel solely seeking to remove the prohibition on damages being sought for the period following Allegiant’s trusteeship. In December 2017, the court denied the petition for rehearing. In July 2019, following a new trial on remand from the court of appeals, the district court awarded the plaintiffs $72 million in compensatory damages, $15 million in interest, and $15 million in punitive damages. The PNC defendants have appealed this judgment to the court of appeals, and plaintiffs have cross-appealed. In December 2019, the court reduced the judgment by approximately $2.6 million to correct a mathematical error in calculating pre-judgment interest, reducing the total judgment to $99.5 million. In February 2020, the district court awarded $7 million in fees and costs to the plaintiffs.
Regulatory and Governmental Inquiries
We are the subject of investigations, audits, examinations and other forms of regulatory and governmental inquiry covering a broad range of issues in our consumer, mortgage, brokerage, securities and other financial services businesses, as well as other aspects of our operations. In some cases, these inquiries are part of reviews of specified activities at multiple industry participants; in others, they are directed at PNC individually. From time to time, these inquiries involve or lead to regulatory enforcement actions and other administrative proceedings, and may lead to civil or criminal judicial proceedings. Some of these inquiries result in remedies including fines, penalties, restitution, or alterations in our business practices, and in additional expenses and collateral costs and other consequences. Such remedies and other consequences typically have not been material to us from a financial standpoint, but could be in the future. Even if not financially material, they may result in significant reputational harm or other adverse consequences.
As has been publicly reported, the U.S. Department of Justice is conducting an inquiry relating to the federal Low Income Housing Tax Credit (LIHTC) program directed at program participants. In connection with that inquiry, the Department of Justice has requested information from PNC Bank. We are cooperating with the inquiry.
Our practice is to cooperate fully with regulatory and governmental investigations, audits and other inquiries, including that described in this Note 19.
Other
In addition to the proceedings or other matters described above, PNC and persons to whom we may have indemnification obligations, in the normal course of business, are subject to various other pending and threatened legal proceedings in which claims for monetary damages and other relief are asserted. We do not anticipate, at the present time, that the ultimate aggregate liability, if any, arising out of such other legal proceedings will have a material adverse effect on our financial position. However, we cannot now determine whether or not any claims asserted against us or others to whom we may have indemnification obligations, whether in the proceedings or other matters described above or otherwise, will have a material adverse effect on our results of operations in any future reporting period, which will depend on, among other things, the amount of the loss resulting from the claim and the amount of income otherwise reported for the reporting period.
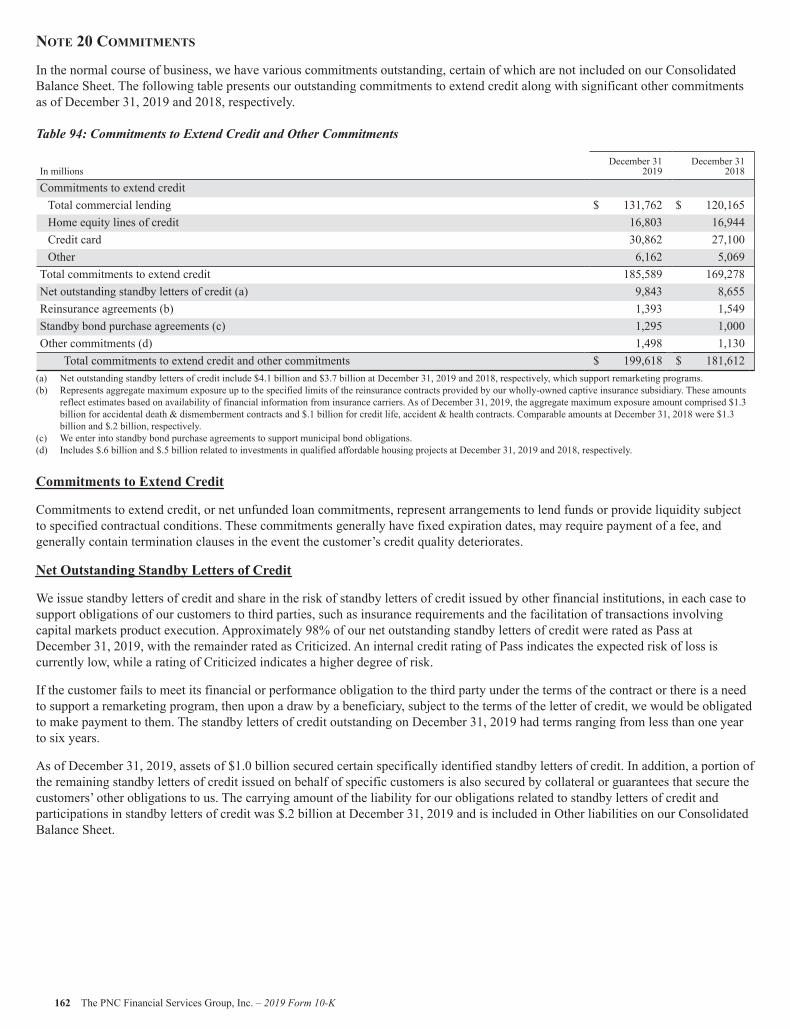
162 The PNC Financial Services Group, Inc. – 2019 Form 10-K
NOTE 20 COMMITMENTS
In the normal course of business, we have various commitments outstanding, certain of which are not included on our Consolidated Balance Sheet. The following table presents our outstanding commitments to extend credit along with significant other commitments as of December 31, 2019 and 2018, respectively.
Table 94: Commitments to Extend Credit and Other Commitments
In millionsDecember 31
2019December 31
2018
Commitments to extend creditTotal commercial lending $ 131,762 $ 120,165Home equity lines of credit 16,803 16,944Credit card 30,862 27,100Other 6,162 5,069
Total commitments to extend credit 185,589 169,278Net outstanding standby letters of credit (a) 9,843 8,655Reinsurance agreements (b) 1,393 1,549Standby bond purchase agreements (c) 1,295 1,000Other commitments (d) 1,498 1,130
Total commitments to extend credit and other commitments $ 199,618 $ 181,612(a) Net outstanding standby letters of credit include $4.1 billion and $3.7 billion at December 31, 2019 and 2018, respectively, which support remarketing programs.(b) Represents aggregate maximum exposure up to the specified limits of the reinsurance contracts provided by our wholly-owned captive insurance subsidiary. These amounts
reflect estimates based on availability of financial information from insurance carriers. As of December 31, 2019, the aggregate maximum exposure amount comprised $1.3 billion for accidental death & dismemberment contracts and $.1 billion for credit life, accident & health contracts. Comparable amounts at December 31, 2018 were $1.3 billion and $.2 billion, respectively.
(c) We enter into standby bond purchase agreements to support municipal bond obligations.(d) Includes $.6 billion and $.5 billion related to investments in qualified affordable housing projects at December 31, 2019 and 2018, respectively.
Commitments to Extend Credit
Commitments to extend credit, or net unfunded loan commitments, represent arrangements to lend funds or provide liquidity subject to specified contractual conditions. These commitments generally have fixed expiration dates, may require payment of a fee, and generally contain termination clauses in the event the customer’s credit quality deteriorates.
Net Outstanding Standby Letters of Credit
We issue standby letters of credit and share in the risk of standby letters of credit issued by other financial institutions, in each case to support obligations of our customers to third parties, such as insurance requirements and the facilitation of transactions involving capital markets product execution. Approximately 98% of our net outstanding standby letters of credit were rated as Pass at December 31, 2019, with the remainder rated as Criticized. An internal credit rating of Pass indicates the expected risk of loss is currently low, while a rating of Criticized indicates a higher degree of risk.
If the customer fails to meet its financial or performance obligation to the third party under the terms of the contract or there is a need to support a remarketing program, then upon a draw by a beneficiary, subject to the terms of the letter of credit, we would be obligated to make payment to them. The standby letters of credit outstanding on December 31, 2019 had terms ranging from less than one year to six years.
As of December 31, 2019, assets of $1.0 billion secured certain specifically identified standby letters of credit. In addition, a portion of the remaining standby letters of credit issued on behalf of specific customers is also secured by collateral or guarantees that secure the customers’ other obligations to us. The carrying amount of the liability for our obligations related to standby letters of credit and participations in standby letters of credit was $.2 billion at December 31, 2019 and is included in Other liabilities on our Consolidated Balance Sheet.

The PNC Financial Services Group, Inc. – 2019 Form 10-K 163
NOTE 21 PARENT COMPANY
Summarized financial information of the parent company is as follows:
Table 95: Parent Company – Income Statement
Year ended December 31 – in millions 2019 2018 2017
Operating RevenueDividends from:
Bank subsidiaries and bank holding company $ 4,030 $ 3,057 $ 3,278Non-bank subsidiaries 170 157 376
Interest income 169 147 109Noninterest income 48 (1) 37
Total operating revenue 4,417 3,360 3,800Operating ExpenseInterest expense 325 281 215Other expense 146 139 175
Total operating expense 471 420 390Income before income taxes and equity in undistributed net income of subsidiaries 3,946 2,940 3,410Income tax benefits (60) (54) (52)
Income before equity in undistributed net income of subsidiaries 4,006 2,994 3,462Equity in undistributed net income of subsidiaries:
Bank subsidiaries and bank holding company 1,199 2,126 1,974Non-bank subsidiaries 164 181 (98)
Net income $ 5,369 $ 5,301 $ 5,338Other comprehensive income, net of tax:Net pension and other postretirement benefit plan activity arising during the period (2) 1 1Other comprehensive income (loss) (2) 1 1Comprehensive income $ 5,367 $ 5,302 $ 5,339
Table 96: Parent Company – Balance Sheet
December 31 – in millions 2019 2018
AssetsCash held at banking subsidiary $ 6 $ 6Restricted deposits with banking subsidiary 175 175Nonrestricted interest-earning deposits 7,024 4,655
Investments in:Bank subsidiaries and bank holding company 48,654 45,863Non-bank subsidiaries 2,054 1,886
Loans with affiliates 730 1,397Other assets 1,512 1,159
Total assets $ 60,155 $ 55,141LiabilitiesSubordinated debt (a) $ 986 $ 1,652Senior debt (a) 8,849 5,061Other borrowed funds from affiliates 307 79Accrued expenses and other liabilities 699 619
Total liabilities 10,841 7,411EquityShareholders’ equity 49,314 47,730
Total liabilities and equity $ 60,155 $ 55,141(a) See Note 10 Borrowed Funds for additional information on contractual rates and maturity dates of senior debt and subordinated debt for parent company.
In connection with certain affiliates’ commercial and residential mortgage servicing operations, the parent company has committed to maintain such affiliates’ net worth above minimum requirements.

164 The PNC Financial Services Group, Inc. – 2019 Form 10-K
Table 97: Parent Company – Interest Paid and Income Tax Refunds (Payments)
Year ended December 31 – in millions Interest PaidIncome Tax Refunds/
(Payments)
2019 $ 300 $ 262018 $ 288 $ 882017 $ 287 $ 40
Table 98: Parent Company – Statement of Cash Flows
Year ended December 31 – in millions 2019 2018 2017
Operating ActivitiesNet income $ 5,369 $ 5,301 $ 5,338Adjustments to reconcile net income to net cash provided by operating activities:
Equity in undistributed net earnings of subsidiaries (1,363) (2,307) (1,974)Return on investment in subsidiary 98Other 218 155 194
Net cash provided (used) by operating activities $ 4,224 $ 3,149 $ 3,656Investing ActivitiesNet change in loans and securities from affiliates $ 664 $ 540 $ 114Net change in nonrestricted interest-earning deposits (2,369) 1,145 (1,116)Other (8) 2
Net cash provided (used) by investing activities $ (1,713) $ 1,687 $ (1,002)Financing ActivitiesNet change in other borrowed funds from affiliates $ 228 $ (29) $ 316Proceeds from long-term borrowings 4,180 498 1,325Repayments of long-term borrowings (1,300) (553) (580)Net change in commercial paper (100) 100Common and treasury stock issuances 90 69 132Acquisition of treasury stock (3,578) (2,877) (2,447)Preferred stock cash dividends paid (236) (236) (236)Common stock cash dividends paid (1,895) (1,603) (1,264)
Net cash provided (used) by financing activities $ (2,511) $ (4,831) $ (2,654)Net increase (decrease) in cash and due from banks $ — $ 5 $ —Cash and restricted deposits held at banking subsidiary at beginning of year 181 176 176
Cash and restricted deposits held at banking subsidiary at end of year $ 181 $ 181 $ 176
NOTE 22 SEGMENT REPORTING
We have four reportable business segments:• Retail Banking• Corporate & Institutional Banking• Asset Management Group• BlackRock
Results of individual businesses are presented based on our internal management reporting practices. There is no comprehensive, authoritative body of guidance for management accounting equivalent to GAAP; therefore, the financial results of our individual businesses are not necessarily comparable with similar information for any other company. We periodically refine our internal methodologies as management reporting practices are enhanced. To the extent significant and practicable, retrospective application of new methodologies is made to prior period reportable business segment results and disclosures to create comparability with the current period.
Total business segment financial results differ from total consolidated net income. These differences are reflected in the “Other” category in the business segment tables. “Other” includes residual activities that do not meet the criteria for disclosure as a separate reportable business, such as asset and liability management activities including net securities gains or losses, other-than-temporary impairment of investment securities, certain trading activities, certain runoff consumer loan portfolios, private equity investments, intercompany eliminations, certain corporate overhead, tax adjustments that are not allocated to business segments, gains or losses related to BlackRock transactions, exited businesses, and differences between business segment performance reporting and financial

The PNC Financial Services Group, Inc. – 2019 Form 10-K 165
statement reporting (GAAP), including the presentation of net income attributable to noncontrolling interests as the segments’ results exclude their portion of net income attributable to noncontrolling interests. Assets, revenue and earnings attributable to foreign activities were not material in the periods presented for comparative purposes.
Financial results are presented, to the extent practicable, as if each business operated on a stand-alone basis. Additionally, we have aggregated the results for corporate support functions within “Other” for financial reporting purposes.
Net interest income in business segment results reflects our internal funds transfer pricing methodology. Assets receive a funding charge and liabilities and capital receive a funding credit based on a transfer pricing methodology that incorporates product repricing characteristics, tenor and other factors.
We have allocated the allowances for loan and lease losses and for unfunded loan commitments and letters of credit based on the loan exposures within each business segment’s portfolio. Key reserve assumptions and estimation processes react to and are influenced by observed changes in loan portfolio performance experience, the financial strength of the borrower and economic conditions. Key reserve assumptions are periodically updated.
Business Segment Products and Services
Retail Banking provides deposit, lending, brokerage, insurance services, investment management and cash management products and services to consumer and small business customers. Our customers are serviced through our branch network, ATMs, call centers, online banking and mobile channels. The branch network is located primarily in markets across the Mid-Atlantic, Midwest and Southeast. In 2018, Retail Banking launched its national expansion strategy designed to grow customers with digitally-led banking and an ultra-thin branch network in markets outside of our existing retail branch network. Deposit products include checking, savings and money market accounts and certificates of deposit. Lending products include residential mortgages, home equity loans and lines of credit, auto loans, credit cards, education loans and personal and small business loans and lines of credit. The residential mortgage loans are directly originated within our branch network and nationwide, and are typically underwritten to agency and/or third-party standards, and either sold, servicing retained, or held on our balance sheet. Brokerage, investment management and cash management products and services include managed, education, retirement and trust accounts.
Corporate & Institutional Banking provides lending, treasury management, and capital markets-related products and services to mid-sized and large corporations, and government and not-for-profit entities. Lending products include secured and unsecured loans, letters of credit and equipment leases. The Treasury Management business provides payables, receivables, deposit and account services, liquidity and investments, and online and mobile banking products and services to our clients. Capital markets-related products and services include foreign exchange, derivatives, securities underwriting, loan syndications, mergers and acquisitions advisory and equity capital markets advisory related services. We also provide commercial loan servicing and technology solutions for the commercial real estate finance industry. Products and services are provided nationally.
Asset Management Group provides personal wealth management for high net worth and ultra high net worth clients and institutional asset management. The Asset Management group is composed of three distinct operating units:
• Wealth Management provides products and services to individuals and their families including investment and retirement planning, customized investment management, private banking, and trust management and administration for individuals and their families.
• Our Hawthorn unit provides multi-generational family planning including estate, financial, tax planning, fiduciary, investment management and consulting, private banking, personal administrative services, asset custody and customized performance reporting to ultra high net worth clients.
• Institutional asset management provides outsourced chief investment officer, custody, private real estate, cash and fixed income client solutions, and fiduciary retirement advisory services to institutional clients including corporations, healthcare systems, insurance companies, unions, municipalities and non-profits.

166 The PNC Financial Services Group, Inc. – 2019 Form 10-K
BlackRock, in which we hold an equity investment, is a leading publicly-traded investment management firm providing a broad range of investment and technology services to institutional and retail clients worldwide. Using a diverse platform of alpha-seeking active, index and cash management investment strategies across asset classes, BlackRock tailors investment outcomes and asset allocation solutions for clients. Product offerings include single- and multi-asset class portfolios investing in equities, fixed income, alternatives and money market instruments. BlackRock also offers technology services, including an investment and risk management technology platform, as well as advisory services and solutions to a broad base of institutional and wealth management clients.
Our equity investment in BlackRock provides us with an additional source of noninterest income and increases our overall revenue diversification. BlackRock is a publicly-traded company, and additional information regarding its business is available in its filings with the Securities and Exchange Commission (SEC). At December 31, 2019, our economic interest in BlackRock was 22%. We received cash dividends from BlackRock of $459 million, $420 million, and $354 million during 2019, 2018 and 2017, respectively.
Table 99: Results of Businesses
Year ended December 31In millions
RetailBanking
Corporate &Institutional
Banking
AssetManagement
Group BlackRock Other Consolidated (a)
2019Income StatementNet interest income $ 5,520 $ 3,637 $ 288 $ 520 $ 9,965Noninterest income 2,648 2,537 991 $ 999 687 7,862
Total revenue 8,168 6,174 1,279 999 1,207 17,827Provision for credit losses (benefit) 517 284 (1) (27) 773Depreciation and amortization 230 198 62 545 1,035Other noninterest expense 5,831 2,615 877 216 9,539Income (loss) before income taxes (benefit) and noncontrolling interests 1,590 3,077 341 999 473 6,480Income taxes (benefit) 377 629 79 161 (184) 1,062Net income $ 1,213 $ 2,448 $ 262 $ 838 $ 657 $ 5,418Average Assets (b) $ 92,959 $ 164,243 $ 7,360 $ 8,558 $ 127,215 $ 400,3352018Income StatementNet interest income $ 5,119 $ 3,551 $ 287 $ 764 $ 9,721Noninterest income 2,631 2,406 892 $ 935 547 7,411
Total revenue 7,750 5,957 1,179 935 1,311 17,132Provision for credit losses (benefit) 373 85 2 (52) 408Depreciation and amortization 206 186 52 496 940Other noninterest expense 5,772 2,520 861 203 9,356Income (loss) before income taxes (benefit) and noncontrolling interests 1,399 3,166 264 935 664 6,428Income taxes (benefit) 335 658 62 154 (127) 1,082Net income $ 1,064 $ 2,508 $ 202 $ 781 $ 791 $ 5,346Average Assets (b) $ 89,739 $ 154,119 $ 7,423 $ 8,061 $ 118,893 $ 378,2352017Income StatementNet interest income $ 4,625 $ 3,396 $ 287 $ 800 $ 9,108Noninterest income 2,236 2,271 881 $ 1,078 755 7,221
Total revenue 6,861 5,667 1,168 1,078 1,555 16,329Provision for credit losses (benefit) 347 160 1 (67) 441Depreciation and amortization 177 184 50 510 921Other noninterest expense 5,569 2,370 855 683 9,477Income (loss) before income taxes (benefit) and noncontrolling interests 768 2,953 262 1,078 429 5,490Income taxes (benefit) 321 520 75 (686) (128) 102Net income $ 447 $ 2,433 $ 187 $ 1,764 $ 557 $ 5,388Average Assets (b) $ 88,663 $ 148,414 $ 7,511 $ 7,677 $ 119,504 $ 371,769
(a) There were no material intersegment revenues for 2019, 2018 and 2017.(b) Period-end balances for BlackRock.

The PNC Financial Services Group, Inc. – 2019 Form 10-K 167
NOTE 23 FEE-BASED REVENUE FROM CONTRACTS WITH CUSTOMERS
A subset of our noninterest income relates to certain fee-based revenue within the scope of ASC Topic 606 - Revenue from Contracts with Customers (Topic 606). The objective of the standard is to clarify the principles for recognizing revenue from contracts with customers across all industries and to develop a common revenue standard under GAAP. The standard requires the application of a five-step recognition model to contracts, allocating the amount of consideration we expect to be entitled to across distinct promises in the contract, called performance obligations, and recognizing revenue when or as those services are transferred to the customer.
Fee-based revenue within the scope of Topic 606 is recognized within three of our reportable business segments, Retail Banking, Corporate & Institutional Banking and Asset Management Group. Income recognized from our investment in BlackRock, also a reportable segment, is outside of the scope of the standard. Topic 606 also excludes interest income, income from lease contracts, fair value gains from financial instruments (including derivatives), income from mortgage servicing rights and guarantee products, letter of credit fees, non-refundable fees associated with acquiring or originating a loan and gains from the sale of financial assets.
The following tables present noninterest income within the scope of Topic 606 disaggregated by segment. A description of the fee-based revenue and how it is recognized for each segment’s principal services and products follows each table.
Retail Banking
Table 100: Retail Banking Noninterest Income Disaggregation
Year ended December 31In millions 2019 2018
Product Deposit account fees $ 642 $ 618 Debit card fees 535 505 Brokerage fees 356 350 Merchant services 216 212 Net credit card fees (a) 186 189 Other 255 284
Total in-scope noninterest income by product $ 2,190 $ 2,158Reconciliation to total Retail Banking noninterest incomeTotal in-scope noninterest income $ 2,190 $ 2,158Total out-of-scope noninterest income (b) 458 473
Total Retail Banking noninterest income $ 2,648 $ 2,631(a) Net credit card fees consists of interchange fees of $498 million and $452 million and credit card reward costs of $312 million and $263 million for the years ended
December 31, 2019 and 2018, respectively.(b) Out-of-scope noninterest income includes revenue streams that fall under the scope of other accounting and disclosure requirements outside of Topic 606.
Deposit Account FeesRetail Banking provides demand deposit, money market and savings account products for consumer and small business customers. Services include online and branch banking, overdraft and wire transfer services, imaging services and cash alternative services, such as money orders and cashier's checks. We recognize fee income at the time these services are performed for the customer.
Debit Card and Net Credit Card FeesAs an issuing bank, Retail Banking earns interchange fee revenue from debit and credit card transactions. By offering card products, we maintain and administer card-related services, such as credit card reward programs, account data and statement information, card activation, card renewals, and card suspension and blockage. Interchange fees are earned when cardholders make purchases and are presented in Table 100 net of credit card reward costs.
Brokerage FeesRetail Banking earns fee revenue by providing its customers a wide range of investment options through its brokerage services including mutual funds, annuities, stocks, bonds, long-term care and insurance products, and managed accounts. We earn fee revenue for transaction-based brokerage services, such as the execution of market trades, once the transaction has been completed as of the trade date. In other cases, such as investment management services, we earn fee revenue over the term of the customer contract.
Merchant ServicesRetail Banking earns fee revenue for debit and credit card processing services. We provide these services to merchant businesses including point-of-sale payment acceptance capabilities and customized payment processing built around the merchant’s specific requirements. We earn fee revenue as the merchant's customers make purchases.

168 The PNC Financial Services Group, Inc. – 2019 Form 10-K
Other Other noninterest income primarily includes ATM fees earned from our customers and non-PNC customers. These fees are recognized as transactions occur.
Corporate & Institutional Banking
Table 101: Corporate & Institutional Banking Noninterest Income Disaggregation
Year ended December 31In millions 2019 2018
Product Treasury management fees $ 840 $ 776 Capital markets fees 547 510 Commercial mortgage banking activities 102 87 Other 77 81
Total in-scope noninterest income by product $ 1,566 $ 1,454Reconciliation to total Corporate & Institutional Banking noninterest incomeTotal in-scope noninterest income $ 1,566 $ 1,454Total out-of-scope noninterest income (a) 971 952
Total Corporate & Institutional Banking noninterest income $ 2,537 $ 2,406(a) Out-of-scope noninterest income includes revenue streams that fall under the scope of other accounting and disclosure requirements outside of Topic 606.
Treasury Management FeesCorporate & Institutional Banking provides corporations with cash and investment management services, receivables and disbursement management services, funds transfer services and access to online/mobile information management and reporting services. Treasury management fees are recognized over time as we perform these services.
Capital Markets FeesCapital markets fees include securities underwriting fees, merger and acquisition advisory fees and other advisory related fees. We recognize these fees when the related transaction closes.
Commercial Mortgage Banking ActivitiesCommercial mortgage banking activities include servicing responsibilities where we do not own the servicing rights. Servicing responsibilities typically consist of collecting and remitting monthly borrower principal and interest payments, maintaining escrow deposits, performing loss mitigation and foreclosure activities, and, in certain instances, funding of servicing advances. We recognize servicing fees over time as we perform these activities.
Other Other noninterest income within Corporate & Institutional Banking primarily comprised fees from collateral management and asset management services. We earn these fees over time as we perform these services.
Asset Management Group
Table 102: Asset Management Group Noninterest Income Disaggregation
Year ended December 31In millions 2019 2018
Customer Type Personal $ 620 $ 611 Institutional 242 272
Total in-scope noninterest income by customer type $ 862 $ 883Reconciliation to Asset Management Group noninterest incomeTotal in-scope noninterest income $ 862 $ 883Total out-of-scope noninterest income (a) 129 9
Total Asset Management Group noninterest income $ 991 $ 892(a) Out-of-scope noninterest income includes revenue streams that fall under the scope of other accounting and disclosure requirements outside of Topic 606.
Asset Management ServicesAsset Management Group provides both personal wealth and institutional asset management services including investment management, custody services, retirement planning, family planning, trust management and retirement administration services. We recognize fee revenue over the term of the customer contract based on the value of assets under management at a point in time.

The PNC Financial Services Group, Inc. – 2019 Form 10-K 169
NOTE 24 LEASES
PNC enters into both lessor and lessee arrangements. On January 1, 2019, we adopted ASU 2016-02 - Leases, which required lessees to recognize on the balance sheet all leases with lease terms greater than twelve months as a lease liability with a corresponding right-of-use asset. For more information on lease accounting and the impact of adoption, see Note 1 Accounting Policies and for additional details on our equipment lease financing receivables see Note 3 Asset Quality.
Lessor Arrangements
PNC's lessor arrangements primarily consist of operating, sales-type and direct financing leases for equipment. Lease agreements may include options to renew and for the lessee to purchase the leased equipment at the end of the lease term. For 2019, lease income was $412 million, consisting of $295 million from sales-type and direct financing leases and $117 million from operating leases and was included in Loan interest income and Corporate services, respectively, on our Consolidated Income Statement.
The following table provides the components of our equipment lease financing assets:
Table 103: Sales-Type and Direct Financing Leases
In millions December 31, 2019
Lease receivables (a) $ 7,353Unguaranteed residual asset values 741Unearned income (939)Equipment lease financing $ 7,155
(a) In certain cases, PNC obtains third-party residual value insurance to reduce its residual risk. The carrying value of residual assets with third-party residual value insurance for at least a portion of the asset value was $.3 billion.
In addition, we had $1.1 billion in operating lease assets, which includes the residual asset values, at December 31, 2019, with accumulated depreciation of $.3 billion. Depreciation expense for the lease assets was not material for the year ended December 31, 2019. We had no lease transactions with related parties or deferred selling profits at December 31, 2019.
The future minimum lease payments based on maturity of our lessor arrangements at December 31, 2019 were as follows:
Table 104: Future Minimum Lease Payments of Lessor Arrangements
In millions Operating Leases Sales-type and Direct Financing Leases2020 $ 159 $ 1,6202021 159 1,4322022 112 1,1612023 136 8012024 128 6682025 and thereafter 192 1,671Total future minimum lease payments $ 886 $ 7,353
Lessee Arrangements
We lease retail branches, datacenters, office space, land and equipment under operating and finance leases. Our leases have remaining lease terms of one year to 61 years, some of which may include options to renew the leases for up to 99 years, and some of which may include options to terminate the leases prior to the end date. Certain leases also include options to purchase the leased asset. The exercise of lease renewal, termination and purchase options is at our sole discretion.
At adoption of ASU 2016-02 on January 1, 2019, we elected to account for the lease and nonlease components of existing real estate leases and leases of advertising assets, such as signage, as a single lease component. Effective January 1, 2019, lease and nonlease components of new lease agreements are accounted for separately. Lease components include fixed payments including rent, real estate taxes and insurance costs and nonlease components include common-area maintenance costs. Generally, we have elected to use the Overnight Indexed Swap rate corresponding to the term of the lease at the lease measurement date as our incremental borrowing rate to measure the right of-use-asset and lease liability. Leases with an initial term of 12 months or less are not recorded on the balance sheet; we recognize lease expense for these leases on a straight-line basis over the lease term.

170 The PNC Financial Services Group, Inc. – 2019 Form 10-K
Certain of our lease agreements include rental payments based on a percentage of revenue and others include rental payments if certain bank deposit levels are met. Our lease agreements do not contain any material residual value guarantees or material restrictive covenants. Subleases to third parties were not material at December 31, 2019.
For 2019, total operating lease cost was $360 million and was included in Occupancy expense on our Consolidated Income Statement. Operating cash flows from operating leases for 2019 were $353 million. Operating lease assets and liabilities totaled $2.0 billion and $2.2 billion at December 31, 2019, respectively. Operating lease assets are reported in Other assets on the Consolidated Balance Sheet, and the related lease liabilities are reported in Accrued expenses and other liabilities. Finance lease assets and liabilities, income and cash flows at December 31, 2019 were not material.
Operating lease term and discount rates of our lessee arrangements at December 31, 2019 were as follows:
Table 105: Operating Lease Term and Discount Rates of Lessee Arrangements
December 31, 2019
Weighted-average remaining lease term (years) 9Weighted-average discount rate 2.42%
Future undiscounted cash flows on our lessee arrangements at December 31, 2019 are as follows:
Table 106: Future Lease Payments of Operating Lease Liabilities
In millions December 31, 20192020 $ 3552021 3392022 3072023 2752024 2262025 and thereafter 923Total future lease payments $ 2,425Less: Interest 255Present value of operating lease liabilities $ 2,170
At December 31, 2018, prior to the adoption of ASU 2016-02, operating lease commitments under lessee arrangements were $374 million, $346 million, $308 million, $258 million, $228 million for 2019 through 2023, respectively, and $941 million in the aggregate for all years thereafter.
NOTE 25 SUBSEQUENT EVENTS
On January 22, 2020, the parent company issued $2.0 billion of senior notes with a maturity date of January 22, 2030. Interest is payable semi-annually at a fixed rate of 2.55% per annum, on January 22 and July 22 of each year, beginning on July 22, 2020.
On February 25, 2020, PNC Bank issued the following:• $1.0 billion of senior floating rate notes with a maturity date of February 24, 2023. Interest is payable quarterly at the 3-
month LIBOR rate, reset quarterly, plus 32.5 basis points, on February 24, May 24, August 24, and November 24, beginning on May 24, 2020.
• $500 million of senior fixed-to-floating rate notes with a maturity date of February 24, 2023. Interest is payable semi-annually at a fixed rate of 1.74% per annum, on February 24 and August 24 of each year, beginning on August 24, 2020. Beginning on February 24, 2022, interest is payable quarterly at the floating rate equal to the 3-month LIBOR rate, reset quarterly, plus 32.3 basis points, on February 24, May 24, August 24, and November 24, commencing on May 24, 2022.

The PNC Financial Services Group, Inc. – 2019 Form 10-K 171
STATISTICAL INFORMATION (UNAUDITED)
THE PNC FINANCIAL SERVICES GROUP, INC.
SELECTED QUARTERLY FINANCIAL DATA
Dollars in millions, except per share data
2019 2018
Fourth Third Second First Fourth Third Second First
Summary of OperationsInterest income $ 3,334 $ 3,503 $ 3,497 $ 3,428 $ 3,359 $ 3,223 $ 3,082 $ 2,918Interest expense 846 999 999 953 878 757 669 557Net interest income 2,488 2,504 2,498 2,475 2,481 2,466 2,413 2,361Noninterest income 2,121 1,989 1,941 1,811 1,859 1,891 1,911 1,750Total revenue 4,609 4,493 4,439 4,286 4,340 4,357 4,324 4,111Provision for credit losses 221 183 180 189 148 88 80 92Noninterest expense 2,762 2,623 2,611 2,578 2,577 2,608 2,584 2,527Income before income taxes (benefit) and noncontrolling interests 1,626 1,687 1,648 1,519 1,615 1,661 1,660 1,492Income taxes (benefit) 245 295 274 248 264 261 304 253Net income 1,381 1,392 1,374 1,271 1,351 1,400 1,356 1,239Less: Net income attributable to noncontrolling interests 14 13 12 10 14 11 10 10
Preferred stock dividends and discount accretion and redemptions 56 64 56 64 56 64 56 64
Net income attributable to common shareholders $ 1,311 $ 1,315 $ 1,306 $ 1,197 $ 1,281 $ 1,325 $ 1,290 $ 1,165Per Common ShareBook value $104.59 $103.37 $101.53 $ 98.47 $ 95.72 $ 93.22 $ 92.26 $ 91.39Cash dividends declared (a) $ 1.15 $ 1.15 $ .95 $ .95 $ .95 $ .95 $ .75 $ .75Basic earnings from net income $ 2.98 $ 2.95 $ 2.89 $ 2.62 $ 2.77 $ 2.84 $ 2.74 $ 2.45Diluted earnings from net income $ 2.97 $ 2.94 $ 2.88 $ 2.61 $ 2.75 $ 2.82 $ 2.72 $ 2.43
(a) On January 2, 2020, we declared a quarterly common stock cash dividend of $1.15 per share payable on February 5, 2020.

172 The PNC Financial Services Group, Inc. – 2019 Form 10-K
AVERAGE CONSOLIDATED BALANCE SHEET AND NET INTEREST ANALYSIS (a) (b) (c)
2019 2018 2017
Taxable-equivalent basisDollars in millions
AverageBalances
InterestIncome/Expense
AverageYields/
RatesAverage
BalancesInterest
Income/Expense
AverageYields/
RatesAverage
BalancesInterest
Income/Expense
AverageYields/
RatesAssetsInterest-earning assets:Investment securities
Securities available for saleResidential mortgage-backed
Agency $ 31,526 $ 867 2.75% $ 27,156 $ 740 2.72% $ 25,766 $ 662 2.57%Non-agency 1,746 141 8.08% 2,196 146 6.65% 2,851 153 5.37%
Commercial mortgage-backed 5,676 162 2.85% 4,545 128 2.82% 5,193 156 3.00%Asset-backed 5,199 172 3.31% 5,242 165 3.15% 5,681 147 2.59%U.S. Treasury and government agencies 17,642 435 2.47% 16,319 373 2.29% 13,178 235 1.78%Other 3,200 107 3.34% 4,064 142 3.49% 5,083 158 3.11%
Total securities available for sale 64,989 1,884 2.90% 59,522 1,694 2.85% 57,752 1,511 2.62%Securities held to maturity
Residential mortgage-backed 15,421 438 2.84% 15,670 456 2.91% 13,049 364 2.79%Commercial mortgage-backed 553 21 3.80% 767 29 3.78% 1,255 51 4.06%Asset-backed 120 5 4.17% 192 7 3.65% 405 10 2.47%U.S. Treasury and government agencies 767 22 2.87% 749 21 2.80% 591 18 3.05%Other 1,816 80 4.41% 1,884 82 4.35% 2,005 105 5.24%
Total securities held to maturity 18,677 566 3.03% 19,262 595 3.09% 17,305 548 3.17%Total investment securities 83,666 2,450 2.93% 78,784 2,289 2.91% 75,057 2,059 2.74%
LoansCommercial 123,524 5,157 4.17% 113,837 4,606 4.05% 107,752 3,778 3.51%Commercial real estate 28,526 1,235 4.33% 28,756 1,193 4.15% 29,487 1,054 3.57%Equipment lease financing 7,255 285 3.93% 7,437 267 3.59% 7,618 248 3.26%Consumer 55,671 3,083 5.54% 55,438 2,817 5.08% 56,262 2,585 4.59%Residential real estate 20,040 844 4.21% 17,810 784 4.40% 16,152 725 4.49%
Total loans 235,016 10,604 4.51% 223,278 9,667 4.33% 217,271 8,390 3.86%Interest-earning deposits with banks 16,878 353 2.09% 20,603 379 1.84% 24,043 267 1.11%Other interest-earning assets 12,425 458 3.69% 8,093 362 4.47% 8,983 313 3.48%
Total interest-earning assets/interest income 347,985 13,865 3.98% 330,758 12,697 3.84% 325,354 11,029 3.39%Noninterest-earning assets 52,350 47,477 46,415
Total assets $400,335 $378,235 $371,769Liabilities and EquityInterest-bearing liabilities:Interest-bearing deposits
Money market $ 55,505 609 1.10% $ 56,353 416 .74% $ 62,331 217 .35%Demand 65,729 354 .54% 60,599 190 .31% 57,045 76 .13%Savings 62,938 696 1.11% 51,908 428 .82% 42,749 197 .46%Time deposits 20,416 327 1.60% 17,501 195 1.11% 17,322 133 .77%
Total interest-bearing deposits 204,588 1,986 .97% 186,361 1,229 .66% 179,447 623 .35%Borrowed funds
Federal Home Loan Bank borrowings 22,253 569 2.56% 20,970 478 2.28% 19,890 261 1.31%Bank notes and senior debt 26,781 869 3.24% 27,855 818 2.94% 25,564 517 2.02%Subordinated debt 5,588 214 3.83% 5,292 224 4.23% 6,273 222 3.54%Other 6,906 159 2.30% 5,189 112 2.16% 5,162 83 1.61%
Total borrowed funds 61,528 1,811 2.94% 59,306 1,632 2.75% 56,889 1,083 1.90%Total interest-bearing liabilities/interest expense 266,116 3,797 1.43% 245,667 2,861 1.16% 236,336 1,706 .72%
Noninterest-bearing liabilities and equity:Noninterest-bearing deposits 72,212 76,303 78,634Accrued expenses and other liabilities 13,371 9,440 10,518Equity 48,636 46,825 46,281
Total liabilities and equity $400,335 $378,235 $371,769Interest rate spread 2.55% 2.68% 2.67%
Benefit from use of noninterest bearing sources .34 .29 .20Net interest income/margin $ 10,068 2.89% $ 9,836 2.97% $ 9,323 2.87%
(a) Nonaccrual loans are included in loans, net of unearned income. The impact of financial derivatives used in interest rate risk management is included in the interest income/expense and average yields/rates of the related assets and liabilities. Basis adjustments related to hedged items are included in noninterest-earning assets and noninterest-bearing liabilities. Average balances of securities are based on amortized historical cost (excluding adjustments to fair value, which are included in other assets). Average balances for certain loans and borrowed funds accounted for at fair value are included in noninterest-earning assets and noninterest-bearing liabilities, with changes in fair value recorded in Noninterest income.
(b) Loan fees for the years ended December 31, 2019, 2018 and 2017 were $163 million, $139 million and $126 million, respectively.(c) Interest income calculated as taxable-equivalent interest income. To provide more meaningful comparisons of interest income and yields for all interest-earning assets, as
well as net interest margins, we use interest income on a taxable-equivalent basis in calculating average yields and net interest margin by increasing the interest income earned on tax-exempt assets to make it fully equivalent to interest income earned on taxable investments. This adjustment is not permitted under GAAP. See Reconciliation of Taxable-Equivalent Net Interest Income in this Statistical Information section for more information.

The PNC Financial Services Group, Inc. – 2019 Form 10-K 173
ANALYSIS OF YEAR-TO-YEAR CHANGES IN NET INTEREST INCOME (a) (b)
2019/2018 2018/2017
Taxable-equivalent basisIncrease/(Decrease) in Income/
Expense Due to Changes in:Increase/(Decrease) in Income/
Expense Due to Changes in:In millions Volume Rate Total Volume Rate TotalInterest-Earning AssetsInvestment securities
Securities available for saleResidential mortgage-backed
Agency $ 119 $ 8 $ 127 $ 37 $ 41 $ 78Non-agency $ (33) $ 28 (5) $ (39) $ 32 (7)
Commercial mortgage-backed $ 32 $ 2 34 $ (18) $ (10) (28)Asset-backed $ (1) $ 8 7 $ (12) $ 30 18U.S. Treasury and government agencies $ 32 $ 30 62 $ 63 $ 75 138Other $ (29) $ (6) (35) $ (34) $ 18 (16)
Total securities available for sale $ 160 $ 30 190 $ 48 $ 135 183Securities held to maturity
Residential mortgage-backed $ (7) $ (12) (19) $ 75 $ 17 92Commercial mortgage-backed $ (8) (8) $ (18) $ (4) (22)Asset-backed $ (3) $ 1 (2) $ (7) $ 4 (3)U.S. Treasury and government agencies $ 1 $ 1 2 $ 4 $ (1) 3Other $ (3) $ 1 (2) $ (6) $ (17) (23)
Total securities held to maturity $ (18) $ (11) (29) $ 61 $ (14) 47Total investment securities $ 147 $ 14 161 $ 104 $ 126 230
LoansCommercial $ 404 $ 147 551 $ 224 $ 604 828Commercial real estate $ (10) $ 52 42 $ (27) $ 166 139Equipment lease financing $ (7) $ 25 18 $ (6) $ 25 19Consumer $ 12 $ 254 266 $ (39) $ 271 232Residential real estate $ 95 $ (35) 60 $ 73 $ (14) 59
Total loans $ 521 $ 416 937 $ 237 $ 1,040 1,277Interest-earning deposits with banks $ (74) $ 48 (26) $ (42) $ 154 112Other interest-earning assets $ 168 $ (72) 96 $ (33) $ 82 49
Total interest-earning assets $ 687 $ 481 $ 1,168 $ 185 $ 1,483 $ 1,668Interest-Bearing Liabilities
Interest-bearing depositsMoney market $ (6) $ 199 $ 193 $ (23) $ 222 $ 199Demand $ 17 $ 147 164 $ 5 $ 109 114Savings $ 101 $ 167 268 $ 49 $ 182 231Time deposits $ 36 $ 96 132 $ 1 $ 61 62
Total interest-bearing deposits $ 130 $ 627 757 $ 25 $ 581 606Borrowed funds
Federal Home Loan Bank borrowings $ 30 $ 61 91 $ 15 $ 202 217Bank notes and senior debt $ (33) $ 84 51 $ 49 $ 252 301Subordinated debt $ 12 $ (22) (10) $ (38) $ 40 2Other 40 $ 7 47 $ 29 29
Total borrowed funds $ 62 $ 117 179 $ 48 $ 501 549Total interest-bearing liabilities $ 246 $ 690 936 $ 70 $ 1,085 1,155
Change in net interest income $ 502 $ (270) $ 232 $ 166 $ 347 $ 513(a) Changes attributable to rate/volume are prorated into rate and volume components.(b) Interest income calculated as taxable-equivalent interest income. To provide more meaningful comparisons of interest income, we use interest income on a taxable-equivalent
basis by increasing the interest income earned on tax-exempt assets to make it fully equivalent to interest income earned on taxable investments. This adjustment is not permitted under GAAP. See Reconciliation of Taxable-Equivalent Net Interest Income in this Statistical Information section for more information.

174 The PNC Financial Services Group, Inc. – 2019 Form 10-K
RECONCILIATION OF TAXABLE-EQUIVALENT NET INTEREST INCOME (NON-GAAP) (a)
Year ended December 31In millions 2019 2018 2017 2016 2015
Net interest income (GAAP) $ 9,965 $ 9,721 $ 9,108 $ 8,391 $ 8,278Taxable-equivalent adjustments 103 115 215 195 196Net interest income (Non-GAAP) $ 10,068 $ 9,836 $ 9,323 $ 8,586 $ 8,474
(a) The interest income earned on certain earning assets is completely or partially exempt from federal income tax. As such, these tax-exempt instruments typically yield lower returns than taxable investments. To provide more meaningful comparisons of net interest income, we use interest income on a taxable-equivalent basis by increasing the interest income earned on tax-exempt assets to make it fully equivalent to interest income earned on taxable investments. This adjustment is not permitted under GAAP.
RECONCILIATION OF FEE INCOME (NON-GAAP)Year ended December 31In millions 2019 2018 2017
Noninterest incomeAsset management $ 1,850 $ 1,825 $ 1,942Consumer services 1,555 1,502 1,415Corporate services 1,914 1,849 1,742Residential mortgage 368 316 350Service charges on deposits 702 714 695
Total fee income 6,389 6,206 6,144Other 1,473 1,205 1,077
Total noninterest income $ 7,862 $ 7,411 $ 7,221
RECONCILIATION OF TANGIBLE BOOK VALUE PER COMMON SHARE (NON-GAAP)December 31Dollars in millions, except per share data 2019 2018 2017 2016 2015
Book value per common share $ 104.59 $ 95.72 $ 91.94 $ 85.94 $ 81.84Tangible book value per common share
Common shareholders’ equity $ 45,321 $ 43,742 $ 43,530 $ 41,723 $ 41,258Goodwill and other intangible assets (9,441) (9,467) (9,498) (9,376) (9,482)Deferred tax liabilities on Goodwill and other intangible assets 187 190 191 304 310 Tangible common shareholders’ equity $ 36,067 $ 34,465 $ 34,223 $ 32,651 $ 32,086
Period-end common shares outstanding (in millions) 433 457 473 485 504Tangible book value per common share (Non-GAAP) (a) $ 83.30 $ 75.42 $ 72.28 $ 67.26 $ 63.65
(a) We believe this non-GAAP financial measure serves as a useful tool to help evaluate the strength and discipline of a company’s capital management strategies and as an additional conservative measure of total company value.
LOANS SUMMARY
December 31 – in millions 2019 2018 2017 2016 2015
Commercial lendingCommercial $ 125,337 $ 116,834 $ 110,527 $ 101,364 $ 98,608Commercial real estate 28,110 28,140 28,978 29,010 27,468Equipment lease financing 7,155 7,308 7,934 7,581 7,468
Total commercial lending 160,602 152,282 147,439 137,955 133,544Consumer lending
Home equity 25,085 26,123 28,364 29,949 32,133Residential real estate 21,821 18,657 17,212 15,598 14,411Automobile 16,754 14,419 12,880 12,380 11,157Credit card 7,308 6,357 5,699 5,282 4,862Education 3,336 3,822 4,454 5,159 5,881Other consumer 4,937 4,585 4,410 4,510 4,708
Total consumer lending 79,241 73,963 73,019 72,878 73,152Total loans $ 239,843 $ 226,245 $ 220,458 $ 210,833 $ 206,696

The PNC Financial Services Group, Inc. – 2019 Form 10-K 175
SELECTED LOAN MATURITIES AND INTEREST SENSITIVITY
December 31, 2019In millions 1 Year or Less 1 Through 5 Years After 5 Years Gross Loans
Commercial $ 39,531 $ 79,258 $ 6,548 $ 125,337Commercial real estate 6,251 15,064 6,795 28,110
Total $ 45,782 $ 94,322 $ 13,343 $ 153,447Loans with:
Predetermined rate $ 6,328 $ 14,409 $ 6,317 $ 27,054Floating or adjustable rate 39,454 79,913 7,026 126,393
Total $ 45,782 $ 94,322 $ 13,343 $ 153,447
At December 31, 2019, $21.9 billion notional amount of receive-fixed interest rate swaps were designated as part of cash flow hedging strategies that converted the floating rate (LIBOR) on the underlying commercial loans to a fixed rate as part of risk management strategies.
NONPERFORMING ASSETS AND RELATED INFORMATION
December 31 – dollars in millions 2019 2018 2017 2016 2015
Nonperforming loansCommercial $ 425 $ 346 $ 429 $ 496 $ 351Commercial real estate 44 75 123 143 187Equipment lease financing 32 11 2 16 7
Total commercial lending 501 432 554 655 545Consumer lending (a)
Home equity 669 797 818 914 977Residential real estate 315 350 400 501 549Automobile 135 100 76 55 35Credit card 11 7 6 4 3Other consumer 4 8 11 15 17
Total consumer lending 1,134 1,262 1,311 1,489 1,581Total nonperforming loans (b) 1,635 1,694 1,865 2,144 2,126OREO and foreclosed assets 117 114 170 230 299Total nonperforming assets $ 1,752 $ 1,808 $ 2,035 $ 2,374 $ 2,425Nonperforming loans to total loans .68% .75% .85% 1.02% 1.03%Nonperforming assets to total loans, OREO and foreclosed assets .73% .80% .92% 1.12% 1.17%Nonperforming assets to total assets .43% .47% .53% .65% .68%Interest on nonperforming loans (c)
Computed on original terms $ 124 $ 123 $ 114 $ 111 $ 115Recognized prior to nonperforming status $ 17 $ 17 $ 19 $ 21 $ 22
Troubled Debt RestructuringsNonperforming $ 843 $ 863 $ 964 $ 1,112 $ 1,119Performing $ 821 $ 988 $ 1,097 $ 1,109 $ 1,232
Past due loansAccruing loans past due 90 days or more (d) $ 585 $ 629 $ 737 $ 782 $ 881As a percentage of total loans .24% .28% .33% .37% .43%
Past due loans held for saleAccruing loans held for sale past due 90 days or more $ 3 $ 4 $ 3 $ 4 $ 4As a percentage of total loans held for sale .28% .40% .11% .16% .29%
(a) Excludes most unsecured consumer loans and lines of credit, which are charged off after 120 to 180 days past due and are not placed on nonperforming status.(b) Nonperforming loans exclude certain government insured or guaranteed loans, loans held for sale, loans accounted for under the fair value option and purchased impaired
loans.(c) Amounts are for the year ended.(d) Past due loan amounts include government insured or guaranteed consumer loans of $.6 billion $.5 billion, $.6 billion, $.7 billion and $.8 billion at December 31, 2019, 2018,
2017, 2016 and 2015, respectively.

176 The PNC Financial Services Group, Inc. – 2019 Form 10-K
SUMMARY OF LOAN LOSS EXPERIENCE
Year ended December 31 – dollars in millions 2019 2018 2017 2016 2015
Allowance for loan and lease lossesJanuary 1 $ 2,629 $ 2,611 $ 2,589 $ 2,727 $ 3,331Gross charge-offs
Commercial (183) (108) (186) (332) (206)Commercial real estate (18) (8) (24) (26) (44)Equipment lease financing (15) (8) (11) (5) (5)Home equity (68) (110) (123) (143) (181)Residential real estate (9) (6) (9) (14) (24)Credit card (263) (217) (182) (161) (160)Other consumer (a) (418) (307) (251) (205) (185)
Total gross charge-offs (974) (764) (786) (886) (805)Recoveries
Commercial 59 67 81 117 170Commercial real estate 11 24 28 51 66Equipment lease financing 8 8 7 10 4Home equity 74 98 91 84 93Residential real estate 14 21 18 9 13Credit card 27 24 21 19 21Other consumer (a) 139 102 83 53 52
Total recoveries 332 344 329 343 419Net (charge-offs) (642) (420) (457) (543) (386)
Provision for credit losses 773 408 441 433 255Net decrease / (increase) in allowance for unfunded loan commitments and letters of credit (33) 12 4 (40) (2)Other (b) 15 18 34 12 (471)
December 31 $ 2,742 $ 2,629 $ 2,611 $ 2,589 $ 2,727ALLL as a percentage of December 31:
Loans (b) 1.14% 1.16% 1.18% 1.23% 1.32%Nonperforming loans 168% 155% 140% 121% 128%
As a percentage of average loans:Net charge-offs .27% .19% .21% .26% .19%Provision for credit losses .33% .18% .20% .21% .12%ALLL (b) 1.17% 1.18% 1.20% 1.24% 1.33%
ALLL as a multiple of net charge-offs 4.27x 6.26x 5.71x 4.77x 7.06x(a) Includes automobile, education and other consumer.(b) Includes $468 million in write-offs of purchased impaired loans in 2015 due to the change in derecognition policy effective December 31, 2015 for certain consumer
purchased impaired loans. See Note 1 Accounting Policies in our 2015 Form 10-K for additional information.
The following table presents the assignment of the ALLL and the categories of loans as a percentage of total loans. Changes in the allocation over time reflect the changes in loan portfolio composition, risk profile and refinements to reserve methodologies.
ALLOCATION OF ALLOWANCE FOR LOAN AND LEASE LOSSES
2019 2018 2017 2016 2015
December 31 dollars in millions AllowanceLoans to
Total Loans AllowanceLoans to
Total Loans AllowanceLoans to
Total Loans AllowanceLoans to
Total Loans AllowanceLoans to
Total Loans
Commercial $ 1,489 52.3% $ 1,350 51.6% $ 1,302 50.1% $ 1,179 48.1% $ 1,286 47.7%Commercial real estate 278 11.7 271 12.4 244 13.1 320 13.8 281 13.3Equipment lease financing 45 3.0 42 3.2 36 3.6 35 3.6 38 3.6Home equity 87 10.5 204 11.6 284 12.9 357 14.2 484 15.5Residential real estate 258 9.1 297 8.3 300 7.8 332 7.4 307 7.0Credit card 288 3.0 239 2.8 220 2.6 181 2.5 167 2.4Other consumer (a) 297 10.4 226 10.1 225 9.9 185 10.4 164 10.5
Total $ 2,742 100.0% $ 2,629 100.0% $ 2,611 100.0% $ 2,589 100.0% $ 2,727 100.0%(a) Includes automobile, education and other consumer.

The PNC Financial Services Group, Inc. – 2019 Form 10-K 177
TIME DEPOSITS
The aggregate amount of time deposits with a denomination of $100,000 or more was $13.3 billion at December 31, 2019 and $10.2 billion at December 31, 2018. Time deposits of $100,000 or more included time deposits in foreign offices of $6.2 billion at December 31, 2019. Domestic time deposits of $100,000 or more were $7.1 billion at December 31, 2019 with the following maturities:
December 31, 2019 - in billions Domestic Time DepositsThree months or less $ 1.9Over three through six months 1.7Over six through twelve months 2.4Over twelve months 1.1
Total $ 7.1
TRANSITIONAL BASEL III AND FULLY PHASED-IN BASEL III COMMON EQUITY TIER 1 CAPITAL RATIOS (NON-GAAP)
Our regulatory risk-based ratios for 2015 through 2017 were calculated using the standardized approach for determining risk-weighted assets, and the definitions of, and deductions from, regulatory capital under the Basel III rules (as such definitions and deductions were phased-in for 2015 through 2017). We refer to the capital ratios calculated using the phased-in Basel III provisions in effect for those periods and, for the risk-based ratios, standardized approach risk-weighted assets as the Transitional Basel III ratios.
Transitional Basel IIIFully Phased-In Basel III (Non-GAAP)
(estimated) (a)
Dollars in millionsDecember 31
2017December 31
2016December 31
2015December 31
2017December 31
2016December 31
2015
Common stock, related surplus and retained earnings, net oftreasury stock $ 43,676 $ 41,987 $ 41,128 $ 43,676 $ 41,987 $ 41,128Less regulatory capital adjustments:
Goodwill and disallowed intangibles, net of deferred tax liabilities (9,243) (8,974) (8,972) (9,307) (9,073) (9,172)Basel III total threshold deductions (1,983) (762) (470) (2,928) (1,469) (1,294)Accumulated other comprehensive income (b) (166) (238) (81) (207) (396) (201)
All other adjustments (138) (214) (112) (141) (221) (182)Basel III Common equity Tier 1 capital $ 32,146 $ 31,799 $ 31,493 $ 31,093 $ 30,828 $ 30,279Basel III standardized approach risk-weighted assets (c) $ 309,460 $ 300,533 $ 295,905 $ 316,120 $ 308,517 $ 303,707Basel III advanced approaches risk-weighted assets (d) N/A N/A N/A $ 285,226 $ 277,896 $ 264,931Basel III Common equity Tier 1 capital ratio 10.4% 10.6% 10.6% 9.8% 10.0% 10.0%
Risk weight and associated rules utilized
Standardized(with 2017transition
adjustments)
Standardized(with 2016transition
adjustments)
Standardized(with 2015transition
adjustments) Standardized(a) Pro forma fully phased-in Basel III ratios are calculated without the benefit of phase-ins. We believe that the pro forma fully phased-in Basel III capital ratios are a useful tool to
assess our capital position (without the benefit of phase-ins), for the periods presented.(b) Represented net adjustments related to accumulated other comprehensive income for securities, and those transferred from, available for sale, as well as pension and other
postretirement plans.(c) Basel III standardized approach risk-weighted assets were based on the Basel III standardized approach rules and include credit and market risk-weighted assets. (d) Basel III advanced approaches risk-weighted assets were based on the Basel III advanced approaches rules, and include credit, market and operational risk-weighted assets.
ITEM 9 – CHANGES IN AND DISAGREEMENTS WITH ACCOUNTANTS ON ACCOUNTING AND FINANCIAL DISCLOSURENone.

178 The PNC Financial Services Group, Inc. – 2019 Form 10-K
ITEM 9A – CONTROLS AND PROCEDURES
MANAGEMENT’S REPORT ON INTERNAL CONTROL OVER FINANCIAL REPORTING
The management of The PNC Financial Services Group, Inc. and subsidiaries (PNC) is responsible for establishing and maintaining adequate internal control over financial reporting, as such term is defined in the Exchange Act Rule 13a-15(f).
Because of inherent limitations, internal control over financial reporting may not prevent or detect misstatements. Also, projections of any evaluation of effectiveness to future periods are subject to the risk that controls may become inadequate because of changes in conditions, or that the degree of compliance with the policies or procedures may deteriorate.
We performed an evaluation under the supervision and with the participation of our management, including the Chairman, President and Chief Executive Officer and the Executive Vice President and Chief Financial Officer, of the effectiveness of PNC’s internal control over financial reporting as of December 31, 2019. This assessment was based on criteria for effective internal control over financial reporting described in Internal Control-Integrated Framework (2013) issued by the Committee of Sponsoring Organizations of the Treadway Commission. Based on this assessment, management concluded that PNC maintained effective internal control over financial reporting as of December 31, 2019.
PricewaterhouseCoopers LLP, the independent registered public accounting firm that audited our consolidated financial statements as of and for the year ended December 31, 2019 included in this Report, has also audited the effectiveness of PNC’s internal control over financial reporting as of December 31, 2019. The report of PricewaterhouseCoopers LLP is included under Item 8 of this Report.
DISCLOSURE CONTROLS AND PROCEDURES AND CHANGES IN INTERNAL CONTROL OVER FINANCIAL REPORTING
As of December 31, 2019, we performed an evaluation under the supervision and with the participation of our management, including the Chairman, President and Chief Executive Officer and the Executive Vice President and Chief Financial Officer, of the effectiveness of the design and operation of our disclosure controls and procedures and of changes in our internal control over financial reporting.
Based on that evaluation, our Chairman, President and Chief Executive Officer and our Executive Vice President and Chief Financial Officer concluded that our disclosure controls and procedures (as defined in Rule 13a-15(e) under the Securities and Exchange Act of 1934, as amended) were effective as of December 31, 2019, and that there has been no change in PNC’s internal control over financial reporting that occurred during the fourth quarter of 2019 that has materially affected, or is reasonably likely to materially affect, our internal control over financial reporting.
ITEM 9B – OTHER INFORMATIONNone.
PART III
ITEM 10 – DIRECTORS, EXECUTIVE OFFICERS AND CORPORATE GOVERNANCECertain of the information regarding our directors (or nominees for director), executive officers and Audit Committee (and Audit Committee financial experts), required by this item is included under the captions “Election of Directors (Item 1),” and “Corporate Governance – Board committees – Audit Committee,” in our Proxy Statement to be filed for the 2020 annual meeting of shareholders and is incorporated herein by reference.
Additional information regarding our executive officers is included in Part I of this Report under the captions “Information about our Executive Officers.”
Information regarding our compliance with Section 16(a) of the Securities Exchange Act of 1934 is included, to the extent necessary, under the caption “Delinquent Section 16(a) Reports” in our Proxy Statement to be filed for the 2020 annual meeting of shareholders and is incorporated herein by reference.
Certain information regarding our PNC Code of Business Conduct and Ethics required by this item is included under the caption “Corporate Governance – Our Code of Business Conduct and Ethics” and “Director and Executive Officer Relationships – Code of Business Conduct and Ethics” in our Proxy Statement to be filed for the 2020 annual meeting of shareholders and is incorporated herein by reference. Our PNC Code of Business Conduct and Ethics is available on our corporate website at www.pnc.com/corporategovernance. In addition, any future amendments to, or waivers from, a provision of the PNC Code of Business Conduct and Ethics that applies to our directors or executive officers (including our principal executive officer, principal financial officer, and principal accounting officer or controller) will be posted at this internet address.

The PNC Financial Services Group, Inc. – 2019 Form 10-K 179
ITEM 11 – EXECUTIVE COMPENSATIONThe information required by this item is included under the captions “Corporate Governance – Board committees – Personnel and Compensation Committee – Compensation committee interlocks and insider participation,” “Director Compensation,” “Compensation Discussion and Analysis,” “Compensation Committee Report,” “Compensation and Risk,” “Compensation Tables,” “Change in Control and Termination of Employment” and “CEO Pay Ratio” in our Proxy Statement to be filed for the 2020 annual meeting of shareholders and is incorporated herein by reference. In accordance with Item 407(e)(5) of Regulation S-K, the information set forth under the caption “Compensation Committee Report” in such Proxy Statement will be deemed to be furnished in this Report and will not be deemed to be incorporated by reference into any filing under the Securities Act or the Exchange Act as a result of furnishing the disclosure in this manner.
ITEM 12 – SECURITY OWNERSHIP OF CERTAIN BENEFICIAL OWNERS AND MANAGEMENT AND RELATED STOCKHOLDER MATTERSThe information required by this item regarding security ownership of certain beneficial owners and management is included under the caption “Security Ownership of Management and Certain Beneficial Owners” in our Proxy Statement to be filed for the 2020 annual meeting of shareholders and is incorporated herein by reference.
Information regarding our compensation plans under which PNC equity securities are authorized for issuance as of December 31, 2019 is included in the table which follows. Additional information regarding these plans is included in Note 12 Stock Based Compensation Plans in the Notes To Consolidated Financial Statements in Item 8 of this Report.
Equity Compensation Plan InformationAt December 31, 2019
(a) (b) (c)
Number of securitiesto be issued upon
exercise ofoutstanding options,warrants and rights
Weighted-averageexercise price of
outstanding options,warrants and
rights (1)
Number of securities remainingavailable for future issuance
under equity compensation plans(excluding securities
reflected in column (a))
Plan Category Equity compensation plans approved by security holders 4,653,282 (2) $ 61.12 29,115,558 (3)Equity compensation plans not approved by security holders — $ — —
Total 4,653,282 $ 61.12 29,115,558
(1) – The weighted-average exercise price does not take into account restricted stock units or incentive performance units because they have no exercise price.
(2) – Of this total, the following amounts relate to the 2016 Incentive Award Plan (2016 Incentive Plan), approved by shareholders on April 26, 2016: 3,492,063 are stock-payable restricted stock units (at a maximum share award level), 444,969 are performance share units (at maximum share award level), 30,147 are deferred stock units (at a maximum share award level), and 108,176 are incentive performance unit awards (at a maximum share award level). Also included in this total are the following amounts that relate to the 2006 Incentive Award Plan, as amended and restated (2006 Incentive Plan): 328,147 are stock options, 249,780 are stock-payable restricted stock units (at a maximum award level).
Under both the 2016 Incentive Plan and the 2006 Incentive Plan (for incentive performance unit awards under each) upon achievement of performance goals and other conditions above target level, payment is made in cash share equivalents, up to a maximum of 25% of the target number of share units.
Following shareholder approval of the 2016 Incentive Plan, no further grants were permitted under the 2006 Incentive Plan.
(3) – Includes 291,751 shares available for issuance under the Employee Stock Purchase Plan, of which 67,362 shares are subject to purchase during the purchase period ending December 31, 2019. The amount available for awards under the 2016 Incentive Plan is 28,823,807.
ITEM 13 – CERTAIN RELATIONSHIPS AND RELATED TRANSACTIONS, AND DIRECTOR INDEPENDENCE
The information required by this item is included under the captions “Director and Executive Officer Relationships – Director independence, – Transactions with directors, – Family relationships, and – Indemnification and advancement of costs” and “Related Person Transactions” in our Proxy Statement to be filed for the 2020 annual meeting of shareholders and is incorporated herein by reference.

180 The PNC Financial Services Group, Inc. – 2019 Form 10-K
ITEM 14 – PRINCIPAL ACCOUNTING FEES AND SERVICESThe information required by this item is included under the caption “Ratification of Independent Registered Public Accounting Firm (Item 2) – Audit, audit-related and permitted non-audit fees and – Procedures for pre-approving audit services, audit-related services and permitted non-audit services” in our Proxy Statement to be filed for the 2020 annual meeting of shareholders and is incorporated herein by reference.
PART IV
ITEM 15 – EXHIBITS, FINANCIAL STATEMENT SCHEDULES
FINANCIAL STATEMENTS, FINANCIAL STATEMENT SCHEDULES
Our consolidated financial statements required in response to this Item are incorporated by reference from Item 8 of this Report.Audited consolidated financial statements of BlackRock, Inc. as of December 31, 2019 and 2018 and for each of the three years in the period ended December 31, 2019 are filed with this Report as Exhibit 99.1 and incorporated herein by reference.
EXHIBIT INDEX
ExhibitNo. Description Method of Filing +
3.1.1 Amended and Restated Articles of Incorporation of the Corporation, effective January 2, 2009
Incorporated herein by reference to Exhibit 3.1 of theCorporation’s Annual Report on Form 10-K for the yearended December 31, 2008 (2008 Form 10-K)
3.1.2 Statement with Respect to Shares of Fixed-to-Floating Rate Non-Cumulative Perpetual Preferred Stock, Series O dated July 21, 2011
Incorporated herein by reference to Exhibit 3.1 of theCorporation’s Current Report on Form 8-K filed July 27,2011
3.1.3 Statement with Respect to Shares of Fixed-to-Floating Rate Non-Cumulative Perpetual Preferred Stock, Series P dated April 19, 2012
Incorporated herein by reference to Exhibit 3.1 of theCorporation’s Current Report on Form 8-K filed April 24,2012
3.1.4 Statement with Respect to Shares of 5.375% Non-Cumulative Perpetual Preferred Stock, Series Q dated September 14, 2012
Incorporated herein by reference to Exhibit 3.1 of theCorporation’s Current Report on Form 8-K filedSeptember 21, 2012
3.1.5 Statement with Respect to Shares of Fixed-to-Floating Rate Non-Cumulative Perpetual Preferred Stock, Series R dated May 2, 2013
Incorporated herein by reference to Exhibit 3.1 of theCorporation’s Current Report on Form 8-K filed May 7,2013
3.1.6 Amendment to Amended and Restated Articles of Incorporation of the Corporation, effective November 19, 2015
Incorporated herein by reference to Exhibit 3.1.6 of theCorporation’s Current Report on Form 8-K filedNovember 20, 2015
3.1.7 Statement with Respect to Shares of Fixed-to-Floating Rate Non-Cumulative Perpetual Preferred Stock, Series S dated October 27, 2016
Incorporated herein by reference to Exhibit 3.1 of theCorporation’s Current Report on Form 8-K filedNovember 1, 2016
3.2 By-Laws of the Corporation, as amended and restated, effective August 11, 2016
Incorporated herein by reference to Exhibit 3.2 of theCorporation’s Current Report on Form 8-K filed August 11,2016
4.1 There are no instruments with respect to long-term debt ofthe Corporation and its subsidiaries that involve a totalamount of securities authorized thereunder that exceed10 percent of the total assets of the Corporation and itssubsidiaries on a consolidated basis. The Corporation agreesto provide the SEC with a copy of instruments defining therights of holders of long-term debt of the Corporation andits subsidiaries on request.
4.2 Deposit Agreement dated July 27, 2011, between the Corporation, Computershare Trust Company, N.A., Computershare Inc. and the holders from time to time of the Depositary Receipts representing interests in the Series O preferred stock
Incorporated herein by reference to Exhibit 4.2 of theCorporation’s Current Report on Form 8-K filed July 27,2011

The PNC Financial Services Group, Inc. – 2019 Form 10-K 181
ExhibitNo. Description Method of Filing +
4.3 Deposit Agreement, dated April 24, 2012, between the Corporation, Computershare Trust Company, N.A., Computershare Inc. and the holders from time to time of the Depositary Receipts representing interests in the Series P preferred stock
Incorporated herein by reference to Exhibit 4.2 of theCorporation’s Current Report on Form 8-K filed April 24,2012
4.4 Deposit Agreement, dated September 21, 2012, between the Corporation, Computershare Trust Company, N.A., Computershare Inc. and the holders from time to time of the Depositary Receipts representing interests in the Series Q preferred stock
Incorporated herein by reference to Exhibit 4.2 of theCorporation’s Current Report on Form 8-K filedSeptember 21, 2012
4.5 Deposit Agreement, dated May 7, 2013, between the Corporation, Computershare Trust Company, N.A., Computershare Inc. and the holders from time to time of the Depositary Receipts representing interests in the Series R preferred stock
Incorporated herein by reference to Exhibit 4.2 of theCorporation’s Current Report on Form 8-K filed May 7,2013
4.6 Deposit Agreement, dated November 1, 2016, between the Corporation, Computershare Trust Company, N.A., Computershare Inc. and the holders from time to time of the Depositary Receipts representing interests in the Series S preferred stock
Incorporated herein by reference to Exhibit 4.2 of theCorporation’s Current Report on Form 8-K filedNovember 1, 2016
4.7 Form of PNC Bank, National Association Subordinated Fixed Rate Global Bank Note issued prior to January 16, 2014
Incorporated herein by reference to Exhibit 4.11 of theCorporation’s Quarterly Report on Form 10-Q for thequarter ended September 30, 2004
4.8.1 Issuing and Paying Agency Agreement, dated January 16, 2014, between PNC Bank, National Association and PNC Bank, National Association, relating to the $25 billion Global Bank Note Program for the Issue of Senior and Subordinated Bank Notes
Incorporated herein by reference to Exhibit 4.25 of theCorporation’s Annual Report on Form 10-K for the yearended December 31, 2013 (2013 Form 10-K)
4.8.2 Amendment No. 1 to Issuing and Paying Agency Agreement, dated May 22, 2015, between PNC Bank, National Association and PNC Bank, National Association, relating to the $30 billion Global Bank Note Program for the Issue of Senior and Subordinated Bank Notes
Incorporated herein by reference to Exhibit 4.21.2 of theCorporation’s Quarterly Report on Form 10-Q for thequarter ended June 30, 2015 (2nd Quarter 2015 Form 10-Q)
4.8.3 Amendment No. 2 to Issuing and Paying Agency Agreement, dated May 27, 2016, between PNC Bank, National Association and PNC Bank, National Association, relating to the $40 billion Global Bank Note Program for the Issue of Senior and Subordinated Bank Notes
Incorporated herein by reference to Exhibit 4.20.3 of theCorporation’s Quarterly Report on Form 10-Q for thequarter ended June 30, 2016 (2nd Quarter 2016 Form 10-Q)
4.9 Forms of PNC Bank, National Association Senior Global Bank Notes issued after January 16, 2014 (included in Exhibit 4.8.1)
Incorporated herein by reference to Exhibit 4.25 of theCorporation’s 2013 Form 10-K
4.10 Forms of PNC Bank, National Association Subordinated Global Bank Notes issued on or after May 22, 2015 (included in Exhibit 4.8.2)
Incorporated herein by reference to Exhibit 4.21.2 of theCorporation’s 2nd Quarter 2015 Form 10-Q
44.11 Description of the Corporation's Securities Filed herewith
10.1.1 The Corporation’s Supplemental Executive Retirement Plan, as amended and restated effective January 1, 2009
Incorporated herein by reference to Exhibit 10.2 of theCorporation’s 2008 Form 10-K*
10.1.2 Amendment 2009-1 to the Corporation’s Supplemental Executive Retirement Plan, as amended and restated effective January 1, 2009
Incorporated herein by reference to Exhibit 10.3 of theCorporation’s Annual Report on Form 10-K for the yearended December 31, 2009 (2009 Form 10-K)*
10.1.3 Amendment 2013-1 to the Corporation’s Supplemental Executive Retirement Plan, as amended and restated effective January 1, 2009
Incorporated herein by reference to Exhibit 10.1.3 of theCorporation’s 2013 Form 10-K*

182 The PNC Financial Services Group, Inc. – 2019 Form 10-K
ExhibitNo. Description Method of Filing +
10.2.1 The Corporation’s ERISA Excess Pension Plan, as amended and restated effective January 1, 2009
Incorporated herein by reference to Exhibit 10.4 of theCorporation’s 2008 Form 10-K*
10.2.2 Amendment 2009-1 to the Corporation’s ERISA Excess Plan, as amended and restated effective January 1, 2009
Incorporated herein by reference to Exhibit 10.6 of theCorporation’s 2009 Form 10-K*
10.2.3 Amendment 2011-1 to the Corporation’s ERISA Excess Pension Plan, as amended and restated effective January 1, 2009
Incorporated herein by reference to Exhibit 10.8 of theCorporation’s Annual Report on Form 10-K for the yearended December 31, 2011 (2011 Form 10-K)*
10.2.4 Amendment 2013-1 to the Corporation’s ERISA Excess Pension Plan, as amended and restated effective January 1, 2009
Incorporated herein by reference to Exhibit 10.2.4 of theCorporation’s 2013 Form 10-K*
10.3.1 The Corporation’s Key Executive Equity Program, as amended and restated effective January 1, 2009
Incorporated herein by reference to Exhibit 10.6 of theCorporation’s 2008 Form 10-K*
10.3.2 Amendment 2009-1 to the Corporation’s Key Executive Equity Program, as amended and restated as of January 1, 2009
Incorporated herein by reference to Exhibit 10.9 of theCorporation’s 2009 Form 10-K*
10.4.1 The Corporation’s Supplemental Incentive Savings Plan, as amended and restated effective January 1, 2010
Incorporated herein by reference to Exhibit 10.17 of theCorporation’s 2011 Form 10-K*
10.4.2 Amendment 2013-1 to the Corporation’s Supplemental Incentive Savings Plan, as amended and restated effective January 1, 2010
Incorporated herein by reference to Exhibit 10.4.2 of theCorporation’s 2013 Form 10-K*
10.5.1 The Corporation and Affiliates Deferred Compensation Plan, as amended and restated May 5, 2009
Incorporated herein by reference to Exhibit 10.62 of theCorporation’s Quarterly Report on Form 10-Q for thequarter ended June 30, 2009*
10.5.2 Amendment 2009-1 to the Corporation and Affiliates Deferred Compensation Plan, as amended and restated May 5, 2009
Incorporated herein by reference to Exhibit 10.17 of theCorporation’s 2009 Form 10-K*
10.5.3 Amendment 2010-1 to the Corporation and Affiliates Deferred Compensation Plan, as amended and restated May 5, 2009
Incorporated herein by reference to Exhibit 10.20 of theCorporation’s Annual Report on Form 10-K for the yearended December 31, 2010 (2010 Form 10-K)*
10.5.4 Amendment 2011-1 to the Corporation and Affiliates Deferred Compensation Plan, as amended and restated May 5, 2009
Incorporated herein by reference to Exhibit 10.23 of theCorporation’s 2011 Form 10-K*
10.5.5 Amendment 2012-1 to the Corporation and Affiliates Deferred Compensation Plan, as amended and restated May 5, 2009
Incorporated herein by reference to Exhibit 10.24 of theCorporation’s Annual Report on Form 10-K for the yearended December 31, 2012 (2012 Form 10-K)*
10.5.6 Amendment 2013-1 to the Corporation and Affiliates Deferred Compensation Plan, as amended and restated May 5, 2009
Incorporated herein by reference to Exhibit 10.5.6 of theCorporation’s 2013 Form 10-K*
10.6.1 The Corporation and Affiliates Deferred Compensation and Incentive Plan, as amended and restated effective January 1, 2017
Incorporated herein by reference to Exhibit 10.7 of the Corporation’s Form 10-K for the year ended December 31, 2016 (2016 Form 10-K)*
10.6.2 Amendment 2018-1 to the Corporation and Affiliates Deferred Compensation and Incentive Plan, as amended and restated effective January 1, 2017
Incorporated herein by reference to Exhibit 10.6.2 of theCorporation’s Form 10-K for the year ended December 31,2018*
10.6.3 The Corporation and Affiliates Deferred Compensation and Incentive Plan, as amended and restated effective January 1, 2020
Filed herewith*
10.7 The PNC Financial Services Group, Inc. 2016 Incentive Award Plan
Incorporated herein by reference to Exhibit 99.1 of theCorporation’s Form S-8 (File No. 333-210995) filedApril 29, 2016*

The PNC Financial Services Group, Inc. – 2019 Form 10-K 183
ExhibitNo. Description Method of Filing +
10.8.1 The Corporation’s 2006 Incentive Award Plan, as amended and restated effective as of March 11, 2011
Incorporated herein by reference to Exhibit 10.70 of theCorporation’s Quarterly Report on Form 1O-Q for thequarter ended March 31, 2011 (1st Quarter 2011 Form 10-Q)*
10.8.2 Addendum to the Corporation’s 2006 Incentive Award Plan, effective as of January 26, 2012
Incorporated herein by reference to Exhibit 10.28 of theCorporation’s 2011 Form 10-K*
10.9 The Corporation’s Directors Deferred Compensation Plan, as amended and restated effective January 1, 2015
Incorporated herein by reference to Exhibit 10.52 of theCorporation’s Quarterly Report on Form 10-Q for thequarter ended September 30, 2014
10.10 The Corporation’s 2016 Incentive Award Plan Directors Deferred Stock Unit Program effective January 1, 2017
Incorporated herein by reference to Exhibit 10.16 of theCorporation’s 2016 Form 10-K*
10.11 Trust Agreement between the Corporation, as settlor, and Matrix Trust Company, as trustee
Incorporated herein by reference to Exhibit 10.15 of theCorporation’s Form 10-K for the year ended December 31,2017*
10.12 Trust Agreement between PNC Investment Corp., as settlor, and PNC Bank, National Association, as trustee
Incorporated herein by reference to Exhibit 10.34 of theCorporation’s 3rd Quarter 2005 Form 10-Q*
10.13 Certificate of Corporate Action for Grantor Trusts effective January 1, 2012
Incorporated herein by reference to Exhibit 10.37 of theCorporation’s 2011 Form 10-K*
10.14 The Corporation’s Employee Stock Purchase Plan, as amended and restated as of January 1, 2019
Incorporated herein by reference to Exhibit 10.53 of the Corporation’s Quarterly Report on Form 10-Q for the quarter ended September 30, 2018
10.15 2010 forms of employee stock option, restricted stock, and restricted share unit agreements
Incorporated herein by reference to Exhibit 10.48 of the Corporation’s 2009 Form 10-K*
10.16 2011 forms of employee stock option, restricted stock, restricted share unit and performance unit agreements
Incorporated herein by reference to Exhibit 10.71 of theCorporation’s 1st Quarter 2011 Form 10-Q*
10.17 2012 forms of employee stock option, restricted stock and restricted share unit agreements
Incorporated herein by reference to Exhibit 10.77 of the Corporation’s Quarterly Report on Form 10-Q for the quarter ended March 31, 2012 (1st Quarter 2012 Form 10-Q)*
10.18 Forms of employee stock option, restricted stock and restricted share unit agreements with varied vesting, payment and other circumstances
Incorporated herein by reference to Exhibit 10.78 of the Corporation’s 1st Quarter 2012 Form 10-Q*
10.19 2013 forms of employee stock option and restricted share unit agreements
Incorporated herein by reference to Exhibit 10.64 of theCorporation’s 2012 Form 10-K*
10.20 Additional 2013 forms of employee stock option, performance unit, restricted stock and restricted share unit agreements
Incorporated herein by reference to Exhibit 10.82 of theCorporation’s Quarterly Report on Form 10-Q for thequarter ended June 30, 2013*
10.21 2016 Form of Performance Restricted Share Units Award Agreement
Incorporated herein by reference to Exhibit 10.52 of theCorporation’s Quarterly Report on Form 10-Q for thequarter ended September 30, 2016 (3rd Quarter 2016 Form10-Q)*
10.22 2016 Form of Senior Leader Performance Restricted Share Units Award Agreement
Incorporated herein by reference to Exhibit 10.54 of theCorporation’s 3rd Quarter 2016 Form 10-Q*
10.23 2017 Form of Performance Restricted Share Units Award Agreement
Incorporated herein by reference to Exhibit 10.56 of theCorporation’s Quarterly Report on Form 10-Q for thequarter ended June 30, 2017 (2nd Quarter 2017 Form 10-Q)*
10.24 2017 Form of Incentive Performance Units Award Agreement
Incorporated herein by reference to Exhibit 10.57 of theCorporation’s 2nd Quarter 2017 Form 10-Q*
10.25 2017 Form of Performance Restricted Share Units Award Agreement - Senior Leaders Program (Section 16 Executives)
Incorporated herein by reference to Exhibit 10.58 of theCorporation’s 2nd Quarter 2017 Form 10-Q*

184 The PNC Financial Services Group, Inc. – 2019 Form 10-K
ExhibitNo. Description Method of Filing +
10.26 2017 Form of Cash-Payable Incentive Performance Units Award Agreement
Incorporated herein by reference to Exhibit 10.59 of theCorporation’s 2nd Quarter 2017 Form 10-Q*
10.27 2018 Form of Performance Share Units Award Agreement Incorporated herein by reference to Exhibit 10.50 of theCorporation’s Quarterly Report on Form 10-Q for thequarter ended June 30, 2018 (2nd Quarter 2018 Form 10-Q)*
10.28 2018 Form of Restricted Share Units Award Agreement Incorporated herein by reference to Exhibit 10.51 of theCorporation’s 2nd Quarter 2018 Form 10-Q*
10.29 2018 Form of Restricted Share Units Award Agreement - Senior Leader Program
Incorporated herein by reference to Exhibit 10.52 of theCorporation’s 2nd Quarter 2018 Form 10-Q*
10.30 2019 Form of Performance Share Units Award Agreement Incorporated herein by reference to Exhibit 10.45 of theCorporation’s Quarterly Report on Form 10-Q for thequarter ended September 30, 2019 (3rd Quarter 2019 Form10-Q)*
10.31 2019 Form of Restricted Share Units Award Agreement Incorporated herein by reference to Exhibit 10.46 of theCorporation’s 3rd Quarter 2019 Form 10-Q*
10.32 2019 Form of Restricted Share Units Award Agreement - Senior Leader Program
Incorporated herein by reference to Exhibit 10.47 of theCorporation’s 3rd Quarter 2019 Form 10-Q*
10.33 Form of Time-Sharing Agreement between the Corporation and certain executives
Incorporated by reference to Exhibit 10.49 of theCorporation’s Current Report on Form 8-K filed April 4,2014*
10.34 Form of change of control employment agreements Incorporated herein by reference to Exhibit 10.51 of theCorporation’s Current Report on Form 8-K filed August 16,2016*
10.35.1 The National City Corporation 2004 Deferred Compensation Plan, as amended and restated effective January 1, 2005
Incorporated herein by reference to Exhibit 10.35 ofNational City Corporation’s Quarterly Report on Form 10-Qfor the quarter ended March 31, 2006*
10.35.2 Amendment to The National City Corporation 2004 Deferred Compensation Plan, as amended and restated effective January 1, 2005
Incorporated herein by reference to Exhibit 10.56 of theCorporation’s 2010 Form 10-K*
10.36.1 Amended and Restated Implementation and Stockholder Agreement, dated as of February 27, 2009, between the Corporation and BlackRock, Inc.
Incorporated herein by reference to Exhibit 10.2 ofBlackRock, Inc.’s Current Report on Form 8-K filedFebruary 27, 2009
10.36.2 Amendment No. 1, dated as of June 11, 2009, to the Amended and Restated Implementation and Stockholder Agreement between the Corporation and BlackRock, Inc.
Incorporated herein by reference to Exhibit 10.2 ofBlackRock, Inc.’s Current Report on Form 8-K filedJune 17, 2009
10.37 Exchange Agreement dated as of May 21, 2012 by and among PNC Bancorp, Inc., the Corporation and BlackRock, Inc.
Incorporated herein by reference to Exhibit 10.3 ofBlackRock, Inc.’s Current Report on Form 8-K filedMay 23, 2012
10.38.1 Distribution Agreement, dated January 16, 2014, between PNC Bank, National Association and the Dealers named therein, relating to the $25 billion Global Bank Note Program for the Issue of Senior and Subordinated Bank Notes
Incorporated by reference to Exhibit 10.47 of theCorporation’s Annual Report on Form 10-K for the yearended December 31, 2014
10.38.2 Amendment No. 1 to Distribution Agreement, dated May 22, 2015, between PNC Bank, National Association and the Dealers named therein, relating to the $30 billion Global Bank Note Program for the Issue of Senior and Subordinated Bank Notes
Incorporated herein by reference to Exhibit 10.47.2 of theCorporation’s 2nd Quarter 2015 Form 10-Q

The PNC Financial Services Group, Inc. – 2019 Form 10-K 185
ExhibitNo. Description Method of Filing +
10.38.3 Amendment No. 2 to Distribution Agreement, dated May 27, 2016, between PNC Bank, National Association and the Dealers named therein, relating to the $40 billion Global Bank Note Program for the Issue of Senior and Subordinated Bank Notes
Incorporated herein by reference to Exhibit 10.48.3 of theCorporation’s 2nd Quarter 2016 Form 10-Q
21 Schedule of Certain Subsidiaries of the Corporation Filed herewith
23.1 Consent of PricewaterhouseCoopers LLP, the Corporation’s Independent Registered Public Accounting Firm
Filed herewith
23.2 Consent of Deloitte & Touche LLP, Independent Registered Public Accounting Firm of BlackRock, Inc.
Filed herewith
24 Powers of Attorney Filed herewith
31.1 Certification of Chief Executive Officer pursuant to Section 302 of the Sarbanes-Oxley Act of 2002
Filed herewith
31.2 Certification of Chief Financial Officer pursuant to Section 302 of the Sarbanes-Oxley Act of 2002
Filed herewith
32.1 Certification of Chief Executive Officer pursuant to 18 U.S.C. Section 1350
Furnished herewith
32.2 Certification of Chief Financial Officer pursuant to 18 U.S.C. Section 1350
Furnished herewith
99.1 Audited consolidated financial statements of BlackRock, Inc. as of December 31, 2019 and 2018 and for each of the three years ended December 31, 2019
Filed herewith
101.INS
Inline XBRL Instance Document Filed herewith
101.SCH
Inline XBRL Taxonomy Extension Schema Document Filed herewith
101.CAL
Inline XBRL Taxonomy Extension Calculation Linkbase Document
Filed herewith
101.LAB
Inline XBRL Taxonomy Extension Label Linkbase Document
Filed herewith
101.PRE
Inline XBRL Taxonomy Extension Presentation Linkbase Document
Filed herewith
101.DEF
Inline XBRL Taxonomy Extension Definition Linkbase Document
Filed herewith
104 Cover Page Interactive Data File (formatted as inline XBRLand contained in Exhibit 101)
+ Incorporated document references to filings by the Corporation are to SEC File No. 001-09718, to filings by NationalCity Corporation are to SEC File No. 001-10074, to filings by BlackRock through its second quarter 2006 Form 10-Q(referred to herein as Old BlackRock) are to BlackRock Holdco 2, Inc. SEC File No. 001-15305, and to filings byBlackRock, Inc. are to SEC File No. 001-33099.
* Denotes management contract or compensatory plan.
You can obtain copies of these Exhibits electronically at the SEC’s website at www.sec.gov. The Exhibits are also available as part of this Form 10-K on PNC’s corporate website at www.pnc.com/secfilings. Shareholders and bondholders may also obtain copies of Exhibits, without charge, by contacting Shareholder Relations at 800-843-2206 or via e-mail at [email protected]. The Interactive Data File (XBRL) exhibit is only available electronically.

186 The PNC Financial Services Group, Inc. – 2019 Form 10-K
ITEM 16 – FORM 10-K SUMMARYNone.
SIGNATURESPursuant to the requirements of Section 13 or 15(d) of the Securities Exchange Act of 1934, the registrant has duly caused this report to be signed on its behalf by the undersigned, thereunto duly authorized.
The PNC Financial Services Group, Inc.(Registrant)
By: /s/ Robert Q. Reilly Robert Q. Reilly Executive Vice President and Chief Financial Officer February 28, 2020
Pursuant to the requirements of the Securities Exchange Act of 1934, this report has been signed below by the following persons on behalf of The PNC Financial Services Group, Inc. and in the capacities indicated on February 28, 2020.
Signature Capacities
/s/ William S. Demchak Chairman, President, Chief Executive Officer and DirectorWilliam S. Demchak (Principal Executive Officer)
/s/ Robert Q. Reilly Executive Vice President and Chief Financial OfficerRobert Q. Reilly (Principal Financial Officer)
/s/ Gregory H. Kozich Senior Vice President and ControllerGregory H. Kozich (Principal Accounting Officer)
* Joseph Alvarado; Charles E. Bunch; Debra A. Cafaro;Marjorie Rodgers Cheshire; Andrew T. Feldstein; Richard J.Harshman; Daniel R. Hesse; Richard B. Kelson; Linda R.Medler, Martin Pfinsgraff; Toni Townes-Whitley; Michael J.Ward
Directors
*By: /s/ Alicia Powell
Alicia Powell, Attorney-in-Fact, pursuant to Powers of Attorney filed herewith

EXHIBIT 31.1
In accordance with Exchange Act Rules 13a-14(f) and 15d-14(f), this certification does not relate to Interactive Data Files as defined in Rule 11 of Regulation S-T.
CERTIFICATION OF CHIEF EXECUTIVE OFFICER
I, William S. Demchak, certify that:
1. I have reviewed this Annual Report on Form 10-K for the year ended December 31, 2019 of The PNC Financial Services Group, Inc.;
2. Based on my knowledge, this report does not contain any untrue statement of a material fact or omit to state a material fact necessary to make the statements made, in light of the circumstances under which such statements were made, not misleading with respect to the period covered by this report;
3. Based on my knowledge, the financial statements, and other financial information included in this report, fairly present in all material respects the financial condition, results of operations and cash flows of the registrant as of, and for, the periods presented in this report;
4. The registrant’s other certifying officer and I are responsible for establishing and maintaining disclosure controls and procedures (as defined in Exchange Act Rules 13a-15(e) and 15d-15(e)) and internal control over financial reporting (as defined in Exchange Act Rules 13a-15(f) and 15d-15(f)) for the registrant and have:
a) Designed such disclosure controls and procedures, or caused such disclosure controls and procedures to be designed under our supervision, to ensure that material information relating to the registrant, including its consolidated subsidiaries, is made known to us by others within those entities, particularly during the period in which this report is being prepared;
b) Designed such internal control over financial reporting, or caused such internal control over financial reporting to be designed under our supervision, to provide reasonable assurance regarding the reliability of financial reporting and the preparation of financial statements for external purposes in accordance with generally accepted accounting principles;
c) Evaluated the effectiveness of the registrant’s disclosure controls and procedures and presented in this report our conclusions about the effectiveness of the disclosure controls and procedures, as of the end of the period covered by this report based on such evaluation; and
d) Disclosed in this report any change in the registrant’s internal control over financial reporting that occurred during the registrant’s most recent fiscal quarter (the registrant’s fourth fiscal quarter in the case of an annual report) that has materially affected, or is reasonably likely to materially affect, the registrant’s internal control over financial reporting; and
5. The registrant’s other certifying officer and I have disclosed, based on our most recent evaluation of internal control over financial reporting, to the registrant’s auditors and the audit committee of the registrant’s board of directors (or persons performing the equivalent functions):
a) All significant deficiencies and material weaknesses in the design or operation of internal control over financial reporting which are reasonably likely to adversely affect the registrant’s ability to record, process, summarize and report financial information; and
b) Any fraud, whether or not material, that involves management or other employees who have a significant role in the registrant’s internal control over financial reporting.
Date: February 28, 2020
/s/ William S. DemchakWilliam S. DemchakChairman, President and Chief Executive Officer

EXHIBIT 31.2
In accordance with Exchange Act Rules 13a-14(f) and 15d-14(f), this certification does not relate to Interactive Data Files as defined in Rule 11 of Regulation S-T.
CERTIFICATION OF CHIEF FINANCIAL OFFICER
I, Robert Q. Reilly, certify that:
1. I have reviewed this Annual Report on Form 10-K for the year ended December 31, 2019 of The PNC Financial Services Group, Inc.;
2. Based on my knowledge, this report does not contain any untrue statement of a material fact or omit to state a material fact necessary to make the statements made, in light of the circumstances under which such statements were made, not misleading with respect to the period covered by this report;
3. Based on my knowledge, the financial statements, and other financial information included in this report, fairly present in all material respects the financial condition, results of operations and cash flows of the registrant as of, and for, the periods presented in this report;
4. The registrant’s other certifying officer and I are responsible for establishing and maintaining disclosure controls and procedures (as defined in Exchange Act Rules 13a-15(e) and 15d-15(e)) and internal control over financial reporting (as defined in Exchange Act Rules 13a-15(f) and 15d-15(f)) for the registrant and have:
a) Designed such disclosure controls and procedures, or caused such disclosure controls and procedures to be designed under our supervision, to ensure that material information relating to the registrant, including its consolidated subsidiaries, is made known to us by others within those entities, particularly during the period in which this report is being prepared;
b) Designed such internal control over financial reporting, or caused such internal control over financial reporting to be designed under our supervision, to provide reasonable assurance regarding the reliability of financial reporting and the preparation of financial statements for external purposes in accordance with generally accepted accounting principles;
c) Evaluated the effectiveness of the registrant’s disclosure controls and procedures and presented in this report our conclusions about the effectiveness of the disclosure controls and procedures, as of the end of the period covered by this report based on such evaluation; and
d) Disclosed in this report any change in the registrant’s internal control over financial reporting that occurred during the registrant’s most recent fiscal quarter (the registrant’s fourth fiscal quarter in the case of an annual report) that has materially affected, or is reasonably likely to materially affect, the registrant’s internal control over financial reporting; and
5. The registrant’s other certifying officer and I have disclosed, based on our most recent evaluation of internal control over financial reporting, to the registrant’s auditors and the audit committee of the registrant’s board of directors (or persons performing the equivalent functions):
a) All significant deficiencies and material weaknesses in the design or operation of internal control over financial reporting which are reasonably likely to adversely affect the registrant’s ability to record, process, summarize and report financial information; and
b) Any fraud, whether or not material, that involves management or other employees who have a significant role in the registrant’s internal control over financial reporting.
Date: February 28, 2020
/s/ Robert Q. ReillyRobert Q. ReillyExecutive Vice President and Chief Financial Officer

EXHIBIT 32.1
In accordance with Exchange Act Rules 13a-14(f) and 15d-14(f), this certification does not relate to Interactive Data Files as defined in Rule 11 of Regulation S-T.
CERTIFICATION BY CHIEF EXECUTIVE OFFICER PURSUANT TO 18 U.S.C. SECTION 1350,
AS ADOPTED PURSUANT TO SECTION 906 OF THE SARBANES-OXLEY ACT OF 2002
In connection with the Annual Report on Form 10-K for the year ended December 31, 2019 of The PNC Financial Services Group, Inc. (Corporation) as filed with the Securities and Exchange Commission on the date hereof (Report), I, William S. Demchak, Chairman, President and Chief Executive Officer of the Corporation, hereby certify, pursuant to 18 U.S.C. Section 1350, as adopted pursuant to Section 906 of the Sarbanes-Oxley Act of 2002, to the best of my knowledge, that:
(1) The Report fully complies with the requirements of Section 13(a) of the Securities Exchange Act of 1934; and
(2) The information contained in the Report fairly presents, in all material respects, the financial condition and results of operations of the Corporation for the dates and periods covered by the Report.
This certificate is being made for the exclusive purpose of compliance by the Chief Executive Officer of the Corporation with the requirements of Section 906 of the Sarbanes-Oxley Act of 2002, and may not be used by any person or for any reason other than as specifically required by law.
/s/ William S. DemchakWilliam S. DemchakChairman, President and Chief Executive Officer
February 28, 2020

EXHIBIT 32.2
In accordance with Exchange Act Rules 13a-14(f) and 15d-14(f), this certification does not relate to Interactive Data Files as defined in Rule 11 of Regulation S-T.
CERTIFICATION BY CHIEF FINANCIAL OFFICER PURSUANT TO 18 U.S.C. SECTION 1350,
AS ADOPTED PURSUANT TO SECTION 906 OF THE SARBANES-OXLEY ACT OF 2002
In connection with the Annual Report on Form 10-K for the year ended December 31, 2019 of The PNC Financial Services Group, Inc. (Corporation) as filed with the Securities and Exchange Commission on the date hereof (Report), I, Robert Q. Reilly, Executive Vice President and Chief Financial Officer of the Corporation, hereby certify, pursuant to 18 U.S.C. Section 1350, as adopted pursuant to Section 906 of the Sarbanes-Oxley Act of 2002, to the best of my knowledge, that:
(1) The Report fully complies with the requirements of Section 13(a) of the Securities Exchange Act of 1934; and
(2) The information contained in the Report fairly presents, in all material respects, the financial condition and results of operations of the Corporation for the dates and periods covered by the Report.
This certificate is being made for the exclusive purpose of compliance by the Chief Financial Officer of the Corporation with the requirements of Section 906 of the Sarbanes-Oxley Act of 2002, and may not be used by any person or for any reason other than as specifically required by law.
/s/ Robert Q. ReillyRobert Q. ReillyExecutive Vice President and Chief Financial Officer
February 28, 2020

Stock ListingThe common stock of The PNC Financial Services Group, Inc.
is listed on the New York Stock Exchange under the symbol PNC.
Stock Transfer Agent and RegistrarComputershare
462 South 4th Street, Suite 1600
Louisville, KY 40202
800-982-7652
www.computershare.com/pnc
Shareholder Services The PNC Financial Services Group, Inc. Dividend Reinvestment and Stock
Purchase Plan enables registered holders of common stock to conveniently
reinvest dividends and purchase additional common shares. Obtain a prospectus
and enroll at www.computershare.com/pnc or contact Computershare at
800-982-7652. Direct deposit of dividends, online account access, sale of
shares, and other services are available through Computershare.
74375.indd 7 3/4/20 10:38 AM

Corporate Headquarters
The PNC Financial Services Group, Inc.
The Tower at PNC Plaza
300 Fifth Avenue
Pittsburgh, PA 15222-2401
74375.indd 8 3/4/20 10:38 AM