on your marks deloitte deleveraging asia 2018...the global loan portfolio market has over the last...
TRANSCRIPT
On your marks...Deloitte Deleveraging Asia 2018

Introduction 02
Market overview 04
China 10
Indonesia 16
Thailand 22
Vietnam 28
Malaysia 34
Singapore 38
Philippines 42
Japan 46
South Korea 50
India 56
Contents
Will Newton Head of Strategic Advisory, Portfolio Lead Advisory Services
Andrew Orr Asia Head & Global Transactions Leader, Portfolio Lead Advisory Services
David Edmonds Global Head, Portfolio Lead Advisory Services
Chi‑Nang Kong Managing Director and Head of South East Asia (incl. China coverage), Portfolio Lead Advisory Services
Hardip Bhatti Director, Portfolio Lead Advisory Services China & South East Asia
Contacts
01
On your marks... | Deloitte Deleveraging Asia 2018
Introduction
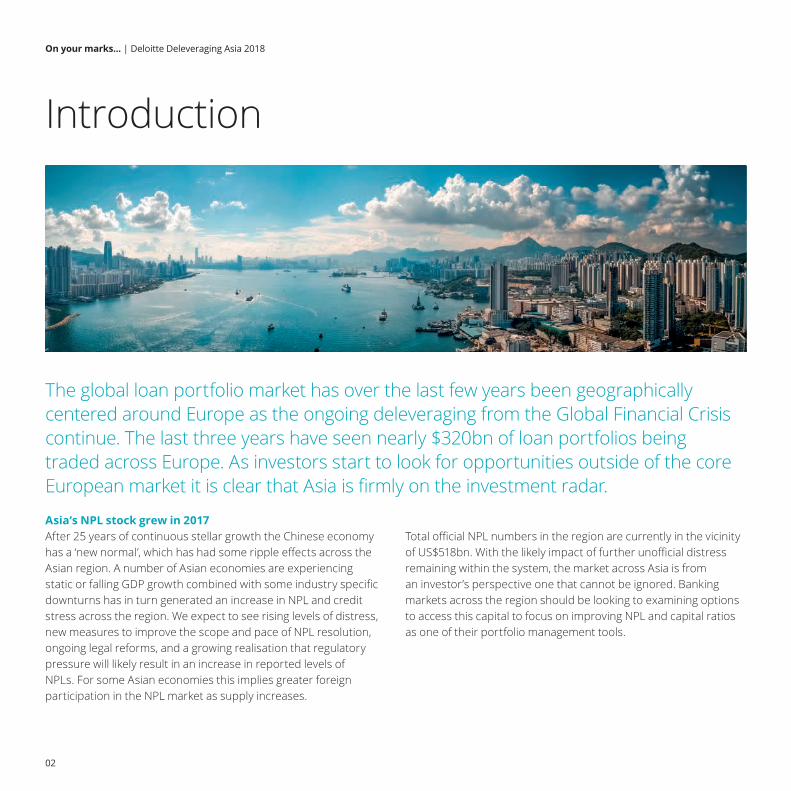
The global loan portfolio market has over the last few years been geographically centered around Europe as the ongoing deleveraging from the Global Financial Crisis continue. The last three years have seen nearly $320bn of loan portfolios being traded across Europe. As investors start to look for opportunities outside of the core European market it is clear that Asia is firmly on the investment radar.
Asia’s NPL stock grew in 2017After 25 years of continuous stellar growth the Chinese economy has a ‘new normal’, which has had some ripple effects across the Asian region. A number of Asian economies are experiencing static or falling GDP growth combined with some industry specific downturns has in turn generated an increase in NPL and credit stress across the region. We expect to see rising levels of distress, new measures to improve the scope and pace of NPL resolution, ongoing legal reforms, and a growing realisation that regulatory pressure will likely result in an increase in reported levels of NPLs. For some Asian economies this implies greater foreign participation in the NPL market as supply increases.
Total official NPL numbers in the region are currently in the vicinity of US$518bn. With the likely impact of further unofficial distress remaining within the system, the market across Asia is from an investor’s perspective one that cannot be ignored. Banking markets across the region should be looking to examining options to access this capital to focus on improving NPL and capital ratios as one of their portfolio management tools.
02
On your marks... | Deloitte Deleveraging Asia 2018

IFRS 9The ongoing implementation of regulatory, accounting and other initiatives developed in response to the global financial crisis will also contribute to an increase in Asian NPL stock with the introduction of IFRS 9 likely to play a leading role. Policymakers developed the impairment rules in IFRS 9 in response to the global financial crisis, which exposed the lack of foresight in banks’ credit impairment estimates.
Many banks globally have already implemented IFRS 9, but have found this a real struggle from a data, process and disclosure perspective. Whilst provisions will increase the materiality of this will continue to depend on robust detection of under and non-performing loans. In Europe, supervisors are relentlessly focusing on the quality of IFRS 9 implementation and on NPL stock resolution. Much depends on whether the Asian regulators will follow a similarly robust approach in the future.
Legal reforms continueWith the exception of some countries, the legal environment that enables asset recovery in Asia remains challenging. It is often characterised by delay, uncertainty and excessive cost. Although recovery and enforcement actions are theoretically achievable within set time limits, it is common for enforcement proceedings to run on longer than prescribed while court rulings can also be inconsistent.
In several jurisdictions reform appears to be imminent. In Malaysia the Companies Bill is expected to make collateral recovery easier; in India the Insolvency and Bankruptcy Bill passed in 2016 seeks to become an overarching legislation that should reduce the time to resolution, while in Vietnam legal reforms that would focus foreclosure on the right to assets and speed the foreclosure process are under discussion. All of this is positive for the ongoing development of individual NPL markets within the region.
03
On your marks... | Deloitte Deleveraging Asia 2018

After a sustained period of growth, the past year in China has seen a continuing ramp up in the process of deleveraging – largely aimed at supporting the official policies to address concerns of the risk positioning of the financial sector. The growth in the use of debt for equity swaps, non-performing loan (NPL) securitisation and distressed debt management foreign buyers have been increasingly participating in a market that has seen lower levels of activity since the onset of the financial crisis in 2008. To that end we have seen total issuances in the NPL securitisation market reach US$3.3bn (RMB 21.14bn) during the period from the restart of NPL securitisation trial programme in 2016 to August 2017 according to the statistical data of Shanghai Securities News.
Distressed debt in the Indonesian banking sector has been increasing since 2008 and NPL growth has accelerated in the past three years. NPL volumes reached US$10.1bn in June 2017 (giving an NPL ratio of 3%, the ratio having nearly doubled since 2013). SMLs reached US$17bn meaning combined NPL and SML reached 8.2%. Domestic banks have not as yet been under significant regulatory pressure to resolve these growing NPL volumes, but given the regulatory changes expected in the imminent future, this is likely to change.
NPLs are mainly concentrated in the ‘big 4’ state-owned banks where certain laws restrict portfolio transactions. The market has seen a number of foreign banks attempt to dispose of their NPLs over the last 12 months.
Thailand is one regional economy with a historically active NPL market. Gross NPL volumes reached US$11.6bn in July 2017, representing a 20% year‑on‑year increase. Reported NPL levels are highest in the manufacturing, consumer and retail sectors, which combined make up around 80% of total NPLs. The banking sector has already shed a significant amount of NPLs in recent years driven by growing regulatory pressure; most distressed assets have been sold to two state-owned AMCs, Bangkok Commercial Assets Management and Sukhumvit Asset Management. Over the last 18 months we have seen the re-emergence of foreign participants in the local market with Bain Capital, Apollo and Lone Star entering into various portfolio opportunities.
Market overview
04
On your marks... | Deloitte Deleveraging Asia 2018

The banking sector in Vietnam is characterized by its size relative to the large number of banks, both domestic and foreign. It is dominated by a few state controlled banks; Vietcombank, Vietinbank, BIDV and Agribank. Widespread policy‑driven lending has resulted in high levels of domestic credit and a growing NPL ratio. Real NPL levels began to increase during 2011 following a general economic downturn and a decline in the real estate market. At the end of 2017 the reported NPL ratio was 2.3%, however this did not include NPLs sold to Vietnam Asset Management Corporation and special mention loans. When including these loans the State Bank of Vietnam estimates the NPL ratio would be closer to 8%.
Vietnam Asset Management Corporation was established in 2013 and absorbed over US$9bn of NPLs from various banks in the country. However the current legal environment that surrounds the resolution and transfer of NPLs/collateral remains the main barrier to an active loan portfolio market.
In Malaysia total NPL volume in the banking sector amounted to US$6.6bn at Q3 2017. A rise in unemployment and weaker economic growth is likely to result in a further increase in household NPLs. Commercial NPLs have been concentrated in the energy and mining sectors; with these sectors comprising only 1.6% of total system NPLs combined, but NPL rates in both sectors are rising.
In Singapore the banking system is resilient amid an uncertain environment and banks have strong liquidity and capital buffers but should remain vigilant. The banking system’s ratio of NPLs was 2% in the beginning of 2017, up from 1.6% the previous year and following a decade of low NPL ratios. Exposures to slowing regional economies and to the energy industry have contributed to the modest rise in NPLs – most bank exposures are in regional economies other than Singapore.
05
On your marks... | Deloitte Deleveraging Asia 2018

The gross NPL ratio of Philippine banks has been gradually declining since the Asian financial crisis, having peaked at around 17% from a pre‑crisis level of 3.5%. The banking sector’s NPL total reached US$3.2bn as of September 2017, with an NPL ratio of 1.91%. Total NPLs from thrift and rural banks amounted to US$1.1bn, up by 14.5% from the previous year. This sector is under pressure to restructure, consolidate and clean up their balance sheets, and the Philippine Deposit Insurance Company (PDIC), has closed hundreds of thrift and rural banks since 2008.
The NPL ratio in Japan as of March 2017 was 1.3% and is expected to remain stable while interest rates remain low. As a result NPL sales are not commonplace and transactions that do take place tend to be small in value as regional banks tidy up their balance sheets. This is a far cry from the late 1990s when the Japanese NPL market flourished in the aftermath of the ‘bubble’ economy. Japan’s post-bubble NPLs were largely resolved by around 2000, giving way to sub-performing and restructuring plays.
In South Korea the NPL ratio was 1.0% at the end of 2017. Over 90% of NPLs are corporate loans. Typically, NPL ratios are higher in specialized banks (average of 3.5%) compared to domestic banks where NPL ratios average 2.6% and nationwide banks at 1.8%.
06
On your marks... | Deloitte Deleveraging Asia 2018
The Indian banking sector has been slow in recognising and impairing stressed assets, and deteriorating asset quality in sectors like steel, infrastructure and textiles remain to be fully addressed. Recent measures by the Reserve Bank of India (RBI) to get banks to correctly classify and provide for loans has resulted in the Indian banking sector seeing a significant increase in stressed assets, which have approximately doubled from 2013 levels to an estimated US$154bn in 2017. The government has also enacted several reforms and new regulations in a bid to streamline NPL resolution. These include steps to make transactions between banks and Asset Reconstruction Companies (ARCs) more transparent and more recently empowering the RBI to direct commercial banks to initiate insolvency proceedings against defaulted borrowers in accordance with the Insolvency and Bankruptcy Code (IBC) which came into effect in 2016.
Outlook for 2018 and beyondSo what does this mean for NPL markets across the region, and will we see an influx of investors – and investment – pouring into Asia over the coming years? Given the activity and sentiment expressed over the last 12 months, it certainly looks that way. A number of international investors have attempted to benefit from first‑mover advantage, acquiring small portfolios across the region in an attempt to familiarise themselves with legal and servicing frameworks. This has not only enabled investors to enhance their understanding of local markets, but also set up business to allow for the acquisition of further, bigger portfolios across the region as the market develops.
Clearly there are challenges which must be overcome; legal frameworks require amendment, bid/ask spreads need to tighten and banks must also face up to the reality of their true NPL issues rather than extending and pretending. However, regulatory changes and the introduction of IFRS 9 are likely to be key drivers in forcing the banks’ hands to clean up their balance sheets and address the true scale of the NPL problem.
07
On your marks... | Deloitte Deleveraging Asia 2018

China$254bn*
India$150bn
Malaysia$6bn
Singapore$7bn
$1bn $227bn
NPLs total c. $518bn in South East Asia, China, India and Japan
Source: IMF, Central banks. Based on official 2016 data. *Indicates 2017 data. All values are in US$
08
On your marks... | Deloitte Deleveraging Asia 2018
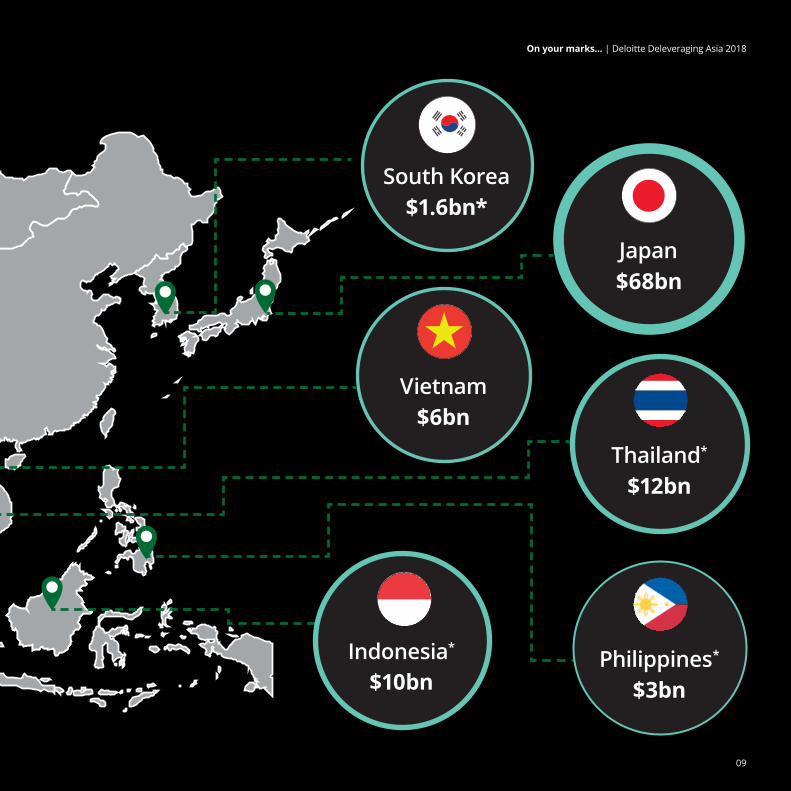
Thailand*
$12bn
Japan$68bn
Vietnam$6bn
Indonesia*
$10bnPhilippines*
$3bn
South Korea$1.6bn*
09
On your marks... | Deloitte Deleveraging Asia 2018


ChinaMacroeconomic landscapeFollowing 25 years of continuous growth the Chinese economy is now experiencing an adjustment to a “new normal”. In part this growth has been fueled by an equally rapid expansion in credit at all levels of the economy including corporations, so called state owned enterprises (SOEs), local government enterprises and individuals. Not surprisingly there has been an increase in the overall stock of NPLs – both from the sheer volume of credit but also arising from the increasing challenges to credit quality that a slowdown in economic activity will inevitably generate. The policy makers in China have this firmly on their radar and continue to progressively introduce measures aimed at a systematic deleveraging of the economy.
Banking landscape and NPL developmentThe Chinese Banking market is characterized by a significant concentration amongst a few very large players with the four major banks, Industrial and Commercial Bank of China (ICBC), China Construction Bank (CCB), Bank of China (BoC) and Agricultural Bank of China (ABC) collectively holding some 47.2% market share in the banking sector (36.7% in the total financial banking institutions sector, which covers both banks and other non-banking institutions). By Q3 2017, with US$13.1trn (RMB 88.15trn) in assets, these entities alone are similar in size and scale to the entirety of the US banking market. Clearly when looking for opportunities they provide a strong indicator of potential market activity.
The slowdown in the growth of the Chinese and global economy has continued to focus the attention of policy makers and regulators alike within China. We have seen a progressive increase in the nominal and relative level of NPLs within the banking sector with each respectively achieving US$254.2bn (RMB 1,705.7bn) and 1.74% at Q4 2017. Whilst the obvious cause for concern is being progressively addressed, it should provide an opportunity for increasing the level of participation in the distressed debt market in China.
China Region average
Source: Economist Intelligence Unit. F = forecast
China real GDP growth
2007
2008
2009
2010
2011
2012
2013
2014
2015
2016
2017
F
2018
F
2019
F
2020
F
0%
2%
4%
6%
8%
10%
12%
14%
16%
Source: World Bank
Bank debt to GDP ratio
100%
110%
120%
130%
140%
150%
160%
20172016201520142013201220112010
China East Asia & Pacific
11
On your marks... | Deloitte Deleveraging Asia 2018

Market opportunities should also be enhanced through the implementation of further reforms aimed at the so called “shadow banking” market. The previously unbridled proliferation of wealth management products is being firmly addressed through the introduction of restrictions in distribution, fees and product structure. As this sector is increasingly regularized (and potentially being brought back on balance sheet) there is the possibility for a further increase in the official levels of NPLs. Add to that the impact of the debt for equity swap regime and the ground is set for supporting the continued development of the distressed debt market.
Chinese provisioning rules allow banks to hold their NPLs off balance sheet provided there is no loss expected), or are classified as investments rather than loans. As such it is important to consider off‑balance sheet lending when it comes to assessing distressed debt levels in China.
Development of the AMCsChina is no stranger to the need for managing large distressed debt issues. A critical element of the re-capitalisation of the banking sector in the late 1990’s and early 2000’s was the creation of what have now emerged as the big four in asset management. China Huarong, China Great Wall, China Orient and China Cinda asset management corporations (AMC) were initially charged with the task of acquiring distressed debt from the four major banks and then progressively re-structuring and repackaging those acquisitions in the following ten years. These organisations continue to grow and diversify their operations in light of the continued establishment of China Banking Regulatory Commission (CBRC) approved provincial AMCs. Authorisation by the CBRC is critical as this overcomes the restriction of only being able to acquire assets from regulator approved AMCs – notwithstanding the fact that non-approved AMCs are still able to acquire distressed single loans from an authorized banking institution.
“ We have seen a progressive increase in the nominal and relative level of NPL within the banking sector, which provides an opportunity for increasing the level of participation in the distressed debt market in China.”
Banking system NPL volume and ratio
Other banks
Source: CBRC, IMF 2016 data. Other institutions include rural and local cooperatives. 2015 and 2016 data for other institutions not available
Total banking system State-owned banks, joint stock banks and city banks
0
200
400
600
800
1000
1200
1400
1600
1800
20172016201520142013201220112010
Volume (RMB bn) NPL ratio (%)
0.0
0.2
0.4
0.6
0.8
1.0
1.2
1.4
1.6
1.8
2.0
12
On your marks... | Deloitte Deleveraging Asia 2018
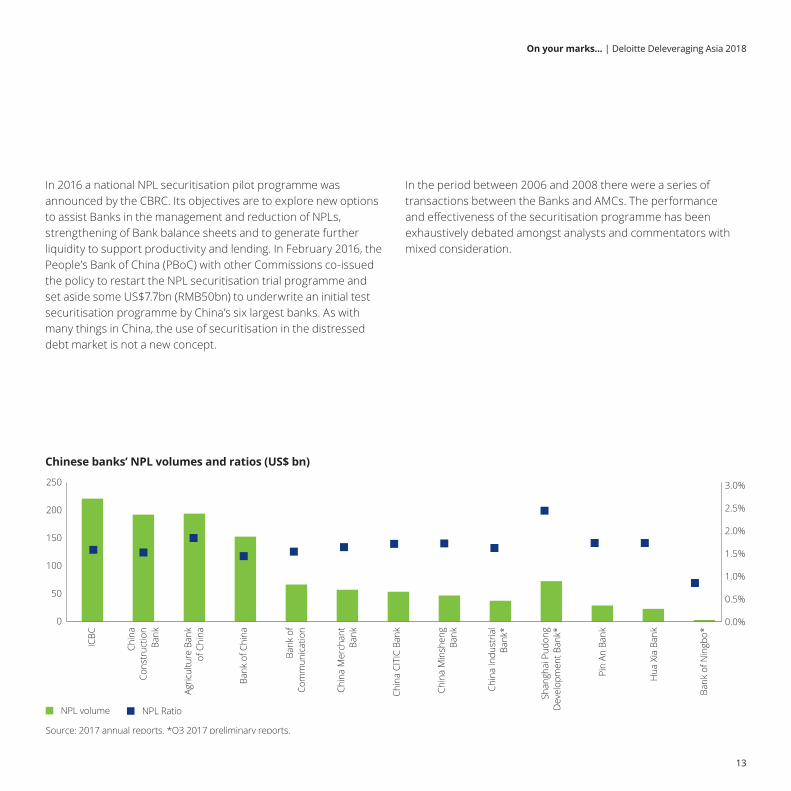
In 2016 a national NPL securitisation pilot programme was announced by the CBRC. Its objectives are to explore new options to assist Banks in the management and reduction of NPLs, strengthening of Bank balance sheets and to generate further liquidity to support productivity and lending. In February 2016, the People’s Bank of China (PBoC) with other Commissions co‑issued the policy to restart the NPL securitisation trial programme and set aside some US$7.7bn (RMB50bn) to underwrite an initial test securitisation programme by China’s six largest banks. As with many things in China, the use of securitisation in the distressed debt market is not a new concept.
In the period between 2006 and 2008 there were a series of transactions between the Banks and AMCs. The performance and effectiveness of the securitisation programme has been exhaustively debated amongst analysts and commentators with mixed consideration.
Chinese banks’ NPL volumes and ratios (US$ bn)
Source: 2017 annual reports. *Q3 2017 preliminary reports.
NPL volume NPL Ratio
0
50
100
150
200
250
ICBC
Chin
aCo
nstr
uctio
nBa
nk
Agric
ultu
re B
ank
of C
hina
Bank
of C
hina
Bank
of
Com
mun
icat
ion
Chin
a M
erch
ant
Bank
Chin
a CI
TIC
Bank
Chin
a M
insh
eng
Bank
Chin
a In
dust
rial
Ban
k*
Shan
ghai
Pud
ong
Dev
elop
men
t Ban
k*
Pin
An B
ank
Hua
Xia
Ban
k
Bank
of N
ingb
o*
0.0%
0.5%
1.0%
1.5%
2.0%
2.5%
3.0%
13
On your marks... | Deloitte Deleveraging Asia 2018

Key buyersLegal and regulatory constraints, combined with a general level of concern over the transparency and quality of data within the market have meant that many international investors have been largely absent from the distressed debt market over the last decade. The market continues to be dominated by authorized AMC’s, predominantly the big four AMCs which collectively acquired some US$32bn worth of NPLs (original book value of RMB207.1bn from 515 troubled asset packages) in 2014 alone. Although there has been growth in the number of provincial AMCs, they remain challenged from a capital perspective, particularly when considering the potential volume of distressed debt that could be expected to emerge in the coming years.
Foreign investors are beginning to show an interest in Chinese NPLs in the past couple of years with a number of high profiled buyers actively engaging in the acquisition cycle. On average these transactions have been relatively small in size – largely thought to be used to test the market and also to establish servicing capabilities. However, larger deal sizes are available and are likely to increase as investor sentiment continues to build.
Servicing landscapeServicing has long been a point of contention in the China market. Restrictions on the mechanism to enforce collateral have meant that servicing can tend to be provided through combining local lawyers and financial advisors under private AMC structures.
National and provincial authorized AMC’s, NPL servicing is generally conducted in-house with sales involving foreign investors be outsourced to a variety of local servicers.
The shortage in local servicers combined with the geographic diversity of the NPLs themselves continues to be problematic for those who are looking to build a pan-China servicing business. Some alternative approaches include the acquisition of a local operator in a preferred province, or partner with local investors to jointly co‑invest (for example in 2015 the private equity firm Clearwater Capital acquired an onshore asset management and loan servicing company – Fan Ya Tai).
China NPL ratio by industry
Source: CBRC, 2016. More recent data not available
0%
1%
2%
3%
4%
5%
Who
lesa
le &
Re
tail
trad
e
Man
ufac
turin
g
Min
ing
Oth
er
Cons
truc
tion
Real
Est
ate
Pers
onal
14
On your marks... | Deloitte Deleveraging Asia 2018

“ Foreign investors are beginning to show an interest in Chinese NPLs in the past couple of years with a number of high profiled buyers actively engaging in the acquisition cycle.”
Regulatory and structural challengesCircular 6, jointly issued by the Ministry of Finance and the CBRC regulates the sale of loan portfolios, more specifically the sale of NPLs relating to state owned and consumer assets and applies to all sales of loans by local banks to the AMC’s. It remains unclear whether this circular applies to foreign banks.
NPL transactions can be ruled invalid on various grounds, including if a broad ‘public interest’ exists, and local governments retain the first right of refusal in the process of selling NPLs out of the AMCs. Foreign investors are required to obtain National Development and Reform Commission (NDRC) consent, in a process that potentially can take up to three months or more. Given the recently announced changes in the regulatory structures within China, it is unclear whether this requirement will remain unchanged.
Enforcement can be a lengthy and costly processEnforcement of collateral in China is highly dependent on the court process. The typical timeline is approximately two years but this obviously could vary significantly given the individual circumstances of each case. Although there has been a progressive enhancement of the legal framework over the recent years, it is worthwhile noting that enforcement proceedings could exceed the statutory time limits, court practices may vary across China and local government procedures could similarly vary.
OutlookGiven the progressive move to a “new normal” for the Chinese economy, the number or NPLs available for sale arising from the measures that have been introduced to drive toward active management of the NPL position of the industry and the outright capital position of the AMC’s the prospects for increased foreign investor participation are high. With a number of large and high profile investors setting up structures and a strategies to participate in the market – it is clear that the opportunity exists for further expansion of the market to a broader range of players.
15
On your marks... | Deloitte Deleveraging Asia 2018


IndonesiaMacroeconomic landscapeAfter a decade long boom in demand for Indonesian commodities, Indonesian growth has slowed. Weaker domestic consumption (responsible for around 54% of GDP as at Q3 2016) has impacted the retail sector in particular. However, the appointment of a new finance minister has boosted confidence in the government’s ability to deal with economic challenges; the Indonesian government is eager to increase foreign investment and has released a series of reforms to liberalise FDI and improve the business climate. A new tax amnesty has also been established with the aim of generating inflows from wealthy individuals.
Banking landscape and NPL developmentThe banking sector faces challenges from the economic slowdown of China and the depreciation of the rupiah against the US dollar. Nonetheless, the bond market continues to be attractive from a yield perspective as it has one of the highest lending rates in the world.
The government continues to have a significant involvement with the banking sector, a legacy from the Asian banking crisis in the late 90’s. Four of the top ten banks, by total asset, are state owned. There are more than 100 banks in Indonesia and the five largest (Bank Mandiri, Bank Rakyat Indonesia, Bank Central Asia, Bank Negara Indonesia and Bank CIMB Niaga) account for over 50% of total banking assets.
In July 2012 the central bank introduced a ruling capping the foreign investment size at 40%. Shareholders who own more than 40% and have not obtained a waiver from the Financial Services Authority (OJK) will need to sell their shares by 2019. Given the large number of banks in Indonesia, OJK has been driving consolidation in the market. The OJK has typically been willing to allow a greater than 40% shareholding where the transaction leads to consolidation of two Indonesian banks.
Source: Economist Intelligence Unit. F = forecast
Indonesia real GDP growth
2000
2001
2002
2003
2004
2005
2006
2007
2008
2009
2010
2011
2012
2013
2014
2015
2016
2017
F20
18F
2019
F20
20F
0%
2%
4%
6%
8%
10%
Indonesia Region average
Source: The World Bank
Bank debt to GDP ratio
20%
40%
60%
80%
100%
120%
140%
2016201520142013201220112010
Indonesia East Asia & Pacific
17
On your marks... | Deloitte Deleveraging Asia 2018

Banking system NPL volume and ratioIDR bn
Source: Financial Service Authority (OJK)
NPL NPL Ratio
0
20,000
40,000
60,000
80,000
100,000
120,000
140,000
160,000
Q2'172016201520142013201220112010200920080.0%
0.5%
1.0%
1.5%
2.0%
2.5%
3.0%
3.5%
For example, in June 2015 the OJK approved China Construction Bank’s acquisition of Bank Windu Kentjana International and Bank Antardaerah, and also approved Shinhan Bank of Korea’s acquisition of a 40%+ stake in Bank Metro Express and Centratama Nasional Bank.
Distressed debt in the banking sector has been increasing steadily since 2008 and NPL growth has accelerated in the past three years. NPL volumes reached US$9.8bn in April 2016 (giving an NPL ratio of 3%, the ratio having nearly doubled since 2013) and impacting banks’ profitability through rising provisions for bad debt. Distressed loans are classified into several categories; NPLs are loans that are 90 days or more overdue, and special mention loans (SMLs) which are loans that are 2‑90 days overdue. Growing NPL levels are seen across all industries, although the wholesale & retail trade and processing sectors make up nearly 50% of total NPLs. Mining has seen the largest year-on-year NPL growth, following the downturn in the global commodities market. The bulk of NPLs are held by state‑owned banks and enterprises, which are not allowed to sell at a loss.
Recent developmentsDuring the last 12 months a number of foreign banks have sought to address their NPL problem via the exploration of NPL sales. Banks are aware of the need to clean up their balance sheets and keep NPL ratios below the regulatory threshold (5%). There has been a number of failed deals in the market mainly due to pricing expectations and poor sales processes. The only deal of size was the sale of a corporate loan portfolio by Permata Bank.
Other banks have also been in discussions with advisors regarding pricing expectations. However given the aspiration to not sell at a loss coupled with high investor IRRs, banks have decided to hold fire on bringing these portfolios to market just yet.
Top Indonesian banks’ NPL/SML volumes and ratios
NPL ratio
Source: Bank Annual Reports
SML ratioNPL SML
0
5
10
15
20
25
30
Bank BCABank CIMB NiagraBank BNIBank BRIBank Mandiri0%
1%
2%
3%
4%
5%
6%
7%
IDR bn
18
On your marks... | Deloitte Deleveraging Asia 2018
Increased regulatory pressure and the adoption of IFRS 9 are likely to force banks to consider proactive divestments.
Another method adopted by foreign banks to keep NPL ratios low, is the establishment of asset management units (AMU) in the form of non-bank entities that are owned by an overseas parent. For example, Japanese‑owned PT. Bank J Trust Indonesia, set up an AMU in the form of a non‑bank entity and transferred its NPL stock, reducing the NPL ratio from 12.24% in 2014 to 6.98% at the end of 2016. However this does not really resolve the NPLs from an economic perspective.
Lack of specific regulation on loan sale transactionsIn 2012 the Indonesian Constitutional Court issued a ruling preventing state banks (but not private banks) from restructuring or selling NPLs at a discount. This represents a significant challenge to the industry where the main overhang of NPLs is within state banks.
Asset-backed securitisation (known as Collective Investment Contract Asset Backed Securities or KIK‑EBA) has historically been used as a structure to securitise performing loans. However, there is no specific recommended approach on how to manage NPLs. The lack of regulatory guidance may allow buyers to be flexible on the structure of investments although securitisation may still require approval from the OJK.
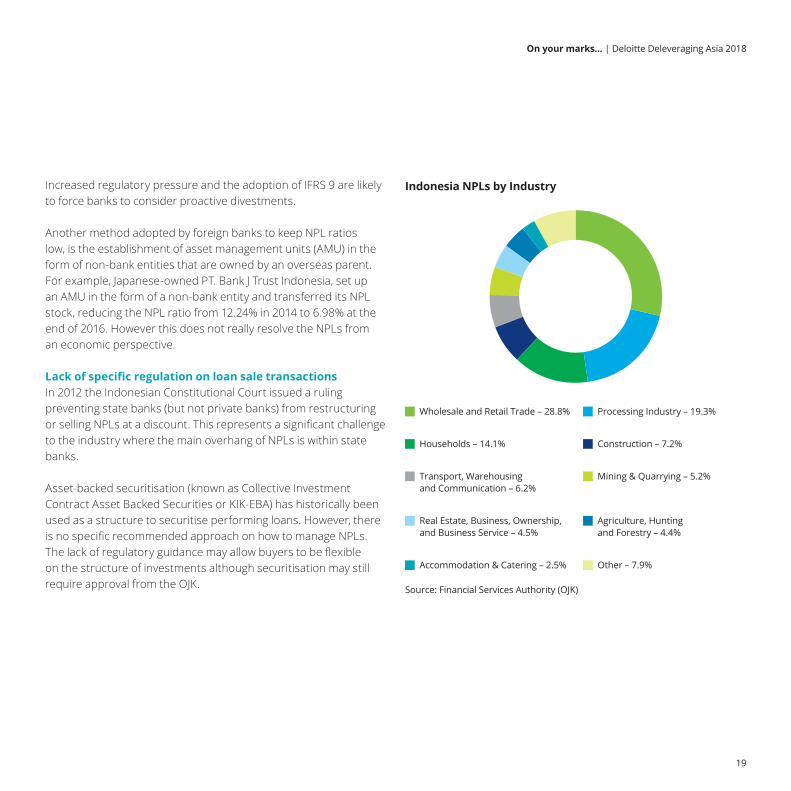
Indonesia NPLs by Industry
Wholesale and Retail Trade – 28.8%
Households – 14.1%
Transport, Warehousing and Communication – 6.2%
Real Estate, Business, Ownership, and Business Service – 4.5%
Accommodation & Catering – 2.5%
Processing Industry – 19.3%
Construction – 7.2%
Mining & Quarrying – 5.2%
Agriculture, Hunting and Forestry – 4.4%
Other – 7.9%
Source: Financial Services Authority (OJK)
19
On your marks... | Deloitte Deleveraging Asia 2018
Servicing landscapeServicing options are limited in Indonesia as is typical in undeveloped loan sales markets. At present only large banks and multi‑finance companies have the capability and infrastructure in place to provide servicing. However, large banks may not be appropriately placed to provide such services whilst multi‑finance companies may lack the relevant expertise.
Nonetheless, establishing a servicing company remains a challenging process in Indonesia due to the lack of government guidelines around the licences required to operate such an entity. In some cases law firms have assisted domestic and foreign entities to speed-up collection from companies and retail customers.
Uncertainty remains around enforcement proceduresThe two main avenues for insolvency in Indonesia are bankruptcy and suspension of debt payment obligations (known as PKPU). Both are relatively easy to initiate, but due to a lack of comprehensive legal provisions and extended timelines, they are not creditor‑friendly in practice. Debtors can use the PKPU process to win time to prepare a restructuring proposal as no petition for bankruptcy can be initiated against the debtor during the process and PKPU decisions are immune from legal challenge.
In the event of default the enforcement of a security must be conducted via a public auction, provided that the creditor has the power of attorney. Conducting a public auction does not require court involvement, however, in most cases court approval is obtained as buyers are unlikely to bid for any assets in a disputed enforcement process without such a court approval. Filing for auction does not always run smoothly, especially where the creditor has no power of attorney or if the security is also being claimed by other parties. In the event of bankruptcy or liquidation, the secured creditor retains the right to priority payment, although enforcement processes are subject to conflicting interpretations.
OutlookOver the last 12 months Indonesia has shown signs of being the most promising market for NPL investors across the SEA region. Banks are actively seeking solutions for the disposal of their NPL loans however, expectations around pricing have yet to be set. As at Q2 2017 the reported NPL volume in Indonesia was US$10.1bn. This number is likely to increase once IFRS 9 is formally adopted across Indonesia and therefore it is only a matter of time before the banks seek initiatives and assistance from foreign investors in helping to remedy the NPL issue.
20
On your marks... | Deloitte Deleveraging Asia 2018

“After a decade long boom in demand for Indonesian commodities, Indonesian growth has slowed. Weaker domestic consumption (responsible for around 54% of GDP as at Q3 2016) has impacted the retail sector in particular. However, the appointment of a new finance minister has boosted confidence in the government’s ability to deal with economic challenges; the Indonesian government is eager to increase foreign investment and has released a series of reforms to liberalise FDI and improve the business climate.”
21
On your marks... | Deloitte Deleveraging Asia 2018

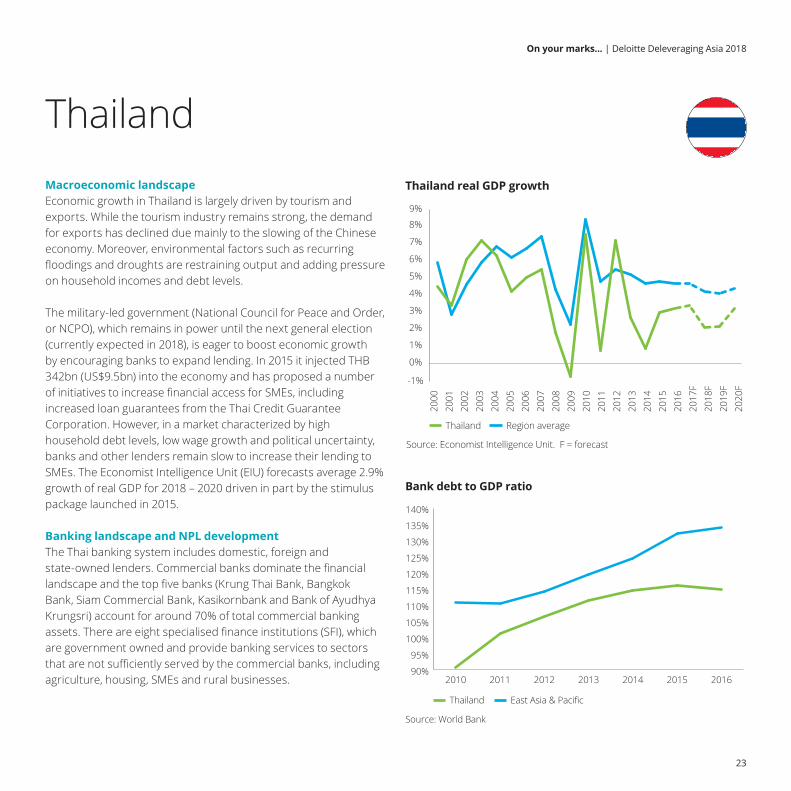
ThailandMacroeconomic landscapeEconomic growth in Thailand is largely driven by tourism and exports. While the tourism industry remains strong, the demand for exports has declined due mainly to the slowing of the Chinese economy. Moreover, environmental factors such as recurring floodings and droughts are restraining output and adding pressure on household incomes and debt levels.
The military-led government (National Council for Peace and Order, or NCPO), which remains in power until the next general election (currently expected in 2018), is eager to boost economic growth by encouraging banks to expand lending. In 2015 it injected THB 342bn (US$9.5bn) into the economy and has proposed a number of initiatives to increase financial access for SMEs, including increased loan guarantees from the Thai Credit Guarantee Corporation. However, in a market characterized by high household debt levels, low wage growth and political uncertainty, banks and other lenders remain slow to increase their lending to SMEs. The Economist Intelligence Unit (EIU) forecasts average 2.9% growth of real GDP for 2018 – 2020 driven in part by the stimulus package launched in 2015.
Banking landscape and NPL developmentThe Thai banking system includes domestic, foreign and state‑owned lenders. Commercial banks dominate the financial landscape and the top five banks (Krung Thai Bank, Bangkok Bank, Siam Commercial Bank, Kasikornbank and Bank of Ayudhya Krungsri) account for around 70% of total commercial banking assets. There are eight specialised finance institutions (SFI), which are government owned and provide banking services to sectors that are not sufficiently served by the commercial banks, including agriculture, housing, SMEs and rural businesses.
Source: Economist Intelligence Unit. F = forecast
Thailand real GDP growth
2000
2001
2002
2003
2004
2005
2006
2007
2008
2009
2010
2011
2012
2013
2014
2015
2016
2017
F20
18F
2019
F20
20F
-1%
0%
1%
2%
3%
4%
5%
6%
7%
8%
9%
Thailand Region average
Source: World Bank
Bank debt to GDP ratio
90%
95%
100%
105%
110%
115%
120%
125%
130%
135%
140%
2016201520142013201220112010
Thailand East Asia & Pacific
23
On your marks... | Deloitte Deleveraging Asia 2018

Under current regulations, foreign banks can buy up to 25% of a Thai bank without Bank of Thailand (BOT) approval and acquisitions beyond 49% require approval from the Ministry of Finance (MOF).
In 2016 Thailand’s total loans reached US$39bn, and overall lending is expected to grow by an average of 7.3% a year in the period 2018‑2020. Gross NPL volume reached US$11.6bn in Q2 2017, representing a 20% year‑on‑year increase. NPL levels are highest in the manufacturing, consumer and retail sectors, which combined make up around 80% of total NPLs. Declining household income particularly in the manufacturing and export sectors has prompted a rise in consumer loans, predominantly personal and credit card loans.
State‑owned AMCs dominate the loan sale marketHistorically Thailand has had an active loan sales market. The banking sector has shed a significant amount of NPLs in recent years driven by growing regulatory pressure to meet banking reserve requirements.
“ The manufacturing, consumer and retail sectors are seeing the highest NPL volumes, accounting for nearly 80% of total NPLs in the banking system.”
Banking system NPL/SML volume and ratio
Source: Bank of Thailand
NPL SML SML Ratio NPL Ratio
THB bn
0
50
100
150
200
250
300
350
400
450
Q2 17201620152014201320122011201020090%
1%
2%
3%
4%
5%
6%
Top Thai banks’ NPL volumes and ratios
Source: 2016 annual reports
NPL NPL Ratio
THB bn
0
10
20
30
40
50
60
70
80
90
100
Bank ofAyudha
KasikornbankSiamCommercial
Bank
BangkokBank
KrungthaiBank
0.0
0.5
1.0
1.5
2.0
2.5
3.0
3.5
4.0
4.5
5.0
24
On your marks... | Deloitte Deleveraging Asia 2018

A number of banks (e.g. Siam Commercial Bank, TMB Bank, Bank of Ayudhya Krungsri) have been selling portfolios for a number of years, appealing to local investors who are often able to cherry pick selected tranches. Due to the lack of investor capital and foreign investments, portfolios are often carved up into small tranches to facilitate sales. Nonetheless, with the increase in NPL volumes, the portfolios from banks are becoming larger (>$500m GBV) and there has been a shift towards commercial and SME loans from predominantly retail assets. This potentially opens the market to foreign investors with greater firepower and varied asset class expertise.
Distressed assets to date have been sold to the two state-owned AMCs: Bangkok Commercial Assets Management (BAM) and Sukhumvit Asset Management (SAM). In 2015 BAM bought a total of US$751m worth of NPLs from financial institutions, and at the end of 2015, the two AMCs held US$2.3bn and US$1bn of assets respectively.
Bid prices have increased significantly over the past couple of years driven in part by competition between SAM and BAM. More than 30 other AMCs also participate in the market, although they tend to be small and focused on unsecured or hire-purchase loans. Given the noticeable increase of NPL volumes in the country, large institutional investors have started to consider acquiring or establishing licensed platforms in preparation for future loan trades. More recently there have been a few small deals in the market including Apollo’s acquisition of CSG, Bain’s acquisition of Standard Chartered’s NPL business and SSG’s acquisition of a loan servicing platform from GE Capital.
Regulatory and structural challengesInvestors have to use an AMC as a vehicle to acquire NPLs. AMC investments are covered under the ‘AMC Decree’.
Thailand NPLs by Industry
Personal Consumptions – 25.2%
Wholesale and retail trade; repair of motor vehicles and motorcycles – 24.2%
Real estate activities – 6.7%
Public Utilities & Transportation – 1.5%
Financial and insurance activities – 0.8%
Manufacturing – 28.2%
Services – 6.8%
Construction – 3%
Agriculture forestry and fishing – 0.9%
Mining and Quarrying – 2.6%
Source: Bank of Thailand
However, with the increase in NPL stock coming to market, it is unlikely that the capital available to SAM and BAM will be sufficient to absorb all portfolios, paving the way for support from foreign players.
25
On your marks... | Deloitte Deleveraging Asia 2018

The AMC Decree provides legal rights over loan collateral, enforcement of claims, and the continuity of interest. In 2012 the Bank of Thailand passed legislation allowing banks to purchase NPLs from other banks and local legal entities, although there are certain limitations. International investors purchasing real estate through the acquisition of a portfolio can only do so via a locally incorporated AMC. As nominee structures are prohibited in Thailand, investors need a trusted local partner or can apply for an appropriate Foreign Business License. The process of licensing an AMC usually takes four to six months. However, if the AMC is a Thai majority owned company, a Foreign Business License is not required and the licensing process is reduced to around two months.
Legal enforcement frameworkMethods of enforcement vary depending on the type of security being enforced. Under the Thai Civil and Commercial Code (CCC) mortgage loan and asset finance loan collateral may be enforced only after notice has been issued to the debtor. In the event the debt remains unpaid the creditor can initiate a court order to seize the asset and sell it at public auction.
The main insolvency procedures in Thailand are bankruptcy and liquidation. In bankruptcy proceedings, after the court has issued the bankruptcy order, the power to manage the business of the company is vested in the official receiver. A liquidation can be initiated by either a special resolution passed at the shareholders’ meeting, by a court decision or after the company has been declared bankrupt and the absolute receivership process has been completed.
The Business Security Act (BSA) effective on 2 July 2016 expands the types of assets that Thai entities can use as securities for their financing. Enforcement of securities is a shorter process than enforcement of mortgages as court proceedings are not required under the BSA, although the BSA requires an enforcement event to be registered with the Business Security Registration Office.
OutlookPortfolio sales within Thailand have recently been dominated by small, multi‑tranched offerings. SAM and BAM have been able to digest the vast majority of NPLs being sold within the market with local investors acquiring smaller loan books. As NPL volumes increase the volume of sales and portfolio sizes are likely to grow. This is likely to put a capital constraint on the current market buyers. In addition, the combination of a mature NPL acquisition framework and tested legal enforcement framework has caught the attention of a number of international investors.
26
On your marks... | Deloitte Deleveraging Asia 2018
“Economic growth in Thailand is largely driven by tourism and exports. While the tourism industry remains strong, the demand for exports has declined due mainly to the slowing of the Chinese economy. Moreover, environmental factors such as recurring floodings and droughts are restraining output and adding pressure on household incomes and debt levels.”
27
On your marks... | Deloitte Deleveraging Asia 2018

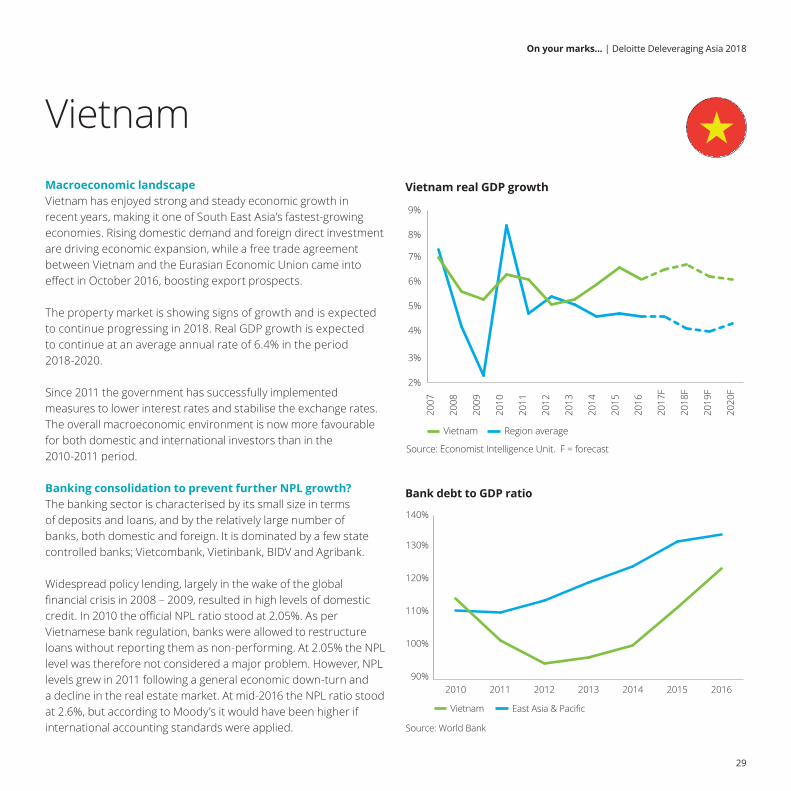
VietnamMacroeconomic landscapeVietnam has enjoyed strong and steady economic growth in recent years, making it one of South East Asia’s fastest-growing economies. Rising domestic demand and foreign direct investment are driving economic expansion, while a free trade agreement between Vietnam and the Eurasian Economic Union came into effect in October 2016, boosting export prospects.
The property market is showing signs of growth and is expected to continue progressing in 2018. Real GDP growth is expected to continue at an average annual rate of 6.4% in the period 2018-2020.
Since 2011 the government has successfully implemented measures to lower interest rates and stabilise the exchange rates. The overall macroeconomic environment is now more favourable for both domestic and international investors than in the 2010-2011 period.
Banking consolidation to prevent further NPL growth?The banking sector is characterised by its small size in terms of deposits and loans, and by the relatively large number of banks, both domestic and foreign. It is dominated by a few state controlled banks; Vietcombank, Vietinbank, BIDV and Agribank.
Widespread policy lending, largely in the wake of the global financial crisis in 2008 – 2009, resulted in high levels of domestic credit. In 2010 the official NPL ratio stood at 2.05%. As per Vietnamese bank regulation, banks were allowed to restructure loans without reporting them as non‑performing. At 2.05% the NPL level was therefore not considered a major problem. However, NPL levels grew in 2011 following a general economic down‑turn and a decline in the real estate market. At mid‑2016 the NPL ratio stood at 2.6%, but according to Moody’s it would have been higher if international accounting standards were applied.
Source: Economist Intelligence Unit. F = forecast
Vietnam real GDP growth
2007
2008
2009
2010
2011
2012
2013
2014
2015
2016
2017
F
2018
F
2019
F
2020
F
2%
3%
4%
5%
6%
7%
8%
9%
Vietnam Region average
Source: World Bank
Bank debt to GDP ratio
90%
100%
110%
120%
130%
140%
2016201520142013201220112010
Vietnam East Asia & Pacific
29
On your marks... | Deloitte Deleveraging Asia 2018

In a bid to overhaul the banking industry the government approved a restructuring plan in 2012, at the peak of the bank liquidity crisis. The ultimate objective was to prevent further NPL growth through banking sector consolidation by using the balance sheets of healthier lenders to support the weaker ones. State intervention in the banking sector is also rising with the State Bank of Vietnam (SBV) taking over struggling lenders, such as the Vietnam Construction Bank in February 2015.
Government measures to tackle the rising NPL volumesIn 2013 the SBV set up the Vietnam Asset Management Company (VAMC) to buy banks’ NPLs in exchange for a special class of bonds. The bonds are provisioned at 20% per annum and can be used as collateral to secure capital from the SBV. All banks with an NPL ratio of above 3% are required to sell NPLs to VAMC. Since its inception VAMC has acquired US$9.4bn of NPLs from various banks; in order to speed up the process the VAMC is planning to begin purchasing additional NPLs, providing banks with fresh capital to extend new loans. It aims to realise its target of purchasing between VND 70trn (US$3.17bn) and VND 100trn (US$4.74bn) worth of bad debts in total.
“ With the establishment of the VAMC the government has managed to delay the negative effect of NPLs, but the issue still remains.”
Total banking system NPLs
Source: State Bank of Vietnam. Data for gross NPL for 2016 and H1 2017 not available
Gross NPL NPL Ratio
VND bn
112000
114000
116000
118000
120000
122000
124000
126000
128000
130000
132000
H1 201720161H 201620152014201320120.0%
0.5%
1.0%
1.5%
2.0%
2.5%
3.0%
3.5%
4.0%
4.5%
30
On your marks... | Deloitte Deleveraging Asia 2018
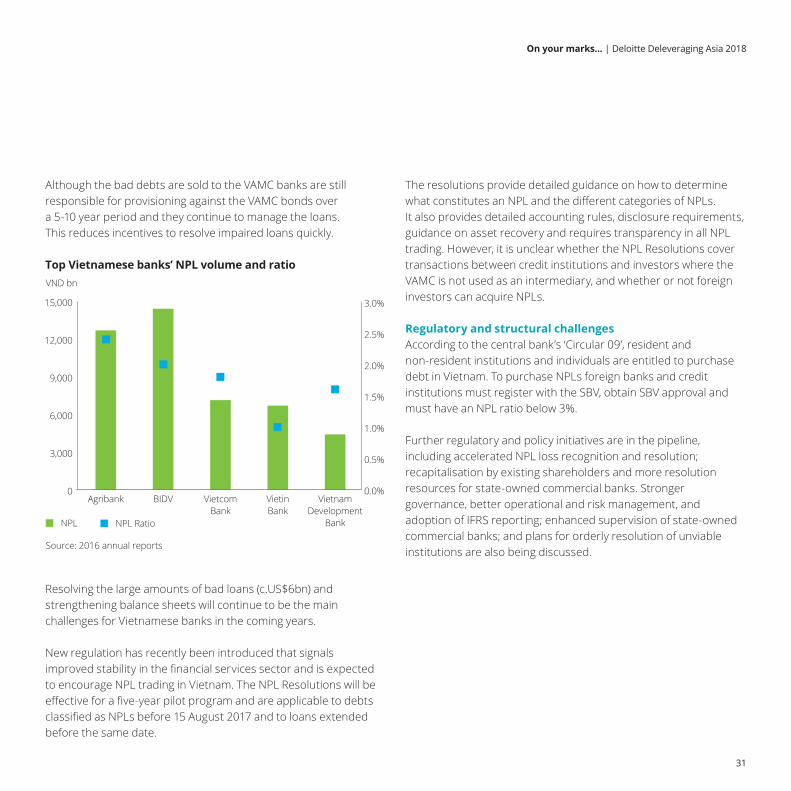
Although the bad debts are sold to the VAMC banks are still responsible for provisioning against the VAMC bonds over a 5‑10 year period and they continue to manage the loans. This reduces incentives to resolve impaired loans quickly.
Top Vietnamese banks’ NPL volume and ratio
Source: 2016 annual reports
NPL NPL Ratio
VND bn
0
3,000
6,000
9,000
12,000
15,000
VietnamDevelopment
Bank
VietinBank
VietcomBank
BIDVAgribank0.0%
0.5%
1.0%
1.5%
2.0%
2.5%
3.0%
Resolving the large amounts of bad loans (c.US$6bn) and strengthening balance sheets will continue to be the main challenges for Vietnamese banks in the coming years.
New regulation has recently been introduced that signals improved stability in the financial services sector and is expected to encourage NPL trading in Vietnam. The NPL Resolutions will be effective for a five‑year pilot program and are applicable to debts classified as NPLs before 15 August 2017 and to loans extended before the same date.
The resolutions provide detailed guidance on how to determine what constitutes an NPL and the different categories of NPLs. It also provides detailed accounting rules, disclosure requirements, guidance on asset recovery and requires transparency in all NPL trading. However, it is unclear whether the NPL Resolutions cover transactions between credit institutions and investors where the VAMC is not used as an intermediary, and whether or not foreign investors can acquire NPLs.
Regulatory and structural challengesAccording to the central bank’s ‘Circular 09’, resident and non-resident institutions and individuals are entitled to purchase debt in Vietnam. To purchase NPLs foreign banks and credit institutions must register with the SBV, obtain SBV approval and must have an NPL ratio below 3%.
Further regulatory and policy initiatives are in the pipeline, including accelerated NPL loss recognition and resolution; recapitalisation by existing shareholders and more resolution resources for state-owned commercial banks. Stronger governance, better operational and risk management, and adoption of IFRS reporting; enhanced supervision of state-owned commercial banks; and plans for orderly resolution of unviable institutions are also being discussed.
31
On your marks... | Deloitte Deleveraging Asia 2018

Key buyersVietnam does not have an active loan sales market as only AMCs have been allowed to engage in debt trading. The VAMC has historically been the key buyer of NPLs and the new government initiative allowing it to purchase NPLs at market prices is likely to increase sales. The Debt and Asset Trading Corporation (DATC) also buys impaired assets outright with a haircut. However, these transactions are not frequent and only limited to a number of state‑owned enterprises. To attract greater foreign interest the government is considering allowing the VAMC to sell debts at a loss and therefore narrowing the price gap.
There are still a number of shortcomings in the regulatory and legal framework across Vietnam which are in the process of being addressed. Investors often find there to be too many unnecessary administrative hurdles to overcome when acquiring or transferring assets, in addition to an unnecessarily slow disposal process. Coupled with a lack of financial incentives to complete half‑finished projects and slow real estate price increases across the country, there is both scope and appetite for an overhaul of the reforms in order to attract foreign investors.
Enforcement a lengthy and costly processEnforcement in Vietnam is a lengthy procedure whereby if debtors are unwilling to accept the foreclosure of property to settle the debt, there will be several rounds of auctions to sell the collateral at the highest price possible. Due to the unpredictability of the courts it is common for enforcement proceedings to run on longer than the statutory time limits; a successful foreclosure of collateral can take more than four months, and costs are high.
Legal reforms are under discussion: a change that would focus foreclosure on the right to assets rather than ownership could speed the foreclosure process, although at present this is no more than a possibility.
Lack of servicing capabilitiesThere are currently few professional servicing companies present in the Vietnamese market. Banks tend to conduct NPL servicing in‑house or through the use of their AMCs. When buying NPLs foreign investors have to rely on the originator of the loans for servicing or enter a cooperation contract with a national AMC for servicing. The servicing landscape is complicated due to the weak legal enforcement and lack of legal framework for asset liquidation.
OutlookWhilst the VAMC has been successful in providing banks with a solution to reduce NPL levels, in practice it operates more as a warehousing vehicle than a proactive clean-up agency. Challenges to resolve NPLs in the country still persist due to structural and legal issues. However, should the reforms push through, this could be another promising market for international investors given the NPL volumes both at bank and VAMC levels.
“ Vietnam is increasingly open to foreign investors, especially under its commitments as a member of the WTO and with the newly signed Trans‑Pacific Partnership.”
32
On your marks... | Deloitte Deleveraging Asia 2018

“Vietnam has enjoyed strong and steady economic growth in recent years, making it one of South East Asia’s fastest-growing economies. Rising domestic demand and foreign direct investment are driving economic expansion, while a free trade agreement between Vietnam and the Eurasian Economic Union came into effect in October 2016, boosting export prospects.”
33
On your marks... | Deloitte Deleveraging Asia 2018


MalaysiaMacroeconomic landscapeMalaysia’s real GDP growth was 4.3% for 2016 (falling from 5.0% in 2015 and from 6.0% in the year before), the slowest pace since the 2008 – 2009 global financial crisis. The main factors for such slow growth were the regional and global slowdown and the low energy prices. A projected increase in oil prices would be well received and EIU expects the economy to grow in 2018 – 2020 with average annual growth of 4.2%, with government consumption expected to expand at a 5.4% annual rate.
Banking landscape and NPL developmentThe banking sector is characterised by a large number of banks (87 in total), 27 of which were locally incorporated conventional lenders. There are also 16 Islamic banks, 11 investment banks and 3 international Islamic banks. The main banks are Maybank, CIMB Bank, Public Bank, RHB Bank and AmBank. Generally, the Malaysian banks are well capitalised and have high liquidity levels.
Declining loan growth experienced since 2013 has put increasing pressure on banks’ revenues and earnings and they are set to come under more sustained margin pressure as asset quality deteriorates. The recent decision by the central bank, Bank Negara Malaysia (BNM), to cut the overnight policy rate is unlikely to help stimulate loan growth as current household debt levels are already high, whilst large corporations are increasingly raising funds on the capital market rather than through bank lending. However, the government is encouraging banks to extend lending to SMEs. Total NPL volume in the banking sector amounted to US$5.8bn at H1 2016. Household sector NPLs fell in 2015 by 1.7% to US$2.1bn although Malaysia still has high levels of household debt accounting for 89% of GDP (as of 2015). A rise in unemployment (3.2% as of 2016), weaker economic growth and slowing growth in real may result in a further increase in household NPLs.
Source: Economist Intelligence Unit. F = forecast
Malaysia real GDP growth
2007
2008
2009
2010
2011
2012
2013
2014
2015
2016
2017
F
2018
F
2019
F
2020
F
-2%
-1%
0%
1%
2%
3%
4%
5%
6%
7%
8%
9%
Malaysia Region average
Commercial NPLs have been concentrated in the energy, mining and shipping sectors, and this is expected to continue as companies affected by the fall in commodity prices continue to adjust. Mining and energy NPLs comprise only 1.6% of total system NPLs combined, but NPL rates in both sectors are rising (by six-fold and three‑fold respectively in the last 18 – 24 months).
NPLs of banks are less concentrated in Malaysia. With regional expansion in previous years, some NPLs of Malaysian banks are to international borrowers in China and Indonesia.
35
On your marks... | Deloitte Deleveraging Asia 2018

Moreover, the explicit reporting of NPL ratios has been discontinued by Malaysian financial institutions since 2010 due to the changes in reporting rules set by the government.
Servicing landscapeDebt servicing in Malaysia can be established either via an AMC or through debt collection agencies. National and provincial AMCs typically service debt in-house, while debt sales involving foreign investors have previously resulted in AMCs being retained to service the portfolios acquired.
Regulatory and structural challengesAll NPL transactions are governed by the Financial Services Act 2013 and by the previously issued Guidelines on the Disposal/Purchase of Non‑Performing Loans. Banks can sell NPLs to domestic banking institutions or locally incorporated companies that are majority owned by domestic shareholders, and to domestic and foreign investors. Transactions involving investors (both domestic and foreign) must be conducted through a Malaysian incorporated and tax‑resident special purpose vehicle in which the foreign ownership is capped at 49%. Approval from BNM is required before any information on borrowers is disclosed, even in a due diligence exercise. In the event that BNM deems the sale as a material part of the seller’s business it also requires approval from the Ministry of Finance.
Banks are required to notify the borrower of the sale, unless loan documents pertaining to the NPLs expressly permit the banking institution to sell or transfer the loan. A vesting order can also be obtained from the court to vest the rights and liabilities connected with the NPLs to the buyer. This route is the most efficient way of implementing the transfer of large NPL portfolios (rather than executing specific documents for each loan).
“ Mining and energy NPLs comprise only 1.6% of total system NPLs combined, but NPL rates in both sectors have risen six-fold and three-fold respectively in the last 18 – 24 months.”
Total banking system NPLs
Source: Bank Negara Malaysia. Note: 2016 NPL% is as of Q4 2016
NPL NPL Ratio
0
5
10
15
20
25
30
35
40
Sept'17*
201620152014201320122011201020092008
RM bn
0%
1%
2%
3%
4%
5%
6%
36
On your marks... | Deloitte Deleveraging Asia 2018

Legal enforcement frameworkThe new Companies Act 2016 came in to force on 31 January 2017, and aims to simplify processes relating to company incorporation, capital restructuring, corporate governance and financial reporting. New provisions in relation to corporate rescue mechanisms (e.g. corporate voluntary arrangement and judicial management) are currently not covered by the Act. These mechanisms are likely to be implemented in the next two years. The possible restructuring and insolvency procedures in Malaysia are schemes of arrangement, receiverships and wind‑up. A scheme of arrangement is a court‑approved compromise or arrangement between the company and its creditors that can be initiated by the debtor, creditors or the liquidator of the company. Once the creditors voted in favour of the compromise and the court approves the proposition, a reorganization or restructuring plan is put in place.
The Companies Act 2016 governs the process of compulsory and creditors’ voluntary winding up. Both processes are commonly used in Malaysia and will result in the appointment of an external officeholder (liquidator) to the company.
A receivership can co‑exist alongside a liquidation. A secured creditor under the terms of a debenture can appoint a receiver (or receiver and manager) to act as an external officeholder over a company. The purpose of appointing a receiver is to allow him/her to take possession of and sell the secured assets, and use the realization of funds to repay the secured creditor for their claims.
In the event that debt remains unpaid following a litigation process, enforcement proceedings will be granted in favor of the creditor and the collateral may be foreclosed. For mortgage loans, National Land Code charges are sold by way of judicial auction (this usually takes eight to twelve months) or land office auction (usually taking six to twelve months). However, some charges provide for sale by Assignment (a non‑judicial auction) which allows the whole process to be completed within six months.
OutlookMalaysia has not historically had an active portfolio sales market. Portfolio sales activities are likely to be opportunistic by banks in the Malaysian market given factors such as the stringent BNM rules regarding approvals to share loan documents, locally incorporated subsidiaries and foreign shareholding ownership restrictions, the country has not typically been seen as an easy proposition by foreign investors. Nonetheless, we see Malaysia as a market that foreign investors should maintain on their watch list.
Top Malaysian banks’ NPL volume and ratio
Source: Q2 2017 interim reports
NPL NPL Ratio
RM bn
0
2
4
6
8
10
12
14
BankRakyat
Malaysia
PublicBank
RHBBank
CIMB GroupHoldings
Maybank0.0%
0.5%
1.0%
1.5%
2.0%
2.5%
3.0%
3.5%
37
On your marks... | Deloitte Deleveraging Asia 2018


SingaporeMacroeconomic landscapeSingapore’s macro-economic outlook has weakened in the last year following the slowdown in China and the wider Asian region. The manufacturing and services sectors are dominant. However, the economy is reliant on exports to drive growth which leaves Singapore susceptible to cyclical changes in global demand.
A well capitalised banking systemThere are 124 commercial banks in Singapore, the vast majority in foreign ownership. Some 31% of loans are classified as housing related and a further 20% are classified as building and construction related.
In Singapore the November 2017 Financial Stability Review noted that the banking system remains resilient with strong capital and liquidity buffers to withstand shocks. The overall NPL ratio declined slightly to 2.1% in Q3 2017, from 2.2% in Q3 2017, indicating an improvement in asset quality. The aggregate NPL ratio of the local banking groups remains low at 1.6%, up 0.4% from 2016 following a decade of low NPL ratios.
Local banking groups’ capital and liquidity positions remain strong and have robust capital and liquidity positions. Exposures to slowing regional economies and to the energy industry (i.e. declining oil prices) have contributed to the modest rise in NPLs – most bank exposures are in regional economies other than Singapore.
Source: Economist Intelligence Unit. F = forecast
Singapore real GDP growth
2000
2001
2002
2003
2004
2005
2006
2007
2008
2009
2010
2011
2012
2013
2014
2015
2016
2017
F20
18F
2019
F20
20F-2%
0%
2%
4%
6%
8%
10%
12%
14%
16%
18%
Exposures to regional economies and the oil and gas industries, which are experiencing slowdowns, have contributed to this rise in NPLs. This trend is to be expected given the low rate of NPLs prior to economic conditions weakening.
Singapore’s three local banks (Development Bank Singapore, United Overseas Bank and OCBC Bank) have built businesses largely focused on Asia and greater China in particular. Each has a slightly different footprint (see chart on page 32).
39
On your marks... | Deloitte Deleveraging Asia 2018

These three banks had overall NPL levels in the range of 1.3% to 1.7% as at Q3 2017.
While the overall NPL level remains low there has been a considerable uptick over the last 12 months with an increase in provisions of 20 – 40%. The NPL percentages shown are calculated on a weighted average basis because of the significant exposure to Singapore, a market where NPLs are in the low range of 0.6% (OCBC), 0.9% (DBS) and 1.3% (UOB).
The banks have more significant NPL exposures in other markets – UOB and OCBC have 4.9% and 3.7% in Indonesia respectively, while DBS reports 4.1% in South and South East Asia (which includes India). DBS has commented that NPLs rose 12% in the most recent quarter and the rise was partly attributed to oil and gas services exposure; UOB attributed increases over the last year to energy and shipping exposures, and OCBC attributed increases to energy exposures.
Total banking system NPLs
Source: IMF
0
2
4
6
8
10
12
201620152014201320122011201020092008
SGD bn
Gross NPLs NPL Ratio
0.0%
0.5%
1.0%
1.5%
2.0%
2.5%
40
On your marks... | Deloitte Deleveraging Asia 2018

Singapore NPLs by country and bank
Source: Q3 2017 interim report
Singapore HK/China SEA RoW
SGD m
0
1,000
2,000
3,000
4,000
5,000
6,000
OCBCUOBDBS
Singapore NPL ratios by country and bank
Source: Q3 2017 interim report
Singapore HK/China SEA RoW Total
0.0% 0.5% 1.0% 1.5% 2.0% 2.5% 3.0% 3.5% 4.0% 4.5% 5.0%
OCBC
UOB
DBS
41
On your marks... | Deloitte Deleveraging Asia 2018


PhilippinesMacroeconomic landscapeThe Philippines remains one of the best economic performers in Asia. In the first half of 2016, GDP grew by 6.9%, making the Philippines the second fastest growing economy in the region after India. Short term economic prospects remain bright and GDP is expected to grow at an average annual rate of 6% in the period 2018 – 2021.
The economy is heavily reliant on the services sector, which accounts for around 58% of GDP. This sector also served as the main driver of growth, with the construction, transport and communication, and real estate subsectors posting the highest year‑on‑year growth. On the demand side, the economy remains heavily dependent on consumer spending, accounting for 69.3% of GDP, although growth in investments and government spending have been the main demand drivers of recent growth.
Notwithstanding the favourable prospects, there are challenges that may hinder the achievement of macroeconomic targets. These include the protracted weak global economy, increased financial market uncertainty, possible shifts in investor sentiment, and potential delays in the government’s infrastructure projects.
Solid banking sector with low NPL volumesThe Philippine banking system is relatively small compared to many of its neighbours in the region in terms of size relative to GDP, but the banking sector remains generally sound and resilient. Asset quality indicators have improved year‑on‑year, while capital adequacy ratios have remained above international standards. Universal and commercial banks (UKBs) continue to dominate the banking sector, accounting for 90% of total assets. The top four banks – BDO Unibank, Metropolitan Bank & Trust, Bank of the Philippine Islands, and Land Bank of the Philippines – hold almost half of the entire assets of the sector.
Source: Economist Intelligence Unit. F = forecast
Philippines real GDP growth
2000
2001
2002
2003
2004
2005
2006
2007
2008
2009
2010
2011
2012
2013
2014
2015
2016
2017
F20
18F
2019
F20
20F
0%
1%
2%
3%
4%
5%
6%
7%
8%
9%
Outstanding loans in the banking system as of June 2016 amounted to US$144.6bn. As a percentage of GDP, domestic credit to the private sector by banks has been rising although it remains relatively low. The growth of the banking sector has been accompanied by a gradual consolidation of banks as well as the exit of weaker players in the banking system (the number of head offices fell from 758 in December 2015 to 618 in June 2016).
The gross NPL ratio of Philippine banks has been gradually declining since the Asian financial crisis, peaking at around 17% from a pre‑crisis level of 3.5%. Following the crisis the government initiated moves to encourage banks and other financial institutions to clean up their balance sheets, but lack of government funds made it difficult for the Philippine government to set up Special Purpose Vehicles (SPVs) and purchase the NPLs of the banking sector itself. Instead, the government provided legal cover and fiscal incentives for the establishment of private SPVs.
43
On your marks... | Deloitte Deleveraging Asia 2018

The Philippine Congress enacted the Special Purpose Vehicle (SPV) Act in 2002, which granted banks and SPVs certain tax exemptions, as well as registration and transfer fee reductions. Although the law has since expired, it is credited with helping clean up the banking sector’s balance sheet and bring down the NPL ratio. Since the expiration of the SPV law, there have been few NPL sale transactions. The most significant have been NPL sales by universal bank Rizal Commercial Banking Corporation and by thrift bank Planters Development Bank to an SPV led by the International Finance Corporation under its Debt and Asset Recovery Program.
The Philippine banking sector’s NPL total reached US$3.2bn as of September 2017, with an NPL ratio of 1.9%.
Philippine UKBs are largely owned by conglomerates that are also active in real estate development, raising some concerns over the banks’ exposure to interconnected borrowers and sectors. More significantly the NPL ratios of thrift and rural banks as of June 2016 reached 4.9% and 11.5%, respectively. Total NPLs from these banks amounted to US$1.1bn, up by 14.5% from the previous year. This sector is under pressure to restructure, consolidate and clean up their balance sheets, and the Philippine Deposit Insurance Company (PDIC), the government depository insurance and regulatory agency, has closed hundreds of thrift and rural banks since 2008.
Legal enforcement frameworkIn the event that a loan becomes due and and remains unpaid, lenders have several legal options. A non‑judicial or judicial foreclosure of mortgaged properties may be undertaken.
Under a non‑judicial foreclosure, the right to redemption is granted to the debtor to redeem or buy back the property within a period of one year from the date of registration of the sale. Although the same right is not normally given under a judicial foreclosure under the General Banking Act, if the creditor is a bank the debtor is given the right to redeem the property judicially foreclosed within one year after the sale of the property.
To date, there are no specific laws in the Philippines addressing the collection of NPLs. Performance of general obligations and contracts remain under the Civil Code and there are still many gaps and questions regarding law enforcement.
Banking sector NPL volume and ratio
Source: Central Bank of the Philippines
PHP bn
NPLs UKBs NPLs Others NPL ratio UKBs NPL ratio Total
0
20
40
60
80
100
120
140
160
180
Sept'17Dec'16Dec'15Dec'14Dec'130.0%
0.5%
1.0%
1.5%
2.0%
2.5%
3.0%
44
On your marks... | Deloitte Deleveraging Asia 2018

Top Philippine banks NPL volumes and ratios
NPL RatioNPL
050
100150200250300350400450500
UnionBankof the
Philippines
RizalCommercial
Banking Corp.
ChinaBanking
Corp.
DevelopmentBank of thePhilippines*
SecurityBankCorp.
PhilippineNationalBank*
Bankof the
PhilippineIslands*
LandBankof the
Philippines*
MetropolitanBank
& TCO
BDOUnibank
Inc.
Source: Capital IQ. As of Q1 2017. *Figures as of December 2016
US$ m
0%
1%
2%
3%
4%
5%
6%
7%
8%
Loans outstanding by activity (PHP bn)
For production – 5,915
Others – 465For household consumption – 790
Others – 1,360
Manufacturing – 860
Real estate – 1,318
Financial and Insurance – 529
Agriculture – 231
Wholesale and retail trade – 946
Energy – 671
Source: Central Bank of the Philippines
45
On your marks... | Deloitte Deleveraging Asia 2018


JapanMacroeconomic landscapeAccording to the EIU, the GDP annual growth rate for Japan was 1.0% in 2016. Growth is forecast to average 0.7% for the period 2018-2020.
Private consumption represents 60% of overall GDP. Towards the end of the decade, the Tokyo 2020 Olympics is expected to boost consumer and business confidence.
Mature banking sector with low NPL levelsThe banking sector is relatively mature. It is largely focused on outward investment given the widespread use of financial products, narrow interest rate spreads, declining population and slow economic growth in Japan.
The Bank of Japan (BOJ) has been pursuing a programme of quantitative and qualitative easing (QQE) since 2013. Low global oil prices and the relative strength of the yen against the US dollar have impacted the BOJ’s efforts to meet its core inflation target of 2%, and faced with a real danger that deflation could return, the BOJ implemented a negative interest rate policy in February 2016 (re‑confirmed in October 2016 when rates were left at – 0.1%), which is adversely affecting the profitability of Japanese banks.
The BOJ is unlikely to push interest rates deeper into negative territory and instead sanction modest changes to the type and maturity of assets that it purchases under its QQE programme. While the BOJ’s policy of continued QQE and negative interest rates will alleviate financial pressures on Japanese companies, there remains a risk that bad debts will increase which could put bank profits under additional pressure.
Source: Economist Intelligence Unit. F = forecast
Japan real GDP growth
2007
2008
2009
2010
2011
2012
2013
2014
2015
2016
2017
F
2018
F
2019
F
2020
F
-6%
-4%
-2%
0%
2%
4%
6%
8%
Japan Region average
Source: World Bank
Bank debt to GDP ratio
90%
100%
110%
120%
130%
140%
2016201520142013201220112010
Japan East Asia & Pacific
47
On your marks... | Deloitte Deleveraging Asia 2018
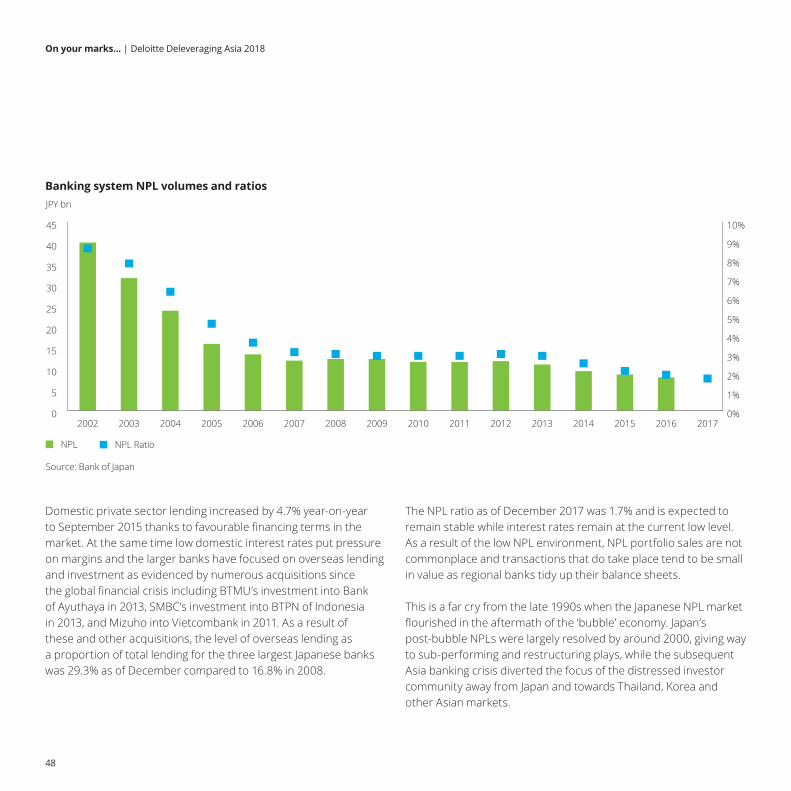
Banking system NPL volumes and ratios
Source: Bank of Japan
NPL NPL Ratio
JPY bn
0
5
10
15
20
25
30
35
40
45
20172016201520142013201220112010200920082007200620052004200320020%
1%
2%
3%
4%
5%
6%
7%
8%
9%
10%
Domestic private sector lending increased by 4.7% year-on-year to September 2015 thanks to favourable financing terms in the market. At the same time low domestic interest rates put pressure on margins and the larger banks have focused on overseas lending and investment as evidenced by numerous acquisitions since the global financial crisis including BTMU’s investment into Bank of Ayuthaya in 2013, SMBC’s investment into BTPN of Indonesia in 2013, and Mizuho into Vietcombank in 2011. As a result of these and other acquisitions, the level of overseas lending as a proportion of total lending for the three largest Japanese banks was 29.3% as of December compared to 16.8% in 2008.
The NPL ratio as of December 2017 was 1.7% and is expected to remain stable while interest rates remain at the current low level. As a result of the low NPL environment, NPL portfolio sales are not commonplace and transactions that do take place tend to be small in value as regional banks tidy up their balance sheets.
This is a far cry from the late 1990s when the Japanese NPL market flourished in the aftermath of the ‘bubble’ economy. Japan’s post-bubble NPLs were largely resolved by around 2000, giving way to sub-performing and restructuring plays, while the subsequent Asia banking crisis diverted the focus of the distressed investor community away from Japan and towards Thailand, Korea and other Asian markets.
48
On your marks... | Deloitte Deleveraging Asia 2018
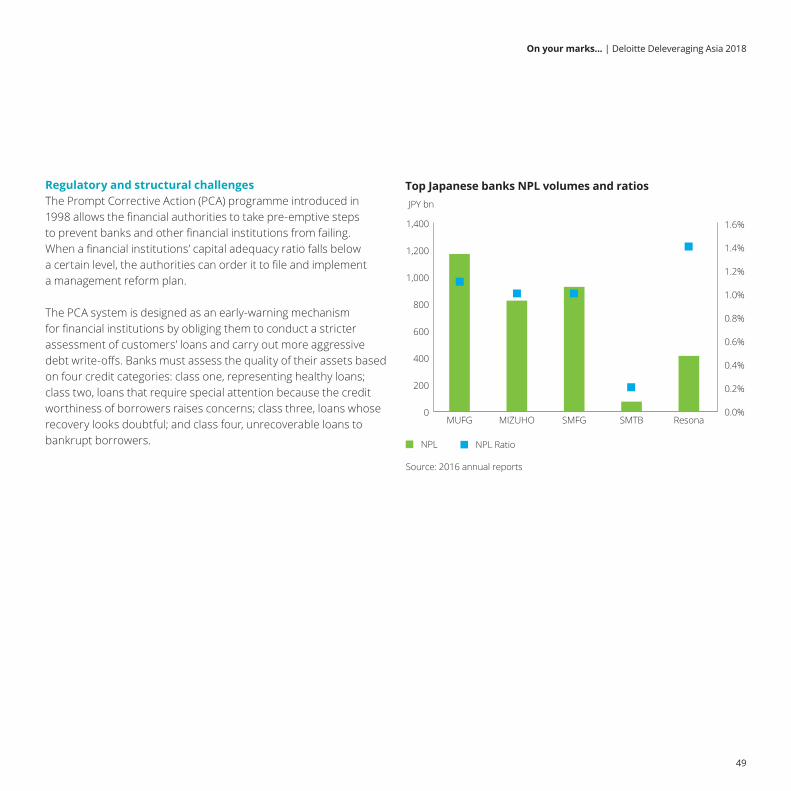
Top Japanese banks NPL volumes and ratios
Source: 2016 annual reports
NPL NPL Ratio
JPY bn
0
200
400
600
800
1,000
1,200
1,400
ResonaSMTBSMFGMIZUHOMUFG0.0%
0.2%
0.4%
0.6%
0.8%
1.0%
1.2%
1.4%
1.6%
Regulatory and structural challengesThe Prompt Corrective Action (PCA) programme introduced in 1998 allows the financial authorities to take pre‑emptive steps to prevent banks and other financial institutions from failing. When a financial institutions’ capital adequacy ratio falls below a certain level, the authorities can order it to file and implement a management reform plan.
The PCA system is designed as an early-warning mechanism for financial institutions by obliging them to conduct a stricter assessment of customers’ loans and carry out more aggressive debt write‑offs. Banks must assess the quality of their assets based on four credit categories: class one, representing healthy loans; class two, loans that require special attention because the credit worthiness of borrowers raises concerns; class three, loans whose recovery looks doubtful; and class four, unrecoverable loans to bankrupt borrowers.
49
On your marks... | Deloitte Deleveraging Asia 2018

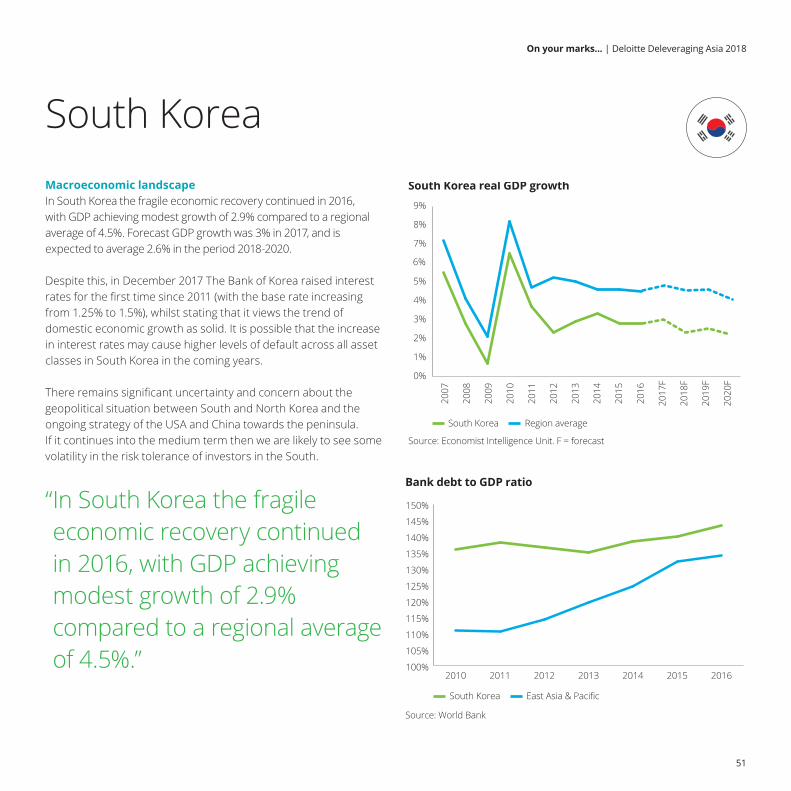
South KoreaMacroeconomic landscapeIn South Korea the fragile economic recovery continued in 2016, with GDP achieving modest growth of 2.9% compared to a regional average of 4.5%. Forecast GDP growth was 3% in 2017, and is expected to average 2.6% in the period 2018-2020.
Despite this, in December 2017 The Bank of Korea raised interest rates for the first time since 2011 (with the base rate increasing from 1.25% to 1.5%), whilst stating that it views the trend of domestic economic growth as solid. It is possible that the increase in interest rates may cause higher levels of default across all asset classes in South Korea in the coming years.
There remains significant uncertainty and concern about the geopolitical situation between South and North Korea and the ongoing strategy of the USA and China towards the peninsula. If it continues into the medium term then we are likely to see some volatility in the risk tolerance of investors in the South.
“ In South Korea the fragile economic recovery continued in 2016, with GDP achieving modest growth of 2.9% compared to a regional average of 4.5%.”
Source: World Bank
Bank debt to GDP ratio
100%
105%
110%
115%
120%
125%
130%
135%
140%
145%
150%
2016201520142013201220112010
South Korea East Asia & Pacific
Source: Economist Intelligence Unit. F = forecast
South Korea real GDP growth
0%
1%
2%
3%
4%
5%
6%
7%
8%
9%
South Korea Region average
2020
F
2019
F
2018
F
2017
F
2016
2015
2014
2013
2012
2011
2010
2009
2008
2007
51
On your marks... | Deloitte Deleveraging Asia 2018

Banking landscape and NPL developmentHistorically, the banking sector was controlled closely by the state, however, in recent years financial institutions have gained greater operational freedom in line with globalisation and the maturity of the economy. Despite this, the current president, Moon Jae‑in, who began his five‑year term in May 2017, has pledged to improve financial supervision and to focus on financial institution governance. Broadly, this may result in banks being encouraged to recognise and deal with non‑performing loans more efficiently.
The privately-owned “bad-bank” United Asset Management has been in operation since 2009 for the purposes of buying and reselling toxic assets. The state‑run Korea Asset Management Corporation (KAMCO) is another major “bad bank” operator, and there are a collection of private firms operating in the secondary market for non-performing assets.
KAMCO was founded in 1962 and later reorganized in 1997 during the financial crisis with the objective to support financial institutions by normalising their asset quality through cleaning up operations and to support corporate restructuring by extending loans, debt-equity swaps, and payment guarantees, as well as to recover public funds through efficient management and disposal of its assets. The development of KAMCO was critical to Korea’s success in resolving NPLs as KAMCO played a market‑making role by minimizing information asymmetries and the lack of creditor coordination. Most notably, KAMCO successfully convinced major international players looking for distressed assets to become interested in the Korean market.
With regards to the current state of the lending market, loan-to-value and debt-to-income ratio rules for home mortgage lending keep the maximum borrowing limit at 70% of the value of the property and the cap on mortgage borrowers’ debt-service cost relative to their income at 60%. These ratios are further reduced to 40% for housing market stabilisation areas designated by the government. On balance, household loans have remained under control and the risk of defaults has been kept in check. Mortgage-loan delinquency rates actually declined through 2013-2016.
Bad loans have been concentrated in the business sector, where potential risks in the shipbuilding, construction, steel, shipping, and other transportation industries have materialised. The ratio of non-performing loans at South Korean banks stood at 1.8% for business loans and 0.26% for household loans at end-June 2017, according to data from the FSS.
“ Historically, the banking sector was controlled closely by the state, however, in recent years financial institutions have gained greater operational freedom in line with globalisation and the maturity of the economy.”
52
On your marks... | Deloitte Deleveraging Asia 2018

Typically, NPL ratios are higher in specialized banks (average of 3.5%) compared to domestic banks where NPL ratios average 2.6% and nationwide banks at 1.8%. This trend is explained by the higher risk sectors that specialized banks typically lend into, and the concentration of their lending towards such sectors.
NPL ratio by type of banks
Source: Financial Stability Report – June 2016 (March 2016 data)
0%
1%
2%
3%
4%
NationwideBanks
Specializedbanks
DomesticBanks
2.60%
3.50%
1.80%
The trend of improving commercial bank asset soundness has continued. During the first quarter of 2017 the amount of new non-performing loans was 1.7trn won, the lowest level since the global financial crisis.
South Korea NPLs by Industry
Other transportation equipment – 33%
Electronics – 12%
Construction – 13%
Real estate & leasing – 5%
Primary metals – 14%
Chemicals – 9%
Shipping – 11%
Wholesale and retail trade – 3%
Source: Financial Stability Report - June 2016
53
On your marks... | Deloitte Deleveraging Asia 2018

The transaction environmentSouth Korea has onerous rules restricting bank ownership as part of the government’s traditional policy focus on restricting the chaebol’s (family controlled industrial conglomerates) control of banks. Strict caps on bank ownership are compounded by regulations on buy-out funds and private equity funds relating to investor qualifications and asset‑allocation requirements. These combine to make bank M&A a highly complex affair, which becomes even more difficult when foreign stakeholders are involved. In principle, non‑financial companies’ ownership in any commercial bank is restricted to 4% (or 15% for regional banks). The limit can be increased to 10% for special cases approved by the FSC.
Since its establishment, KAMCO has managed state-owned properties, purchased and resolved financial institutions NPLs, assisted in the restoration of credit-worthiness of the financially‑underprivileged, restructured corporations, and collected overdue taxes as a quasi‑governmental entity. In 1997, KAMCO started purchasing NPLs with a face value of 4.4trn won from Seoul Bank and Korea First Bank, followed by a purchase of 2.7trn won of NPS from 30 merchant banks. In 1999, KAMCO broke new ground by international securitization of its NPL portfolio through issuance of asset-backed securities.
Key players in the banking sectorThe majority of the key players in the banking sector have shown a downward trend in NPL ratios over the past five years with Shinham Financial Group, KB Financial Group, Hana Financial Group and Woori Bank all reporting NPL ratios of below 0.8% in 2017, and precautionary & below ratios of 1.9% or less.
Korean Development Bank however is demonstrating an upward trend in both precautionary and below and NPL ratio’s with precautionary and below ratios reaching 10.07% in 2017 and NPL ratios 3.56% in the same period.
Total banking system NPLs
Source: Respective Company ReportsData as of September 2017 (except Korea Development Bank, December 2016)
Precautionary & below ratio NPL ratio
0
2
4
6
8
10
12
Kore
a D
evel
opm
ent
Bank
Woo
ri Ba
nkCo
. Ltd
.
Han
a Fi
nanc
iaG
roup
Inc.
KB F
inan
cial
Gro
up In
c.
Shin
han
Fina
ncia
lG
roup
Co.
, Ltd
0.0
0.5
1.0
1.5
2.0
2.5
3.0
3.5
4.0
54
On your marks... | Deloitte Deleveraging Asia 2018
“In South Korea the fragile economic recovery continued in 2016, with GDP achieving modest growth of 2.9% compared to a regional average of 4.5%. Forecast GDP growth was 3% in 2017, and is expected to average 2.6% in the period 2018-2020.”
55
On your marks... | Deloitte Deleveraging Asia 2018

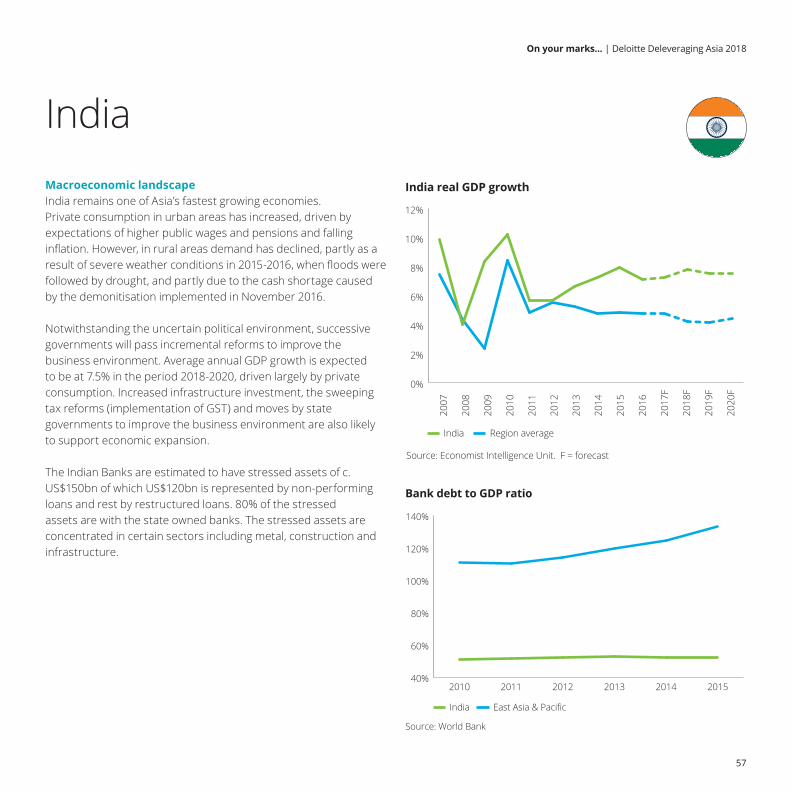
IndiaMacroeconomic landscapeIndia remains one of Asia’s fastest growing economies. Private consumption in urban areas has increased, driven by expectations of higher public wages and pensions and falling inflation. However, in rural areas demand has declined, partly as a result of severe weather conditions in 2015‑2016, when floods were followed by drought, and partly due to the cash shortage caused by the demonitisation implemented in November 2016.
Notwithstanding the uncertain political environment, successive governments will pass incremental reforms to improve the business environment. Average annual GDP growth is expected to be at 7.5% in the period 2018-2020, driven largely by private consumption. Increased infrastructure investment, the sweeping tax reforms (implementation of GST) and moves by state governments to improve the business environment are also likely to support economic expansion.
The Indian Banks are estimated to have stressed assets of c. US$150bn of which US$120bn is represented by non-performing loans and rest by restructured loans. 80% of the stressed assets are with the state owned banks. The stressed assets are concentrated in certain sectors including metal, construction and infrastructure.
Source: Economist Intelligence Unit. F = forecast
India real GDP growth
2007
2008
2009
2010
2011
2012
2013
2014
2015
2016
2017
F
2018
F
2019
F
2020
F
0%
2%
4%
6%
8%
10%
12%
India Region average
Source: World Bank
Bank debt to GDP ratio
40%
60%
80%
100%
120%
140%
201520142013201220112010
India East Asia & Pacific
57
On your marks... | Deloitte Deleveraging Asia 2018

“ India remains one of Asia’s fastest growing economies. Notwithstanding the uncertain political environment, successive governments are likely to pass incremental reforms to improve the business environment.”
Source: Deloitte research
Evolution of gross non‑performing assets
0%
2%
4%
6%
8%
10%
12%
Public Sector Banks
2010 2011 2012 2013 2014 2015 2016
Foreign Banks Private Sector BanksAll Banks
Stress ratio by industrues, share of total credit
Source: RBI Data as of Q2 2017
Stressed advances ratio Share of total credit
0%
5%
10%
15%
20%
25%
30%
35%
40%
45%
50%
Oth
ers
Cem
ent a
ndpr
oduc
ts
Infr
astr
uctu
re
Min
ing
and
quar
ryin
g
Text
iles
Cons
truc
tion
Basi
c m
etal
and
prod
ucts
0%
0.2%
0.4%
0.6%
0.8%
1.0%
1.2%
1.4%
1.6%
The ratio of stressed assets to net worth of the banks is just above 100%. For nationalised banks, the ratio of stressed assets to net worth is around 150% signifying the dire need for recapitalisation. The total stressed assets of the nationalised banks is c.US$130m compared to the net worth of US$87m. In comparison, the private sector has total stressed assets of US$18m compared to net worth of US$55m.
58
On your marks... | Deloitte Deleveraging Asia 2018
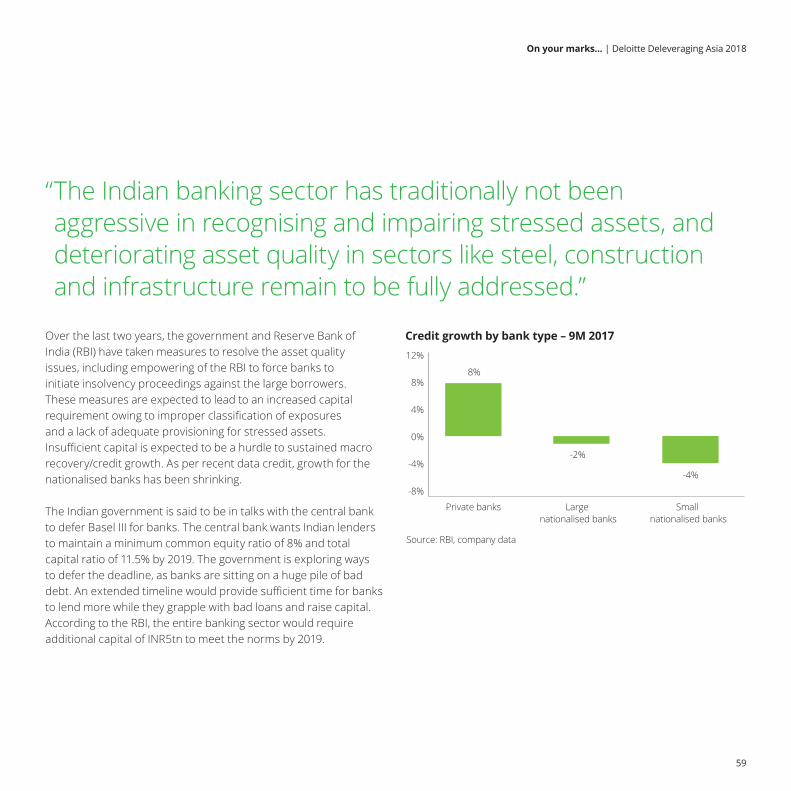
“ The Indian banking sector has traditionally not been aggressive in recognising and impairing stressed assets, and deteriorating asset quality in sectors like steel, construction and infrastructure remain to be fully addressed.”
Over the last two years, the government and Reserve Bank of India (RBI) have taken measures to resolve the asset quality issues, including empowering of the RBI to force banks to initiate insolvency proceedings against the large borrowers. These measures are expected to lead to an increased capital requirement owing to improper classification of exposures and a lack of adequate provisioning for stressed assets. Insufficient capital is expected to be a hurdle to sustained macro recovery/credit growth. As per recent data credit, growth for the nationalised banks has been shrinking.
The Indian government is said to be in talks with the central bank to defer Basel III for banks. The central bank wants Indian lenders to maintain a minimum common equity ratio of 8% and total capital ratio of 11.5% by 2019. The government is exploring ways to defer the deadline, as banks are sitting on a huge pile of bad debt. An extended timeline would provide sufficient time for banks to lend more while they grapple with bad loans and raise capital. According to the RBI, the entire banking sector would require additional capital of INR5tn to meet the norms by 2019.
Credit growth by bank type – 9M 2017
Source: RBI, company data
-8%
-4%
0%
4%
8%
12%
Private banks Large nationalised banks
Small nationalised banks
8%
-2%
-4%
59
On your marks... | Deloitte Deleveraging Asia 2018

Recent measures taken by RBIRBI has been given more powers to deal with the stressed assets problem. As part of this, Banking Regulation (Amendment) Ordinance 2017 was notified by the central government under which the RBI is authorized to direct the commercial banks to initiate an insolvency resolution process for loan default in accordance with the bankruptcy code. The RBI could also issue directions or appoint committees to advise banks on the resolution of stressed assets.
Additionally, the RBI has decided to progressively restrict its investment in SRs backed by their own stressed assets, leading to a true sale of stressed assets by such banks.
RBI is expected to monitor and control the stressed asset resolution plan through internal advisory committees (IAC). Given that personal liability attaches to bank management in case of wilful misconduct preventing decision making, the authoritative directions by RBI will help bankers overcome concerns about their decisions being subsequently probed by vigilance agencies. This protection appears to be the right step as bankers have had concerns especially after the arrest of former banking officials in 2016.
As per RBI, 12 borrower groups, representing about 25% of the gross bad loans in the banking system, would be eligible for immediate reference for bankruptcy proceedings. The IBC has been invoked in some of these cases already. RBI has also asked Banks to invoke insolvency proceedings for cases where a resolution plan is not agreed within 6 months. This is expected to set precedent for smaller cases.
RBI is also expected to issue provisioning guidelines in respect of cases where bankruptcy code has been invoked.
The Insolvency and Bankruptcy Code (IBC)While the Insolvency and Bankruptcy Code (IBC or the Code) was approved in May 2016, it took about a year for the basic infrastructure to be in place with activity picking up from July 2017. This happened when the Reserve Bank of India (RBI) identified 12 large borrowers (forming close to 25% of the banking systems gross non‑performing assets) for resolution under the IBC. The timeline for the resolution of these assets is over the next couple of quarters and market participants are watching proceedings with a keen interest on expected outcomes and precedents these set for future resolutions.
The Code is still evolving as the government and the Insolvency and Bankruptcy Board of India (IBBI) amend and adapt the IBC to strengthen the system and promote transparency. Relevant infrastructure as envisaged under the Code, such as central repository, are also yet to be fully implemented. While the resolution success is limited so far, the imminent decisions on several of the initially referred borrowers, many of which have received investor interest, should open up the distressed investing market in India. While financial creditors have refrained from referring cases to the National Company Law Tribunal (NCLT), only around a third of cases referred to the NCLT towards the end of 2017 came from financial creditors, the RBI has also suggested another 28 borrowers for referral under the IBC if resolution is not achieved through other means. This trend may reverse as banks get better prepared and their scepticism around the efficacy of the process fades with success resolutions, and also due to the underlying push from the RBI for resolution, either through other means or under the Code.
60
On your marks... | Deloitte Deleveraging Asia 2018

Overview of Bankruptcy Bill
Unified code Single code to address insolvency for companies, limited liability partnerships, partnership firms and individuals
Adjudicating Authority
National Company Law Tribunal (NCLT) for corporates and LLPs and DRT for individuals and other Partnership firms
Insolvency Regulator Insolvency and Bankruptcy Board of India
Insolvency Professionals
Registered insolvency professionals can act as Resolution professionals Bankruptcy trustee and Liquidator
Resolution Process
Speedy resolution process prior to liquidation to revive the company with a timeline of 180 days which can be extended by another 90 days
Information Utilities
Information repositories that collect, collate, authenticate & disseminate, financial information from listed companies, financial & operational creditors
Early identification of distress
Time bound resolution and liquidation
Clear ambiguity on rights of various stakeholders
Enhances investor confidence
61
On your marks... | Deloitte Deleveraging Asia 2018

Global teamDavid EdmondsGlobal Head, Portfolio Lead Advisory Services+44 20 7303 [email protected]
Andrew OrrAsia Head & Global Transactions Leader, Portfolio Lead Advisory Services+44 20 7007 [email protected]
Will NewtonHead of Strategic Advisory, Portfolio Lead Advisory Services+44 20 7007 [email protected]
Chi‑Nang KongManaging Director and Head of South East Asia (incl. China coverage), Portfolio Lead Advisory Services+65 6800 [email protected]
Hardip BhattiDirector, China & South East Asia, Portfolio Lead Advisory Services+44 20 7007 [email protected]
Laya CarnevaleAssistant Director, Business Development, Portfolio Lead Advisory Services+44 20 7007 [email protected]
AustraliaKevin ChamberlainPartner, Corporate Finance+61 (2) 9322 5985 [email protected]
China Tim PagettPartner, National Industry Programs+852 [email protected]
Edmund YeungPartner, Financial Advisory+852 [email protected]
Richard ZhaoPartner, Restructuring Services+86 10 [email protected]
IndiaUday BhansaliPartner, Financial Advisory+91 22 6185 [email protected]
IndonesiaWidiana WinawatiExecutive Director, Financial Advisory+62 21 5081 [email protected]
Edy WirawanExecutive Director, Financial Advisory+62 21 5081 [email protected]
Contacts
62
On your marks... | Deloitte Deleveraging Asia 2018
JapanKoichi TamuraHead of Corporate Finance Advisory+81 80 1010 [email protected]
MalaysiaSiew Kiat KhooExecutive Director, Restructuring Services+60 3 7610 [email protected]
Abdul Malek Mohamed SaidExecutive Director, Restructuring Services+60 3 7610 [email protected]
PhilippinesDiane YapPartner, Financial Advisory+63 2 581 [email protected]
SingaporeAndrew GrimmetExecutive Director, Restructuring Services+65 6530 [email protected]
South KoreaKi Wan KilPartner, Financial Advisory+82 2 6676 [email protected]
ThailandThavee ThaveesangsakulthaiPartner, Financial Advisory+66 2034 [email protected]
VietnamPhong Le VietPartner, Financial Advisory+84 0903 05 [email protected]
63
On your marks... | Deloitte Deleveraging Asia 2018

Notes
64
On your marks... | Deloitte Deleveraging Asia 2018

This publication has been written in general terms and we recommend that you obtain professional advice before acting or refraining from action on any of the contents of this publication. Deloitte LLP accepts no liability for any loss occasioned to any person acting or refraining from action as a result of any material in this publication.
Deloitte LLP is a limited liability partnership registered in England and Wales with registered number OC303675 and its registered office at 2 New Street Square, London EC4A 3BZ, United Kingdom.
Deloitte LLP is the United Kingdom affiliate of Deloitte NWE LLP, a member firm of Deloitte Touche Tohmatsu Limited, a UK private company limited by guarantee (“DTTL”). DTTL and each of its member firms are legally separate and independent entities. DTTL and Deloitte NWE LLP do not provide services to clients. Please see www.deloitte.com/about to learn more about our global network of member firms.
© 2018 Deloitte LLP. All rights reserved.
Designed and produced by The Creative Studio at Deloitte, London. J15367