on time rather than on wind conditions arrival patterns of
TRANSCRIPT

Page 1/34
Migrating Curlews on Schedule: Departure andArrival Patterns of a Long-Distance Migrant Dependon Time Rather than on Wind ConditionsPhilipp Schwemmer ( [email protected] )
Research and Technology Centre (FTZ), University of Kiel https://orcid.org/0000-0002-3930-2845Moritz Mercker
Bionum GmbH - Consultants for biological statisticsKlaus Heinrich Vanselow
Research and Technology Centre (FTZ), University of KielPierrick Bocher
Littoral Environnement et Sociétés Laboratory (LIENSs), University of La RochelleStefan Garthe
Research and Technology Centre (FTZ), University of Kiel
Research
Keywords: shorebird, Wadden Sea, �ight altitude, phenology, GPS tracking, repeatability
Posted Date: November 9th, 2020
DOI: https://doi.org/10.21203/rs.3.rs-101849/v1
License: This work is licensed under a Creative Commons Attribution 4.0 International License. Read Full License

Page 2/34
AbstractBackground: Choosing the appropriate time to depart for spring migration is crucial to achieving asuccessful subsequent breeding season among migratory bird species. We expected Eurasian Curlews(Numenius arquata) to start their migration during favourable weather conditions and to adjust their �ightheights to prevailing wind conditions.
Methods: We equipped 23 curlews with Global Positioning System data loggers to record the spatio-temporal patterns of their departure from and arrival at their wintering site in the Wadden Sea, as well asthe �rst part of their migration. We obtained data for 42 curlew migrations over a period of 6 years.Departure and arrival dates were related to 73 meteorological and bird-related predictors using the leastabsolute shrinkage and selection operator (LASSO) to identify drivers of departure and arrival decisions.
Results: Curlews migrated almost exclusively to the western part of Russia for breeding. They left theWadden Sea mainly during the evening hours from mid- to late April and returned between the end ofJune and mid-July. There was no difference in departure times between the sexes, but males tended toreturn from their breeding sites later than females. Flight speeds of the birds increased signi�cantly withincreasing tailwind component, suggesting that they timed their migration according to favourable windconditions. However, curlews left the Wadden Sea during various wind and weather conditions, withsigni�cant numbers leaving during headwind conditions, in contrast to the apparent wind-driven start ofmigration. Curlews migrated at very low altitudes during tailwind conditions, but �ew signi�cantly higherduring headwind conditions, at altitudes of up to several kilometres. Departure dates varied by <4 days inindividual curlews that were tagged over consecutive years.
Conclusions: Our results suggest that the start of migration in a long-distance migrant mainly depends onthe date and is independent of weather conditions. Given the high repeatability of the departure dayamong subsequent years, this clearly suggests the existence of an internal clock prompting the start ofmigration. Further insights into the timing of migration in immatures and closely related birds might helpus to understand the genetic mechanisms triggering temporal migration patterns.
BackgroundMigration is an essential part of the life cycle of a wide range of species, with potentially importantconsequences for their �tness [1–5]. Birds show the most extensive and far-ranging migrations [6–8].Careful timing of migration is essential to maximize the chance of survival during migration (e.g. to avoidsevere weather) [9–12, 5] and to coincide with bene�cial environmental resources in the destinationareas, as a prerequisite to ensuring �tness [13–14].
We studied the departure and arrival patterns of a long-distance migrating shorebird, the Eurasian Curlew(Numenius arquata), at one of its most important wintering sites on the East Atlantic Flyway, the WaddenSea. Despite strong population decreases in the �yway population as a whole [15], the numbers ofcurlews wintering in the Wadden Sea have remained stable for several decades [16]. The Wadden Sea
Page 3/34
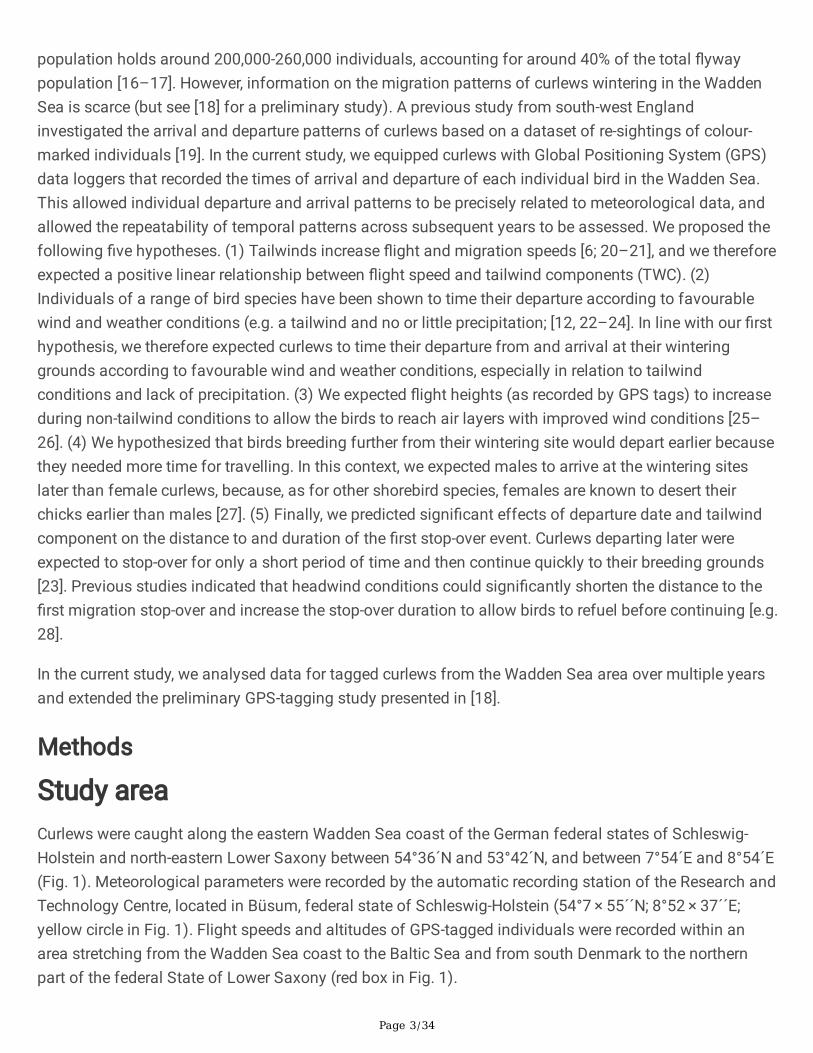
population holds around 200,000-260,000 individuals, accounting for around 40% of the total �ywaypopulation [16–17]. However, information on the migration patterns of curlews wintering in the WaddenSea is scarce (but see [18] for a preliminary study). A previous study from south-west Englandinvestigated the arrival and departure patterns of curlews based on a dataset of re-sightings of colour-marked individuals [19]. In the current study, we equipped curlews with Global Positioning System (GPS)data loggers that recorded the times of arrival and departure of each individual bird in the Wadden Sea.This allowed individual departure and arrival patterns to be precisely related to meteorological data, andallowed the repeatability of temporal patterns across subsequent years to be assessed. We proposed thefollowing �ve hypotheses. (1) Tailwinds increase �ight and migration speeds [6; 20–21], and we thereforeexpected a positive linear relationship between �ight speed and tailwind components (TWC). (2)Individuals of a range of bird species have been shown to time their departure according to favourablewind and weather conditions (e.g. a tailwind and no or little precipitation; [12, 22–24]. In line with our �rsthypothesis, we therefore expected curlews to time their departure from and arrival at their winteringgrounds according to favourable wind and weather conditions, especially in relation to tailwindconditions and lack of precipitation. (3) We expected �ight heights (as recorded by GPS tags) to increaseduring non-tailwind conditions to allow the birds to reach air layers with improved wind conditions [25–26]. (4) We hypothesized that birds breeding further from their wintering site would depart earlier becausethey needed more time for travelling. In this context, we expected males to arrive at the wintering siteslater than female curlews, because, as for other shorebird species, females are known to desert theirchicks earlier than males [27]. (5) Finally, we predicted signi�cant effects of departure date and tailwindcomponent on the distance to and duration of the �rst stop-over event. Curlews departing later wereexpected to stop-over for only a short period of time and then continue quickly to their breeding grounds[23]. Previous studies indicated that headwind conditions could signi�cantly shorten the distance to the�rst migration stop-over and increase the stop-over duration to allow birds to refuel before continuing [e.g.28].
In the current study, we analysed data for tagged curlews from the Wadden Sea area over multiple yearsand extended the preliminary GPS-tagging study presented in [18].
Methods
Study areaCurlews were caught along the eastern Wadden Sea coast of the German federal states of Schleswig-Holstein and north-eastern Lower Saxony between 54°36´N and 53°42´N, and between 7°54´E and 8°54´E(Fig. 1). Meteorological parameters were recorded by the automatic recording station of the Research andTechnology Centre, located in Büsum, federal state of Schleswig-Holstein (54°7 × 55´´N; 8°52 × 37´´E;yellow circle in Fig. 1). Flight speeds and altitudes of GPS-tagged individuals were recorded within anarea stretching from the Wadden Sea coast to the Baltic Sea and from south Denmark to the northernpart of the federal State of Lower Saxony (red box in Fig. 1).

Page 4/34
Catching of curlews and deployment of GPS tagsA total of 26 adult curlews were caught at their high-tide roosts using mist nets, between 2014 and 2020.Three of the GPS devices malfunctioned or the birds were predated before departure from their winteringgrounds, and data for 23 adult wintering curlews (11 females and 12 males) were therefore available forthis study. Some curlews migrated multiple times before the device stopped working, and we weretherefore able to record the departures and arrivals of the same individuals in up to 5 subsequent years.We recorded a total of 42 departures from and 33 arrivals at the wintering sites. All individuals wereequipped with solar-powered GPS-Global System for Mobile Communications (GSM) data loggersattached by breast harnesses [18, 29]. The devices recorded time, date, geographical position, and �ightspeed at pre-programmed intervals of 1–15 min. Twelve individuals were equipped with “Skua” dataloggers (Ecotone, Poland) weighing 17 g, and the other 11 individuals were equipped with OT-20 (3individuals), OT-15 (7 individuals), and OT-10 (1 individual) data loggers, weighing 20, 15, and 10 g,respectively (Ornitela, Lithuania). Our study took place over a period of 7 years and we therefore aimed touse progressively lighter data loggers in line with technical developments (particularly logger weightreduction) over this time period. The mean body masses of female and male curlews were 957.7 ± 74.3 gand 827.8 ± 92.1 g, respectively. Even the heaviest data loggers used in this study therefore accounted foronly about 2.4% of body mass, which was below the threshold of 3% suggested to avoid confoundingeffects of the devices [30]. The Skua devices only sent part of the data to a server via a GSM connection,which could then be downloaded directly, and the rest of the data were transmitted to base stations setup next to the high-tide roosts. The full dataset for the Skua devices was thus only obtained after thebirds had returned to their wintering sites in the Wadden Sea. The highest temporal resolution achievedby these devices was 15 min. In contrast, the OT devices transmitted the whole dataset to an onlineportal, and the recording intervals were programmed according to a �exible schedule, generally rangingfrom 1–15 min, based on the battery status of the device. We programmed “geofences” (i.e. de�ned areasin which the devices recorded data constantly in 1-min intervals) for all OT devices. The geofence coveredthe red box shown in Fig. 1, but excluded high-tide roosts, to save battery power. The high temporalresolution of the GPS �xes allowed �ight height measurements to be derived within the red box areashown in Fig. 1, and also further east.
All data recorded by the GPS devices were �nally stored in the online portal Movebank(www.movebank.org).
In addition to equipping each bird with a GPS device, all individuals were ringed and weighed, bill andwing lengths were measured, age was determined, and sex was determined by taking a breast feather forgenetic sexing in the lab (Tauros Diagnostics, Berlin).
Data analysesWe visualized the GPS data for each curlew using the Geographical Information System ArcGIS (version10.3) [31]. The time (UTC) and day of the year at which the birds left their wintering grounds headingnorth-east towards their breeding sites were determined. This departure was evident from the GPS tracks,

Page 5/34
and was always associated with a clear increase in �ight speed (and �ight heights in OT devices). Thetime and day of year of arrival at the wintering grounds was determined in a similar manner.
Meteorological data were recorded at 1-min intervals by an automatic recording station located at theResearch and Technology Centre in Büsum, and weather conditions were related to the curlews’ departureand arrival patterns (see Statistical analysis section below). The recorded parameters were: temperature(°C), wind speed and maximum wind speed (m/s), wind direction (degrees), precipitation (mm), globalradiation (W/m²), UVA and UVB (W/m²), photosynthetically active radiation (W/m²), air pressure (mbar),and air humidity (%). For all parameters, we computed the mean values of the 1-min recordings over aperiod from 90 min before to 90 min after the departure/arrival of each individual curlew. The meanvalues were then related to the departure/arrival day (see Statistical analysis section below) and used totest for differences in weather conditions between departures and arrivals. To account for the circularnature of the wind direction, means were calculated as the direction of a circular vector using the R-package circular [32]. Wind-rose plots of the wind direction during the departure and arrival of curlewswere created using the R-package openair [33].
To relate the departure and arrival dates to linear distance from the breeding area, it was necessary todetermine the location of the breeding area for each curlew. The likely breeding area was identi�ed in GIS(white triangles in Fig. 4). It could be distinguished from stop-over locations by being the most distantpoint from the wintering location, and at the same time as a location where the birds stayed for severalweeks (more than at each stop-over location) with very limited movement behaviour. The approximatecoordinate of the nest site was calculated by computing the mean geographical position of all positionsin the potential breeding site. Finally, the linear distance between this position and the wintering site wascalculated in GIS.
Departure dates were also related to the linear and �own distances (calculated in GIS) to the �rst stop(red circles in Fig. 4), the �ight time to the �rst stop, and the duration of the �rst stop. The same wasapplied for the arrival dates using the last stop before the wintering site (orange circles in Fig. 4). Themean locations of the nearest stops to the wintering sites were calculated in the same way as for thebreeding site. In some cases, birds migrated from their wintering sites in the Wadden Sea to otherWadden Sea areas (always < 30 km distance), probably to join other birds shortly prior to departure.These locations were not regarded as �rst stop-over events, and the departure from the last site in theWadden Sea was used for the analyses instead.
Finally, we computed the relative deviation between the �own and linear distances (%) as an indicator ofthe curvature of the actual �ight track. This was expected to increase during headwind conditions,because birds might try to avoid headwinds by choosing different �ight angles. Only �ight tracks withlog-intervals of ≤ 5 min were used for this to keep the �ight tracks comparable.
We determined the mean departure direction of each individual across the red box shown in Fig. 1 andrelated it to the mean recorded wind speed and wind direction to compute the TWC. This is known to havea signi�cant impact on the migration speed of birds [20–21, 34], and was therefore expected to affect the

Page 6/34
departure and arrival decisions of the curlews in the current study. According to [35], we used thefollowing formula: TWC = v × cos x; where v is the wind speed in ms-1 and x is the angular deviationbetween the opposite �ight direction of the curlew (i.e., tailwind direction) and the wind direction (indegrees). In addition to using TWC as an additional predictor of departure and arrival decisions, we alsorelated it to mean �ight speed to demonstrate if the birds were able to increase their speed during tailwindconditions, and to mean �ight height within the red box in Fig. 1.
Statistical analysisAll statistical analyses were carried out using the open source software R, version 3.6.3 [36]. Plots werevisualized using the R package ggplot2 [37]. All regressions were performed using generalized additivemodels (GAMs) [38–39] using the R package mgcv [40]. Individual was included as a random intercept inthe GAMs to avoid pseudo-replication due to multiple observations of the same individual. For eachmodel, we selected an appropriate probability distribution for the variable of interest; if differentprobability distributions were reasonable (e.g. in the case of possibly overdispersed count data), weselected the most appropriate distribution based on the Akaike Information Criterion [41].
We related the departure day to meteorological data to see if departure decisions were affected by theweather. We considered the meteorological data under six conditions, including (1) at the moment ofdeparture and (2) the mean conditions 90 min before to 90 min after departure. We also contrasted (3)the moment of departure and (4) the mean conditions 90 min before to 90 min after departure with thesame measure on the 4 days before departure, to determine if curlews experienced suboptimal conditionsprior to their departure, which might have delayed their departure decision. Finally, we also contrasted (5)the moment of departure and (6) the mean conditions 90 min before to 90 min after departure with thesame measure at the same time of day on the same date for the average of the 4 previous years todetermine if the curlews experienced suboptimal meteorological conditions compared with the averageconditions on similar dates. In all cases, the meteorological conditions were compared by dividing theweather data at the moment of departure (respectively 90 min before to 90 min after departure) by theaverage conditions at the same moment (same time interval) for the 4 preceding days/years. If themeteorological variable of interest had a zero value, the difference was calculated instead of the quotient.
In addition to the above meteorological parameters, we also used the following additional predictors tomodel the departure decision (de�ned by day of the year): number of migrations for each individual bird,sex of the individual, catching location in the Wadden Sea, year, time of day, breeding latitude, lineardistance to breeding area, departure direction, TWC, time to �rst stop-over, duration of �rst stop-over,�own distance to �rst stop, and linear distance to �rst stop. For TWC, we used the six differentcombinations of meteorological data given above. All other predictors were kept constant.
We therefore used a total of 73 predictors to model the departure decision (i.e. 55 constant andcontrasted meteorological predictors, 6 constant and contrasted combinations of TWC, and 12 constantpredictors related to the individual curlews or the �rst stop-over event). The same predictors were used tomodel the arrival of the birds in their wintering grounds.

Page 7/34
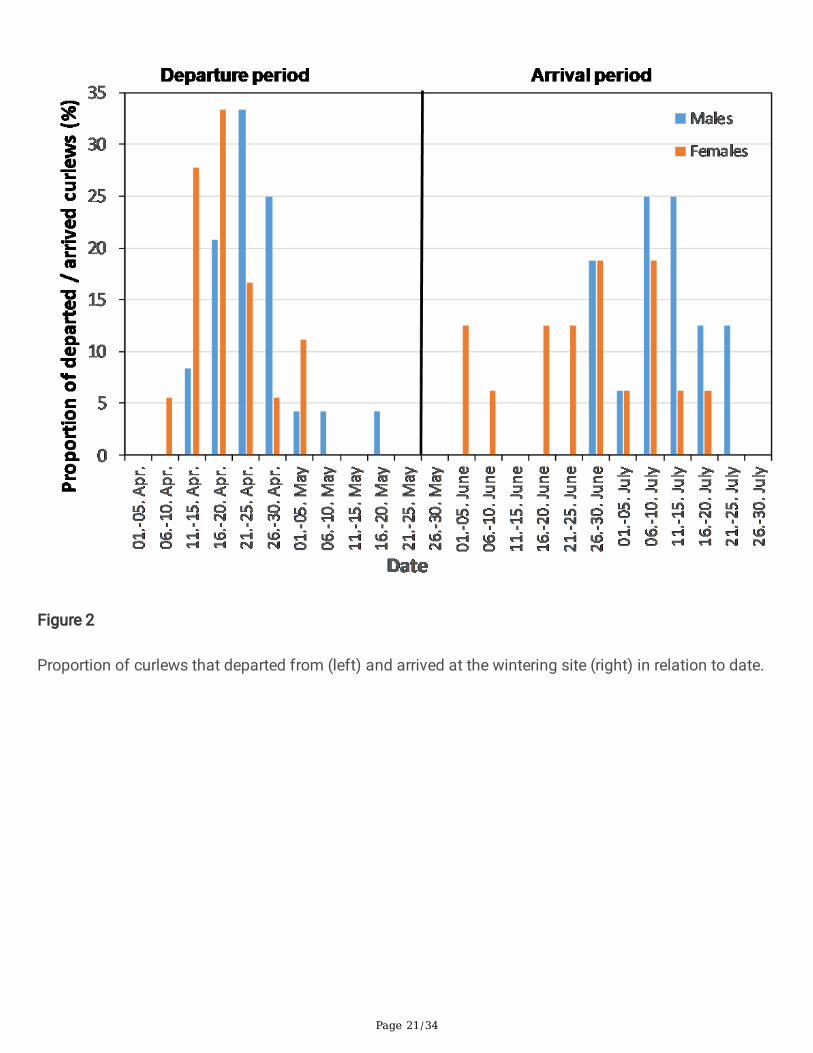
ResultsPhenology of departures and arrivalsThe �rst curlew departed from the wintering grounds on April 7 and the last on May 16. Most individualsdeparted between mid- and late April (Fig. 2). Females tended to depart earlier, but the sex difference wasnot signi�cant (GAM: t = 1.23, df = 41, p = 0.23). The �rst curlews arrived at the wintering sites on June 3and the last on July 24, with most birds arriving between mid-June and the end of July (Fig. 2). There wasa clear but not signi�cant tendency for females to arrive earlier than males (GAM: t = 1.97, df = 31, p = 0.067; mean day of year females: 177.9 ± 13.1, mean day of year males: 189.9 ± 11.7).
Departures mainly occurred during the late evening, shortly before sunset, with no signi�cant differencebetween the sexes (GAM: t = − 0.29, df = 41, p = 0.78; Fig. 3a). The time of day for arrivals differed fromthat for departures (Table 1, Suppl. 1a), with signi�cantly more arrivals during the nighttime and alsooccasionally during daytime. As for departing curlews, there was no sex difference in terms of arrivals(GAM: t = 1.7, df = 31, p = 0.09; Fig. 3b).
The effects of the 73 predictors on day of the year (outcome variable) were tested using the leastabsolute shrinkage and selection operator (LASSO) [42–43] technique for predictor selection. Thistechnique is known to handle a large number of possible predictors without being prone to statisticalproblems e.g. compared with stepwise methods (c.f., below). Notably, LASSO has been combined withcross-validation to select promising predictors based on their predictive capacity [42–44]. In contrast tothe common stepwise methods (e.g., forward or backward selection procedures), LASSO-based resultsare not sensitive to the order of the performed tests [44–45]. However, it is necessary to bear in mind thatthe chance of detecting a signi�cant relationship between a predictor and the considered outcomevariable increases with the number of investigated predictors.

Page 8/34
Table 1GAMs comparing migration parameters, and wind variables between departing and arriving curlews.
EstimateStd.
Error t-value
p-value
Time of day −3.08 1.32 −2.33 0.023
Rel. diff. between �own and linear distance to neareststop
−2.06 1.75 −1.8 0.244
Linear distance to nearest stop −432.4 106.2 −4.07 < 0.001
Time to nearest stop −189.47 118.16 −1.6 0.114
Duration of nearest stop 258.7 433.5 0.6 0.553
Mean �ight speed −18.53 4.12 −4.49 < 0.001
Tail wind component −0.33 0.67 −0.5 0.618
Mean �ight altitude −930.2 164.9 −5.64 < 0.001
Mean wind speed −1.29 0.45 −2.89 0.005
Mean wind direction −2.2 27.43 −0.08 0.936
Estimate Std = estimated standard deviation. GAM outputs are illustrated in Suppl. 1.
[Table 1 should be placed approximately here]GPS tracks of curlews and relationships with nearest stop-over sitesAfter their departure from the wintering grounds in the Wadden Sea, all curlews headed towards theirbreeding sites, which were located exclusively in north-western Russia (except for one individual that wasbreeding in Finland; see white triangles in Fig. 4). The most distant breeding site was 3,840 km from thewintering site, east of the Ural Mountains. The mean linear distance of all �ight tracks was 2,339 ± 612 km. The relative differences between the �own and linear distances to the breeding sites were similarfor arriving and departing curlews (Table 1; Suppl. 1b).
The mean linear distance between the nearest stop-over site and the wintering site for departing curlewswas 775.8 ± 376 km, which represents 33.2% of the linear distance to their breeding sites (i.e. birdsperformed about 1/3 of their overall migration during their �rst migration bout). Curlews selected astraight �ight path to reach their �rst stop-over site, with the distance �own on average only 45.7 kmlonger than the linear distance (5.6%).
Many curlews crossed the Baltic Sea directly, while others stopped over on the Danish islands or thesouthern Baltic Sea coast (see red circles in Fig. 4). The nearest stop-over site for arriving curlews wassigni�cantly closer to the wintering site than that for departing curlews (mean: 342.4 km; Table 1; Suppl.

Page 9/34
1c), but the distance was highly variable (± 503.1 km). In contrast, both time to the nearest stop-over siteand duration of the nearest stop were similar for departing and arriving curlews (Table 1; Suppl. 1d, e).
Finally, there was no signi�cant relationship between �ight time to the nearest stop-over and stop-overduration, suggesting that curlews did not take longer to recover after longer migration bouts.Flight speed and �ight height in relation to TWCThe �ight speeds of both departing (GAM: t = 8.42, df = 32, p < 0.001) and arriving curlews (GAM: t = 5.07,df = 27, p < 0.001) were positively and highly signi�cantly related to TWC (Fig. 5), suggesting that birdswere able to increase their migration speeds with wind assistance. Interestingly, �ight speeds duringdeparture were signi�cantly higher (mean: 73.8 ± 18.5 km/h, range: 41.9–115.6 km/h) than speeds duringarrival (mean: 55.3 ± 11.9 km/h, range: 40.8–84.0 km/h), as indicated by the small overlap of con�denceintervals in Fig. 5 (see also Table 1; Suppl. 1f). There was no difference in the TWC relationships betweendeparting and arriving curlews (Table 1; Suppl. 1 g).
Curlews departed at signi�cantly higher altitudes during headwind compared with tailwind conditions(GAM: t = − 9.52, df = 19, p < 0.001), but there was no signi�cant relationship between TWC and �ightaltitude in arriving curlews (Fig. 6; GAM: t = − 1.25, df = 13, p = 0.25). As for �ight speeds, �ight altitudeswere signi�cantly higher and more variable during departure (mean: 1,113.3 ± 592.0 m, range: 175.2–2337.7 m) compared with during arrival (mean: 182.3 ± 164.4 m, range: 37.0–639.2 m) (Table 1; Suppl.1 h).
There was no signi�cant relationship between TWC and the relative difference between the �own andlinear distances, indicating that the straightness of the �ight pass was not impacted by wind conditions.Finally, there was also no correlation between TWC and migration distance to the �rst stop or stop-overduration, suggesting that headwind conditions had no effect on �ight distances and length of the �rststop-over.Departure/arrival decisionsThe LASSO model showed that only one of the 73 predictors signi�cantly in�uenced the departure day ofcurlews: curlews departed signi�cantly later with increasing linear distance to their breeding sites (Fig. 7;GAM: t = 2.63, df = 37, p < 0.05). Wind direction at the time of departure contrasted with the mean winddirection at the same time of day, and day of year 4 years prior to departure remained a predictor in the�nal LASSO model, but had no signi�cant impact on departure day (GAM: t = − 0.77, df = 37, p = 0.45).Interestingly, LASSO did not select any other meteorological predictors, bird-related variables, or variablesassociated with the nearest stop-over event. Mean wind direction and wind force in the period from90 min before to 90 min after departure were highly variable (Fig. 8a), which explains the absence of anysigni�cant relationships with day of departure.
According to LASSO, none of the 73 predictors was related to arrival day. As for departures, wind directionand force were highly variable (Fig. 8b). Wind force (but not wind direction) differed signi�cantly betweendeparture and arrival �ights (Table 1; Suppl. 1i, j). During arrival, most of the higher wind forces wereassociated with north-easterly winds (Fig. 8b), which might have assisted some returning curlews, but

Page 10/34
eventually had no signi�cant impact. This also led to a lack of any signi�cant difference in tailwindconditions between departing and arriving curlews (Suppl. 1 g).
In addition, there was no signi�cant relationship between departure/arrival date and stop-over duration,indicating that curlews that migrated later did not have shorter stop-overs.Repeatability:Among the 42 curlews with departure information, we recorded multiple departures in subsequent yearsfor 12 individual birds (2–5 consecutive years). It was therefore possible to assess the repeatability of thedeparture day in the same individuals in different years. The mean absolute difference in departure daysin subsequent years was only 3.68 ± 2.97 days (n = 19). However, the variability in arrival days ofreturning curlews was more than twice as high (7.17 ± 4.83, n = 12). The departure days recorded in eachindividual´s �rst year were signi�cantly related to the departure days in subsequent year(s) (Fig. 9; GAM: t = 5.29, df = 18, p < 0.001), while there was no signi�cant relationship for arrival dates (GAM: t = − 0.5, df = 11, p = 0.62).
There was also high site �delity in terms of the locations of breeding and wintering sites, but less �delityfor the location of the nearest stop-over sites (Fig. 4). The repeatability of �ight directions was also high,with a mean variability of only 9.7 ± 8.2° for departures and 13.3 ± 10.2° for arrivals among subsequentyears for the same individuals.
DiscussionWind and weather effects and �ight heights
Our data con�rmed that curlew �ight speed increased with increasing TWC, in accordance with previousstudies showing similar relationships [6, 20]. Based on the clear bene�t of faster �ight speeds duringtailwind conditions, we hypothesized that curlews would mainly select days with suitable tailwindconditions for their departure from (and arrival at) their wintering grounds in the Wadden Sea. Thisrelationship was demonstrated in previous studies of songbirds [e.g. 12, 22], while long-distancemigrating shorebirds were found to encounter unfavourable and potentially fatal wind conditions if theyfailed to time their departure precisely [10]. However, in contrast to our assumption, the current studyrevealed virtually no effect of wind or other weather parameters on the departure/arrival day for curlews,even when the actual weather during departure was compared with the mean weather conditions 4 daysand/or 4 years prior to departure. Although curlews rarely departed during hours with precipitation (inaccordance with other bird species) [12, 23–24], this predictor had no signi�cant in�uence in our �nalmodel. The current �ndings were therefore not in agreement with previous studies, which found that theprobability of departure of curlews from a pre-breeding staging site was reduced during precipitation [46].In contrast, our �ndings were in accord with observations of departing curlews in China, where there wasalso no signi�cant in�uence of wind force or wind direction [46]. The same holds true for the closelyrelated whimbrel (Numenius phaeopus islandicus), for which there were no correlations with windconditions for either direct �ight or one-stop-over migration [47].

Page 11/34
Although weather parameters had no impact on departure/arrival decisions, we found a signi�cantnegative correlation between TWC and �ight altitude in curlews. Although there were no available data forwind speeds (and directions) of different air layers for this study, this pattern clearly suggests thatcurlews tried to �nd more favourable wind conditions at higher altitudes if they encountered headwindsat lower altitudes. In temperate latitudes, the prevailing westerly wind conditions in the higher air layerssuggest wind assistance when ascending [48]. This behaviour has previously been recorded for nocturnalsongbird migrants [25–26], as well as for diurnal long-distance migrants using radar techniques [49]. [50]found intensive songbird migration in air layers up to 3 km altitude in temperate regions, when the birdsencountered headwind conditions close to the surface. The authors demonstrated that migrating birdsbene�ted from the wind conditions in higher air layers by ascending, exclusively during their springmigration. This might explain why there was no signi�cant relationship between �ight altitude and TWCin arriving curlews during their autumn migration. The current results clearly suggest that curlews depart(and stay) at lower altitudes when wind conditions close to the surface are bene�cial, and use higher airlayers during spring migration when they encounter headwinds.
Interestingly, curlews arrived at signi�cantly slower �ight speeds and lower altitudes compared withdeparting curlews. Meteorological reasons for this can be excluded, given that the wind conditions andTWC were similar for departing and arriving individuals. One likely reason is that the linear distance to thenearest stop-over in arriving curlews was far smaller than for departing individuals, which might explainwhy departing curlews ascended to higher altitudes and had faster �ight speeds compared with arrivingbirds.
In conclusion, the absence of clear relationships between departure decision and wind/weatherparameters suggests that curlews behave conservatively and follow an individual time schedule driven byan internal genetic trigger [14, 51–52] (see discussion on repeatability below). If their individual departureday happens to coincide with headwind conditions, the birds seem to account for this by �ying at higheraltitudes. However, further studies are needed to determine if curlews have knowledge of the windconditions at higher altitudes when they encounter headwinds on the ground.
Temporal patterns and location of breeding sites
According to our LASSO analysis, distance to the breeding site was the single (highly signi�cant)predictor affecting the day of departure of curlews from the Wadden Sea. Counterintuitively and incontrast to our formulated hypothesis, birds with the longest migration distances showed the latestdeparture and arrival days. Given the long migration distance, we expected these curlews to leave earlierto allow them to complete their journey to their breeding grounds in time to start breeding. However,shorebirds have been shown to encounter higher food availability and have faster chick growth rates ifthey start nesting soon after snowmelt [53–54], suggesting that curlews should aim to arrive at theirbreeding sites as soon as the areas are free from snow and ice. This could in turn explain why curlewsthat breed further from their wintering grounds (e.g. in the eastern parts of Russia in this study) mightwait longer to allow the snow and ice in their Arctic breeding grounds to melt, and/or to ensure that they

Page 12/34
encounter optimal arthropod densities. Similarly, [19] showed that colour-ringed curlews breeding inFennoscandia departed later than birds breeding further west. Although this study dealt with a differentsub-population, the results matched the patterns found in the current study.
We found that curlews wintering in the Wadden Sea departed within a very short time window (i.e. mostlybetween mid-April and mid-May). This contrasts with birds wintering in south-west Britain, which hadalready started to depart during February and March [19]. However, in contrast to British curlews thatbreed in north-western Europe [19], all but one of the curlews reported in the present study bred in Russia,i.e. much further east. The more condensed departure window in our study might thus also be aconsequence of the relatively late availability of breeding sites due to snow and ice melt. Thisemphasises the need for the birds to have an internal clock to ensure their timely departure.
The main window of arrival of birds in the Wadden Sea was late June to mid-July, which is about 2 weekslater than reported for birds breeding in central or northern Europe [19]. Although desertion of offspring byfemales is common in shorebirds and has been shown for curlews [27], we found no sex differences indeparture patterns, and only a non-signi�cant tendency for females to arrive earlier. The reason for this isunclear. It is possible that some birds failed to rear chicks successfully, leading to the earlier arrival of atleast some males.
Departures of songbirds usually occur at night and around sunset [22, 51] and the same is true for manylong-distance migratory wader species, given that birds are thought to take advantage of favourableatmospheric factors during the night and to calibrate their orientation systems before they start in theevening hours [55–56]. Our results support these patterns, with more curlews departing during the earlyevening or early nighttime. However, an earlier study of curlews departing from a �nal pre-breeding stop-over site in China showed high variability in terms of the time of day for departures [46]. The reason forthese different �ndings remains unclear. Given the higher number of individuals arriving during morningand afternoon, our results suggest the existence of a strong temporal trigger regulating departuredecisions, but a weaker such trigger for arrivals.
Correlations with �rst and last stop-overs
We expected that the departure day and TWC would be signi�cantly related to the distance to the neareststop-over site and the stop-over duration; however, no such correlation was found. Curlews did not stagefor shorter periods if they departed later, nor did they stage for longer if they encountered headwindconditions during the �rst part of their migration to allow more time for re-fuelling. This �nding is inaccordance with studies of songbirds, which likewise showed no or only weak relationships [57–58].Similar results were also found for whimbrels, with no impact of wind conditions on stop-over patterns;however, in contrast to our study, they tended to skip a potential stop-over when they departed later [47].
Repeatability

Page 13/34
In a recent review, [52] presented evidence for genetic control of the timing of bird migration. However, theauthors also found much individual variation in this genetic programme as a result of interactions withenvironmental and social factors, as well as due to individual learning. The curlews in the current studyalso demonstrated a clear genetic circannual rhythm, given that individual curlews showed very littlevariation in departure and arrival patterns among subsequent years, and did not time their departureaccording to the weather. The current results thus provide a robust example of the concept of an internalclock, responsible for timing bird migration [14, 51]. In contrast to these results however, black-tailedgodwits (Limosa limosa limosa) tracked across subsequent years exhibited a much broader window ofinter- and intraspeci�c timing of migration [59]. The authors suggest that this broad window ofrepeatability indicated weak selective forces with respect to migration timing. This assumption wouldsuggest that such forces are strong for curlews, although for the speci�c mechanisms affecting the highinter- and intraspeci�c repeatability of migration timing evidence is currently lacking. In contrast, [8]hypothesized a conservative annual-cycle strategy in long-distance migrants that was thought tominimise risks and reduce carry-over effects. Our study may support this hypothesis, given that curlewsclearly showed constant, conservative patterns in terms of their departure decisions, independent of theweather conditions at their wintering sites. These �ndings are in line with other Arctic breeding birds, suchas bar-tailed godwits (Limosa limosa baueri) from New Zealand, which also showed high repeatability[60].
ConclusionsThe results of the current study demonstrated constant temporal departure and arrival patterns incurlews, with no signi�cant impact of meteorological conditions. The high repeatability of the departureday in the same individuals in subsequent years suggests a genetic trigger regulating the timing ofmigration. These results clearly show that curlews departed during any weather conditions, includingheadwinds, which seemed to be accounted for by �ying at higher altitudes. However, the main factordriving the timing of migration seems to be the date, suggesting the existence of an internal clockprompting the start of migration. Follow-up studies are needed to explore the timing of migration inimmature curlews, ideally by tagging birds from the same clutch and their parents. Further insights intothe timing of migration in closely related birds might help us to understand the genetic mechanismstriggering temporal migration patterns.
AbbreviationsGPSGlobal Positioning SystemGSMGlobal System for Mobile CommunicationsTWCtailwind component

Page 14/34
DeclarationsEthics approval and consent to participate
Permission to attach GPS tags was issued by the Ministerium für Energiewende, Landwirschaft, Umwelt,Natur und Digitalisierung of the federal state of Schleswig-Holstein (�le numbers V 312-7224.121-37(42-3/13) and V 241-35852/2017(88-7/17)) as well as by the Niedersächsisches Landesamt fürVerbraucherschutz und Lebensmittelsicherheit of the federal state of Lower Saxony (�le number 33-19-42502-04-17/2699). Catching and treatment of birds complied with current EU and German laws. Allauthors consent to participate in this study.
Consent for publication
Not applicable.
Availability of data and materials
The tracking data of curlews are available in www.movebank.org.
Competing interests
The authors declare that they have no competing interests.
Funding
Parts of this study were conducted within the project “StopP-Synthese – from Sediment to Top Predators”(FKZ 03F672B) funded under the FONA programme of the German Federal Ministry of Research andEducation (BMBF), and by the projects “Birdmove” (FKZ 3515822100) and “Trackbird” (FKZ 3519861400)funded by the Federal Agency for Nature Conservation.
Author´s contributions
PS designed the study, conducted the �eldwork, performed the data analyses and wrote most parts of themanuscript. MM designed and performed the statistical tests and wrote parts of the method section. KHVrecorded and analysed the meteorological data. PB wrote parts of the manuscript. SG designed the studyand compiled the movement data. All authors read and approved the �nal manuscript.
Acknowledgements
The National Park Administration within the Landesbetrieb für Küstenschutz, Nationalpark undMeeresschutz, provided permission to enter bird protection sites for catching. We thank our colleagues forassistance in nocturnal bird catching and in particular Gerhard (Niko) Nikolaus and members from theSchutzstation Wattenmeer e.V. We thank S. Furness for providing linguistic support.

Page 15/34
References1. Schaefer JA, Mahoney SP. Spatial dynamics of the rise and fall of caribou (Rangifer tarandus) in
Newfoundland. Can J Zool. 2013;91:767–74.
2. Briedis M, Krist M, Král M, Voigt C, Adamík P. Linking events throughout the annual cycle in amigratory bird – non-breeding period buffers accumulation of carry-over effects. Behav EcolSociobiol. 2018;72:93. https://doi.org/10.1007/s00265-018-2509-3.
3. Pelletier D, Seyer Y, Garthe S, Bonnefoi S, Philips A, Guillemette M. So far, so good… Similar �tnessconsequences and overall energetic costs for short and long-distance migrants in a seabird. PLoSOne. 2019;15(3):e0230262. https://doi.org/10.1371/journal.pone.0230262.
4. Sawyer H, LeBeau CW, McDonald T, Xu W, Middleton AD. All routes are not created equal: An ungulate´s choice of migration route can in�uence its survival. J Appl Ecol. 2019;56:1860–9.https://doi.org/10.1111/1365-2664.13445.
5. Sergio F, Tavecchia G, Tanferna A, Blas J, Blanco G, Hiraldo F. When and where mortality occursthroughout the annual cycle changes with age in a migratory bird: individual vs. populationimplications. Sci Rep. 2019;9:17352. https://doi.org/10.1038/s41598-019-54026-z.
�. Alerstam T. Bird migration speed. In: Berthold P, Gwinner E, Sonnenschein E, editors. Avian migration.Springer; 2003. p. 253–67.
7. Gill RE Jr, Tibbits TL, Douglas DC, Handel CM, Mulcahy DM, Gottschalck JC, et al. Extreme endurance�ights by landbirds crossing the Paci�c Ocean: ecological corridor rather than barrier? Proc R Soc B.2009;276:447–57. doi:10.1098/rspb.2008.1142.
�. Conklin JR, Senner NR, Battley PF, Piersma T. Extreme migration and the individual quality spectrum.J Avian Biol. 2017;48:19–36. doi:10.1111/jav.01316.
9. Franke A, Therrien J-F, Descamps S, Bêty J. Climatic conditions during outward migration affectapparent survival of an arctic top predator, the peregrine falcon Falco peregrinus. J Avian Biol.2011;42:544–51. doi:10.1111/j.1600-048X.2011.05466.x.
10. Alves JA, Dias MP, Méndez V, Katrínardóttir B, Gunnarsson TG. Very rapid long-distance sea crossingby a migratory bird. Sci Rep. 2016;6:38154. doi:10.1038/srep38154.
11. Haest B, Hüppop O, Bairlein F. The in�uence of weather on avian spring migration phenology: What,where and when? Glob Chang Biol. 2018;1–20. doi:10.1111/gcb.14450.
12. Brust V, Michalilk B, Hüppop O. To cross or not to cross – thrushes at the German North Sea coastadapt �ight and routing to wind conditions in autumn. Mov Ecol. 2019;7:32.https://doi.org/10.1186/s40462-019-0173-5B.
13. Fayet AL, Freeman R, Shoji A, Kirk HL, Padget O, Perrins CM, et al. Carry-over effects on the annualcycle of a migratory seabird: an experimental study. J Animal Ecol. 2016;85:1516–27.doi:10.1111/1365-2656.12580.
14. Åkesson S, Ilieva M, Karagicheva J, Rakhimberdiev E, Tomotani B, Helm B. Timing avian long-distance migration: from internal clock mechanisms to global �ights. Philos Trans R Soc B.

Page 16/34
2017;372:20160252. doi.org/10.1098/rstb.2016.0252.
15. BirdLife International. Species factsheet: Numenius arquata. 2020. http://www.birdlife.org. AccessedSeptember 2020.
1�. Kleefstra R, Hormann M, Bregnballe T, Frikke J, Günther K, Hälterlein B, et al. Trends of migratory andwintering waterbirds in the Wadden Sea 1987/1988–2016/2017. Wadden Sea Ecosystem No. 39.Common Wadden Sea Secretariat, Joint Monitoring Group of Migratory Birds in the Wadden Sea,Wilhelmshaven, Germany. 2019. https://www.waddensea-worldheritage.org/sites/default/�les/2019_Ecosystem39_Trends%20of%20Waterbirds.pdf. AccessedSeptember 2020.
17. Blew J, Günther K, Hälterlein B, Kleefstra R, Laursen K, Scheiffarth G. Trends of migratory andwintering waterbirds in the Wadden Sea 1987/1988–2011/2012. Wadden Sea Ecosystem No. 34.Common Wadden Sea Secretariat, Joint Monitoring Group of Migratory Birds in the Wadden Sea,Wilhelmshaven, Germany. 2015. https://www.waddensea-worldheritage.org/de/node/447. AccessedSeptember 2020.
1�. Schwemmer P, Enners L, Garthe S. Migration routes of Eurasian Curlews (Numenius arquata) restingin the eastern Wadden Sea based on GPS telemetry. J Ornithol. 2016;157:901–05.
19. Sanders JD, Rees EC. Arrival and departure patterns of Eurasian Curlew Numenius a. arquatawintering on the River Severn estuary, Gloucestershire, southwest England. Wildfowl. 2018;68:155–71.
20. Garthe S, Montevecchi WA. Davoren GK Flight destinations and foraging behavior of northerngannets (Sula bassana) preying on a small forage �sh in a low-Arctic ecosystem. Deep Sea Res PartII. 2007;54:311–20.
21. Chevallier D, Handrich Y, Georges J-Y, Baillon F, Brossault P, Aurouet A, Le Maho Y, Massemin S.In�uence of weather conditions on the �ight of migrating black storks. Proc R Soc B.2010;277:2755–64. doi:10.1098/rspb.2010.0422.
22. Eikenaar C, Schmaljohann H. Wind conditions experienced during the day predict nocturnalrestlessness in a migratory songbird. Ibis. 2015;157:125–32.
23. Schmaljohann H, Lisovski S, Bairlein F. Flexible reaction norms to environmental variables along themigration route and the signi�cance of stopover duration for tota pseed of migration in a songbirdmigrant. Front Zool. 2017;14:17. doi:10.1186/s12983-017-0203-3.
24. Summers RW, de Raad AL, Bates B, Etheridge B, Elkins N. Non-breeding areas and timing ofmigration in relation to weather of Scottish-breeding common sandpipers Actitis hypoleucos. J AvianBiol. 2019; e01877. doi:10.1111/jav.01877.
25. Bruderer B. Nocturnal bird migration in the Negev (Israel) – a tracking radar study. Ostrich.1993;65:204–12. https://doi.org/10.1080/00306525.1994.9639683.
2�. Kemp MU, Shamoun-Baranes J, Dokter AM, van Loon E, Bouten W. The in�uence of weather on the�ight altitude of nocturnal migrants in mid-latitudes. Ibis. 2013;155:734–49.

Page 17/34
27. Currie D, Valkama J, Berg Å, Boschert M, Norrdahl K, Hänninen M, et al. Sex roles, parental effort andoffspring desertion in the monogamous Eurasian Curlew Numenius arquata. Ibis. 2001;143:642–50.
2�. Ma Z, Hua N, Zhang X, Guo H, Zhao B, Ma Q, et al. Wind conditions affect stopover decisions andfuel stores of shorebirds migrating through the south Yellow Sea. Ibis. 2011;153:755–67.
29. Guillaumet A, Dorr B, Wang G, Taylor JD, Chipman RB, Scherr H, et al. Determinants of local andmigratory movements of Great Lakes double-crested cormorants. Behav Ecol. 2011;22:1096–103.
30. Phillips RA, Xavier JC, Croxall JP. Effects of satellite transmitters on albatrosses and petrels. Auk.2003;120:1082–90.
31. Environmental Systems Research Institute (ESRI). ArcGIS v.10.3. ESRI, Redlands, California; 2011.
32. Lund U, Agostinelle C, Arai H, Gagliardi A, Portugues EG, Giunchi D, et al. Package ´circular´.https://cran.r-project.org/web/packages/circular/circular.pdf. 2017. Accessed September 2020.
33. Carslaw D, Ropkins K. Package ´openair´. 2020. https://cran.r-project.org/web/packages/openair/openair.pdf. Accessed September 2020.
34. Alerstam T, Hedenström A, Åkesson S. Long-distance migration: evolution and determinants. Oikos.2003;103:247–60.
35. Fransson T. Patterns of migratory fuelling in whitethroats Sylvia communis in relation to departure. JAvian Biol. 1998;29:569–73.
3�. R Core Team. R: a language and environment for statistical computing. R Foundation for StatisticalComputing, Vienna, Austria. 2017. https://www.R-project.org/. Accessed September 2020.
37. Wickham H, Chang W, Henry L, Pedersen TL, Takahashi K, Wilke C, et al. R package ´ggplot2´. 2010.https://cran.r-project.org/web/packages/ggplot2/ggplot2.pdf. Accessed September 2020.
3�. Zuur AF. A Beginner's Guide to Generalized Additive Models with R. Newburgh:Highland StatisticsLtd; 2012.
39. Wood S. Generalized Additive Models: an Introduction with R. 2nd ed. London: Chapman and Hall;2017.
40. Wood S. Package ´mgcv´. 2020. https://cran.r-project.org/web/packages/mgcv/mgcv.pdf. AccessedSeptember 2020.
41. Akaike H. Information theory and an extension of the maximum likelihood principle. In: Petrov BN,Caski F, editors. Proceeding of the Second International Symposium on Information Theory.Budapest: Akademiai Kiado; 1973. p. 267–81.
42. Tibshirani R. Regression shrinkage and selection via the lasso. J R Stat Soc Series B Stat Methodol.1996;58:267–88.
43. Tibshirani R. The lasso method for variable selection in the Cox model. Stat Med. 1997;16:385–95.
44. Usai M, Goddard M, Hayes B. LASSO with cross-validation for genomic selection. Genet Res (Camb).2009;91:427–36.
45. Korner-Nievergelt F, Roth T, von Felten S, Guelat J, Almasi B, Korner-Nievergelt P. Bayesian dataanalysis in ecology using linear models with R, BUGS, and Stan. London: Elsevier; 2015.

Page 18/34
4�. Tan K, Chohi C-Y, Peng H, Melville DS, Ma Z. Migration departure strategies of shorebirds at a �nalpre-breeding stopover site. Avian Res. 2018;9:15. https://doi.org/10.1186/s40657-018-0108-7.
47. Carneiro C, Gunnarsson TG, Alves JA. Linking weather and phenology to stopover dynamics of along-distance migrant. Front Ecol Evol. 2020;8:145. doi:10.3389/fevo.2020.00145.
4�. Watts A. Instant Weather Forecasting: You Can Predict the Weather. Adlard Coles Ltd. 1975.
49. Mateos-Rodríguez M, Liechti F. How do diurnal long-distance migrants select �ight altitude in relationto wind? Behav Ecol. 2012;23:403–40. doi:10.1093/beheco/arr204.
50. Dokter AM, Shamoun-Baranes J, Kemp MU, Tijm S, Holleman I. High altitude bird migration attemperate latitudes: a synoptic perspective on wind assistance. PLoS One. 2013;8:e52300.doi:10.1371/journal.pone.0052300.
51. Müller F, Taylor PD, Sjöberg S, Muheim R, Tsvey A, Mackenzie SA, et al. Towards a conceptualframework for explaining variation in nocturnal departure time of songbird migrants. Mov Ecol.2016;4:24. doi:10.1186/s40462-016-0089-2.
52. Åkesson S, Helm B. Endogenous programs and �exibility in bird migration. Front Ecol Evol.2020;8:78. doi:10.3389/fevo.2020.00078.
53. Reenerkens J, Schmidt NM, Gilg O, Hansen J, Hansen LH, Moreau J, et al. Effects of food abundanceand early clutch predation on reproductive timing in a high Arctic shorebird exposed toadvancements in arthropod abundance. Ecol Evol. 2016;6:7375–86. doi:10.1002/ece3.2361.
54. Saalfeld ST, McEwen DC, Kesler DC, Butler MG, Cunningham JA, Doll AC, et al. Phenologicalmismatch in Arctic-breeding shorebirds: Impact of snowmelt and unpredictable weather conditionson food availability and chick growth. Ecol Evol. 2019;9:6693–707. doi:10.1002/ece3.5248.
55. Piersma T, Zwarts L, Bruggemann JH. Behavioural aspects of the departure of waders before long-distance �ights: �ocking, vocalization, �ight paths and diurnal timing. Ardea. 1990;78:157–84.
5�. Åkesson S, Hedenström A. How migrants get there: Migratory performance and orientation.Bioscience. 2007;57:123–33.
57. Bulyuk VN, Tsvey A. Regulation of stopover duration in the European Robin Erithacus rubecula. JOrnithol. 2013;154:1115–26. doi:10.1007/s10336-013-0981-0.
5�. Hays QR, Morbey YE, Hobson KA, Jyons JE, Guglielmo CG. Effects of migration distance and sex onstopover timing and refueling by Wilson´s Warblers. J Field Ornithol. 2018;89:149–64.doi:10.1111/jofo.12246.
59. Verhoeven MA, Loonstra AHJ, Senner NR, McBride AD, Both C, Piersma T. Variation from an unknownsource: large inter-individual differences in migrating black-tailed godwits. Front Ecol Evol. 2019;7:31.doi:10.3389/fevo.2019.00031.
�0. Battley PF. Consistent annual schedules in a migratory shorebird. Biol Lett. 2006;2:517–20.doi:10.1098/rsbl.2006.0535.
Figures

Page 19/34
Figure 1
Left: location of study area in the southern part of the German Wadden Sea, south-eastern North Seacoast, indicated by black box. Right: study area for analyses of tailwind component �ight speeds and�ight altitudes (red box) and location of weather recording station (yellow dot). Satellite image: ESRI,DigitalGlobe, GeoEye, Earthstar Geographics, CNES/Airbus DS, USDA, USGS, AeroGRID, IGN, and the GISUser Community. Note: The designations employed and the presentation of the material on this map donot imply the expression of any opinion whatsoever on the part of Research Square concerning the legalstatus of any country, territory, city or area or of its authorities, or concerning the delimitation of itsfrontiers or boundaries. This map has been provided by the authors.

Page 20/34
Figure 1
Left: location of study area in the southern part of the German Wadden Sea, south-eastern North Seacoast, indicated by black box. Right: study area for analyses of tailwind component �ight speeds and�ight altitudes (red box) and location of weather recording station (yellow dot). Satellite image: ESRI,DigitalGlobe, GeoEye, Earthstar Geographics, CNES/Airbus DS, USDA, USGS, AeroGRID, IGN, and the GISUser Community. Note: The designations employed and the presentation of the material on this map donot imply the expression of any opinion whatsoever on the part of Research Square concerning the legalstatus of any country, territory, city or area or of its authorities, or concerning the delimitation of itsfrontiers or boundaries. This map has been provided by the authors.
Page 21/34
Figure 2
Proportion of curlews that departed from (left) and arrived at the wintering site (right) in relation to date.

Page 22/34
Figure 2
Proportion of curlews that departed from (left) and arrived at the wintering site (right) in relation to date.
Figure 3

Page 23/34
Proportion of curlews that departed from (a) and arrived at the wintering site (b) in relation to time of day(UTC).
Figure 3
Proportion of curlews that departed from (a) and arrived at the wintering site (b) in relation to time of day(UTC).

Page 24/34
Figure 4
Flight tracks (n=41) of 23 curlews between their wintering sites in the Wadden Sea and their breedingsites (white triangles). Red and orange dots indicate location of the �rst and last stop-over sites,respectively. Satellite image: see Fig. 1. Note: The designations employed and the presentation of thematerial on this map do not imply the expression of any opinion whatsoever on the part of ResearchSquare concerning the legal status of any country, territory, city or area or of its authorities, or concerningthe delimitation of its frontiers or boundaries. This map has been provided by the authors.

Page 25/34
Figure 4
Flight tracks (n=41) of 23 curlews between their wintering sites in the Wadden Sea and their breedingsites (white triangles). Red and orange dots indicate location of the �rst and last stop-over sites,respectively. Satellite image: see Fig. 1. Note: The designations employed and the presentation of thematerial on this map do not imply the expression of any opinion whatsoever on the part of ResearchSquare concerning the legal status of any country, territory, city or area or of its authorities, or concerningthe delimitation of its frontiers or boundaries. This map has been provided by the authors.

Page 26/34
Figure 5
Flight speed of departing (blue) and arriving curlews (red) in relation to tailwind component. Solid line:model curve; dashed lines: 95% con�dence intervals.

Page 27/34
Figure 5
Flight speed of departing (blue) and arriving curlews (red) in relation to tailwind component. Solid line:model curve; dashed lines: 95% con�dence intervals.

Page 28/34
Figure 6
Flight altitudes of departing (blue) and arriving curlews (red) in relation to tailwind component. Solid line:model curve; dashed lines: 95% con�dence intervals.

Page 29/34
Figure 6
Flight altitudes of departing (blue) and arriving curlews (red) in relation to tailwind component. Solid line:model curve; dashed lines: 95% con�dence intervals.

Page 30/34
Figure 7
Day of year of departure (blue) and arrival (red) in relation to linear distance to the breeding site. Solidline: model curve; dashed lines: 95% con�dence intervals.

Page 31/34
Figure 7
Day of year of departure (blue) and arrival (red) in relation to linear distance to the breeding site. Solidline: model curve; dashed lines: 95% con�dence intervals.

Page 32/34
Figure 8
Frequency distribution of mean wind directions and wind forces (ms-1) in the period 90 min before to 90min after curlew departure (a) and arrival (b).
Figure 8
Frequency distribution of mean wind directions and wind forces (ms-1) in the period 90 min before to 90min after curlew departure (a) and arrival (b).

Page 33/34
Figure 9
Departure days in successive years. Red solid line: model curve; dashed lines: 95% con�dence intervals,bold black line indicates 1:1 relationship, thin black lines depict departure days 3 days before or after this.

Page 34/34
Figure 9
Departure days in successive years. Red solid line: model curve; dashed lines: 95% con�dence intervals,bold black line indicates 1:1 relationship, thin black lines depict departure days 3 days before or after this.
Supplementary Files
This is a list of supplementary �les associated with this preprint. Click to download.
Supplement201028clean.docx
Supplement201028clean.docx