on the path to sunshot: the role of advancements in solar ... · on the path to sunshot: the role...
TRANSCRIPT

ON THE PATH TO SUNSHOT
May 2016 NREL/TP-6A20-65872
The Role of Advancements in Solar Photovoltaic Efficiency, Reliability, and Costs
Cover photos (clockwise from top left): Solar Design Associates, Inc., NREL 08563; SolarReserve; Dennis Schroeder, NREL 30551; and iStock 000075760625
Michael Woodhouse1, Rebecca Jones-Albertus2, David Feldman1, Ran Fu1, Kelsey Horowitz1, Donald Chung1, Dirk Jordan1, and Sarah Kurtz1
1 National Renewable Energy Laboratory2 U.S Department of Energy
NREL is a national laboratory of the U.S. Department of Energy, Office of Energy Efficiency and Renewable Energy, operated by the Alliance for Sustainable Energy, LLC.
On the Path to SunShot: The Role of Advancements in Solar Photovoltaic Efficiency, Reliability, and Costs
SUGGESTED CITATION Woodhouse, Michael, Rebecca Jones-Albertus, David Feldman, Ran Fu, Kelsey Horowitz, Donald Chung, Dirk Jordan, and Sarah Kurtz. 2016. On the Path to SunShot: The Role of Advancements in Solar Photovoltaic Efficiency, Reliability, and Costs. Golden, CO: National Renewable Energy Laboratory. NREL/TP-6A20-65872. http://www.nrel.gov/docs/fy16osti/65872.pdf.

NOTICE
This report was prepared as an account of work sponsored by an agency of the United States government. Neither the United States government nor any agency thereof, nor any of their employees, makes any warranty, express or implied, or assumes any legal liability or responsibility for the accuracy, completeness, or usefulness of any information, apparatus, product, or process disclosed, or represents that its use would not infringe privately owned rights. Reference herein to any specific commercial product, process, or service by trade name, trademark, manufacturer, or otherwise does not necessarily constitute or imply its endorsement, recommendation, or favoring by the United States government or any agency thereof. The views and opinions of authors expressed herein do not necessarily state or reflect those of the United States government or any agency thereof.
This report is available at no cost from the National Renewable EnergyLaboratory (NREL) at www.nrel.gov/publications.
Available electronically at SciTech Connect http:/www.osti.gov/scitechAvailable for a processing fee to U.S. Department of Energyand its contractors, in paper, from:
U.S. Department of EnergyOffice of Scientific and Technical InformationP.O. Box 62Oak Ridge, TN 37831-0062OSTI http://www.osti.govPhone: 865.576.8401Fax: 865.576.5728Email: [email protected]
Available for sale to the public, in paper, from:
U.S. Department of CommerceNational Technical Information Service5301 Shawnee RoadAlexandria, VA 22312NTIS http://www.ntis.govPhone: 800.553.6847 or 703.605.6000Fax: 703.605.6900Email: [email protected]

iii
This report is available at no cost from the National Renewable Energy Laboratory (NREL) at www.nrel.gov/publications.
Preface The U.S. Department of Energy launched the SunShot Initiative in 2011 with the goal of making solar electricity cost-competitive with conventionally generated electricity by 2020. At the time this meant reducing photovoltaic and concentrating solar power prices by approximately 75%—relative to 2010 costs—across the residential, commercial, and utility-scale sectors. To examine the implications of this ambitious goal, the Department of Energy’s Solar Energy Technologies Office (SETO) published the SunShot Vision Study in 2012. The study projected that achieving the SunShot price-reduction targets could result in solar meeting roughly 14% of U.S. electricity demand by 2030 and 27% by 2050—while reducing fossil fuel use, cutting emissions of greenhouse gases and other pollutants, creating solar-related jobs, and lowering consumer electricity bills.
The SunShot Vision Study also acknowledged, however, that realizing the solar price and deployment targets would face a number of challenges. Both evolutionary and revolutionary technological changes would be required to hit the cost targets, as well as the capacity to manufacture these improved technologies at scale in the U.S. Additionally, operating the U.S. transmission and distribution grids with increasing quantities of solar energy would require advances in grid-integration technologies and techniques. Serious consideration would also have to be given to solar siting, regulation, and water use. Finally, substantial new financial resources and strategies would need to be directed toward solar deployment of this magnitude in a relatively short period of time. Still the study suggested that the resources required to overcome these challenges were well within the capabilities of the public and private sectors. SunShot-level price reductions, the study concluded, could accelerate the evolution toward a cleaner, more cost-effective and more secure U.S. energy system.
That was the assessment in 2012. Today, at the halfway mark to the SunShot Initiative’s 2020 target date, it is a good time to take stock: How much progress has been made? What have we learned? What barriers and opportunities must still be addressed to ensure that solar technologies achieve cost parity in 2020 and realize their full potential in the decades beyond?
To answer these questions, SETO launched the On the Path to SunShot series in early 2015 in collaboration with the National Renewable Energy Laboratory (NREL) and with contributions from Lawrence Berkeley National Laboratory (LBNL), Sandia National Laboratories (SNL), and Argonne National Laboratory (ANL). The series of technical reports focuses on the areas of grid integration, technology improvements, finance and policy evolution, and environmental impacts and benefits. The resulting reports examine key topics that must be addressed to achieve the SunShot Initiative’s price-reduction and deployment goals. The On the Path to SunShot series includes the following reports:
• Emerging Issues and Challenges with Integrating High Levels of Solar into the Electrical Generation and Transmission Systems (Denholm et al. 2016)
• Emerging Issues and Challenges with Integrating High Levels of Solar into the Distribution System (Palmintier et al. 2016)
• Emerging Opportunities and Challenges in Financing Solar (Feldman and Bolinger 2016)

iv
This report is available at no cost from the National Renewable Energy Laboratory (NREL) at www.nrel.gov/publications.
• Utility Regulatory and Business Model Reforms for Addressing the Financial Impacts of Distributed Solar on Utilities (Barbose et al. 2016)
• The Role of Advancements in Photovoltaic Efficiency, Reliability, and Costs (Woodhouse et al. 2016)
• Advancing Concentrating Solar Power Technology, Performance, and Dispatchability (Mehos et al. 2016)
• Emerging Opportunities and Challenges in U.S. Solar Manufacturing (Chung et al. 2016)
• The Environmental and Public Health Benefits of Achieving High Penetrations of Solar Energy in the United States (Wiser et al. 2016).
Solar technology, solar markets, and the solar industry have changed dramatically over the past five years. Cumulative U.S. solar deployment has increased more than tenfold, while solar’s levelized cost of energy (LCOE) has dropped by as much as 65%. New challenges and opportunities have emerged as solar has become much more affordable, and we have learned much as solar technologies have been deployed at increasing scale both in the U.S. and abroad. The reports included in this series explore the remaining challenges to realizing widely available, cost-competitive solar in the United States. In conjunction with key stakeholders, SETO will use the results from the On the Path to SunShot series to aid the development of its solar price reduction and deployment strategies for the second half of the SunShot period and beyond.

v
This report is available at no cost from the National Renewable Energy Laboratory (NREL) at www.nrel.gov/publications.
Acknowledgments The authors thank the Solar Energy Technologies Office team for its support of this report and Robert Margolis of NREL for his management and oversight of the On the Path to SunShot report series. We also appreciate the knowledgeable input and helpful feedback provided by the following external reviewers: Shaffiq Jaffer (Total), Michael McGehee (Stanford), Richard Swanson (SunPower), and Dirk Weiss (First Solar). We thank Robin Newmark, Gian Porro, Dave Mooney, Barbara Goodman, Chuck Kutscher, and Mary Werner of NREL for comments on a draft of the report. Additional contributors from the National Renewable Energy Laboratory (NREL) include Keith Emery, Alfred Hicks, Kendra Palmer, Tim Remo, Peter Hacke, Carolyn Davidson, and Robert Margolis. The authors would also like to thank Jarett Zuboy (consultant) and Mike Meshek (NREL) for editorial assistance.
This work was funded by the Solar Energy Technologies Office of the U.S. Department of Energy (DOE) Office of Energy Efficiency and Renewable Energy (EERE) under Contract No. DE-AC36-08GO28308.
John Frenzl of NREL designed the covers for the On the Path to SunShot report series.

vi
This report is available at no cost from the National Renewable Energy Laboratory (NREL) at www.nrel.gov/publications.
List of Acronyms Al BSF aluminum back surface field a-Si amorphous silicon BOM balance-of-module BOS balance-of-system CAGR compound annual growth rate CIGS Copper Indium Gallium diSelenide Cz Czochralski CZTS Copper Zinc Tin diSelenide DNI direct normal irradiance DOE U.S. Department of Energy EIA Energy Information Administration GIS geographic information system HCPV high concentration photovoltaics HIT heterojunction intrinsic thin layer IBC interdigitated back contact IPCC Intergovernmental Panel on Climate Change ITC investment tax credit LCOE levelized cost of energy LCPV low concentration photovoltaics MACRS Modified Accelerated Cost Recovery Schedule NREL National Renewable Energy Laboratory O & M operation and maintenance OPV organic photovoltaics PERC passivated emitter and rear cell PV photovoltaic(s) TCS trichlorosilane

vii
This report is available at no cost from the National Renewable Energy Laboratory (NREL) at www.nrel.gov/publications.
Executive Summary U.S. photovoltaic (PV) deployment has increased at a compound annual growth rate of 54% since 2010—in part due to plummeting PV system prices during that period—from less than 0.1% of total U.S. electricity generation in 2010 to 0.9% at the end of 2015 (EIA 2015). Critical challenges remain to achieving the competitive solar energy costs and large-scale PV deployment envisioned under the U.S. Department of Energy’s SunShot Initiative, including the still relatively high upfront prices of PV systems. Figure ES-1 depicts modeled PV LCOE results by sector across the range of solar resources within the contiguous United States—showing the tremendous progress to date as well as the remaining improvements needed to reach the SunShot goals of 6, 7, and 9 cents per kWh (¢/kWh) in the utility, commercial, and residential sectors, respectively, without subsidies and with an average solar resource.
Figure ES-1. Historical, current, and SunShot LCOE calculations
The cases with the federal investment tax credit (ITC) assume a 30% credit in 2010 and 2015 and a 26% credit in 2020. The energy yields for the systems varies from 1120 to 2380 kWh/kW, depending upon location and mounting configuration, which leads to the range of LCOE values calculated across the continental United States.

viii
This report is available at no cost from the National Renewable Energy Laboratory (NREL) at www.nrel.gov/publications.
The authors of this report envision solar-energy cost reductions through lower PV module and balance-of-system (BOS) costs as well as improved system efficiency and reliability. After reviewing the recent history of PV price reductions, we demonstrate that numerous combinations of PV improvements could help complete the path to SunShot’s solar LCOE goals. This range of possibilities is created by the tradeoffs among key metrics like module price, efficiency, and degradation rate as well as system price and lifetime. For example, high module efficiency is important but probably not sufficient on its own to meet the aggressive LCOE goals. System reliability (lower degradation rates, longer system lifetimes) might be equally important.
In addition to this conceptual analysis, we employ LCOE modeling and bottom-up manufacturing cost analysis to map specific example pathways to SunShot-level PV system prices. Under one scenario, module prices drop by 29%–38% (depending on the sector) between 2015 and 2020. Narrowing the gap between the highest theoretical efficiencies and the efficiencies of the commercial products of today might produce module cost advantages, although the tradeoff between efficiency and manufacturing cost must be addressed effectively. Further, increased PV production scale is expected to drive down costs across technologies. For crystalline-silicon modules specifically, we map up to a 38% cost reduction based largely on kerfless wafer technology and higher cell efficiency via PERC architecture as well as industry maturation (Figure ES-2). We map cost reductions up to 33% for thin-film (CdTe) modules through thinner light-absorbing layers, improved light transmission, and other cell improvements as well as industry maturation (Figure ES-3). These pathways merely illustrate the feasibility of two of many possible approaches to significant module cost reductions.

ix
This report is available at no cost from the National Renewable Energy Laboratory (NREL) at www.nrel.gov/publications.
Figure ES-2. Historical, current, and two possible roadmap scenarios for crystalline-silicon
module manufacturing cost reductions
Efficiencies shown are for module area

x
This report is available at no cost from the National Renewable Energy Laboratory (NREL) at www.nrel.gov/publications.
Figure ES-3. Historical, current, and two possible roadmap scenarios for CdTe module manufacturing cost reductions
Efficiencies shown are for module area.
The BOS hardware and soft cost reductions required to achieve our modeled path to the SunShot targets are even larger than the module cost reductions, ranging from 54% (for fixed-tilt, utility-scale systems) to 77% (for residential systems) of total cost reductions. The residential sector’s high supply-chain costs, labor requirements, and customer-acquisition costs give it the greatest BOS cost reduction opportunities, followed by the commercial sector. These opportunities include various approaches to improving and standardizing BOS technologies and processes in addition to improvements in efficiency that reduce the contribution of BOS costs.
Finally, we consider a future scenario in which very high PV penetration requires additional costs to facilitate grid integration and increased power system flexibility—which might necessitate solar LCOEs even lower than the SunShot goals. We map one conceivable pathway to 3 ¢/kWh (utility-scale), 4 ¢/kWh (commercial), and 5 ¢/kWh (residential) PV systems. This analysis underscores the importance of combining robust improvements in PV module and BOS costs as well as PV system efficiency and reliability if such aggressive long-term targets are to be realized.

xi
This report is available at no cost from the National Renewable Energy Laboratory (NREL) at www.nrel.gov/publications.
Table of Contents 1 Introduction ......................................................................................................................................... 12 2 Analytical Methods, Price-Reduction Progress, and SunShot Targets ........................................ 15 3 SunShot Module Cost-Reduction Roadmaps .................................................................................. 21
3.1 Module Metrics to Achieve SunShot LCOE Goals ..................................................................... 21 3.2 Current Module Technologies and Costs .................................................................................... 23 3.3 Technology Development Roadmaps for Module Technologies ................................................ 27 3.4 Technology Advances for Improved Lifetime and Decreased Degradation ............................... 32
4 SunShot BOS Cost-Reduction Roadmaps ....................................................................................... 33 5 Cost Reductions Beyond the SunShot 2020 Targets ..................................................................... 35 6 Conclusions ........................................................................................................................................ 39 References ................................................................................................................................................. 40 List of Figures Figure ES-1. Historical, current, and SunShot LCOE calculations ............................................................ vii Figure ES-2. Historical, current, and two possible roadmap scenarios for crystalline-silicon module
manufacturing cost reductions ................................................................................................ ix Figure ES-3. Historical, current, and two possible roadmap scenarios for CdTe module manufacturing
cost reductions .......................................................................................................................... x Figure 1. U.S. PV market share by sector since 2010 (GTM and SEIA 2015) ........................................... 12 Figure 2. Market share by U.S. state since 2010 (GTM and SEIA 2015)................................................... 12 Figure 3. Historical, current, and SunShot 2020 target system prices for the utility, commercial, and
residential sectors (weighted national average for fixed-tilt systems) ................................... 15 Figure 4. Historical, current, and SunShot LCOE calculations .................................................................. 19 Figure 5. Permutations of the key metrics of module price, efficiency, degradation rate, and system
lifetime that might enable the SunShot targets ...................................................................... 22 Figure 6. Annual shipments of different PV technologies over time (Mints 2015) .................................... 24 Figure 7. Overview of c-Si module components—the cell shapes are typical for monocrystalline ........... 25 Figure 8. Typical thin-film module made by monolithic integration .......................................................... 26 Figure 9. Summary of NREL bottom-up cost model estimates for select PV module technologies
in 2015 ................................................................................................................................... 27 Figure 10. Historical, current, and possible roadmap scenarios for crystalline-silicon module
manufacturing cost reductions ............................................................................................... 30 Figure 11. Historical, current, and two possible roadmap scenarios for CdTe module manufacturing cost
reductions ............................................................................................................................... 31 Figure 12. Example modeled pathway toward an LCOE target of 3 ¢/kWh for 100-MW utility-scale
systems with 1,480 kWh/kW first-year performance ............................................................. 38
List of Tables Table 1. Current and SunShot PV System Cost Targets and LCOE Input Assumptions............................ 17 Table 2. Durability and Outdoor Performance for Technologies Described in Report .............................. 28 Table 3. Current and Example Long-Term LCOE Input Assumptions for 3, 4, and 5 ¢/kWh Targets ...... 36

12
This report is available at no cost from the National Renewable Energy Laboratory (NREL) at www.nrel.gov/publications.
1 Introduction Since 2010, total U.S. photovoltaic (PV) deployment has increased at a compound annual growth rate (CAGR) of 54%—ranging from 25% in the commercial sector to 54% in the residential sector to 74% in the utility-scale sector (Figure 1). In the first half of 2015, the top five markets for newly installed capacity across all three sectors were California (57% of the total 2.7 GW), Nevada (6.3%), North Carolina (4.9%), New York (4.6%), and Massachusetts (4.1%) (GTM and SEIA 2015).
Figure 1. U.S. PV market share by sector since 2010 (GTM and SEIA 2015)
Figure 2. Market share by U.S. state since 2010 (GTM and SEIA 2015)
In 2010, PV contributed less than 0.1% of electricity generation within the United States. Toward the end of 2015, PV represented 0.9% of electricity generation (EIA 2015). Critical challenges remain to achieving the larger-scale PV deployment envisioned under the U.S.

13
This report is available at no cost from the National Renewable Energy Laboratory (NREL) at www.nrel.gov/publications.
Department of Energy’s SunShot Initiative (IEA et al. 2010; IEA 2014; IEA 2015). The principal barriers to increasing deployment levels include the relatively high upfront prices of current PV systems and the resulting high cost of solar electricity, the very large and relatively long-lived stock of existing generation sources, and—increasingly—grid-integration challenges (Denholm and Margolis 2007; Hand et al. 2012).
This report addresses the PV price and energy cost barriers within the United States. PV prices and solar-energy costs arise from a complex mix of financial, technological, policy, and geographic factors. Other reports in the On the Path to SunShot series address critical financial, policy, and geographic issues as well as technological issues related to global manufacturing competitiveness and grid integration (Feldman and Bolinger 2016). Here we focus on PV module manufacturing and balance-of-system (BOS) costs as well as the efficiency and reliability of PV systems. These factors present numerous tradeoffs that must be balanced to achieve the SunShot solar-energy cost targets.
The aggressive SunShot targets aim to create cost parity between solar technologies and conventional generation technologies by 2020. These targets are quantified in terms of the levelized cost of energy (LCOE), which accounts for total lifecycle costs and electricity generation (e.g., as dollars per kilowatt-hour) from project inception to system decommissioning.1 By 2020, the SunShot Initiative aims to achieve unsubsidized LCOEs of 6 ¢/kWh for utility-scale PV systems, 7 ¢/kWh for commercial PV systems (20 kW to 1.0 MW), and 9 ¢/kWh for residential PV systems (smaller than 20 kW), assuming a moderate solar resource. These targets are set in order to compete with typical prices in each market (wholesale electricity rates for utility-scale PV2 and residential and commercial retail rates for residential and commercial PV).3
To enable the tracking of cost reduction progress, we translate these LCOE goals into installed price targets. For fixed-tilt systems with average U.S. solar resource, we calculate unsubsidized SunShot installed-price targets of $1.1/W for utility-scale PV, $1.3/W for commercial PV, and $1.6/W for residential PV. For utility-scale systems with the same solar resource, adding one-axis tracking raises that target to $1.2/W because the 27% increase in energy production offsets the higher $/W tracking system’s cost on an LCOE basis (Fu, James, and Woodhouse 2015). Beyond 2020, these installed-price targets might need to decline even further, as higher PV deployment could increase solar energy costs related to grid integration and utility business model reforms.
1 This metric by itself, however, does not explicitly account for the value of on-demand dispatchability. It is primarily for this reason that it is difficult to define a true LCOE “price parity” target for solar EIA (2015). 2 For a traditional utility, the costs beyond bulk power generation include transmission and distribution to the end user, O&M of the distribution system, administrative overhead, and interest expense. It is here that the economies-of-scale quickly become a factor in determining the cost for each kilowatt-hour delivered, as do considerations of distance and any existing available infrastructure for new transmission and distribution systems. This leads to differences in electricity rates between every end user based on their locations (i.e., distance from the bulk power generation system and all of the substations in between) and their total demand for electricity. 3 For customers of utilities that allow for “net metering,” where every solar-generated kilowatt-hour can directly substitute for every kilowatt-hour that would otherwise be purchased from the grid, a competitiveness benchmark of interest is the electrical power generation costs for a solar system versus the rate for electricity charged by the supplying utility company.

14
This report is available at no cost from the National Renewable Energy Laboratory (NREL) at www.nrel.gov/publications.
In the next section of this report, we discuss our methods for tracking price reductions and review recent progress. Section 3 then maps the PV module cost reductions and technology improvements required to achieve the SunShot targets. Section 4 does the same for BOS components and processes. In Section 5, we present initial analyses of pathways for achieving deeper solar-energy cost reductions beyond 2020. Finally, we offer conclusions in Section 6.

15
This report is available at no cost from the National Renewable Energy Laboratory (NREL) at www.nrel.gov/publications.
2 Analytical Methods, Price-Reduction Progress, and SunShot Targets
To track progress toward the SunShot price-reduction targets, we use a bottom-up methodology to account for the cost contributions of all components of residential, commercial, and utility PV system prices (Davidson et al. 2014; Chung et al. 2015; Fu, James, and Woodhouse 2015). The components include hardware (modules, inverters, racking systems, electrical conduit, etc.) and “soft costs” such as overhead and profit, customer acquisition, permitting, and engineering, procurement, and construction (EPC). State-level analysis is translated into a weighted national average by weighting each state’s installed capacity and costs.
Figure 3. Historical, current, and SunShot 2020 target system prices for the utility, commercial, and residential sectors (weighted national average for fixed-tilt systems)
Figure 3 shows our weighted-national-average PV system price results for 2010 and 2015, along with the SunShot goals. The variations in modeled systems prices across the United States for 2015 were $0.21/W for utility-scale, $0.13/W for commercial, and $0.19/W for residential systems (Chung et al. 2015). Figure 3 shows the remarkable progress that has been made since the launch of the SunShot Initiative: price reductions of 54% for utility-scale, 63% for commercial, and 55% for residential systems. In conjunction with national and state-level PV incentives, these dramatic price reductions drove the rapid growth of U.S. PV deployment during this period.

16
This report is available at no cost from the National Renewable Energy Laboratory (NREL) at www.nrel.gov/publications.
Figure 3 also breaks out the components of the price reductions. Module prices, which declined sharply between 2010 and 2015, were one major factor (see Section 3). Soft costs also fell dramatically across all three sectors owing to increased efficiency in system design and installation, increased installer experience and competition, and compressed margins. Non-module (BOS) hardware costs dropped as well: by $0.07/W (18%) for utility-scale, $0.33/W (50%) for commercial, and $0.17/W (37%) for residential systems between 2010 and 2015. The reasons for this include improved system designs that reduced the use of raw materials such as aluminum within racking systems; since 2012, rail products have been designed that use 15%–30% less aluminum per foot without compromising strength (Chung et al. 2015). Aluminum prices also declined, from $1.02/lb in 2010 to $0.65/lb in November 2015 (Bray 2011; London Metals Exchange 2015). In addition, module efficiency gains helped lower per-watt racking and electrical costs because these costs depend on the module count. Using 72-cell, rather than 60-cell, modules have also helped to reduce the module count in certain applications. Finally, inverter costs declined as well. Most residential systems still use single-phase, string-level inverters, although microinverters connected to each module gained market share—from 25% of the residential market in 2012 to 41% in 2015 (GTM and SEIA 2015). Although microinverters are generally more expensive than string-level inverters, increased use of this technology did not halt the trend toward lower inverter costs. In the commercial and utility sectors, larger inverters and higher system voltages also helped lower inverter costs.
Figure 3 also provides the system prices required to meet the SunShot 2020 LCOE targets. These LCOE targets are in terms of $/kWh, calculated as the net present value of lifecycle system costs per watt divided by the net present value of kWh lifecycle energy yield per watt. Table 1 shows the inputs for the National Renewable Energy Laboratory’s System Advisor Model (SAM) that are used to calculate LCOE, and Figure 4 shows the modeled LCOE results for the different sectors across the range of solar resources within the contiguous United States. The references within the table give the sources for the 2015 system cost benchmarks and the assumptions for the LCOE calculations. The 2020 per-watt system prices for all three sectors in figure 3 would achieve the SunShot LCOE targets with an average U.S. solar resource and without the 30% federal ITC. These correspond to the white horizontal bars in the 2020 scenarios within Figure 4. A SAM model set to the input assumptions shown in Table 1 is freely available for download within the supplementary information.
Table 1 (bottom row) and Figure 4 (colored bars) also show the LCOE ranges calculated using the system-price values from Figure 3 for systems located at opposite ends of the solar resource spectrum from across the continental United States. For example, in Daggett, California—one of best U.S. climates for PV—a typical multicrystalline-silicon, utility-scale system in a fixed-tilt configuration produces 1,880 kWh/kW in the first year of production. In Seattle, the same system produces only 1,120 kWh/kW, and therefore returns a higher calculated LCOE than Daggett. In Kansas City, Missouri, the yield is 1,480 kWh/kW, very close to the average between Daggett and Seattle. Dividing the same system price values by these different energy yields gives the LCOE ranges shown in Table 1 and Figure 4. Kansas City is used to approximate the average solar resource corresponding to the SunShot LCOE goals.

17
This report is available at no cost from the National Renewable Energy Laboratory (NREL) at www.nrel.gov/publications.
Table 1. Current and SunShot PV System Cost Targets and LCOE Input Assumptions
PV System Cost Inputs(2015 U.S. Dollars)
Residential Commercial Utility
2015 SunShot 2020 2015 SunShot
2020 2015 SunShot 2020
Direct Capital Costs ($/WDC)
System Size 2.0 – 20.0 kW 20.0 kW – 1.0 MW 1.0 MW – 1,000+ MW
Module Price 0.70 0.50 0.68 0.45 0.65 0.40
Inverter Price 0.30 0.15 0.15 0.12 0.15 0.10
Costs Associated With 1-axis Tracker
---- 0.15 0.10
Balance-of-System Equipment
0.50 0.30 0.35 0.25 0.35 0.25
Direct Installation Labor 0.35 0.20 0.20 0.15 0.20 0.10
Land Costs ---- 0.03 0.03
Grid Interconnection and Transmission
---- 0.05 0.03
Indirect Capital Costs ($/WDC)
Permitting and Environmental Studies 0.10 0.05 0.05 0.04 0.03 0.03
Customer Acquisition and System Design
0.35 0.10 0.05 0.03 0.04 0.02
Installer Overhead and Profit
0.70 0.25 0.65 0.22 0.20 0.10
Sales Taxes 0.10 0.05 0.07 0.04 0.05 0.04
Installed System Price ($/WDC) 3.10 1.60 2.20 1.30
1.75/1.90 Fixed Tilt/Tracker
1.10/1.20 Fixed Tilt/Tracker
O&M Parameters and Costs
Tilt Angle for Module 25o 25o 15o 15o Optimal tilt angle (e.g., 30o)
Optimal tilt angle
Degradation Rate (%/ year) 0.75% 0.2% 0.75% 0.2% 0.75% 0.2%
Average annual soiling loss (%/year) 5.0% 5.0% 5.0% 5.0% 5.0% 5.0%
O&M Annual Cost by Capacity ($/kW-yr) $20 $10 $15 $7.5
$15 (Fixed tilt) and $18 (Tracking)
$7 (Fixed tilt) and $10 (Tracking)
DC-to-AC power ratio 1.4 1.4 1.4 1.4
1.4 (Fixed tilt) 1.2 (Tracking)
1.4 (Fixed tilt) 1.2 (Tracking)

18
This report is available at no cost from the National Renewable Energy Laboratory (NREL) at www.nrel.gov/publications.
Total DC and AC Power Loss
4.5% and 2.0%
4.5% and 2.0%
4.5% and 2.0%
4.5% and 2.0%
4.5% and 2.0%
4.5% and 2.0%
Inverter Lifetime (years) 15 30 15 30 15 30
Inverter Replacement (Real 2015 $/WDC)
$0.15 ---- $0.12 ---- $0.10 ----
Financial Parameters and Incentives (All Using the SAM Template of PPA Single Owner)
IRR Target (%) 7.5% 7.5% 7.5% 7.5% 7.0% 7.0%
PPA Price Escalation (%/yr) 2.5% 2.5% 2.5% 2.5% 2.5% 2.5%
Analysis Period and IRR Target Year (Effective System Lifetime)
30 30 30 30 30 30
Inflation Rate (%/year) 2.5% 2.5% 2.5% 2.5% 2.5% 2.5%
Real Discount Rate (%/year) 4.9% 4.9% 4.9% 4.9% 4.4% 4.4%
Nominal Discount Rate (%/year) 7.5% 7.5% 7.5% 7.5% 7.0% 7.0%
Federal Income Tax Rate (%/year) 35% 35% 35% 35% 35% 35%
State Income Tax Rate (%/year) 7.0% 7.0% 7.0% 7.0% 7.0% 7.0%
Annual Insurance Rate (% of capital cost) and Property Tax Rate (%/year)
0% 0% 0% 0% 0% 0%
System Salvage Value (% of capital cost) 0% 0% 0% 0% 0% 0%
Percentage of Debt or Project Debt Service Coverage Ratio
0.0 0.0 0.0 0.0 0.0 0.0
Depreciation Class 5-yr MACRS
5-yr MACRS
5-yr MACRS
5-yr MACRS
5-yr MACRS
5-yr MACRS
Federal ITC Qualification 30% or 0% as noted
0% 30% or 0% as noted
0% 30% or 0% as noted 0%
State ITC Qualification 0% 0% 0% 0% 0% 0%
Real 2015 LCOE Without ITC Daggett, CA – Seattle, WA in U.S. ¢/kWh
14.5–23.9 7.0–11.5 10.6–
17.5 5.8–9.5
8.0–13.1 Fixed Tilt
4.5–7.4 Fixed Tilt
6.9–12.1 1-Axis Tracking
3.9–6.8 1-Axis racking

19
This report is available at no cost from the National Renewable Energy Laboratory (NREL) at www.nrel.gov/publications.
Figure 4. Historical, current, and SunShot LCOE calculations
The cases with the federal investment tax credit (ITC) assume a 30% credit in 2010 and 2015 and a 26% credit in 2020. The energy yields for the systems vary from 1120 to 2380 kWh/kW, depending upon location and mounting configuration. The white horizontal bars represent the calculated LCOE values for Kansas City, Missouri, which represents the average solar resource that is used for the SunShot targets of 9, 7, and 6 cents per kWh for residential, commercial, and utility sectors, respectively.
Several input assumptions for the LCOE calculations have been updated since the SunShot Vision Study (DOE 2012). The annual degradation rate for modules was originally assumed to be 1.0%/yr through 2020, but more recent studies suggest an expected mean degradation rate of 0.75%/yr, which is what we use here for 2015 (Jordan and Kurtz 2013; Jordan, Kurtz et al. 2015). The original average annual O&M expenses used were $32.8/kW-yr for residential, $23.5/kW-yr for commercial, and $19.93/kW-yr for utility-scale. Today’s expectations are closer to $20/kW-yr for residential, $15/kW-yr for commercial and fixed-tilt utility, and $18/kW-yr for 1-axis tracking utility (Fu, James, and Woodhouse 2015). The assumed discount rate is a particularly important change: the original study (DOE 2012) used 8.6%, but lower nominal project financing rates are already being realized by the industry, and we use nominal discount rates of 7.5% (for residential and commercial) and 7.0% (for utility-scale) (Skroback 2015). We increased the assumed inverter lifetimes from the original 10 years to 15 years in 2015, and we increased the projected 2020 lifetime from the original 20 years to 30 years. For the updated SunShot 2020 scenarios, we also set new module degradation rate targets of 0.2%/yr. Additionally, the original SunShot utility goals envisioned modules prices of $0.50/W, inverter prices of $0.10/W, and BOS and overhead costs of $0.40/W in order reach total $1.0/W system

20
This report is available at no cost from the National Renewable Energy Laboratory (NREL) at www.nrel.gov/publications.
prices. To reflect more recent technological progress, our updated 2020 utility goal assumes $0.40/W module prices, $0.10/W inverter prices, and $0.60/W BOS and overhead costs in order to reach total $1.1/W system prices. Similar dynamics allow for higher installed prices in the residential and commercial sectors versus the original SunShot Vision Study (DOE 2012): from the original $1.25/W target for commercial to $1.3/W, and from the original $1.5/W in residential to $1.6/W. Sensitivity analyses around these metrics have been detailed elsewhere (Jones-Albertus, Feldman et al. 2015), and they are discussed further throughout this report.
In the residential and commercial sectors, third-party PV ownership arrangements—such as leases and PPAs—have proliferated, constituting 63%–90% of residential systems, depending on the state (Chung et al. 2015). The details of such arrangements affect system prices and LCOE. For example, leased residential systems typically have higher soft costs than host-owned systems, but they enable the lessor to utilize depreciation as a tax benefit, which can reduce LCOE. We apply the 5-year Modified Accelerated Cost Recovery Schedule (MACRS) benefit in all LCOE calculations. In 2010 and 2015 we also calculate LCOE with and without the 30% federal Investment Tax Credit (ITC). In the 2020 scenarios, we calculate LCOE with and without the recent extension of the ITC under the Consolidated Appropriations Act of 2016 (House Resolution 2029). Under this resolution, the ITC for solar systems is set to be 26% in 2020 and 22% in 2021.
This section has described historical, current, and SunShot system-price and LCOE values. The following sections discuss technological developments that may help provide the necessary advances toward the SunShot 2020 targets.

21
This report is available at no cost from the National Renewable Energy Laboratory (NREL) at www.nrel.gov/publications.
3 SunShot Module Cost-Reduction Roadmaps The cost, efficiency, and reliability of PV modules—and the tradeoffs among these aspects—are critical determinants of LCOE. This section discusses the combinations of module metrics that could achieve the SunShot LCOE goals, characterizes the major PV technologies and their costs, provides two example pathways of PV module development that could realize the 2020 module targets shown in Table 1, and discusses opportunities for improving PV lifetime and reducing degradation.
3.1 Module Metrics to Achieve SunShot LCOE Goals Many combinations of system cost and performance pathways—beyond the pathway shown in Table 1—could lead to the SunShot 2020 LCOE goals. Figure 5 illustrates the significant LCOE impacts and tradeoffs for the key metrics of module price, efficiency, and degradation rate as well as system price and lifetime. Each iso-LCOE curve in the figure corresponds to different permutations of these factors, calculated using SAM, which would achieve the SunShot 2020 LCOE goals—with all other factors remaining equal within each sector. For example, a higher-priced system with a lower degradation rate and/or longer lifetime can achieve the same LCOE as a lower-priced system that has a higher degradation rate and/or shorter lifetime, because the higher-priced system produces more energy over its lifetime.4 With the total per-watt system cost held constant along each of the curves, all the different pairings of module price and efficiency could yield the LCOE targets in their respective sectors, at the stated degradation rate and system lifetime. For the utility cases, the soft, inverter, and other BOS hardware costs are held constant at $140/m2, which corresponds to $0.70/W at 20% efficiency. For a total $1.10/W system cost target in the baseline 2020 SunShot scenario, this corresponds with the remaining $0.40/W budget for modules. The total fixed BOS costs are $170/m2 for the commercial case and $220/m2
for the residential case, which equate to $0.85/W and $1.10/W at 20% efficiency. The concavity of each curve is different over the given range of efficiencies due to the different costs per square meter for each system. The baseline case for each sector is shown as an orange circle; they are all based on 20% module efficiency and a 0.2%/yr degradation rate.
4 Although PV system lifetime is sometimes assumed to be the point at which performance reaches 80% of the system’s initial rated value, here the system lifetime is specified separately, at 10, 30, or 50 years, as noted in the figure. The lifetime determines the financial analysis period used in the LCOE calculations.

22
This report is available at no cost from the National Renewable Energy Laboratory (NREL) at www.nrel.gov/publications.
Figure 5. Permutations of the key metrics of module price, efficiency, degradation rate, and
system lifetime that might enable the SunShot targets
(a) Utility (b) Commercial, and (c) Residential
Figure 5 shows that high efficiency is important but probably not sufficient on its own to meet the aggressive SunShot LCOE goals. Reliability (in terms of degradation rate and system lifetime) is perhaps equally important (Jones-Albertus 2015). The figure also illustrates the potential price premiums for modules offering efficiency or reliability higher than the baseline case, as well as the potential discount for modules with lower efficiency or reliability. Extending the system lifetime from a more standard expectation of 30 years in 2015 to 50 years over the long term—assuming investors and project developers could be convinced of that increase—yields an allowance for higher module prices across the entire range of efficiencies. In the extreme case, approaching the highest theoretical single-junction PV efficiency potential and achieving very high reliability could allow module prices as high as $1.20/W to achieve the 9 ¢/kWh residential goal (see the highest curve at far right). Conversely, poor reliability hinders attainment of the SunShot goals. With a system lifetime of 10 years and a degradation rate of 2.0%/yr (red curves), even a free module would require an efficiency of at least 26%–29%. If, however, a low-reliability system also enabled lower installation costs, then the efficiency and module price requirements relax somewhat, although they are still challenging. While not shown in Figure 5, a utility-scale system with a 10-year lifetime, 2.0%/yr degradation rate, and 50% lower labor and hardware costs (giving a budget of $110/m2 total inverter, other BOS, and overhead costs) could allow a $0.10/W module price at 25% efficiency or a $0.30/W module price at 40% efficiency. Lower labor and hardware costs would help higher-reliability systems as well—a 50% reduction in those costs allows a roughly $0.10/W increase in module price for all curves.

23
This report is available at no cost from the National Renewable Energy Laboratory (NREL) at www.nrel.gov/publications.
Figure 5 outlines permutations of module efficiency, reliability, and price that could yield the SunShot targets for an average U.S. solar resource. These pathways are technology agnostic in the sense that the cost goals for any module technology could be placed within the context of the given LCOE goals, once the performance characteristics are known. In the next section we apply this technique to today’s major PV module technologies.
3.2 Current Module Technologies and Costs Several cell and module technologies are currently commercially available, and an even greater number are being contemplated for the future. Figure 6 shows the approximate market share of the major PV technologies sold and shipped since 2004 (Mints 2015). Although not shown because of their extremely small market share, III-V technologies are also being manufactured and offer the highest efficiencies among all solar cell types. Most III-V technologies focus on the markets of space applications, unmanned aerial vehicles, and concentrator PV. At the end of 2014, the total global installed capacity was around 300 MW for high-concentration PV (HCPV) and 25 MW for low-concentration PV (LCPV) (Philipps et al. 2015). Predominantly at the laboratory scale, there are also next-generation technologies including organic PV (OPV), copper zinc tin diselenide (CZTS), and perovskites, to name just a few.
Crystalline-silicon technologies accounted for 94% of PV module shipments in 2014, and have consistently accounted for 80%–95% of module shipments for decades. This family of technologies can be broadly classified as either monocrystalline or multicrystalline depending on how the polysilicon feedstock is melted and solidified into an ingot. Monocrystalline silicon cells are most widely produced using wafers made by the Czochralski (Cz) process of ingot formation and wire sawing. The resulting ingots are cylindrical in shape. To achieve the maximum packing density of cells on a module, the wafers are then made into a “pseudo-square” shape by sawing the ingot lengthwise. Multicrystalline wafers are fabricated from very large (hundreds of kilograms) ingots that assume the shape of a cube. For this reason, multicrystalline wafers are perfectly square once sawn from the ingot. Each monocrystalline and multicrystalline ingot produces thousands of wafers. Multicrystalline wafers are cheaper than monocrystalline wafers principally because the ingots are much larger: the larger ingot size leads to lower equipment costs for each wafer because the output per machine is much greater. On the other hand, monocrystalline wafers do generally enable higher cell efficiencies because of material quality differences (e.g., monocrystalline wafers typically offer higher charge carrier lifetimes and lower density of bulk material defects).

24
This report is available at no cost from the National Renewable Energy Laboratory (NREL) at www.nrel.gov/publications.
Figure 6. Annual shipments of different PV technologies over time (Mints 2015)
Once a wafer is made a number of options are available for cell conversion. Today, the primary commercially available options include full-area aluminum back surface field (Al BSF) cells, passivated emitter and rear cells (PERC), interdigitated back contact (IBC) cells, heterojunction intrinsic thin layer (HIT) cells, and bifacial cells. Of these, full-area Al BSF cells are the most widely produced and offer the lowest cell-level costs per watt. PERC cells are, however, rapidly gaining market share and they can be made with either Cz or multicrystalline wafers. The other cell architectures typically use Cz wafers and require more numerous and complex manufacturing steps. These advanced cell architectures also require improved wafer purity and often a switch from p-type base doping within the wafer to n-type base doping, which increases cost (Goodrich et al. 2012). The other cell architectures, however, offer improved efficiencies: at commercial scale, the typical improvement is from an expected 16%–18% commercial production average efficiency for Al BSF cells made on p-type multicrystalline wafers to 22%–26% commercial production efficiencies available from IBC and HIT cells made on high-purity n-type Cz wafers (Green et al. 2015). The higher cell efficiencies lead to costs savings at the module and BOS level (Jones-Albertus et al. 2015).
In manufacturing lines separate from cell conversion, the final step of module assembly begins by electrically connecting the individual cells into strings. The strings of cells are then encased between two layers of a protective polymer sheet, such as ethylene vinyl acetate (EVA), and are further protected from the elements by lamination between either two sheets of glass or glass and a backsheet. The wired cells are also connected at one end of the module through an electrical junction box, which is then also used to connect modules electrically when they are installed into a total system. Figure 7 shows these components.

25
This report is available at no cost from the National Renewable Energy Laboratory (NREL) at www.nrel.gov/publications.
Figure 7. Overview of c-Si module components—the cell shapes are typical for monocrystalline
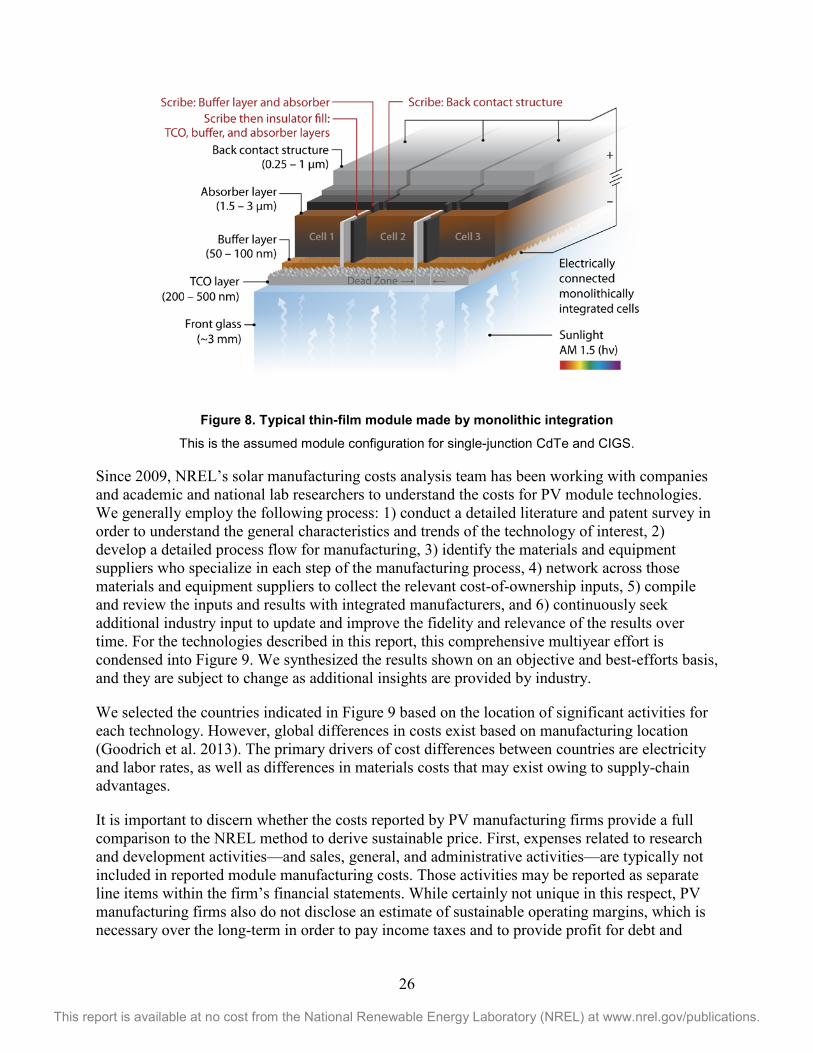
Non-crystalline silicon PV technologies typically use much thinner light-absorbing layers because of their direct bandgap for light absorption (crystalline silicon has an indirect bandgap). The typical crystalline silicon wafer is 140–200 μm thick, while the other technologies typically have light-absorbing layers that are only 0.2–5.0 μm thick—giving them the name “thin films.” This name is also appropriate because the light-absorbing layers are often deposited as a film directly on glass. Thin-film technologies also differ from c-Si because of their use of monolithic integration, which introduces a series of very narrow lines into the thin-film layer via lasers and fine-tipped scribes. Monolithic integration divides the total module area into individual cells, which improves the total module efficiency relative to having only one cell across the whole module area. Figure 8 shows a general monolithic design.
Solution-processable thin-film materials are also being developed that could be printed in a roll-to-roll fashion. Owing to their flexible form factor, these technologies aim to significantly reduce manufacturing equipment and installation costs. Now, however, the efficiencies and/or reliability of these technologies have limited their commercial applications.
26
This report is available at no cost from the National Renewable Energy Laboratory (NREL) at www.nrel.gov/publications.
Figure 8. Typical thin-film module made by monolithic integration
This is the assumed module configuration for single-junction CdTe and CIGS.
Since 2009, NREL’s solar manufacturing costs analysis team has been working with companies and academic and national lab researchers to understand the costs for PV module technologies. We generally employ the following process: 1) conduct a detailed literature and patent survey in order to understand the general characteristics and trends of the technology of interest, 2) develop a detailed process flow for manufacturing, 3) identify the materials and equipment suppliers who specialize in each step of the manufacturing process, 4) network across those materials and equipment suppliers to collect the relevant cost-of-ownership inputs, 5) compile and review the inputs and results with integrated manufacturers, and 6) continuously seek additional industry input to update and improve the fidelity and relevance of the results over time. For the technologies described in this report, this comprehensive multiyear effort is condensed into Figure 9. We synthesized the results shown on an objective and best-efforts basis, and they are subject to change as additional insights are provided by industry.
We selected the countries indicated in Figure 9 based on the location of significant activities for each technology. However, global differences in costs exist based on manufacturing location (Goodrich et al. 2013). The primary drivers of cost differences between countries are electricity and labor rates, as well as differences in materials costs that may exist owing to supply-chain advantages.
It is important to discern whether the costs reported by PV manufacturing firms provide a full comparison to the NREL method to derive sustainable price. First, expenses related to research and development activities—and sales, general, and administrative activities—are typically not included in reported module manufacturing costs. Those activities may be reported as separate line items within the firm’s financial statements. While certainly not unique in this respect, PV manufacturing firms also do not disclose an estimate of sustainable operating margins, which is necessary over the long-term in order to pay income taxes and to provide profit for debt and

27
This report is available at no cost from the National Renewable Energy Laboratory (NREL) at www.nrel.gov/publications.
equity investors. Additionally, the NREL method assumes equipment and facilities costs that would be more representative of all-new capacity; therefore, our represented costs for this category may be higher than what many firms are able to realize by utilizing legacy capacity and/or by purchasing used equipment. In total, the minimum sustainable prices that we derive in figure 9 are anywhere from $0.10/W to $0.20/W higher than many of the most recently reported costs from c-Si and thin-film manufacturing firms. As a final note, the SunShot scenarios shown throughout this report are based upon a presumption of sustainable module pricing.
Figure 9. Summary of NREL bottom-up cost model estimates for select PV module technologies in 2015
Important manufacturing location and average module efficiency in parentheses
3.3 Technology Development Roadmaps for Module Technologies Perhaps the most powerful use of cost modeling is to quantify the value of specific research opportunities. Detailed cost modeling can be used to evaluate the impacts of specific technology improvement opportunities in terms of their ability to reach certain cost and performance targets (through improvements in efficiency and manufacturing throughput, material substitution, solar cell design changes, or another innovation). To apply such a method here, we first take stock of each technology’s current status. Table 2 gives the commercial production average efficiency and durability benchmarks for the technologies that have been discussed as well as the demonstrated best and theoretical maximum efficiencies of laboratory cells for each material set.
Table 2 also includes temperature coefficients, which affect the energy production that can be expected from each technology. As module temperatures rise, the performance of most PV technologies declines. The temperature coefficient describes how the efficiency changes when

28
This report is available at no cost from the National Renewable Energy Laboratory (NREL) at www.nrel.gov/publications.
the temperature is not at the 25°C standard used in certified efficiency benchmarking. For example, a temperature coefficient of -0.3%/oC means that a module operating at 60°C would produce 10.5% less energy than at its 25°C standard rated efficiency. Particularly for installations in hot climates, this can be an important factor.
Yet another factor—the efficiency of the solar cell under non-standard lighting conditions—also affects energy production in the field. Incorporating these corrections for each technology is specific to the field operating conditions, and a careful examination of weather data is needed for a chosen location. These climatic effects require a detailed study for each technology and are beyond the scope of this report. In general, however, a technology offering a lower temperature coefficient and better efficiency in low-light conditions can be expected to yield more energy in hot and cloudy climates. Field observations for CdTe, for example, are in the range of a 5%–9% improvement in annual energy production in hot and cloudy environments over standard multicrystalline silicon (Strevel et al. 2012). For the same nameplate installed capacity, this typically gives thin-film technologies a slight LCOE advantage over crystalline silicon technologies.
Table 2. Durability and Outdoor Performance for Technologies Described in Report
LCOE Considerations for Different PV Technologies
Efficiency Durability Temperature Coefficient
Champion Research Cell and Theoretical Maximum (Green et al. 2015)a
2015 Commercial Production Modulesb
Degradation Rate (95% confidence interval)2 (Jordan and Kurtz 2013; Jordan et al. 2015)
Total Range (Jordan and Kurtz 2013)
Range of 90% Confidence Intervalc (Kinsey et al. 2008)
a-Si 13.6% (28%)
8% (6%–10%)
1.0% to 1.3%/yr 0.2% to 4.5%/yr
-0.1% to -0.3%/oC
CdTe 21.5% (28%)
16% (13%–18%)
0.7% to 1.0%/yr 0% to 1.5%/yr
-0.2% to -0.3%/oC
CIS/CIGS 22.3% (26–29%)
14% (12%–17%)
0.7% to 1.0%/yr 0.4% to 3.0%/yr
-0.3% to -0.4%/oC
Monocrystalline Silicon
25.6% (28%)
16% (14%–22%)
0.5% to 0.8%/yr 0.4% to 2.8%/yr
-0.3% to -0.5%/oC
Multicrystalline Silicon
21.3% (28%)
16% (13%–19%)
0.5% to 0.8%/yr 0.4% to 3.2%/yr
-0.4% to -0.5%/oC
a The theoretical maximum efficiencies correspond to the approximate radiative efficiency limits from Green 2011. b The commercial production module efficiencies on the top are meant to represent the typical efficiencies for the most widely shipped modules. The ranges below reflect efficiency offerings from various brands. c The range of degradation rates and temperature coefficients are over the 95% and 90% confidence intervals, respectively.

29
This report is available at no cost from the National Renewable Energy Laboratory (NREL) at www.nrel.gov/publications.
Each technology has improved over time, and each possesses opportunities for further progress. Importantly, there are gaps in efficiency between the typical commercial production modules, the champion laboratory cells, and the theoretical maximum for each cell. Advancing the record cell efficiencies even further, and then narrowing the gaps between record cells and commercial production modules, could provide dividends at the balance-of-module and total-system cost levels. This would require sustained effort in laboratory research and development, as well as developing gigawatt-scale manufacturing processes that would yield modules approaching the laboratory record cell efficiencies and, eventually, the theoretical maximums. This is challenging from a cost-benefit standpoint because the highest-efficiency cells are typically fabricated through processes requiring many more steps and, sometimes, more expensive input materials—thus, advances in process engineering and materials science are required.
Given its contribution to the PV market, it is first worth considering how the costs for the silicon family of technologies might change over time. The first pathway is the “economies-of-scale” effect or, more colloquially within the PV community, “Swanson’s Law” (Swanson 2007; Nemet 2006). The observation behind this law is that, for every doubling of growth in cumulative shipments, the price of PV modules has historically declined by 20%. By this model, if the same phenomenon of scale economies and learning-by-doing held, the module price targets in Table 1 could be achieved by scaling from the roughly 200 GW of installed capacity at the end of 2015 to 950 GW of installed capacity. To realize cost reductions through scaling or by other means ultimately requires innovations. Historically, improvements in process engineering and design for each piece of the supply chain have driven these cost reductions, including the major innovations of increasing solar cell sizes, moving from evaporated metallizations to screen-printing, and increased automation (Swanson 2007). Looking forward, we can postulate what might perpetuate Swanson’s Law into the future.
To begin, crystalline silicon wafer production presents numerous opportunities for cost reductions. At present, most c-Si wafers are laboriously sawn from an ingot—thereby losing a large amount of silicon due to sawing dust, or “kerf,” loss. This leads to materials waste and an associated higher cost, because the high impurity content and difficulty of impurity removal means kerf loss is essentially unusable. There is around 150 µm of kerf loss for every 160–200 µm thick wafer that is produced today (Goodrich et al. 2012). To bypass these losses, several kerfless wafering techniques have emerged, including epitaxial growth from a parent substrate and cast wafers. These techniques may offer significantly lower wafer costs: projections suggest they might cut wafer manufacturing costs by about half. Besides reducing materials loss, the benefits of kerfless wafers could include lower energy consumption and elimination of the costs associated with sawing equipment, wafer cleaning, moving large ingots around a factory, and so forth. Reducing wafer thickness and also using a kerfless technique—assuming there are no overwhelming yield losses that might carry all the way through module assembly—might yield an even lower wafer cost. Kerfless wafers might also eliminate some steps in cell processing because some solar cell device layers can be grown-in during wafer formation.
Crystalline-silicon cell improvements beyond the established full-area Al BSF technology also promise cost-reduction opportunities, including balance-of-module (BOM) and BOS savings due to higher cell efficiency. This is because most commodity materials in module assembly are sold on a cost-per-area ($/m2) basis, so efficiency improvements can reduce per-watt costs as more watts are produced within the same area.

30
This report is available at no cost from the National Renewable Energy Laboratory (NREL) at www.nrel.gov/publications.
Figure 10 shows two possible roadmap scenarios for reducing the cost of crystalline-silicon modules along with historical progress. Improvements include higher cell efficiency, with the PERC cell architecture used as just one example for enabling higher efficiencies by surface passivation. The figure also includes cost savings from kerfless wafers, assuming that the input polysilicon price is $20/kg. In 2015, spot and contract polysilicon prices as low as $15/kg were available, but this price may not sustainable (Fu, James, and Woodhouse 2015). Finally, the benefits of a long-term goal of 25% module efficiency are shown.
Figure 10. Historical, current, and possible roadmap scenarios for crystalline-silicon module
manufacturing cost reductions
Efficiencies shown are for module area.

31
This report is available at no cost from the National Renewable Energy Laboratory (NREL) at www.nrel.gov/publications.
There are also cost-reduction opportunities for thin-film technologies relative to the 2015 baseline. For technologies including CdTe and CIGS, many of these improvements entail better understanding and control of materials science issues, including higher carrier lifetimes, doping profile, bandgap grading within the light-absorbing layer, and better control of interfaces such as those between the window and buffer layer and the semiconductor and metal contacts (Woodhouse et al. 2013). Higher-transmission glass with an antireflection coating and improved optical properties within the TCO layer should also increase efficiency by improving the transmission of sunlight into the active layers. The III-V thin-film cell technologies already offer very high efficiency; their primary challenge is maintaining these efficiencies while lowering costs. Cheaper deposition methods, different material precursors (e.g., moving away from metal-organic and hydride compounds), and increased substrate reuse for epitaxial lift-off methods have been identified as possible routes to lower costs (Woodhouse and Goodrich 2013; Ward et al. 2015). Figure 11 shows past, present, and potential long-term module manufacturing costs for an example thin-film technology (CdTe). The long-term sustainable module price is calculated to be slightly lower than for c-Si, but may yield similar total system costs due to the slightly lower module efficiency that is projected (Jones-Albertus et al. 2015).
Figure 11. Historical, current, and two possible roadmap scenarios for CdTe module
manufacturing cost reductions
Efficiencies shown are for module area.

32
This report is available at no cost from the National Renewable Energy Laboratory (NREL) at www.nrel.gov/publications.
3.4 Technology Advances for Improved Lifetime and Decreased Degradation
Figure 5 demonstrates the value of improving the lifetime and/or decreasing the degradation rate of PV modules and systems to reach the SunShot goals. Opportunities for researchers to realize the new reliability targets can be divided into two parts: 1) development of new technologies that directly enable longer lifetimes and slower degradation, and 2) development of understanding, tests, and standards that help PV customers and investors reduce the uncertainty surrounding PV reliability.
Summaries of common field observations of failures and degradation can be found in the literature (Kempe et al. 2006; Hacke et al. 2010; Miyashita and Masuda 2012). Current research topics related to addressing these issues include developing higher-resistivity encapsulant materials to reduce risk of potential induced degradation; formulating encapsulant materials that do not change color (by yellowing or exhibiting “snail trails”); designing modules to exhibit fewer cracked cells, broken ribbons, and failed solder bonds; and developing encapsulant materials and lamination techniques that result in packaging without signs of delamination or chemical corrosion. For p-type crystalline-silicon cells, another important research topic relates to heat- and light-induced degradation of the cells due to the formation of boron-oxygen complexes and the formation of dangling bonds on the frontside of the cell due to ultraviolet (UV) radiation damage (Wohlny et al. 2013). These and multiple other research efforts could guide module designs toward products that can last 40–50 years in some or all climates.
Once a robust module design has been identified, controls are needed to ensure consistent manufacturing of that design. More research is needed to optimally control the process window and prevent shipment of product with latent defects. Ideally, materials are qualified with simple and inexpensive tests, and manufacturing processes are controlled by maintaining the temperature or other process parameter within the desired process window with little need for extensive product testing to ensure durability.
As research elucidates the science behind PV failure mechanisms, the PV community benefits from establishing standard ways of testing for these failures. For example, the International Electrotechnical Commission (IEC) Technical Committee 82 (TC82) has developed standards for qualification (IEC 61215) and safety (IEC 61730) testing of PV modules. The International PV Quality Assurance Task Force (PVQAT), a worldwide consortium of volunteers in the community, is working to implement and adapt a PV-specific form of the ISO 9001 standard for repeatable and reproducible manufacturing. ICERE is working to create a set of standards to verify proper system installation and performance. In addition, organizations like NABCEP in the United States promote training and verification of essential PV installation skills.

33
This report is available at no cost from the National Renewable Energy Laboratory (NREL) at www.nrel.gov/publications.
4 SunShot BOS Cost-Reduction Roadmaps Figure 3 shows the past (2010), present (2015), and SunShot-target national average system costs that would yield the SunShot LCOE goals in Kansas City, which has an average solar resource among locations in the contiguous U.S. The assumed systems have typical multicrystalline silicon PV module efficiencies for each timeframe: 14% in 2010, 16% in 2015, and a 20% target for 2020. Relative to today, further costs reductions of 37% for utility-scale systems, 45% for commercial systems, and 52% for residential systems are needed to reach the SunShot 2020 goals. Of these total system cost reductions, 54% (for fixed-tilt, utility-scale systems) to 77% (for residential systems) come from BOS hardware and soft cost reductions (i.e., reductions in all capital expenditures other than the module and inverter). Clearly, reducing these costs is critical to reaching the SunShot goals. BOS cost-reduction opportunities include the following:
• BOS Hardware Cost-Reduction Opportunities
1. Improved module efficiency via more efficient solar cells, which reduces BOS costs for a variety of reasons (Jones-Albertus, Feldman et al. 2015)
2. Novel racking and installation materials, methods, and designs 3. Optimal structural design codes for PV systems (oftentimes systems are overbuilt) 4. Standardized racking systems for specific module types (e.g., frameless modules) 5. New methods for integrating power electronics (e.g., microinverters on the actual
module or string inverters) that reduce the overall effort for installing modules 6. Overall changes to system designs that reduce BOS costs, e.g., using higher-
voltage systems in the 1,500 VDC range 7. Building-integrated PV, in which the module replaces standard roofing materials
or building facades and is installed during initial building construction 8. Modular construction of PV systems
• BOS Soft Cost-Reduction Opportunities
9. Improved software and databases for reducing times to design and install systems 10. Streamlined project planning, permitting, and interconnection processes and shared
best practices from across the globe 11. Robotic-based installations to save on labor costs 12. Scaled-up installation capacity for commercial and utility-scale systems to lower
developer costs 13. Reduced logistics costs, e.g., by preassembly or kitting of systems and/or using
systems that require less complicated electrical interconnections and thus reduce electrical labor costs
14. Reduced customer-acquisition costs through state-of-the-art marketing methods 15. Use of more non-skilled labor 16. Standardized systems to reduce time needed for design and construction 17. Reduced labor costs via streamlining task and time requirements of system
installation.

34
This report is available at no cost from the National Renewable Energy Laboratory (NREL) at www.nrel.gov/publications.
Residential systems typically have the highest installed system prices for a variety of reasons, including more fragmented distribution channels between manufactured modules, hardware components, power electronics, and installed systems. Each party involved with handling and distributing these components adds a margin above purchasing price. Residential systems also have higher labor requirements per watt installed and greater customer-acquisition costs. For example, in 2015 the labor productivity for residential systems is 110–220 W installed per hour of structural and electrical labor; in contrast, utility-scale systems have a labor productivity of 220–250 W installed per hour (Chung et al. 2015; Fu, James, and Woodhouse 2015). Utility systems have the lowest overall installed price as well, because—for everything from project acquisition to the purchase of hardware—they can realize economies-of-scale. Thus, we estimate that opportunities for reducing soft costs are greatest in the residential and commercial sectors.
For utility-scale systems, most development activities may be approaching their minimum, including land acquisition, environmental permitting and entitlement, and interconnection studies that total around $0.09/W (Chung et al. 2015). Utility-scale project developers are, however, increasingly realizing the benefits of procuring their own hardware directly from manufacturers—or even manufacturing the components for themselves—and this helps eliminate the soft cost of EPC markups. Utilizing more non-skilled labor can also have a significant impact on system installation costs and prices.
Another utility-scale BOS cost-reduction opportunity—in terms of LCOE—is the use of solar trackers, which increase energy yield. For Daggett, California, SAM modeling estimates that one-axis tracking yields a 27% improvement in first-year energy production over fixed-tilt (from 1,880 to 2,390 kWh/kW). In terms of net LCOE benefit, this production improvement is calculated to more than offset the additional $0.10–$0.20/W cost for the tracker. As shown for the 2015 case in Table 1, even with the additional tracking cost there is a calculated LCOE benefit around 1 ¢/kWh across the contiguous United States. This at least partially explains the increasing market share for tracking systems—from 40% in 2010 to 58% by the end of 2014 (Bolinger and Seel 2015). Reducing tracker costs without compromising durability would also have a net LCOE benefit.

35
This report is available at no cost from the National Renewable Energy Laboratory (NREL) at www.nrel.gov/publications.
5 Cost Reductions Beyond the SunShot 2020 Targets Reaching the SunShot goals is expected to create a better PV value proposition and drive large-scale U.S. PV deployment. However, because PV is a variable energy source, very high PV penetration likely will require additional costs to facilitate grid integration and increased flexibility via approaches such as energy storage, advanced power electronics for monitoring and controls, and demand-side management (Denholm and Margolis 2007; Hand et al. 2012). To accommodate these extra costs at very high PV penetrations, the long-term LCOE goals for PV systems may need to be even lower than the SunShot 2020 goals of 6 ¢/kWh (utility-scale), 7 ¢/kWh (commercial), and 9 ¢/kWh (residential).
Table 3 shows a conceivable pathway to 3 ¢/kWh (utility-scale), 4 ¢/kWh (commercial), and 5 ¢/kWh (residential), and Figure 12 illustrates the fixed-tilt utility case. Clearly, continued technology advancements beyond the 2020 SunShot targets (in all key metrics) are needed in these more aggressive scenarios.
As a first-order approximation, cutting an LCOE target approximately in half should correspond to an equivalent reduction in per-watt system price. This would generally be true if everything else were held constant, but here additional improvements are assumed. Relative to the 2015 and 2020 input assumptions (Table 1), the benefits of much longer system lifetimes (from 30 to 50 years) and lower discount rates (from 7.0%–7.5% to 5.0%) are incorporated within SAM to generate the ultralow LCOE results. Should these assumptions not be realized, the per-watt system prices in Table 3 would have to decrease in order to achieve the ultralow LCOE targets. For example, assuming the 2020 discount rate and system lifetime in Table 1, reducing the LCOE from 6 to 3 ¢/kWh corresponds to the fixed-tilt utility-scale system price declining from $1.1/W to $0.55/W. In the long-term scenario given in Table 3 however, the 3 ¢/kWh target for a fixed-tilt utility-scale system is calculated with a system price of $0.85/W. These sensitivities can be examined by downloading the SAM version available within the supplementary information.
With regard to replicating Figure 12, note that entering all input assumptions simultaneously will yield a slightly different result than adding the results of each metric varied individually. For example, improving module efficiency reduces module price and hardware and labor costs, and such interdependencies can be double-counted if each parameter is varied only independently. These interdependencies are represented as the overlap (in the direction of the y-axis) between bars. The number in each darker bar represents the scaled contribution of each item to the final result, while the number in parentheses in each lighter bar represents the contribution if each item were varied individually within SAM.

36
This report is available at no cost from the National Renewable Energy Laboratory (NREL) at www.nrel.gov/publications.
Table 3. Current and Example Long-Term LCOE Input Assumptions for 3, 4, and 5 ¢/kWh Targets
PV System Costs Inputs (2015 U.S. Dollars)
Residential Commercial Utility
2015 5 ¢/kWh 2015 4 ¢/kWh 2015 3 ¢/kWh
Direct Capital Costs ($/WDC)
System Size 2.0 – 20.0 kW 20.0 kW – 1.0 MW 1.0 MW – 1,000+ MW
Module Price 0.70 0.35 0.68 0.32 0.65 0.30
Inverter Price 0.30 0.10 0.15 0.07 0.15 0.05
Costs Associated With 1-axis Tracker
---- 0.15 0.10
Balance-of-System Equipment
0.50 0.30 0.35 0.25 0.35 0.20
Direct Installation Labor 0.35 0.20 0.20 0.15 0.20 0.10
Land Costs ---- 0.03 0.03
Grid Interconnection and Transmission
---- 0.05 0.03
Indirect Capital Costs ($/WDC)
Permitting and Environmental Studies 0.10 0.05 0.05 0.04 0.03 0.03
Customer Acquisition and System Design
0.35 0.10 0.05 0.03 0.04 0.02
Installer Overhead and Profit 0.70 0.25 0.65 0.20 0.20 0.07
Sales Taxes 0.10 0.05 0.07 0.04 0.05 0.02
Installed System Price ($/WDC): 3.10 1.40 2.20 1.10
1.75/1.90 Fixed Tilt/Tracker
0.85/0.95 Fixed Tilt/Tracker
O&M Parameters and Costs
Tilt Angle for Module 25o 25o 15o 15o Optimal tilt angle (e.g., 30o)
Optimal tilt angle
Degradation Rate (%/ year) 0.75% 0.2% 0.75% 0.2% 0.75% 0.2%
Average annual soiling loss (%/year) 5.0% 5.0% 5.0% 5.0% 5.0% 5.0%
O&M Annual Cost by Capacity ($/kW-yr) $20 $10 $15 $7.5
$15 (Fixed tilt) $18 (Tracking)
$7 (Fixed tilt) $8 (Tracking)
DC-to-AC power ratio 1.4 1.4 1.4 1.4
1.4 (Fixed tilt) 1.2 (Tracking)
1.4 (Fixed tilt) 1.2 (Tracking)
Total DC and AC Power Loss 4.5% and 2.0%
4.5% and 2.0%
4.5% and 2.0%
4.5% and 2.0%
4.5% and 2.0%
4.5% and 2.0%
Inverter Lifetime (years) 15 50 15 50 15 50

37
This report is available at no cost from the National Renewable Energy Laboratory (NREL) at www.nrel.gov/publications.
PV System Costs Inputs (2015 U.S. Dollars)
Residential Commercial Utility
2015 5 ¢/kWh 2015 4 ¢/kWh 2015 3 ¢/kWh
Inverter Replacement (Real 2014 $/WDC) $0.15 ---- $0.12 ---- $0.10 ----
Financial Parameters and Incentives (All Using the SAM Template of PPA Single Owner)
IRR Target (%) 7.5% 5.0% 7.5% 5.0% 7.0% 5.0%
PPA Price Escalation (%/yr) 2.5% 2.5% 2.5% 2.5% 2.5% 2.5%
Analysis Period and IRR Target (Years) (Effective System Lifetime)
30 50 30 50 30 50
Inflation Rate (%/year) 2.5% 2.5% 2.5% 2.5% 2.5% 2.5%
Real Discount Rate (%/year) 4.9% 2.5% 4.9% 2.5% 4.4% 2.5%
Nominal Discount Rate (%/year) 7.5% 5.0% 7.5% 5.0% 7.0% 5.0%
Federal Income Tax Rate (%/year) 35% 35% 35% 35% 35% 35%
State Income Tax Rate (%/year) 7.0% 7.0% 7.0% 7.0% 7.0% 7.0%
Annual Insurance Rate (% of capital cost) and Property Tax Rate (%/year)
0% 0% 0% 0% 0% 0%
System Salvage Value (% of capital cost) 0% 0% 0% 0% 0% 0%
Percentage of Debt or Project Debt Service Coverage Ratio
0.0 0.0 0.0 0.0 0.0 0.0
Depreciation Class 5-yr MACRS
5-yr MACRS
5-yr MACRS
5-yr MACRS
5-yr MACRS 5-yr MACRS
Federal ITC Qualification 30% or 0% as noted
0% 30% or 0% as noted
0% 30% or 0% as noted 0%
State ITC Qualification 0% 0% 0% 0% 0% 0%
Real 2015 LCOE Without ITC Daggett, CA – Seattle, WA (U.S. ¢/kWh)
14.5–23.9 3.6–5.9 10.6–17.5 2.8–4.6
8.0–13.1 Fixed Tilt
2.2–3.7 Fixed Tilt
6.9–12.1 1-Axis Tracking
1.9–3.4 1-Axis Tracking

38
This report is available at no cost from the National Renewable Energy Laboratory (NREL) at www.nrel.gov/publications.
Figure 12. Example modeled pathway toward an LCOE target of 3 ¢/kWh for 100-MW utility-scale
systems with 1,480 kWh/kW first-year performance

39
This report is available at no cost from the National Renewable Energy Laboratory (NREL) at www.nrel.gov/publications.
6 Conclusions Remarkable reductions in PV system prices and LCOE have been achieved since the launch of the SunShot Initiative. Still, significant additional reductions are needed to realize the 2020 SunShot targets. We demonstrate that numerous combinations of PV improvements could help complete the path to the SunShot LCOE goals. These possibilities are created by the tradeoffs among key metrics like module price, efficiency, and degradation rate as well as system price and lifetime. For example, high module efficiency is important but probably not sufficient on its own to meet the aggressive LCOE goals. System reliability (lower degradation rates, higher system lifetimes) can be equally important.
In addition to this conceptual analysis, we employ LCOE modeling and bottom-up manufacturing and system cost analysis to map specific example pathways to SunShot-level system prices. Under this scenario, module prices must drop by 29%–38% (depending on the sector) between 2015 and 2020. Narrowing the gap between potential efficiency and the efficiency of today’s commercial products could produce module cost advantages, although the tradeoff between efficiency and manufacturing cost must be addressed effectively. In addition, increased PV production scale will likely drive down costs across technologies. For crystalline-silicon modules specifically, we map up to a 38% cost reduction based largely on kerfless wafer technology and higher cell efficiency via PERC architecture (as well as industry maturation). We map cost reductions up to 33% for thin-film modules through thinner light-absorbing layers, improved light transmission, and other cell improvements as well as industry maturation. These pathways illustrate the feasibility of only two of many possible approaches to significant module cost reductions.
The BOS hardware and soft cost reductions required to achieve our modeled path to the SunShot targets are even larger than the module cost reductions, ranging from 54% (for fixed-tilt, utility-scale systems) to 77% (for residential systems) of total cost reductions. The residential sector’s high supply-chain costs, labor requirements, and customer-acquisition costs give it the greatest BOS cost reduction opportunities, followed by the commercial sector. These opportunities include various approaches to improving and standardizing BOS technologies and processes. Even the utility-scale sector could reduce BOS costs via such measures as procuring hardware directly from manufacturers, and using more non-skilled labor while installing solar tracking systems could reduce the LCOE of utility-scale systems. In addition, improved efficiency can work to lower BOS costs and improved module and system reliability yields LCOE benefits.
Finally, we consider a future scenario in which very high PV penetration requires additional costs to facilitate grid integration and increased power-system flexibility—which might necessitate solar LCOEs even lower than the SunShot goals. We quantify conceivable pathways to 3 ¢/kWh (utility-scale), 4 ¢/kWh (commercial), and 5 ¢/kWh (residential) PV systems. This analysis underscores the importance of combining robust improvements in PV module and BOS costs, as well as PV system efficiency and reliability, if such aggressive long-term targets are to be achieved.

40
This report is available at no cost from the National Renewable Energy Laboratory (NREL) at www.nrel.gov/publications.
References Barbose, G., J. Miller, B. Sigrin, E. Reiter, K. Cory, J. McLaren, J. Seel, A. Mills, N. Darghouth, and A. Satchwell. 2016. On the Path to SunShot: Utility Regulatory and Business Model Reforms for Addressing the Financial Impacts of Distributed Solar on Utilities. Golden, CO: National Renewable Energy Laboratory. NREL/TP-6A20-65670. http://www.nrel.gov/docs/fy16osti/ 65670.pdf.
Bolinger, M., and J. Seel. 2015. Utility-scale solar 2014: An empirical analysis of project cost, performance, and pricing trends in the United States. LBNL-1000917. Berkeley, CA: Lawrence Berkeley National Laboratory. Accessed November 2015, https://emp.lbl.gov/sites/all/files/lbnl-1000917.pdf.
Bray, E.L. 2011. United States Geological Survey (USGS) Minerals Yearbook: Aluminum. Reston, VA: U.S. Geological Survey and U.S. Department of the Interior. Accessed November 2015, http://minerals.usgs.gov/minerals/pubs/commodity/aluminum/myb1-2011-alumi.pdf.
Chung, D., C. Davidson, R. Fu, K. Ardani, and R. Margolis. 2015. U.S. Photovoltaic Prices and Cost Breakdowns: Q1 2015 Benchmarks for Residential, Commercial, and Utility-Scale Systems. Golden, CO: National Renewable Energy Laboratory. NREL/TP-6A20-64746. http://www.nrel.gov/docs/fy15osti/64746.pdf.
Chung, D., K. Horowitz, and P. Kurup. 2016. On the Path to SunShot: Emerging Opportunities and Challenges in U.S. Solar Manufacturing. Golden, CO: National Renewable Energy Laboratory. NREL/TP-7A40-65788. http://www.nrel.gov/docs/fy16osti/65788.pdf.
Davidson, C., T.L. James, R. Margolis, R. Fu, and D. Feldman. (2014). U.S. Residential Photovoltaic System Prices, Q4 2013 Benchmarks: Cash Purchase, Fair Market Value, and Prepaid Lease Transaction Prices. NREL/TP-6A20-62671. Golden, CO: NREL. Accessed October 2015, http://www.nrel.gov/docs/fy15osti/62671.pdf.
Denholm, P., and R. M. Margolis. 2007. “Evaluating the Limits of Solar Photovoltaics (PV) in Traditional Electric Power Systems.” Energy Policy 35:2852–2861.
Denholm, P., K. Clark, and M. O’Connell. 2016. On the Path to SunShot: Emerging Issues and Challenges in Integrating High Levels of Solar into the Electrical Generation and Transmission System. Golden, CO: National Renewable Energy Laboratory. NREL/TP-6A20-65800. http://www.nrel.gov/docs/fy16osti/65800.pdf.
DOE (U.S. Department of Energy). 2012. “SunShot Vision Study.” Washington, DC: U.S. Department of Energy. DOE/GO-102012-3037. http://www.nrel.gov/docs/fy12osti/47927.pdf.
EIA. 2015. “The U.S. Energy Information Administration: Levelized Cost and Levelized Avoided Cost of New Generation Resources in the Annual Energy Outlook 2015.” In Annual Energy Outlook. Washington, D.C.: EIA. Accessed December 2015, http://www.eia.gov/forecasts/aeo/electricity_generation.cfm.

41
This report is available at no cost from the National Renewable Energy Laboratory (NREL) at www.nrel.gov/publications.
Feldman, D., and M. Bolinger. 2016. On the Path to SunShot: Emerging Opportunities and Challenges in Financing Solar. Golden, CO: National Renewable Energy Laboratory. NREL/TP-6A20-65638. http://www.nrel.gov/docs/fy16osti/65638.pdf.
Fu, R., T.L. James, and M. Woodhouse. 2015a. “Economic Competitiveness of U.S. Utility-Scale Photvoltaics Systems in 2015: Regional Cost Modeling of Installed Cost ($/W) and LCOE ($/kWh).” IEEE Journal of Photovoltaics. Accepted.
Fu, R., T.L. James, and M. Woodhouse. 2015b. “Economic measurements of polysilicon for the photovoltaic industry: market competition and manufacturing competitiveness.” IEEE Journal of Photovoltaics. Accepted.
Goodrich, A., P. Hacke, Q. Wang, B. Sopori, R. Margolis, T.L. James, and M. Woodhouse. 2012. “A wafer-based monocrystalline silicon photovoltaics roadmap: utilizing known technical improvement opportunities for further reductions in manufacturing costs.” Solar Energy Materials and Solar Cells 114: 110-135.
Goodrich, A., D.M. Powell, T.L. James, M. Woodhouse, and T. Buonassisi. 2013. “Assessing the drivers of regional trends in solar photovoltaic manufacturing.” Energy and Environmental Science 6: 2811-2821.
Green, M.A., K. Emery, Y. Hishikawa, W. Warta, and E. Dunlop. 2015. “Solar cell efficiency tables.” Progress in photovoltaics: research and applications 23(7): 805-812.
Green, M.A. (2011). “Radiative efficiency of state of the art photovoltaic cells.” Progress in Photovoltaics: Research and Applications DOI: 10.1002.
GreenTech Media Research (GTM) and Solar Energy Industries Association (SEIA). 2015. U.S. Solar Market Insight Report. Washington, D.C.: GTM Research and SEIA.
Hacke, P., M. Kempe, K. Terwilliger, S. Glick, N. Call, S. Johnston, S. Kurtz, I. Bennett, and M. Kloos. 2010. "Characterization of multicrystalline silicon modules with system bias voltage applied in damp heat." Proceedings 25th EU PVSEC, 3760-3765.
Hand, M.M., S. Baldwin, E. DeMeo, J.M. Reilly, T. Mai, D. Arent, G. Porro, M. Meshek, and D. Sandor. 2012. NREL Renewable Electricity Futures Study. 4 vols (NREL/TP-6A20-52409). Golden, CO: NREL. Accessed September 2015, http://www.nrel.gov/analysis/re_futures/.
International Energy Agency (IEA). 2010. International Energy Agency Technology Roadmap: Solar Photovoltaic Energy. Paris, France: IEA. Accessed October 2015, https://www.iea.org/publications/freepublications/publication/pv_roadmap.pdf.
IEA. 2014. “Technology Roadmap: Solar Photovoltaic Energy. Paris, France: International Energy Agency. Accessed December 2015, https://http://www.iea.org/publications/freepublications/publication/TechnologyRoadmapSolarPhotovoltaicEnergy_2014edition.pdf.

42
This report is available at no cost from the National Renewable Energy Laboratory (NREL) at www.nrel.gov/publications.
IEA. 2015. World Energy Outlook 2015. Paris, France: International Energy Agency. Accessed December 2015, http://www.worldenergyoutlook.org/weo2015/#d.en.148701.
Jones-Albertus, R., D. Feldman, R. Fu, K. Horowitz, and M. Woodhouse. 2015. “Technology Advances Needed for Photovoltaics to Achieve Widespread Grid Price Parity.” Preprint. Accessed January 2016, http://energy.gov/eere/sunshot/downloads/technology-advances-needed-photovoltaics-achieve-widespread-grid-price-parity.
Jordan, D.C., and S.R. Kurtz. 2013. “Photovoltaic Degradation Rates--An Analytical Review.” Progress in photovoltaics: research and applications 21: 12-29.
Jordan, D.C., S.R. Kurtz, K.T. VanSant, and J. Newmiller. 2015. “Compendium of Photovoltaic Degradation Rates.” Progress in photovoltaics: research and applications. Accepted.
Kempe, M.D., G.J. Jorgensen, K.M. Terwilliger, T.J. McMahon, C.E. Kennedy, and T.T. Borek. 2006. “Ethylene-vinyl acetate potential problems for photovotlaic packaging." NREL/CP-520-39915. Golden, CO: NREL. Accessed October 2015, http://www.nrel.gov/docs/fy06osti/39915.pdf.
Kinsey, G., P. Hebert, K. Barbour, D. Krut, H. Cotal, and R. Sherif. (2008). “Concentrator multijunction solar cell characteristics under variable intensity and temperature.” Progress in photovoltaics: research and applications 16: 503-508.
“Aluminum Metal Prices.” 2015. MetalPrices.com. London, UK: London Metals Exchange. Accessed December 2015, http://www.metalprices.com/p/AluminumFreeChart.
Mehos, M., C. Turchi, J. Jorgenson, P. Denholm, C. Ho, and K. Armijo. 2016. On the Path to SunShot: Advancing Concentrating Solar Power Technology, Performance, and Dispatchability. Golden, CO: National Renewable Energy Laboratory. NREL/TP-5500-65668. http://www.nrel.gov/docs/fy16osti/65668.pdf.
Mints, P. 2015. “Photovoltaic Manufacturer Shipments: Capactiy, Price, and Revenues.” SPV Market Research April 2015.
Miyashita, M., and A. Masuda. 2012. “Correlation between moisture ingress and performance in photovoltaic modules.” Proceedings of the 28th EU PVSEC Paper 4CO.9.4.
Nemet, G.F. 2006. “Beyond the Learning Curve: Factors Influencing Cost Reductions in Photovoltaics.” Energy Policy 34: 3218-3232.
Palmintier, B., R. Broderick, B. Mather, M. Coddington, K. Baker, F. Ding, M. Reno, M. Lave, and A. Bharatkumar. 2016. On the Path to SunShot: Emerging Issues and Challenges in Integrating Solar with the Distribution System. Golden, CO: National Renewable Energy Laboratory. NREL/TP-5D00-65331. http://www.nrel.gov/docs/fy16osti/65331.pdf.
Philipps, S.P., A.W. Bett, K. Horowitz, and S.R. Kurtz. (2015). Current Status of Concentrator Photovoltaic (CPV) Technology. NREL/TP-6A20-63196. Golden, CO: NREL. Accessed November 2015, http://www.nrel.gov/docs/fy15osti/63196.pdf.

43
This report is available at no cost from the National Renewable Energy Laboratory (NREL) at www.nrel.gov/publications.
Skroback, A. 2015. "Solar Tax Equity Market: State of Play." New York, NY: Chadbourne and Partners Publishing. Accessed November 2015, http://www.chadbourne.com/Publications/.
Strevel, N., L. Trippel, and M. Gloeckler. 2012. “Performance characterization and superior energy yield of First Solar PV power plants in high-temperature conditions.” Photovoltaics International 17.
Swanson, R.M. 2007. “Developments in Silicon solar cells.” San Jose, CA: SunPower Corp. IEEE Electron Devices Meeting: 359-362.
Ward, S., T. Remo, et al. 2015. “Techno-economic analysis of three different substrate removal and reuse strategies for III-V solar cells.” Progress in photovoltaics: research and applications. Submitted.
Wiser, R., T. Mai, D. Millstein, J. Macknick, A. Carpenter, S. Cohen, W. Cole, B. Frew, and G. A. Heath. 2016. On the Path to SunShot: The Environmental and Public Health Benefits of Achieving High Penetrations of Solar Energy in the United States. Golden, CO: National Renewable Energy Laboratory. NREL/TP-6A20-65628. http://www.nrel.gov/docs/fy16osti/ 65628.pdf.
Wohlny, F., T. Weber, M. Müller, and G. Fischer. 2013. “Light induced degradation and regeneration of high efficiency Cz PERC cells with varying base resistivity.” Energy Procedia 38: 523-530.
Woodhouse, M., and A. Goodrich. 2013. A Manufacturing Cost Analysis Relevant to Single- and Dual-Junction Photovoltaic Cells Fabricated with III-Vs and III-Vs Grown on Silicon. Golden, CO: National Renewable Energy Laboratory. NREL/PR-6A20-60126. http://www.nrel.gov/docs/ fy14osti/60126.pdf.
Woodhouse, M., A. Goodrich, R. Margolis, T.L. James, R. Dhere, T. Gessert, T. Barnes, R. Eggert, and D. Albin. 2013. “Perspectives on the Pathways for Cadmium Telluride Photovoltaic Module Manufacturers to Address Expected Increases in the Price for Tellurium.” Solar Energy Materials and Solar Cells 115: 199-212.
Woodhouse, M., R. Jones-Albertus, D. Feldman, R. Fu, K. Horowitz, D. Chung, D. Jordan, and S. Kurtz. 2016. On the Path to SunShot: The Role of Advancements in Solar Photovoltaic Efficiency, Reliability, and Costs. Golden, CO: National Renewable Energy Laboratory. NREL/TP-6A20-65464. http://www.nrel.gov/docs/fy16osti/65464.pdf.