on the measurement of the ratio of the specific...
TRANSCRIPT

510
On the Measurement o f the R atio o f the Specific H eats usin Sm all Volumes o f Gas.— The Ratios o f the Specific Heat o f A ir and o f H ydrogen a t Atmospheric Pressure and a Temperatures between 20° C. and —183° C.
By J. H. Brinkworth, A.R.C.S., M.Sc., D.I.C.
(Communicated by Prof. H. L. Callendar, F.R.S.—Received October 14, 1924.)
Introduction.—In nearly all tbe previous determinations of tbe ratio of thi specific beats of gases, from measurements of tbe pressures and temperature before and after an adiabatic expansion, large expansion chambers of fror 50 to 130 litres capacity bave been used. Professor Callendar first suggeste< tbe use of smaller vessels, and in 1914, Mercer (‘ Proc. Pbys. Soc.,’ vol. 26 p. 155) made some measurements with several gases, but a t room temperature only, using volumes of about 300 and 2000 c.c. respectively. He obtainec values which indicated th a t small vessels could be used, and that, with prope: corrections, a considerable degree of accuracy might be obtained. The on< other experimenter who has used a small expansion chamber, capacity abou 1 litre, is M. C. Shields (£ Phys. Rev.,’ 1917), who measured this ratio for ar and for hydrogen a t room temperature, about 18° C., and its value for hydrogei a t — 190° C. The chief advantage gained by the use of large expansion Cham bers is th a t no correction, or a t the most, a very small one, has to be made foi any systematic error due to the size of the containing vessels, but it is cleai that, in the determinations of the ratio of the specific heats of gases at lov temperatures, the use of small vessels becomes a practical necessity in ordei tha t uniform and steady temperature conditions may be obtained.
Owing, however, to the presence of a systematic error depending upon tht dimensions of the expansion chamber, the magnitude of which had not beer definitely settled by experiment, the following work was undertaken with thf object of investigating the method more fully, especially with regard to its applicability to the determination of this ratio a t low temperatures.
The present experiments relate to air and hydrogen. Further experiment8 of a similar nature on other gases are in progress. Air was selected in the first instance on account of its convenience, and because the value of the ratio of the specific heats a t ordinary temperatures is known with greater accuracy than for other gases. The results obtained for air in the present experiments
\
on September 8, 2018http://rspa.royalsocietypublishing.org/Downloaded from

Ratio of Specific Heats using Small Vol umes of Gas. 511
ith small vessels, down to 35 c.c. capacity, will, therefore, afford a fair iterion of the degree of accuracy attainable under such conditions.Hydrogen has been investigated because, in the first place, its physical ?operties, density, heat conductivity, &c., are so very different from those
1 f air that it might perhaps be assumed that, if the experimental conditions requisite in the cases of air and hydrogen are known, it should not be difficult ) deal with any other gas, and secondly, because a knowledge of the tempera- ire variation of the specific heats of hydrogen is of very great importance i theoretical physics, and the experimental values at present available are few 1 number and are somewhat discordant.These investigations have been made in the Physical Laboratories of the
mperial College of Science, and I wish to do homage to Prof. Callendar, the director of those Laboratories, and to express to him my thanks for his advice nd my great appreciation of the opportunity given me to develop this method f experiment.
I General Outline of the Method.—The quantity actually measured in these xperiments is the cooling effect in adiabatic expansion, tha t is to say, the atio of the drop in temperature to the drop in pressure, when the gas in a vessel a t a pressure slightly above atmospheric is allowed to expand rapidly0 atmospheric pressure. The general principle of the method is the same is that of the old experiment of Clement and Desormes, except tha t the drop >f temperature is directly measured with a sensitive thermometer, as in the ixperiments of Lummer and Pringsheim (4 Smithsonian Contributions to Knowledge,’ 1898) and those of Callendar and Nicolson, in an engine cylinder
Proc. Inst. C.E.,’ November, 1897).1 Assuming an adiabatic relation between pressure and temperature of the ■ame type as for a perfect gas, namely :
0 i / i> r = 02,w ” • ••• A>
where 0l5 02, are the initial and final temperatures on the absolute scale, and Pi, p 2, the corresponding pressures, we find for the index m,
m = log (01/©2)/log (P iM -
But, in order to facilitate comparison with the work of other observers, the results have been expressed in terms of the apparent value of the ratio of the specific heats y, by the relation :
y *=: 1/(1 — m), or = (y — l)/y.
The apparent value of y thus obtained requires certain small corrections to VOL. CVI1.— A. ^ N
on September 8, 2018http://rspa.royalsocietypublishing.org/Downloaded from

512 J. H. Brinkworth.
allow for deviations of the actual gases employed from the ideal state, in addition to corrections for radiation and for the volume of the vessel or the time of expansion, depending on the conditions of each experiment.
The advantage of the direct measurement of the drop in temperature, as r compared with the indirect method of Cldment and Desormes, is that the effect of the walls of the vessel is very greatly reduced.
As compared with the method of deducing y from the velocity of sound, the advantages of directly measuring the drop of temperature with an electric thermometer are as follows. An error of 1 per cent, in the observed velocity gives an error of 2 per cent, in the value of y ; whereas an error of 1 per cent, in the drop of temperature gives an error of (y — 1) per cent, in y or only 0*4 per cent, for air.
With suitable apparatus a higher order of accuracy can be attained in the measurement of the temperature drop than in the measurement of the velocity of sound, except possibly in the case of air on a large scale. With small quantities of gas a t low temperatures the electric method is probably about ten times as accurate as the velocity method.
Arrangement of Apparatus.—The gases were obtained from Brin’s Oxygen ; Co., in the usual gas cylinders. For the experimental measurements the gas was stored in large glass carboys N, N, together holding about 7 cubic feet, i under the excess pressure of about 5 cm. of mercury. The gas circuit from these reservoirs to the expansion vessel V is shown in the diagram (fig. 1), where O is a tube, 1 metre long, containing stick potash, and P, P, P, P are 2-litre flasks partly filled with phosphorus pentoxide. Q is a tube filled with glass-wool acting as a dust filter, and S another 2-litre flask which could be surrounded by a low-temperature bath, when necessary, in order to cool the gas on its way to the expansion vessel. The latter was maintained at an approximately constant temperature in a suitable medium contained in a vacuum vessel.
The difference between the initial and final pressures of the gas is read on the oil manometer M, the final pressure being tha t of the atmosphere, which is obtained from the barometric reading. The temperatures before and immediately after the expansion of the gas were measured electrically, by means of * compensated thermometer of platinum wire, 0*025 mm. in diam eter; tflB|^ was put into the electrical circuit by contacts made in the arms A and B of mercury key.
The Automatic Mercury Key.—An automatic key was employed, as it l | important that the time interval between the commencement of the expansion
on September 8, 2018http://rspa.royalsocietypublishing.org/Downloaded from

/iflwbhe closing of the galvanometer circuit for the measurement of 02 should'be reducible with some consistency. If the points a and b (fig. 1) are joined and
Ratio of Specific Heats using Small Volumes of Gas. 513
C.G.Brid(?e
hlgas in Y is under pressure, the galvanometer circuit can be closed in the t» A for the measurement of the initial temperature 0^ This circuit must
At be open until it is again closed, a t some instant after the commencement of n<expansion, for the observation of the final temperature 02. This second -Qiact was made in the limb B by the rising of the mercury level in this limb
the vessel V was opened to the atmosphere. The time elapsing between swcommencement of an expansion and the making of contact in B could be 7*ed by adjustment of the mercury levels and the taps, shown in the figure, of h4cey and was measured on a chronograph. The latter gave a trace of 5 cm.
°nlie record, corresponding to a time interval of one second. is an auxiliary- mit by which a small e.m.f. can be introduced into the galvanometer circuit Compensate disturbing thermal effects.
lethod of Performing an Experiment (fig. 1).—At the commencement of an2 N 2
on September 8, 2018http://rspa.royalsocietypublishing.org/Downloaded from

514 J. H. Brinkworth.
experiment taps 1, 2 and 3 were open and T connected V with the oil gauge. Contact was made in the three-way mercury switch between a and b, and the electrical circuit through the galvanometer was completed in the limb A of the automatic key. The pressure p 1 on the gas in V was first adjusted to be from 76 to 78 cm. of oil in excess of atmospheric pressure, and test observations were made to determine the steady temperature of the gas 0! and its constancy, the time indication of the automatic mercury key, the approximate balance point on the Callendar-Griffiths bridge corresponding to the lowest temperature reached by the gas, the absence of thermo-electromotive forces in the galvanometer circuit and the value of the heating effect caused by the current in the thermometer wire. The experimental manipulations and observations necessary for the evaluation of each individual measure of the ratio of the specific heats were then made in the following order. Two readings of the approximate balance point on the bridge wire, differing by 1 mm., and the resulting deflections obtained on reversal of the current, corresponding to temperatures slightly above and slightly below the actual steady temperature 0l5 were recorded. The latter can be deduced by interpolation. Contact a t A, in the mercury key, was then broken by raising, through a friction grip, the wire dipping into the mercury in this arm, and the contact on the bridge was adjusted to a millimetre division as near as possible to the point corresponding to the lowest temperature 02 attained by the gas after expansion. The readings in both limbs of the oil gauge were taken, tap 1 was closed, the large three-way tap, T, quickly turned full open to the atmosphere, and the (more or less) sudden deflection of the galvanometer needle was noted. I t is convenient to call this the kick deflection.
Immediately after the observation of this kick, the battery circuit through the bridge was broken a t m, n, tap 2 was closed, the three-way tap T turned back to its initial position, and the pressure readings on the oil gauge were checked. The galvanometer needle was then brought to rest by means of a subsidiary damping circuit and the contact on the bridge wire was lifted and depressed. If there was no change in the position of the galvanometer needle resulting from this, it indicated the absence of thermo-electromotive forces in the c ircu it: if they existed, they could be neutralised by a suitable change in the balancing circuit R^. Tap 3 was then closed and tap 1 opened, thus refilling the bulb. During the heating up of the new supply of gas, observations were made of the atmospheric pressure and of the temperatures of the oil gauge and the barometer.
Taps 2 and 3 were then opened, the contact lowered into the arm A, and
on September 8, 2018http://rspa.royalsocietypublishing.org/Downloaded from

steady readings of the thermometer again observed. Another experiment vs now made in a similar manner, except that the position of the bridge- \re contact, corresponding approximately to the temperature 02, was altered
ft one or two millimetres in whichever direction was judged advisable from a tnsideration of the magnitude of the kick observed in the preceding experiment, ite r some five to fifteen sets of observations had been made, the time interval Itween the commencement of the expansion and the closing of the galvanometer circuit was again noted. To do this, the contact in the three-way switch Itween a and b was broken and a, c joined. The point of the wire contact £ A was made just to touch the surface of the mercury in this arm of the mercury key, the chronograph was set in motion, and an expansion made, • before, by turning the three-way tap. A complete set of observations could e made in one to three hours.
Details of Apparatus Employed.1 The Barometer and Oil Gauge.—The barometer used was of the standard ortin type. Its indications were read to 0*01 cm. and the necessary tempera- ire corrections to 0° C. were applied.1 The oil gauge was tha t used by Swann in his measurements of the specific eats of air and of C 02. The scale was engraved in millimetres over a length E 81 cms. on both limbs of a glass U-tube ; the scale was everywhere correct> within 0-002 cm. Determinations of the density and of the temperature ^efficient of expansion of the oil used gave the following relationship for ae reduction of the pressure measured in centimetres of oil a t t° C., i.e. ht,> lengths H0 measured in centimetres of mercury a t 0° C.
H 0 = ht (0-06400) [1 — 0-000735 ( — 22)].!he indications on the gauge could easily be read to 0-01 cm., these readings eing taken by the aid of low-power microscopes. The oil was somewhat iscous, but sufficient time was always allowed for stationary levels to be ttained; moreover, the use of large balancing reservoirs ensured that the hange in the levels of the oil between successive experiments was small, t will be noticed that during the time taken to complete any set of observa- ions the barometric pressure remained constant to within a few tenths of a nillimetre of mercury, thus showing that the atmospheric conditions were steady. It is essential that all observations should be taken only under such •onditioDS, for on windy days the oil surfaces in the gauge were never at rest ind the irregular fluctuations in pressure were sometimes as big as 2 to 3 mm. if oil. The pressure readings taken immediately before and after the expansion
Ratio of Specific Heats using Small Volumes of Gas. 515
on September 8, 2018http://rspa.royalsocietypublishing.org/Downloaded from

516 J. H. Brinkworth.
were almost always identical, rarely differing by as much as 1 in 3000. Whe a difference existed, the mean value has been used in the calculations.
Expansion Vessels (fig. 2).—Thes were of glass, each consisting of a bul on the end of a straight tube of 1 cir diameter, through which the thermomete was inserted. The overall length of eac vessel was the same, 37 cm., the side tub for the exit of the - gas being 6 cm. fror the open end of the tube. Each bul: was blown with the length of tb cylindrical portion of the bulb aboul 1 ♦ 5 times its diameter.
The internal volumes of the bulbs wer 697, 287, 75, 34*5, 11*2 c.c. respectively the reciprocals of the cube roots of thes volumes being 0*1128, 0*1516, 0*2371 0*3072, and 0*447.
The Galvanometer.—An astatic galvano meter of the Paschen type, with a lonj quartz-fibre suspension, was used. I t hac a period of about 5 seconds and t resistance of 4 ohms. Some care was taken in making it as astatic as possible To do this, the needle was first deflectec through 90° by a small current, then * large current was flushed through th( two pairs of field coils arranged in series the magnetic field in the coils surrounding the weaker magnet being strengthened by the insertion of an iron core. Such success was obtained tha t it was not necessary to screen the instrument. The scale was
about 2 metres from the galvanometer.The Platinum Thermometer Bridge.—The well-known form of bridge desigW«h
by Prof. Callendar was used, the bridge coils being cut out by means of mercury keys. Two calibrations of the coils and bridge were made, and the corrections, which were small, agreed to within 0*005 cm. of bridge wire.
on September 8, 2018http://rspa.royalsocietypublishing.org/Downloaded from

The Thermometer {fig. 2).—The main leads were of No. 22 copper wire, j which lengths of 0*1 mm. platinum wire were hard-soldered. The main distance consisted of a single loop of about 6 cm. of pure platinum wire •025 mm. in diameter. The compensating leads were joined by another loop f about 2 cm. of the same wire. The value of 8 in the Callendar reduction jrmula is 1*50 for this specimen of wire. The fine wires were joined to the ads of the thicker platinum wires by a trace of gold solder. The main leads rere sheathed in glass tubes, which were fused around the thicker platinum /ires, leaving about 2 cm. of the latter exposed. The sheathing tubes were
i irmly bound together and were fixed, a t the end remote from the platinum vires, in a glass tube which just fitted into the stem-tube of the expansion vessel, the joint being made with plaster-of-Paris covered with wax. This jlass tube served as a guide, and other guides, consisting of small mica frames, vere placed a t intervals along the stem of the thermometer.'! The gas-tight joint between the head of the thermometer and the bulb stem was made by a rubber tube fixed to this head ; it slipped over the stem and was wound round with insulating tape and wired into position. The free ends of the four leads from the thermometer and compensator were soldered to thick copper lugs, which were connected with the flexible leads to the bridge in a 4-hole mercury cup. With this arrangement, the transference of the thermometer from one bulb to another could be accomplished easily, and it was possible, when necessary, to alter the position of the thermometer wire in a bulb and to replace the thermometer in practically the same position. I t was found to be important th a t the thermometer should be firmly fixed in the bulb. As the result of the preliminary experiments it was decided to arrange the lower end of the loop 1 to 1*5 cm. above the bottom of the bulb in use.
Before commencing any series of experiments the loops were cleaned by heating in a spirit flame, and they were slightly stretched so th a t each loop lay in one plane, but the two loops were in planes a t right angles to each other. The fundamental interval was then determined with the usual apparatus. After several expansions the longest loop changed its outline, due to the slight shaking, but this did not affect the fundamental interval. If the wire became bent very much out of its original plane, or if it was touched during the transference from one vessel to another, then the wires were again cleaned and straightened, and the new ‘constants determined. In general, the fundamental interval was about 270 cm., and the resistance a t 0 C. about 720 cm. of bridge wire.
Ratio of Specific Heats using Small Volumes of Gas. 517
on September 8, 2018http://rspa.royalsocietypublishing.org/Downloaded from

518 J. H. Brinkworth.
The current to the bridge was derived from accumulators, either 1, 2 or 4 units, in series with suitable resistances according to the conditions of the experiment.
With such fine wires the effect of the bridge current in altering the resistance of the thermometer must be measured and allowed for. This heating effect in the thermometer wire was measured in the way suggested by Prof. Callendar, and the variation of the effect with change of temperature was determined. I t is the small difference, from 0*01 to 0-06 cm., of bridge wore, between the magnitudes of this heating effect a t 0X and 02 which affects the calculated values of y. These differences were constantly redetermined, and very consistent values were obtained in experiments performed, on different days, under similar conditions.
Estimation of the Lowest Temperature attained.—In fig. 3, the probable-changes in temperature of the gas are plotted against the time. Starting from an initial
Key Time
temperature 0l5 the tap T is opened a t time a. There is a rapid fall of temperature a t first, becoming less rapid from b to c. From to the temperature remains constant, any cooling being balanced by heat received from outside. At e the gas has begun to rise in temperature and this rise gets more rapid as time passes. The straight portion from c to e indicates the lowest temperature 02. If the moment of contact is a t a time between c and e, and the bridge wire setting corresponds to 02, the galvanometer needle will remain undeflected when contact is made a t B. If the contact is maintained as the gas rises in temperature a gradual deflection (say, to the right) will take place. If, with the same time conditions, the bridge setting corrflf* ponds to 0, a temperature between 0X and 02, there is an initial kick to the
on September 8, 2018http://rspa.royalsocietypublishing.org/Downloaded from

due to the want of balance. I t is this initial kick which is measured, jjiie time of contact corresponds to b, and the bridge setting to a temperature rehed after this instant, there is the possibility that, before the kick occurs tohe left, there may be a small and almost instantaneous movement of the jjgglle to the right. The latter movement was only observed when the bridge
setting was not far removed from the point of exact balance ; if it existed th time of the key was increased to correspond to a value slightly greater tin c.
’he expression “ kick sensitiveness ” is used to indicate the number of sde divisions in a kick movement corresponding to 1 mm. of bridge wire. It average value in an experiment can be deduced from a consideration of ajcessive observations, such as are tabulated in columns b and c on pages 527 ad 531. This quantity increased as the temperature a t which the experiment ws performed was lowered, and also, roughly, in direct proportion to a linear uasurement of the bulb (fig. 4). The key times usually adopted (i.e., in
Ratio of Specific Heats using Small Volumes of Gas. 519
R a d iu s o f B u lb . £ \ A i r at 5° C.
C— Air at 78° C.
g. 3) showed the same relationship. The latter is dependant on the extenon of the pressure drop down the axis of the bulb, the former on the time
on September 8, 2018http://rspa.royalsocietypublishing.org/Downloaded from

520 J. H. Brinkworth.
interval corresponding to ce. When experiments were made with long times than c, but not exceeding / , the kick sensitiveness was decrease but the calculated values of y were only slightly reduced. This can be e plained by reference to fig. 3. When the key time corresponds to c there a considerable interval of time before the needle is moved to the right, ar therefore, the galvanometer spot has time to reach its maximum kick elong tion to the left. In some of the air experiments, if the time of making conts, was trebled, the kick sensitiveness was reduced by about one-half. Wh necessary, a kick deflection could be estimated to a quarter division on a tot deflection of 2 or 3 divisions, but, in general, to obtain the accuracy expect* it was only necessary to observe to the nearest scale division. A check on ti value of the kick sensitiveness used is obtained from a comparison of the me values of y calculated from the results when the kick deflections are (a) sma (6) large. These means should agree.
Thermoelectric Effects in the Galvanometer Circuit.—The current through t thermometer was kept constant in all the observations from which one me value is deduced, the key contact a t B being one to close the galvanomet circuit. The presence of thermoelectro-motive forces in this circuit is not m atter of especial consequence when it is possible,* as it is in the measureme: of the steady temperature, to reverse the direction of the current through tl bridge. But the value of the lowest temperature is deduced from a brid reading which represents a point of balance only existing for a short inter\ of time during which reversal is not possible ; hence, it is of great importan th a t the kick deflection should be free from errors due to a zero shift occurrii during the time of observation of this temperature.
Such thermo-electric effects as existed, when contact through the galvaD meter circuit was made a t B, were small and were reduced so as to be negligit by the insertion of a balancing e.m.f. in this pircuit. The arrangement employ (shown a t R j, in fig. 1) consisted of a circuit containing an accumulator, reversing key, a resistance box and a piece of well-lagged manganin wii potential leads from two points on the latter being led into the galvanomet circuit. I t is more especially in those cases when the movement of the need during the kick elongation is slow th a t the whole effect of such a source error will have time to show itself, but the error then introduced is minimis*! by the fact that, under these conditions, the magnitude of the kick deflectic per mm. change in the reading of the bridge is large. Such uncompensate zero changes as existed were rarely more than ± 2 divisions on the galvan meter scale, and errors thus introduced would mean out, though, no doub!
N
on September 8, 2018http://rspa.royalsocietypublishing.org/Downloaded from

>me part of the variations between individual results is due to their resence.Initial Temperature Conditions and Reduction of Platinum Temperatures to
rue Temperatures.—The expansion bulb was surrounded by a suitable medium mtained in a vacuum vessel. Absolute constancy of the temperature of the ledium is not essential, but any change occurring must be slow, as it is not esirable tha t the difference between the steady temperatures, measured before ad after an expansion, should differ by 0*01° C. In general, the differences
observed were less than this. For all temperatures above —78° C. Callendar’s Phil. T r a n s .1887) parabolic formula was used. Initially the observations
t —78° C. were reduced in the same manner, and the correction curve given y Henning (‘ Ann. der Physik,’ vol. 40, p. 635, 1913) for his standard thermometer was utilized in reducing the platinum temperatures observed a t —118° nd —183°. With these corrections the temperatures of solid C02, sub- iming from alcohol, was —78• 49°, and tha t of old liquid air, —183*40 C. lenning has shown tha t a t —78° the Callendar formula gives results about t*08° too low while a t —183° the divergence is over 2°. (See also Travers and Iwyer, * Boy. Soc. Proc.,’ vol. 74, p. 528, 1904.) Henning has also shown hat a t —183° different platinum thermometers will vary by as much as 0*5° n their indications, but tha t the scales of these thermometers could be :onnected with tha t of his standard by making an additional correction calculated from a relation of the form ptx — p t2 = c . p t 1 (ptx 100).' The scale finally adopted for the calculations of temperatures a t and below —78° was the Henning scale with this additional correction. The temperature of a considerable quantity of liquid air used in the experiments made at the end of November was —183*40° as deduced, using Hennings standard values, and this temperature was constant to within 0*02° over a period of four hours on each of two successive days. In calculating the constant c, in the additional correction to be applied to Henning’s standard values, it has been assumed that this temperature should have been —182*95 .
The expansion bulb was surrounded by water, ice, and ice and salt respectively, in the experiments made a t temperatures of about 17 , 0 and 21 . Lower temperatures were obtained by the use of (a) a mixture of solid C02 and alcohol; (6) solid ether; and (c) liquid air. These will be considered separately.
(a) Solid C02 was mixed with alcohol to form a pasty mass. Over the pressure range of about 2 cm. due to variations in the barometric height, the temperatures can be represented by —78*31 -f- 0*16 (p 76).
Ratio of Specific Heats using Small Volumes of Gas. 521
on September 8, 2018http://rspa.royalsocietypublishing.org/Downloaded from

522 J. H. Brinkworth.
(b) Liquid air was poured on to anhydrous ether and the solid crust whit formed was r a m m ed around the bulb. The temperatures obtained w* sufficiently constant, but addition of liquid air was necessary after every t>} or three observations. The temperature, about —117*8°, is 0*2° lower thi the value obtained by Holborn and Wien. (‘ Wied. Ann.,’ 1896.) I t has bei shown by Timmermans (‘ Bull. Soc. Chem. Belg.,’ 1911), and confirmed r Henning (£ Ann. d. Phys.,’ 1914), th a t solid ether is dimorphous, and that fe lower transition point is a t a temperature of —123*6° C.
(c) The liquid air was obtained from commercial sources and was alw£$ fairly rich in oxygen. The temperatures of the various samples were sui- ciently constant for the purposes of the experiments. A check on the accura ̂with which the scale adopted applies to my thermometer is obtained fret the value it gives for the temperature of solid C 02, in alcohol, a value whit differs from th a t obtained by Holborn (c Ann. der Physik,’ vol. 6, p. 242,19() by only 0*03° C.
The Effect of Observational Errors.—The ratio of the specific heats is usua'r obtained either from measurements of the velocity of sound or from a knowled: of the pressure or temperature resulting from an adiabatic expansion.
In the first method, an error in the measurement of the velocity gives r - to an error twice as great in the value of y.
In the method adopted in these experiments—which, it is generally agree is the best of the expansion methods—we may write
T ~ 1 _ log 0i/02 __ log (1 + A6/62)T loZPi/P2 log (1 +
e2 * * L f \ e2
In considering my experiments, make = 75 cm. and Ap = 5 cd
andat room temperature 02 = 280° and A0 = 5° a t liquid air temperature 02 = 88° and A0 = 2*1°.
Substituting in (1), we find th a t
---- - ns £2 . is correct,Y 02 A p
a t both temperatures, to within per cent., and this simple relation sufficiently accurate if we wish only to consider to what extent errors in tl quantities observed will affect the value of y obtained. As p 2 and 63 Cc be observed to a high degree of accuracy, >̂2/®2 may be assumed correct.
on September 8, 2018http://rspa.royalsocietypublishing.org/Downloaded from
Ratio of Specific Heats using Small Volumes of Gas. 523
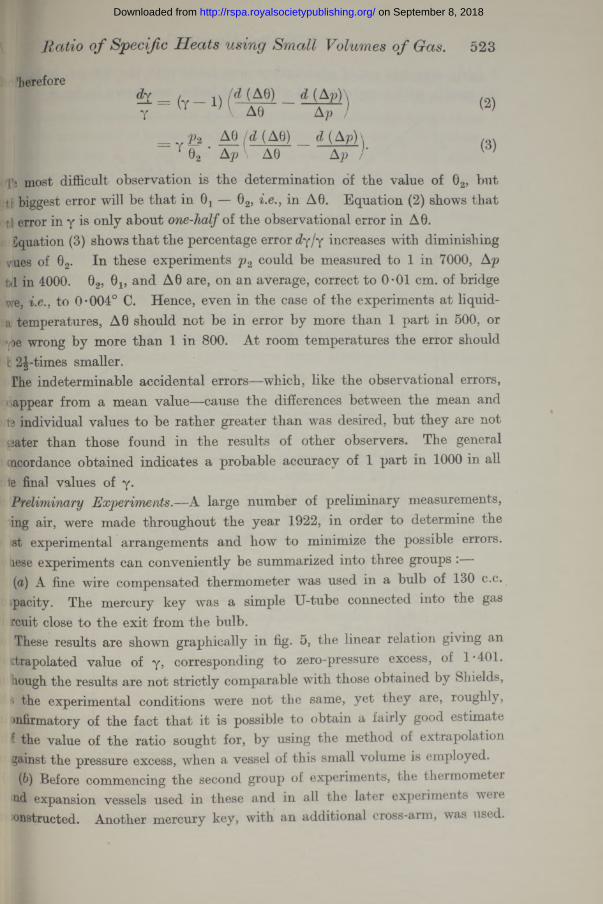
'herefore/V_ U ( d d
y VT 'V A0 Ap / (2)
Pz _ Ai (^IMl ~ d^ 02 A p\ A0 A J (3)
f i most difficult observation is the determination of the value of 02, but tl biggest error will be tha t in 0X — 02, i.e., in A0. Equation (2) shows tha t tl error in y is only about one-half of the observational error in A0.
Equation (3) shows th a t the percentage error dy/y increases with diminishing vues of 02. In these experiments p 2 could be measured to 1 in 7000, A t«l in 4000. 02, 0X, and A0 are, on an average, correct to 0*01 cm. of bridgewe, i.e., to 0*004° C. Hence, even in the case of the experiments a t liquid- a temperatures, A0 should not be in error by more than 1 part in 500, or -,De wrong by more than 1 in 800. At room temperatures the error should t 2|-times smaller.The indeterminable accidental errors—which, like the observational errors,
(.appear from a mean value—cause the differences between the mean and is individual values to be rather greater than was desired, but they are not pater than those found in the results of other observers. The general (ncordance obtained indicates a probable accuracy of 1 part in 1000 in all 1e final values of y.Preliminary Experiments.—A large number of preliminary measurements, ing air, were made throughout the year 1922, in order to determine the •st experimental arrangements and how to minimize the possible errors, lese experiments can conveniently be summarized into three groups :(a) A fine wire compensated thermometer was used in a bulb of 130 c.c. (pacity. The mercury key was a simple U-tube connected into the gas ccuit close to the exit from the bulb.These results are shown graphically in fig. 5, the linear relation giving an
•ctrapolated value of y, corresponding to zero-pressure excess, of 1*401. tough the results are not strictly comparable with those obtained by Shields, * the experimental conditions were not the same, yet they are, roughly, mfirmatory of the fact tha t it is possible to obtain a fairly good estimate f the value of the ratio sought for, by using the method of extrapolation gainst the pressure excess, when a vessel of this small volume is employed.(b) Before commencing the second group of experiments, the thermometer
ud expansion vessels used in these and in all the later experiments were onstructed. Another mercury key, with an additional cross-arm, was used.
on September 8, 2018http://rspa.royalsocietypublishing.org/Downloaded from

524 J. H. Brinkworth.
A fairly complete set of observations was made with tbe 300-c.e. bulb, an the results, with some obtained with other bulbs, are shown in fig. 6.
1 3 8
c.c.s c.c.sc.c.s
c m s.
1 4 0 01 3 9 0
I t had been expected th a t a similar linear relation would result, although the experimental arrangements had been somewhat modified. In the experi-
on September 8, 2018http://rspa.royalsocietypublishing.org/Downloaded from
referred to in group (a) the time of the key was about the same as the ;-n of expansion of the gas ; in this second series the key was placed near heap T, and its time was fixed by the adjustment of the taps in the cross- l7T. The movement of the mercury column in the key was not quite uniform, in pening the tap, T, the mercury surface in the arm, B, a t first rose rapidly mcDhen more slowly. When the pressure excess was small, contact was made lung the time interval corresponding to the first rapid rise, and therefore (heonditions were very similar to those previously existing. For the larger -aJes of the pressure excess the key time was shorter than in the preceding 'Xjriments, but if the key time was increased the apparent values of y >e<me smaller. .It is obvious th a t this method of extrapolation can only ,e ;sed when the timing conditions are suitable. Both Moody and Shields killed a definite time to elapse between the commencement of the sudden Ermsion and the closing of the circuit. With the slower rates of expan- io used in these experiments, apparently a linear relation is only obtained da the time increases with the excess pressure. With larger vessels, when oier time intervals are allowable, the linear relation between y and A ri hold over a greater range.
i the values of y obtained with excess pressures of 3 to 5 cm. of mercury, tin plotted against the inverse cube roots of the volumes of the bulbs, lie ie' straight lines which give extrapolated values close to tha t generally kcpted, it was thought advisable to work with excess pressures of about I to 5 cm. of mercury, the maximum value measurable on the oil gauge, m to investigate the timing conditions. As a result, the method detailed 'mage 518 was evolved.
) The final form of mercury key was adopted, and rather greater consists y between the individual values and the mean was obtained by the intro- k ion of the thermo-electromotive-force balancing circuit. All the practical n ipulations and settings were as in the final experiments and are described on |Ne 514, but undried, unpurified air was used. The mean results with the five ul »s used are shown graphically on p. 533 in fig. 8 (dotted line), each mean being ^Uined from 20 to 30 separate determinations with one of the bulbs. I t " not expected tha t very good results would be obtained with the smallest kb, capacity 11 c.c. only, but the individual values agreed among themselves w-:fc 0*002 on the value of y—viz., 1*351. This value lies, rather more than 1 ei cent., below the line showing the linear relation between the results Gained with the larger vessels ; the lowness of the result is probably due t'lhe fact that the time of the key could not be made sufficiently short.
Ratio of Specific Heats using Small Volumes of Gas. 525
on September 8, 2018http://rspa.royalsocietypublishing.org/Downloaded from

526 J. H. Brinkworth.
I t is of interest to note th a t this result is only about 4 per cent, lower tin the value obtained when using a volume of gas over ten-thousand times gre£*r.
During the course of these experiments the variation of the kick sensitive! gg with the size of the bulb and its dependence on the time of the key \re ascertained. Experiments were made, in the largest bulb, with the thermomer 1 loop a t different distances above th e bottom of the bulb. Consistent rests were obtained, as long as the wire was not more than one-quarter way up tie bulb. If higher than this the loop was bent out of the vertical plane andae results were discordant.
The Final Experiments, representing the results of this research, date fan; this time. A few reduced observations are given in order to show steadiness of the experimental conditions and the accuracy with which rests could be reproduced.
Air . F inal E xperiments. (Fig. 8, p. 533.)
Fundamental Interval, Freezing Point and Heating Effect Observationin cm. of Bridge Wire.
Date. Temp. ° C. 1 Cell. 2 Cells. 4 Cells
April 19, 1923 ................ 099-726
731-34 1004-67
F.P. 731-26
731-62 1004-86
F.I. 274-09
732-61006-6
Heating Effects ( ).
Date. Temp. °C. 4 Cells. 2 Cells.
Anril 19 ............................................... 0 1-41 0-37
April 19 ................................................... 100 1-07 0-250-420-50May 19 ............................................................ — 78 1-57
July 24 ............................................... - 118 —June 16 ................................................... 0 — 0-35September 6 ............................................... 0 1-42 —September 6................................................... 100 1-09 ---'WA
-----------— —
The value of the F.P. obtained on the latter day was 731-28.From these observations it will be seen tha t the correction to be aPP^Pj*
account of the variation in the heating effect is only 0-02 cm. in the case of f measurements a t room temperatures, and it is negligible a t 78 an^ ' « j when 2 cells only were used.
on September 8, 2018http://rspa.royalsocietypublishing.org/Downloaded from

Ratio of Specific Heats using Small Volumes of Gas. 527
Reduced Observations.
Columns (a) and (d) give the values of 0X and 02 expressed in terms of cm. c bridge wire, after the application of the box coil and the heating effect erections.Column (6) gives the bridge wire setting for the observation of 02 and (c) the
rulting kick deflection.
By 9th. 300 c.c. Bulb. = • 28 secs.
Pi' Pi' a\ b. c. d. •i- 7*
5-61 80-564 779-23 17-0 68 765-09 285-281 290-384 1-387780-545 779-23 16-6 2 765-13 285-295 290-384 1-388180-525 779-23 16-8 28 765-15 285-302 290-384 1-389580-503 779-24 16-8 16 765-23 285-331 290-388 1-389280-480 779-24 16-9 21 765-30 285-356 290-388 1-389080-456 779-24 16-9 11 765-37 285-381 290-388 1-3889
5-59 80-418 779-24 16-95 11 765-42 285-399 290-388 1-388780-397 779-25 16-95 1 765-48 285-421 290-391 1-388980-378 779-25 17-0 2 765-53 285-439 290-391 1-389080-356 779-26 17-1 8 765-59 285-462 290-395 1-389380-338 779-26 17-05 —4 765-62 285-472 290-395 1-390280-320 779-26 17-2
15 765-71 285-504 290-395 1-3885
Other values o f (y — 1) obtained under similar conditions.
April 26th.— -3901, -3895, -3896, *3901, *3875, -3895, *3895, -3899, -3890,890. t = ♦ 35 secs.May 12th.— 3893, -3888, -3883, -3888, *3885, *3897, -3894, -3890, -3896,891. t = *30 secs.
2 oV°L. CVII.— A.
on September 8, 2018http://rspa.royalsocietypublishing.org/Downloaded from
528 J. H. Brink worth.
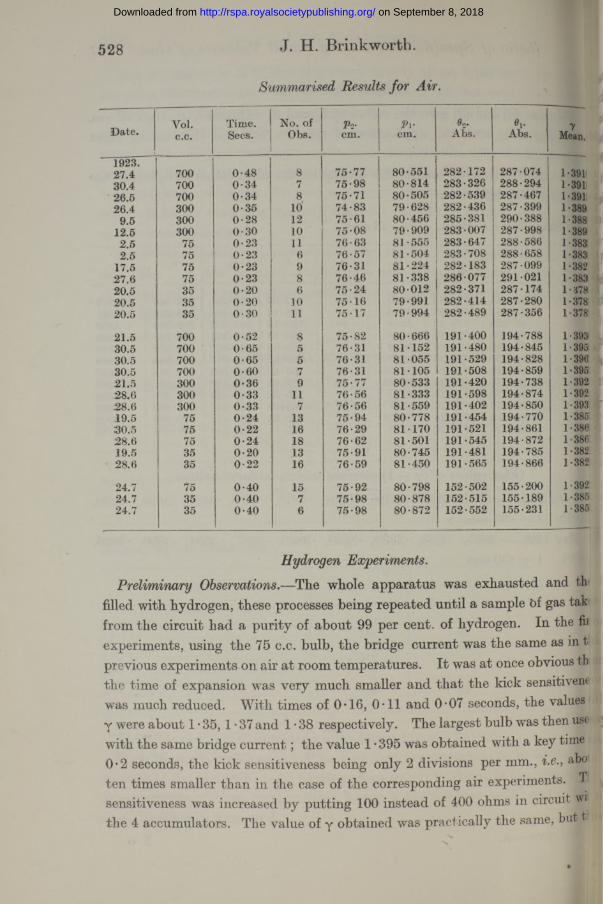
Summarised Results for Air.
Date. Vol.c.c.
Time.Secs.
No. of Obs.
p2.cm.
Pi-cm.
0o.Abs.
01-Aba.
7Mean.
1923”27.4 700 0-48 8 75-77 80-551 282-172 287-074 1-39H30.4 700 0-34 7 75-98 80-814 283-326 288-294 1-391!26.5 700 0-34 8 75-71 80-505 282-539 287-467 1-39126.4 300 0-36 10 74-83 79-628 282-436 287-399 1-389
9.5 300 0-28 12 75-61 80-456 285-381 290-388 1-38812.5 300 0-30 10 75-08 79-909 283-007 287-998 1-3892.5 75 0-23 11 76-63 81-555 283-647 288-586 1-3832.5 75 0-23 6 76-57 81-504 283-708 288-658 1-383
17.5 75 0*23 9 76-31 81-224 282-183 287-099 1-38227.6 75 0-23 8 76-46 81-338 286-077 291-021 1-38320.5 35 0*20 6 75-24 80-012 282-371 287-174 1-37820.5 35 0-20 10 75-16 79-991 282-414 287-280 1-37820.5 35 0-30 11 75-17 79-994 282-489 287-356 1-378
21.5 700 0-52 8 75-82 80-666 191-400 194-788 1-39330.5 700 0-65 5 76-31 81-152 191-480 194-845 1-39530.5 700 0-65 5 76-31 81-055 191-529 194-828 1-39630.5 700 0-60 7 76-31 81-105 191-508 194-859 1-39521.5 300 0-36 9 75-77 80-533 191-420 194-738 1-39228.6 300 0-33 11 76-56 81-333 191-598 194-874 1-39228.6 300 0-33 7 76-56 81-559 191-402 194-850 1-39319.5 75 0-24 13 75-94 80-778 191-454 194-770 1-38530.5 75 0-22 16 76-29 81-170 191-521 194-861 1-38628.6 75 0-24 18 76-62 81-501 191-545 194-872 1-38619.5 35 0-20 13 75-91 80-745 191-481 194-785 1-38228.6 35 0-22 16 76-59 81-450 191-565 194-866 1-382
24.7 75 0-40 15 75-92 80-798 152-502 155-200 1-39224.7 35 0-40 7 75-98 80-878 152-515 155-189 1-38524.7 35 0-40 6 75-98 80-872 152-552 155-231 1-385
Hydrogen Experiments.Preliminary Observations.—The whole apparatus was exhausted and th-
filled with hydrogen, these processes being repeated until a sample Of gas tab from the circuit had a purity of about 99 per cent, of hydrogen. In the ffl experiments, using the 75 c.c. bulb, the bridge current was the same as in t previous experiments on air a t room temperatures. I t was a t once obvious th the time of expansion was very much smaller and tha t the kick sensitivene was much reduced. With times of 0-16, 0-11 and 0*07 seconds, the values y were about 1 • 35,1 • 37 and 1 • 38 respectively. The largest bulb was then u*el with the same bridge cu rren t; the value 1 • 395 was obtained with a key time 0*2 seconds, the kick sensitiveness being only 2 divisions per mm., i.e., aap ten times smaller than in the case of the corresponding air experiments. |P sensitiveness was increased by putting 100 instead of 400 ohms in circuit |B§ the 4 accumulators. The value of y obtained was practically the same, bujM
on September 8, 2018http://rspa.royalsocietypublishing.org/Downloaded from

lensitivity was now 6*5 divs. per mm. of bridge wire. With such a large value or the heating effect, over 1-5° C. in the experiments at air temperatures, the variation in its values at Gi and 02 becomes of great importance ; it amounts to ibout 0*06 cm. of bridge wire and gives an additive correction to the ratio of )-0023.
At lower temperatures, sufficient sensitiveness was obtained when using much tmaller currents through the thermometer. The correction for the change in the heating effect was 0*02 cm. a t —78° C., 0*01 cm. at —118° C., and nothing it -183° C.
Purity of the Hydrogen.—The magnitude of the heating effect varied greatly srith the purity of the hydrogen and its measure was a useful guide to a knowledge )f this purity. As will be seen from fig. 7 the heating effect changed from about L9 cm. of bridge wire, when the bulb contained air, to about 4 cm., when hydrogen of the maximum purity used filled the bulb. The dependence of the heating effect on the purity was estimated in the following way. The resistance of the thermometer was measured, using 1, 2 and 4 cells through 100 ohms,
Ratio of Specific Heats using Small Volumes of Gas. 529
2 o 2
on September 8, 2018http://rspa.royalsocietypublishing.org/Downloaded from

530 J. H. Brinkworth.
when the bulb was filled with air. The pressure in the bulb was then reduced to one half its initial value, 80 cm. of mercury, and hydrogen, from the reservoir, was admitted to raise the pressure back to the original value, when similar resistance measurements were again made. This procedure was repeated.
The curves (fig. 7) are obtained by plotting the differences between the resistances with 2 and 1, and with 4 and 2 cells respectively, against a rough estimate of the air content. The upper curves show th a t when the hydrogen is fairly pure, a difference of 1 mm. on the bridge wire corresponds to about 1 per cent, change in the purity of the hydrogen. The curves marked AA refer to observations made with the 300 c.c. bulb a t 0° C .; BB represent mean results obtained using the 700 c.c. and 75 c.c. bulbs a t a temperature of about 15° C.
I am indebted to Mr. D. Newitt, of the Department of Chemical Technology in the Imperial College, for some analyses of samples of hydrogen taken from the gas circuit on various occasions, chiefly when the low temperature measurements were in progress. The mean of six separate analyses gives 99*3 ± 0-5 per cent, of hydrogen, the impurity being air, as there was about four to six times as much nitrogen as oxygen present in the remainder. A small correction, amounting to 1 part in 1000 on * the value of v a t — 183° C., has been applied to the final results.
Final Experiments.—These are summarised in the following tables. The general nature of the temperature changes during the expansion of the gas was as in the air experiments (fig. 3), but the time scale was reduced about five times.
on September 8, 2018http://rspa.royalsocietypublishing.org/Downloaded from

Ratio o f Specific Heats using Small Volumes of Gas. 531
H y d r o g e n . F in a l E x p e r im e n t s (fig . 9 ).
Reduced Observations.
P v Cl* 6. c. d. 7-
fovember 29th, 1923. 300 c.c. bulb. t = 0 -17 sec.
i-22 80-345 202-81 16-5 24 196-19 87-834 90-002 1-587280-288 202-81 16-5 11 196-26 87-857 90-002 1-587280-233 202-81 16-6 18 196-32 88-877 90-002 1-588280-174 202-81 16-6 3 196-40 88-903 70-002 1-587380-123 202-81 16-8 30 196-45 88-919 90-002 1-589480-069 202-81 16-8 22 196-50 88-936 90-002 1-591780-017 202-82 16-9 24 196-59 88-966 90-005 1-592479-961 202-82 16-8 _ 2 196-63 88-979 90-005 1-593579-907 202-82 16-9 — 2 196-73 88-012 90-005 1-5885
1-5895
•t — 0 •15 sec.
;-26 80-254 202-83 16-6 9 196-37 87-893 90-009 1-588080-198 202-83 16-8 37 196-41 87-906 90-009 1-588780-140 202-84 16-7 0 196-52 87-942 90-012 1-588180-082 202-85 16-8 4 196-60 87-968 90-015 1-588480-028 202-85 17-0 27 196-67 87-991 90-015 1-587379-970 202-85 16-9 0 196-72 88-008 90-015 1-591079-916 202-85 17-0 5 196-79 88-031 90-015 1-5906
1-5890
>ecember 5th, 1923. t = 0 -17 sec.
s*57 79-495 200-23 14-0 [— 3 193-84 87-065 89-157 1-590579-436 200-27 14-3 29 193-96 87-105 89-170 1-588979-371 200-32 14-3 7 194-08 87-145 89-186 1-589979-315 200-36 14-5 21 194-20 87-184 89-199 1-588379-262 200-42 14-5 1 2 194-31 87-220 89-219 1-5907
1-5897
on September 8, 2018http://rspa.royalsocietypublishing.org/Downloaded from

532 J. H. Brinkworth
Date.
1923.17.919.912.927.910.113.10
29.1031.10
1.1122.11 10.10
1924.31.1
24.124.1
1923.14.1114.1131.10
1.1124.1022.11
1924.31.1
1923.29.1129.11
5.127.12
19.1225.1129.1229.12
Summarised Results for .
Vol.,c.c.
Time,sees.
No.of
Obs.Pt-cm.
Pi-cm.
02*Abs.
evAbs.
, 7* 1 Mean.
700 0*09 9t
75*33 80*087 285*129 290*160 1*3982700 0*10 10 75*73 80*575 284*682 289*754 1*3980700 0*22 11 75*69 80*565 284*800 289*873 1*3950700 0*15 9 76*88 81*786 284*034 289*074 1*3970700 0*12 7 76*60 81*505 282*327 287*353 1*3981300 0*06 8 74*76 79*620 284*789 289*903 1*3944300 0*07 9 76*06 80*977 284*346 289*438 1*3960300 0*06 7 76*46 81*422 284*751 289*880 1*3962
75* 0*05 10 76*45 81*389 284*507 289*520 1*385875* 0*04 7 75*46 80*404 280*137 285*128 1*386035f — — — — -- - 1*368
300 0*09 7 76*96 81*865 268*278 273*046 1*3983
300 0*08 12 76*47 81*373 247*500 252*000 1*4084300 0*09 9 76*45 81*210 247*593 251*968 1*4087
700 0*12 6 74*35 79*220 190*927 194*619 1*4331700 0*12 9 74*69 79*496 191*036 194*660 1*4339300 0*09 11 76*46 81*257 191*358 194*904 1*4312
75 0*07 12 76*63 81*422 191*417 194*897 1*424035 0 05 13 73*81 78 *714 190 *826 194 *478 1*419035 0 05 10 75 *49 80 *360 191 184 194 *740 1 *4194
300 0*12 19 76*90 81*783 152*494 155*511 1*4676
300 0*17 9 75*22 80*123 87*919 90*002 1*5895300 0*15 7 75*26 80*082 87*968 90*015 1*5890300 0*17 5 74*57 79*371 87*145 89*186 1*5897
75 0*12 5 75*20 79*969 87*985 90*005 1*583875 0*12 14 76*57 81*500 88*061 90*114 1*583735J 0*10 15 76*50 81*370 88*240 90*239 1*576435 0*11 8 77*08 81*968 88*155 90*157 1*577235 0*09 6 77*08 81*838 88*217 90*177 1*5773
* With a key time 0*07, 7 = 1*383. *t Key time too small for measurement. Highest value obtained, t With a key time 0*17, 7 = 1 * 574.
„ „ 0 - 2 9 ,7 = 1 -5 7 0 .
Extrapolated Results.—In figs. 8 and 9 the mean result obtained with each bulb is plotted against the reciprocal of a linear dimension of the bulb, the inverse cube root of the volume. I t is found tha t the results a t ftflP temperature thus treated lie on a straight line—this law had been ussttfaflif by Mercer—and the value given by the intersection of this line with that infinite volume is taken as the value required. Jfl
As soon as the gas in the neighbourhood of the thermometer is cooled Bjji
on September 8, 2018http://rspa.royalsocietypublishing.org/Downloaded from

Ratio of Specific Heats using Small Volumes of Gas. 533
RECIPROCAL OF CUBE ROOT OF VOLUME
H Y D R O G E N
-21 C
M-Mercer.
R E C I P R O C A L OF C U B E ROOT OF VOLUME — --------— — -------------- ' : ;J7
on September 8, 2018http://rspa.royalsocietypublishing.org/Downloaded from
534 J. H. Brinkworth.
the adiabatic expansion an inflow of heat occurs from the walls of the vesse This causes a rise of temperature in the gas which will vary inversely with tb volume employed. 02 will therefore be in excess of its true value, and will be lower than the value corresponding to infinite volume by an amour depending on an inverse linear dimension of the vessel.
There is no difficulty in deducing the relation which represents the result of the experiments on air, because a linear law is so strictly applicable to th results obtained with all four vessels. This is the case because the time of tb key could be made short enough, even in the experiments with the 35 c.c. bull
Hydrogen, on account of its much smaller density, expands very muc: more rapidly, and it was not possible to make observations with a tim interval sufficiently short in the experiments with the two smaller vessels a air temperatures. The four experimental results, a t about 15° C., lie on « curve which, if extrapolated on the assumption th a t all the 'points should b equally weighted, indicates a value for the ratio for hydrogen a t this tempera ture slightly higher than th a t obtained by Shields.
I t was noticed how nearly the straight line through the mean results obtainec with the two larger vessels passed through the value obtained by Lummer anc Pringsheim, and also tha t this line was approximately parallel to the othe straight lines representing the results with air. At a later date it was found from the other experiments on hydrogen a t lower temperatures, when, owinj to the greater masses of gas in any bulb, more correct experimental condition were obtainable with the smaller vessels, th a t similar nearly parallel line were obtained.
Although the gases used had such very different physical properties and tb1 temperatures of the experiments extended over so wide a range, the slope of all these lines, each obtained from one set of experiments, agreed to withii 6 per cent. As the magnitude of the correction to be applied to the result obtained with the 300 c.c. biilb amounts to only 0*01 on the value of y, final values of y would not be affected by as much as 1 part in 2000 by th* adoption of a constant slope for all the linear relationships experimentally found. This result was wholly unexpected ; it is undoubtedly due to the fact that, in attempting to observe the lowest temperature attained by the ga> in the manner described previously, the time of the key is necessarily mucl shorter when using hydrogen than when air fills the bulb.
The Radiation Correction.—The thermometer wire continually receive* heat from the walls of the expansion vessel. The quantity of heat received will depend on the nature of the surfaces and on the magnitudes of 0 and of
on September 8, 2018http://rspa.royalsocietypublishing.org/Downloaded from

f A The subsequent rise in temperature of the wire, on which the radiation ejection depends, will be determined not only by the quantity of heat asorbed, which is practically independent of the nature of the gas, but also 1 the rate of loss of heat from the wire. The latter will depend on the tarmal conductivity of the surrounding gas.The radiation corrections will, therefore, be in the inverse ratio of the thermal
inductivities of the gases, as was assumed by Mercer. If the above explanation i correct, Partington’s adverse criticism of this method of estimating the o-rection is unjustifiable. The radiation correction has been measured and i plied to their results by all other observers, except by Shields. She points< t that it does not apply to values of y obtained by extrapolating against the jessure excess.The method of determining the correction is to measure y, first with a bright
jfttinum wire and then with the wire coated with platinum black, all other <perimental conditions being the same. Then, assuming that the absorption< a black surface is 15 times as great as tha t of a polished surface, the correction <n be calculated. As the thermometer, after the air experiments, was used 1r work with hydrogen, an experiment to determine this correction has not sen made ; obviously, it could not safely be attempted in an atmosphere of Mrogen.However, the smallness of the correction, and still more the concordance tween the values for it which have been obtained by others, justifies the sumption of an additive quantity 0*0021 to correct for this radiation error : air at room temperatures. The values a t lower temperatures have been duced by the application of Stefan’s law.Theoretical Correction.—Equation A, p. 511, applies only to perfect gases which >ey the law pv = H6. The adiabatic law assumed in calculating the results is */6 = constant. In the limit, corresponding to results deduced for a vessel of
finite volume, m is written as ^ ~ —. The specific heat at constant pressure
T . . . R6> of a gas which obeys the Callendar characteristic equation, —— - c
‘here b is the co-volume, and c the co-aggregation volume, which is a func-
on of the temperature of the form c —? n being dependent on the
ature of the gas), can be calculated from the thermodynamical relation
, l~ ] = 0 (— ) . The difference of the specific heats at constant pressureWp/* \dWv
Qd constant volume can be calculated from — — 0 *
Ratio of Specific Heats using Small Volumes of Gas. 535
on September 8, 2018http://rspa.royalsocietypublishing.org/Downloaded from

536 J. H. Brinkworth.
Y =z_f? can thus be obtained in terms of y', the relationship being
w ( i + v - » i s } ■
The numerical values adopted in calculating this correction are those given b; Prof. Gallendar in his paper on the “ Thermodynamical Correction of the_Ga Thermometer ” (‘ Phil. Mag.,’ January, 1903).
The corrections are almost identical in magnitude with those deduced fror the Berthelot characteristic equation used by Partington.
Summ.
Final Values for the Ratios of the Specific Heats.
Radia Thermo Im i
Final Values
of. 7 .
Values
Gas.Tempera V-
tionCorrec y 'i —
+ r.
dynamicalCorrection purity
CorrecObtained by
Otherture. tion Factor tion. Observers.°C . r. (1 + / ) •
Air ........ 17 1-3997 0-0021 1-4018 1-0010 — 1-4032 1-4025 L.&I 1-4029 Sh. 1-4034 P.
— 78 1-4032 0-0005 1-4037 1-0028 — 1-4077 1-4055 K.- 1 1 8 1-4082 0-0002 1-4084 1-0050 — 1-4154
Hydrogen 17 1-4066* 0-0004 1-4070 1-0000 — 1-4070 1-4012 Sh.0 1-4095 0-0003 1-4098 1 0001 — 1-4099
— 21 1-4197 0 0002 1-4199 1-0001 ■— • 1-4200— 78 1-4420 0-0001 1-4421 1-0002 0*0003 1-4427— 118 1-4789 0-0000 1-4789 1-0004 0*0005 1-4800
1-592 Sh.1— 183 1-6007 — 1-6007 1-0020 0*0015 1-6054
L & P., Lummer and Pringsheim, * Ann. d. Phys.,’ 1898. K., Koch, ‘ Ann. d. Phys.,’ 1908.P., Partington, ‘ P .R .S.,’ 1921.Sh., Shields, * Phys. Rev.,’ 1917.* L & P., experimental value 1-4063.
Criticism of Previous Measurements of y.
Summaries of the work of the many observers will be found in various pa^Pj referred to below. I t will be sufficient if attention is restricted to result obtained by the method adopted in these experiments. This limits the ^ cussion to a consideration of the methods of extrapolation used by S0IQ observers and to the results of the experiments by Lummer and I 'ringsheipand by Partington. JB
Moody C Phys. Rev.,’ vol. 34, p. 275, 1912), and later Shields (‘ Phys. Rev., vol. 10, p. 525, 1917), using thermocouples, extrapolate the observed valyet
on September 8, 2018http://rspa.royalsocietypublishing.org/Downloaded from

Ratio o f Specific H eats using Small Volumes o f Gas. 537.
0f against the pressure excess A p .Over the range of pressures used by the la-er observer, 7 to 35 ram. of mercury only, a linear relation holds with ponderable accuracy. Moody, using larger pressure excesses and a vessel of hi itres capacity, found th a t the linear relation did not hold good for values of ip greater than 6 cm., the divergence of the observations from this linear hi being in the same direction as th a t found by me (fig. 6), but not so large agnine. Both these experimenters made the key contact a t some definite tire after the commencement of the sudden expansion, but such contact was nc made automatically.
a Moody’s experiments this interval was either 2 or 3 seconds ; in Shields’ w k, with a 1-litre flask, the time was between 0 *87 and 1 second in the air pjeriments, and from 0*62 to 0-83 second when hydrogen was used.
'here can, I think, be no doubt tha t the reason for the low values of the rao for hydrogen obtained by Shields is because the time intervals were to long.
loth Lummer and Pringsheim and I find th a t the time taken for the expansion isome five times smaller in the case of hydrogen than for air : possibly Shields wild have obtained a higher value if the time intervals employed had hn between 0• 1 and 0*2 second. Shields points out that this method of erapolation corrects for error due to conduction along the leads of the thmo-junction as well as for the radiation effect, as these are proportional t<A0, which is itself zero when Ap = 0.?or the same reason any thermometric lag effect is eliminated. This method
o extrapolation is objectionable chiefly because the observed values of y rained from experiments with small values of A p a n d A0, on which observa- t aal and accidental errors would produce big percentage errors, are just those ''most importance in fixing the point of intersection (Ap = 0), giving the final
tc Mue of y.tfakower (‘ Phil. Mag.,’ vol. 5, p. 226, 1903) used air in a 50-litre globe and
c ompensated thermometer of 0*025 mm. diameter platinum wire. From the © userved measurements, he calculated the values of the adiabatic index m
Vs p. 511) corresponding to different times of closing the circuit after the mansion, times which varied from 0*75 to 5 seconds. He assumed this
'nation of mto be linear and extrapolated to find the value corresponding * zero time interval. This method may, perhaps, be referred to in terms of *- 3, as one in which observations are made at various points on the slowly ward-rising part of the temperature-time curve, i.e., between e and./. The 'lues of m for times shorter than about 1 second are constant and give a value
on September 8, 2018http://rspa.royalsocietypublishing.org/Downloaded from

538 J. H. Brinkworth.
of y = 1-396, but by assuming the linear extrapolation Makower deduct Y = 1*399.
I t is difficult to see how such a method of extrapolation can possibly corret for any lag effect, but the close agreement of the extrapolated result with tl probable value may be taken as a proof th a t any error due to lag effect in wire of 0*025 mm. diameter is very small, certainly not exceeding 0*001 o the value of y. I t is interesting to note th a t his results, for time intervals < one second and less, confirm the horizontal nature of the line c, e, in fig. ! The experimental result 1*396 is of great value as an estimate of y whic can indubitably be associated with my own experiments.
The method of extrapolation used by Mercer and myself is not open to two objections raised above. The observations are all made with a fairl large pressure excess, so th a t percentage errors in A a n d A0 are minimised moreover, as I have shown, there is a very accurate linear relation betwee the plotted quantities over a big range in the size of the vessel employed, an the whole variation in y over the observed straight portion of any line i only 1 per cent.
Again, the linear extrapolation gives a value of y corresponding not onl to th a t obtainable with a vessel of infinite volume, but also to a long time fo the key. This is clear if it be remembered th a t the key times had to 1 increased as the size of the bulb increased, in order to get near the point (fig. 3), and during this long interval lag effects would have had time t disappear. The method would not have been satisfactory if the thermomett had not been compensated.
Before commencing the hydrogen experiments, I had expected that th much greater thermal conductivity of this gas would be indicated by a increased slope in the lines representing the results. That this is not th case shows th a t the correction applied depends on the size of the bulb an on the thermometer, but not, apparently, on the nature of the gas surroundip the latter. The closeness with which Makower and Mercer’s values agre with mine are confirmatory to this supposition.
Lummer and Pringsheim and Partington have made measurements, uswi much finer wires in the thermometric system. Lummer and Pringsheim use a fine bolometer strip in a globe of 90 litres capacity. > They showed that, i) the case of air, the same results were obtained with an expansion time varyin from 12 to 2 seconds, and tha t in the latter case “ the galvanometer need! remained absolutely a t rest for several seconds after the expansion. T b |l must, however, be some uncertainty in their results, owing to the fact tip
on September 8, 2018http://rspa.royalsocietypublishing.org/Downloaded from

Ratio o f Specific H eats using Small Volumes Gas. 539
bolometer strip was not compensated for conduction occurring from the t cker leads.Probably Partington’s result y' = 1-4001 (‘Roy. Soc. Proc.,’ A, vol. 100,
127, 1921), obtained for air, using a 130-litre globe and a thermometer wire < diameter 0-001 mm., may be considered as entirely free from systematic tror, unless any was introduced by the “ overshooting ” of the gas owing to te rapidity of the expansion.He made some preliminary observations, using thermometer wires 0-05,
(01 and 0-001 mm. in diameter respectively, and found lag effects which iereased with the diameters of the wires used, these measurements being ;parently made with no compensating leads. If this were so, the “ lag ” dects, i.e., the non-coincidence of the temperature of the wire with that of ie gas immediately surrounding it, would be due to two causes, (a) the inertia • the wire itself, (6) conduction to the wire from the leads. Both these elects tend to maintain the wire a t a temperature above that of the gas. If e two effects are operative, it does not seem justifiable to apply the full rrection deduced from these preliminary observations to results obtained ith compensated thermometric systems. In some later experiments on air, hen a 60-litre vessel was employed, with a wire of 0-01 mm. diameter rming the compensated thermometer, Partington and Howe (‘ Roy. Soc. roc.,’ A, vol. 105, p. 225,1924) obtained two values, 1-3928 and 1-3968, ‘’there ;ing some uncertainty to within 0-05° in the measurement of the final mperature in the second determination.” The correction applied was iduced from the “ lag ” observations quoted above, and the values of y icame 1-4004 and 1-4038 respectively.Makower’s experimental value, 1 • 396, is only 0 • 004 lower than the most
robable value of y', but Partington’s first result, to which he attaches most eight, is so much lower than this, although the thermometer wire used was ■5 times smaller in diameter, that it suggests some outstanding error in artington’s later measurements. In other experiments Partington found overshooting” to occur when he used oxygen, but not when he used nitrogen, his seems so curious that, perhaps, it had better be considered as Partington’s value y ' = 1 • 4001 was obtained by the null method, the
alvanometer being an Einthoven string galvanometer with a period of about 5‘01 seconds. The resistance of the thermometer wire was about 1000 ohms, nd this was not affected by variations, within reasonable limits, of the bridge urrent. The temperature measurements were deduced by direct comparisons vith an auxiliary thermometer, which was read to 0-01° C., and corrected for
on September 8, 2018http://rspa.royalsocietypublishing.org/Downloaded from

540 J. H. Brinkworth.
emergent stem and scale errors. Though, the advantage accruing from the use of the fine wire bolometer and a dead-beat galvanometer, having a short period, are very great, there is a loss in sensitivity, as measured by the deflection of the filament corresponding to a temperature change in the thermometer wire. An estimate of this sensitiveness can be made from the experimental data given. The initial and final temperatures being fixed, A0 — 7*72°, a pressure excess of 115*10 mm. of oil caused a deflection of 0*1.
The null experiment gives y ' = 1*3981. Neglecting the deflection, the prehminary experiment gives y ' = 1 • 3965. The 0 • 1 division deflection (this is stated as being the limit to which the scale deflection could be estimated), therefore, corresponds to a temperature difference of over 0*02° C., and the accuracy of an individual result is limited to about 0*0015 on the value of y'.
The sensitivity may be even less than this, as the value of Y deduced from the null experiment is 0*002 lower than the mean of all the results which vary from 1*3978 to 1*4015. Confirmation of the essential correctness of this calculation is obtained from a statement by Partington (‘ Roy. Soc. Proc.,’ A, vol. 105, p. 238, 1924) th a t “ one-half a small scale division corresponds to about 0*10° temperature change,” though this statement refers to his more recent, but similar, experimental arrangements.
Kimdt’s tube method of determining the velocity of sound in gases cannot be considered good, owing to the difficulty in measuring the length of the sound wave.
I t is much better to measure the velocity of sound in small tubes by a direct method and to deduce the velocity in free gas. This has been done recently by Dixon, Campbell and Parker (‘ Roy. Soc. Proc.,’ A, vol. 100, p. 1, 1921) and by Dixon and Greenwood (‘ Roy. Soc. Proc.,’ A, vol. 105, p. 199, 1924). Their measurements were made on many different gases and vapours and extend over a wide range of high temperatures.
Great Care was- taken to eliminate errors inherent in the timing mechanism. The values obtained are probably more accurate than any previously recorded.
Values of the Specific Heats, fig. 10.
The specific heat a t constant pressure, sp, and the molecular heat a t constant volume Sr, can be deduced from the final values of y, but the error introduced on the value of each specific heat thus calculated is about three times larger than that existent on the value of y. Nevertheless, a smooth curve drawn through my observations with Hydrogen at 90°, 155°, and 290° abs., gives
on September 8, 2018http://rspa.royalsocietypublishing.org/Downloaded from

Ratio of Specific Heats using Small Volumes of Gas. 541
alues a t 252° and 273° which agree within one part in 250 with those deduced rom the experimental measurements.
The following values have been assumed in the calculations of sv and Sv :
R the gas constant = 1 • 985Molecular Weight of Air = 28*99Molecular Weight of Hydrogen == 2-016
Air.
0°A . 7 — 1. s,-s*. s*. Direct Measurement of sp.
[«90 ............................. 0-4032 1-995 4-948 0-2395 0-2414 S«,; 0 -237 R. 0-2406 S & H.
195 ............................. 0-4077 2-012 4-937 0-2396 0-243 S & H ; 0-237 W.|5 5 ............................. 0-4154 2-034 4-896 0-2391 0-246 S & H.* (at 90° A.)
Hydrogen.
6° A. 7 — 1. S , - Sv. Direct Measurement of sP.
290 ............................. 0-4070 1-9856 4-879 3-405 3-403 S & H .273 ............................. 0-4099 1-9858 4-844 3-388 3-40 R.252 ............................. 0-4200 1-9863 4-729 3-3311195 ............................. 0-4427 1-9869 4-488 3-212 3-157 S & H ., 3 -21.*155 ............................. 0-4800 1-9884 4-142 3 0411 90 ............................. 0-6054 1-9983 3-301 2-628 2-644 S & H., 2-60.*
R., Regnault, 4 Mem. de l’Acad.,’ 1862.Sw, Swann, 4 Phil. Trans.,’ A, 1911.W., Witkowski, 4 Phil. Mag.,’ 1896.S & H., Scheel and Heuse, 4 Ann. d. Phys.,’ 1912, 1913.
* S. & H., Scheel and Heuse, 'modified (see below).
Scheel and Heuse (‘ Ann. der Physik,’ vol. 37, p. 79, 1912, and vol. 40, p. 473, 1913) have measured the specific heats a t constant pressure for air, hvdrogen and other gases. The flows, in grammes per second, were very small, so tha t a very long extrapolation is necessary in order to arrive a t the value of sv corresponding to infinite flow, i.e., zero heat loss. If their experimental observations of CE/QdO are plotted against the corresponding values of 1 /Q, it will be found that considerable latitude in the values of sp deduced is possible. The experimental results with hydrogen a t —78° C., can be represented by a linear relation, fitting the points quite as well as the curve adopted, which gives the value 3-21, which is in excellent agreement with that deduced from my measurement of y a t this temperature. With regard to Scheel and Heuse’s
on September 8, 2018http://rspa.royalsocietypublishing.org/Downloaded from

542 J. H. Brinkworth.
measurements on air and hydrogen a t —183° C., values rather lower than those they give can be deduced. For example, each of the three series of experiments on air a t this temperature, when extrapolated linearly, will give a value of sP in the neighbourhood of 0*246.
Regnault’s value for the specific heat of air undoubtedly requires correction for the variation in the specific heat of water. In addition, if the correction suggested by Leduc (‘ Compt. Rend.,’ 1898) is made, Regnault’s value is raised to 0*2395, or if the experimental values be plotted against 1/Q, the value corresponding to infinite flow is about the same.
Eucken (c Sitz. d. Kon. Preus. Akad. d. Wiss.,’ 1912, p. 141) measured the molecular heat of hydrogen as a difference between the thermal capacities of a steel vessel when empty and when filled with hydrogen. At temperatures above 190° A, the ratio, thermal capacity of the contained hydrogen/thermal capacity of vessel, was about but a t lower temperatures the ratio increased. The specific heat of steel alters very rapidly a t low temperatures, and as the values of this quantity are somewhat uncertain, it is clear that some considerable error may be introduced. on the small difference measured. Eucken’s results, the first in which the rapid change in the molecular heat of hydrogen was experimentally verified, are remarkably consistent when one remembers the extreme difficulty of the measurements.
On the Variation of the Molecular Heat of Hydrogen with .
The values of SB, calculated from my experimental observations, are plotted against the corresponding absolute temperatures in fig. 10, and the continuous variation in SB is represented by the full curve. The values obtained by Eucken (loc. cit.) and those deduced from the experiments by Scheel and Heuse (loc. cit.) are also shown. The three broken curves have been drawn from formulae proposed by Planck-Einstein (‘ Ann. der Physik,’ vol. 22, 1907), by Reiche (‘ Ann. der Physik,’ vol. 58, p. 657, 1919) and by Callendar (‘ Phil. Mag.,’ vol. 26, p. 787, 1913) respectively. Not one of these fits the experimental observations over the whole temperature range a t all well, for each deviates by 2 per cent.* or more from the full curve representing values which, by a very conservative estimate, are accurate to within one-half of 1 per cent.
I t is not to be expected tha t a simple relation, involving one frequency only and however deduced, should represent the results over the whole temperature
* The divergence when measured as a percentage of the rotational specific heat is several times greater than this.
on September 8, 2018http://rspa.royalsocietypublishing.org/Downloaded from
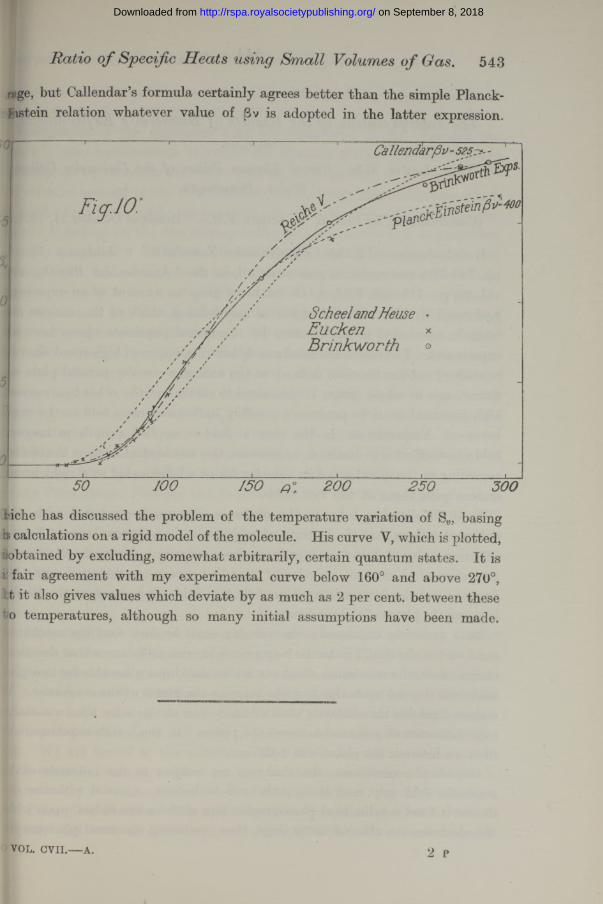
otge, but Callendar’s formula certainly agrees better than the simple Planck- Histein relation whatever value of Bv is adopted in the latter expression.
Ratio o f Specific Heats using Small Volumes of Gas. 543
Callendarpv- 5257*- -
ScheelandHeuse • Eucken *B rinkw orth °
Oliche has discussed the problem of the temperature variation of S„, basing bs calculations on a rigid model of the molecule. His curve V, which is plotted, iobtained by excluding, somewhat arbitrarily, certain quantum states. I t is ilfair agreement with my experimental curve below 160° and above 270°, ht it also gives values which deviate by as much as 2 per cent, between these to temperatures, although so many initial assumptions have been made.
2 pVOL. evil.— A.
on September 8, 2018http://rspa.royalsocietypublishing.org/Downloaded from