on the impact of post sharing agreements on growth in developing countries after...
TRANSCRIPT

1
On the Impact of Post-Conflict Power
Sharing Agreements on Growth in
Developing Countries after 1989*
Syed Mansoob Murshed
International Institute of Social Studies (ISS), Erasmus University Rotterdam (EUR),
The Hague, The Netherlands and Coventry University, UK.
&
Muhammad Badiuzzaman
International Institute of Social Studies (ISS), Erasmus University Rotterdam (EUR),
The Hague, The Netherlands.
ABSTRACT
In this paper we test the impact of post-conflict power sharing arrangements, and their
implementation, on economic growth in developing countries. Our theoretical postulate is
that power sharing agreements, especially if implemented serve to alter the institutional
environment after a civil war has occurred. This may promote growth by enabling more
Schumpterian creative destruction in production, lowering social conflict and also by altering
the nature of economic institutions. In our cross-sectional empirical investigation, we utilize a
power sharing event data set (PSED), which distinguishes between power sharing pledges
and their implementation, and sub-divides power sharing into political, economic, military
and territorial types. The data covers the period from 1989 to 2006. Our results suggest that
power sharing agreements in general, particularly territorial power sharing, as well as military
power sharing, do indeed facilitate post-conflict growth.
Keywords: Civil War, Post-Conflict Power Sharing, Post-Conflict Economic Growth.
This version: 28th
June 2016
* Paper Prepared for the 24
th World Congress of the International Political Science Association in
Poznan, Poland, 23-28 July 2016, to be presented in the panel: Signalling Strangers? Power Sharing
and FDI in Post-Civil War States, convened by Caroline Hartzell.
2
1 Introduction
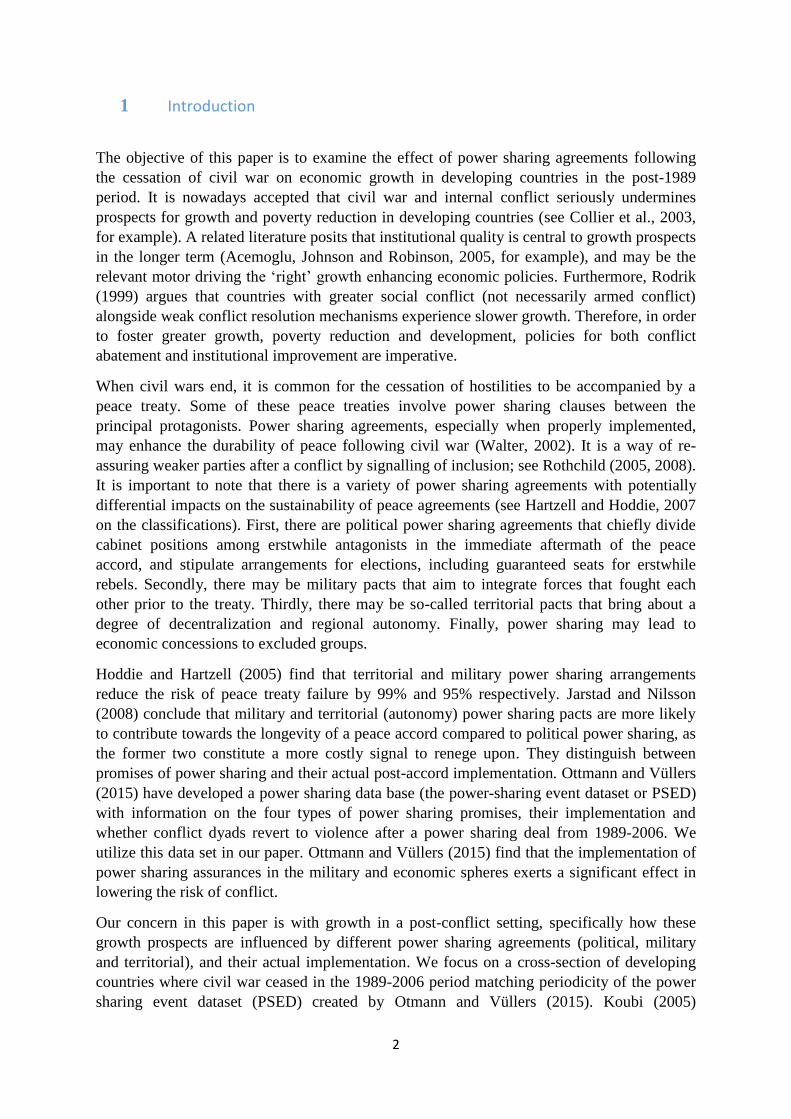
The objective of this paper is to examine the effect of power sharing agreements following
the cessation of civil war on economic growth in developing countries in the post-1989
period. It is nowadays accepted that civil war and internal conflict seriously undermines
prospects for growth and poverty reduction in developing countries (see Collier et al., 2003,
for example). A related literature posits that institutional quality is central to growth prospects
in the longer term (Acemoglu, Johnson and Robinson, 2005, for example), and may be the
relevant motor driving the ‘right’ growth enhancing economic policies. Furthermore, Rodrik
(1999) argues that countries with greater social conflict (not necessarily armed conflict)
alongside weak conflict resolution mechanisms experience slower growth. Therefore, in order
to foster greater growth, poverty reduction and development, policies for both conflict
abatement and institutional improvement are imperative.
When civil wars end, it is common for the cessation of hostilities to be accompanied by a
peace treaty. Some of these peace treaties involve power sharing clauses between the
principal protagonists. Power sharing agreements, especially when properly implemented,
may enhance the durability of peace following civil war (Walter, 2002). It is a way of re-
assuring weaker parties after a conflict by signalling of inclusion; see Rothchild (2005, 2008).
It is important to note that there is a variety of power sharing agreements with potentially
differential impacts on the sustainability of peace agreements (see Hartzell and Hoddie, 2007
on the classifications). First, there are political power sharing agreements that chiefly divide
cabinet positions among erstwhile antagonists in the immediate aftermath of the peace
accord, and stipulate arrangements for elections, including guaranteed seats for erstwhile
rebels. Secondly, there may be military pacts that aim to integrate forces that fought each
other prior to the treaty. Thirdly, there may be so-called territorial pacts that bring about a
degree of decentralization and regional autonomy. Finally, power sharing may lead to
economic concessions to excluded groups.
Hoddie and Hartzell (2005) find that territorial and military power sharing arrangements
reduce the risk of peace treaty failure by 99% and 95% respectively. Jarstad and Nilsson
(2008) conclude that military and territorial (autonomy) power sharing pacts are more likely
to contribute towards the longevity of a peace accord compared to political power sharing, as
the former two constitute a more costly signal to renege upon. They distinguish between
promises of power sharing and their actual post-accord implementation. Ottmann and Vüllers
(2015) have developed a power sharing data base (the power-sharing event dataset or PSED)
with information on the four types of power sharing promises, their implementation and
whether conflict dyads revert to violence after a power sharing deal from 1989-2006. We
utilize this data set in our paper. Ottmann and Vüllers (2015) find that the implementation of
power sharing assurances in the military and economic spheres exerts a significant effect in
lowering the risk of conflict.
Our concern in this paper is with growth in a post-conflict setting, specifically how these
growth prospects are influenced by different power sharing agreements (political, military
and territorial), and their actual implementation. We focus on a cross-section of developing
countries where civil war ceased in the 1989-2006 period matching periodicity of the power
sharing event dataset (PSED) created by Otmann and Vüllers (2015). Koubi (2005)

3
demonstrated that in the 1960-1989 period, post-war economic growth was greater the higher
the intensity of conflict. Thus, there is a priori evidence that the cessation of conflict is
followed by rapid growth (the Phoenix factor).1 Furthermore, conflict may serve to remove or
reform certain institutional constraints to capitalism’s creative forces of destruction and
creation (Schumpeter, 1942). Power sharing agreements may aid or retard these changes, as
well as alter the functioning of economic institutions that promote growth as highlighted by
Acemoglu, Johnson and Robinson (2005). Moreover, power sharing may be an additional
means of mitigating social conflict in general, constituting a powerful mechanism through
which conflict resolution can take place.
The remainder of the paper is organised as follows: section 2 outlines our theoretical
framework; section 3 describes our empirical methodology and data followed by our results
in section 4; section 5 is by way of a brief conclusion.
2 Theoretical Underpinnings
As already indicated, there appears to be a ‘Phoenix’ factor at work when it comes to post-
war economic growth. Koubi (2005) has demonstrated that post-conflict growth is greater the
longer the duration of the war, and the more intense the conflict in terms of battle deaths in a
cross-country regression covering all (interstate and civil) wars during the period between
1960 and 1989. But the causal mechanisms underlying this phenomenon still remain largely
unanswered. A clue could be contained in institutional change, as war alters the balance of
power in society, even when its cessation is not accompanied by an explicit peace treaty with
power sharing stipulations. Power sharing outcomes could imply deeper institutional change
both in terms of process and outcome compared to a peace which does not result in power
sharing. De facto power sharing does not necessarily require an explicit treaty obligation.
In the economics of growth, following the work of Acemoglu, Johnson and Robinson (2005
for example) it is currently believed that long-term growth prospects require solid
institutional functioning.2 Formal and informal political institutions related to power relations
and the distribution of income shape economic institutions (chiefly related to property rights
and the enforcement of contracts). These economic institutions, and their functioning,
determine long-term growth. In other words, political institutions and the distribution of
income or wealth are the two state variables that determine economic institutions, and then
economic performance (growth) and the future distribution of resources (income and wealth).
Even if one does subscribe entirely to this view, at the very least it can be argued that
institutions perform an enabling function that permits growth enhancing economic policies to
succeed. Institutions may be a mechanism in the middle between policies to promote
investment and productivity and their fruition.
In this connection it may be argued that power sharing alters the political balance of power,
and therefore impacts also on economic institutions. Power sharing, relative to other peace
1 War, however, has serious repercussions for contemporaneous growth (Gates et. Al, 2012), and even rapid
post-conflict growth does not always make up for this lost output. 2 These views are, for example, used to explain why colonised countries in Latin America or sub-Saharan Africa
did not develop or grow as fast as North America, where settlement by colonists was more prevalent.

4
settlements, leads to greater institutional change, as it is potentially more inclusive, and
usually co-opts weaker parties to a conflict.
Another factor that is considered salient in lowering growth is social conflict, short of war,
although social conflict may contain the seeds of deadly armed conflict. Rodrik (1999)
argued that social conflict measured by indicators such as income inequality3 and ethno-
linguistic fragmentation, unless moderated by well-functioning institutions (democracy and
other governance indicators), can lead to declining growth. This helps explain the growth
collapses in sub-Saharan Africa, Latin America and even the Middle East in the post-1973
era running up to the second millennium. In other words, persistent inequality and other
forms of social conflict destabilise the fabric of the social contract. Even in cases where it
does not lead to a full-blown civil war, social conflict is likely to retard growth. Post-war
power sharing arrangements may therefore constitute an additional institutional mechanism,
on top of democracy, and conventional good governance, for managing latent social conflict,
as they imply inclusiveness. This may promote sustainable economic growth.
War alters the political balance of power, and the institutions that govern society. In a market
(capitalist) economy the process of innovation is a dynamic factor crucial to economic
progress. This is a process that can be traced back to Schumpeter’s (1942) notion of creative
destruction, which implies the abandoning of some of the existing productive capacity of an
economy in favour of newer forms of production. Here the role of the entrepreneur is crucial,
as are the incentives he faces to innovate. Cabellero and Hammour (2001) present a
contemporary version of Schumpeter’s (1942) creative destruction theory involving a three
stage process: destruction or the scrapping of some existing productive capacity, the creation
of new production facilities and finally, the act of production itself. The full potential
economic growth of an economy may not be realised if there is insufficient ‘creation’. This
may be the consequence of institutional arrangements that encourage incomplete contracting,
rent seeking and the creation of regulatory burdens repressing creative innovation. Murphy,
Shleifer and Vishny (1991) point out that a certain type of institutional environment diverts
valuable human talent away from productive activities towards rent seeking and predation,
thus dampening growth prospects. The alteration or modification of institutional
arrangements that discourage innovation and create incentives to engage in rent seeking may
require the sea changes engendered by war; these may be further cemented by the power
sharing arrangements enacted in a post-conflict society.
In summary, our hypothesis is that power sharing agreements in a peace treaty after war alters
the political balance of power which reshapes economic institutions, mitigates the effects of
social conflict, and permits greater productive innovation (creative destruction). All of this
should stimulate economic growth, and this is the proposition that we empirically examine.
Prior to moving on to our econometric investigation it is worthwhile examining some
descriptive statistics. Table 1 lists the total number of post-conflict countries, a sub-set of
which had power sharing peace treaties, with a further sub-set where these agreements were
implemented.4
3 In recent times, the role of inequality in retarding growth, in both developed and developing countries, is
receiving special attention; see Dabla-Norris et al (2015). 4 According to the PSED data base, de facto implementation could exceed de jure agreement, so we recode
countries with agreements to reflect this.
5
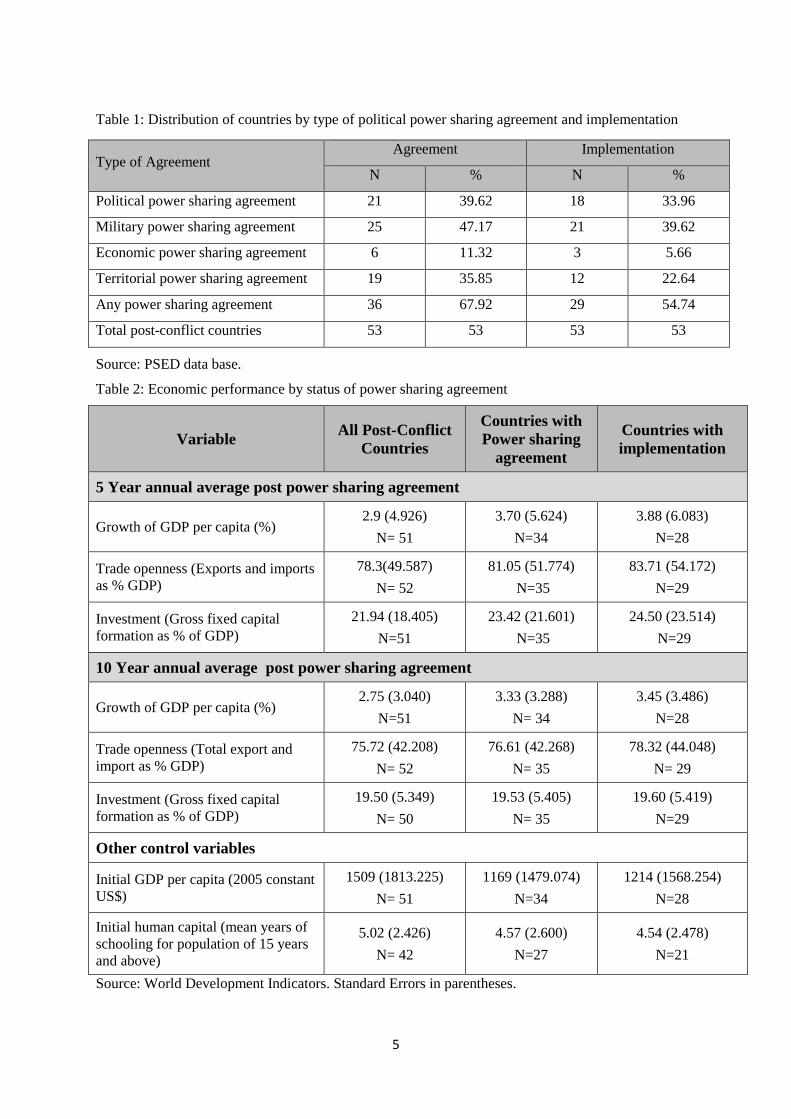
Table 1: Distribution of countries by type of political power sharing agreement and implementation
Type of Agreement Agreement Implementation
N % N %
Political power sharing agreement 21 39.62 18 33.96
Military power sharing agreement 25 47.17 21 39.62
Economic power sharing agreement 6 11.32 3 5.66
Territorial power sharing agreement 19 35.85 12 22.64
Any power sharing agreement 36 67.92 29 54.74
Total post-conflict countries 53 53 53 53
Source: PSED data base.
Table 2: Economic performance by status of power sharing agreement
Variable All Post-Conflict
Countries
Countries with
Power sharing
agreement
Countries with
implementation
5 Year annual average post power sharing agreement
Growth of GDP per capita (%) 2.9 (4.926)
N= 51
3.70 (5.624)
N=34
3.88 (6.083)
N=28
Trade openness (Exports and imports
as % GDP)
78.3(49.587)
N= 52
81.05 (51.774)
N=35
83.71 (54.172)
N=29
Investment (Gross fixed capital
formation as % of GDP)
21.94 (18.405)
N=51
23.42 (21.601)
N=35
24.50 (23.514)
N=29
10 Year annual average post power sharing agreement
Growth of GDP per capita (%) 2.75 (3.040)
N=51
3.33 (3.288)
N= 34
3.45 (3.486)
N=28
Trade openness (Total export and
import as % GDP)
75.72 (42.208)
N= 52
76.61 (42.268)
N= 35
78.32 (44.048)
N= 29
Investment (Gross fixed capital
formation as % of GDP)
19.50 (5.349)
N= 50
19.53 (5.405)
N= 35
19.60 (5.419)
N=29
Other control variables
Initial GDP per capita (2005 constant
US$)
1509 (1813.225)
N= 51
1169 (1479.074)
N=34
1214 (1568.254)
N=28
Initial human capital (mean years of
schooling for population of 15 years
and above)
5.02 (2.426)
N= 42
4.57 (2.600)
N=27
4.54 (2.478)
N=21
Source: World Development Indicators. Standard Errors in parentheses.
6
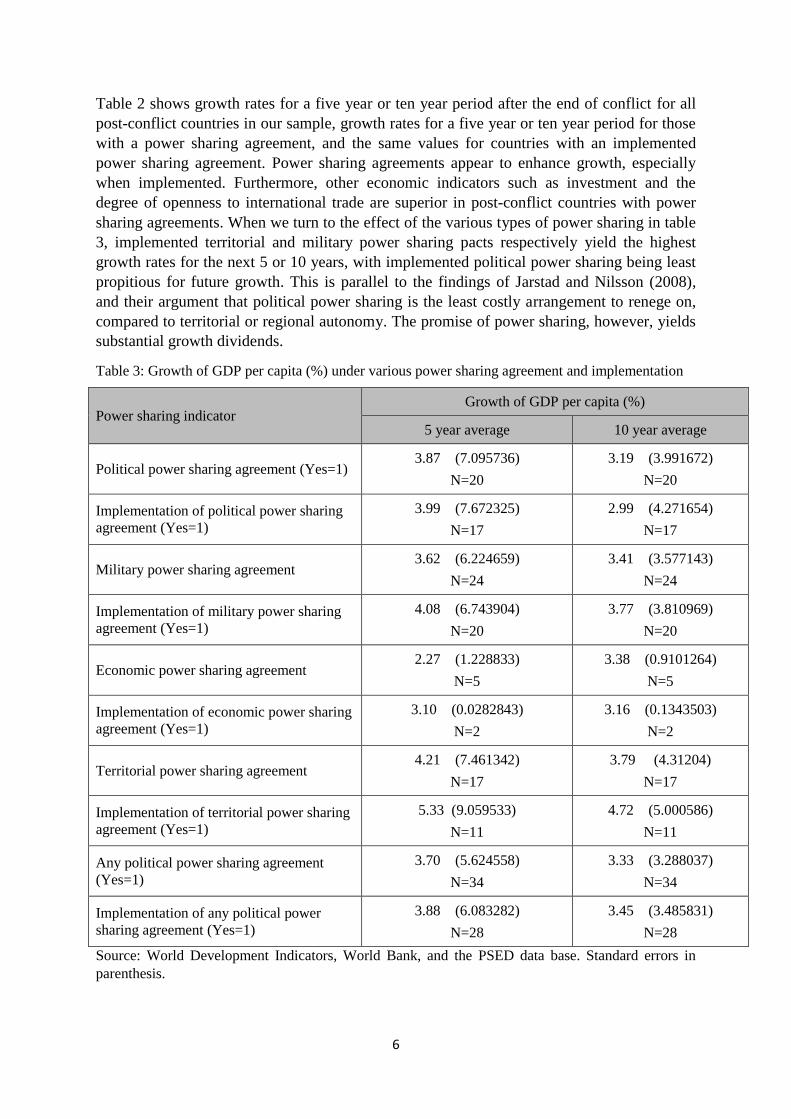
Table 2 shows growth rates for a five year or ten year period after the end of conflict for all
post-conflict countries in our sample, growth rates for a five year or ten year period for those
with a power sharing agreement, and the same values for countries with an implemented
power sharing agreement. Power sharing agreements appear to enhance growth, especially
when implemented. Furthermore, other economic indicators such as investment and the
degree of openness to international trade are superior in post-conflict countries with power
sharing agreements. When we turn to the effect of the various types of power sharing in table
3, implemented territorial and military power sharing pacts respectively yield the highest
growth rates for the next 5 or 10 years, with implemented political power sharing being least
propitious for future growth. This is parallel to the findings of Jarstad and Nilsson (2008),
and their argument that political power sharing is the least costly arrangement to renege on,
compared to territorial or regional autonomy. The promise of power sharing, however, yields
substantial growth dividends.
Table 3: Growth of GDP per capita (%) under various power sharing agreement and implementation
Power sharing indicator Growth of GDP per capita (%)
5 year average 10 year average
Political power sharing agreement (Yes=1) 3.87 (7.095736)
N=20
3.19 (3.991672)
N=20
Implementation of political power sharing
agreement (Yes=1)
3.99 (7.672325)
N=17
2.99 (4.271654)
N=17
Military power sharing agreement 3.62 (6.224659)
N=24
3.41 (3.577143)
N=24
Implementation of military power sharing
agreement (Yes=1)
4.08 (6.743904)
N=20
3.77 (3.810969)
N=20
Economic power sharing agreement 2.27 (1.228833)
N=5
3.38 (0.9101264)
N=5
Implementation of economic power sharing
agreement (Yes=1)
3.10 (0.0282843)
N=2
3.16 (0.1343503)
N=2
Territorial power sharing agreement 4.21 (7.461342)
N=17
3.79 (4.31204)
N=17
Implementation of territorial power sharing
agreement (Yes=1)
5.33 (9.059533)
N=11
4.72 (5.000586)
N=11
Any political power sharing agreement
(Yes=1)
3.70 (5.624558)
N=34
3.33 (3.288037)
N=34
Implementation of any political power
sharing agreement (Yes=1)
3.88 (6.083282)
N=28
3.45 (3.485831)
N=28
Source: World Development Indicators, World Bank, and the PSED data base. Standard errors in
parenthesis.

7
3. Data and Methodology
The total number of countries that successfully ended all civil wars in their soil, without
conflict re-igniting is 53. The data on power sharing is derived from the PSED data set
created by Otmann and Vüllers (2015) for the period 1989 to 2006. There are a total of 36
countries5 which had power sharing agreements, although countries actually implementing
these may exceed the number of explicit agreements enshrined in treaties. Political power
sharing agreements covered 21 countries, military agreements 25 countries, economic power
sharing occurred in 6 countries and territorial agreements in 19 nations. Observe that any
single civil war cessation may involving a peace treaty may or may not contain explicit
power sharing clauses; if they do, they may cover more than one of the four dimensions of
power sharing. Details of the four different types of power sharing agreements can be found
in Ottmann and Vüllers (2015). In our econometric analysis, we exclude a number of
developed countries such as the UK and Australia as their growth trajectories are very
different from the rest of the sample, and countries where there have been power sharing
agreements in some civil wars but other armed conflicts persist (Israel, Pakistan, Peru, Sri
Lanka, Uzbekistan and Yemen). A few other countries may fall out of the sample because of
the lack of some economic data.
Our regression model involves a cross section of developing countries where civil wars ended
between 1989 to 2006, conforming to the period covered in the PSED data set. Our
dependent variable is annual average growth in GDP per-capita in the post-conflict country
for either a five or ten year period following the cessation of hostilities. Given differential
dates when power sharing agreements are arrived at, and the subsequent five or ten year
period’s average growth for different countries---our analysis is purely cross-sectional, and
not a panel. The basis regression model takes the form:
𝑌𝑖 = 𝛼 + 𝛽𝑋𝑖 + 𝛾𝑍𝑖 + 𝜖𝑖
Here Y is the dependent variable indicating the (five or ten year) annual average growth in
per-capita GDP in country i after the cessation of war6, α is the constant term, the βs are
coefficients, ε is the error term, X refers to power sharing agreements, which take the value 1
if a conflict ends with power sharing, 0 otherwise; Z is a vector of control variables described
below. We also employ country fixed effects to account for unobserved country
heterogeneities.
As far as the control variables are concerned, first of all we employ initial year GDP per
capita, as in standard growth regressions, for each country in the year when civil wars end.
This is because in a cross-section countries with a higher initial per-capita income are
expected to grow more slowly. Data on income per capita are drawn from the World Bank’s,
World Development Indicators (WDI) data base. We also include the five or ten year average
degree of trade openness (exports plus imports over GDP), as greater exposure to
international trade or globalisation is expected to increase growth prospects. Data on these
variables are drawn from the WDI. We also include five or ten year average data on gross
5 The actual data is reported on the basis of conflict dyads as there may be more than one civil war in any one
country, but for the purposes of measuring growth, we have converted the data into a country-year format. 6 Since we look at growth after the end of conflict, we avoid potential endogeneity and reversal causality issues.

8
fixed capital formation as the standard proxy for investment in physical capital, essential to
any growth accounting exercise. This information is also obtained from the WDI. Data on
education or human capital are drawn from the Barro-Lee (2013) data, based on the initial
year (end of the civil war) mean years of schooling for the population aged 15 years or more.
Human capital plays a crucial role in promoting growth; since it takes time to yield dividends
in terms of growth, initial year values should be considered. The deployment of human
capital results in several countries dropping out from the sample because of missing data. We
do not include any other institutional variables involving polity and governance, as they could
be highly co-linear with power sharing, and act as confounding factors with both power
sharing and growth. In what follows we also refrain from the regression analysis involving
economic power sharing, since the number of observations are limited to just 6.
4 Empirical results
Our sample consists of 50 plus conflict countries where conflict completely ceased in the
1989-2006 period, a sub-set of which have power sharing arrangements of different types.
We refer to power sharing agreements in peace treaties as promises, and their implementation
as practices, in the tables that follow. The regressions labelled number 1 in the tables include
initial human capital as defined above. Their inclusion, however, leads to a loss of 9 out of a
total of 49-50 observations due to data paucity, and therefore in order not to lose degrees of
freedom we drop this explanatory variable in regressions labelled 2. Observe, also that
because we have a pure cross-section the fixed effects estimators will cluster standard errors
at the country level, reporting identical coefficients.
At first it may be useful to aggregate all power sharing agreements together, treating them as
if they were a grand set of institutional innovations. These results are reported in table 4 for
growth in a five year period following the cessation of violence, and in table 5 for a ten year
period of growth. Any stipulation or promise of a power sharing agreement per se seems to
positively and significantly enhance growth, except when the initial human capital
endowment of countries is excluded for the five year growth exercise in table 4. The actual
practice or implementation of these agreements appears to matter less; it is significant only in
the fixed effects estimator for ten year post-conflict growth in table 5. The impact of the
power sharing on growth appears stronger for the five year period following peace, than for
the ten year period when the magnitude of its coefficient wanes, and when it is significant it
is so at a lower confidence level than in the five year post-conflict growth regressions.
The sign of the effect of initial per-capita income is negative, as expected, although
insignificant, with the exception of one instance where initial human capital is dropped in
table 4. This may be because it is picking up the contribution of human capital when that
variable is omitted. The effect of initial human capital endowment on growth is positive but
insignificant, and the coefficients are greater in the five year period relative to the ten year
episode. The effect of the degree of globalisation on growth, measured by the magnitude of
the share of international trade in national income (openness) is positive but insignificant in
all estimations. The effect of investment captured by the magnitude of gross fixed capital
formation is highly significant in the five year period following the end of war (table 4); it
continues to exert a positive influence in the ten year period, although becoming statistically
insignificant.

9
Table 4: All power sharing agreements and post conflict growth over 5 years
Variables Promise Practice Promise: Fixed effect Practice: Fixed effect
1 2 1 2 1 2 1 2
Any promise 1.662** 2.369 1.662** 2.369**
(0.787) (1.502) (0.779) (1.101)
Any practice 0.986 1.876 0.986 1.876
(0.752) (1.391) (0.661) (1.169)
Trade openness 0.00326 0.0108 0.00265 0.00984 0.00326 0.0108 0.00265 0.00984
(0.00707) (0.0144) (0.00735) (0.0145) (0.00559) (0.00976) (0.00574) (0.00982)
Investment 0.0909*** 0.110* 0.0927*** 0.111* 0.0909*** 0.110*** 0.0927*** 0.111***
(0.0269) (0.0557) (0.0279) (0.0561) (0.0172) (0.0338) (0.0178) (0.0333)
Initial_Y -7.89e-05 6.49e-05 -0.000154 -1.54e-05 -7.89e-05 6.49e-05 -0.000154 -1.54e-05
(0.000219) (0.000393) (0.000222) (0.000386) (0.000150) (0.000161) (0.000178) (0.000157)
Initial_human
capital 0.175 0.160 0.175 0.160
(0.173) (0.179) (0.215) (0.227)
Constant -1.599 -1.885 -0.795 -1.161 -1.599 -1.885 -0.795 -1.161
(1.165) (1.854) (1.093) (1.682) (1.186) (1.265) (0.910) (1.125)
Observations 41 50 41 50 41 50 41 50
R-squared 0.389 0.181 0.343 0.170 0.389 0.181 0.343 0.170
Standard errors in parentheses. *** p<0.01, ** p<0.05, * p<0.1
Table 5: All power sharing agreements and post conflict growth over 10 years
Variables Promise Practice Promise: Fixed effect Practice: Fixed effect
1 2 1 2 1 2 1 2
Any promise 1.275* 1.663* 1.275* 1.663**
(0.685) (0.956) (0.695) (0.767)
Any practice 0.933 1.402 0.933 1.402*
(0.622) (0.867) (0.574) (0.793)
Trade openness 0.00625 0.0123 0.00523 0.0113 0.00625 0.0123 0.00523 0.0113
(0.00668) (0.00998) (0.00678) (0.0100) (0.00449) (0.00796) (0.00454) (0.00811)
Investment 0.0286 0.133 0.0256 0.137 0.0286 0.133 0.0256 0.137*
(0.0648) (0.0835) (0.0658) (0.0838) (0.0642) (0.0817) (0.0618) (0.0812)
Initial_Y -0.000120 -4.06e-05 -0.000176 -9.61e-05 -0.000120 -4.06e-05 -0.000176 -9.61e-05
(0.000185) (0.000247) (0.000183) (0.000240) (0.000207) (0.000158) (0.000222) (0.000160)
Initial_human
capital 0.125 0.121 0.125 0.121
(0.146) (0.148) (0.177) (0.187)
Constant 0.211 -1.778 0.836 -1.331 0.211 -1.778 0.836 -1.331
(1.593) (1.858) (1.516) (1.788) (1.791) (1.961) (1.539) (1.914)
Observations 40 49 40 49 40 49 40 49
R-squared 0.154 0.160 0.125 0.152 0.154 0.160 0.125 0.152
Standard errors in parentheses. *** p<0.01, ** p<0.05, * p<0.1

10
Turning now to political power sharing, this type of power sharing is statistically insignificant
in terms of its contribution to growth, and the signs are sometimes negative, when it comes to
power sharing in practice (see tables 6 and 7). This may be due to the fact that political power
sharing is the most akin to ‘cheap talk’ when it comes to judging the commitment of the more
powerful to be more inclusive of the weaker segments of society. By the same token, it is
least costly signal, and the easiest commitment to renege on. Political power sharing, such as
guarantees of cabinet posts for erstwhile rebels, can not only be reneged on, but can also
produce political instability that is harmful to growth prospects. Roeder (2005) points out the
inherent instability of political power sharing in fractionalised societies. Hence, the negative
signs on implemented power sharing agreements, when all control variables are included.
Both Jarstad and Nilsson (2008) and Ottmann and Vüllers (2015) find that political power
sharing can actually reduce the durability of peace. In our sample, we have excluded post-
conflict countries that revert to civil war, but that the absence of war (negative peace) does
not preclude political instability and social conflict. The signs, significance and interpretation
of the contribution of the other independent variables in tables 6 and 7 are much the same as
discussed in the previous paragraph.
With regard to military power sharing’s impact on growth we can be more sanguine. Its sign
is always positive (Tables 8 and 9), becoming significant in three cases when implemented,
included two cases for long-run growth ten years after cessation of hostilities (Table 9). The
signs and significance for the other independent variables are similar to their effect
previously, with the exception that the effect of initial per-capita income is positive (but
insignificant) for the ten year growth analysis. This suggests an anomaly that for this sample,
richer post-conflict countries grow faster than poorer countries. Military power sharing could
be more effective in enhancing economic progress in post-conflict countries that were
relatively richer to begin with. In line with earlier findings (Jarstad and Nilsson, 2008 and
Ottmann and Vüllers, 2015) military power sharing is a more powerful signal of inclusion,
and lowers the probability of conflict reigniting substantially. Hence it generates more
stability, may encourage greater innovation, and is more growth promoting.
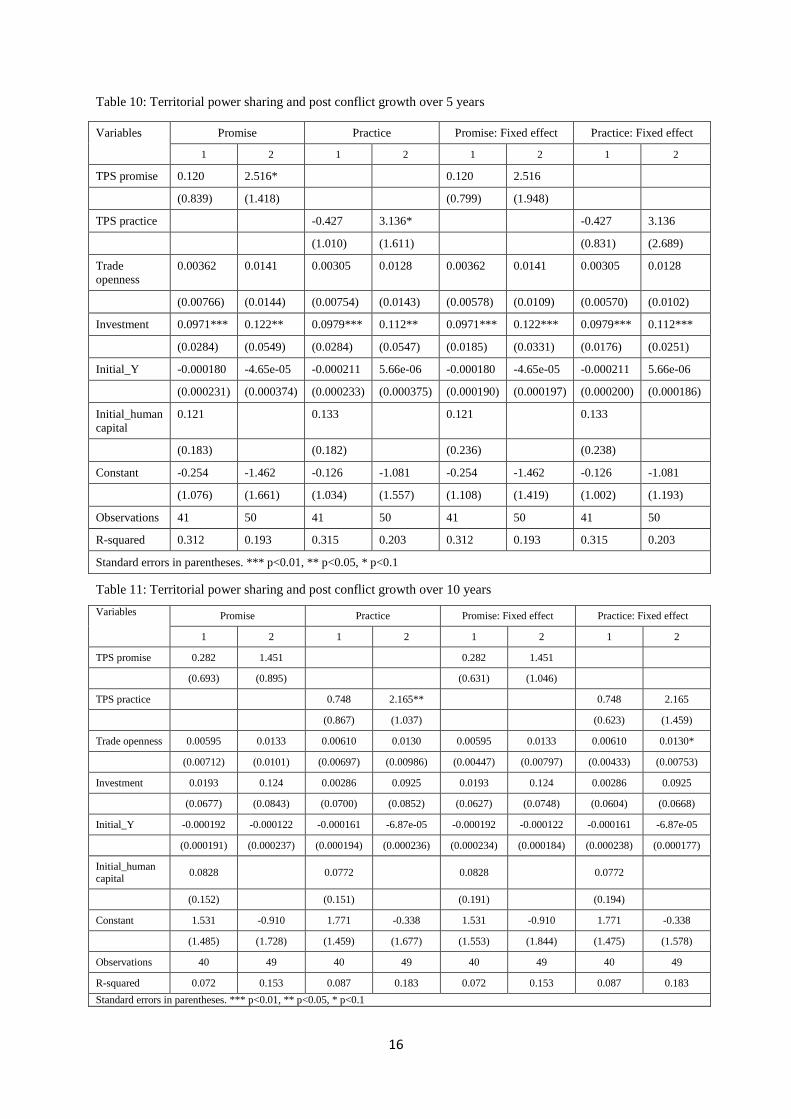
Tables 10 and 11 present results for territorial power sharing or regional autonomy, a device
which may be regarded as decentralisation, federalism, akin to the power dividing ideas in
Roeder (2005). It is statistically significant in three instances also, but the magnitude of these
significant coefficients are the largest, suggesting it may be the most effective in enhancing
growth of all three types of power sharing, at least in the short run five year period. In this
case, the signs, significance and interpretation of the contribution of the other independent
variables are similar to those discussed beforehand, except that the positive contribution of
trade openness or globalisation is statistically significant in one case for the ten year analysis
of growth. Akin to military power sharing, territorial power sharing is a costlier signal of
inclusion to renege on; once granted regional autonomy cannot be easily revoked. This may
encourage political stability, reduce social conflict and enhance innovation especially in the
shorter term following a lasting peace accord. The benefits of this form of power sharing are
significant in fewer cases in the longer run growth analysis of ten years compared to its
military power sharing counterpart. Our findings run parallel to the results in Jarstad and
Nilsson (2008) and Ottmann and Vüllers (2015), although they are concerned with durability
of peace.
11
5 Conclusions
We have attempted to look at the growth enhancing properties of power sharing agreements
in post-conflict economies. Our premise is that power sharing could be the catalyst for
institutional change, permitting greater innovation and managing social conflict, so as to
enhance growth prospects. We do, indeed, find this to be the case for military and territorial
power sharing agreements, but not necessarily for political power sharing. The former two
types of power sharing constitute a stronger commitment to be inclusive to weaker parties.
Military power sharing may have more lasting positive effects on growth than territorial
autonomy. On the other hand, the latter is more akin to power dividing arrangements so as to
make power sharing more durable.
Power sharing as a means of avoiding social conflict and civil wars has its limitations (see,
Murshed, 2010, chapter 5 for a brief review of this critique). The real solution, according to
Roeder (2005) may lie in ‘power dividing’ institutions. Its characteristics include first, certain
limitations on the powers of government. Power division also means the separation of powers
between executive, legislative and judicial branches. Also, none of the different decision
making layers of government should have veto powers. This means checks and balances, and
constraints on executive power. One interpretation of the above idea is that there should be
more layers of political and economic decision making than there are ethnicities or factions
within society. This is likely to lead to more cooperative behaviour and several overlapping
coalitions between groups.
Finally, there are other concepts and typologies of power sharing; see Strøm et al (2016) and
Gates et al (2016). They divide power sharing into constraining, dispersive and inclusive
types; the latter being the most prevalent in post-conflict societies. Dispersive power sharing
is akin to territorial power sharing, and the inclusive variety is similar to political power
sharing. Constraining power sharing which is conceptually similar to a set of checks and
balances (judicial review, religious freedom) works best in lowering the probability of civil
war (Gates et. Al, 2016). It is possible that these constraining factors may promote growth as
well.

12
REFERENCES
Acemoglu, Daron, Simon Johnson, and James Robinson (2005) ‘Institutions as the
Fundamental Cause of Long-Run Growth’, in Philippe Aghion and Steven Durlauf
(eds), Handbook of Economic Growth 1(1), Amsterdam: Elsevier: 385-472.
Barro, Robert and Jong-Wha Lee (2010) ‘A New Data Set of Educational Attainment in the
World, 1950-2010’, Journal of Development Economics, 104 (September): 84-198.
Cabellero, Ricardo J and Mohamad L Hammour (2001) ‘Creative Destruction and
Development: Institutions, Crisis and Restructuring’, in Boris Pleskovic and Nicholas
Stern (eds), Annual World Bank Conference on Development Economics, 2000,
Washington D.C.: The World Bank: 213-236.
Collier, Paul, Lani Elliot, Håvard Hegre, Anke Hoeffler, Marta Reynal-Querol and Nicholas
Sambanis (2003) Breaking the Conflict Trap: Civil War and Development Policy,
World Bank, Oxford: Oxford University Press.
Dabla-Norris, Era, Kalpana Kochkar, Nujin Suphaphiphat, Frantisek Ricka and Evridiki
Tsounta (2015) ‘Causes and Consequences of Income Inequality: A Global
Perspective’, IMF Staff Discussion Note.
Gates, Scott, Håvard Hegre, Håvard Mokleiv Nygård and Håvard Strand (2012)
‘Development Consequences of Armed Conflict’, World Development 40 (9): 1713-
1722.
Gates, Scott, Benjamin A.T. Graham, Yonatan Lupu, Kaare W Strøm and Håvard Strand
(2016) ‘Power Sharing, Protection and Peace’, Journal of Politics 78 (2): 512-526.
Hartzell, Caroline and Matthew Hoddie (2007) Crafting Peace: Power Sharing Institutions
and the Negotiated Settlement of Civil Wars, University Park: Pennsylvania State
University Press.
Hoddie, Matthew and Caroline Hartzell (2005) ‘Power Sharing in Peace Settlements:
Initiating the Transition from Civil war’, in Philip Roeder and Donald Rothchild
(eds), Sustainable Peace: Power and Democracy After Civil Wars, London: Cornell
University Press: 83-106.
Jarstad, Anna and Desirée Nilsson (2008) ‘From Words to Deeds: The Implementation of
Power-Sharing Pacts in Peace Accords’, Conflict Management and Peace Science
25(3): 206-223.
Koubi, Vally (2005) ‘War and Economic Performance’ Journal of Peace Research 42(1): 67-
82.
Murphy, Kevin, Andrei Shleifer and Robert Vishny (1991) ‘The Allocation of Talent:
Implications for Growth’, Quarterly Journal of Economics, 106 (2): 503-30.
Murshed, Syed Mansoob (2010) Explaining Civil War: A Rational Choice Approach,
Cheltenham: Edward Elgar.
Rodrik, Dani (1999) ‘Where Did All the Growth Go? External Shocks, Social Conflict, and
Growth Collapses’, Journal of Economic Growth, 4(4): 385-412.

13
Roeder, Philip (2005) ‘Power Dividing as an Alternative to Ethnic Power Sharing’ in Philip
G Roeder and Donald Rothchild (eds) Sustainable Peace. Power and Democracy after
Civil War, London: Cornell University Press: 51-82.
Rothchild, Donald (2005) ‘Reassuring Weaker Parties after Civil Wars: The Benefits and
Costs of Executive Power-sharing Systems in Africa’, Ethnopolitics, 4(3): 247-267.
Rothchild, Donald (2008). ‘Africa’s Power Sharing Institutions as a Response to Insecurity:
Assurance without Deterrence’, in Stephen M. Saideman and Marie-Joelle J. Zahar
(eds) Intra-State Conflict, Governments and Security: Dilemmas of Deterrence and
Assurance, London: Routledge: 138-160.
Otmann, Martin and Johannes Vüllers (2015) ‘The Power Sharing Event Dataset (PSED): A
New Dataset on the Promises and Practices of Power-Sharing in Post-Conflict
Countries’, Conflict Management and Peace Science, 32(3): 327-350.
Schumpeter, Joseph A (1942) Capitalism, Socialism and Democracy, New York: Harper.
Strøm, Kaare W, Scott Gates, Benjamin A.T. Graham and Håvard Strand (2016) ‘Inclusion,
Dispersion, and Constraint: Powersharing in the World’s States, 1975–
2010’, British Journal of Political Science, available on CJO2015.
doi:10.1017/S0007123415000174.
Walter, Barbara F (2002) Committing to Peace: The Successful Settlement of Civil Wars,
Princeton: University Press.
World Bank, World Development Indicators Database, Washington D.C.

14
Table 6: Political power sharing and post conflict growth over 5 years
Variables Promise Practice Promise: Fixed effect Practice: Fixed effect
1 2 1 2 1 2 1 2
PPS promise 0.520 1.357 0.520 1.357
(0.847) (1.446) (0.833) (1.572)
PPS practice -0.0535 1.087 -0.0535 1.087
(0.921) (1.485) (0.766) (1.739)
Trade
openness 0.00297 0.0101 0.00345 0.0104 0.00297 0.0101 0.00345 0.0104
(0.00750) (0.0147) (0.00755) (0.0147) (0.00547) (0.00920) (0.00576) (0.00961)
Investment 0.0953*** 0.116** 0.0973*** 0.113* 0.0953*** 0.116*** 0.0973*** 0.113***
(0.0284) (0.0564) (0.0290) (0.0571) (0.0170) (0.0350) (0.0191) (0.0311)
Initial_Y -0.000166 -2.03e-05 -0.000186 -6.41e-05 -0.000166 -2.03e-05 -0.000186 -6.41e-05
(0.000227) (0.000397) (0.000226) (0.000392) (0.000178) (0.000209) (0.000185) (0.000199)
Initial_human capital
0.155 0.120 0.155 0.120
(0.187) (0.192) (0.257) (0.256)
Constant -0.500 -0.751 -0.182 -0.490 -0.500 -0.751 -0.182 -0.490
(1.123) (1.648) (1.092) (1.595) (1.336) (1.283) (1.188) (1.121)
Observations 41 50 41 50 41 50 41 50
R-squared 0.318 0.153 0.311 0.146 0.318 0.153 0.311 0.146
Standard errors in parentheses *** p<0.01, ** p<0.05, * p<0.1
Table 7: Political power sharing and post conflict growth over 10 years
Variables Promise Practice Promise: Fixed effect Practice: Fixed effect
1 2 1 2 1 2 1 2
PPS promise 0.256 1.003 0.256 1.003
(0.763) (0.932) (0.779) (1.179)
PPS practice -0.502 0.349 -0.502 0.349
(0.747) (0.929) (0.651) (1.142)
Trade openness 0.00545 0.0116 0.00544 0.0116 0.00545 0.0116 0.00544 0.0116
(0.00699) (0.0102) (0.00695) (0.0103) (0.00444) (0.00813) (0.00441) (0.00810)
Investment 0.0294 0.162* 0.0127 0.142 0.0294 0.162 0.0127 0.142
(0.0732) (0.0877) (0.0683) (0.0865) (0.0694) (0.100) (0.0638) (0.0909)
Initial_Y -0.000198 -0.000111 -0.000211 -0.000162 -0.000198 -0.000111 -0.000211 -0.000162
(0.000190) (0.000247) (0.000187) (0.000246) (0.000229) (0.000191) (0.000230) (0.000186)
Initial_human
capital
0.101 0.0589 0.101 0.0589
(0.156) (0.157) (0.204) (0.200)
Constant 1.281 -1.424 2.075 -0.684 1.281 -1.424 2.075 -0.684
(1.805) (1.947) (1.597) (1.843) (2.093) (2.498) (1.651) (2.193)
Observations 40 49 40 49 40 49 40 49
R-squared 0.071 0.125 0.080 0.105 0.071 0.125 0.080 0.105
Standard errors in parentheses. *** p<0.01, ** p<0.05, * p<0.1

15
Table 8: Military power sharing and post conflict growth over 5 years
Variables Promise Practice Promise: Fixed effect Practice: Fixed effect
1 2 1 2 1 2 1 2
MPS promise 0.846 1.642 0.846 1.642
(0.834) (1.374) (0.644) (1.441)
MPS practice 1.177 2.244 1.177* 2.244
(0.764) (1.363) (0.623) (1.597)
Trade openness 0.00349 0.0113 0.00323 0.0102 0.00349 0.0113 0.00323 0.0102
(0.00740) (0.0146) (0.00727) (0.0144) (0.00564) (0.0106) (0.00582) (0.0107)
Investment 0.100*** 0.121** 0.103*** 0.126** 0.100*** 0.121*** 0.103*** 0.126***
(0.0282) (0.0560) (0.0278) (0.0553) (0.0196) (0.0334) (0.0188) (0.0360)
Initial_Y -0.000177 -3.58e-05 -0.000184 -7.58e-05 -0.000177 -3.58e-05 -0.000184 -7.58e-05
(0.000223) (0.000386) (0.000219) (0.000375) (0.000168) (0.000167) (0.000163) (0.000162)
Initial_human
capital
0.202 0.181 0.202 0.181
(0.195) (0.179) (0.227) (0.220)
Constant -1.100 -1.181 -1.070 -1.244 -1.100 -1.181 -1.070 -1.244
(1.337) (1.738) (1.135) (1.636) (1.136) (1.373) (0.892) (1.263)
Observations 41 50 41 50 41 50 41 50
R-squared 0.331 0.163 0.355 0.185 0.331 0.163 0.355 0.185
Standard errors in parentheses. *** p<0.01, ** p<0.05, * p<0.1
Table 9: Military power sharing and post conflict growth over 10 years
Variables Promise Practice Promise: Fixed effect Practice: Fixed effect
1 2 1 2 1 2 1 2
MPS promise 0.620 0.964 0.620 0.964
(0.710) (0.881) (0.643) (0.829)
MPS practice 0.971 1.480* 0.971* 1.480
(0.642) (0.855) (0.564) (0.899)
Trade openness (0.00694) (0.0102) (0.00678) (0.00998) (0.00456) (0.00853) (0.00477) (0.00852)
0.0233 0.125 0.0355 0.130 0.0233 0.125 0.0355 0.130
Investment (0.0672) (0.0860) (0.0664) (0.0836) (0.0657) (0.0789) (0.0642) (0.0790)
-0.000197 -0.000115 -0.000201 -0.000133 -0.000197 -0.000115 -0.000201 -0.000133
Initial_Y (0.000186) (0.000245) (0.000182) (0.000235) (0.000222) (0.000169) (0.000220) (0.000163)
0.147 0.135 0.147 0.135
Initial_human capital
(0.164) (0.150) (0.202) (0.188)
0.920 -0.831 0.677 -0.970 0.920 -0.831 0.677 -0.970
Constant (1.666) (1.764) (1.555) (1.724) (1.731) (1.775) (1.542) (1.759)
40 49 40 49 40 49 40 49
Observations 0.088 0.126 0.126 0.159 0.088 0.126 0.126 0.159
Standard errors in parentheses. *** p<0.01, ** p<0.05, * p<0.1
16
Table 10: Territorial power sharing and post conflict growth over 5 years
Variables Promise Practice Promise: Fixed effect Practice: Fixed effect
1 2 1 2 1 2 1 2
TPS promise 0.120 2.516* 0.120 2.516
(0.839) (1.418) (0.799) (1.948)
TPS practice -0.427 3.136* -0.427 3.136
(1.010) (1.611) (0.831) (2.689)
Trade
openness
0.00362 0.0141 0.00305 0.0128 0.00362 0.0141 0.00305 0.0128
(0.00766) (0.0144) (0.00754) (0.0143) (0.00578) (0.0109) (0.00570) (0.0102)
Investment 0.0971*** 0.122** 0.0979*** 0.112** 0.0971*** 0.122*** 0.0979*** 0.112***
(0.0284) (0.0549) (0.0284) (0.0547) (0.0185) (0.0331) (0.0176) (0.0251)
Initial_Y -0.000180 -4.65e-05 -0.000211 5.66e-06 -0.000180 -4.65e-05 -0.000211 5.66e-06
(0.000231) (0.000374) (0.000233) (0.000375) (0.000190) (0.000197) (0.000200) (0.000186)
Initial_human
capital
0.121 0.133 0.121 0.133
(0.183) (0.182) (0.236) (0.238)
Constant -0.254 -1.462 -0.126 -1.081 -0.254 -1.462 -0.126 -1.081
(1.076) (1.661) (1.034) (1.557) (1.108) (1.419) (1.002) (1.193)
Observations 41 50 41 50 41 50 41 50
R-squared 0.312 0.193 0.315 0.203 0.312 0.193 0.315 0.203
Standard errors in parentheses. *** p<0.01, ** p<0.05, * p<0.1
Table 11: Territorial power sharing and post conflict growth over 10 years
Variables Promise Practice Promise: Fixed effect Practice: Fixed effect
1 2 1 2 1 2 1 2
TPS promise 0.282 1.451 0.282 1.451
(0.693) (0.895) (0.631) (1.046)
TPS practice 0.748 2.165** 0.748 2.165
(0.867) (1.037) (0.623) (1.459)
Trade openness 0.00595 0.0133 0.00610 0.0130 0.00595 0.0133 0.00610 0.0130*
(0.00712) (0.0101) (0.00697) (0.00986) (0.00447) (0.00797) (0.00433) (0.00753)
Investment 0.0193 0.124 0.00286 0.0925 0.0193 0.124 0.00286 0.0925
(0.0677) (0.0843) (0.0700) (0.0852) (0.0627) (0.0748) (0.0604) (0.0668)
Initial_Y -0.000192 -0.000122 -0.000161 -6.87e-05 -0.000192 -0.000122 -0.000161 -6.87e-05
(0.000191) (0.000237) (0.000194) (0.000236) (0.000234) (0.000184) (0.000238) (0.000177)
Initial_human capital
0.0828 0.0772 0.0828 0.0772
(0.152) (0.151) (0.191) (0.194)
Constant 1.531 -0.910 1.771 -0.338 1.531 -0.910 1.771 -0.338
(1.485) (1.728) (1.459) (1.677) (1.553) (1.844) (1.475) (1.578)
Observations 40 49 40 49 40 49 40 49
R-squared 0.072 0.153 0.087 0.183 0.072 0.153 0.087 0.183
Standard errors in parentheses. *** p<0.01, ** p<0.05, * p<0.1
17
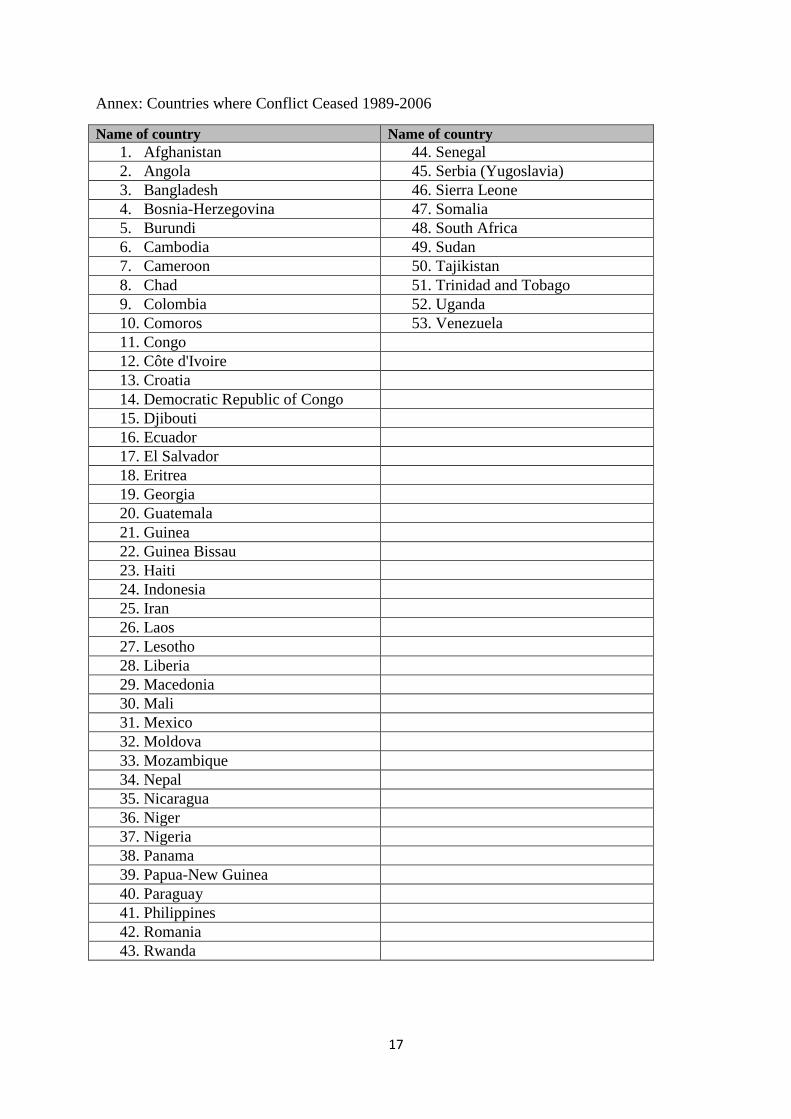
Annex: Countries where Conflict Ceased 1989-2006
Name of country Name of country
1. Afghanistan 44. Senegal
2. Angola 45. Serbia (Yugoslavia)
3. Bangladesh 46. Sierra Leone
4. Bosnia-Herzegovina 47. Somalia
5. Burundi 48. South Africa
6. Cambodia 49. Sudan
7. Cameroon 50. Tajikistan
8. Chad 51. Trinidad and Tobago
9. Colombia 52. Uganda
10. Comoros 53. Venezuela
11. Congo
12. Côte d'Ivoire
13. Croatia
14. Democratic Republic of Congo
15. Djibouti
16. Ecuador
17. El Salvador
18. Eritrea
19. Georgia
20. Guatemala
21. Guinea
22. Guinea Bissau
23. Haiti
24. Indonesia
25. Iran
26. Laos
27. Lesotho
28. Liberia
29. Macedonia
30. Mali
31. Mexico
32. Moldova
33. Mozambique
34. Nepal
35. Nicaragua
36. Niger
37. Nigeria
38. Panama
39. Papua-New Guinea
40. Paraguay
41. Philippines
42. Romania
43. Rwanda