on the economics of sickness absence and...
TRANSCRIPT

On the Economics of Sickness Absence and Presenteeism
Dissertationzur Erlangung des Doktorgrades
des Fachbereichs IVder Universitat Trier
vorgelegt vonDaniel Arnold M.A.aus Heidelberg
Trier2015

Tag der mundlichen Prufung: 14. April 20151. Gutachter: Professor Dr. Laszlo Goerke2. Gutachter: Professor Dr. Dr. h.c. Dieter Sadowski

Acknowledgments
First of all, I would like to thank my supervisor, Laszlo Goerke, for not losing faithin me and supporting me throughout the writing of this thesis in any possible way. Ialso want to thank Dieter Sadowski as second referee and Katrin Muehlfeld as chairof my disputation.
This thesis would not have been started without my time as student assistant inGottingen at the Chair of Public Finance, where Christian Bruns and Oliver Himm-ler brought me into the world of economic research in the first place and encouragedme to write my thesis in Tubingen.
In Tubingen I have been very lucky to work with extraordinary colleagues at theChair of Public Finance, who have become close friends by now. Without their help,I would not have been able to finish this thesis. I am particularly grateful to FlorianBaumann, who helped me to build my first theoretical model, and to Mario Mechtelwho was, and still is, willing to discuss any academic or non-academic topic with me.Furthermore, I am deeply indebted to Inga Hillesheim, who taught me how to teachundergraduates, and to Tobias Brandle, who was a most likable office partner andco-author.
After two years of research for this thesis in Tubingen, I followed Laszlo Goerke toTrier. Here, again, I found a formidable work environment at the Institute of LabourLaw and Industrial Relations in the EU (IAAEU). I want to thank all the colleaguesat the IAAEU, be they lawyers or economists, for the great time we had. Amongthem, I am particular indebted to Marco de Pinto, with whom I wrote the last paperof this thesis.
Finally, my personal thanks goes to my parents, who showed me that it is worthwriting a doctoral thesis no matter how hard it may be.

Contents
List of Figures iv
List of Tables v
1 Introduction 1
I SICKNESS ABSENCE AND INSTITUTIONS 7
2 Benefit morale and cross-country diversity in sick pay entitlements 9
2.1 Introduction . . . . . . . . . . . . . . . . . . . . . . . . . . . . . . . . . 10
2.2 Theoretical model . . . . . . . . . . . . . . . . . . . . . . . . . . . . . . 13
2.2.1 Description . . . . . . . . . . . . . . . . . . . . . . . . . . . . . 13
2.2.2 Political economy model . . . . . . . . . . . . . . . . . . . . . . 14
2.2.3 Comparative statics . . . . . . . . . . . . . . . . . . . . . . . . . 16
2.3 Empirical evidence . . . . . . . . . . . . . . . . . . . . . . . . . . . . . 18
2.3.1 Data . . . . . . . . . . . . . . . . . . . . . . . . . . . . . . . . . 18
2.3.2 Econometric method and results . . . . . . . . . . . . . . . . . . 20
2.3.3 Robustness checks . . . . . . . . . . . . . . . . . . . . . . . . . 23
2.4 Conclusion . . . . . . . . . . . . . . . . . . . . . . . . . . . . . . . . . . 24
2.5 Appendix . . . . . . . . . . . . . . . . . . . . . . . . . . . . . . . . . . 26
3 Sickness absence and works councils 29
3.1 Introduction . . . . . . . . . . . . . . . . . . . . . . . . . . . . . . . . . 30
3.2 Institutional set-up . . . . . . . . . . . . . . . . . . . . . . . . . . . . . 32
3.2.1 The legal setting . . . . . . . . . . . . . . . . . . . . . . . . . . 32
3.2.2 The works constitution act and absence behaviour . . . . . . . . 33
3.2.3 Beyond the works constitution act . . . . . . . . . . . . . . . . . 34
3.3 Data and empirical specification . . . . . . . . . . . . . . . . . . . . . . 35
i

3.3.1 SOEP . . . . . . . . . . . . . . . . . . . . . . . . . . . . . . . . 35
3.3.2 LIAB . . . . . . . . . . . . . . . . . . . . . . . . . . . . . . . . . 37
3.3.3 Empirical strategy . . . . . . . . . . . . . . . . . . . . . . . . . 39
3.4 Results . . . . . . . . . . . . . . . . . . . . . . . . . . . . . . . . . . . . 41
3.4.1 Absence behaviour . . . . . . . . . . . . . . . . . . . . . . . . . 41
3.4.2 Personnel problems due to high absence rates . . . . . . . . . . 43
3.5 Robustness checks, effect heterogeneity and DiD-models . . . . . . . . . 45
3.5.1 Count data models . . . . . . . . . . . . . . . . . . . . . . . . . 45
3.5.2 Group-specific effect heterogeneity . . . . . . . . . . . . . . . . . 45
3.5.3 Difference-in-differences models . . . . . . . . . . . . . . . . . . 47
3.6 Summary . . . . . . . . . . . . . . . . . . . . . . . . . . . . . . . . . . 49
3.7 Appendix . . . . . . . . . . . . . . . . . . . . . . . . . . . . . . . . . . 51
II SICKNESS PRESENTEEISM 57
4 Determinants of the annual duration of sickness presenteeism 59
4.1 Introduction . . . . . . . . . . . . . . . . . . . . . . . . . . . . . . . . . 60
4.2 Related literature . . . . . . . . . . . . . . . . . . . . . . . . . . . . . . 62
4.3 Data . . . . . . . . . . . . . . . . . . . . . . . . . . . . . . . . . . . . . 64
4.4 Econometric investigation . . . . . . . . . . . . . . . . . . . . . . . . . 66
4.5 Robustness checks . . . . . . . . . . . . . . . . . . . . . . . . . . . . . . 70
4.6 Conclusion . . . . . . . . . . . . . . . . . . . . . . . . . . . . . . . . . . 71
4.7 Appendix . . . . . . . . . . . . . . . . . . . . . . . . . . . . . . . . . . 73
5 Sickness absence, presenteeism and work-related characteristics 77
5.1 Introduction . . . . . . . . . . . . . . . . . . . . . . . . . . . . . . . . . 78
5.2 Theoretical model . . . . . . . . . . . . . . . . . . . . . . . . . . . . . . 83
5.2.1 Preliminaries . . . . . . . . . . . . . . . . . . . . . . . . . . . . 83
5.2.2 Absence/attendance decision . . . . . . . . . . . . . . . . . . . . 84
5.2.3 Presenteeism . . . . . . . . . . . . . . . . . . . . . . . . . . . . 85
5.2.4 Substitutes, complements or neither . . . . . . . . . . . . . . . . 88
5.3 Empirical analysis . . . . . . . . . . . . . . . . . . . . . . . . . . . . . . 90
5.3.1 Data and empirical strategy . . . . . . . . . . . . . . . . . . . . 90
5.3.2 Predictions . . . . . . . . . . . . . . . . . . . . . . . . . . . . . 94
5.3.3 Econometric results . . . . . . . . . . . . . . . . . . . . . . . . . 95
5.3.4 Robustness checks . . . . . . . . . . . . . . . . . . . . . . . . . 98
ii

5.4 Conclusion . . . . . . . . . . . . . . . . . . . . . . . . . . . . . . . . . . 99
5.5 Appendix . . . . . . . . . . . . . . . . . . . . . . . . . . . . . . . . . . 101
6 Summary 107
7 German Summary - Deutsche Zusammenfassung 111
Bibliography 115
iii

List of Figures
4.1 Distribution of sickness presenteeism days conditional on presenteeism.
Observations with zero sickness presenteeism days not shown but in-
cluded in analysis (64 % of the full sample). Source: 2010-EWCS. Own
calculations, survey weights used. . . . . . . . . . . . . . . . . . . . . . 73
5.1 Distribution of sickness absence and presenteeism days conditional on
absence and presenteeism. Observations with zero sickness absence and
presenteeism days not shown but included in analysis (49 and 64 % of
the full sample, respectively). Source: 2010-EWCS. Own calculations,
survey weights used. . . . . . . . . . . . . . . . . . . . . . . . . . . . . 101
iv

List of Tables
2.1 Summary statistics . . . . . . . . . . . . . . . . . . . . . . . . . . . . . 26
2.2 Great averages of sickpay generosity (with and after waiting days) . . . 26
2.3 Sick pay generosity regression results . . . . . . . . . . . . . . . . . . . 27
3.1 Absence incidence (pooled Probit estimates) and duration (pooled OLS
estimates) . . . . . . . . . . . . . . . . . . . . . . . . . . . . . . . . . . 42
3.2 Personnel problems due to absence (Pooled Probit estimates) . . . . . . 43
3.3 DiD models of absence incidence for western Germany (pooled Probit) 48
3.4 Descriptive statistics (SOEP) . . . . . . . . . . . . . . . . . . . . . . . 51
3.5 Pooled sickness absence estimations (SOEP) . . . . . . . . . . . . . . . 52
3.6 Descriptive statistics (LIAB) . . . . . . . . . . . . . . . . . . . . . . . . 53
3.7 Personnel problems due to absence and works councils: Pooled Probit
estimates . . . . . . . . . . . . . . . . . . . . . . . . . . . . . . . . . . . 54
3.8 Overview of robustness checks and effect heterogeneity . . . . . . . . . 56
4.1 Descriptive statistics . . . . . . . . . . . . . . . . . . . . . . . . . . . . 74
4.2 Number of sickness presenteeism days (ZINB) . . . . . . . . . . . . . . 75
4.3 Robustness checks . . . . . . . . . . . . . . . . . . . . . . . . . . . . . . 76
5.1 Descriptive statistics . . . . . . . . . . . . . . . . . . . . . . . . . . . . 102
5.2 Predictions from the literature . . . . . . . . . . . . . . . . . . . . . . . 103
5.3 Regression results . . . . . . . . . . . . . . . . . . . . . . . . . . . . . . 104
5.4 Robustness checks . . . . . . . . . . . . . . . . . . . . . . . . . . . . . . 105
v

Chapter 1
Introduction
This thesis deals with economic aspects of employees’ sickness. Besides the fact that
sickness reduces personal well-being, it also diminishes labour productivity. In conse-
quence, sickness prevents employees from going to work and supplying their contrac-
tually agreed working hours, thereby entailing substantial output losses. Accordingly,
sickness absence is acknowledged as a highly relevant topic among labor economists
and has been intensively researched (for an overview see an early survey by Brown
and Sessions, 1996, or Treble and Barmby, 2011). The economic literature particu-
larly stresses the deliberate component of employees’ decisions to be absent.1 But the
negative economic effects of sickness are not solely entailed by the employees’ decision
to be absent. Being sick itself reduces the productivity of an employee independently
of the absence decision. Hence, there is, besides the classical case of sickness absence
in which an employee is completely unable to work and hence stays at home, the
case of sickness presenteeism in which the employee comes to work despite being sick.
In contrast to sickness absence, economic research on sickness presenteeism is still
scarce.2
While the negative economic effects of absence seem straightforward, the economic
evaluation of sickness presenteeism is more complex. Particularly, it depends on the
specific medical condition of the employee and the type of work (see Schultz and Ed-
ington, 2007 for a survey on this issue). In some cases, the mobilizing effect of work
facilitates the employee’s recovery and rehabilitation (cf. Markussen et al., 2012),
while in others the negative economic effects even exceed those of absence (Pauly
et al., 2008). The latter is particularly the case under the following circumstances:
1See, for example, Cornelissen et al. (2013), Ichino and Maggi (2000), and Ichino and Riphahn(2005).
2Notable exceptions that will be discussed throughout this thesis in more detail are Bierla et al.(2013), Brown and Sessions (2004), Chatterji and Tilley (2002), and Pauly et al. (2008).
1

(i) when working is negative for recuperation with ensuing effects for the employee’s
health (Bergstrom et al., 2009) which might even lead to more absence in the future
(Hansen and Andersen, 2009), (ii) when the disease is infectious and spreads at the
workplace (Barmby and Larguem, 2009) and (iii) when production interdependen-
cies exist, for example through team production (Pauly et al., 2008). In conclusion,
it is not clear whether higher social losses are provoked by sickness absence or pre-
senteeism. Hence, we acknowledge sickness presenteeism to be of similar economic
interest as absence. For this reason, the thesis at hand covers research on both sick-
ness states, absence and presenteeism, attempting to shed more light on these two
related issues.
With a large number of existing studies, the research agenda for sickness absence is al-
ready turning to more specialized questions, be it on the effects of specific institutions
or for specific groups of employees and additionally opens up towards behavioural
approaches. In contrast, the phenomenon of sickness presenteeism is more or less
unexplored. Hence, research on presenteeism is still in its infancy and mostly from
social medicine. Furthermore, data availability on this issue is scarce and is limited
primarily to cross-sections from northern Europe. Accordingly, the questions asked
are still more fundamental than in the literature on sickness absence. Despite these
differences, this thesis aims to address existing gaps in both strands of the literature
and therefore is divided in two main parts. In the first part, we add to the literature
on sickness absence by focusing on important labour market institutions. The second
part aims at closing the existing gap in the literature on presenteeism by examining
determinants of sickness presenteeism and subsequently analyzing interdependencies
between both sickness states.
In the first part, we shed light on labour market institutions and sickness absence
from two different perspectives. Chapter 2 presents a new explanation for large differ-
ences in the generosity of statutory sick pay entitlements between developed countries,
which have in turn a strong impact on sickness absence behaviour.3 The literature
has already shown that social norms affect absence behaviour, which itself can affect
political choices over sick pay entitlements.4 In this vein, we present theoretical and
empirical evidence that differences in the social norm against benefit fraud, called
benefit morale, can explain cross country diversity in the generosity of public insur-
3Evidence for the impact of sick pay on absence from Germany is presented by Ziebarth andKarlsson (2010) and Puhani and Sonderhof (2010).
4For a theoretical approach see Lindbeck and Persson (2010), for an empirical investigation seeIchino and Maggi (2000).
2

ance programs against the loss of income due to illness.5
Chapter 2 is based on Arnold (2013) and describes a political economy model in which
a stricter benefit morale in an economy reduces the absence rate with counteracting
effects on the politically set sick pay replacement rate. On the one hand, less absence
entailed by a stricter norm makes the tax-financed insurance cheaper, leading to the
usual demand side effect and hence to more generous sick pay entitlements. On the
other hand, being less likely to be absent due to a stricter norm, the voters prefer a
smaller fee over more insurance. Numerical simulations show that the positive price
effect of a marginal change in benefit morale prevails at low levels of benefit morale,
while the negative probability effect dominates at high levels of benefit morale. We
document both effects in a sample of 31 developed countries, capturing the years from
1981 to 2010. Hence, we find theoretical and empirical evidence for a hump shaped
relationship between a country’s level of benefit morale and its sick pay replacement
rate. Accordingly, this study is the first to combine a positive theory with real in-
stitutional data as dependent variable in the research on benefit morale and welfare
state generosity.
While Chapter 2 offers a new explanation for institutional differences which determine
absence behaviour, Chapter 3 investigates how a specific labour market institution af-
fects absence behaviour. In Germany, non-union workforce representation by works
councils is widespread and has been shown to fundamentally shape labour relations.
Among other things, works councils affect wages, productivity, employment and prof-
itability.6 Accordingly, they have not only a direct impact on the determinants of
sickness-related absence but also on the managerial options to control absence be-
haviour. In their seminal article, Freeman and Lazear (1995) attribute a dual role to
works councils: First, they protect employees against employer retaliation. Second,
they can help improving working conditions and productivity. The first effect should
be associated with higher absence rates; in contrast the second effect should reduce
employee absence. In Chapter 3, which is joint work with Tobias Brandle and Laszlo
Goerke, we investigate the relationship between the existence of works councils and
illness-related absence and its consequences for plants. Using individual data from
the German Socio-Economic Panel (SOEP), we find that the existence of a works
council is positively correlated with the incidence and the annual duration of absence.
Since it is not clear whether higher absence rates in firms with works council are
5Social norms are defined as socially shared beliefs about how one ought to behave (Elster, 1989).Here, benefit morale measures whether it is socially accepted to claim government benefits to whichone is not entitled to.
6Addison (2009) provides an overview of economic research on German co-determination.
3

compensated for by higher productivity due to co-determination, we want to evaluate
in a second step whether high absence rates cause a problem for firms with works
councils. Therefore we use linked employer-employee data (LIAB) which suggest that
employers are more likely to expect personnel problems due to absence in plants with
a works council. All these findings are quite robust in different (sub)samples. We
find a stronger relationship between works councils and all three absence indicators
in western Germany, which fits to the fact that works councils have been part of the
industrial relations system in western Germany for much longer than in the East-
ern part, where they were first introduced after 1990. Additionally, this correlation
can be interpreted causally in western Germany where we find significant effects in
a difference-in-differences approach. All in all, our findings suggest that employees
profit from the existence of works councils in the form of more absence days (keeping
subjective health constant). This comes at the expense of the employers who com-
plain that this causes problems for their firms.
The second part of this thesis covers two studies on sickness presenteeism. In Chapter
4, we empirically investigate the determinants of the annual duration of sickness pre-
senteeism. Since personnel managers – and, albeit to a lesser degree, policy-makers as
well – can shape work-related characteristics (e.g. contract type, workload, autonomy
and others), we focus our investigation on work-related characteristics as determi-
nants of sickness presenteeism. Although there is already some evidence on the inci-
dence of sickness presenteeism (Aronsson et al., 2000; Aronsson and Gustafsson, 2005;
Bockerman and Laukkanen, 2009, 2010; Leineweber et al., 2011; Preisendorfer, 2010)
and its frequency (Johansson and Lundberg, 2004; Hansen and Andersen, 2008), there
is a lack of studies on its annual duration. From an economic perspective, the annual
duration of sickness presenteeism is more relevant than its incidence or frequency,
since the productivity loss due to sickness presenteeism is among others a function of
its (annual) duration (cf. Pauly et al., 2008). For our analysis, we use the European
Working Conditions Survey (EWCS), the first large-scale dataset outside northern
Europe which offers better external validity than previous surveys. Accordingly, our
findings are not confined to the institutionally specific cases of north European coun-
tries with their generous welfare states, active labour market policies, and bold social
norms. We find that presenteeism is a widespread phenomenon with more than 35
percent of European employees going at least once during 12 months to work whilst
sick, amounting to an average of 2.4 sickness presenteeism days per year, which is
about half the number of absence days (5.3 days per year).
In our cross-sectional analysis, we find work autonomy, workload, tenure and the work
4

environment to be the quantitatively most relevant work-related determinants of sick-
ness presenteeism days in Europe when controlling for individual health status. Work
autonomy, workload and tenure are positively related to the number of sickness pre-
senteeism days, while a good working environment comes along with less presenteeism.
We are, to the best of our knowledge, the first to investigate tenure in this regard and
our significant and positive results for work autonomy are in contrast to the insignif-
icant findings for presenteeism frequency in Denmark (Hansen and Andersen, 2008).
Since the work-related characteristics might be related to the employees’ health as
well as with ensuing effects on sickness presenteeism, it is also interesting to evaluate
the overall correlations between work-related factors and sickness presenteeism days,
i.e. the direct and indirect health mediated channels taken together. Hence, besides
the full model we additionally present models excluding health controls. The size of
all correlations increase in this model, but those of the working environment variables
gain the most and their size outranks the others. Accordingly, offering a good working
environment might be a particularly good way to reduce sickness presenteeism since a
good working environment relates to presenteeism not only directly but also through
the employees’ health.
Chapter 5 is joint work with Marco de Pinto. Here we analyse the interrelation
between sickness absence and presenteeism. Most empirical studies look only at de-
terminants of one of the two sickness states and neglect the possibility that both
sickness states could be simultaneously affected by the same determinants. This is,
for instance, the case in Chapter 3 where we do not know whether works councils
reduce presenteeism which could affect the normative evaluation of this institution.
From this normative perspective, it is highly relevant for (personnel) managers as well
as policy makers to know the impact of a determinant with regard to both sickness
states. Neither the SOEP, nor the LIAB used in Chapter 3 contain information on
sickness presenteeism, which is one of the big advantages of the EWCS dataset we use
here. The literature on absence behaviour neglects the possible interrelationship be-
tween absence and presenteeism altogether. In contrast, some studies on presenteeism
implicitly assume a substitutive relationship (Aronsson and Gustafsson, 2005; Bierla
et al., 2013; Brown and Sessions, 2004).7 But this proposition has, as of yet, neither
been explicitly theoretically derived nor comprehensively empirically investigated in
the literature. Hence, we add to the literature by analyzing sickness absence and pre-
senteeism behaviour with a focus on their interdependence. For the same reasons as in
7A substitutive relationship means that a determinant which reduces absence is assumed to in-crease presenteeism for a given health status (and vice versa).
5
Chapter 4, we focus our investigation on work-related characteristics as determinants
of sickness absence and presenteeism.
We particularly ask whether work-related factors lead to a substitutive, a comple-
mentary or no relationship between sickness absence and presenteeism. Hence, we
want to know whether changes in absence and presenteeism behaviour incurred by
work-related characteristics point in opposite directions (substitutive), same direc-
tions (complementary) or whether they only affect either one of the two sickness
states (no relationship). To answer this question, we, first, build a theoretical model
that highlights mechanisms through which both sickness states can be affected at the
same time. Second, we use empirical data to simultaneously analyse determinants of
sickness absence and presenteeism and hence take explicitly into account their inter-
dependence.
Sickness presenteeism in our theoretical model is more narrowly defined than in Chap-
ter 4. In our model, we define it as a situation in which the negative sickness effects (re-
duced productivity, spread of illness etc.) are such that it would be profit-maximizing
for the firm when the employee stayed at home (compare Chatterji and Tilley, 2002
for a similar definition). The innovation of our theoretical model is that the critical
level of sickness that makes the firm indifferent between employee’s absence and at-
tendance and hence defines presenteeism is endogenously determined by work-related
characteristics. Accordingly, work-related characteristics do not only have an impact
on the absence decision but also on whether the presence of the employee is detrimen-
tal to the firm. Thus, they affect both sickness states separately. With this model at
hand, we can show that the relationship between sickness absence and presenteeism
with regard to work-related characteristics is not necessarily of a substitutive nature.
Instead, a complementary or no relationship can emerge as well.
Turning to the empirical investigation, we find that only one out of 16 work-related
factors, namely the supervisor status, leads to a substitutive relationship between
absence and presenteeism. Few of the other determinants are complements, while
the large majority is either related to sickness absence or presenteeism. Hence, our
theoretical model which allows for a non-substitutive relationship between both sick-
ness states is better able to explain our empirical findings than the existing literature
which predominantly embraces a substitutive view. In sum, our investigation adds to
the literature by explicitly investigating the interrelation between both sickness states
not only empirically but also theoretically.
Finally, Chapter 6 summarizes the most important results derived in the previous
chapters and provides suggestions for future research.
6

Part I
SICKNESS ABSENCE AND
INSTITUTIONS
7


Chapter 2
Benefit morale and cross-country
diversity in sick pay entitlements
We analyse the impact of a country’s level of benefit morale on generosity of sick pay
entitlements by means of a political economy model and an empirical investigation.
Higher benefit morale reduces the incidence of absence. On the one hand, this makes
insurance cheaper with the usual demand side reaction. On the other hand, being
absent less often, the voter prefers less insurance. The former effect dominates at
lower, the latter at higher levels of benefit morale. We present empirical evidence for
both effects in a sample of 31 countries between 1981 and 2010.
This chapter is based on the article “Benefit morale and cross-country diversity in
sick pay entitlements” (Arnold, 2013).
9

2.1 Introduction
There are large differences in the generosity of statutory sick pay benefits across de-
veloped countries, ranging from full replacement of the earned wage in some European
countries to no benefits at all in the USA. Compared with other welfare programs,
sick pay benefits display a particularly vast institutional diversity. This institutional
diversity corresponds to considerable variation in average sickness absence days in
OECD countries, ranging from four to 29 days per year per employee (Ziebarth and
Karlsson, 2010).
We establish that cross-country differences in social norms against benefit fraud can
explain cross-country diversity in mandatory sick pay benefits. Social norms are de-
fined as socially shared beliefs about how one ought to behave while compliance is
enforced either by informal social sanctions (Fehr and Gachter, 2000) or by internal-
ization (Elster, 1989). This social norm regarding benefit fraud will be subsequently
referred to as “benefit morale.” In some countries people are more tolerant towards
their fellow citizens committing benefit fraud compared to countries where the popu-
lation exhibits a stronger sense of benefit morale. These differences can be substantial
even within Europe. It has been theoretically (Lindbeck and Persson, 2010) and em-
pirically (Ichino and Maggi, 2000) shown that social norms influence absence behavior,
which in turn might affect choices over sick pay insurance. Hence, we present a po-
litical economy model and an empirical investigation analyzing the impact of benefit
morale on the generosity of mandatory sick pay.
Since this chapter is concerned with publicly legislated insurance programs, the gen-
erosity of sick pay benefits is politically set in our model. We investigate the impact
of exogenous changes in benefit morale on the political equilibrium replacement rate
in a median voter model. Voters who are risk averse and aware of their exposure
to sickness risk decide ex ante on the scope of the public insurance. Since sick pay
insurance is plagued by moral hazard problems and benefit fraud due to asymmetric
information about individual health status, benefit morale plays a role in the absence
decisions of the insured.1 Here, benefit morale is modeled as psychological costs in-
curred by individuals who commit benefit fraud. Therefore, when assuming a gradual
health status, an increase in benefit morale reduces at the margin the number of peo-
1Even if a checkup with a physician is necessary to obtain sick pay, anecdotal evidence suggeststhat it is relatively easy to convince a physician to declare one sick without any real symptoms – atleast for a short spell. This is supported by empirical studies documenting that the insurance levelhas a positive impact on the incidence and the duration of absence spells (Johansson and Palme,2005; Osterkamp and Rohn, 2007; Frick and Malo, 2008; Puhani and Sonderhof, 2010; Ziebarth andKarlsson, 2010).
10
ple claiming sick pay. This not only reduces the expenses incurred by the insurance
program but also increases its revenues due to more people working. In sum the
changed working behavior in the whole population reduces, ceteris paribus, the price
for insurance leading to a higher demand for insurance. But there is also an effect
working in the opposite direction. The smaller the probability of receiving benefits
for the voter due to a stricter benefit morale, the less desirable an increased insurance
level becomes, compared to a reduced fee. The overall effect depends on the absolute
magnitude of these counteracting effects. Numerical simulations indicate that the
positive price effect prevails at low levels of benefit morale, while the counteracting
probability effect becomes stronger at higher benefit morale levels. In some cases,
the negative probability effect overcompensates for the positive price effect at higher
levels. The negative relationship between benefit morale and sick pay benefits is a
sick pay specific result insofar as benefit morale affects marginally the incidence of
sickness absence in a more direct way than the incidence of unemployment.
We test empirically the predictions of our theoretical model in a sample of 31 de-
veloped countries over the period 1981-2010. We measure the generosity of the enti-
tlements as the mandatory gross replacement rate in the first week of illness for an
individual earning an average production worker’s wage. Benefit morale is measured
by the World Values Survey and has been widely used in empirical research on wel-
fare state programs (Heinemann, 2008; Halla and Schneider, 2014; Algan and Cahuc,
2009). Using a pooled cross-section design and spline regression functions to capture
the non-linear relationship in a flexible way, we find evidence of a significant positive
relationship in the lower half of the benefit morale distribution that is followed by a
significant negative slope that flattens for very high values. These results are robust
to measuring benefit morale and sick pay generosity in different ways. Overall, the
data corroborates the numerical predictions of our theoretical model.
In this chapter, we contribute to two strands of the literature. First, we add to the
research field concerned with the impact of social norms on the design of public poli-
cies by offering evidence for benefit morale as a new explanation for cross-country
diversity in sick pay entitlements. The concept underlying this investigation is closely
related to that proposed by Algan and Cahuc (2009), who argue that civic mindedness
on the part of individuals allows moral hazard problems to be solved in the case of
insurance against unemployment risks. We transfer Algan and Cahuc’s idea to public
welfare entitlement programs that cover the risk of losing one’s work income due to
illness. Countries that have generous unemployment benefits do not necessarily have
generous sick pay entitlements so that a separate investigation of the latter with re-
11

spect to benefit morale is needed.2 However, there are two fundamental differences:
i) we present a political economy model while Algan and Cahuc (2009) offer a nor-
mative analysis; ii) they disregard the probability effect since benefit morale does not
directly influence the probability of becoming unemployed in their model. In a recent
study, Algan et al. (forthcoming) find with cross-country survey data that individual
demand for general income redistribution is negatively influenced by the individual’s
trustworthiness and positively influenced by the share of trustworthy people in the
population. However, our contribution differs again in two ways: i) we investigate a
socially shared norm that leads to a much more pronounced probability effect and, ii)
we use real institutional outcomes instead of survey data on redistributive preferences.
There are other socially shared beliefs that have an impact on public policies. Alesina
et al. (forthcoming) show, for instance, that more family values lead to more strictly
regulated labor markets.
There are several studies that consider the long-run effects of welfare state generosity
on work norms (Lindbeck, 1995; Lindbeck et al., 2003; Halla and Schneider, 2014;
Heinemann, 2008; Halla et al., 2010); we , however, aim at investigating the opposite
effect of social norms on institutions. We argue that welfare state institutions and
social norms affect each other and, therefore, are interdependent. However, there are
particularly good reasons to investigate the link from social norms to public policy
programs in detail. Individuals follow social norms in a rather uncritical way and
acquire them involuntarily during their childhood and social norms adapt very slowly
to changing conditions (Lindbeck, 1995; Postlewaite, 2011). In contrast, it is easy
to adapt public policy programs to changed conditions. For this reason, we deem it
particularly worthwhile to investigate the effect of benefit morale on the institutional
design of public sick pay programs.
Second, we contribute to the literature on sick pay and welfare state institutions in
general. We add benefit morale as a new explanation to the literature on determi-
nants of cross-country diversity in sick pay entitlements and include more countries
than in previous studies. There are to date two empirical studies on determinants
of cross-country diversity in sick pay generosity. However, neither Korpi (1989) nor
Allan and Scruggs (2004) take social norms into account as a possible explanation for
cross-country diversity in sick pay insurance generosity. Furthermore, we add to the
theoretical understanding of sick pay insurance by endogeneizing the insurance gen-
erosity in the sick pay and benefit morale framework used by Lindbeck and Persson
2Sick pay and unemployment benefit generosity have a surprisingly small correlation coefficientof 0.27 in our sample.
12
(2010). Hence, we do not investigate the impact of benefit morale with respect to
absence behavior as they do in their contribution but its impact with respect to the
politically determined replacement rate for sick pay. We transfer the idea from Wright
(1986) that voters’ preferences for welfare benefits are driven by their probability of
the insurance case. In contrast to our contribution, Wright (1986) offers a political
economy model for unemployment benefits and does not take benefit morale into ac-
count. Hence, this study is to our knowledge the first investigation that combines
positive theory, in the form of a political economy model with real institutional out-
comes in the empirical investigation with regard to benefit morale as a determinant
for welfare state generosity.
The remainder of this chapter is organized as follows: Section 2.2 introduces our
political economy model of sick pay generosity and furnishes numerical simulations
for comparative statics. Section 2.3 describes the data and the econometric method
used, and presents estimation results as well as some robustness checks. Section 2.4
concludes this study.
2.2 Theoretical model
2.2.1 Description
The model is set up as follows. There are a large number of risk-averse individuals
whose number is normalized to unity. As full employment is guaranteed, there are
only two labor force states: either present and working or absent. The individuals gain
utility from consumption and are hit by a disutility shock of value φ while working.
This shock can be interpreted as disutility from sickness due to work effort. Following
Engstrom and Holmlund (2007) and Lindbeck and Persson (2010), we model the sick-
ness shock φ as a continuous random variable, which leaves scope for benefit morale to
play a role in absence decisions at the margin. Individuals are heterogeneous in their
exposure to this shock, which is drawn from probability distributions. In line with
Lindbeck and Persson (2010),3 individuals have to bear psychological or stigmatiza-
tion costs when absent, b ≥ 0. The level of the costs is associated with the stringency
of the prevailing social norm in a society, such that b is constant within one society
while varying between societies.
Following Engstrom and Holmlund (2007), we model a logarithmic consumption
3Note that the published version of this paper (Lindbeck and Persson, 2013) does not feature therelationship between social norms and absence behaviour, which is present in the discussion paperversion cited here.
13

utility function. The utility of present and absent workers reads as follows: up =
ln [w(1− t)] − φ and ua = ln [ρw(1− t)] − b. Present workers earn an exogenously
determined wage w and have to pay taxes t that finance the sick pay benefits.4 Absent
workers are entitled to sick pay benefits with a replacement rate of ρ, 0 < ρ ≤ 1. For
simplicity, we assume that benefits are taxed at the same rate as regular wage income.
Since the individual health status is private information, individuals self-select into
the two labor force states by comparing disutility from work against reduced con-
sumption and psychological costs at home. Accordingly, employees hit by a shock
which is higher (lower) than the reservation value, s, stay at home (go to work):
s = b− ln ρ. (2.1)
Here, the psychological costs b guarantee that individuals in a context with higher
benefit morale are less likely to be absent (Ichino and Maggi, 2000; Lindbeck and
Persson, 2010). Each individual is aware of his or her exogenous exposure to the
sickness shock, i.e., the probability distribution of φ, which is private information.
The aggregate shock in the population is a random variable drawn from a publicly
known distribution F (γ) with support[γ, γ]
and density f(γ). As the size of the
population equals unity, we can interpret F (s) as the share of the population that
works, while [1− F (s)] of the population stays at home. With this information and
assuming that we exclude cross financing of other programs, we can write the budget
equation as:
t =[1− F (s)] ρ
F (s) + ρ [1− F (s)]. (2.2)
2.2.2 Political economy model
The population decides on the generosity of the sick pay insurance, ρ, in an elec-
tion with a simple majority vote before the realization of the sickness shock. Due to
a binding budget constraint, replacement rates and tax rates are chosen simultane-
ously. Thus, the vote simplifies to a single-issue ballot on the replacement rate. The
concavity of the utility function guarantees single peaked preferences, which allows
the median voter theorem to be applied. As the individuals are heterogeneous with
4 The economic mechanism at stake here is not dependent on the assumption that sick pay isfinanced by a tax. A similar effect can be obtained when sick pay is directly financed by the employer,which is common in several countries. In this case, higher absence rates lead to lower equilibriumwages via reduced output. Hence, we have an effect similar to the price effect in the tax-financedmodel. As we take only budgetary costs into account in our model and disregard the output effect,we are at the lower level of effects brought about by norm-guided absence behavior.
14

regard to sickness risk, the individual with the median exposure to illness has the
decisive vote. In order to allow the median’s shock to differ from the shock in the
overall population, we let G(φ) represent the cumulated distribution of the utility
shock φ for the pivotal voter with density g(φ).5 Substituting the tax rate t as in 2.2,
expected utility of the median voter reads as follows:
EUmedian =
∫ s
φ
(ln
[F (s)w
F (s) + ρ [1− F (s)]
]− φ) dG(φ)
+
∫ φ
s
(ln
[ρF (s)w
F (s) + ρ [1− F (s)]
]− b) dG(φ).
(2.3)
Due to the self-selection mechanism in equation (2.1), a higher replacement rate
encourages more people to stay at home as the reservation value s decreases. The
share of absent workers has, in turn, repercussions for the insurance terms, as it
influences the benefits-to-tax ratio via the budget constraint, i.e., the “price” for any
given level of ρ increases. This moral hazard effect caused by the insurance has to
be taken into account by the pivotal voter when choosing the optimal replacement
rate. Thus, the voter chooses ρ to maximize his or her expected utility subject to
the incentive compatibility constraint (2.1) that takes the moral hazard effect into
account. Assuming there is a maximum, it can be characterized by two optimality
conditions6:
h(s, ρ) = [1−G(s)]F (s)−G(s) [1− F (s)] ρ− ρf(s)
F (s)≡ 0 (2.4)
s(ρ, b) = b− ln(ρ). (2.5)
The first optimality condition (2.4) takes direct and indirect effects of a changed
replacement rate on the expected utility of the pivotal voter into account. The first
two terms of h(s, ρ) represent the standard insurance trade-off between more con-
sumption when absent at probability [1−G(s)] and less consumption when present
at probability G(s). An increase in ρ has further (indirect) repercussions, as it in-
5If the pivotal voter has the same exposure to the risk as the whole population, the politicaleconomy solution is maximizing a utilitarian welfare function.
6The sign of the bordered Hesse Matrix,∣∣H2
∣∣, is analytically indeterminate without furtherassumptions regarding F (φ) and G(φ). Simulations with different types of distributions for F and G(log-normal, normal, Weibull and Student-t distributions) suggest that
∣∣H2
∣∣ > 0 holds for relevantparameter constellations. We thus assume the second-order condition to be fulfilled.
15

creases the absence rate in the population and thus individual costs for one unit of
insurance, which is represented by the last term. The second condition (2.5) represents
the incentive compatibility condition.
2.2.3 Comparative statics
We will now analyse the impact of changes in the value of the psychological costs
b that reflect the level of benefit morale in a society on the equilibrium value of ρ∗,
i.e., the generosity of the sick pay entitlements. According to the implicit function
theorem, changes in ρ induced by exogenous changes in b can be written as:
∂ρ∗
∂b= −
∂h∂b
+ ∂h∂s∗
∂s∗
∂b∂h∂ρ
+ ∂h∂s∗
∂s∗
∂ρ
. (2.6)
From the second-order condition we can deduce a negative denominator. Since ∂h∂b
= 0
and ∂s∗
∂b= 1, the direction of the total effect hinges on the partial derivative ∂h
∂s∗:
∂h
∂s∗=− g(s∗){F (s∗) + [1− F (s∗)] ρ}+ f(s∗){[1−G(s∗)] +G(s∗)ρ}
− ρf ′(s∗)
F (s∗)+ρ [f(s∗)]2
[F (s∗)]2≥< 0.
(2.7)
Analytically, it is not clear which of the counteracting effects in ∂h∂s∗
prevails. The
first term in (2.7) represents the effects of an increase in the probability of the pivotal
voter being present and working due to a marginal increase in s∗ (probability effect).
This effect reduces the utility gains from increased insurance, since this effect makes
the voter more likely to be a net contributor to the insurance. The second term takes
changes in the working behavior of the whole population into account. Since more
people go to work instead of staying at home, each unit of insurance is less costly to the
voter (price effect) which favors more insurance. Assuming f ′(s∗) ≤ 0 in the relevant
range for s,7 the third term represents the reduction of the negative moral hazard ef-
fect in the optimality condition h(s, ρ), as weakly fewer people are marginally affected
by increases in ρ when moving to higher values of s. Finally, the last term shows,
that if more people go to work, the moral hazard costs of an increase in generosity are
shared among more people working, which makes this increase in generosity cheaper
for the median voter. Hence, the direction of the overall effect of a change in benefit
morale on sick pay generosity depends on whether the negative probability effect is
7This assumption implies that the probability of a stronger shock occurring is not higher than theprobability of a smaller shock or that more severe diseases are less prevalent, which seems plausible.
16

stronger in size than the combined positive effects that are brought about as more
people work and the moral hazard effect is marginally reduced.
In the case of a positive partial derivative ∂h∂s∗
equation 2.6 establishes a positive
connection between benefit morale and the equilibrium replacement rate. Here, the
price sinks sufficiently due to stricter benefit morale that more insurance increases
the median’s utility albeit his or her reduced absence probability. In the other case,
i.e., ∂h∂s∗
< 0, the overall effect is negative. Here, the median’s incidence of sickness
absence is reduced by stricter benefit morale to the point that – even though the price
is reduced – less generous insurance leads to utility gains for the median voter.
If the median has the same shock pattern as the whole population (welfare maximiza-
tion), the overall effect is ambiguous except for the unplausible case that F (s∗) < 1/2.8
To shed light on this analytically indeterminate problem, we run numerical simula-
tions.
Using numerical simulations, we analyse several parameter constellations, vary the
expected scope and the spread of the shock’s distribution and assume different types
of distribution for the sickness shock (the results are available upon request). The
relationship between benefit morale level and replacement rate is concave in all these
models. While the positive price effect prevails at low levels of benefit morale, the
counteracting probability effect becomes stronger at higher benefit morale levels. In
some cases, the negative probability effect overcompensates for the positive price ef-
fect at higher levels, which leads to a hump shaped pattern. With regard to the
resulting absence rate, we replicate the negative impact of benefit morale presented
in Lindbeck and Persson (2010) for all parameter constellations. This direct impact
of benefit morale on the incidence of the insurance case distinguishes our model from
the model in Algan and Cahuc (2009) covering unemployment benefits. We conclude
from the simulation that the pattern between benefit morale and the replacement rate
is characterized by a positive relationship at low levels that might turn negative for
higher levels of benefit morale. In the following section, we empirically analyse the de-
terminants of sick pay entitlements, with benefit morale as an additional explanation
not present in the previous literature.
8In this case equation 2.7 simplifies to ∂h∂s∗ = f(s∗) [1− ρ] [1− 2F (s∗)]− ρf ′(s∗)
F (s∗) + ρ[f(s∗)]2
[F (s∗)]2. F (s∗) <
1/2 and f ′(s∗) ≤ 0, guarantee that equation 2.7 is positive, which produces an overall positive effect.However, under the more plausible assumption F (s∗) > 1/2, which implies that more than half ofthe population is present and working, the overall effect is again ambiguous.
17

2.3 Empirical evidence
2.3.1 Data
Our data set covers 31 developed countries between 1981 and 2010.9 Our dependent
variable is the statutory gross replacement rate in the first week of illness for a single
household earning an average production worker’s wage. We disregard privately con-
cluded sick pay benefits as part of work contracts or collective bargaining agreements
due to a lack of data. In addition, we do not discern whether the sick pay is financed
by social contributions, general tax revenue or the employer, as the effects outlined in
the theoretical model are qualitatively the same (see footnote 4). The gross replace-
ment rate has a major advantage over the net replacement rate: namely, that it is
independent of tax policy reforms. Since we assume that benefit fraud takes place in
short spells of absence, we measure the generosity of sick pay during the first week
of illness, and we take waiting days into account. As a robustness check, we present
results with sick pay measured as a replacement rate that does not take waiting days
into account.
The data on sick pay entitlements is taken from three different sources in order to
obtain a number of observations as large as possible. For the 1980s and 1990s, we use
the Social Citizenship Indicator Program data set (SCIP) provided by the Swedish
Institute for Social Research (SOFI), which covers 18 major developed countries from
1930 to 1995 (Korpi and Palme, 2007). For the years after 2000, we expand our sam-
ple to the major EU-27 countries by using the EU’s Mutual Information System on
Social Protection (European Union, 2012), and for countries that are not members
of the European Union, we use the Social Security Programs Throughout the World
Series (US Social Security Administration and International Social Security Associa-
tion, 2010).10 Generally, there is much more variation between countries than there
is variation over time. The replacement rates range from zero in the first week in
some anglophone countries to 100% of the wage in some Central and North European
countries. The bulk of the countries however, guarantee a gross replacement rate in
the first week strictly between zero and one. Country averages of the sick pay data
9These countries are: Australia, Austria, Belgium, Bulgaria, Canada, the Czech Republic, Den-mark, Estonia, Finland, France, Germany, Greece, Hungary, Ireland, Italy, Japan, Latvia, Lithuania,the Netherlands, New Zealand, Norway, Poland, Portugal, Romania, Slovakia, Slovenia, Spain, Swe-den, Switzerland, the United Kingdom, and the United States.
10To guarantee the most accurate and consistent data possible, we cross-checked the values betweenthe different sources, where feasible, and reviewed the literature on sick pay institutions (Seffen,1980; Salowsky and Seffen, 1993). Countries covered over the whole period and hence collected fromdifferent sources show a very consistent pattern over time in our data.
18

are in Table 2.2 in the appendix.
The variable of interest, benefit morale, is taken from the European and World Val-
ues Survey (European Values Study and World Value Survey Association, 2009) waves
one to five, which has been widely used in empirical research on social norms and the
welfare state (Algan and Cahuc, 2009; Halla and Schneider, 2014; Heinemann, 2008).
The World Values Survey (WVS) is a survey of attitudes on a worldwide base, which
provides over 500 representative observations per country for our sample. The ques-
tion for benefit morale reads: “Do you think it can always be justified, never been
justified or something in between to claim government/state benefits to which you
have no rights?”11 The scale ranges from one for “Never justifiable” to 10 for “Al-
ways justifiable”. We disregard wave three due to a lack of sick pay data and, hence,
consider four of the first five waves of the WVS: 1981-1982 (first wave), 1989-1990
(second wave), 1999-2001 (fourth wave), and 2004-2008 (fifth wave).12 We work with
waves as time units and take country averages over the duration of each wave for the
annually measured controls. Since the institutional data from the last century is only
available in five-year periods and the WVS is polled aperiodically, we associate the
last year of a WVS wave with the next available generosity data point measured after
a lag of at least one year.13 As the World Values Survey does not cover the benefit
morale item in all countries in each wave, we have an unbalanced panel covering 31
countries in four waves over the period 1981-2010.
We follow Algan and Cahuc (2009) in taking shares of individuals who have answered
“Never justifiable” within each country as a measure of a country’s benefit morale.
The country average ranges from less then a quarter in Greece to around 90 percent
in Denmark. With a gradual decline of about nine percent over the past 30 years,
benefit morale can still be described as relatively stable over time. This fits our con-
tention that benefit morale is a social norm, which is to a great extent internalized
and transmitted from one generation to the next. Only in Finland do we observe one
discordant value: the share of participants answering “Never justifiable” dropped in
Finland from almost two thirds in the first wave to a mere twelve percent in 1990,
which is the lowest value in our sample. In the mid-1990s this value again stabilized
11The item does not ask for the socially shared but the individual norm. Hence, it can be ratherinterpreted as the internalized part of the social norm. However, the aggregate country measuresgive a good idea of how much benefit morale is shared among the population.
12The sick pay data from SCIP ends in 1995 and MISSOC starts in 2004.13Accordingly, benefit morale and lagged controls from 1981-82 are associated with the replacement
rate in 1985, 1989-90 norms with institutions in 1995, 1999-2000 with 2004 and finally 2004-08, withentitlements in 2010.
19

at over 60 percent.14 Thus, this observation is an outlier, in the strict sense of the
term, and we disregard it in our subsequent investigation.15
We will now turn to the control variables. First, there are political factors drawn
from the literature on comparative welfare state institutions that are deemed to af-
fect public sick pay programs (Korpi, 1989; Allan and Scruggs, 2004). The political
orientation of the government is measured by the government partisanship index,
taken from the Comparative Political Data Sets I (Armingeon et al., 2009) and III
(Armingeon et al., 2010), in which higher values are associated with more left-wing
politicians in the cabinet. Furthermore, we take a communist past of a country into
account. In addition to the political dimension, economic factors shape institutional
choice. Economic problems might force governments to reform welfare programs, and
for that reason, our model contains real GDP growth as a proxy for economic shocks.
Moreover, in order to account for the absolute level of wealth in a country, we include
GDP per capita measured in 2005 US dollars. In addition, welfare program generos-
ity has been linked to economic openness which is measured as the ratio between the
sum of imports and exports and a country’s GDP, since these programs are seen as a
means to reduce external risk from exposure to the world market (Rodrik, 1998). The
economic controls are taken from IMF sources and the Penn World Tables. Finally,
since Ichino and Riphahn (2005) have shown that employment protection reduces the
incidence and the duration of sick spells, we include the Employment Protection Leg-
islation Indicator (EPL) from the OECD (Version 1) that is supplemented with data
for middle and eastern European countries from the literature.16 Summary statistics
are in Table 2.1 in the appendix.
2.3.2 Econometric method and results
In order to keep as many observations as possible in our analysis, we apply a pooled
cross-section design. Despite the limited range of the dependent variable, an OLS
model is selected over a tobit model, in order to avoid the stricter distributional as-
14Finland’s situation in 1990 was characterized by a huge economic downturn accompanied by thedisintegration of the Soviet Union, Finland’s neighbor and biggest trading partner.
15Our results are sensitive to the inclusion of this outlier observation, but since we consider theexclusion of this peculiar observation reasonable, we present the results obtained without this outlier.
16Detailed information about the concept and measurement of the EPL indicator can be foundin OECD (n.d.a). We choose the OECD Version 1 indicator since this measure is available for thelongest time span, i.e., since 1985. For that reason, EPL is measured in the first wave in 1985only. For supplementary data, we consult primary sources that apply the OECD methodology,i.e. Muravyev (2010) for the Baltic countries and Tonin (2009) for Bulgaria, and Romania. Theresults are not sensible to the inclusion of these additional data (regression results are available uponrequest).
20

sumptions inherent in the latter, which is presented in the next section as a robustness
check. We abstain for two reasons from the inclusion of country dummies. First, this
allows us to retain the dominant cross-country variation of sick pay in the model.
Second, by doing so we can keep twelve countries in our analysis for which data is
available only in the cross-sectional dimension.
Since the literature postulates a negative long-term impact of welfare state benefits
on work norms, i.e., in the inverse direction, there is quite likely a reversed causality
problem leading to a simultaneity bias (Lindbeck, 1995; Lindbeck et al., 2003; Halla
and Schneider, 2014; Heinemann, 2008). However, due to the very temporary char-
acter and rather small amount paid by sick pay programs compared to other welfare
programs, we seriously doubt that sick pay generosity has a strong and persistent
bearing on the benefit morale level prevalent in a country. Unemployment bene-
fits seem to be much better suited to have an impact on work norms due to higher
amounts spent and longer duration of payments. The idea that the generosity of sick
pay reflects the generosity of unemployment benefits finds little support in our data,
which calculated a correlation coefficient of 0.27 between the replacement rate for
unemployment and sickness.17 Hence, countries with generous sick pay entitlements
do not necessarily have generous unemployment benefits, which in turn are expected
to affect the benefit morale level in the long run. Also problematic is the fact that our
data covers almost 30 years, which increases the likelihood that social norms adapt
to institutions. The gradual decline of benefit morale observed in our data of about
six percentage points or nine percent could lead – if caused by generous sick pay enti-
tlements – to a simultaneity bias. We can calculate the direction of this simultaneity
bias, i.e. the asymptotic covariance between benefit morale and the error term, under
some assumptions only.18 With a claimed negative impact from generosity on benefit
morale, according to the literature, benefit morale should under these assumptions
be negatively correlated with the error term in our model and lead to a downward
bias of the coefficient of interest. However, these considerations should be taken with
some caution due to the restrictive underlying assumptions. Additionally, as political
processes work slowly, independent variables are generally lagged, which also helps to
mitigate the reversed causality problem.
To capture the predicted concave pattern that might decrease at higher levels in a
17The gross unemployment benefit rate for an average production worker is taken from van Vlietand Caminada (2012).
18The sign of the bias can only be calculated when we (i) disregard covariates in the two structuralequations (benefit morale on welfare benefits and welfare benefits on benefit morale), (ii) assumethat the error terms of the two structural equations are uncorrelated, and (iii) the product of thetwo structural coefficients is less than one, c.f. Wooldridge (2006, pp. 550-551).
21

flexible way, we use so called spline regressions (Greene, 2003, pp. 121-122). Spline
regressions or piecewise linear regressions allow for different linear slopes in sections
of the benefit morale range. We prefer spline regression models to quadratic regres-
sion models for their flexibility, but we will present the latter as a robustness test in
the following section. We decide whether and where to put the knots of the spline
regression, i.e., the kink points, by means of Wald tests of nested models. Hence,
we test in which benefit morale range a different slope would add most to the fit of
the model. The first knot is best at a benefit morale level of 0.56 with a p-value of
0.01 in the Wald test of nested models. Given this, the second knot is best at 0.72
with a p-value of 0.05. Hence we estimate different linear effects in these three value
ranges.19 Taken together, we analyse the correlation between benefit morale and sick
pay insititutions by estimating the following model:
RRc,t = γ1+β1BMc,t−1+β2BM2c,t−1+β3BM3c,t−1+Xc,t−1′γ2+γ3wavet+εc,t. (2.8)
In this equation, RRc,t represents the gross effective replacement rate in country c,
at date t; BMc,t−1 denotes the benefit morale in country c, at date t − 1; BM2c,t−1
represents the second linear effect starting at a benefit morale level of 0.56; BM3c,t−1
represents the third linear effect starting at 0.72 of benefit morale. Finally, the vector
Xc,t−1 includes lagged control variables; wavet represents time fixed effects; and
εc,t is an error term. In order to guarantee consistent standard error estimates, we
use heteroskedasticity-robust standard errors that take clustering by country into
account.20 The regression results are in Table 2.3.
[Insert Table 2.3 about here]
Looking at the baseline specification (1) in Table 2.3, we find a positive and highly
significant coefficient for the general benefit morale variable (β1), a negative and
significant coefficient for the second linear effect starting at 0.56 (β2) and finally a
positive but less significant coefficient for the third linear effect starting at 0.72 (β3).
In the lower section, we obtain a highly significant positive relationship. Combining
19These data generated ranges happen to cut the relevant value range, 0.24-0.90, into the lowerhalf and split the remaining upper half into two almost equally sized sections. Hence we have (i)a first range with observations between benefit morale levels of 0.24 and 0.56; (ii) a smaller middlerange between 0.56 and 0.72 and finally (iii) the upper range with observations between 0.72 and0.90. The lower part contains one quarter of the observations, the middle range 45% and the upperrange 30 %.
20Since it could be argued that the cluster adjustment with only 31 countries is biased, we alsoestimate Huber-White standard errors which does not change the significance of the results (resultsare available upon request).
22
β1 and β2 in the middle section we find a significant negative slope while the combined
effect in the third section is positive but insignificant. This fits with the results of our
theoretical model and its numerical simulations that point to a hump shaped pattern
indicating a dominant price effect at lower levels of benefit morale, while at higher
levels, this positive effect is outweight by the negative probability effect. Hence, higher
levels of benefit morale are associated with an increase in generosity in the lower half
of benefit morale, a decrease in the middle, and no effect in the upper range. The
effects are economically sizable. Hence, in the lower half of benefit morale an increase
of one standard deviation of benefit morale in this subsection (0.09) is associated with
an increase of about 19 percentage points in sick pay generosity. Due to the negative
simultaneity bias, we should consider the negative slope more cautiously, but taken
at face value a change in benefit morale of one standard deviation in the middle range
(0.04) comes with a reduction of six percentage points of generosity.
Concerning the controls, we find that openness, higher GDP per capita, stricter EPL
and a communist past are significantly positively associated with generous sick pay
entitlements. In contrast with the literature, we do not find any effect of the cabinet
composition, which might be due to the weakened polarization between left and right
in many countries.
2.3.3 Robustness checks
As a robustness check, we use differently measured variables for sick pay generosity
and benefit morale in models (2) and (3), respectively. Specifically, we calculate the
replacement rate by using the benefits paid after waiting days have elapsed, which does
not fundamentally change our results (model 2). By constructing a broader defined
benefit morale measure, we try to address the potential of an extreme response bias
in the WVS which leaves our results basically unaffected (model 3).21 Given the
structure of our data with the limited range of the dependent variable between zero
and one, a tobit model can be considered, but this does not fundamentally change
our results (model 4). Finally we present a quadratic regression model to make sure
that the results are not only driven by the chosen spline regression models. Again,
the Wald test of nested models calls for the inclusion of the quadratic term (p-value
of 0.05) leading to a hump shaped pattern with a turning point at a benefit morale
21In some cultures, people are reluctant to choose extreme values in surveys (Johnson et al., 2005).For that reason, we take the country share of individuals choosing the two most negative options ofthe benefit morale item and apply the spline model with the knots guaranteeing the best fit, here,at 0.74 and 0.82.
23

level of 0.63. Hence this model approves that the positive price effect prevails at lower
levels and is compensated for by the negative probability effect at higher levels of
benefit morale. Note that a quadratic model can either be U-shaped or hump-shaped,
which means that the slope is large in size and, hence, is significant only at high and
low levels. In contrast, the spline model is more flexible with regard to the direction
of the slope. For this reason we prefer the spline model to the quadratic model despite
its limitation to constant slopes inside each benefit morale range.
In order to see whether the results are driven by single countries, we rerun the baseline
model excluding one country at a time, which does not alter our results fundamentally
(not shown). The results are generally robust to the exclusion of single waves with
two exceptions: When dropping wave 1, the positive combined effect in the highest
range becomes significant, whereas without wave 4 the negative middle range becomes
insignificant. Unchanged point estimates with increased standard errors suggest that
this result is caused by the reduced number of observations.
2.4 Conclusion
In this chapter, we propose benefit morale as an additional explanation for cross-
country diversity in public sick pay generosity. In particular, we analyse the impact
of benefit morale on sick pay generosity in a political economy model and present
empirical evidence for 31 countries between 1981 and 2010. Since benefit morale is
predicted to reduce absence behaviour, it affects the sick pay replacement rate in two
ways. On the one hand, less absence reduces insurance costs as fewer people claim
benefits which favors, ceteris paribus, increased generosity due to lower prices (price
effect). On the other hand, being less frequently absent makes a generous insurance
less desirable for voters (probability effect). Numerical simulations suggest that the
positive price effect prevails at low levels of benefit morale, while the counteracting
probability effect becomes stronger at higher benefit morale levels. In some cases,
the negative probability effect overcompensates for the positive price effect. We find
empirical evidence for the positive price effect in the lower benefit morale range, for
the negative probability effect in the medium range flattening for high values. Due
to a potential negative simultaneity bias, the negative effect should be considered
cautiously.
The existence of the positive effect is already covered in the literature for other wel-
fare state dimensions, while the negative probability effect in this dimension is a new
finding. The negative relation is mostly due to the fact that higher benefit morale re-
24

duces the incidence of the insurance case by making absence rather unattractive for the
employed individuals through additional psychological costs. In extremum, reduced
absence behaviour leads to presenteeism meaning that people go to work sick, which
negatively affects overall productivity. In this sense, generous entitlements could be
a means to counterbalance too strict benefit morale standards in some countries in
order to prevent presenteeism. The combination of benefit morale and presenteeism
could be an interesting subject for further research. Furthermore, the negative effect
could be taken as argument to see benefit morale not only as a social precondition for
sick pay entitlements but also as its substitute. The same argument could also apply
– to a lesser degree – to other welfare programs, for instance, to disability insurance.
25
2.5 Appendix
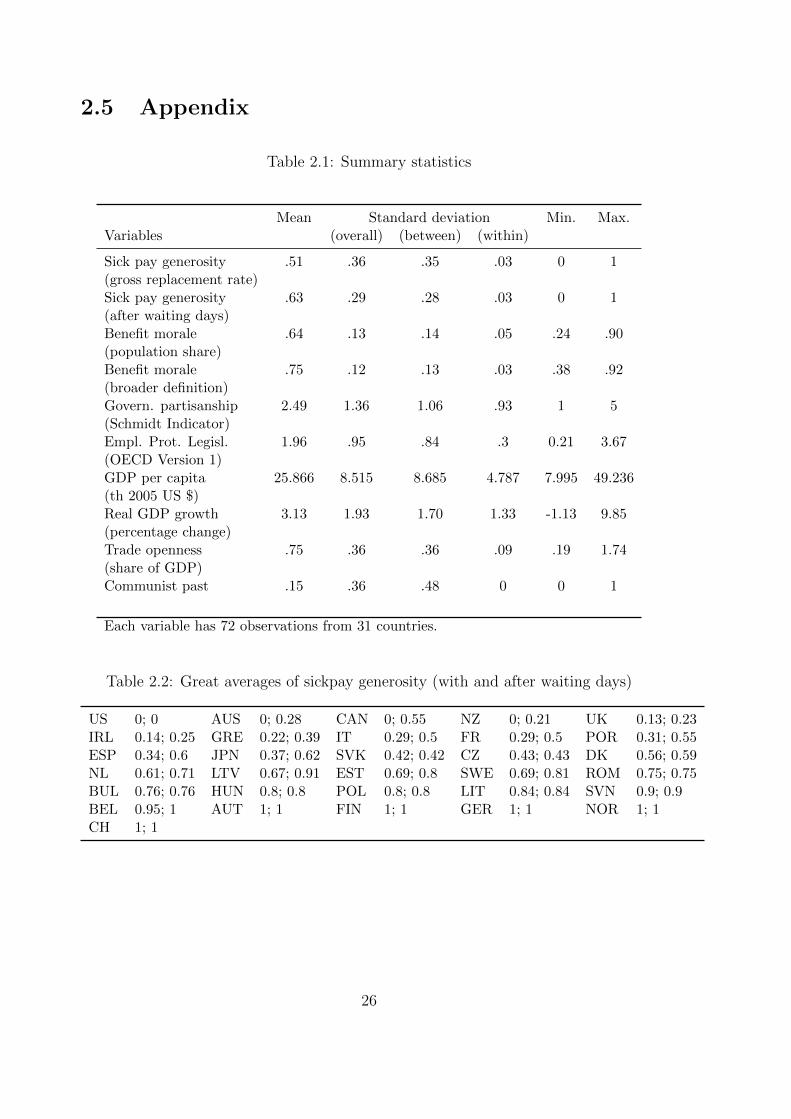
Table 2.1: Summary statistics
Mean Standard deviation Min. Max.Variables (overall) (between) (within)
Sick pay generosity .51 .36 .35 .03 0 1(gross replacement rate)Sick pay generosity .63 .29 .28 .03 0 1(after waiting days)Benefit morale .64 .13 .14 .05 .24 .90(population share)Benefit morale .75 .12 .13 .03 .38 .92(broader definition)Govern. partisanship 2.49 1.36 1.06 .93 1 5(Schmidt Indicator)Empl. Prot. Legisl. 1.96 .95 .84 .3 0.21 3.67(OECD Version 1)GDP per capita 25.866 8.515 8.685 4.787 7.995 49.236(th 2005 US $)Real GDP growth 3.13 1.93 1.70 1.33 -1.13 9.85(percentage change)Trade openness .75 .36 .36 .09 .19 1.74(share of GDP)Communist past .15 .36 .48 0 0 1
Each variable has 72 observations from 31 countries.
Table 2.2: Great averages of sickpay generosity (with and after waiting days)
US 0; 0 AUS 0; 0.28 CAN 0; 0.55 NZ 0; 0.21 UK 0.13; 0.23IRL 0.14; 0.25 GRE 0.22; 0.39 IT 0.29; 0.5 FR 0.29; 0.5 POR 0.31; 0.55ESP 0.34; 0.6 JPN 0.37; 0.62 SVK 0.42; 0.42 CZ 0.43; 0.43 DK 0.56; 0.59NL 0.61; 0.71 LTV 0.67; 0.91 EST 0.69; 0.8 SWE 0.69; 0.81 ROM 0.75; 0.75BUL 0.76; 0.76 HUN 0.8; 0.8 POL 0.8; 0.8 LIT 0.84; 0.84 SVN 0.9; 0.9BEL 0.95; 1 AUT 1; 1 FIN 1; 1 GER 1; 1 NOR 1; 1CH 1; 1
26

Table 2.3: Sick pay generosity regression results
(1) (2) (3)1 (4) (5)(OLS) (OLS) (OLS) (tobit) (OLS)
Benefit morale β1 2.14∗∗∗ 1.77∗∗∗ 1.77∗∗∗ 2.87∗∗∗ 4.56∗∗
(0.67) (0.50) (0.50) (0.95) (2.07)Second range (0.56-1) β2 -3.95∗∗∗ -3.22∗∗∗ -5.27∗∗∗ -5.5∗∗∗
(1.29) (0.92) (1.50) (1.87)Third range (0.72-1) β3 2.84∗ 1.62 5.15∗∗ 3.43∗
(1.44) (1.11) (2.22) (1.93)Cabinet composition 0.01 -0.01 0.02 0.02 0.01
(0.02) (0.02) (0.02) (0.03) (0.02)Trade openness 0.31∗∗∗ 0.25∗∗ 0.31∗∗∗ 0.48∗∗∗ 0.31∗∗
(0.10) (0.12) (0.11) (0.17) (0.12)GDP per capita 0.02∗∗∗ 0.02∗ 0.02∗∗∗ 0.03∗ 0.02∗∗∗
(0.00) (0.00) (0.00) (0.01) (0.00)Real GDP growth 0.00 -0.00 0.01 -0.00 0.00
(0.02) (0.02) (0.02) (0.03) (0.02)Communist past 0.59∗∗∗ 0.35∗ 0.64∗∗∗ 0.62∗∗ 0.63∗∗∗
(0.19) (0.19) (0.18) (0.29) (0.19)EPL (Version 1) 0.18∗∗∗ 0.18∗∗∗ 0.20∗∗∗ 0.25∗∗∗ 0.22∗∗∗
(0.05) (0.05) (0.05) (0.08) (0.05)Benefit morale squared -3.6∗∗
(1.7)Wave dummies Yes Yes Yes Yes Yes
Combined linear effects
First range 2.14∗∗∗ 1.77∗∗∗ 1.77∗∗∗
Second range -1.81∗∗ -1.45∗∗∗ -3.50∗∗∗
Third range 1.03 0.18 1.65
Joint sign. of benefit morale 0.01 0.01 0.01 0.01 0.08
N 72 72 72 72 72n 31 31 31 31 31R2 / Pseudo-R2 0.56 0.56 0.57 0.40 0.52
Heteroskedasticity-robust standard errors, clustered by country, in parentheses.
Constant not shown. ∗ p < 0.10, ∗∗ p < 0.05, ∗∗∗ p < 0.011 In column (3) the benefit morale variables are measured in the broader definition and
with accordingly changed ranges. Second range: 0.74-1; Third range: 0.82-1.
27


Chapter 3
Sickness absence and works
councils
Using both household and linked employer-employee data for Germany, we assess the
effects of non-union representation in the form of works councils on (1) individual
sickness absence rates and (2) a subjective measure of personnel problems due to
sickness absence as perceived by a firm’s management. We find that the existence
of a works council is positively correlated with the incidence and the annual duration
of absence. We observe a more pronounced correlation in western Germany which
can also be interpreted causally. Further, personnel problems due to absence are more
likely to occur in plants with a works council.
This chapter is joint work with Tobias Brandle and Laszlo Goerke.
29

3.1 Introduction
In Germany, non-union workforce representation by works councils is widespread.
Works councils have wide-ranging information, consultation and codetermination rights
and their effects on wages, productivity, employment and profitability have been stud-
ied intensively. In contrast, the relationship between works councils and sickness-
related absence has not been thoroughly considered. This is surprising because ab-
sence in Germany is relatively high in international comparison (OECD, n.d.b, p. 95)
and causes substantial output losses. Furthermore, works councils have considerable
impact on the determinants of sickness-related absence and on the means available to
firms to respond to such employee behaviour. The direction of the impact is, however,
ambiguous. On the one hand, works councils may prevent firms from monitoring ab-
sence behaviour and from imposing sanctions for illness-related absence. In this case,
they are likely to increase absence. On the other hand, works councils can act as the
employees’ voice and help to improve working conditions and productivity. In this
latter case, they presumably reduce absence.
Besides a study considering the specific case of apprentices, there is – to the best of
our knowledge – no general investigation of the relationship between works councils
and absence for Germany. More specifically, Pfeifer (2014b) combines firm data for
2007 from the Federal Institute for Vocational Education and Training with adminis-
trative employee data. He finds absence rates to be lower in the presence of a works
council for apprentices, i.e. a subgroup of mostly very young employees who have
fixed-term contracts. Moreover, they are subject to different legal regulations than
regular employees. Therefore, and because of the specific role works councils play
in the German apprenticeship system, Pfeifer’s findings cannot easily be generalised.
Furthermore, some analyses focussing on related issues suggest a positive relationship
between works councils and absence of employees. Ziebarth and Karlsson (2014) use
data from the German Socio-Economic Panel to investigate the effects of an increase
in statutory sick pay in 1999. They show in one robustness check that employees
working in firms without a works council in 2001 were absent for fewer days between
1997 and 2000. Pfeifer (2014a) focusses on various aspects of human resource man-
agement using data from the Institute for Employment Research Establishment Panel
for the year 2006. One of the relevant questions relates to work absence. He finds
the existence of a works council to be positively correlated with expected absence
problems. Moreover, Heywood and Jirjahn (2004) use firm-level data from the 1996
wave of the Hannover Firm Panel to investigate the relationship between teamwork
and absence. They show that the existence of a works council is positively associated
30

with a firm’s absence rate. Finally, Berger et al. (2011) employ a dataset of 305 firms
from 2006 to analyse the impact of incentive schemes on cooperation among employ-
ees. They show that the average number of missed work days is higher in firms with
a works council.
In Germany, collective bargaining mainly takes place at the industry level. There-
fore, the plant-level representation of employees heavily rests on the shoulders of
works councils. Our analysis is, hence, also related to contributions which indicate
a positive relationship between firm-level collective bargaining and absence for Spain
(Garcıa-Serrano and Malo, 2009), Canada (Dionne and Dostie, 2007), and the United
States (Allen, 1981, 1984; Leigh, 1981, 1985). In partial contrast, centralised collective
bargaining seems to have no impact on sickness absence in Britain (Heywood et al.,
2008) and Germany (Heywood and Jirjahn, 2004), and union density does not appear
to affect absence rates in Norway (Mastekaasa, 2013).
In sum, the literature suggests a positive impact of employee representation at the
plant level on absence. However, a systematic investigation of works councils and
absence behaviour and of its consequences for firms is not available. Hence, in this
chapter we, first of all, use the German Socio-Economic Panel (SOEP) to investigate
the effects of the presence of a works council on individual absence behaviour. The
SOEP contains information on the incidence and the duration of sickness absence
on an annual basis, as well as, for some years, on the existence of a works council.
The estimates from pooled cross-sectional models suggest that an employee working
in a plant with a works council is about three and a half percentage points more
likely to be absent at least one day in a given calendar year than an otherwise similar
employee who is not represented by a council. The corresponding difference in the
annual duration of absence amounts to more than one day. These effects are quanti-
tatively sizeable, given an average incidence (duration) of about 58% (9 days). Using
a difference-in-differences approach, we obtain evidence which is compatible with a
causal interpretation of the positive correlation for western Germany. Second, we use
linked employer-employee data (LIAB). We exploit a unique variable which is derived
from questions directed at plant managers or high-ranking personnel staff, inquiring
whether they expect personnel problems due to high absence rates. We show that
the existence of a works council is associated with an increase in the likelihood of
such problems by about three percentage points. This is also an economically sizeable
impact, given an average probability of 12%.
The remainder of this chapter develops as follows. Section 3.2 outlines the institu-
tional set-up and its consequences for absence behaviour, while Section 3.3 provides
31

detailed descriptions of the data and the econometric methodology. In Section 3.4 we
present and discuss our main results. Section 3.5 reports various robustness checks,
subsample-specific effects and results from a difference-in-differences approach. Fi-
nally, Section 3.6 summarises.
3.2 Institutional set-up
Initially, we describe the legal framework relating to works councils and sickness ab-
sence in Germany. However, such a legal perspective may not be sufficient, since
works councils have been shown to affect economic outcomes, such as wages, which
the relevant law (the Works Constitution Act; WCA) explicitly removes from their
realm (see, e.g., Addison et al., 2010). Consequently, we take a wider perspective in
the last part of this section.
3.2.1 The legal setting
The German system of industrial relations is characterised by a dual structure: Col-
lective bargaining, mainly at the industry level, determines wages and overall working
conditions, while works councils constitute a codetermination body at the plant level
(see Addison, 2009). The WCA establishes information, consultation and codetermi-
nation rights, which become more extensive the larger the firm. Although the law
states that works councils are to be set up in private sector plants with at least five
permanent employees, in 2011 (2001) they existed only in about 10% (12%) of eligible
plants, which employed 44% (50%) of the eligible employees in western Germany and
36% (41%) in the eastern part of the country. Since their incidence rises along with
firm size, about 90% of plants with a workforce exceeding 500 persons have a works
council (Ellguth and Kohaut, 2012).
Works councils are closely linked to trade unions in Germany, but cannot and do not
act as agents of unions within plants per se. This is the case because works councils
are legally obliged to cooperate with management to the advantage of the workforce
and the firm (WCA §2). Moreover, a works council is made up exclusively of employ-
ees of the plant, so that trade unions can only affect them directly by getting their
members elected as councillors. In recent years, this type of influence has declined,
since union membership of works councillors has fallen to below 60% (Goerke and
Pannenberg, 2007; Behrens, 2009).
The rights of works councils as detailed in the WCA are more extensive with regard
to personnel policy and social affairs and less pronounced with respect to financial
32

and economic aspects. As a general entitlement, the management has to provide
the council with the information it needs to perform its legal duties. The WCA es-
tablishes consultation rights of the works council, which require its information and
(weak forms of) consent, in particular with respect to personnel policy, changes in the
organisation of the work process, the work environment and the treatment of appren-
tices. Additionally, in establishments with more than 20 employees, the consultation
requirements with respect to personnel policy are expanded substantially (WCA §99);
for example, the works council has to consent to all job-to-job transfers of employees
within an establishment. Codetermination rights exist in particular with respect to
what the law calls ‘social matters’ (WCA §87). They include vacation arrangements,
principles of remuneration - though not its level -, and health and safety regulations.
Note, finally, that works councils are explicitly forbidden to organise strikes (WCA
§74(2)) and to negotiate over issues commonly dealt with in collective bargaining, un-
less explicitly allowed to do so in the respective contract. This restriction contained
in WCA §77(3) is most relevant with respect to wages.
The most important regulations concerning illness-related absence result from the
Continued Remuneration Act (‘Entgeltfortzahlungsgesetz’). During the period rele-
vant for our analysis, this law obliged employers to pay absent workers their full wage
for the first six weeks of sickness if they have been employed for more than four weeks.
Employees who are continuously absent for more than six weeks (referred to as ‘long-
term ill’) receive 70% of their gross or, at most, 90% of their net wage. Such payments
are financed by a mandatory health insurance to which virtually all employees in our
sample belong. Generally, employees missing work due to illness have to present their
employer with a doctor’s certificate that confirms the temporary inability to attend
work from the third day of illness onwards.
3.2.2 The works constitution act and absence behaviour
When looking for explicit regulations with respect to employee absence, one will search
the WCA in vain. However, a number of provisions pertaining to personnel policy can
have an impact. §87 WCA, for example, furnishes the works council with codeter-
mination rights relating to working-time arrangements and overtime. Furthermore,
the use of technical devices to control the behaviour and performance of employees
requires the councils’ approval. Finally, this paragraph and §89(2) WCA establish
codetermination and information rights with respect to workplace safety, a driving
factor of workplace-related injuries. All these regulations can have an impact on the
causes of sickness absence and its monitoring. Nonetheless, they do not provide a
33

clear indication of the direction of the effect a works council may have on absence
behaviour and resulting personnel problems. In addition, §102 WCA states that the
works council has to be consulted prior to a dismissal and that any dismissal without
such consultation is void. Moreover, a works council can object to dismissals and can
effectively delay them, thus making them more costly.
Moving beyond the WCA, dismissals in firms with fewer than ten employees are
subject to general civil law. However, larger firms are additionally subject to the
Protection Against Dismissal Act (PADA). It establishes illness to be one valid jus-
tification for an individual’s dismissal (PADA §1(2)). Furthermore, a works council’s
objection to a dismissal creates additional rights for dismissed employees if the PADA
is applicable. Accordingly, a works council can severely restrict a firm’s possibilities
to terminate employment contracts.1 This suggests a positive impact on absence,
given the substantial evidence that employment protection fosters absence (Ichino
and Riphahn, 2005; Olsson, 2009; Scoppa and Vuri, 2014).
3.2.3 Beyond the works constitution act
Although the WCA does not mention illness-related absence, as detailed above, there
are a number of further channels through which works councils can affect absence
behaviour. §80(1) WCA, for example, states that the main obligation of a works
council is to ensure that regulations and laws beneficial to the workforce are actually
applied. Therefore, working conditions in plants in which a works council exists
are likely to be better than in plants without such institutions (cf. Heywood and
Jirjahn, 2009 with respect to family-friendly policies). Better working conditions, in
turn, can reduce the incidence of illnesses, improve the motivation of employees and
reduce absenteeism (cf. Afsa and Givord, 2014). However, better working conditions
may also imply that employees are less likely to attend work when ill (i.e. reduce
sickness presenteeism) and potentially increase absence. Furthermore, works councils
can act as a collective voice (Freeman and Lazear, 1995) and reduce exit behaviour.
While exit is usually associated with permanently leaving the firm, a more short-term
interpretation suggests that exit could also be represented by absence behaviour.
Viewed from this perspective, works councils could mitigate sickness absence as a
1However, the evidence that works councils actually reduce dismissals is limited. Holand (1985,pp. 97 ff.) finds that councils did not object to dismissals in 70% to 80% of all cases in the 1980’s.Frick and Sadowski (1995), using different data, report even higher percentages. While Sadowski etal. (1995) and Frick (1996) argue that dismissal rates are lower in plants with a works council, Kraft(2006) questions this claim. Hirsch et al. (2010) further show that works councils are associated withlower separation rates, but cannot clearly identify dismissals
34

form of short-run exit behaviour. Moreover, works councils have been shown to affect
various economic outcomes which, in turn, are related to absence behaviour. For
example, although works councils are explicitly forbidden to negotiate over issues
bargained in collective contracts, they have been observed to increase wages through
various indirect channels (Addison et al., 2001; Hubler and Jirjahn, 2003; Addison et
al., 2010). Moreover, higher wages tend to reduce absence in Germany (Puhani and
Sonderhof, 2010; Ziebarth and Karlsson, 2009). These relationships may result in a
negative correlation between the presence of a works council and absence. In addition
to wages, the existence of a works council is positively correlated with tenure of
employees, temporary contracts, and firm size, inter alia.2 Since all of these features
can also have an impact on absence behaviour, works councils may, hence, affect
sickness absence via the composition of the workforce and firm characteristics.
The considerations above imply that the direction of the impact of works councils on
absence behaviour, and on its consequences from a firm’s perspective, are theoretically
ambiguous and ultimately an empirical issue, to which we now turn.
3.3 Data and empirical specification
3.3.1 SOEP
To empirically investigate whether the existence of a works council is systematically
associated with individual absence behaviour, we use the German Socio-Economic
Panel (SOEP), a representative longitudinal dataset for Germany.3 We exclude the
self-employed, civil servants (‘Beamte’) and employees working either in public admin-
istration or in plants with fewer than five employees, since these individuals, by law,
cannot be represented by works councils (cf. Section 3.2). Furthermore, our sample is
restricted to employees who work in energy, mining, manufacturing, construction, and
service industries. Finally, we focus on respondents aged 18 to 65. In consequence,
there is a maximum of 15,778 observations of 10,147 individuals. Note, finally, that we
apply survey weights for the descriptive statistics, but not for the regression analyses.
The SOEP regularly contains information on the self-reported number of working days
missed due to sickness in the previous calendar year. The item reads: “How many
days were you not able to work in 20XX because of illness? Please state all the days,
2For example, Boockmann and Hagen (2003) establish a connection between works councils andtemporary employment, while Engellandt and Riphahn (2005) find lower absence for temporaryworkers.
3More specifically, we use the SOEP long v29 dataset. For a general in-depth discussion of theSOEP see Wagner et al. (2007).
35

not just those for which you had an official note from your doctor. (a) None (b) A
total of X days”. We consider two dimensions of absence: first, whether an employee
was absent at all in the previous calendar year, i.e. the incidence of sickness absence,
and second, the annual duration of absence measured in days. There is also an item
which asks whether the respondent was continuously absent for more than six weeks
(‘long-term illness’), but the information is not detailed enough to separate short- and
long-term absence spells and their respective durations. Unfortunately, there is no
data on work accidents in the relevant time period.
Turning to works councils, the SOEP contains information which indicates the exis-
tence of such an institution at the workplace of the individual (1 = yes; 0 = no) in
the years (waves) 2001, 2006 and 2011. We associate the works council status and
the controls with the absence data from the subsequent wave, because the question
on absence is retrospective.
In our sample, 58.2% of the observations miss at least one day of work due to illness
per year. On average, sickness absence amounts to 9.24 days per year in the full
sample and drops to 6.48 days when excluding the long-term ill. More than 62% of
respondents work in a plant with a works council. This percentage shrinks to about
50% when we additionally exclude the vaguely-defined public sector (‘offentlicher Di-
enst’).4
Turning to the control variables, we take standard confounding factors into account
(Ziebarth and Karlsson, 2009, 2010; Puhani and Sonderhof, 2010; Goerke and Pan-
nenberg, 2012). Accordingly, we control for personal characteristics such as disability
status, being female, marital status, living with a partner, being of foreign national-
ity, having a foreign background (immigrant), subjective general health status (good,
bad), having children under the age of 14, age, educational attainment, satisfaction
with current health status, and 12 regional dummies.5 Furthermore, we include job
characteristics such as working part-time, being an apprentice, a blue collar worker, or
working in the public sector,6 having a temporary or marginal employment contract,
4This number is broadly comparable to the percentage reported by Ellguth and Kohaut (2012)for the first decade of this millennium and consistent with the percentages calculated by Jirjahn andLange (2011) and Gralla et al. (2012) on the basis of SOEP data.
5We use the regional categories common for LIAB data that guarantee a sufficient number of obser-vations per region. The federal states are grouped into regions as follows: Hamburg and Schleswig-Holstein; Lower Saxony and Bremen; North Rhine-Westphalia; Hesse; Rhineland-Palatinate andSaarland; Baden-Wurttemberg; Berlin; Brandenburg and Mecklenburg-West Pomerania; Saxony;Saxony-Anhalt; Thuringia.
6Since we think our argumentation holds in publicly-owned private firms, i.e. those in a compet-itive environment, we exclude only those employees who work in the public administration but notthose who claim to work in the vaguely-defined public sector (‘offentlicher Dienst’). In Germany, anumber of firms are owned by the state but are legally private enterprises and may, hence, have a
36

the size of the plant, log gross monthly earnings, tenure categories, a work autonomy
scale, and seven industry codes (energy/ mining, manufacturing, construction, trade,
transport/ information/ communication technology, banking/ insurance, other ser-
vices). This division guarantees similar classifications across the SOEP and the LIAB
data, described below. Regrettably, the SOEP contains no information on collective
bargaining coverage in the period under investigation. However, we can indirectly
capture a potential coverage effect because it varies systematically across industries
and with firm size. Additionally, we include the unemployment rate measured at the
level of the respective federal state (provided by the Federal Employment Agency),
as well as general time dummies. Descriptive statistics are provided in Table 3.4.
3.3.2 LIAB
To investigate the impact of works councils on absence-related personnel problems, we
use the LIAB Cross-sectional Model 2 1993-2010 from the Institute for Employment
Research (IAB) in Nuremberg. It is a linked employer-employee dataset with rich
information based on a representative annual plant-level survey (the IAB Establish-
ment Panel), together with personal data generated in the labour administration and
social security records by employees working in these plants (see Jacobebbinghaus
and Seth, 2010 for an overview). The IAB Establishment Panel is a representative
sample of about 1% of German plants which is stratified over industries and firm size
classes. Hence, large plants are slightly overrepresented, such that the data covers
about 7% of all German employees. The individual data (the Integrated Employment
Biographies, IEB) is drawn from official registers and is of very high quality, but the
number of individual variables observed is limited. To use a comparable sample to
the SOEP, we restrict our data to plants from mining, energy, manufacturing, con-
struction and service industries with at least five employees, one of whom must be
subject to social security in order to be included in the sample in the first place. This
results in a maximum of 42,444 observations in 21,453 plants (theoretically covering
over 4 million employees). The descriptive statistics are weighted at the individual
level. For the regression analysis, however, we present unweighted estimates.7
Most importantly, the LIAB dataset contains a unique set of variables, namely re-
sponses to a series of questions directed at plant managers or high-ranking personnel
works council. Our results are robust to the (inclusion and) exclusion of employees working in thewidely-defined public sector.
7While most of the results are robust against the use of sample weights, their inclusion could biasthe results if the effect of works councils on our dependent variable differs by firm size.
37

staff on the existence of personnel problems: “What kind of problems with human
resources management do you expect for your plant during the next two years?”.
Subsequently, replies with respect to various topics are requested, inter alia: “High
rate of lost working time and absence due to illness”. This information particularly
suits the investigation of the relationship between works councils and the economic
consequences of sickness absence, because the response reflects an evaluation of those
individuals who determine a plant’s adjustment behaviour to absence. Our data cov-
ers the years 2000, 2004, 2006, 2008, and 2010, as plant managers have been asked
about personnel problems in 2000 and every other year since 2004 and, because prior
to 2000, changes were made in the questionnaire regarding several variables we em-
ploy in the empirical investigation. Information on the existence of a works council
is provided for every year. As a robustness check we also include an indicator of the
degree of cooperation between management and works council which, however, is only
available for 2006 and has also been used by Pfeifer (2014a).
Regarding our dependent variable, a total of 4,952 plants (6.92% of all plants employ-
ing 13.71% of all employees) state that they expect personnel problems caused by high
absence rates during the following two years. Such personnel problems appear to be
temporary, since managers in only 2.31% of all plants (in which 5.77% of all employees
work) expect problems more than once during the observation period. Furthermore,
16,346 plants (14.31% of all plants employing 49.87% of all employees) are covered by
a works council.8
To account for confounding factors, we control for firm size and a large number of
other covariates. Based on individual-level data, we incorporate plant-specific means
of employee characteristics with respect to sex, nationality, tenure, age, qualification,
occupational status (blue collar worker), working time (part-time) and daily wages.9
Using plant-level information, we control for collective bargaining status (including
orientation, i.e. a firm’s voluntary application of the terms of collective agreements,
and the existence of wage cushions), the share of vacancies and of workers with tem-
porary contracts, the churning rate, investment activity, firm age, foreign and public
ownership, modern technical assets, status as a single plant, status as limited firm, and
8The numbers are somewhat higher than those provided by Ellguth and Kohaut (2012), becausewe only use plants with at least five observations in the personnel records and exclude some industrieswith low works council incidence.
9While being of high quality, the wage information in the LIAB is calculated from social securitycontributions and therefore censored at the contribution limit. This affects about 5.7% of all em-ployees. We have controlled for this circumstance by including a variable which reflects the share ofemployees with censored earnings. Regressions on median or imputed wage levels or using the peremployee pay bill yield very similar estimates.
38

the existence of (other) human resource management problems. Moreover, we include
industry, region, firm size and year dummy variables comparable to the ones used
in the SOEP as well as the unemployment rate at the regional level (‘Landkreis’).
Furthermore, there exist additional variables which might influence our dependent
variable, but which have a significant share of item-non-response. Therefore, we in-
clude them in some specifications, but only after controlling for sample selection bias
by estimating the restricted model on the restricted sample. These variables consist
of the natural logarithm of total investments, the share of expansion investments,
standard weekly working time, the share of exports, the existence of overtime, firm-
sponsored training and of performance-related pay, and expectations with respect to
rising turnover and employment levels. Using these additional variables decreases our
sample by about 40% to 23,916 observations in 12,744 plants. A full description of
all variables can be found in Table 3.6.
3.3.3 Empirical strategy
When analysing absence behaviour and expectations regarding future personnel prob-
lems, the stylized estimation equation for the different models reads as follows:
F (Yit)−1 = β1 + β2 workscouncilit +Xit
′ γ + δ yeart + εit. (3.1)
Here, Yit represents the dependent variable. Given the binary nature of absence
incidence and personnel problems we estimate pooled Probit models. For the dura-
tion of sickness absence, which includes the observations with zero days of absence,
we estimate pooled OLS models (F = a linear function) and additionally present re-
sults from count data models in Section 3.5.1. The subscript i represents individuals
(plants) at time t when using SOEP (LIAB) data. The dummy variable workscouncilit
indicates the existence of a works council, while the vector Xit contains confounding
factors, yeart represents year dummies, and εit is the error term. In order to account
for multiple observations of individuals or plants over time we use cluster-robust stan-
dard errors. As regards the Probit models, we additionally present the marginal effect
for our variable of interest, evaluated as a discrete change from zero to one.
Estimating equation (3.1) allows us to establish a correlation between works council
status and sickness absence indicators. However, such a relationship can not only arise
because works councils affect absence behaviour or resulting future personnel prob-
lems, but also because of selection of employees or the endogeneity of the existence
of a works council. To get closer to a causal interpretation, we use information with
39

respect to changes in works council status in the longitudinal dimension. We expect
different effects for changes into and out of council status. This is the case because
anecdotal evidence suggests that works councils are usually not abolished actively
but cease to exist when no new councillors are elected in the regular elections taking
place every four years. This is likely to be the case in plants in which works councils
have already ceased to operate properly. Hence, we primarily expect the adoption of a
works council to affect absence. Using individual data, we can furthermore distinguish
between stayers (in a plant) and movers (across plants).10 With regard to stayers,
a change in works council status can come about because a council is established or
dissolved. Hence, we expect the impact for stayers to be similar to the effects observed
in plant-level data.
Since we anticipate different effects for changes into and out of works council status,
and because of the small panel dimension in our datasets, we estimate difference-in-
differences (DiD) models (cf. Grund and Schmitt, 2013, Gralla and Kraft, 2012b).
Moreover, we present separate models for a change into works council status where
the control group is defined by never being covered by a works council, and for a
change out of works council status for which the control group consists of employees
or plants which are covered by a works council throughout the observation period.
Our estimation equation reads:
F (Yit)−1 = β1+β2 treatmentgroupi+β3 (no)workscouncilit+Xit
′ γ+δ yeart+εit. (3.2)
As the ‘treatment’ does not occur at the same moment in time, but throughout
the observation period, we follow Imbens and Wooldridge (2009, p. 68) to discern two
effects. The time-invariant dummy variable treatmentgroupi captures the selection
effect of plants and individuals into the treatment and control group. It is set equal
to one only if the employee or plant changes works council status at some point in
time. This allows us to see whether works councils are introduced in plants experi-
encing different absence rates, or levels of personnel problems due to absence, before
its adoption (reversed causality) and whether individuals with different absence be-
haviour sort themselves into plants with a council (selection effect).11 When looking
10We define stayers to have at least 5.5 (10.5) years of tenure in 2006 (2011), which indicates thatthey have not changed their employer since 2001. Accordingly, an employee, first observed in 2006,must have at least 5.5 years of tenure in 2011 to be classified as a stayer.
11Jirjahn (2009) finds that works councils are more likely to be adopted in plants experiencingeconomic distress. In our case, high absence rates and ensuing problems could be characteristicsthat are associated with the introduction of a works council.
40

at changes into works council coverage, the variable workscouncilit captures the ex-
posure to the ‘treatment’, indicating whether a plant or individual i is covered by
a works council in period t (treatment or DiD effect). In contrast, when looking at
changes out of works council coverage, the treatment effect is captured by the variable
no workscouncilit which is set equal to one if a plant or individual i is not covered.
We present the results of the DiD models in Section 3.5.3.
3.4 Results
3.4.1 Absence behaviour
The subsequent descriptive statistics of the weighted raw data from the German Socio-
Economic Panel (SOEP) suggest that employees who work in a plant with a works
council exhibit more sickness absence days and are more likely to be absent at least
once a year than those who are employed in a plant without a council. On average,
that is, including observations from individuals who are never absent, employees in
a plant without a works council report 7.67 days of absence per annum, while those
represented by a works council miss 10.18 days. When looking at a sample without
those respondents who state that they have been long-term ill at least once, the
difference is almost halved, to 5.60 days without and 7.01 days with works council
coverage. The incidence of sickness absence (without long-term ill employees) amounts
to 60.7% (58.8%) for respondents who work in a plant in which a works council exists
and to 53.9% (52.0%) for those not represented by such an institution.
The results of the regression models based on the pooled dataset are summarised
in Table 3.1. We successively add control variables, but only depict the estimated
coefficients (and marginal effects) of interest. Full results for specifications (3) and
(6) are contained in Table 3.5 (in the Appendix). Specifications (1) and (4) in Table
3.1, relating to the incidence of absence and its annual duration, respectively, contain
works council status as sole explanatory variable. Here, the coefficients of interest are
positive, statistically highly significant and mirror the differences from the (weighted)
raw data. Adding dummy variables for firm size classes, industries, regions and years
reduces the size of the works council effect for both dimensions, but not its significance
(specifications 2 and 5). In the absence incidence model with the full set of control
variables, the coefficient remains highly statistically significant and the marginal effect
still maintains a value of more than 3.6 percentage points (specification 3). This
difference is economically sizeable, given an absence incidence of 58% in our sample.
41

Since the raw difference in the incidence observed between employees working in a
firm with and without a works council is about 6.8% (see above), more than 50% of
this difference (3.6/6.8) is actually associated with a council’s presence.
Table 3.1: Absence incidence (pooled Probit estimates) and duration (pooled OLSestimates)
Absence incidence Absence annual duration
(1) (2) (3) (4) (5) (6)
Works council 0.173*** 0.115*** 0.099*** 2.01*** 1.90*** 1.23**(0.022) (0.028) (0.030) (0.39) (0.49) (0.48)
Marginal effect 0.068*** 0.045*** 0.036***
Dummy variables Yes Yes Yes YesIndivid.-level contr. Yes Yes
N. of obs. 15,778 15,778 15,778 15,778 15,778 15,778Pseudo-R2 / R2 0.003 0.012 0.058 0.002 0.006 0.110
Source: Own calculations from SOEP long v29. Note: Standard errors clustered at the individuallevel in parentheses. Dummy variables: firm size classes, industries, regions and years. Individual-level control variables: as in Table 3.5; Significance levels: * p < 0.10, ** p < 0.05, *** p < 0.01.
Turning to the annual duration of absence, the works council coefficients are size-
able and highly significant (p-value in the full model at 0.01). Given an average annual
duration of slightly more than nine days in our sample, the implied difference of more
than 1.2 days when including the full set of control variables (specification 6) is also
quantitatively sizeable. It translates – if taken at face value – into a reduction in
GDP of more than 0.22%, given that the total loss of production due to absence is
estimated to be about 1.7% of GDP in 2010 (Badura et al., 2011, p. 224). Almost
50% of the raw difference between individuals working in a plant with and without a
works council (of two and a half days; 10.18 - 7.67) is accounted for by the existence
of a works council.
With regard to the control variables (see Table 3.5 in the Appendix), the estimated
coefficients are generally in line with results based on SOEP data (Ziebarth and Karls-
son, 2009; Puhani and Sonderhof, 2010; Goerke and Pannenberg, 2012).12 When in-
12 In addition to the variables mentioned in Section 3.3.1, and following Goerke and Pannenberg(2012), we also included individual trade union membership as a covariate in specifications (3) and(6), which has to be imputed for 2006. While the size of the works council dummies is slightly reduced,they remain statistically highly significant. Individual trade union membership is associated with ahigher incidence and greater duration of absence. Furthermore, our results are robust to the inclusion
42

terpreting the results shown in Table 3.1, it is important to note that we control for
the health status of individuals in specifications (3) and (6). Thus, higher absence in
plants with a works council is not due to employees having inferior health.
3.4.2 Personnel problems due to high absence rates
In our sample based on the LIAB, there are 4,952 plants for which managers expect
to face personnel problems due to high absence rates within the following two years;
2,735 of those have a works council, while 2,217 do not. Using representative sample
weights, the plants with a works council account for 25.6% of all plants that expect
personnel problems due to high absence, but cover 64.5% of employees. This can
be explained by the oversampling of large plants, which almost always have a works
council. Comparing plants without a works council to those with such an institution,
personnel problems due to high absence are expected to arise in only 6.0% of the
former, while this number is 12.4% for the latter. A similar ratio at a higher level can
be observed for the share of employees (9.7% versus 17.7%).
Table 3.2: Personnel problems due to absence (Pooled Probit estimates)
(1) (2) (3) (4) (5) (6)
Works council 0.380*** 0.103*** 0.124*** 0.177*** 0.174*** 0.180***(0.019) (0.024) (0.027) (0.028) (0.038) (0.038)
Marginal effect 0.074*** 0.019** 0.021*** 0.029*** 0.028*** 0.030***
Dummy var. Yes Yes Yes Yes YesPlant-level contr. Some Some Some AllIndiv.-level contr. Yes Yes Yes
N. of Obs. 42,444 42,444 42,444 42,444 23,916 23,916N. of Clusters 21,453 21,453 21,453 21,453 12,744 12,744Chi2 421.20 1505.61 3511.53 3794.27 2279.66 2285.62Pseudo-R2 0.02 0.06 0.14 0.17 0.17 0.17
Source: LIAB QM2 9310 waves 2000, 2004, 2006, 2008 and 2010; own calculations (controlledremote data access via FDZ). Note: Standard errors clustered at the plant level in parentheses.Dummy variables: firm size classes, industries, regions and years. Other control variables: as inTable 3.7; Significance levels: * p < 0.10, ** p < 0.05, *** p < 0.01.
of several other control variables that are insignificantly related to the two dimensions of sicknessabsence behaviour: temporary agency contract, fear of job loss, or occupational categories (KLDB1992 or ISCO-2). Substituting the part-time dummy with contractual or actual weekly workinghours does not affect our results, either. Results are available upon request.
43

The results for the variables of interest from the pooled Probit estimates are sum-
marised in Table 3.2. Again, we successively add control variables and depict full
results in Table 3.7 (in the Appendix). Specification (1) in Table 3.2 only contains
the works council status as an explanatory variable. The coefficient is highly signifi-
cant and the marginal effect mirrors the (weighted) raw difference from the descriptive
statistics of about seven percentage points. In specification (2), we include dummy
variables for firm size classes, industries, regions and years. This reduces the size of
the coefficient, but not its statistical significance. When adding plant-level control
variables (specification 3), and covariates gathered from the individual level (specifi-
cation 4), the coefficient becomes larger again. In the preferred specification (4), we
find a highly significant estimated coefficient. The probability that personnel prob-
lems due to high absence rates arise is about three percentage points or 25% higher
in a plant with a works council. Hence, the estimated marginal effect is considerably
lower than the one obtained by Pfeifer (2014a) for the year 2006. Moreover, since it is
less than half the difference found in the raw data, about 40% of it can be attributed
to the existence of a works council. Observation-sensitive control variables are added
in specification (6). Furthermore, we check for sample selection bias in specification
(5) by using the variables from the previous specification (4) in the smaller sample
utilised in specification (6). The significance of the estimated coefficient does not
change when adding all covariates and neither does the size of the marginal effect.
Also, there is no indication of sample selection bias.
Turning to the control variables (see Table 3.7 in the Appendix), the signs of most
of the estimated coefficients are in line with expectations regarding personnel prob-
lems.13 They are also consistent with the few existing analyses on human resource
management problems using IAB EP data (Pfeifer, 2014a; Gralla and Kraft, 2012a).
In addition, the estimated parameters of the variables measuring the impact of bar-
gaining coverage are not significantly different from zero. Hence, we cannot discern
an association between collective bargaining and expected personnel problems due to
absence.
13Controlling additionally for occupational group shares (KLDB 1992) – as with the SOEP data(see footnote 12) – does not affect our results. The coefficients of these share variables are insignif-icant. Similarly, the inclusion of temporary agency workers does not change the results. We wouldhave to discard, however, the first wave of the LIAB when including this covariate. Results areavailable upon request.
44

3.5 Robustness checks, effect heterogeneity and DiD-
models
Having established a positive correlation between the existence of a works council and
various indicators of sickness absence, the objective of this section is threefold. First,
we analyse the robustness of the results concerning the annual duration of absence
and present findings from count data models (Section 3.5.1). Second, we scrutinise
whether the correlation between works councils and absence indicators varies across
subgroups (Section 3.5.2). Finally, we present the findings from DiD models for the
absence incidence models in order to shed some light on (reversed) causality and
selection issues (Section 3.5.3). The main results for the models presented in Sections
3.5.1 and 3.5.2 are summarised in Table 3.8 in the Appendix.
3.5.1 Count data models
Since the number of absence days has a count data structure, according models could
be considered (see Cameron and Trivedi, 1998, pp. 59 ff.). Applying a negative
binomial model corroborates qualitatively and quantitatively the results from the
OLS model, since we observe a highly significant difference of 1.14 days (p-value 0.013;
Table 3.8) between employees who work in a plant in which a works councils exists
and those in a plant without one. In order to take into account the excess number of
zeroes (i.e. the fact that more than 40% of the respondents are not absent a single
day in a calendar year), we additionally estimate a zero inflated negative binomial
model (ZINB). Again, the combined effect confirms the effect size and significance of
the OLS model (p-value 0.008).
3.5.2 Group-specific effect heterogeneity
We also look at subgroups of plants or employees, in or for which works councils may
play a different role. Following, for example, Addison et al. (2010) or Mueller (2012),
we look at a subsample of medium-sized plants with 20 to 200 employees. This allows
us to avoid extrapolation between small firms that usually do not have, and large firms
that generally do have, a works council. Furthermore, in this subsample we can keep
constant (1) the intensity of employment protection legislation (PADA) and (2) the
intensity of codetermination rights that increase together with plant size, according
to the WCA. The significant and positive relationship between works councils and
absence is affirmed with respect to the incidence measure, which becomes slightly
45

more pronounced with a difference of 3.8 percentage points, as well as for expected
personnel problems (marginal effect of 4.0 percentage points). In contrast, the esti-
mated coefficient of the works council dummy becomes insignificant when looking at
the annual duration of absence. When probing deeper into the relationship between
firm size, works councils and absence, we find the incidence of absence to be higher
only in firms with fewer than 200 employees, while the annual duration is affected if
there are 200 or more employees. With respect to expected personnel problems no
such size effects can be discerned. Since our data does not allow us to differentiate
between alternative channels by which works councils affect absence behaviour and
its consequences, the issue of whether the relationship varies systematically with firm
size remains a topic for future research.
Because the WCA has been in force in western Germany since 1952 and only became
applicable to the eastern part of the country after re-unification (in 1990), we also split
our sample along this regional dimension. For both components of absence behaviour
– incidence and annual duration – we find quantitatively stronger effects in western
Germany than for the whole of the country. For eastern Germany, the estimated
coefficients of interest are insignificant. As regards expected personnel problems due
to absence, the estimated marginal effect for the eastern German sample is about
20% smaller than the effect for western Germany. These findings are consistent with
results which document changes in the impact of works councils over the duration of a
council’s lifetime (cf. Jirjahn et al., 2011, Mueller and Stegmaier, 2014) because works
councils in East Germany may not have existed for long enough to fully unfold their
properties. Since information on a works council’s age is not available in the SOEP,
and only for newly-founded councils in the LIAB in the period under investigation, it
is, however, impossible to analyse further the learning hypothesis with regard to the
observed regional differences.
Our estimates presented thus far are based on a sample which excludes the public
sector, when narrowly defined. We also consider samples with a more strictly defined
private sector.14 The results from the full sample (Tables 3.1 and 3.2) also hold in
these subsamples (see Table 3.8). Hence, we can rule out the possibility that the
council impact is actually a public sector effect.
Furthermore, we can look at a sample based on the SOEP data which does not in-
14In particular, in the SOEP, we also exclude the employees claiming to work in the somewhatvaguely-defined ‘public sector’ and not only those respondents who state that they are membersof the public administration or civil servants (‘Beamte’). In the LIAB data, we identify the publicsector (apart from the industry classifications) using information on whether at least one civil servant(‘Beamter’) works in the plant, whether it is publicly owned, whether the budget volume is statedinstead of turnover, and whether the legal form of the plant is a public corporation.
46

clude employees who are long-term ill and whose sick pay will therefore be financed
by the mandatory health insurance. Hence, the financial consequences for firms are
different for long-term than for shorter absence periods. Moreover, the same is true
for employees because the level of sick pay is lower for long-term absentees. Finally,
Ose (2005) hypothesises that short-term absences are more likely to be voluntary and
responsive to economic incentives than longer periods of absence. These arguments
indicate that the effects of works councils on absence behaviour may differ with the
duration of absence. The estimated coefficient of the works council dummy in the
incidence equation when excluding long-term ill becomes larger (not documented in
Table 3.8), while the magnitude of the coefficient in the duration equation drops by
about one-third, relative to the sample which includes the long-term ill. Both esti-
mated coefficients remain highly significant. Hence, the works council effect is neither
driven by nor systematically related to long-term absence periods.
With regard to expected personnel problems, in the wave 2006 of the LIAB we can dif-
ferentiate between works councils that are characterised by the management as either
hostile or pragmatic on the one hand or as management-friendly on the other hand.
We find that the effects on personnel problems due to absence are more pronounced
and larger for hostile or pragmatic works councils, while they are insignificant for
management-friendly councils. Pfeifer (2014b) obtains comparable findings for the
first type of council, but also observes a significantly positive effect for management-
friendly works councils.
Finally, we look at potential gender differences (cf. Leigh, 1983, Vistnes, 1997, Ose,
2005). Using SOEP data, we observe that both the marginal effect and the level of
significance are higher for females than for males with regard to absence incidence. In
contrast, the size of the effect for the annual duration of absence is similar for males
and females with reduced significance, mostly due to the smaller sample sizes. Sim-
ilarly, in the LIAB, an increase in the share of female employees does not affect the
marginal effect of the works council variable along its distribution. Consequently, the
relationship between works councils and sickness absence does not exhibit a clear-cut
gender-specific component.
3.5.3 Difference-in-differences models
To get closer to a causal interpretation and to shed some light on reversed causality and
selection issues, we subsequently present the findings from DiD models (cf. equation
(3.2)). Using individual data (SOEP), we obtain significant effects with respect to the
47

incidence of absence for western Germany (see Table 3.3).15 We observe 326 changes
into (159 movers, 167 stayers) and 288 changes out of works council coverage (161
movers, 127 stayers). Both DiD samples are reasonably representative of the full
sample with respect to covariates.
Table 3.3: DiD models of absence incidence for western Germany (pooled Probit)
Stayer and mover Stayer Mover
In Out In Out In Out
(1) (2) (3) (4) (5) (6)
Treatment group 0.121 0.023 0.064 -0.117 0.211# 0.194(0.085) (0.085) (0.119) (0.123) (0.129) (0.135)
Marginal effect 0.044 0.008 0.023 -0.042 0.072# 0.068
Works council 0.171# 0.027** -0.065(0.010) (0.137) (0 .173)
No works council -0.174* -0.084 -0.296*(0.10) (0.139) (0.156)
Marginal effect 0.061# -0.063* 0.097** -0.030 -0.022 -0.103*
Control variables Yes Yes Yes Yes Yes YesN. of obs. 2,530 5,133 1,652 4,053 878 1,080Pseudo-R2 0.074 0.061 0.088 0.062 0.110 0.100
Source: Own calculations from SOEP long v29. Note: Standard errors clustered at the individuallevel in parentheses. Control variables: as in Table 3.5; Significance levels: # p < 0.15, * p < 0.10,** p < 0.05.
As regards changes into the council status, the estimated parameter is at the edge
of significance in the full sample (combining movers and stayers) with a p-value of
0.100 (column 1). This change comes along with an increase in absence incidence of
about six percentage points. When focussing on changes out of works council status in
the full sample (column 2) we obtain a similarly-sized, significant marginal effect (6.3
percentage points). A more detailed look at separate stayer and mover subsamples
offers additional insights. We find a highly significant works council effect for the
introduction of a works council (stayer, into works council) of almost ten percentage
points (column 3). In contrast, there is no evidence for reversed causality, since
employees in plants in which a works council is introduced (treatment group) are not
characterised by a significantly higher sickness incidence before its introduction. As
15We find qualitatively similar yet slightly less statistically significant results for the annual dura-tion of absence which are, however, sensitive to the exclusion of outliers.
48

regards the dissolution of a works council (stayer, out of works council), we neither
find a significant treatment effect (no works council), nor evidence indicating reversed
causality (column 4). These results are consistent with our expectations that there
will only be an effect due to the introduction, but not because of the abolition, of
a works council. Turning to the smaller mover sample, we do not find a significant
works council effect for those respondents coming to a plant with a works council
(column 5). Moreover, there is some evidence that absence-prone individuals select
themselves into plants with works councils (p-value 0.102). Finally, looking at those
employees who leave a plant with a works council (mover, out of works council), we
observe a significant treatment effect (no works council) amounting to more than ten
percentage points (column 6), while the selection effect is positive yet insignificant.
Taken together, there is some evidence for treatment effects from works councils on
individual sickness absence incidence for western Germany. Hence, our results can,
with due care, be interpreted causally. A caveat is that the applied DiD models can
only wipe out group-specific time invariant heterogeneity between the treatment and
control group, while individual heterogeneity is not accounted for. But the fact that
we observe a strong effect for the introduction, but not for the abolition of a works
council, makes us quite confident that we capture a genuine works council effect.
Furthermore, there are weak signs of selection by more absence-prone employees into
plants with a works council and no evidence of reversed causality for the introduction
(abolition) of works councils in firms with already high (low) absence incidence. We
interpret this as evidence that the positive correlation in the pooled models is neither
fully driven by self-selection, nor by reversed causality. However, these findings are
restricted to western Germany and individual data. With regard to the expectation
of personnel problems due to high absence rates within the following two years, we
do not find evidence that the adoption of a works council alters these perceptions.
This might, inter alia, be due to the small number of cases in which works council
are adopted or abolished (234 (0.48%) adoptions and 241 (0.45%) abolitions of works
councils in our sample).
3.6 Summary
We have identified a gap in the literature on the economic effects of non-union repre-
sentation in Germany, namely the impact of works councils on sickness-related absence
and its consequences for plants. Using individual and linked employer-employee data,
we find that employees working in a plant with a works council are more than three
49

and a half percentage points more likely to be absent and to miss over one day per
year more than those working in a plant without such an institution. Furthermore,
the probability that personnel problems due to high absence rates are expected is ap-
proximately three percentage points higher in plants in which a works council exists.
When looking at various subgroups, these findings can basically be confirmed. As an
exception, both individual-level and linked employer-employee data suggest that the
relationship between works councils and absence is stronger in the western part of
Germany. Consistent with these results, we also obtain some evidence which allows
us to interpret the correlation between works councils and the incidence of absence
causally for western Germany using the SOEP data.
We can tentatively conclude that works councils increase sickness absence. In ad-
dition, the findings with regards to personnel problems suggest that works council
cannot compensate for the higher absence rates through higher productivity. Conse-
quently, non-union representation of employees in Germany via works councils does
not appear to benefit firms via its impact on sickness-related absence, but rather seems
to help employees at the expense of their employers. However, our data does not allow
us to determine how this effect comes about. The scrutiny of the channels by which
works councils influence absence behaviour and resulting personnel problems remains
a topic for future research.
50

3.7 Appendix
Table 3.4: Descriptive statistics (SOEP)
Variable Mean Standard deviation Min. Max.
Sickness absence (incidence) 0.582 0.493 0 1Sickness absence (annual duration) 9.236 23.998 0 365Works council 0.624 0.484 0 1Age 41.254 10.802 18 65Disabled 0.059 0.236 0 1Female 0.438 0.496 0 1Foreigner 0.09 0.286 0 1Married 0.583 0.493 0 1Partner 0.228 0.42 0 1Immigrant 0.182 0.386 0 1Bad health 0.105 0.306 0 1Good health 0.587 0.492 0 1Apprentice certificate 0.734 0.442 0 1Abitur 0.267 0.442 0 1University degree 0.198 0.399 0 1Children 0.306 0.461 0 1Satisfaction with health 7.02 2.004 0 10Log gross monthly income 7.615 0.7 3.448 10.161Part-time 0.173 0.378 0 1Temporary contract 0.12 0.326 0 1Apprentice 0.04 0.197 0 1Marginally employed 0.029 0.169 0 1Autonomy in job 2.524 1.152 0 5Blue collar worker 0.345 0.475 0 1Public sector 0.185 0.388 0 15-19 employees 0.169 0.375 0 120-99 employees 0.217 0.412 0 1100-199 employees 0.112 0.316 0 1200-1999 employees 0.258 0.438 0 1≥ 2000 employees 0.243 0.429 0 1Tenure (< 1 year) 0.114 0.317 0 1Tenure (≥ 1 & < 3 years) 0.154 0.361 0 1Tenure (≥ 3 & < 5 years) 0.118 0.322 0 1Tenure (≥ 5 & < 10 years) 0.194 0.395 0 1Tenure (≥ 10 & < 15 years) 0.144 0.351 0 1Tenure (≥ 15 & < 20 years) 0.1 0.3 0 1Tenure (≥ 20 years) 0.177 0.382 0 1Unempl. rate in state 8.921 3.98 3.8 19.7
Note: Each variable has 15,778 observations from 10,147 individuals in 2001, 2006 and 2011.Source: Own Calculations from SOEP long v29; Survey weights are used.
51

Table 3.5: Pooled sickness absence estimations (SOEP)
Absence Incidence Absence duration
Probit OLSCoeff. Coeff. SE
Works council 0.099*** 0.03 1.227** 0.479Age -0.038*** 0.008 -0.299* 0.168Age2 0.0002*** 0.0001 0.004* 0.002Disabled 0.282*** 0.053 6.534*** 1.574Female 0.232*** 0.031 1.228** 0.517Foreigner 0.047 0.056 1.598* 0.918Married 0.069** 0.034 0.179 0.65Partner 0.101*** 0.035 0.079 0.582Immigrant -0.003 0.039 -0.019 0.647Bad health 0.291*** 0.047 12.494*** 1.385Good health -0.172*** 0.028 -2.061*** 0.403Apprentice certificate 0.005 0.031 0.335 0.489Abitur 0.079** 0.033 -1.048** 0.492University degree -0.067* 0.039 -1.163* 0.595Children 0.064* 0.033 -0.077 0.542Children*Female -0.025 0.048 0.157 0.809Satisfaction with health 0-2 (base) (base)Satisfaction with health 3-4 -0.034 0.087 -20.958*** 3.923Satisfaction with health 5-6 -0.15* 0.086 -21.695*** 3.887Satisfaction with health 7-8 -0.232*** 0.087 -23.671*** 3.825Satisfaction with health 9-10 -0.455*** 0.09 -24.747*** 3.814Log gross monthly income 0.128*** 0.029 -0.399 0.543Part-time -0.142** 0.038 -1.706** 0.743Temporary contract -0.016 0.045 -1.468** 0.639Apprentice 0.044 0.091 0.474 1.251Marginally employed -0.698*** 0.083 -6.894*** 1.48Autonomy in job -0.081*** 0.018 -0.521 0.351Blue collar worker -0.013 0.035 1.773*** 0.681Public sector 0.108*** 0.033 1.519*** 0.5775-19 employees (base) (base)20-99 employees -0.004 0.036 0.975* 0.574100-199 employees -0.05 0.045 0.924 0.773200-1999 employees 0.011 0.04 0.884 0.636≥ 2000 employees 0.044 0.042 1.452** 0.672Tenure (< 1 year) (base) (base)Tenure (≥ 1 & < 3 years) 0.079 0.042 0.019 0.693Tenure (≥ 3 & < 5 years) 0.094 0.046 0.555 0.797Tenure (≥ 5 & < 10 years) 0.091 0.043 -0.005 0.784Tenure (≥ 10 & < 15 years) 0.115 0.046 0.86 0.868Tenure (≥ 15 & < 20 years) 0.029 0.051 0.987 1.01Tenure (≥ 20 years) 0.062 0.051 0.065 1.005Unemployment rate in state -0.016 0.009 -0.17 0.23N. of obs. 15,778 15,778N. of clusters 10,147 10,147Pseudo-R2 / R2 0.058 0.1095
Source: Own calculations from SOEP long v29. Note: Standard errors clusteredat the individual level in parentheses. Constant, regional, industry and yeardummies included but not shown; Significance levels: * p < 0.10, ** p < 0.05,*** p < 0.01. 52

Table 3.6: Descriptive statistics (LIAB)
Variable Mean Std. Dev. Min Max
Personnel problems due to high absence rates 0.14 0.33 0 1Works council 0.5 0.5 0 1Type of works council: Hostile or pragmatic** 0.37 0.51 0 1Type of works council: Management-friendly ** 0.1 0.27 0 1Collective bargaining agreement (CBA) 0.57 0.49 0 1Share of female employees 0.44 0.29 0 1Share of foreign employees 0.07 0.1 0 1Tenure dummies(≥ 1 & < 3, ≥ 3 & < 5, ≥ 5 & < 10, ≥ 10 & < 15, ≥ 15 & < 20, ≥ 20)Mean employee age 40.75 4.61 19.01 62.75Std. deviation employee age 10.82 1.93 0.95 20.03Share of non-social security employees 0.14 0.18 0 1Share of apprentices 0.05 0.09 0 1Share of skilled employees 0.59 0.26 0 1Share of high-skilled employees 0.09 0.15 0 1Share of blue collar workers 0.35 0.31 0 1Share of part-time employees 0.25 0.25 0 1Mean of gross daily wages (censored) 72.85 31.81 1.19 178.04Share of employees at social security contribution limit 0.06 0.11 0 1Orientation to a CBA 0.18 0.38 0 1Plants with a wage cushion 0.33 0.47 0 1Share of vacancies 0.02 0.05 0 1Share of temporary workers 0.06 0.13 0 1Churning rate (hires and quits over growth) 0.05 0.17 0 13.01Any investment activity in the last year 0.77 0.42 0 1Modern technical assets 0.73 0.44 0 1Firm age (in years up to 1990) 16.66 5.73 0 20New firm (after 1990) 0.27 0.45 0 1Public ownership 0.07 0.26 0 1Foreign ownership 0.08 0.27 0 1Single firm 0.59 0.49 0 1Limited firm (0: Private partnership 1: Limited firm 2: Other type) 0.96 0.58 0 2Sum of all personnel problems 1.56 1.34 0 9Standard weekly working time* 38.55 2.29 4 66Log. of total investments* 9.91 5.75 0 21.08Share of expansion investments* 0.23 0.33 0 1Share of exports* 0.14 0.26 0 1Firm-sponsored training* 0.77 0.42 0 1Overtime dummy* 0.77 0.42 0 1Rising turnover outlook* 0.34 0.47 0 1Rising employment outlook* 0.19 0.39 0 1Performance-related pay exists* 0.28 0.45 0 1Regional unemployment rate 9.89 4.51 1.64 31.33Region dummy variables (10 regions in Germany)Industry classification (Nace-1; 9 industries)Firm size dummies (5-19, 20-99, 100-199, 200-1999, 2000+)Year dummies
Source: LIAB QM2 9310, Waves 2000, 2004, 2006, 2008, 2010. Own calculations using controlled remotedata acces (FDZ). Note: 43,444 observations in 21,453 plants; * 23,916 observations in 12,744 plants; ** 8,711observations and plants in 2006. Means and standard deviations weighted by employee-representative weights.
53
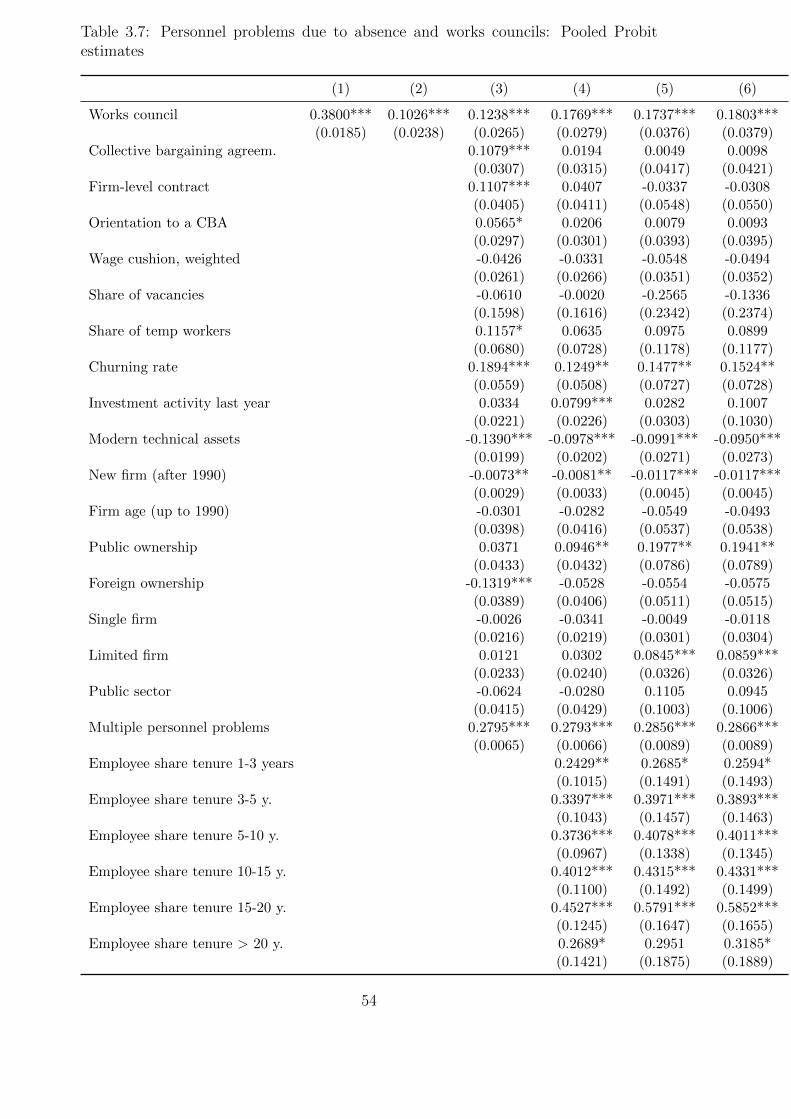
Table 3.7: Personnel problems due to absence and works councils: Pooled Probitestimates
(1) (2) (3) (4) (5) (6)
Works council 0.3800*** 0.1026*** 0.1238*** 0.1769*** 0.1737*** 0.1803***(0.0185) (0.0238) (0.0265) (0.0279) (0.0376) (0.0379)
Collective bargaining agreem. 0.1079*** 0.0194 0.0049 0.0098(0.0307) (0.0315) (0.0417) (0.0421)
Firm-level contract 0.1107*** 0.0407 -0.0337 -0.0308(0.0405) (0.0411) (0.0548) (0.0550)
Orientation to a CBA 0.0565* 0.0206 0.0079 0.0093(0.0297) (0.0301) (0.0393) (0.0395)
Wage cushion, weighted -0.0426 -0.0331 -0.0548 -0.0494(0.0261) (0.0266) (0.0351) (0.0352)
Share of vacancies -0.0610 -0.0020 -0.2565 -0.1336(0.1598) (0.1616) (0.2342) (0.2374)
Share of temp workers 0.1157* 0.0635 0.0975 0.0899(0.0680) (0.0728) (0.1178) (0.1177)
Churning rate 0.1894*** 0.1249** 0.1477** 0.1524**(0.0559) (0.0508) (0.0727) (0.0728)
Investment activity last year 0.0334 0.0799*** 0.0282 0.1007(0.0221) (0.0226) (0.0303) (0.1030)
Modern technical assets -0.1390*** -0.0978*** -0.0991*** -0.0950***(0.0199) (0.0202) (0.0271) (0.0273)
New firm (after 1990) -0.0073** -0.0081** -0.0117*** -0.0117***(0.0029) (0.0033) (0.0045) (0.0045)
Firm age (up to 1990) -0.0301 -0.0282 -0.0549 -0.0493(0.0398) (0.0416) (0.0537) (0.0538)
Public ownership 0.0371 0.0946** 0.1977** 0.1941**(0.0433) (0.0432) (0.0786) (0.0789)
Foreign ownership -0.1319*** -0.0528 -0.0554 -0.0575(0.0389) (0.0406) (0.0511) (0.0515)
Single firm -0.0026 -0.0341 -0.0049 -0.0118(0.0216) (0.0219) (0.0301) (0.0304)
Limited firm 0.0121 0.0302 0.0845*** 0.0859***(0.0233) (0.0240) (0.0326) (0.0326)
Public sector -0.0624 -0.0280 0.1105 0.0945(0.0415) (0.0429) (0.1003) (0.1006)
Multiple personnel problems 0.2795*** 0.2793*** 0.2856*** 0.2866***(0.0065) (0.0066) (0.0089) (0.0089)
Employee share tenure 1-3 years 0.2429** 0.2685* 0.2594*(0.1015) (0.1491) (0.1493)
Employee share tenure 3-5 y. 0.3397*** 0.3971*** 0.3893***(0.1043) (0.1457) (0.1463)
Employee share tenure 5-10 y. 0.3736*** 0.4078*** 0.4011***(0.0967) (0.1338) (0.1345)
Employee share tenure 10-15 y. 0.4012*** 0.4315*** 0.4331***(0.1100) (0.1492) (0.1499)
Employee share tenure 15-20 y. 0.4527*** 0.5791*** 0.5852***(0.1245) (0.1647) (0.1655)
Employee share tenure > 20 y. 0.2689* 0.2951 0.3185*(0.1421) (0.1875) (0.1889)
54
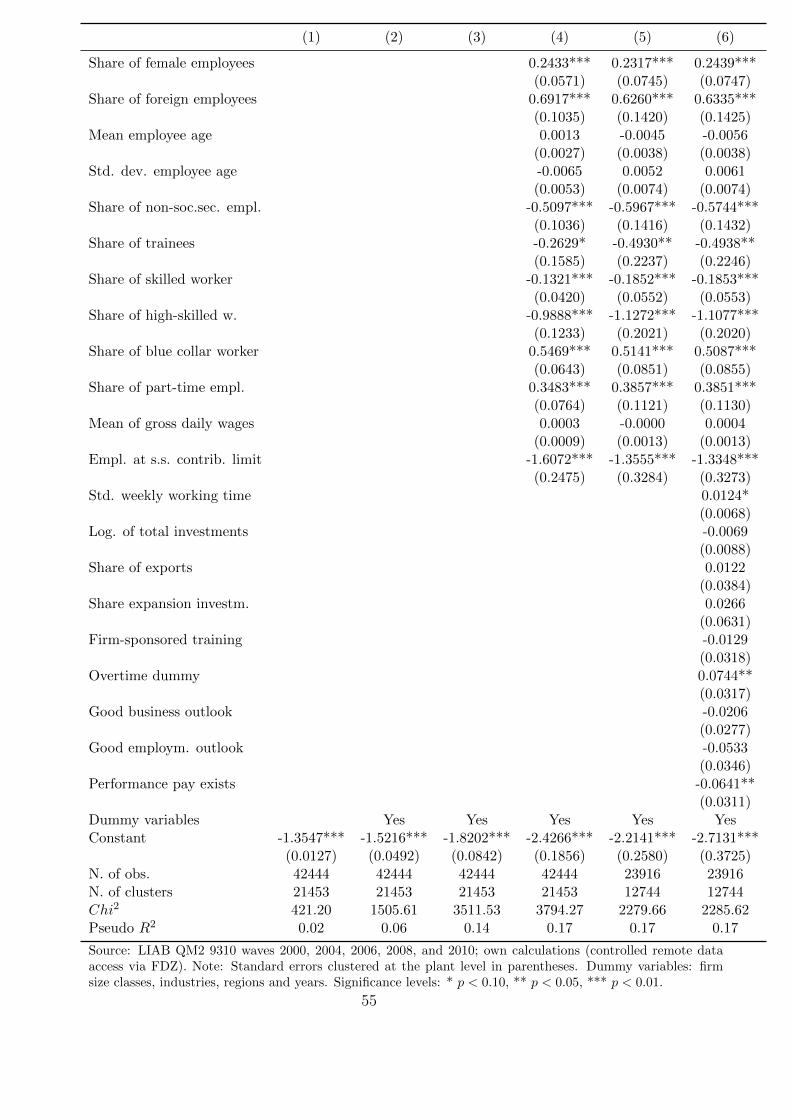
(1) (2) (3) (4) (5) (6)
Share of female employees 0.2433*** 0.2317*** 0.2439***(0.0571) (0.0745) (0.0747)
Share of foreign employees 0.6917*** 0.6260*** 0.6335***(0.1035) (0.1420) (0.1425)
Mean employee age 0.0013 -0.0045 -0.0056(0.0027) (0.0038) (0.0038)
Std. dev. employee age -0.0065 0.0052 0.0061(0.0053) (0.0074) (0.0074)
Share of non-soc.sec. empl. -0.5097*** -0.5967*** -0.5744***(0.1036) (0.1416) (0.1432)
Share of trainees -0.2629* -0.4930** -0.4938**(0.1585) (0.2237) (0.2246)
Share of skilled worker -0.1321*** -0.1852*** -0.1853***(0.0420) (0.0552) (0.0553)
Share of high-skilled w. -0.9888*** -1.1272*** -1.1077***(0.1233) (0.2021) (0.2020)
Share of blue collar worker 0.5469*** 0.5141*** 0.5087***(0.0643) (0.0851) (0.0855)
Share of part-time empl. 0.3483*** 0.3857*** 0.3851***(0.0764) (0.1121) (0.1130)
Mean of gross daily wages 0.0003 -0.0000 0.0004(0.0009) (0.0013) (0.0013)
Empl. at s.s. contrib. limit -1.6072*** -1.3555*** -1.3348***(0.2475) (0.3284) (0.3273)
Std. weekly working time 0.0124*(0.0068)
Log. of total investments -0.0069(0.0088)
Share of exports 0.0122(0.0384)
Share expansion investm. 0.0266(0.0631)
Firm-sponsored training -0.0129(0.0318)
Overtime dummy 0.0744**(0.0317)
Good business outlook -0.0206(0.0277)
Good employm. outlook -0.0533(0.0346)
Performance pay exists -0.0641**(0.0311)
Dummy variables Yes Yes Yes Yes YesConstant -1.3547*** -1.5216*** -1.8202*** -2.4266*** -2.2141*** -2.7131***
(0.0127) (0.0492) (0.0842) (0.1856) (0.2580) (0.3725)N. of obs. 42444 42444 42444 42444 23916 23916N. of clusters 21453 21453 21453 21453 12744 12744Chi2 421.20 1505.61 3511.53 3794.27 2279.66 2285.62Pseudo R2 0.02 0.06 0.14 0.17 0.17 0.17
Source: LIAB QM2 9310 waves 2000, 2004, 2006, 2008, and 2010; own calculations (controlled remote dataaccess via FDZ). Note: Standard errors clustered at the plant level in parentheses. Dummy variables: firmsize classes, industries, regions and years. Significance levels: * p < 0.10, ** p < 0.05, *** p < 0.01.
55

Table 3.8: Overview of robustness checks and effect heterogeneity
NegBin ZINB 20-200 employeesDuration Duration Incidence Duration Personnel Probl.
Works council 0.122** 0.071 0.103*** 0.789 0.217***(0.049) (0.047) (0.042) (0.736) (0.032)
Works council -0.175***(Inflate equation) (0.060)Marginal effect 1.141** 1.134*** 0.038*** 0.040***
(0.462) (0.426) (0.155) (0.006)
N 15,778 15,778 5,154 5,154 20,500
West-Germany East-GermanyIncidence Duration Personnel probl. Incidence Duration Personnel probl.
Works Council 0.131*** 1.67*** 0.291*** 0.022 0.122 0.278**(0.035) (0.569) (0.031) (0.059) (0.863) (0.048)
Marginal Effect 0.048*** 0.052*** 0.008 0.039**(0.127) (0.006) (0.022) (0.006)
N 12,091 12,091 27,599 3,687 3,687 14,845
Narrowly defined private sector Non-longterm ill WC-Management relationIncidence Duration Personnel probl. Duration Coeff. Marg. eff.
Works council 0.108*** 1.329*** 0.296*** 0.784***(0.032) (0.512) (0.029) (0.273)
Marginal effect 0.040*** 0.048***(0.012) (0.005)
Hostile or 0.3288*** 0.0480***pragmatic WC (0.0635) (0.0096)Management 0.1005 0.0127friendly WC (0.0809) (0.0106)
N 12,724 12,724 34,922 15,778 8,711
Females Males Share of femalesIncidence Duration Incidence Duration Personnel. probl.
Works council 0.132*** 1.173* 0.064 1.142* 0.323***(0.044) (0.684) (0.041) (0.663) (0.0400)
Marginal effect 0.046*** 0.024(0.015) (0.015)
Share of 0.296***female employees (0.0648)Interaction effect -0.079
(0.0715)
N 7,062 7,062 8,716 8,716 42,444
Source (Incidence and Duration): SOEP long v29; own calculations. Note: Standard errors clustered onthe individual level. All estimated coefficients rely on control variables used in Table A2.Source (Personnel Problems): LIAB QM2 9310 waves 2000, 2004, 2006, 2008, and 2010 (2006 only forworks council type); own calculations (controlled remote data access via FDZ). Note: All estimatedcoefficients rely on control variables used in specification (4) from Table A4; Standard errors clustered atthe plant level in parentheses, where possible. Else: robust standard errors.Significance levels: * p < 0.10, ** p < 0.05, *** p < 0.01.
56

Part II
SICKNESS PRESENTEEISM
57


Chapter 4
Determinants of the annual
duration of sickness presenteeism
Sickness presenteeism, i.e. going to work while sick, causes substantial productivity
losses. Focusing on work-related characteristics, we investigate the determinants of the
annual duration of sickness presenteeism using European cross-sectional data. We find
work autonomy, workload, tenure and the work environment to be the quantitatively
most relevant determinants of sickness presenteeism days. Work autonomy (control
over one’s work, being supervisor), workload (weekly working hours, time pressure)
and tenure are positively related to the number of sickness presenteeism days. In
contrast, a good work environment (good working conditions and social support) is
associated with fewer presenteeism days.
59

4.1 Introduction
Employee sickness has substantial economic implications for firms and employees, not
only in form of sickness absence but also through sickness presenteeism behaviour.
While there is a lot of research on the determinants of sickness absence behaviour,
less is known about sickness presenteeism, i.e. the case where employees come to work
while sick. Neither in terms of productivity, nor in terms of the employee’s health is
it clear whether an employee should stay at home or go to work when sick. While it is
safe to say that employees are less productive when they work whilst sick compared to
when they are healthy (see Schultz and Edington, 2007 for a survey on this issue), the
size of this effect is job and sickness specific (Pauly et al., 2008). Additionally, there
is the possibility that presentees spread their illness to other employees with further
negative repercussions on firm productivity (Barmby and Larguem, 2009). Turning to
the health effects, there is evidence for a negative impact on presentees’ future general
health (Bergstrom et al., 2009) and for more sickness absence at a later date (Hansen
and Andersen, 2009). Nevertheless in some cases it might be better for the recovery
and rehabilitation of the employee – if the job and the sickness allows – to come to
work when sick (Markussen et al., 2012). Notwithstanding the economic comparison
between the two sickness states, we argue that sickness presenteeism is economically
relevant and hence it is worthwhile to further investigate its determinants.
While there is already some knowledge about the incidence of individual sickness pre-
senteeism behaviour (Aronsson et al., 2000; Aronsson and Gustafsson, 2005; Bockerman
and Laukkanen, 2009, 2010; Leineweber et al., 2011; Preisendorfer, 2010) and its fre-
quency (Johansson and Lundberg, 2004; Hansen and Andersen, 2008), there is a lack
of studies investigating the annual duration of sickness presenteeism. This is a de-
plorable lack of knowledge since the (direct) impact of presenteeism on productivity
depends much more on the annual duration than on its incidence or frequency. Hence,
in this chapter, we tentatively answer the following question with cross-sectional cor-
relations: what are the quantitatively most important work-related determinants of
the annual duration of sickness presenteeism? We contribute to the literature by
using the annual duration of sickness presenteeism as dependent variable, which is
more relevant for the economic effects of sickness presenteeism than its frequency or
incidence. Furthermore, we use the European Working Conditions Survey (EWCS),
the first large-scale dataset on sickness presenteeism outside Scandinavia, covering 34
European countries. Hence, our findings have better external validity and are not
confined to the institutionally specific cases of Scandinavian countries with their gen-
erous welfare states, active labour market policies, and bold social norms. We find
60

that presenteeism is a widespread phenomenon with more than 35 percent of Euro-
pean employees going to work whilst sick at least once during 12 months, amounting
to an average of 2.4 sickness presenteeism days per year.
In count data models and controlling for health status, we find work autonomy, work-
load, tenure and the work environment to be the quantitatively most relevant work-
related determinants of sickness presenteeism days in Europe. Work autonomy, work-
load and tenure are positively related to the number of sickness presenteeism days,
while a good working environment comes along with less presenteeism.1 Besides the
positive linear tenure effect on presenteeism days, we observe significantly less pre-
senteeism in the first year of an employment relationship. While we are, to the best
of our knowledge, the first to investigate the relationship between tenure and pre-
senteeism, our significant and positive result for work autonomy is in contrast to an
insignificant finding for presenteeism frequency in Denmark (Hansen and Andersen,
2008). This result shows that sickness presenteeism behaviour is different outside
Scandinavia and hence merits further investigation. Our results for workload and the
work environment are in line with the literature. While work autonomy and workload
lead in terms of economic significance, the other two factors are not far apart. The
effect of the working environment on sickness presenteeism is increased particularly
when combining direct and indirect, health mediated effects. Regarding the other
determinants, we mostly confirm the picture presented in the literature: health status
is the most important determinant of sickness presenteeism followed by work-related
factors and sociodemographics. The main results are robust to the application of OLS
models and to using a more homogeneous subsample comprising EU member states.
The rest of this chapter develops as follows: Section 4.2 discusses the related litera-
ture, Section 4.3 delivers detailed descriptions of the data, while Section 4.4 contains
the empirical strategy and presents the main results. Finally, Section 4.5 contains
robustness checks, and Section 4.6 concludes.
1We capture work autonomy with a control over work index and supervisory status. Workloadis measured by weekly working hours and a subjective measure of time pressure. Job tenure is notonly measured in years but also by an additional new job dummy for the first year of tenure. A goodwork environment is characterized by satisfaction with the working conditions and by support fromcolleagues and management.
61

4.2 Related literature
The literature on sickness presenteeism is dominated by empirical studies from social
medicine.2 These studies mostly use binary variables to measure sickness presenteeism
taken from North European data, and hence neglect its annual duration. Aronsson et
al. (2000) find that employment in so-called human service jobs and a low replaceabil-
ity are highly correlated to the incidence of presenteeism in a Swedish cross-sectional
sample. In a follow-up study, Aronsson and Gustafsson (2005) present workload and
control over work pace as additional determinants. Bockerman and Laukkanen (2009)
find in a small Finnish cross-sectional sample of union members that the incidence of
presenteeism is much more sensitive to working time arrangements than absenteeism,
particularly to the number of weekly working hours, shift work and the mismatch
between actual and desired working hours. In a follow up study, they show that the
effect of working time mismatch is mostly driven by employees with a poor health
status (Bockerman and Laukkanen, 2010). Preisendorfer (2010) uses a very small
German sample and finds a positive relationship between fear of job loss and presen-
teeism incidence.
Furthermore, there are two studies that adjust only for some of the confounding
factors when investigating determinants of presenteeism, which in turn increases the
likelihood of omitted variable bias. In this vein, Leineweber et al. (2011) find that sup-
port from colleagues and supervisors as well as low autonomy are positively related
to presenteeism using data from Swedish police officers but control only for either
age, gender or supervisor status. Biron et al. (2006) look at the share of presenteeism
days in relationship to the sum of presenteeism and absenteeism days in a Cana-
dian public sector sample. While controlling only for age, gender and occupational
grade as confounders, they report workload, contract type, and work autonomy to be
the most relevant determinants. Additionally, Biron et al. (2006) present reasons for
presenteeism given by their respondents. Workload comes first (32 %), followed by
professionalism and guilt feelings (27 %). Less important are an insufficient severity
of the illness (15%), a lack of replacement (13 %) and fear from negative repercussions
(10 %). Caverley et al. (2007) report similar findings for a Canadian public sector
organization with 40 % claiming workload and deadlines to be the reason for their
presenteeism behaviour.
2Besides the empirical literature there are two theoretical papers. Brown and Sessions (2004)include presenteeism in the Barmby et al. (1994) absenteeism framework. Chatterji and Tilley(2002) take negative productivity externalities from presenteeism as explanation for voluntary supramandatory sick pay packages offered by employers.
62

Besides the empirical investigations with direct measures of presenteeism, there are
two contributions by Bierla et al. (2011, 2013) in which they infer presenteeism be-
haviour from absence data. They assume that the excess zeros in a zero-inflated neg-
ative binomial model capture presenteeism behaviour since these individuals follow a
‘never absent rule’. Excess zeros are a binary event and hence this paper investigates
at best the incidence of presenteeism. They find that higher responsibility and the
team manager’s presenteeism probability are positively related to presenteeism. These
investigations offer in our opinion an interesting look at the joint decision on sickness
absence and presence behaviour but rest upon a highly speculative assumption with
regard to presenteeism.
While there is, to the best of our knowledge, no study with data on the annual duration
of sickness presenteeism, two Scandinavian studies analyse its frequency. Johansson
and Lundberg (2004) find in a cross-sectional sample from Stockholm (n=4924) that
control over work effort, called adjustment latitude, is not significantly related to pre-
senteeism frequency, while attendance requirements are positively related to presen-
teeism. There are several differences to our study. First, they exclude all respondents
that report neither absence nor presence behaviour since they want to investigate the
decision between absence and presence behaviour (’illness flexibility’). This sample
selection could lead to biased estimates if the excluded observations are systematically
related to the explanatory variables, which is quite likely. Second, their dependent
variable is measured in vaguely defined four ordinal categories (never, once, a few
times, many times). Finally, controlling only for age, health, financial situation and
family means that the authors do not convincingly address potential omitted variable
bias.
Hansen and Andersen (2008) investigate presenteeism frequency in a large cross-
sectional data set from Denmark (12,000 observations). They present time pressure
and a good relationship with colleagues as the most relevant work-related determi-
nants for the frequency of sickness presenteeism, which is in line with our findings. In
contrast to our results they find a significant impact of firm size while finding none
for work autonomy. When we estimate a model that allows for a different autonomy
effect in northern Europe, we find that work autonomy is insignificantly related to
presenteeism in northern Europe while remaining significant and positive in the other
countries, which might be due to institutional differences. Tenure and satisfaction
with working conditions, which are among the relevant determinants in our study,
are not looked at by Hansen and Andersen (2008). But there are also methodological
differences to our study: Hansen and Andersen (2008) utilize arbitrarily set categories
63

to measure the frequency of presenteeism, while we measure the annual duration more
precisely in days per year. Furthermore, we disregard normative attitudes towards
sickness absence as explanatory variables due to endogeneity concerns, since we argue
that these attitudes are quite likely determined by actual presenteeism behaviour.
In contrast, we focus on work-related factors because they are more relevant than
personal circumstances from a policy and management perspective.
4.3 Data
For our investigations, we use the 2010 wave of the European Working Conditions Sur-
vey (EWCS), a repeated cross-sectional survey on working conditions in Europe. The
EWCS is conducted every 5 years by the European Foundation for the Improvement
of Living and Working Conditions, an agency of the European Union, and profits from
a single questionnaire which guarantees consistent data across countries. In 2010, the
EWCS covered for the first and only time an item on sickness presenteeism and is
hence the first large-scale survey about sickness presenteeism outside Scandinavia.
It covers the active population aged 15 and above living in 34 European countries.3
We consider employees aged 18-65 years who have been employed during the last 12
months working at least ten hours per week,4 excluding self-employed, students, ap-
prentices, and employees without work contracts. Since we are not interested in the
presenteeism behaviour of employees with chronic diseases, we disregard observations
with more than 50 sickness presenteeism days in 12 months.5 The number of obser-
vations amounts to 18,953.
We are, to the best of our knowledge, the first to investigate the determinants of the
annual duration of sickness presenteeism. The relevant item reads as follows:“Over
the past 12 months did you work when you were sick? a) Yes b) No. If yes, how many
working days?” This item has advantages compared to the items widely used in the
literature on presenteeism. First of all, the annual duration of sickness presenteeism
is more relevant from an economic perspective than the frequency or the incidence
of sickness presenteeism episodes. Furthermore, asking for the number of sickness
presenteeism days in an open question is less prone to biased responses than offering
predefined frequency categories as done by Hansen and Andersen (2008) and Johans-
3The sample covers all 27 European Union member states, Albania, Croatia, Kosovo, Macedonia,Montenegro, Norway, and Turkey.
4We also disregard employees unrealistically claiming to work more than 80 hours per week. Theresults are not sensitive to the exclusion of either of these two groups of observations.
5This means we disregard a little more than 100 observations. The central results do not dependon this sample selection (see robustness section).
64

son and Lundberg (2004). Furthermore, the item from the EWCS neglects normative
aspects. Here, presenteeism is neither contingent on the judgment that it would have
been better to take sick leave (Aronsson et al., 2000; Johansson and Lundberg, 2004;
Aronsson and Gustafsson, 2005; Bockerman and Laukkanen, 2009, 2010; Leineweber
et al., 2011), nor on the legitimacy of taking sick leave (Hansen and Andersen, 2008).
The descriptive statistics show that sickness presenteeism is a widespread phenomenon
in Europe. During the period under investigation, more than 35 percent of the em-
ployees went to work for at least one day while being sick during the period under
investigation. The average number of days amounts to almost 2.4 (2.9 days if also
including the chronically ill with more than 50 sickness presenteeism days per year).
The conditional mean amounts to more than seven days. The distribution of the
conditional sickness presenteeism days is shown in Figure 4.1.
[Figure 4.1 about here.]
In order to filter the impact of work-related factors in a cross-sectional model, the
choice of covariates is key. We include work-related characteristics as comprehensively
as possible in our model. Our choice is guided by the literature on sickness absence be-
haviour (Frick and Malo, 2008; Puhani and Sonderhof, 2010; Ziebarth and Karlsson,
2010; Livanos and Zangelidis, 2013) and by the literature on sickness presenteeism
(Aronsson et al., 2000; Aronsson and Gustafsson, 2005; Hansen and Andersen, 2008;
Bockerman and Laukkanen, 2009, 2010; Preisendorfer, 2010; Leineweber et al., 2011).
Besides the work-related characteristics, we control for health status and sociodemo-
graphic characteristics.
First, we present the work-related variables, that have been found to be most relevant
for sickness presenteeism, and then turn to the other work-related characteristics.
The former are: work autonomy, workload, job tenure and good work environment.
Work autonomy is captured on the one hand by an index measuring the number of
autonomy dimensions in which the employee has control over work, i.e. work order,
methods and speed, and on the other hand by supervisory status. Workload is mea-
sured in four dimensions: the number of hours usually worked per week, a subjective
indicator asking whether the employee lacks time to get work done (five-point scale),
and two dummy variables indicating whether the employee works in a second job and
whether she works during evenings or weekends (unusual working time). Job tenure
is not only measured in years but also by an additional new job dummy for the first
year of tenure. Finally, the work environment is captured on one side by the satisfac-
tion with the working conditions (five-point scale), and on the other by social support
65

from colleagues and the management, which is here measured by summing up two
five-point scales quantifying whether the respondent is helped and supported from
colleagues and the manager respectively.
The other work-related factors comprise job specific characteristics such as job inse-
curity (five-point scale measuring fear to loose one’e job within 6 months), the annual
net income from the main job (measured in 21 categories), blue collar status, hav-
ing a temporary contract and plant specific characteristics such as the size of the
plant (< 10 employees, 10-49 employees, 50-99 employees, 100-249 employees, ≥250
employees), private sector and industry dummies (modified NACE 17 classification).
Albeit the generosity of sick pay entitlements is crucial for absence behavior (Frick
and Malo, 2008; Puhani and Sonderhof, 2010; Ziebarth and Karlsson, 2010), we prefer
including country dummies as a better way to account for aggregated country differ-
ences (labour market institutions, social norms, health care and other country specific
effects) in cross-sectional data sets.6
[Table 4.1 about here.]
Turning to the sociodemographic variables, we include sex (female=1), having
children, living with a partner, age categories (aged 18-24, 25-34, 35-44, 45-54, and
55-65 years), and educational status (primary, secondary and higher education status).
The most important determinant of presenteeism, health status, is taken into account
by four subjective categories (very good, good, fair and, finally, bad and very bad
in one category) and an objective index measuring the number of different kinds of
health problems from which the respondent has suffered during the last 12 months.7
Descriptive statistics are provided in Table 4.1.
4.4 Econometric investigation
We estimate the relationship between the explanatory variables and the number of
sickness presenteeism days by applying zero-inflated negative binomial regression mod-
6With cross-sectional data, including both, country dummies and sick pay generosity, is notfeasible due to multi-collinearity.
7Regarding the subjective measure, we integrated the two worst categories into one single categorysince only 0.2 percent of the sample claimed to have a very bad health status. The health problemsinclude: hearing problems; skin problems; backache; muscular pain in shoulders, neck and/or upperlimbs; muscular pain in lower limbs; headaches and eyestrain; stomach ache; respiratory difficulties;cardiovascular diseases; injuries; depression or anxiety; overall fatigue; insomnia or general sleepingproblems; other. Using instead dummy variables for each of these health problems did not improvethe fit of the model while leaving the main results unchanged and was hence discarded (resultsavailable upon request).
66

els (ZINB) with cluster adjusted standard errors on the country level. Since our data
consists of non-negative integers of which the large majority is smaller than ten with
a large mass at zero, a count data model is appropriate to describe the data (cf.
Cameron and Trivedi, 1998, pp. 59ff.). Due to overdispersion, i.e. the variance of the
presenteeism days is much larger than its mean, we prefer a negative binomial over a
Poisson distribution. Furthermore, with a significantly positive Vuong test (z-stastics
39.93) we include a zero-inflate part into our model. As a robustness check we present
a simple OLS model in Section 4.5 to make sure that the results are not driven by
the choice of the ZINB model. The econometric model reads as follows:
presenteeism daysi =α0 + work characteristics′iα1 + sociodemographics′iα2
+ health status′iα3 + country′iα4 + εi.
Here, presenteeism daysi indicates the number of days spent at work while being sick
during twelve months for individual i. work characteristicsi, sociodemographicsi
and health statusi represent the different vectors of independent variables. In order
to account for country-specific effects we include country dummies and εi is the error
term. Besides the preferred full model, depicted in Table 4.2, we present in Section
4.5 additionally a model that does not partial out the effects that are mediated by
health, since the overall effect of work-related factors on sickness presenteeism days,
i.e. the direct and indirect health mediated effects taken together, is economically
highly relevant as well.
[Table 4.2 about here.]
We present the count and the inflate part of the ZINB model in column 1 and 2,
while we are more interested in the combined average marginal effects in column 3
with beta-coefficients in squared brackets to capture their economic significance. We
find work autonomy, workload, tenure and the work environment to be the quantita-
tively most relevant work-related determinants of sickness presenteeism days. While
we are the first to investigate tenure in this regard, our significant and positive results
for work autonomy are in contrast to insignificant findings for presenteeism frequency
in Denmark (Hansen and Andersen, 2008). The findings for workload and the work
environment are in line with the literature on presenteeism frequency. The work au-
tonomy index and the usual weekly hours lead in terms of economic significance with
beta coefficients larger than 0.04. The tenure variables and working conditions follow
with beta coefficients around 0.03.
Having more autonomy over one’s work is associated with more presenteeism days
67

mostly due to a significant effect in the inflate part of the model. Having discretion
over work speed, methods and order makes a difference of almost 0.7 days compared to
someone without such autonomy.8 Hence, employees who can control to some extent
their work effort are more likely to come to work albeit sick. A potential explana-
tion could be that they can avoid or postpone the most strenuous part of their work.
More autonomous employees could also be more intrinsically motivated and hence go
to work more often while sick. This result is in line with findings for presenteeism
incidence (Biron et al., 2006; Leineweber et al., 2011), while contrasting insignificant
findings for presenteeism frequency (Johansson and Lundberg, 2004; Hansen and An-
dersen, 2008). Estimating a regional-specific coefficient for North European countries
(Denmark, Norway, Finland and Sweden) with regards to work autonomy shows that
there is no significant relationship between work autonomy and sickness presenteeism
in these countries, while there is one in the rest of Europe, which reconciles the diver-
gent findings (not shown, estimation results available upon request). Whether these
differences are due to different labour market institutions or cultural traits in Scan-
dinavia is an open question for further research. Being supervisor contributes more
than 0.2 additional days which could be explained by more autonomy, but also by
less replaceability and their function as a role model for subordinates. The significant
result for supervisors is in line with findings by Hansen and Andersen (2008) and
driven by the count part of the ZINB model.
There are several dimensions of workload captured in our model which are all posi-
tively associated with sickness presenteeism days. The economically and statistically
most significant dimension is the number of hours usually worked per week. Increasing
weekly hours by twenty, which represents a switch from part to full time employment,
comes along with an additional 0.6 presenteeism days per year. The result for the
subjective measure asking whether the employee lacks time to get her or his work
done points in the same direction and totals 0.11 additional days for an increase of
one unit on the Lickert-scale which represents one standard deviation. Working dur-
ing evenings and weekends could also be a proxy for an onerous workload and adds
0.20 sickness presenteeism days. Here the relationship with colleagues could also play
a role in the sense that employees are, during weekends and evenings, more reluctant
to leave their colleagues alone or to be replaced by a colleague. These results corrob-
orate findings by Hansen and Andersen (2008). Finally, working in two jobs comes
with 0.27 additional days of presenteeism. The significance of the workload variables
8This difference equals three points in the work autonomy index (for each dimension one additionalpoint) which translates to an increase of approximately 0.7 days (0.69 = 3 · 0.23)
68

is brought about by the inflate part of the ZINB model, except for the weekly hours
variable which is significant in both parts.
Regarding tenure, there are two effects on the number of sickness presenteeism days.
Having recently changed the employer (new job) is associated with significantly less
presenteeism, while presenteeism increases with each year of tenure.9 The dummy is
significant in both parts of the ZINB model, whereas the linear tenure effect is fully
driven by the count part. The positive slope could be interpreted with increasing
loyalty and identification with the firm, whereas the negative first year effect is more
puzzling. Reduced presenteeism at the beginning of an employment relationship does
not conform to higher effort in the form of presenteeism during the critical first year
in a job where contracts are often temporary and employees have to gain reputation
among coworkers and management. Furthermore, sick pay eligibility criteria should
push towards more presenteeism during the first year, not less, since sick pay enti-
tlements are, in many European countries, only available after a qualifying period
(cf. European Union, 2012). The fact that young and hence also healthier employees
are more likely to change a job partially explains this story, since the significance of
the new job effect vanishes once we condition our sample on employees aged over 35
(results available upon request). In contrast, the size of the new job effect increases
if conditioning on employees with a poor general health status to directly control for
the better health of younger job changers. Of course, the question remains why only
younger employees exhibit significantly less presenteeism in the first year of an em-
ployment relationship.
Finally, we turn to the working environment which is captured by satisfaction with
one’s working conditions and by the support from colleagues and the management.
Working conditions have a significant impact at the lower bound of the distribution
(inflate part), while social support in the count part of the ZINB model. Increasing
the satisfaction with the working conditions by one standard deviation (0.68 units
on the 4 point Likert Scale) is associated with 0.15 fewer sickness presence days. A
similar change in social support equalling two units on the 8 point Likert Scale has
a value of 0.12 days. The result for social support from colleagues and management
confirms findings from Hansen and Andersen (2008) for Denmark.
The other work-related factors are not significantly related to the number of sickness
presenteeism days. In contrast to Hansen and Andersen (2008) we do not find a sig-
nificant impact of firm size on sickness presenteeism days. This might be explained
9The negative first year effect is robust to a more flexible approach with several tenure categories(results available upon request).
69

by the cross country nature of our data without homogeneous regulations in function
of firm size. The sociodemographic and health control variables confirm mostly the
results known from the literature on presenteeism. Health status is the quantitatively
most relevant determinant for sickness presenteeism days, followed by work-related
factors and sociodemographics.
4.5 Robustness checks
As robustness checks, we present models with different sets of control variables, with
an alternative estimation technique and in a subsample that is characterized by a
more homogeneous institutional setting. The corresponding regression results are de-
picted in Table 4.3. First, in order to measure the direct and indirect health mediated
effects of the work-related characteristics, we estimate the ZINB model without the
health controls (column 1). The results are mostly unchanged in terms of statistical
significance when excluding the health variables, while the estimated average marginal
effects change substantially in some cases. Particularly, the marginal effect of the work
environment variables increase considerably (up to the factor of three), which suggests
a strong relationship of good working conditions and social support with presenteeism
via its effect on health. The same is true for the subjective lack of time variable which
gains in economic and statistical significance and thereby points to a negative health
impact of (perceived) workload. Work autonomy as well as weekly working hours are
still highly economically relevant for sickness presenteeism days here but are over-
taken by good working conditions. Job insecurity, work interdependence, income and
private sector employment become significant if no longer controlling for health sta-
tus. Hence, these controls are related to presenteeism behaviour only through health.
Being dependent on the work pace of coworkers (interdependence), working as a blue
collar worker and job insecure are associated with more presenteeism days, a higher
income with less.
In column 2 we present a parsimonious model including only the significant deter-
minants to alleviate multi-collinearity concerns which does not change our results.
Furthermore, the results are robust to estimating the number of presenteeism days by
an OLS model instead of the preferred ZINB model (column 3). Finally, restricting
our sample to EU member states which are in various dimensions homogeneous due
to common EU regulations corroborates our finding (Column 4).
Additional robustness checks are presented in the following but not included in Table
4.3 and available upon request. Rerunning our preferred model in samples excluding
70

the observations from each country at a time does not change the results. Accord-
ingly, our results are not driven by a single country. Furthermore, including long-term
presentees, i.e. those with more than 50 sickness presenteeism days per year, in our
preferred ZINB specification does not fundamentally change our results either. The
marginal effect for second jobs becomes insignificant at the ten percent level when
including presentees with up to 100 sickness presenteeism days. When additionally
including those with up to 200 sickness presenteeism days the social support, super-
visory and the unusual working hours variables are no longer significant either.
4.6 Conclusion
Sickness presenteeism is known to have negative repercussions with regard to pro-
ductivity and health. While there is already some knowledge about the incidence
and frequency of individual sickness presenteeism behaviour, there is, to the best of
our knowledge, no study investigating its annual duration. This is a deplorable lack
of knowledge, since the impact of presenteeism on productivity depends much more
on the number of sickness presenteeism days than on its incidence or frequency. We
investigate the quantitatively relevant work-related determinants for the annual du-
ration of sickness presenteeism in Europe in a cross-sectional sample. We contribute
to the literature by taking the annual duration of sickness presenteeism as dependent
variable and by using the European Working Conditions Survey (EWCS), the first
large-scale dataset on sickness presenteeism outside Scandinavia, covering 34 Euro-
pean countries. Hence, our findings have better external validity and are not confined
to the institutionally specific cases of Scandinavian countries.
We find work autonomy, workload, tenure and the work environment to be the quan-
titatively most relevant work-related determinants of sickness presenteeism days in
Europe. Work autonomy, workload and tenure are positively related to the number
of sickness presenteeism days while a good working environment comes along with
less presenteeism. Besides the positive linear tenure effect on presenteeism days, we
observe significantly less presenteeism in the first year of an employment relation-
ship. While we are, to the best of our knowledge, the first to investigate tenure in
this regard, our significant and positive results for work autonomy are in contrast to
insignificant findings for presenteeism frequency in Denmark (Hansen and Andersen,
2008). Estimating a model that allows for a different autonomy effect in northern
Europe reveals that work autonomy is insignificantly related to presenteeism in this
71

region while remaining significant and positive in the other countries, which might be
due to institutional differences. The findings for workload and the work environment
are in line with the literature on presenteeism frequency. The impact of work auton-
omy and workload lead in terms of economic significance (beta coefficients) followed
by the other two work-related factors. Overall, health status is the quantitatively
most relevant determinant for sickness presenteeism days, followed by work-related
factors and sociodemographics.
The effect of the working environment on sickness presenteeism is particularly in-
creased when combining direct and indirect, health mediated effects. The main results
are robust in a more homogeneous subsample comprising EU member states only and
to the application of OLS models. Since all results are based on cross-sectional mod-
els only, practical and policy implications should be taken with caution. Although
panel data is needed to draw causal conclusions, our results suggest that employers
who want to reduce presenteeism should, besides offering health improving working
conditions, consider limiting the workload per employee and offer a good working en-
vironment. One interesting feature of our findings is that our findings mirror the dual
nature of sickness presenteeism which is similarly related to good as well as to bad job
characteristics (work autonomy, time pressure). Accordingly, coming to work when
being sick can, on the one hand, be facilitated by good working conditions, or on the
other be forced by obligations. The first case is rather commensurate with a situa-
tion in which coming to work is socially beneficial because negative health effects are
limited. In contrast, the latter is more likely a situation in which the negative effects
dominate over the positive effects. Accordingly, it will be one of the crucial questions
for future research to distinguish between productivity and health improving forms of
presenteeism and those that are not.
72

4.7 Appendix
Figure 4.1: Distribution of sickness presenteeism days conditional on presenteeism. Observationswith zero sickness presenteeism days not shown but included in analysis (64 % of the full sample).Source: 2010-EWCS. Own calculations, survey weights used.
73

Table 4.1: Descriptive statistics
Variable Obs. Mean Std.Dev.
Min. Max.
Sickness presenteeism days 18,953 2.37 4.9 0 50Sickness presenteeism incidence 18,953 0.36 0.48 0 1
Work autonomy index 18,953 1.92 1.19 0 3Supervisor 18,953 0.15 0.36 0 1
Usual weekly working hours 18,953 38.0 9.1 10 80Lack of time to get work done 18,953 2.11 0.99 1 5Unusual working time 18,953 0.58 0.49 0 1Second job 18,953 0.07 0.26 0 1
New job (tenure <1 year) 18,953 0.08 0.27 0 1Tenure 18,953 9.49 9.05 0 47
Good working conditions 18,953 3.04 0.68 1 4Social support 18,953 5.57 1.94 1 8
Job insecurity 18,953 2.18 1.85 1 5Blue collar worker 18,953 0.34 0.47 0 1Temporary contract 18,953 0.13 0.33 0 1Net income category 18,953 11.35 3.83 1 21Work interdependence 18,953 0.46 0.50 0 1Size (<10 employees) 18,953 0.27 0.45 0 1Size (10-49 employees) 18,953 0.34 0.47 0 1Size (50-99 employees) 18,953 0.13 0.34 0 1Size (100-249 employees) 18,953 0.11 0.31 0 1Size (≥250 employees) 18,953 0.15 0.36 0 1Private sector 18,953 0.67 0.47 0 1
Sex (female=1) 18,953 0.46 0.50 0 1Children 18,953 0.54 0.50 0 1Partnership 18,953 0.74 0.44 0 1Age (18-24 years) 18,953 0.07 0.26 0 1Age (25-34 years) 18,953 0.26 0.44 0 1Age (35-44 years) 18,953 0.29 0.46 0 1Age (45-54 years) 18,953 0.26 0.44 0 1Age (55-65 years) 18,953 0.11 0.32 0 1Primary education 18,953 0.31 0.46 0 1Secondary education 18,953 0.34 0.47 0 1Higher education 18,953 0.35 0.48 0 1
Very good health 18,953 0.26 0.44 0 1Good health 18,953 0.55 0.50 0 1Fair health 18,953 0.18 0.39 0 1Bad and very bad health 18,953 0.02 0.13 0 1# of health problems 18,953 2.71 2.38 0 14
Source: 2010-EWCS. Own calculations, survey weights used.
74

Table 4.2: Number of sickness presenteeism days (ZINB)
(1) (2) (3)Count Inflate ME [beta coeff]
Work autonomyWork autonomy 0.02∗ (0.01) -0.12∗∗∗ (0.03) 0.23∗∗∗ [0.048] (0.05)Supervisor 0.07∗∗∗ (0.02) -0.05 (0.06) 0.24∗∗ [0.016] (0.10)
WorkloadUsual weekly hours/10 0.05∗∗∗ (0.02) -0.11∗∗∗ (0.03) 0.29∗∗∗ [0.045] (0.06)Lack of time 0.00 (0.01) -0.08∗∗∗ (0.03) 0.11∗∗ [0.019] (0.05)Unusual working time -0.01 (0.02) -0.18∗∗∗ (0.04) 0.20∗∗∗ [0.018] (0.07)Second job -0.02 (0.04) -0.25∗∗ (0.10) 0.27∗∗ [0.013] (0.13)
TenureNew job -0.10∗∗∗ (0.03) 0.28∗∗∗ (0.09) -0.65∗∗∗ [0.032] (0.14)Tenure in years 0.01∗∗∗ (0.00) -0.00 (0.00) 0.02∗∗∗ [0.033] (0.00)
Working environmentGood working condit. -0.01 (0.02) 0.16∗∗∗ (0.03) -0.22∗∗∗ [0.027] (0.07)Social support -0.02∗∗∗ (0.01) 0.00 (0.01) -0.06∗∗ [0.020] (0.02)
Other work-related factorsJob insecurity 0.00 (0.01) -0.03 (0.02) 0.04 [0.009] (0.04)Temporary contract -0.03 (0.04) -0.04 (0.06) -0.02 [0.001] (0.12)Work interdependence 0.01 (0.02) -0.01 (0.04) 0.03 [0.003] (0.06)Net income -0.01∗∗ (0.01) -0.01 (0.01) -0.01 [0.012] (0.02)Blue collar 0.05 (0.03) 0.14∗∗∗ (0.05) -0.03 [0.003] (0.08)Size (<10 employees) (base) (base) (base)Size (10-49 employees) 0.05 (0.03) 0.06 (0.05) 0.06 [0.005] (0.11)Size (50-99 employees) 0.00 (0.03) -0.08 (0.06) 0.11 [0.007] (0.13)Size (100-249 employees) 0.03 (0.04) -0.07 (0.07) 0.17 [0.009] (0.16)Size (>250 employees) -0.01 (0.03) -0.04 (0.08) 0.03 [0.002] (0.14)Private sector -0.02 (0.03) 0.01 (0.05) -0.06 [0.005] (0.10)
SociodemographicsSex (female=1) 0.10∗∗∗ (0.03) -0.16∗∗∗ (0.05) 0.48∗∗∗ [0.044] (0.09)Children 0.05 (0.03) -0.13∗∗∗ (0.04) 0.30∗∗∗ [0.027] (0.10)Partnership -0.07∗∗∗ (0.02) -0.02 (0.04) -0.18∗∗ [0.015] (0.08)Aged 18-24 (base) (base) (base)Aged 25-34 0.02 (0.07) 0.04 (0.09) 0.01 [0.001] (0.21)Aged 35-44 0.01 (0.07) 0.28∗∗∗ (0.10) -0.34 [0.028] (0.23)Aged 45-54 -0.07 (0.07) 0.50∗∗∗ (0.09) -0.86∗∗∗ [0.069] (0.23)Aged > 55 -0.08 (0.08) 0.73∗∗∗ (0.11) -1.16∗∗∗ [0.074] (0.28)Elementary education (base) (base) (base)Secondary education -0.03 (0.04) -0.15∗∗ (0.07) 0.12 [0.011] (0.14)Higher education -0.08∗ (0.04) -0.22∗∗∗ (0.06) 0.07 [0.006] (0.13)
Health status# of health problems 0.07∗∗∗ (0.01) -0.22∗∗∗ (0.01) 0.47∗∗∗ [0.207] (0.02)Very good health (base) (base) (base)Good health 0.12∗∗∗ (0.04) -0.19∗∗∗ (0.07) 0.58∗∗∗ [0.052] (0.11)Fair health 0.28∗∗∗ (0.04) -0.29∗∗∗ (0.07) 1.15∗∗∗ [0.085] (0.16)(Very) bad health 0.63∗∗∗ (0.08) -0.42∗∗∗ (0.16) 2.30∗∗∗ [0.063] (0.36)
N 18953
Source: 2010-EWCS, own calculations.∗ p < 0.10, ∗∗ p < 0.05, ∗∗∗ p < 0.01. Countryand industry dummies included, standard errors clustered at the country level inparentheses. Logit model for the inflate part. Number of nonzero obs. 7331, zero obs.11622. Vuong test z = 39.93 (p-value 0.00).
75

Table 4.3: Robustness checks
(1) (2) (3) (4)No health Parsimonious OLS EU-27
Work autonomyWork autonomy 0.28∗∗∗ (0.05) 0.23∗∗∗ (0.05) 0.21∗∗∗ (0.05) 0.28∗∗∗ (0.05)Supervisor 0.31∗∗∗ (0.11) 0.21∗∗ (0.10) 0.35∗∗∗ (0.11) 0.22∗∗ (0.11)
WorkloadUsual weekly hours/10 0.35∗∗∗ (0.07) 0.24∗∗∗ (0.06) 0.27∗∗∗ (0.07) 0.29∗∗∗ (0.06)Lack of time 0.27∗∗∗ (0.06) 0.11∗∗ (0.05) 0.15∗∗ (0.06) 0.11∗∗ (0.06)Unusual working time 0.35∗∗∗ (0.07) 0.20∗∗∗ (0.06) 0.16∗∗ (0.07) 0.24∗∗∗ (0.07)Second job 0.39∗∗ (0.16) 0.30∗∗ (0.13) 0.29∗ (0.17) 0.35∗∗∗ (0.11)
TenureNew job -0.70∗∗∗ (0.13) -0.69∗∗∗ (0.14) -0.67∗∗∗ (0.14) -0.64∗∗∗ (0.16)Tenure in years 0.02∗∗∗ (0.00) 0.02∗∗∗ (0.00) 0.02∗∗∗ (0.01) 0.02∗∗∗ (0.00)
Working environmentGood working condit. -0.79∗∗∗ (0.07) -0.22∗∗∗ (0.07) -0.28∗∗∗ (0.08) -0.21∗∗∗ (0.07)Social support -0.12∗∗∗ (0.03) -0.06∗∗ (0.03) -0.07∗∗∗ (0.03) -0.07∗∗∗ (0.03)
Other work-related factorsJob Insecurity 0.11∗∗ (0.04) 0.02 (0.05) 0.06 (0.04)Temporary contract 0.00 (0.12) 0.01 (0.11) -0.06 (0.14)Work interdependence 0.20∗∗∗ (0.05) -0.01 (0.06) 0.01 (0.06)Net income -0.07∗∗∗ (0.02) -0.03 (0.02) -0.02 (0.02)Blue collar 0.17∗∗ (0.08) -0.08 (0.07) -0.04 (0.09)Size (<10 employees) (base) (base) (base)Size (10-49 employees) 0.14 (0.12) 0.09 (0.11) 0.15 (0.12)Size (50-99 employees) 0.23∗ (0.14) 0.12 (0.13) 0.16 (0.15)Size (100-249 employees) 0.17 (0.18) 0.18 (0.16) 0.23 (0.18)Size (>250 employees) 0.15 (0.16) 0.07 (0.15) 0.10 (0.15)Private sector -0.11 (0.11) -0.03 (0.10) -0.02 (0.11)
Sociodemographics and health statusSex (female=1) 0.76∗∗∗ (0.09) 0.55∗∗∗ (0.08) 0.49∗∗∗ (0.10) 0.42∗∗∗ (0.10)Children 0.31∗∗∗ (0.10) 0.30∗∗∗ (0.10) 0.34∗∗∗ (0.11) 0.28∗∗ (0.11)Partnership -0.22∗∗∗ (0.08) -0.17∗∗ (0.08) -0.18∗∗ (0.09) -0.17∗∗ (0.08)Aged 18-24 (base) (base) (base) (base)Aged 25-34 0.20 (0.19) -0.02 (0.21) -0.07 (0.17) -0.09 (0.24)Aged 35-44 0.04 (0.21) -0.37 (0.23) -0.46∗∗ (0.21) -0.40 (0.25)Aged 45-54 -0.29 (0.21) -0.90∗∗∗ (0.24) -0.99∗∗∗ (0.21) -0.90∗∗∗ (0.26)Aged > 55 -0.42∗ (0.25) -1.22∗∗∗ (0.28) -1.32∗∗∗ (0.24) -1.24∗∗∗ (0.31)Elementary education (base) (base) (base)Secondary education 0.00 (0.15) 0.15 (0.15) 0.22 (0.15)Higher education -0.14 (0.17) 0.12 (0.14) 0.17 (0.14)# of health problems 0.47∗∗∗ (0.02) 0.52∗∗∗ (0.03) 0.48∗∗∗ (0.02)Very good health (base) (base) (base)Good health 0.58∗∗∗ (0.11) 0.34∗∗∗ (0.10) 0.58∗∗∗ (0.12)Fair health 1.14∗∗∗ (0.16) 1.02∗∗∗ (0.18) 1.09∗∗∗ (0.17)(Very) bad health 2.30∗∗∗ (0.35) 3.87∗∗∗ (0.74) 2.04∗∗∗ (0.37)
N 18953 18953 18953 16485
Source: 2010-EWCS, own calculations.∗ p < 0.10, ∗∗ p < 0.05, ∗∗∗ p < 0.01. Except in column(3) average marginal effects from ZINB models; in column (3) coefficient estimates from OLSregression. Standard errors clustered at the country level in parentheses. Country and industrydummies included.
76

Chapter 5
Sickness absence, presenteeism and
work-related characteristics
This chapter investigates how changes in work-related factors affect workers’ absence
and presenteeism behavior. Previous studies (implicitly) assume that there is a substi-
tutive relationship – specifically, that a change in a work-related factor that decreases
the level of absence simultaneously increases presenteeism (or vice versa). We set up
a theoretical model in which work-related characteristics not only affect a worker’s
absence decision but also the critical level of sickness that defines presenteeism. Our
model shows that non-substitutive relationships between absence and presenteeism are
also conceivable. Using European cross-sectional data, we find only one substitutive
and few complementary relationships, while the bulk of the work-related characteristics
are related only to one of the two sickness states.
This chapter is joint work with Marco de Pinto.
77

5.1 Introduction
It is well established that sickness absence and presenteeism – that is, going to work
while sick, have negative economic effects through reduced or less productive labour
supply (for absence see Pauly et al., 2002, for presenteeism see Pauly et al., 2008).
Motivated by this stylized fact, a large number of papers investigate the determinants
of absence and presenteeism behaviour. Since most of the studies in this field look
only at the determinants of one of the two sickness states, the possibility that the
same factor might influence absence and presenteeism behaviour at the same time is
neglected.1 Albeit of this lack of empirical evidence on the interrelationship between
both sickness states with regards to their determinants, some studies suggest a sub-
stitutive relationship between both sickness states. This means that a determinant
which reduces absence is assumed to increase presenteeism (and vice versa). This
proposition is presented rather implicitly by describing both sickness states as the
result of the same decision process (Aronsson and Gustafsson, 2005; Brown and Ses-
sions, 2004) or by deducing hypotheses for determinants of presenteeism negatively
from the literature on absence (Bierla et al., 2013). Hence, there is a vague consen-
sus that absence and presenteeism have a substitutive relationship which is neither
explicitly theoretically derived, nor comprehensively empirically investigated.
In this chapter, we contribute to the existing literature by analyzing the interrela-
tion between sickness absence and presenteeism in a more explicit and comprehensive
manner. This topic is highly relevant for (personnel) managers and policy makers,
since it clearly makes a difference whether a measure aimed at reducing absence days
is associated with more, unchanged or even fewer presenteeism days. While a decline
in absence is an economic improvement (for the manager, but of course also for the
society), reducing absence at the cost of more presenteeism could reduce overall pro-
ductivity, depending on the specific productivity effects of presenteeism (see Schultz
and Edington, 2007, for a survey on the productivity effects of presenteeism). On the
contrary, economic improvement clearly survives in cases of unchanged or even lower
presenteeism. It is thus important to determine how different factors simultaneously
affect both sickness states. This is in particular true for factors that managers and
1Only three studies investigate both sickness states at once, and these will be discussed in moredetail below (Bockerman and Laukkanen, 2009, 2010; Johansson and Lundberg, 2004). In contrastthere is a bulk of literature that investigates either sickness absence or presenteeism behaviour. Whilethe former also includes economic studies (for an early survey article, see Brown and Sessions, 1996;for literature using European cross-country data, see Frick and Malo, 2008; Livanos and Zangelidis,2013; Lusinyan and Bonato, 2007), the latter is mostly from social medicine (Aronsson et al., 2000;Aronsson and Gustafsson, 2005; Bockerman and Laukkanen, 2009; Hansen and Andersen, 2008, 2009;Leineweber et al., 2011; Preisendorfer, 2010).
78

policy makers can directly influence. In our investigation, we therefore focus on work-
related characteristics (e.g. contract type, workload, autonomy and others) which
are at least partially under manager’s (and to a smaller degree under policy maker’s)
control and analyse how they are related to absence and presenteeism behaviour.
When investigating the impact of work-related characteristics on sickness absence
and presenteeism, we distinguish three possible interrelations between the two sick-
ness states: (i) If a change in one work-related factor leads to a change in absence and
presenteeism in the opposite direction, we find a substitutive relationship between
both sickness states with respect to this work-related factor. (ii) If a change in one
work-related factor implies a change in absence and presenteeism in the same direc-
tion, we find a complementary relationship between both sickness states with respect
to this work-related factor. (iii) If a change in one work-related factor affects only
one of the sickness states while leaving the other constant, we find no relationship
between them with respect to this work-related factor. Summing up, we ask whether
work-related factors lead to a substitutive, a complementary or no relationship be-
tween absence and presenteeism. To find an answer to this question, we proceed with
a two-step approach. First, we build a theoretical model that highlights mechanisms
through which both sickness states can be affected at the same time. Second, we
make use of a rich data set in which indicators for sickness absence and presenteeism
are compiled in one survey. With these data at hand, we are able to simultaneously
analyse determinants of sickness absence and presenteeism and hence take explicitly
into account their interdependence.
In our theoretical model, the worker’s utility of being attendant negatively depends
on their sickness intensity. Accordingly, we can show that if the sickness level of an
individual exceeds a certain threshold, she decides to stay at home. Hence, we call
this threshold the individual critical level of sickness, which – and this is important
– depends (among others) on work-related characteristics (see Brown and Sessions,
2004 for a similar approach). Moreover, we present a formal definition of presenteeism
which is narrower than in Chapter 4. The crucial mechanism behind this definition is
that a worker’s sickness level does not only negatively affect her utility level but also
the firm’s profit situation. If the worker’s sickness level exceeds a certain threshold, it
is profit-maximzing for the firm that the worker stays at home. We call this thresh-
old the firm critical level of sickness. Then, presenteeism is defined as a situation
where the worker decides to be attendant at the workplace despite the fact that her
attendance reduces the firm’s profit – in other words, her sickness level is higher than
79
the firm critical level (compare Chatterji and Tilley, 2002, for a similar definition).2
Since work-related factors influence the impact of sickness on the firm’s profit situa-
tion, the firm critical level of sickness and thus presenteeism are also functions of the
work-related factors.
There are two benefits from our theoretical analysis. First, we find that the relation-
ship between absence and presenteeism with regard to a work-related characteristic
is not necessarily of a substitutive nature, as is commonly assumed in the literature.
Indeed, the interrelation of both sickness states is more complex as work-related char-
acteristics do not only affect the worker’s absence decision but also the firm’s costs
of the worker’s attendance while sick as stated above. Second, we derive conditions
under which work-related factors lead to a substitutive, a complementary or no rela-
tionship between sickness absence and presenteeism. These conditions depend on the
sign and the magnitude of the changes in the firm and/or the individual critical level
of sickness brought about by changes in the work-related characteristics. With this at
hand, we are able to identify the underlying mechanism for the variation in sickness
absence and presenteeism behaviour, which in particular guides our understanding of
the empirical findings.
In our empirical investigation, we estimate the relationship between work-related char-
acteristics and the number of sickness absence and presenteeism days. For that pur-
pose, we use the European Working Conditions Survey (EWCS), a cross-sectional sur-
vey which covers 34 European countries. This allows us to relate in OLS regressions 16
different work-related characteristics of more than 18,000 employees to their sickness
absence and presenteeism behaviour.3 Since there is no panel data on presenteeism
available, we cannot deliver causal analysis of the interrelation between absence and
presenteeism behaviour, but our empirical investigation offers several improvements
in other dimensions. First, we comprehensively cover work-related characteristics
instead of only two as in Johansson and Lundberg (2004), which reduces omitted
variable bias. Second, absence and presenteeism are measured more accurately in
numbers of days per year instead of arbitrarily set frequency categories (Johansson
and Lundberg, 2004) or incidence measures (Bockerman and Laukkanen, 2009, 2010).
A (potentially) substitutive relationship between absence and presenteeism should
be felt more strongly when measured in days than in frequency categories or in bi-
2Notably, we assume that the firm cannot observe the true sickness level of the individual. Hence,the firm is not able to prevent presenteeism in its workforce.
3Specifically, we look at supervisory and blue collar status, temporary contracts, tenure cate-gories, weekly working hours, whether working in a second job and during evenings or weekends, netincome, firm size, private sector employment, work interdependence, work autonomy, job insecurity,satisfaction with working conditions, support by coworkers and the management, and time pressure.
80
nary measures. Third, we use data that is representative for each European country
and Europe as a whole instead of samples from Stockholm county (Johansson and
Lundberg, 2004) or from Finnish trade union members (Bockerman and Laukkanen,
2009, 2010). Accordingly, our results have better external validity. Finally, covering
relationships with both sickness states, we are able to see whether factors reducing
absence days come at the price of more presenteeism. This is particularly an advan-
tage over causal studies that investigate moral hazard effects in absence behaviour
such as Puhani and Sonderhof (2010) and Ziebarth and Karlsson (2010), since they
are not able to discern whether the changed moral hazard effect entails changes in
presenteeism. Hence, their normative conclusions must be taken cautiously.
The main results are as follows: (i) We find that only one work-related factor (namely
the supervisor status) leads to a substitutive relationship between absence and pre-
senteeism. This finding casts doubt on the predominant view in the literature that
both sickness states are interlinked in a substitutive manner. (ii) There are only two
work-related factors (namely working conditions and tenure) which lead to a comple-
mentary relationship between absence and presenteeism. While an improvement of
working condition is accompanied with a reduction of both absence and presenteeism,
an increase in tenure is positively correlated with both sickness states. (iii) The bulk
of the considered work-related characteristics is only related to one of the two sickness
states while leaving the other unchanged. From a managerial and policy perspective,
this shows that it is possible to reduce absence without negative side-effects on pre-
senteeism or to reduce presenteeism without the threat of higher absence. The former
case could be interpreted as a situation in which the absence is – at least partially
– not due to health problems. According to our results, this can be observed in the
public sector, in large firms and for employees with an open-ended contract. Our
results are robust against count data models and in differently defined subsamples.
How can we explain these results? Our theoretical model shows that if a change in
a work-related factor only influences the absence/attendance decision of individuals
and hence the individual critical level of sickness, absence and presenteeism are indeed
substitutes with respect to the changing factor. To put it differently, both sickness
states are then determined by the same decision process – as is also argued in the
literature (see above). But since this substitutive relationship is rarely observed in
the empirical investigation, there must be a second channel through which at least
one sickness state is affected. Taking up the lessons from our model, this channel
is given by the influence of work-related factors on the firm critical level of sickness
which in turn defines presenteeism. Hence, our theoretical model is able to explain
81

the none-substitutive relationships between sickness absence and presenteeism thanks
to the endogenous firm critical level of sickness, which is its major innovation.
Regarding the related literature, there are few studies empirically looking at both
sickness states and even fewer focusing on the interrelation between them. Two
Finnish studies investigate work-related determinants of both sickness states, but
they do not focus on their interrelation and use binary measures for both sickness
states (Bockerman and Laukkanen, 2009, 2010). In their first study, Bockerman and
Laukkanen (2009) find that only few determinants are related to both sickness states,
be it complementary as shift work or substitutive as regular overtime. Only one of
the two variables of interest is related to both sickness states in their follow-up study
(Bockerman and Laukkanen, 2010), while the other is only correlated with presen-
teeism. The match between desired and actual working hours is associated with less
sickness absence and presenteeism, whereas a strong emphasis of efficiency in the work
place increases presenteeism. However, the data set used is not representative for the
Finish workforce since it comprises only a small sample of Finnish trade union mem-
bers.
Johansson and Lundberg (2004) is the only study that explicitly investigates the
substitution between sickness absence and attendance, which they refer to as ‘illness
flexibility’. Contrary to their expectations, presenteeism and absence have only a sub-
stitutive relationship with regards to attendance requirements, but not with regards
to adjustment latitude (the possibility to adjust work effort when ill). The latter is
positively related to the frequency of sickness absence for females, while not affecting
presenteeism. There are several differences in regards to our study. First, they exclude
all respondents that report neither absence nor presence behaviour since they want to
investigate the decision between absence and presence behaviour (‘illness flexibility’).
This sample selection could lead to biased estimates, if the excluded observations are
systematically related to the explanatory variables, which is quite likely. Second, their
dependent variable is measured in four vaguely defined ordinal categories (never, once,
a few times, many times). Finally, controlling only for age, health, financial situation
and family demands, the authors do not convincingly address potential omitted vari-
able bias.
In addition, this chapter is also related to the theoretical analysis on sickness absence
and presence behaviour by Brown and Sessions (2004). In this study, the authors
enhance the Barmby et al. (1994) model of absenteeism by including sickness pre-
senteeism into their shirking model. While our model is inspired by their model, we
depart in three ways. We do not focus on shirking and detection technology since
82

we cannot directly discern shirking from legitimate absence in our data. More im-
portantly, we expand their model by defining presenteeism through the firm critical
level of sickness. Finally, we focus on the interrelation between sickness absence and
presenteeism, which is not done in their study.
The remainder of this chapter is structured as follows. In Section 5.2, we present our
theoretical model and derive conditions for the existence of a substitutive, a comple-
mentary or no relationship between sickness absence and presenteeism. The empirical
analysis is conducted in Section 5.3. Section 5.4 concludes.
5.2 Theoretical model
5.2.1 Preliminaries
In this section, we build a model that formalizes the absence/attendance decision of
individuals and shows under which conditions presenteeism is conceivable. There are
three properties of our model. First, we consider the behaviour of individual i who is
employed at firm j. By assumption, there is a contract between both which specifies
the wage rate wij > 0 and the working hours per day hij > 0. In addition to individual
i, the firm employs an exogenously given number of individuals N−i,j.
Second, we assume that the employment relationship between individual i and firm
j is characterized by several work-related factors, such as tenure, contract type and
others, which are the focus of our investigation. In order to keep our framework as
general as possible, we use Xij as a vector that subsumes all relevant work-related
factors in the employment relationship between i and j.
Third, the individual is confronted with health shock δi. We assume that δi is ran-
domly distributed over the interval [0, 1] with the density f(δi) and increases in the
severity of sickness (see Brown and Sessions, 2004, for a similar approach). Since
the health state has an impact on the worker’s utility, she decides conditional on δi
whether she will be absent from the workplace (absence) or attendant at the work-
place (attendance). There is an individual critical level of sickness, δij, at which she
is indifferent between absence and attendance. If the revealed health state exceeds
(falls short of) δij, the individual is absent (attendant). Notably, we assume that δi
is private information to the individual i.
The timing structure of our model is as follows: First, individual i and firm j sign
a contract. Second, the individual formulates a decision rule for being attendant or
absent – that is, determines the threshold level δij. Third, the realization of the health
83

shock is drawn, and the individual goes to work or stays at home in accordance with
the formulated decision rule. We exclude the possibility of re-contracting after the
state of health is revealed. Finally, production takes place. Note that the health shock
recurs on a daily basis, implying that the individual renews her absence/attendance
decision every day.
5.2.2 Absence/attendance decision
Under which conditions does individual i decide to be absent (attendant) from (at)
the workplace? To find the answer to this question, we first have to introduce the
individual’s utility functions. For notational simplicity, we drop the indizes i and j in
the following.
The individual’s realized utility can either be Uh in the case of attendance or Ua in
the case of absence. Formally, we assume:
Uh = (1− δ) · uh (w, T − h,X) , (5.1)
Ua = ua (s, T,X) , (5.2)
where T stands for the individual endowment in time and s (0 ≤ s ≤ w) denotes the
exogenously given firm-financed sick pay which the individual receives in the case of
absence. The sub-utility functions uh and ua are concave in w, (T − h), s and T with
∂uh/∂w > 0, ∂uh/∂(T − h) > 0, ∂ua/∂s > 0 and ∂ua/∂T > 0. Note further that the
higher the level of sickness δ, the lower the utility of being attendant. Intuitively, an
increasing δ implies a rise in the worker’s disutility of working, and thus the overall
utility of being attendant drops.4
Regarding the vector X, the sign of the partial derivatives depends on the respective
work-related factor. For example, if job insecurity increases, uh might decline, while
the reverse could be true in the case of an improvement in working conditions. In
addition, we assume uh 6= ua so that work-related factors can influence the utility of
being attendant and of being absent with different sign and intensity.
With this at hand, we can derive the individual critical level of sickness, δ, at which
the individual is indifferent between attendance or absence. Formally, this requires
4Since we are interested in explicitly deriving the individual critical level of sickness δ (see below),we model the health state as an additive-separable argument in (5.1). The alternative approach –
that is, using the implicit form uh(δ) with ∂uh(δ)/∂δ < 0, makes it impossible to calculate δ in anexplicit form.
84

Uh(δ = δ) = Ua. Using (5.1) and (5.2), we obtain:
δ = 1− ua(s, T,X)
uh (w, T − h,X), (5.3)
where we assume that 0 ≤ ua(s, T,X) ≤ uh (w, T − h,X) holds in order to ensure
0 ≤ δ ≤ 1. Intuitively, this condition should hold in any cases because otherwise
the individual would never be attendant at the workplace and the contract would be
thus misspecified. After the health state δ of the individual is revealed, she chooses
to be attendant on this day if δ ≤ δ holds; otherwise (δ > δ), she chooses to be
absent. Recall that this decision is made on a daily basis since the health shock takes
place every day. Note also the individual critical level of sickness δ (and thus her
attendance-absence decision) depends on X, implying that it is influenced by work-
related factors.
Since the individual knows her critical level of sickness δ before the health state is
revealed, it is possible to calculate the probability that the individual will be absent
from the work-place on a given day. Formally, the probability of absence is given by
A = Pr(δ < δ < 1) = F (δ < δ < 1), where F (δ) denotes the distribution function of
δ. Using the simplifying assumption of a uniform distribution5 F (δ) = δ, we obtain:
A = 1− δ. (5.4)
Eq. (5.4) shows that if the individual critical level of sickness increases (decreases),
the probability of being absent on a given day decreases (increases). Of course, the
probability of being attendant on a given day is simply given by H = 1− A.
5.2.3 Presenteeism
So far, we have analysed the consequences of the health shock on the individual’s
utility and derived her absence/attendance decision. One conclusion is that in the case
of a relatively high individual critical sickness level δ, it is possible that the individual
chooses to be attendant at the workplace despite a relatively bad realization of the
health shock – in other words, a high δ. Such a scenario is described by presenteeism
in the literature, where individuals work despite the fact that they are sick (see Brown
and Sessions, 2004; Chatterji and Tilley, 2002).
In this subsection, we use our model to give a formal definition of presenteeism which
5We use the uniform distribution in order to hold our model as simple as possible. Note that ourqualitative results are not affected by this assumption. If we would use instead the general form ofthe distributional function F (δ), our qualitative findings would hold since we have ∂F/∂δ > 0.
85

is narrower than in Chapter 4. The crucial mechanism is that the health state of the
individual also has an impact on the firm’s profit situation. As we will show below,
the firm’s profit decreases in the level of the individual’s sickness in the case of her
attendance. This might be through the reduced productivity of the worker itself but
also due to its effects on others – for example, team production or infection of co-
workers. If the sickness level of the individual δ exceeds a certain threshold denoted
by δ, it is profit-maximzing for the firm that the individual is absent. Hence, we call
the threshold δ firm critical level of sickness in the following. Importantly, this firm
critical level of sickness depends on the work-related characteristics since the impact
of sickness on profits differs between different jobs and is hence a function of the vector
X.
To formally calculate δ, we have to specify the firm’s profit function. We define Πh
as the firm’s profit in the case of the individual’s attendance, while Πa stands for the
profit in the case of the individual’s absence. For both, we assume, respectively:
Πh = (1− δ) · πh (h,w,X, Y ) ≥ 0, (5.5)
Πa = πa(s,X, Y ) > 0. (5.6)
The variable Y > 0 stands for the profit which the firm earns through the employ-
ment of the other N workers – that is, without the consideration of individual i.
The sub-profit functions πh and πa are concave in their arguments with ∂πh/∂h > 0,
∂πh/∂w < 0, ∂πh/∂Y > 0, ∂πa/∂s < 0 and ∂πa/∂Y > 0. The sign of the partial
derivatives of X depends (as for the utility functions) on the specific work-related fac-
tor considered. We also assume πh 6= πa to capture the fact that the same work-related
factor might have a different impact on the firm’s profit in the case of attendance than
in the case of absence.
Importantly, Πh is a negative function of the individual’s sickness level δ. One expla-
nation is that an increasing sickness level has a negative effect on the individuals’s
productivity – particularly in the future due to a lack of recuperation (cf. Bergstrom
et al., 2009) – which in turn decreases the firm’s profit. It can also be the case that
the sickness of individual i creates negative externalities either through infection of
other employees (Barmby and Larguem, 2009) or through production interdependen-
cies (team production), which also reduces the firm’s profit (Pauly et al., 2008). Note
that the formulation in (5.5) pushes this argument to the extreme: If the individual
86

has the highest level of sickness, δ = 1, the firm’s profit drops to zero.6
With this at hand, we can compute the firm critical level of sickness δ at which the
firm is indifferent in regards to the individual’s attendance or her absence. Formally,
this requires Πh(δ = δ) = Πa. Inserting (5.5) and (5.6) yields:
δ = 1− πa(s,X, Y )
πh (h,w,X, Y ), (5.7)
where we assume that πa(s,X, Y ) ≤ πh (h,w,X, Y ) holds to ensure that 0 < δ ≤ 1.
There is also an economic justification for this condition, since an employment contract
should be specified in a way that attendance increases profits if the employee is healthy
(δ = 0); otherwise, the contract would not have been concluded in the first place.
Recall the interpretation of the firm critical level of sickness: If δ ≤ δ holds, the
attendance of the individual is desired; otherwise (δ > δ), the firm prefers the absence
of the individual. Note that the firm cannot observe δ due to our assumption that
this is the individual’s private information.
Given the individual critical level of sickness δ and the firm critical level of sickness
δ, we are able to give a formal definition of presenteeism. Suppose that δ > δ holds
and that the realized health state of the individual lies in the interval δ < δ < δ. As
a consequence, she chooses to be attendant at the workplace since δ is smaller than
her critical level of sickness. From the firm’s perspective, the individual is sufficiently
sick and should therefore stay at home. We define this situation (δ < δ < δ) as
presenteeism of the individual. Recall that there is a daily health shock, implying
that we measure presenteeism on a daily basis.
Similar to the absence/attendance decision, we can also compute the probability of
presenteeism on a given day. In general, this is given by P = Pr(δ < δ < δ) = F (δ <
δ < δ). Again using F (δ) = δ, we obtain:
P = δ − δ. (5.8)
Finally, suppose that instead δ < δ holds. Then, a health shock realization of δ
< δ < δ implies that the individual chooses to be absent, while she is not sufficiently
sick from the firm’s perspective and should therefore be attendant. We define this
situation as absenteeism of the individual. Note, however, that in a situation where
absenteeism is possible – that is δ < δ, there is no presenteeism by definition.
6An alternative modeling approach would be to assume that πh depends directly on δ: ∂πh/∂δ <0. However, we then would not be able to find an explicit solution for δ. Thus, we use the formulationin (5.5) throughout.
87

5.2.4 Substitutes, complements or neither
Our model shows that the probabilities of absence and of presenteeism depend on the
individual critical level of sickness δ and on the firm critical level of sickness δ [see
(5.4) and (5.8)]. In turn, δ and δ are affected by variations in work-related factors
which are summarized in the vector X [see (5.3) and (5.7)]. Hence, we can use our
model to shed light on the following question: How does a variation in a work-related
factor – holding everything else constant – influence both the probability of absence
and the probability of presenteeism per day?
Suppose that one particular work-related factor included in the vector X changes
and denote this factor as x ∈ X. In general, we can distinguish three cases. First,
the variation of x implies a decrease (increase) in the absence probability, while the
probability of presenteeism increases (decreases). Then, a change in x leads to a
substitutive relationship between absence and presenteeism. Second, the change in x
leads to an increase (or decrease) in both the absence and the presenteeism probability.
Then, the change in x entails a complementary relationship between absence and
presenteeism. Third, the variation in x is associated with a change (no change) in
the probability of absence, while the probability of presenteeism remains constant
(changes). Then, x leads neither to a substitutive nor a complementary relationship
between presenteeism and absence.7
To determine under which conditions a change in work-related factor x leads to a
substitutive, a complementary or no relationship between absence and presenteeism,
recall first that variations of x influence δ and δ. Using (5.4), we can show that the
probability of absence increases (decreases) when δ decreases (increases):
dA =∂A
∂δ︸︷︷︸=−1
dδ > (≤) 0⇔ dδ < (≥) 0. (5.9)
Regarding the probability of presenteeism, (5.8) indicates that changes in δ and δ
influence P . If dδ < 0 (and thus dA > 0) holds, we get:
dP =∂P
∂δ︸︷︷︸=1
dδ︸︷︷︸<0
+∂P
∂δ︸︷︷︸=−1
dδ < (≥) 0⇔ dδ ≥ 0 or dδ < dδ < 0 (dδ ≤ dδ < 0). (5.10)
7Note that we use the statement “absence and presenteeism are substitutes (complements) withrespect to the changing work-related factor” as a synonym for case 1 (2). In the third case, we alsoformulate that “absence and presenteeism are neither substitutes nor complements with respect tothe changing work-related factor”.
88

If dδ ≥ 0 (and thus dA ≤ 0) holds, we find:
dP =∂P
∂δ︸︷︷︸=1
dδ︸︷︷︸≥0
+∂P
∂δ︸︷︷︸=−1
dδ > (≤)0⇔ dδ ≤ 0 or 0 < dδ < dδ (0 < dδ ≤ dδ). (5.11)
With these conditions at hand, we obtain the following propositions.
Proposition 1 Presenteeism and absence are substitutes with respect to a work-
related factor x (i) if the variations in δ and δ are oppositional or (ii) if the changes
of δ and δ have the same sign but the (absolute) change in δ is sufficiently weak.
Proof. A substitutional relationship requires dA > (<)0 and dP < (>)0. From
(5.9), we obtain dA > (<)0 ⇔ dδ < (>) 0. For dδ ≥ (≤)0, (5.10) and (5.11) show
that dP < (>)0 holds, which proves part (i) of the proposition. Eqs. (5.10) and
(5.11) indicate that dP < (>)0 also holds if the absolute change in δ is lower than
the absolute change in δ: dδ < dδ < 0 (0 < dδ < dδ). This proves part (ii) of the
proposition.
Proposition 2 Presenteeism and absence are complements with respect to a work-
related factor x if the changes in δ and δ have the same sign and the (absolute) change
in δ is sufficiently strong.
Proof. A complementary relationship requires dA > (<)0 and dP > (<)0. Eq.
(5.9) implies that dA > (<)0 ⇔ dδ < (>) 0. Observing (5.10) and (5.11), we find
that dP > (<)0 holds if the absolute change in δ is higher than the absolute change
in δ: dδ < dδ < 0 (0 < dδ < dδ).
Proposition 3 Presenteeism and absence are neither substitutes nor complements
with respect to a work-related factor x (i) if δ remains constant while δ changes or
(ii) if the changes in δ and δ are identical.
Proof. There is no relationship between absence and presenteeism if dA = ( 6=)0
and dP 6= (=)0 holds. From (5.9), we obtain dA = (6=)0⇔ dδ = (6=) 0. Given dδ = 0,
Eqs. (5.10) and (5.11) imply that dP 6= 0 ⇔ dδ 6= 0, which proves part (i) of the
proposition. If dδ 6= 0 holds, we see from (5.10) and (5.11) that dδ = dδ must hold in
order to ensure dP = 0, which proves part (ii) of the proposition.
These findings are based on the assumption δ > δ. However, it can be the case
that the reverse relation is true: δ < δ. As discussed in the previous subsection,
89

there is then no presenteeism by definition, and we normalize its probability to zero:
dP ≡ 0⇔ δ < δ. Note that in this scenario, the probability of absenteeism is positive.
Hence, we arrive at the following proposition:
Proposition 4 Presenteeism and absence are neither substitutes nor complements
with respect to a work-related factor x if δ < δ holds.
Summing up, there are three lessons from our model. First, the absence/attendance
decision is solely determined by the individual critical level of sickness. Second, we
find that presenteeism is determined by both the individual- and the firm critical
level of sickness since the health state of an individual also affects the firm’s profit.
Third, we show analytically under which conditions a change in work-related factor x
implies a substitutional, a complementary or no relationship between absence and pre-
senteeism. This result is particularly interesting since the literature on presenteeism
(implicitly) assumes that the relationship between both is substitutional (see Arons-
son and Gustafsson, 2005; Bierla et al., 2013; Brown and Sessions, 2004; Johansson
and Lundberg, 2004). In our theoretical analysis, we have shown that it is not obvious
whether a change in a work-related factor implies a substitutional, a complementary
or no relationship between absence and presenteeism. In the end, such a classification
is primarily an empirical question, to which we turn in the following section.
5.3 Empirical analysis
5.3.1 Data and empirical strategy
To analyse the impact of work-related characteristics on the relationship between ab-
sence and presenteeism empirically, we use the fifth wave of the EWCS, a repeated
cross-sectional survey on working conditions in Europe. The EWCS is conducted every
five years by an agency of the European Union and profits from a single questionnaire
guaranteeing consistent data across countries. In 2010, the EWCS covered for the
first and only time an item on sickness presenteeism and is hence the first large-scale
survey integrating information about sickness absence and presenteeism behaviour.
It comprises the population aged 15 and above living in 34 European countries. In
our investigation, we consider employees aged 18-65 years who have been employed
during the last 12 months prior to the interview and who have been working at least
10 hours per week, excluding the self-employed, students, apprentices, and employees
90

without work contracts.8
As the dependent variable in both sickness dimensions, we prefer the annual duration
over incidence or frequency measures for two reasons. First, the impact of sickness
on productivity depends much more on the annual duration than on the incidence
or frequency of the two sickness states. Second, the substitutive and complementary
impact of a work-related characteristic on absence and presenteeism is mostly felt at
the intensity of both sickness dimensions.
The sickness absence item reads as follows: “Over the past 12 months how many days
in total were you absent from work for reasons of health problems?” The sickness pre-
senteeism item asks: “Over the past 12 months did you work when you were sick? a)
Yes b) No. If yes, how many working days?” These two items have major advantages
compared to those which are widely used in the literature. On the one hand, asking
for the number of sickness presenteeism and absence days in an open question is less
prone to biased responses than offering predefined frequency categories as done by Jo-
hansson and Lundberg (2004). On the other hand, they fit well with our model where
daily absence decisions can be explained. The annual number of days in our empirical
investigation can be seen as the aggregated realization of daily absence decisions in the
model. Since the aggregation has no influence on the decision of individuals per day
due to the assumption of a daily health shock, we can use the derived proposition as
the economic intuition behind our results from the empirical investigation.9 Note that
we disregard outliers – that is, those with either more than 50 sickness presenteeism
or 100 absence days within 12 months, resulting in a loss of around 200 observations.
However, the central results do not depend on this sample selection (see robustness
checks). In total, the number of observations amounts to 18,447.
The descriptive statistics show that sickness absence and presenteeism is a widespread
and quantitatively relevant phenomenon in Europe (Table 5.1). The average number
of sickness presenteeism and absence days amounts to 2.4 and 5.3, respectively. The
conditional means amount to almost seven presenteeism days and more than ten ab-
sence days. The distribution of the conditional sickness presenteeism and absence
days is shown in Figure 1.
8The sample covers all 27 European Union member states, Albania, Croatia, Kosovo, Macedonia,Montenegro, Norway, and Turkey. Note further that we disregard employees unrealistically claimingto work more than 80 hours per week. The results are not sensitive to the exclusion of either thoseworking less than 10 or more than 80 hours per week.
9One remark: In our model, presenteeism was defined by a situation where the individual choosesto be attendant despite the fact that her sickness level exceeds the firm critical level of sickness. Ifwe adopt our model to the EWCS presenteeism item, “work when you were sick” means that theindividual worked despite the fact that she was sufficiently sick from the firm’s perspective.
91

[Figure 1 about here.]
Since we are interested in the relationship between work-related characteristics and
absence/presenteeism, we have to select specific work-related characteristics and cover
them empirically. In our cross-sectional model, this selection of explanatory variables
is key and must be done as comprehensively as possible. Therefore, we guide our
choice by the literature on sickness absence behaviour (Frick and Malo, 2008; Livanos
and Zangelidis, 2013; Puhani and Sonderhof, 2010; Ziebarth and Karlsson, 2010), by
the results from Chapter 4 and by the literature on sickness presenteeism (Aronsson
et al., 2000; Aronsson and Gustafsson, 2005; Bockerman and Laukkanen, 2009, 2010;
Hansen and Andersen, 2008; Leineweber et al., 2011; Preisendorfer, 2010).
Among the work-related variables, we include rather formal job characteristics such as
supervisory and blue collar status, temporary contracts, tenure categories (1-2 years,
3-14 years, ≥ 15 years), weekly working hours, whether working in a second job and
during evenings or weekends (unusual working time), net income (21 ordinal cate-
gories), firm size, industry (modified NACE-17 classification) and sector information
(private sector). Additionally, we take the more subjective properties of a job into
account such as work interdependence, work autonomy, job insecurity, satisfaction
with working conditions, support by co-workers and the management, and time pres-
sure (lack of time to get work done).10 The corresponding descriptive statistics are
provided in Table 5.1.
[Table 5.1 about here.]
Besides the work-related characteristics, we control for sociodemographic variables
and health status. As sociodemographic variables, we include sex (female=1), having
children, living with a partner, age categories (aged 18-24, 25-34, 35-44, 45-54, and 55-
65 years), and educational status (primary, secondary and higher education status).
The health status is taken into account by four subjective categories (very good, good,
fair and, finally, bad and very bad in one category) and an objective index measuring
the number of different kinds of health problems from which the respondent has suf-
fered during the last 12 months.11 Although the generosity of sick pay entitlements
10Work interdependence indicates whether work speed depends on other employees, and job in-security measures the likelihood of loosing one’s job within six months on a five point Likert scale.Work autonomy is captured by an index measuring the number of autonomy dimensions in which theemployee has control – specifically, work order, methods and speed. The other subjective variablesare measured on different Likert scales.
11Regarding the subjective measure, we integrated the two worst categories into one single category
92

is crucial for absence behaviour (Frick and Malo, 2008; Puhani and Sonderhof, 2010;
Ziebarth and Karlsson, 2010), we prefer including country dummies, which is a better
way to account for aggregated country differences (labour market institutions, social
norms, health care and other country-specific effects) in cross-sectional data sets.
To find out whether a change of a work-related factor implies a substitutive, comple-
mentary or no relationship between sickness presenteeism and absence, we investigate
separately how they are related to the number of presenteeism and absence days and
classify them accordingly.
A substitutive relationship between presenteeism and absence days is given if a work-
related factor leads to an opposite change in these two sickness states. For a comple-
mentary relationship between presenteeism and absence days, a work-related factor
affects both sickness states at the same time either positively or negatively. Finally,
if a work related factor is either significantly related to sickness presenteeism or ab-
sence, its relationship is neither substitutive nor complementary.
For that purpose, we investigate the relationship between the work-related character-
istics and the number of presenteeism and absence days by estimating OLS regression
models with cluster adjusted standard errors at the country level. Since there is no
panel data on presenteeism available at the moment, we can offer only cross-sectional
correlations which should be kept in mind when interpreting the ensuing results. De-
spite having a count data structure with excess zeros, we prefer OLS to count data
models since they are less contingent on distributional assumptions and easier to inter-
pret (for count data models, see Cameron and Trivedi, 1998, pp. 59ff.). Particularly,
assuming an average linear relationship between independent and dependent variable,
OLS models make it easier to draw a general picture with regards to a substitutive,
a complementary or no relationship than count data models where there might be
different effects at different points on the distribution. To be sure that our results
do not depend on this simplifying assumption, we present a zero-inflated negative
binomial regression model (ZINB) as a robustness check.
since only 0.2 percent of the sample claimed to have a very bad health status. The health problemsinclude: hearing problems; skin problems; backache; muscular pain in shoulders, neck and/or upperlimbs; muscular pain in lower limbs; headaches and eyestrain; stomach ache; respiratory difficul-ties; cardiovascular diseases; injuries; depression or anxiety; overall fatigue and insomnia or generalsleeping problems. Using dummy variables for each of these health problems instead of the theirnumber did not improve the fit of the model while leaving the main results unchanged and was hencediscarded. The corresponding results are available upon request.
93

The econometric model reads as follows:
absence/presenteeism daysi =α0 + work characteristics′iα1 + health status′iα2
+ sociodemographics′iα3 + country′iα4 + εi.
Here, presenteeism/absence daysi indicate the number of days either spent at work
while being sick or absent during 12 months for individual i. work characteristicsi,
health statusi and sociodemographicsi represent the different vectors of indepen-
dent variables. In order to account for country-specific effects, we include country
dummies, and εi is the error term.
5.3.2 Predictions
Before we turn to the results of our empirical investigation, let us look at some ex-
pectations regarding the relationship between sickness presenteeism and absence with
respect to the considered work-related characteristics. As stated above, the literature
on sickness presenteeism often argues that changes in work-related factors lead to a
substitutive relationship between presenteeism and absence (Aronsson and Gustafs-
son, 2005; Bierla et al., 2013; Brown and Sessions, 2004; Johansson and Lundberg,
2004). In an extreme interpretation of this, the choice between both sickness states is
simply a zero-sum game. However, the results of our theoretical model (Propositions
1-4) are at odds with this view. There is clear theoretical evidence that, for example,
a change in a work-related factor can also increase both sickness states at the same
time. Whether the relationship is substitutive, complementary or simply non-existing
depends on the relative changes of the individual critical level of sickness δ and the
firm critical level of sickness δ.
This conclusion establishes a second way to find predictions, which consists of two
steps: (i) Derive expectations for the sign and the magnitude of changes in δ and δ
for each covered work-related factor. (ii) Adopt the results summarized in Proposi-
tions 1-4 to formulate a prediction as to whether this variation is associated with a
substitutive, a complementary or no relationship between absence and presenteeism.
Concerning step 1, we make use of the fact that changes in the individual critical level
δ determine individuals’ absence behaviour [see (5.4)]. Hence, the sign of changes in
δ can be deduced from the empirical literature on absence behaviour with regards to
the considered work-related characteristics.12 In contrast, changes in the firm critical
12We consulted Frick and Malo (2008) regarding firm size, private sector, and income; Puhani andSonderhof (2010) regarding tenure, firm size, income and blue collar; Goerke and Pannenberg (2012)regarding work autonomy, firm size, blue collar and income; Stormer and Fahr (2012) regarding
94

level of sickness δ are driven by the relation between the profit in the case of the em-
ployee’s absence and the profit in the case of his or her attendance. According to the
literature (Pauly et al., 2008; Nicholson et al., 2006), the cost of absence (πa − πh in
our model) depends on three characteristics: i) the degree of team-oriented production
versus individual-oriented production, ii) costs and availability of substitutes and iii)
the magnitude of penalty associated with output shortfalls. Following these criteria,
we categorize the work-related factors as favourable (implying an increase in δ) or
unfavourable (implying a decrease in δ) to the worker’s attendance.13 Unfortunately,
the literature does not provide any indicators to derive the magnitude of the changes
in δ and δ. In addition, even the sign of these changes remains unclear in some cases.
Table 5.2 summarizes our predictions.
[Table 5.2 about here.]
Without knowing the magnitude of the changes in δ and δ, step 2 – the adoption of
our model – implies that we cannot predict whether or not absence and presenteeism
are complements with respect to the changing work-related factor. However, as stated
in Proposition 1, it is nevertheless possible to predict a substitutive relationship. The
sufficient condition for this is that the changes in δ and δ are oppositional, irrespective
of their magnitude. Therefore, we expect a variation in job insecurity and temporary
contracts to lead to a substitutive relationship between both sickness states.
5.3.3 Econometric results
The regression outcomes are depicted in Table 5.3, in which we present the determi-
nants of absence and presenteeism days in columns (1) and (2), respectively. As our
first result, we find that the supervisor is the only work-related variable that leads
to a substitutive relationship, with more presenteeism days at the expense of absence
days. This is a very remarkable finding because it is at odds with the common view in
the literature that employees’ choice between absence and presenteeism is a zero-sum
game. Furthermore, it contradicts our expectations that sickness absence and presen-
teeism are substitutes with respect to perceived job security and temporary contracts.
firm size, tenure and temporary contract and Livanos and Zangelidis (2013) regarding second job.Finally, with regard to some work-related characteristics, we do not find a clear expectation fromthe literature. This is the case for tenure, work load (weekly hours and lack of time), social support,income, work interdependence and unusual working time.
13For some variables, these three dimensions point to counteracting effects with regard to the profitsituation in the case of attendance (good working conditions, private sector, social support, firm size,blue collar and work autonomy), or their impact on profits is a priori not clear (weekly hours, tenureand second job).
95
What are the consequences of the observed lack of substitutive relationships between
both sickness states with respect to work-related factors? To answer this question,
we use our model presented in the previous section. On the one hand, we see from
Proposition 1 that a substitutive relationship requires a sufficiently weak or no change
in the firm critical level of sickness δ. On the other hand, we see from Propositions 2
and 3 that a complementary or no relationship crucially depends on the change in δ.
If this variation is sufficiently strong, we obtain a complementary relationship. If this
change is identical to the variation in the individual critical level of sickness δ, there
is no relationship. This is also true if δ remains constant while δ changes.
Therefore, the combination of our model’s results and the first empirical finding (only
one substitutive relationship) suggests that the firm critical level of sickness plays an
important role for the interdependence between sickness absence and presenteeism.
This also implies that the idea of a fixed-sized number of unprodctive sickness days
that can be differently shared between absence and presenteeism is too simple and
that the definition of sickness itself can be influenced by work-related factors via
the firm-critical level as well. The endogenous firm critical level of sickness is, thus,
the major innovation of our model compared to that of Brown and Sessions (2004).
Regarding the work-related factor of supervisor, our model allows another corollary:
Proposition 1 in connection with the empirical result suggests that the difference be-
tween supervisors and non-supervisors with regards to their individual critical level
of sickness δ is positive and larger than that with regard to their firm critical levels
δ. This implies that supervisors differ more strongly in their absence decision than in
their impact on profits from non-supervisors.
[Table 5.3 about here.]
The second result of our empirical investigation is that only a few complemen-
tary relationships exist between absence and presenteeism days with respect to work-
related factors.14 To be more specific, working conditions and tenure are significantly
related to both sickness categories in the same direction. Good working conditions
reduce the number of absence and presenteeism days. In contrast, longer tenure is
related to more days in both sickness states, with a stronger effect on absence days.
We can interpret this finding by observing Proposition 2: Working conditions and
tenure more strongly affect the impact of sickness on profitability (δ) than the indi-
vidual absence decision (δ). So, they primarily change the effect of sickness for the
14This lack in substitutes and complements is not a specific result for the work-related charac-teristics but does hold also true for the sociodemographics. Here, only sex has a complementaryrelationship with absence and presenteeism. Health status is of course significantly related to both.
96

firm and less so for the employee. From a managerial perspective, these two results
are particular interesting. On one hand, offering good working conditions does not
lead to more presenteeism as one may have expected; it even is associated with less
presenteeism and also reduces absence. On the other hand, experienced and trustful
employees – that is, those with long tenure – are not only less often attendant but also
more often inhibited in their productivity through sickness when attendant. Whether
the productivity increasing experience effect of tenure or the negative sickness effect
prevails is an open question for further research.
As shown in Table 5.3, the majority of the work-related factors has either an impact
on sickness absence days or on presenteeism days while leaving the other unaffected.
Let us first look at the case in which absence behaviour changes while presenteeism
remains unaffected. Working under a temporary contract, in the private sector, in a
larger plant or as a blue collar worker and being dependent on the work speed of one’s
coworkers (interdependence) are only significantly related to the number of absence
days, while they are statistically insignificant in the presenteeism regression. Working
under a temporary contract and in the private sector are associated with significantly
less absence days, while working in a larger plant, as a blue collar worker and being
dependent on the work speed of one’s coworkers are positively related to the number
of absence days.
Again, we can use our model to find an explanation for this result. There are two possi-
ble constellations: On the one hand, Proposition 3(ii) states that both the individual-
and firm critical level of sickness must change by the same magnitude (and sign) in
order to ensure that only absence varies with a change in a work-related factor. On
the other hand, Proposition 4 shows that a variation in absence without a change
in presenteeism is the result of a change in δ if δ < δ since then the probability of
presenteeism is zero by definition. Note that in this situation, a health shock which
lies in the interval [δ, δ] implies that the individual chooses to be absent, while she
is not sufficiently sick from the firm’s perspective. We have defined this scenario as
absenteeism where individuals absent themselves illegitimately from work. Since the
latter case is more likely, we conclude that the above-mentioned work-related factors
do not only leave presenteeism unaffected but might also be associated with a change
in absenteeism behaviour.
For temporary contracts, employment in the private sector and in smaller firms, this
conclusion fits very well with the literature that suggests that these factors make
illegitimate absence more costly (probably due to less employment protection, cf.
Riphahn, 2004; Ichino and Riphahn, 2005). Albeit reducing absence, these character-
97

istics do not come at the cost of increased presenteeism here. With data collected in
2010, the peak of the economic crisis in Europe with its increasing unemployment and
general economic insecurity, this is a rather hard test since we would expect to find
strong effects that might have appeared in this situation also at the cost of increased
presenteeism.
Next, let us turn to the other case where presenteeism changes while absence is un-
affected. As shown in Table 5.3, work load and autonomy are associated with more
sickness presenteeism days, while support by colleagues and management is associ-
ated with less. Hence, there are no strong signs that those who are overworked try
to cope with their work load by substituting absence with presenteeism. Proposition
3(i) shows that a simple change in the firm critical level (δ) and a constant individual
critical level of sickness can explain this outcome. This suggests that the work load
of an employee (lack of time, usually worked hours per week and second job), social
support and work autonomy affect only the impact of sickness on the firm’s profit sit-
uation while leaving the individual’s utility trade off between absence and attendance
unchanged.
5.3.4 Robustness checks
As robustness checks, we present in Table 5.4 count data models as well as OLS models
in differently defined (sub)samples. Estimating zero-inflated negative binomial regres-
sion models largely confirms our results (columns 1 and 2). Unusual working times –
such as working weekends or evenings, and working in two jobs – gain significance in
the presenteeism model.
[Table 5.4 about here.]
Restricting our sample to EU member states which are characterized by a more
homogeneous institutional setting (columns 3 and 4) does not alter our results, ei-
ther. In fact, the results are quite similar to those obtained in the count data model.
Accordingly, unusual working time and second job are significantly related to pre-
senteeism in the EU sample as well. As a further robustness check, we restrict our
sample to employees that have been sick during the last 12 months, since one can only
substitute between sickness states when being sick at all (columns 5 and 6). Here,
work autonomy turns out to also lead to a substitutive relationship between sickness
absence and presenteeism, while the qualitative findings for the other controls remain
mostly stable. Even here we find only two substitutes which – additionally – measure
quite similar things. Hence, this is only a small caveat since supervisors are, among
98

others, characterized by more work autonomy.
Finally, including (some) of the outliers – that is, those with up to 150 absence or
presenteeism days in 12 months, does not fundamentally change our results either (not
shown in Table 5.4 but available upon request). The absence model is more affected
than the presenteeism model, where the significance is reduced to the 10 percent level
for the coefficients of the supervisor, job insecurity and work interdependence vari-
ables, while the only weakly significant second job effect becomes insignificant in the
presenteeism model.
5.4 Conclusion
In this chapter, we ask whether certain work-related factors lead to a substitutive,
a complementary or no relationship between the two sickness states of absence and
presenteeism. Using cross-sectional data from the EWCS, we show in OLS regressions
that only one out of 16 work-related factors, namely the supervisor status, implies a
substitutive relationship between absence and presenteeism. This finding is at odds
with the predominant view in the literature that presenteeism behaviour is simply the
residuum of sickness absence. In addition, there are also only two work-related fac-
tors, namely working conditions and tenure, for which a complementary relationship
between both sickness states can be observed. The bulk of work-related factors is only
related to one of the sickness states while leaving the other unaffected. This finding
shows that it is possible to reduce either absence or presenteeism without shifting
the negative productivity effect of sickness to the other sickness state, hence raising
the overall number of unimpaired working days. These results are remarkably robust
against count data models and in differently defined subsamples.
In addition to our empirical investigation, we present a theoretical model which is
able to explain the aforementioned results. Our theory shows that if a work-related
factor changes only the individual’s utility trade-off regarding their absence decisions,
then we always obtain a substitutive relationship between absence and presenteeism.
However, if a work-related factor also implies a change in the firm’s profit, the firm
critical level adjusts and – depending on the sign and magnitude of this change –
there can also be a complementary or no relationship between both sickness states.
Hence, the new endogenous firm critical level is crucial in so far as it allows us to
obtain a non-substitutive relationship between absence and presenteeism, which is
the dominant empirical finding. This also implies that the idea of a fixed-sized num-
ber of unproductive sickness days that can be differently shared between absence and
99

presenteeism is too simple and that the definition of sickness via the firm critical level
can be influenced by work-related factors as well.
Although our results are based on cross-sectional correlations only, and hence causal
interpretations should be taken cautiously, our investigation offers advantages in other
dimensions. Particularly, we are able to identify situations which are associated with
absenteeism – that is, illegitimate absence. This is the case for employees in the public
sector, in larger firms and with open-ended contracts who are associated with more
absence but not fewer presenteeism days.
100

5.5 Appendix
Figure 5.1: Distribution of sickness absence and presenteeism days conditional on absence and pre-senteeism. Observations with zero sickness absence and presenteeism days not shown but includedin analysis (49 and 64 % of the full sample, respectively). Source: 2010-EWCS. Own calculations,survey weights used.
101

Table 5.1: Descriptive statistics
Variable Obs. Mean Std.Dev.
Min. Max.
Sickness presenteeism days 18,447 2.37 4.9 0 50Sickness absence days 18,447 5.30 4.9 0 100
Work-related characteristicsTenure (<1 years) 18,447 0.08 0.27 0 1Tenure (1-2 years) 18,447 0.17 0.38 0 1Tenure (3-14 years) 18,447 0.20 0.5 0 1Tenure (≥ 15 years) 18,447 0.25 0.43 0 1
Work autonomy index 18,447 1.92 1.19 0 3Supervisor 18,447 0.15 0.36 0 1
Usual weekly working hours 18,447 38.0 9.1 10 80Lack of time to get work done 18,447 2.11 0.99 1 5Unusual working time 18,447 0.58 0.49 0 1Second job 18,447 0.07 0.26 0 1
Good working conditions 18,447 3.04 0.68 1 4Social support 18,447 5.58 1.94 1 8
Job insecurity 18,447 2.18 1.19 1 5Blue collar worker 18,447 0.34 0.47 0 1Temporary contract 18,447 0.13 0.33 0 1Net income category 18,447 11.37 3.84 1 21Work interdependence 18,447 0.46 0.50 0 1Size (<10 employees) 18,447 0.27 0.45 0 1Size (10-49 employees) 18,447 0.34 0.47 0 1Size (50-99 employees) 18,447 0.13 0.34 0 1Size (100-249 employees) 18,447 0.11 0.31 0 1Size (≥250 employees) 18,447 0.15 0.36 0 1Private sector 18,447 0.67 0.47 0 1
Socio-demographic controlsSex (female=1) 18,447 0.46 0.50 0 1Children 18,447 0.54 0.50 0 1Partnership 18,447 0.74 0.44 0 1Age (18-24 years) 18,447 0.07 0.26 0 1Age (25-34 years) 18,447 0.26 0.44 0 1Age (35-44 years) 18,447 0.29 0.46 0 1Age (45-54 years) 18,447 0.26 0.44 0 1Age (55-65 years) 18,447 0.11 0.32 0 1Primary education 18,447 0.31 0.46 0 1Secondary education 18,447 0.34 0.47 0 1Higher education 18,447 0.36 0.48 0 1
Health statusVery good health 18,447 0.26 0.44 0 1Good health 18,447 0.55 0.50 0 1Fair health 18,447 0.18 0.39 0 1Bad and very bad health 18,447 0.02 0.13 0 1# of health problems 18,389 2.69 2.36 0 14
Source: 2010-EWCS. Own calculations, survey weights used.
102

Table 5.2: Predictions from the literature
Variable dδ dδ
Temporary contract > 0 < 0Job insecurity > 0 < 0Supervisor > 0 > 0Private sector > 0 ?Good working conditions > 0 ?Work autonomy index > 0 ?Blue collar worker < 0 ?Firm size < 0 ?Second job > 0 ?Lack of time to get work done ? > 0Unusual working time ? > 0Social support ? ?Net income category ? > 0Work interdependence ? > 0Tenure ? ?Usual weekly working hours ? ?
103

Table 5.3: Regression results
(1) (2)Absence Presenteeism
Substitutes
Supervisor -0.764∗∗∗ (-3.15) 0.332∗∗∗ (3.23)
Complements
Good working condit. -0.527∗∗∗ (-3.38) -0.271∗∗∗ (-3.09)Tenure (<1 years) (base) (base)Tenure (1-2 years) 1.114∗∗∗ (3.90) 0.696∗∗∗ (4.57)Tenure (3-14 years) 1.876∗∗∗ (5.21) 0.776∗∗∗ (5.31)Tenure (≥ 15 years) 1.916∗∗∗ (4.20) 1.093∗∗∗ (6.66)
Only absence
Private sector -1.305∗∗∗ (-6.07) -0.070 (-0.66)Temporary contract -1.106∗∗∗ (-3.85) 0.010 (0.08)Work interdependence 0.400∗∗ (2.51) 0.026 (0.41)Blue collar 0.635∗∗ (2.47) -0.089 (-1.18)Size (<10 employees) (base) (base)Size (10-49 employees) 0.786∗∗∗ (3.27) 0.111 (0.99)Size (50-99 employees) 0.427 (1.54) 0.126 (1.06)Size (100-249 employees) 1.114∗∗∗ (3.20) 0.193 (1.16)Size (>250 employees) 1.341∗∗∗ (3.59) 0.084 (0.60)
Only presenteeism
Lack of time -0.101 (-0.95) 0.168∗∗∗ (2.90)Usual weekly hours -0.008 (-0.53) 0.027∗∗∗ (3.98)Work autonomy -0.070 (-0.84) 0.205∗∗∗ (3.85)Second job -0.429 (-1.53) 0.308∗ (1.79)Social support -0.058 (-1.11) -0.073∗∗∗ (-2.90)
Insignificant
Net income 0.013 (0.30) -0.021 (-0.96)Job insecurity 0.111 (1.30) 0.021 (0.46)Unusual working time -0.136 (-0.96) 0.124 (1.55)
Control variables Yes Yes
N 18447 18447R2 0.11 0.14
Source: 2010-EWCS, own calculations. Notes: Coefficient esti-mates are from OLS regressions. The dependent variables are thenumber of sickness absence days in column (1) and the numberof sickness presenteeism days in column (2), both including thosewith zero days. All variables shown in the table except good workingconditions, lack of time, usual weekly hours, work autonomy, socialsupport, net income and job insecurity are dummies (see Table 5.1for descriptive statistics). Sociodemographic and health variablesas well as country and industry dummies (modified NACE 17) areincluded as control variables but are not shown. The sociodemo-graphic controls comprise sex, having children, partnership status,age categories and educational status. The health status comprisesa subjective and an objective measure of health measuring the num-ber of different health problems during the last 12 months. T-statistics based on standard errors clustered on the country levelare in parentheses. ∗∗ p < 0.05, ∗∗∗ p < 0.01.

Tab
le5.
4:R
obust
nes
sch
ecks
(1)
(2)
(3)
(4)
(5)
(6)
Ab
sen
ceP
rese
nte
eism
Ab
sen
ceP
rese
nte
eism
Ab
sen
ceP
rese
nte
eism
Cou
nt
dat
am
od
elE
U-2
7C
on
dit
ion
al
on
sick
nes
s
Su
per
vis
or-0
.808∗∗∗
(-3.
43)
0.2
12∗∗
(2.3
0)
-0.9
07∗∗∗
(-3.6
0)
0.3
23∗∗
(2.7
5)
-1.0
05∗∗∗
(-2.7
6)
0.5
20∗∗∗
(3.6
2)
Good
wor
kin
gco
nd
it.
-0.4
76∗∗∗
(-3.
39)
-0.2
03∗∗∗
(-2.8
7)
-0.6
02∗∗∗
(-3.3
9)
-0.2
76∗∗∗
(-2.8
7)
-0.4
08∗
(-1.8
0)
-0.2
27∗
(-1.8
5)
Ten
ure
(<1
yea
rs)
(bas
e)(b
ase
)(b
ase
)(b
ase
)(b
ase
)(b
ase
)T
enu
re(1
-2ye
ars)
1.18
0∗∗∗
(3.2
1)0.6
67∗∗∗
(4.0
8)
1.1
95∗∗∗
(3.6
9)
0.7
21∗∗∗
(4.1
6)
0.7
36
(1.4
3)
0.5
27∗∗
(2.5
7)
Ten
ure
(3-1
4ye
ars)
1.95
3∗∗∗
(4.4
3)0.7
45∗∗∗
(4.9
5)
2.0
73∗∗∗
(5.2
5)
0.7
54∗∗∗
(4.6
0)
1.6
13∗∗
(2.5
6)
0.5
19∗∗
(2.7
1)
Ten
ure
(≥15
yea
rs)
1.93
3∗∗∗
(3.7
0)1.0
38∗∗∗
(6.2
8)
2.2
15∗∗∗
(4.6
0)
1.0
41∗∗∗
(5.7
7)
1.2
84
(1.6
9)
0.8
90∗∗∗
(3.7
9)
Pri
vate
sect
or-1
.403∗∗∗
(-6.
41)
-0.0
97
(-0.9
7)
-1.2
85∗∗∗
(-5.9
3)
-0.0
61
(-0.5
1)
-1.8
92∗∗∗
(-6.7
1)
-0.0
42
(-0.3
0)
Tem
por
ary
contr
act
-1.2
86∗∗∗
(-3.
89)
-0.0
26
(-0.2
1)
-0.9
43∗∗∗
(-3.0
6)
-0.0
42
(-0.3
0)
-1.9
07∗∗∗
(-4.6
2)
0.0
42
(0.2
0)
Wor
kin
terd
epen
den
ce0.
332∗∗
(2.0
2)0.0
55
(0.9
8)
0.4
11∗∗
(2.3
9)
0.0
11
(0.1
7)
0.4
33∗
(1.7
2)
-0.0
41
(-0.4
9)
Blu
eco
llar
0.62
2∗∗
(2.3
2)-0
.051
(-0.6
3)
0.7
20∗∗
(2.4
2)
-0.0
74
(-0.9
4)
1.2
95∗∗∗
(3.0
8)
-0.0
25
(-0.1
9)
Siz
e(<
10em
plo
yees
)(b
ase)
(base
)(b
ase
)(b
ase
)(b
ase
)(b
ase
)S
ize
(10-
49em
plo
yees
)0.
683∗∗∗
(2.9
1)0.0
91
(0.8
3)
0.7
93∗∗∗
(2.9
6)
0.2
23∗
(1.9
7)
1.2
38∗∗∗
(3.6
8)
0.1
52
(0.9
1)
Siz
e(5
0-99
emp
loye
es)
0.30
1(1
.10)
0.1
16
(0.9
3)
0.3
63
(1.2
5)
0.1
65
(1.2
4)
0.3
63
(0.9
7)
0.0
88
(0.5
2)
Siz
e(1
00-2
49em
plo
yees
)0.
741∗∗
(2.3
2)0.1
85
(1.1
3)
1.1
54∗∗∗
(2.9
4)
0.2
54
(1.3
7)
1.3
12∗∗∗
(2.8
5)
0.1
03
(0.4
6)
Siz
e(>
250
emp
loye
es)
0.94
7∗∗
(2.5
0)0.0
55
(0.4
2)
1.3
63∗∗∗
(3.3
8)
0.1
32
(0.9
2)
1.5
98∗∗∗
(3.2
9)
-0.0
55
(-0.3
2)
Wor
kau
ton
omy
-0.0
67(-
0.68
)0.2
25∗∗∗
(4.2
6)
-0.0
26
(-0.2
9)
0.2
62∗∗∗
(5.2
2)
-0.2
61∗∗
(-2.1
9)
0.2
82∗∗∗
(4.3
4)
Lac
kof
tim
e-0
.017
(-0.
16)
0.1
24∗∗
(2.5
3)
-0.1
25
(-1.0
7)
0.1
58∗∗
(2.4
9)
-0.2
23
(-1.5
3)
0.1
96∗∗∗
(2.9
3)
Usu
alw
eekly
hou
rs0.
008
(0.5
3)0.0
28∗∗∗
(4.9
1)
-0.0
06
(-0.3
7)
0.0
28∗∗∗
(3.7
6)
-0.0
21
(-0.9
7)
0.0
38∗∗∗
(3.8
6)
Unu
sual
wor
kin
gti
me
-0.1
86(-
1.48
)0.1
83∗∗
(2.4
6)
-0.1
58
(-1.0
0)
0.1
82∗∗
(2.2
2)
-0.3
91∗
(-1.8
6)
0.1
00
(0.7
6)
Sec
ond
job
-0.3
33(-
1.09
)0.2
84∗∗
(2.2
3)
-0.2
46
(-0.8
8)
0.3
98∗∗
(2.6
2)
-0.9
36∗∗∗
(-2.8
7)
0.2
53
(1.1
8)
Soci
alsu
pp
ort
-0.0
09(-
0.20
)-0
.059∗∗
(-2.4
6)
-0.0
57
(-1.0
4)
-0.0
86∗∗∗
(-3.2
9)
-0.0
39
(-0.6
0)
-0.0
95∗∗
(-2.5
8)
Net
inco
me
-0.0
09(-
0.19
)-0
.012
(-0.5
5)
0.0
16
(0.3
2)
-0.0
30
(-1.2
3)
-0.0
06
(-0.1
1)
-0.0
48
(-1.5
4)
Job
Inse
curi
ty0.
056
(0.7
7)0.0
31
(0.8
7)
0.1
40
(1.5
7)
0.0
46
(0.9
9)
0.1
61
(1.3
7)
0.0
33
(0.5
5)
Con
trol
vari
able
sY
esY
esY
esY
esY
esY
es
N18
447
18447
16065
16065
11713
11713
R2
0.1
10.1
40.1
00.1
2
Sou
rce:
2010
-EW
CS
,ow
nca
lcu
lati
ons.
Not
es:
Ave
rage
marg
inal
effec
tsfr
om
zero
-in
flate
dn
egati
veb
inom
ial
regre
ssio
ns
inC
olu
mn
s(1
)an
d(2
),co
effici
ent
esti
mat
esfr
omO
LS
regr
essi
ons
inC
olu
mn
s(3
)-(6
).T
he
dep
end
ent
vari
ab
les
are
the
nu
mb
erof
sick
nes
sab
sen
ced
ays
inco
lum
ns
(1),
(3)
and
(5)
and
the
nu
mb
erof
sick
nes
sp
rese
nte
eism
day
sin
colu
mn
(2),
(4)
an
d(6
),b
oth
incl
ud
ing
those
wit
hze
rod
ays.
All
vari
ab
les
show
nin
the
tab
leex
cep
tgood
workingconditions,
lack
oftime,
usualweeklyhours
,work
autonomy,
socialsupport
,net
income
an
djobinsecurity
are
du
mm
ies
(see
Tab
le5.
1fo
rd
escr
ipti
vest
atis
tics
).S
oci
od
emogra
ph
icand
hea
lth
vari
ab
les
as
wel
las
cou
ntr
yan
din
du
stry
dum
mie
s(m
od
ified
NA
CE
17)
are
incl
ud
edas
contr
olva
riab
les
bu
tn
otsh
own
.T
he
firs
ttw
oes
tim
ati
on
sre
lyon
the
full
sam
ple
of
18,4
47
ob
serv
ati
on
s.C
olu
mn
s(3
)an
d(4
)re
lyon
the
obse
rvat
ion
sfr
omth
eE
U-2
7co
untr
ies,
i.e.
16,0
65
ob
serv
ati
on
s,an
dco
lum
ns
(5)
an
d(6
)re
lyon
lyon
ob
serv
ati
on
sth
at
hav
eat
least
on
esi
ckn
ess
day
,b
eit
abse
nce
orp
rese
nte
eism
(11,
713
obse
rvati
ons)
.T
-sta
tist
ics
base
don
stan
dard
erro
rscl
ust
ered
on
the
cou
ntr
yle
vel
are
inp
are
nth
eses
.∗∗
p<
0.05
,∗∗∗p<
0.0
1.
105


Chapter 6
Summary
This thesis contributes to the better understanding of sickness related issues in the
labour market. In the first part, we are interested in sickness absence and labour
market institutions. Specifically, in Chapter 2, we examine whether differences in
the stringency of the social norm against benefit fraud, so-called benefit morale, can
explain cross-country diversity in sick pay generosity. Our theoretical model reveals
counter-acting effects of benefit morale on the politically determined level of sick pay
entitlements along the following lines: As stricter benefit morale reduces absence be-
haviour in the population, we observe on the one hand a positive (price) effect, since
this makes the insurance cheaper. On the other hand, as a stricter socially shared
norm makes the median voter less likely to be absent herself, she prefers a reduced
fee over more insurance (probability effect). Numerical simulations and an empirical
investigation covering 31 developed countries from 1981 to 2010 show that the posi-
tive price effect dominates at low levels of benefit morale, while it is compensated for
by the probability effect at higher levels turning it negative. Hence, we find a hump
shaped relationship between benefit morale and sick pay generosity.
While the relationship between benefit morale and the institutions that insure against
unemployment has already been investigated (Algan and Cahuc, 2009), we are the first
to investigate benefit morale as a determinant of sick pay generosity. Transferring their
idea to the insurance against income loss due to sickness delivers fruitful new insights.
Particularly, the negative relationship in the upper part of the benefit morale dis-
tribution is a sick pay specific finding, since the social norm affects sickness absence
in a more direct way than unemployment, where only the unemployed are affected
through lower search effort. While a strict benefit morale is a social precondition for a
generous insurance against unemployment (cf. Algan and Cahuc, 2009), in the case of
sickness absence, benefit morale also functions as a substitute for the insurance since
107

it reduces the insurance case. In a next step it would be interesting to see whether
this also holds true for other welfare programs, such as disability insurance. Finally,
we contribute to the literature by combining, for the first time, positive theory, that
is a political economy model, with real institutional data to investigate benefit morale
as a determinant of welfare state generosity.
In Chapter 3, which is joint work with Tobias Brandle and Laszlo Goerke, we are inter-
ested in how a specific German labour market institution shapes absence behaviour.
Specifically, we ask whether non-union workforce representation by works councils
affects employees’ absence behaviour and if so whether that causes problems for the
firms. Using representative individual absence data (SOEP), we find that employees
working in a plant with a works council are about three percentage points more likely
to be absent at all during a calender year (absence incidence) and that they miss one
day more per year compared to those working in a plant without a works council
(annual duration). Linked employer-employee data (LIAB) additionally suggests that
these higher absence rates in plants with works councils cause problems for the man-
agement. While works councils have been a fundamental part of the German industrial
relations system in Western Germany well before 1990, they have been introduced in
the eastern part of the country after re-unification in 1990 only. This is mirrored
by a stronger relationship between works councils and all three absence indicators
(incidence, annual duration and personnel problems due to absence) in western Ger-
many. Additionally, the correlation can be interpreted causally for absence incidence
in Western Germany where we find significant effects in a difference-in-differences ap-
proach.
Chapter 3 adds to the literature on work place representation and offers a new way
in which works councils affect employee behaviour and firm performance. In the per-
spective of the seminal article by Freeman and Lazear (1995), our results can be seen
as new evidence that works councils protect employees against their employers and
thereby give them the opportunity to be absent more often (keeping individual health
status constant). Our findings with regard to personnel problems suggest that higher
absence rates in plants with works councils cannot be compensated for by better
working conditions or an optimized work process potentially entailed by employment
participation. An open question for future research is whether the higher absence
rates in plants with works councils are brought about by less presenteeism or through
more illegitimate absence. We were not able to address this important issue as the
data available do not contain information on presenteeism.
The second part of this thesis deals with sickness presenteeism, particularly with its
108

determinants and its interrelation with sickness absence. In Chapter 4, we analyse the
determinants of the annual duration of sickness presenteeism with a focus on work-
related characteristics. Using cross-sectional EWCS data and controlling for health
status, we find work autonomy, workload, tenure and the work environment to be the
quantitatively most relevant work-related correlates of sickness presenteeism. While
work autonomy, workload and tenure are positively related to the number of sickness
presenteeism days, a good working environment is associated with less presenteeism.
We present additionally a model excluding health controls, because the overall cor-
relations between work-related factors and sickness presenteeism days, i.e. the direct
and indirect health mediated channels taken together, are economically highly rele-
vant as well. Here, the role of the working environment is particularly increased.
We are the first to investigate the annual duration of sickness presenteeism as depen-
dent variable which is a better proxy for the productivity effects of sickness presen-
teeism than its incidence or its frequency. Furthermore, tenure and work autonomy
are new findings with regard to sickness presenteeism. While tenure has, to the best
of our knowledge, never been investigated in this regard before, the positive relation-
ship between work autonomy and presenteeism days is in contrast to an insignificant
finding for Denmark (Hansen and Andersen, 2008). Using the first large-scale dataset
on presenteeism outside northern Europe, our results are more informative than pre-
vious studies. And, as our finding for work autonomy shows, northern European
countries are different with regard to sickness presenteeism behaviour which under-
lines the necessity of studies outside northern Europe. From a policy and management
perspective, our findings – albeit based on correlations only – suggest better working
conditions and less work load per employee as potential means to reduce presenteeism.
Finally, our findings mirror the dual nature of sickness presenteeism which is similarly
related to good as well as bad job characteristics (work autonomy, time pressure).
Accordingly, coming to work when being sick can, on the one hand, be facilitated by
good working conditions, or on the other forced by obligations. The first case is rather
commensurate with a situation in which coming to work is socially beneficial because
negative health effects are limited. In contrast, the latter is more likely a situation
in which the negative effects dominate over the positive effects. Accordingly, it will
be one of the crucial questions for future research to distinguish between productivity
and health improving forms of presenteeism and those that are not.
Finally, Chapter 5, which is joint work with Marco de Pinto, combines the analysis
of sickness absence and presenteeism. Here, we ask how these two sickness states
are interrelated, that is whether their determinants affect both sickness states at the
109

same time. More specifically, we investigate whether a change in a work-related char-
acteristic leads to a substitutive (oppositional), complementary (same direction) or no
change in both sickness states. In contrast to the literature which implicitly assumes
that a factor which reduces sickness absence increases presenteeism for a given health
status (and vice versa), our theoretical model shows that non-substitutive relation-
ships are also possible. This result is due to the major innovation of our theoretical
model, that is a definition of presenteeism which depends on work-related character-
istics. Accordingly, the interrelation between sickness absence and presenteeism does
not only depend on the employee’s absence decision, but also on the effect sickness has
on the firm’s profitability which in turn defines presenteeism. Empirically, we find in
European cross-sectional data that only one out of 16 work-related characteristics has
a substitutive pattern with regard to sickness absence and presenteeism. Few have a
complemantary relationship, while the large majority is only related to one of the two
sickness states.
This chapter adds to the literature by explicitly and comprehensively investigating
the interrelationship between sickness absence and presenteeism which has not been
done before. Particularly, we offer a theoretical explanation for our empirical find-
ing that most work-related characteristics either affect absence or presenteeism be-
haviour. Hence, we discard the simple idea that presenteeism is just the residuum of
sickness absence. Moreover, our results show that sickness absence can be reduced
without increasing presenteeism which is good news from a normative perspective.
And, although our investigation is based on correlations only, we can interpret work-
related characteristics as conducive to illegitimate absence when they are associated
with more absence days but not less presenteeism. This is particularly the case for
employees in the public sector, in larger firms and with open-ended contracts.
110

Chapter 7
German Summary - Deutsche
Zusammenfassung
Diese Dissertation befasst sich aus einer okonomischen Perspektive mit Krankheit von
Arbeitnehmern. Krank zu sein reduziert nicht nur das Wohlbefinden sondern auch die
Arbeitsproduktivitat von Arbeitnehmern. Folglich halt Krankheit viele Arbeitnehmer
davon ab, zur Arbeit zu kommen und ihre vertraglich vereinbarten Arbeitsstunden zu
leisten, was zu erheblichen Produktionsausfallen fuhrt. Entsprechend ist krankheits-
bedingte Abwesenheit ein hoch relevantes Thema unter Arbeitsmarktokonomen und
ist bereits intensiv erforscht worden (fur einen Survey siehe Brown and Sessions,
1996). Die okonomische Literatur betont besonders den freiwilligen Aspekt der Ab-
wesenheitsentscheidung, lasst aber die negativen okonomischen Effekte von Krankheit
außer Acht, welche nicht alleine an der Abwesenheitsentscheidung des Arbeitsnehmers
hangen. Krankheit reduziert die Produktivitat unabhangig davon, ob der Arbeit-
nehmer an- oder abwesend ist. Neben dem klassischen Fall der krankheitsbedingten
Abwesenheit, in dem der Arbeitnehmer arbeitsunfahig ist, gibt es auch den Fall des
sogenannten Prasentismus, in dem der Arbeitnehmer zur Arbeit kommt, obwohl er
oder sie krank ist. Die okonomische Forschung zu Prasentismus steckt im Gegensatz
zur Abwesenheitsforschung noch in ihren Anfangen.
Wahrend die negativen, okonomischen Effekte von krankheitsbedingter Abwesenheit
auf der Hand liegen, ist die okonomische Evaluation von Prasentismus komplexer, da
diese nicht nur von der Art der Krankheit abhangt, sondern auch von der ausgeubten
Tatigkeit (vgl. Schultz and Edington, 2007). Unter bestimmten Bedingungen kann
Prasentismus sogar die Erholung und Rehabilitation eines kranken Arbeitnehmers
befordern (vgl. Markussen et al., 2012), wohingegen in anderen Fallen die negativen
Effekte des Prasentismus sogar schwerwiegender sein konnen, als der Abwesenheit
111
(Pauly et al., 2008)). Dies ist insbesondere dann der Fall i) wenn die Tatigkeit der
Genesung des Arbeitnehmers abtraglich ist, mit entsprechenden negativen Folgen fur
dessen Gesundheit (Bergstrom et al., 2009), was oft mit erhohter Abwesenheit in der
Zukunft einhergeht (Hansen and Andersen, 2009), ii) bei ansteckenden Krankheiten,
die sich am Arbeitsplatz ausbreiten (Barmby and Larguem, 2009), iii) bei Produk-
tivitatsinterdependenzen, z.B. durch Teamarbeit (Pauly et al., 2008). Zusammen-
fassend ist zu sagen, dass es im Allgemeinen unklar ist, ob krankheitsbedingte Ab-
wesenheit hohere soziale Kosten verursacht als Prasentismus. Aus diesem Grund
thematisiert diese Dissertation beide Falle, also die krankheitsbedingte Abwesenheit
und den Prasentismus und ist entsprechend in zwei thematische Teile gegliedert.
Im ersten Teil dieser Dissertation werden Arbeitsmarktinstitutionen und krankheits-
bedingte Abwesenheit aus zwei verschiedenen Perspektiven beleuchtet. Nach dem
einleitenden ersten Kapitel, wird in Kapitel 2 eine neue Erklarung fur internationale
Unterschiede in der Großzugigkeit der gesetzlichen Lohnfortzahlung im Krankheits-
fall prasentiert, die wiederum das Abwesenheitsverhalten beeinflusst. Die Literatur
hat bereits gezeigt, dass soziale Normen (individuelles) Abwesenheitsverhalten beein-
flussen (Lindbeck and Persson, 2010; Ichino and Maggi, 2000), was wiederum politis-
che Entscheidungen uber die Großzugigkeit der Lohnfortzahlung beeinflussen konnte.
In dieser Perspektive werden theoretische und empirische Belege geliefert, dass Un-
terschiede in sozialen Normen gegen Sozialleistungsbetrug (aBenefit moralea) interna-
tionale Unterschiede in der Großzugigkeit offentlicher Versicherungsleistungen gegen
Einkommensverlust durch Krankheit erklaren konnen.
Kapitel 2 basiert auf Arnold (2013) und enthalt ein polit-okonomisches Modell, in dem
eine striktere Norm die Abwesenheit in der Okonomie reduziert, was zu gegenlaufigen
Effekten auf die politisch bestimmte Lohnersatzrate fuhrt. Einerseits vergunstigt sich
der Preis fur die steuerfinanzierte Versicherung durch eine striktere soziale Norm, was
zum ublichen Nachfrageeffekt fuhrt und damit zu einer großzugigeren Ersatzrate. An-
dererseits macht die striktere Norm es gleichzeitig fur die Wahler unwahrscheinlicher
selbst abwesend zu sein, was eine reduzierte Gebuhr gegenuber einer umfangreicheren
Versicherung interessanter macht. Numerische Simulationen zeigen, dass der pos-
itive Preiseffekt fur niedrige Werte der Benefit morale starker ist, wohingegen der
negative Wahrscheinlichkeitseffekt im oberen Wertebereich dominiert. Beide Effekte,
die sich zu einem umgekehrt U-formigen Zusammenhang zwischen der in einem Land
herrschenden Benefit morale und der gesetzlichen Lohnfortzahlungsrate erganzen, wer-
den in einem Sample von 31 entwickelten Volkswirtschaften zwischen 1981 und 2010
empirisch dokumentiert. Diese Studie ist die erste, die positive Theorie mit institu-
112

tionellen Daten als abhangige Variable in der Erforschung von Benefit morale und der
Großzugigkeit des Sozialstaats kombiniert. In Kapitel 3, das gemeinsam mit Tobias
Brandle und Laszlo Goerke entstand, wird das Verhaltnis zwischen der Existenz eines
Betriebsrates in einem Betrieb und dem individuellen Abwesenheitsverhalten sowie
den daraus resultierenden Personalproblemen fur das Management untersucht. Mit-
tels Individualdaten des Soziookonomischen Panels (SOEP) werden positive Korrela-
tionen zwischen der Existenz eines Betriebsrats und der Fehlzeiteninzidenz sowie der
jahrlichen Fehltage dokumentiert. In verbundenen Arbeitnehmer-Arbeitgeber Daten
(LIAB) finden wir daruber hinaus eine positive Korrelation mit der Wahrschein-
lichkeit, dass Manager Personalprobleme aufgrund erhohter Abwesenheitsraten er-
warten. Der statistische Zusammenhang zu allen drei Abwesenheitsindikatoren ist
starker in West- als in Ostdeutschland ausgepragt, wo Betriebsrate erst 1990 mit der
Wiedervereinigung eingefuhrt worden sind. Im Westen finden wir auch signifikante
Effekte in Differenz-in-Differenzen Modellen, die kausal interpretiert werden konnen.
Zusammengefasst suggerieren diese Ergebnisse, dass sich Arbeitnehmer durch mehr
Fehltage a bei gleicher Gesundheit a durch Betriebsrate besser stellen konnen, was zu
Lasten der Arbeitgeber geht.
Der zweite Teil der Dissertation enthalt Studien zu Prasentismus. In Kapitel 4 wird
empirisch untersucht, was Prasentismusverhalten determiniert. Der Fokus liegt dabei
auf Eigenschaften des Arbeitsplatzes wie z.B. Vertragsart, Arbeitsbelastung und Ar-
beitsautonomie, da diese durch das Management leichter zu beeinflussen sind als an-
dere Faktoren. Prasentismus wird hier als jahrliche Anzahl der Tage, die ein Ar-
beitnehmer trotz Krankheit zur Arbeit geht, operationalisiert. Die jahrliche Dauer
ist bislang nicht untersucht worden obwohl sie okonomisch relevanter fur die Produk-
tivitatseffekte von Prasentismus ist als die schon untersuchten Großen Inzidenz (Aron-
sson and Gustafsson, 2005) und Haufigkeit (Hansen and Andersen, 2008). Als Daten-
grundlage dient die Europaische Erhebung uber die Arbeitsbedingungen (EWCS), der
erste große Datensatz zu Prasentismusverhalten außerhalb Skandinaviens. Prasentis-
mus ist in Europa weit verbreitet und wird von 35 Prozent der Arbeitnehmer in-
nerhalb von 12 Monaten praktiziert und belauft sich auf durchschnittlich 2,4 Tage
pro Jahr. Arbeitsautonomie, Arbeitsbelastung, Beschaftigungsdauer und das Ar-
beitsumfeld sind in den Querschnittsdaten die quantitativ relevantesten Determi-
nanten der jahrlichen Prasentismusdauer, wenn der Gesundheitsstatus berucksichtigt
wird. Autonomie, Arbeitsbelastung und Beschaftigungsdauer sind positiv mit der
Prasentismusdauer korreliert, wohingegen ein gutes Arbeitsumfeld mit weniger Prasen-
tismustagen korreliert. Wird der Gesundheitszustand nicht berucksichtigt, steigen die
113

Korrelationskoeffizienten aller relevanter Arbeitseigenschaften an, wobei das Arbeit-
sumfeld am meisten gewinnt und auch absolut fuhrt. Entsprechend konnten diese
Ergebnisse so gelesen werden, dass ein gutes Arbeitsumfeld ein besonders geeignetes
Mittel gegen Prasentismus ist. Kapitel 5, das gemeinsam mit Marco de Pinto ent-
stand, analysiert die Interdependenz zwischen krankheitsbedingter Abwesenheit und
Prasentismus und geht der Frage nach, ob beide Krankheitszustande gemeinsame
Determinanten haben, wobei der Fokus auf Eigenschaften des Arbeitsplatzes wie in
Kapitel 4 liegt. Konkret wird untersucht, ob eine Veranderung einer Determinante Ab-
wesenheit und Prasentismus gegenlaufig (substitutiv), gleichgerichtet (komplementar)
oder nur einen der beiden beeinflusst. Die Literatur nimmt implizit eine substitutive
Beziehung an (vgl. Brown and Sessions, 2004; Johansson and Lundberg, 2004, obwohl
diese weder explizit theoretisch hergeleitet wurde, noch systematisch empirisch belegt
ist. Entsprechend liefert diese Studie eine umfassende Untersuchung der Interdepen-
denz von Abwesenheits- und Prasentismusverhalten aus theoretischer und empirischer
Perspektive.
Prasentismus ist in unserem theoretischen Modell enger als im 4. Kapitel definiert als
eine Situation, in der die Abwesenheit des Arbeitnehmers aufgrund dessen Krankheit
(z.B. durch niedrigere Produktivitat, Ansteckung der Kollegen oder anderes) vorteil-
hafter fur den Arbeitgeber ist als dessen Anwesenheit. Das Modell zeigt, dass nicht nur
substitutive Beziehungen zwischen krankheitsbedingter Abwesenheit und Prasentismus
denkbar sind, wie haufig in der Literatur angenommen. Dieses Resultat ist darauf
zuruckzufuhren, dass die Determinanten nicht nur die An- bzw. Abwesenheitsentschei-
dung der Arbeitnehmer, sondern auch die Wirkung der Krankheit auf die Firmenprof-
ite verandert, was wiederum Prasentismus beeinflusst (s.o.). Entsprechend gibt es zwei
Kanale uber die beide Zustande unabhangig voneinander beeinflusst werden konnen.
Als Datengrundlage der empirischen Untersuchung dient, wie in Kapitel 4, der EWCS,
der auch Informationen uber die Anzahl der krankheitsbedingten Fehltage enthalt.
Von den 16 untersuchten Arbeitseigenschaften ist nur eine substitutiv mit den bei-
den Krankheitszustanden verknupft, namentlich der Vorgesetzten-Status. Weiterhin
dokumentieren wir einige komplementare Beziehungen, wohingegen die Mehrzahl der
Determinanten entweder mit der Abwesenheits- oder mit der Prasentismusdauer kor-
reliert. Das in dieser Arbeit entwickelte theoretische Modell eignet sich besonders gut
um die empirischen Befunde im Hinblick auf das Verhaltnis zwischen krankheitsbed-
ingter Abwesenheit und Prasentismus zu erklaren. Mithin fuhrt die Untersuchung also
zu Zweifeln an der in der Literatur vorherrschenden Vorstellung, dass Prasentismus
lediglich das Residuum von krankheitsbedingter Abwesenheit ist.
114

Bibliography
Addison, John T., The economics of codetermination. Lessons from the German
experience, Palgrave Macmillan, 2009.
, Claus Schnabel, and Joachim Wagner, “Works councils in Germany: Their
effects on establishment performance,” Oxford Economic Papers, 2001, 53 (4), 659–
694.
, Paulino Teixeira, and Thomas Zwick, “German works councils and the
anatomy of wages,” Industrial and Labor Relations Review, 2010, 63 (2), 247–270.
Afsa, Cedric and Pauline Givord, “The impact of working conditions on sickness
absence: A theoretical model and an empirical application to work schedules,”
Empirical Economics, 2014, 46 (1), 285–305.
Alesina, Alberto F., Yann Algan, Pierre Cahuc, and Paola Giuliano, “Family
values and the regulation of labor,” Journal of the European Economic Association,
forthcoming.
Algan, Yann and Pierre Cahuc, “Civic virtue and labor market institutions,”
American Economic Journal: Macroeconomics, 2009, 1 (1), 111–145.
, , and Marc Sangnier, “Trust and the welfare state: The twin peaks curve,”
Economic Journal, forthcoming.
Allan, James P. and Lyle Scruggs, “Political partisanship and welfare state reform
in advanced industrial societies,” American Journal of Political Science, 2004, 48
(3), 496–512.
Allen, Steven G., “An empirical model of work attendance,” The Review of Eco-
nomics and Statistics, 1981, 63 (1), 77–87.
, “Trade unions, absenteeism, and exit-voice,” Industrial and Labor Relations Re-
view, 1984, 37 (3), 331–345.
115

Armingeon, Klaus, Panajotis Potolidis, Marlene Gerber, and Philipp Leim-
gruber, “Comparative political data set 1960-2007,” Institute of Political Science,
University of Berne, 2009.
, Romana Careja, Sarah Engler, Panajotis Potolidis, Marlene Gerber,
and Philipp Leimgruber, “Comparative political data set III 1990-2008,” Insti-
tute of Political Science, University of Berne, 2010.
Arnold, Daniel, “Benefit morale and cross-country diversity in sick pay entitle-
ments,” Kyklos, 2013, 66 (1), 27–45.
Aronsson, Gunnar and Klas Gustafsson, “Sickness presenteeism: Prevalence,
attendance-pressure factors, and an outline of a model for research,” Journal of
Occupational and Environmental Medicine, 2005, 47 (9), 958–966.
, , and Margareta Dallner, “Sick but yet at work. An empirical study of
sickness presenteeism,” Journal of Epidemiology and Community Health, 2000, 54
(7), 502–509.
Badura, Bernhard, Antje Ducki, Helmut Schroder, Joachim Klose, and
Katrin Macco, Fehlzeitenreport 2011, Springer-Verlag, 2011.
Barmby, Tim and Makram Larguem, “Coughs and sneezes spread diseases:
An empirical study of absenteeism and infectious disease,” Journal of Health Eco-
nomics, 2009, 28 (5), 1012–1017.
, John Sessions, and John Treble, “Absenteeism, efficiency wages and shirking,”
Scandinavian Journal of Economics, 1994, 96 (4), 561–566.
Bockerman, Petri and Erkki Laukkanen, “What makes you work while you
are sick? Evidence from a survey of union members,” European Journal of Public
Health, 2009, 20 (1), 43–46.
and , “Predictors of sickness absence and presenteeism: Does the pattern differ
by a respondent’s health?,” Journal of Occupational and Environmental Medicine,
2010, 52 (3), 332–335.
Behrens, Martin, “Still married after all these years? Union organizing and the role
of works councils in German industrial relations,” Industrial and Labor Relations
Review, 2009, 62 (3), 275–293.
116

Berger, Johannes, Claus Herbertz, and Dirk Sliwka, “Incentives and cooper-
ation in firms: Field evidence,” IZA Discussion Paper 5618, 2011.
Bergstrom, Gunnar, Lennart Bodin, Jan Hagberg, Tomas Lindh, Gunnar
Aronsson, and Malin Josephson, “Does sickness presenteeism have an impact
on future general health?,” International Archives of Occupational and Environ-
mental Health, 2009, 82 (10), 1179–1190.
Bierla, Ingrid, Benjamin Huver, and Sebastien Richard, “Presenteeism at
work,” International Journal of Business and Management Studies, 2011, 3 (2),
97–107.
, , and , “New evidence on absenteeism and presenteeism,” The International
Journal of Human Resource Management, 2013, 24 (7), 1536–1550.
Biron, Caroline, Jean-Pierre Brun, Hans Ivers, and Cary L. Cooper, “At
work but ill: Psychosocial work environment and well-being determinants of pre-
senteeism propensity,” Journal of Public Mental Health, 2006, 5 (4), 26–37.
Boockmann, Bernhard and Tobias Hagen, “Works councils and fixed-term em-
ployment: Evidence from West German establishments,” Journal of Applied Social
Science Studies, 2003, 123 (3), 359–381.
Brown, Sarah and John G. Sessions, “The economics of absence: Theory and
evidence,” Journal of Economic Surveys, 1996, 10 (1), 23–53.
and , “Absenteeism, ’presenteeism’, and shirking,” Economic Issues, 2004, 9
(1), 15–21.
Cameron, A. Colin and Pravin K. Trivedi, Regression analysis of count data,
Cambridge University Press, 1998.
Caverley, Natasha, J. Barton Cunningham, and James N. MacGregor,
“Sickness presenteeism, sickness absenteeism, and health following restructuring
in a public service organization,” Journal of Management Studies, 2007, 44 (2),
304–319.
Chatterji, Monojit and Colin J. Tilley, “Sickness, absenteeism, presenteeism,
and sick pay,” Oxford Economic Papers, 2002, 54 (4), 669–687.
117

Cornelissen, Thomas, Oliver Himmler, and Tobias Konig, “Fairness spillovers:
The case of taxation,” Journal of Economic Behavior & Organization, 2013, 90,
164–180.
Dionne, Georges and Benoit Dostie, “New evidence on the determinants of ab-
senteeism using linked employer-employee data,” Industrial and Labor Relations
Review, 2007, 61 (1), 108–120.
Ellguth, Peter and Susanne Kohaut, “Tarifbindung und betriebliche Inter-
essenvertretung: Aktuelle Ergebnisse aus dem IAB-Betriebspanel 2011,” WSI-
Mitteilungen, 2012, 4, 297–305.
Elster, Jon, “Social norms and economic theory,” Journal of Economic Perspectives,
1989, 3 (4), 99–117.
Engellandt, Axel and Regina T. Riphahn, “Temporary contracts and employee
effort,” Labour Economics, 2005, 12 (3), 281–299.
Engstrom, Per and Bertil Holmlund, “Worker absenteeism in search equilib-
rium,” Scandinavian Journal of Economics, 2007, 109 (3), 439–467.
European Union, “Mutual information system on social protection,”
http://ec.europa.eu/social/main.jsp?catId=815langId=en, 2012.
European Values Study and World Value Survey Association, “Eu-
ropean and world values surveys five-waves integrated data file, 1981-2008,”
www.worldvaluessurvey.org, 2009.
Fehr, Ernst and Simon Gachter, “Fairness and retaliation: The economics of
reciprocity,” The Journal of Economic Perspectives, 2000, 14 (3), 159–181.
Freeman, Richard B. and Edward P. Lazear, “An Economic Analysis of Works
Councils,” in Friedrich Buttler, Wolfgang Franz, Ronald Schettkat, and David Sos-
kice, eds., Works councils: Consultation, representation, and cooperation in indus-
trial relations, University of Chicago Press, 1995, pp. 27–50.
Frick, Bernd, “Codetermination and personnel turnover: The German experience,”
Labour, 1996, 10 (2), 407–430.
and Dieter Sadowski, “Works Councils, Unions and Firm Performance: the Im-
pact of Workers’ Participation in Germany,” in Friedrich Buttler, Wolfgang Franz,
118

Ronald Schettkat, and David Soskice, eds., Institutional frameworks and labor mar-
ket performance, Routledge, 1995, pp. 46–81.
and Miguel A. Malo, “Labor market institutions and individual absenteeism
in the European Union: The relative importance of sickness benefit systems and
employment protection,” Industrial Relations, 2008, 47 (4), 505–529.
Garcıa-Serrano, Carlo and Miguel A. Malo, “The impact of union direct voice
on voluntary and involuntary absenteeism,” The Journal of Socio-Economics, 2009,
38 (2), 372–383.
Goerke, Laszlo and Markus Pannenberg, “Trade union membership and works
councils in West Germany,” Industrielle Beziehungen, 2007, 14 (2), 154–175.
and , “Trade union membership and sickness absence: Evidence from a sick pay
reform,” IZA Discussion Paper 6777, 2012.
Gralla, Rafael and Kornelius Kraft, “Higher wages, overstaffing or both? The em-
ployer’s assessment of problems regarding wage costs and staff level in co-determined
establishments,” IZA Discussion Paper 7021, 2012.
and , “Separating introduction effects from selectivity effects: The differences
in employment patterns of co-determined firms,” IZA Discussion Paper 7022, 2012.
, , and Julia Lang, “Let’s call it a day: The effect of works councils on working
hours constraints in German establishments,” SFB 823 Discussion Paper 36/2012,
2012.
Greene, William H., Econometric analysis, 5 ed., Pearson Education, 2003.
Grund, Christian and Andreas Schmitt, “Works councils, wages, and job satis-
faction,” Applied Economics, 2013, 45 (3), 299–310.
Halla, Martin and Friedrich G. Schneider, “Taxes and benefits: Two distinct
options to cheat on the state,” Oxford Bulletin of Economics and Statistics, 2014,
76 (3), 411–431.
, Mario Lackner, and Friedrich G. Schneider, “An empirical analysis of the
dynamics of the welfare state: The case of benefit morale,” Kyklos, 2010, 63 (1),
55–74.
119
Hansen, Claus D. and Johan H. Andersen, “Going ill to work – what personal
circumstances, attitudes and work-related factors are associated with sickness pre-
senteeism?,” Social Science and Medicine, 2008, 67 (6), 956–964.
and , “Sick at work – a risk factor for long-term sickness absence at later date,”
Journal of Epidemiology and Community Health, 2009, 63 (5), 397–402.
Hubler, Olaf and Uwe Jirjahn, “Works councils and collective bargaining in Ger-
many: The impact on productivity and wages,” Scottish Journal of Political Econ-
omy, 2003, 50 (4), 471–491.
Heinemann, Friedrich, “Is the welfare state self-destructive? A study of govern-
ment benefit morale,” Kyklos, 2008, 61 (2), 237–257.
Heywood, John S. and Uwe Jirjahn, “Teams, teamwork and absence,” Scandi-
navian Journal of Economics, 2004, 106 (4), 765–782.
and , “Family-friendly practices and worker representation in Germany,” Indus-
trial Relations, 2009, 48 (1), 121–145.
, , and Xiangdong Wei, “Teamwork, monitoring and absence,” Journal of
Economic Behavior & Organization, 2008, 68 (3-4), 676–690.
Hirsch, Boris, Thorsten Schank, and Claus Schnabel, “Works councils and
separations: Voice, monopoly, and insurance effects,” Industrial Relations, 2010, 49
(4), 566–592.
Holand, Armin, Das Verhalten von Betriebsraten bei Kundigungen, Campus Verlag,
1985.
Ichino, Andrea and Giovanni Maggi, “Work environment and individual back-
ground: Explaining regional shirking differentials in a large Italian bank,” Quarterly
Journal of Economics, 2000, 115 (3), 1057–1090.
and Regina Riphahn, “The effect of employment protection on worker effort:
A comparison of absenteeism during and after probation,” Journal of the European
Economic Association, 2005, 3 (1), 120–143.
Imbens, Guido and Jeffrey M. Wooldridge, “Recent developments in the econo-
metrics of program evaluation,” Journal of Economic Literature, 2009, 47 (1), 5–86.
120
Jacobebbinghaus, Peter and Stefan Seth, “Linked employer-employee data from
the IAB: LIAB cross-sectional Model 2 1993-2008 (LIAB QM2 9308),” FDZ Data
Report 05/2010, 2010.
Jirjahn, Uwe, “The introduction of works councils in German establishments: Rent
seeking or rent protection?,” British Journal of Industrial Relations, 2009, 47 (3),
521–545.
and Vanessa Lange, “Reciprocity and workers’ tastes for representation,” SOEP
Papers 402, 2011.
, Jan Mohrenweiser, and Uschi Backes-Gellner, “Works councils and learn-
ing: On the dynamic dimension of codetermination,” Kyklos, 2011, 64 (3), 427–447.
Johansson, Gun and Ingvar Lundberg, “Adjustment latitude and attendance
requirements as determinants of sickness absence or attendance: Empirical tests of
the illness flexibility model,” Social Science and Medicine, 2004, 58 (10), 1857–1868.
Johansson, Per and Marten Palme, “Moral hazard and sickness insurance,” Jour-
nal of Public Economics, 2005, 89 (9-10), 1789–1890.
Johnson, Timothy, Patrick Kulesa, Young Cho, and Sharon Shavitt, “The
relation between culture and response styles: Evidence from 19 countries,” Journal
of Cross-Cultural Psychology, 2005, 36 (2), 264–277.
Korpi, Walter, “Power, politics, and state autonomy in the development of social
citizenship: Social rights during sickness in eighteen OECD countries since 1930,”
American Sociological Review, 1989, 54 (3), 309–328.
and Joakim Palme, “The social citizenship indicator program (SCIP),” Swedish
Institute for Social Research, Stockholm University, 2007.
Kraft, Kornelius, “On estimating the effect of co-determination on personnel
turnover,” Schmollers Jahrbuch, 2006, 126 (2), 287–305.
Leigh, J. Paul, “The effects of union membership on absence from work due to
illness,” Journal of Labor Research, 1981, 2 (2), 329–336.
, “Sex differences in absenteeism,” Industrial Relations, 1983, 22 (3), 349–361.
, “The effects of unemployment and the business cycle on absenteeism,” Journal of
Economics and Business, 1985, 37 (2), 159–170.
121

Leineweber, Constanze, Hugo Westerlund, Jan Hagberg, Pia Svedberg,
Marita Luokkala, and Kristina Alexanderson, “Sickness presenteeism among
Swedish police officers,” Journal of Occupational Rehabilitation, 2011, 21 (1), 17–22.
Lindbeck, Assar, “Welfare state disincentives with endogenous habits and norms,”
Scandinavian Journal of Economics, 1995, 97 (4), 477–494.
and Mats Persson, “A continuous theory of income insurance,” IZA Discussion
Paper 3097, 2010.
and , “A continuous model of income insurance,” International Tax and Public
Finance, 2013, 20 (6), 938–960.
, Sten Nyberg, and Jorg W. Weibull, “Social norms and welfare state dynam-
ics,” Journal of the European Economic Association, 2003, 1 (2-3), 533–542.
Livanos, Ilias and Alexandros Zangelidis, “Unemployment, labor market flexi-
bility, and absenteeism: A Pan-European study,” Industrial Relations, 2013, 52 (2),
492–515.
Lusinyan, Lusine and Leo Bonato, “Work absence in Europe,” IMF Staff Papers,
2007, 54 (3), 475–538.
Markussen, Simen, Arnstein Mykletun, and Knut Roed, “The case for pre-
senteeism: Evidence from Norway’s sickness insurance program,” Journal of Public
Economics, 2012, 96 (11-12), 959–972.
Mastekaasa, Arne, “Unionization and certified sickness absence: Norwegian evi-
dence,” Industrial and Labor Relations Review, 2013, 66 (1), 117–141.
Mueller, Steffen, “Works councils and establishment productivity,” Industrial and
Labor Relations Review, 2012, 65 (4), 880–898.
and Jens Stegmaier, “The dynamic effects of works councils on labor produc-
tivity: First evidence from panel data,” LASER Discussion Paper 78, 2014.
Muravyev, Alexander, “Evolution of employment protection legislation in the
USSR, CIS and Baltic states, 1985-2009,” IZA Discussion Paper 5365, 2010.
Nicholson, Sean, Mark V. Pauly, Daniel Polsky, Claire Sharda, Helena
Szrek, and Marc L. Berger, “Measuring the effects of work loss on productivity
with team production,” Health Economics, 2006, 15 (2), 111–123.
122

OECD, Employment outlook 1999.
, Society at a glance 2006.
Olsson, Martin, “Employment protection and sickness absence,” Labour Economics,
2009, 16 (2), 208–214.
Ose, Solveig Osborg, “Working conditions, compensation and absenteeism,” Jour-
nal of Health Economics, 2005, 24 (1), 161–188.
Osterkamp, Rigmar and Oliver Rohn, “Being on sick leave: Possible explanations
for differences of sick-leave days across countries,” CESifo Economic Studies, 2007,
54 (1), 97–114.
Pauly, Mark V., Sean Nicholson, Daniel Polsky, Claire Sharda, and Marc L.
Berger, “Valuing reductions in on-the-job illness: ’Presenteeism’ from managerial
and economic perspectives,” Health Economics, 2008, 17 (4), 469–485.
, , Judy Xu, Daniel Polsky, Patricia M. Danzon, James F. Murray, and
Marc L. Berger, “A general model of the impact of absenteeism on employers and
employees,” Health Economics, 2002, 11 (2), 221–231.
Pfeifer, Christian, “Works councils and the management of human resources,” Eco-
nomic and Industrial Democracy, 2014, 35 (1), 143–163.
Pfeifer, Harald, “Absenteeism in apprenticeships: What role do works councils
play?,” Leading House Working Paper 98, 2014.
Postlewaite, Andrew, “Social norms and preferences,” in Jess Benhabib,
Matthew O. Jackson, and Alberto Bisin, eds., Handbook for social economics,
Vol. 1B, North-Holland, 2011, pp. 31–68.
Preisendorfer, Peter, “Prasentismus. Pravalenz und Bestimmungsfaktoren unter-
lassener Krankmeldung bei der Arbeit,” Zeitschrift fur Personalforschung, 2010, 24
(4), 401–408.
Puhani, Patrick A. and Katja Sonderhof, “The effects of a sick pay reform on
absence and on health-related outcomes,” Journal of Health Economics, 2010, 29
(2), 285–302.
Riphahn, Regina T., “Employment protection and effort among German employ-
ees,” Economic Letters, 2004, 85 (3), 353–357.
123

Rodrik, David, “Why do more open economies have bigger governments?,” Journal
of Political Economy, 1998, 106 (5), 997–1032.
Sadowski, Dieter, Uschi Backes-Gellner, and Bernd Frick, “Works councils:
Barriers or boosts for the competitiveness of German firms?,” British Journal of
Industrial Relations, 1995, 33 (3), 493–513.
Salowsky, Heinz and Achim Seffen, “Einkommenssicherung bei Krankheit im
internationalen Vergleich,” Beitrage zur Wirtschafts- und Sozialpolitik, 1993, 206.
Schultz, Alyssa B. and Dee W. Edington, “Employee health and presenteeism: A
systematic review,” Journal of Occupational Rehabilitation, 2007, 17 (3), 547–579.
Scoppa, Vincenzo and Daniela Vuri, “Absenteeism, unemployment and employ-
ment protection legislation: Evidence from Italy,” IZA Journal of Labor Economics,
2014, 3 (3).
Seffen, Achim, “Einkommenssicherung bei Krankheit im westlichen Indus-
trielandern,” Beitrage zur Wirtschafts- und Sozialpolitik, 1980, 78.
Stormer, Susi and Rene Fahr, “Individual determinants of work attendance: Ev-
idence on the role of personality,” Applied Economics, 2012, 45 (19-21), 2863–2875.
Tonin, Mirco, “Employment protection legislation in central and east European
countries,” South East Europe Review, 2009, 4, 477–491.
Treble, John and Tim Barmby, Worker Absenteeism and Sick Pay, Cambridge
University Press, 2011.
US Social Security Administration and International Social Secu-
rity Association, “Social security programs throughout the world series,”
http://www.ssa.gov/policy/docs/progdesc/ssptw/index.html, 2010.
van Vliet, Olaf and Koen Caminada, “An update, extension and modification of
the Scruggs welfare state entitlements data set,” NEUJOBS Special Report 2, 2012.
Vistnes, Jessica Primoff, “Gender differences in days lost from work due to illness,”
Industrial and Labor Relations Review, 1997, 50 (2), 304–323.
Wagner, Gert G., Joachim R. Frick, and Jurgen Schupp, “The German socio-
economic panel study (SOEP): Scope, evolution, and enhancements,” Schmollers
Jahrbuch, 2007, 127 (1), 139–169.
124

Wooldridge, Jeffrey M., Introductory econometrics: A modern approach, 4 ed.,
South-Western. Cengage Learning, 2006.
Wright, Randall, “The redistributive roles of unemployment insurance and the
dynamics of voting,” Journal of Public Economics, 1986, 31 (3), 377–399.
Ziebarth, Nicolas R. and Martin Karlsson, “The effects of expanding the gen-
erosity of the statutory sickness insurance system,” HEDG Working Paper 09/35,
2009.
and , “A natural experiment on sick pay cuts, sickness absence, and labor costs,”
Journal of Public Economics, 2010, 94 (11-12), 1108–1122.
and , “The effects of expanding the generosity of the statutory sickness insurance
system,” Journal of Applied Econometrics, 2014, 29 (2), 208–230.
125