on the disparity between corporate profits and … the disparity between corporate profits and...
TRANSCRIPT
On the Disparity between Corporate Profits and Economic Growth
Urooj Khan Columbia University
Suresh Nallareddy Columbia University
Ethan Rouen Columbia University
November 2015
We are thankful to Dan Amiram, John Donaldson, Alex Edwards, Fabrizio Ferri, Trevor Harris,
Anne Heinrichs, Moritz Hiemann, Alon Kalay, Amit Khandelwal, Wayne Landsman, Shelley Li
(discussant), Hai Lu, Partha Mohanram, Emi Nakamura, Maria Ogneva, Shiva Rajgopal, Terry
Shevlin, Lakshman Shivakumar, Jake Thornock, Ryan Wilson, Franco Wong, Pierre Yared, and
participants of research seminars at Columbia Business School, University of Toronto, and the
London Transatlantic Doctoral Conference for thoughtful discussions and feedback. We also thank
economists at the Bureau of Economic Analysis for their assistance with data collection. All
remaining errors are our own. We are grateful for financial support from the Center on Japanese
Economy and Business at Columbia Business School.
On the Disparity between Corporate Profits and Economic Growth
Abstract
We investigate the impact of the corporate tax regime in the United States on the relation between
the performance of U.S. corporations and the overall economy. Using an exogenous shock, and
cross-country and cross-sectional analyses, we document that the relatively higher corporate
income tax rate and the accounting treatment of foreign earnings of U.S. corporations have
contributed to growth in corporate profits not translating into overall economic growth. These
features of the U.S. tax regime result in fewer corporate profits being channeled to subsequent
domestic investments, leading to lower economic growth. The disparity between the growth rates
of corporate profits and the economy is unsustainable in the long run. Social, political, and
economic pressures should eventually cause the growth rates in corporate profits and the broader
economy to realign.
1
1. Introduction
We investigate the impact of the U.S. tax regime on the relation between the performance
of corporations and the overall economy. Without frictions, growth in corporate profits1 should be
closely related to growth in the economy. However, in the presence of frictions, such as differential
corporate tax rates across countries, this relation may be altered or eliminated altogether. Using an
exogenous shock, cross-country and cross-sectional analyses, we document that the relatively
higher U.S. corporate tax rate — in relation to the average rate of the other countries in the OECD
— combined with the accounting treatment of foreign earnings of U.S. corporations has
contributed to corporate profit growth outpacing the growth in the overall economy.
This disparity between the growth of corporate profits and the overall economy is
unsustainable in the long run since corporate profits, a component of GDP, will eventually be
larger than the GDP. Social, political, or economic pressures should eventually cause these growth
rates to align.2 While the disparity between corporate profit growth and economic growth has
received occasional coverage in the popular press (e.g., The Economist 2014), we are among the
first to provide a systematic and thorough examination of the issue and show the impact of the
U.S. tax regime on the relation between the performance of U.S. corporations and overall economic
growth in the United States.
The unique corporate tax regime in the United States is a potentially important factor that
can result in disparity between the growth of corporate profits and that of the economy. In deciding
whether to invest in a project, managers compare the marginal benefits of the investment to its
1 Corporate profits represent the portion of total income earned from current production that is accounted for by U.S. corporations, public and private. In our analyses, we use domestic and national corporate profits estimates prepared by the Bureau of Economic Analysis (BEA), which are the measures used to calculate gross domestic income (income equivalent of gross domestic product). 2 For example, in the face of $2 trillion in untaxed profits currently being held abroad by U.S. firms, President Barack Obama and members of Congress have said political action is needed to return more corporate profits to the U.S. economy (The Economist 2015).
2
marginal costs. Taxes influence these investment decisions because they affect the costs of
investments and a project’s net present value (Hall and Jorgensen 1967; Romer and Romer 2010).
Tax policy can also affect allocation of capital, as well as the shifting of income to lower tax
jurisdictions (Hines 1997; Grubert and Mutti 1991; De Mooij and Ederveen 2003; Klassen and
Laplante 2012). Therefore, if the corporate income tax rate in the United States is relatively higher
than that in other countries, firms have incentives to reduce the after-tax costs of investments by
diverting them to jurisdictions with lower corporate taxes.
Additionally, the accounting treatment of taxes on foreign profits of U.S. multinationals
provides an incentive for these firms to invest abroad. Under U.S. tax law, multinational firms
must pay taxes on foreign profits at a rate equal to the U.S. tax rate upon repatriation of the earnings
to the United States, and they receive a credit for foreign taxes paid on those earnings. For financial
reporting purposes, under U.S. GAAP a deferred tax liability is recognized because of the
temporary difference created under this regime. However, a multinational firm can designate the
foreign earnings to be “permanently reinvested” under APB Opinion No. 23 to defer recognizing
the residual U.S. tax.3 Thus, a deferred tax liability is not recognized for the residual U.S. income
taxes, and the recognized income tax expense is comprised only of the foreign taxes paid at the
lower foreign tax rate. Thus, while U.S. firms are reporting record profits, the corporate tax regime
in the United States is incentivizing firms to invest these profits abroad or hold them as cash.4 This
incentive, in turn, could be a contributing factor to the deteriorating relation between U.S.
corporate profit growth and economic growth.
3 Permanently reinvested earnings are earnings from foreign subsidiaries of U.S. multinational firms that have been invested abroad and that managers intend to reinvest indefinitely or that managers intend to remit in a tax-free liquidation (Oler, Shevlin, and Wilson 2007). 4 Graham, Hanlon, and Shevlin (2001) report in a survey of tax executives that 48% of respondents of publicly traded firms with foreign earnings consider the accounting deferral of tax on foreign earnings allowed under APB 23 to be an important factor in the decision to invest abroad.
3
On the other hand, by taking advantage of relatively lower tax rates abroad, U.S.
corporations can maximize shareholder wealth resulting in wealth effects at the individual level in
the United States. These wealth effects can impact components of economic growth (e.g.,
consumption) resulting in higher growth of the overall economy (Poterba 2000). Therefore, it is
an empirical question whether the U.S. tax regime can impact the relation between growth in
corporate profits and overall economic growth. We test this conjecture by exploiting variations in
the U.S. corporate income tax rate relative to other countries over time.
We conduct our empirical analyses during the period from 1975:Q1 to 2013:Q4 using
aggregated quarterly data from the Bureau of Economic Analysis (BEA). We find that the growth
in corporate profits is higher than economic growth during our entire sample period. However, the
relation between corporate profit growth and economic growth in the United States depends on the
U.S. corporate income tax rate relative to that of the OECD countries. During our sample period,
the U.S. corporate income tax rate has largely held steady while the average corporate tax rate of
countries in the OECD began a precipitous decline,5 what has been dubbed a “race to the bottom”
to attract foreign investment (see Figure 1). We find that when the difference between the U.S. tax
rate and the average tax rate of the OECD countries is below its time-series median, the growth in
corporate profits and the U.S. economy is closely related. However, when the difference between
the U.S. tax rate and the OECD rate is relatively high (i.e., above its time-series median), the profits
of U.S. corporations grow at nearly twice the rate of the overall economy. This result is robust
whether using domestic corporate profits or national corporate profits, which adds foreign earnings
of domestic firms to domestic corporate profits.
5 Dyreng, Hanlon, Maydew and Thornock (2014) examines the effects of the decline in foreign statutory tax rates relative to the U.S. tax rate and find that the decline in foreign tax rates helps to explain the decrease in effective tax rates of U.S. multinational corporations over the past 25 years.
4
To better understand the shift in the relation between corporate profits and economic
growth, we examine the relation between corporate profit growth and growth in quarter-ahead
domestic investments during the same periods. We find that during the period in which the
difference between the U.S. tax rate and that of the average OECD rate is below its time-series
median, growth in corporate profits (2.47%) is relatively closely related to the growth in domestic
investments (1.98%). However, when the difference in the U.S. tax rate and the OECD rate is
above the median, the difference in the growth rates nearly doubles, and mean growth in U.S.
domestic investments lags growth in corporate profits by 0.96%. The same pattern is observed in
total repatriations of foreign earnings made by U.S. multinationals: As the difference between the
U.S. corporate tax rate and the average rate of OECD countries rises, repatriations by U.S. firms
falls. These findings suggest that lower foreign tax rates and the accounting treatment for foreign
profits discourage U.S. multinationals from repatriating their foreign profits and investing them
domestically. In contrast, we do not find any relation between the growth in corporate profits and
the other components of economic growth.
Next, we use the American Jobs Creation Act of 2004 (AJCA) as an exogenous shock to
establish the causal effect of variations in the U.S. tax rate on domestic investments and
repatriations — the underlying mechanisms that are potentially contributing to the shift in the
relation between the growth of corporate profits and overall economic growth. The AJCA
significantly but temporarily lowered U.S. multinationals’ tax cost of repatriating foreign earnings
from 35% to 5.25%. While identifying the effects of tax changes on corporate behavior can be a
significant challenge due to endogeneity (Hasset and Hubbard 2002; Hanlon and Heitzman 2010),
the shock of the AJCA is exogenous to other macroeconmic factors and has been used in prior
studies to investigate the causal effect of corporate taxes on several firm-level outcomes (e.g.,
5
Blouin and Krull 2009; Romer and Romer 2010; Dharmapala, Foley and Forbes 2011; Faulkender
and Petersen 2012; Edwards, Kravet and Wilson 2015).
Prior literature has found mixed evidence on the relation between the AJCA and firm-level
investment decisions.6 The advantage of examining the AJCA at the macroeconomic level is that,
as long as companies repatriate earnings, these funds will flow into the economy irrespective of
whether firms make investments domestically or distribute them to investors. We show that
contemporaneous aggregate repatriations, one-quarter-ahead aggregate domestic investment
growth, GDP growth, and GNP growth increased significantly during the years when the AJCA
reduced the tax cost of repatriating foreign earnings. This evidence suggests that tax rates causally
affect the decision to repatriate foreign earnings and invest domestically, factors that have
contributed to the observed structural shift in the relation between corporate profit growth and
economic growth.
To provide additional support for our findings, we conduct two more tests. First, we
compare the relation between corporate profits and economic growth in the U.S. to this relation in
Japan and the United Kingdom. While these three developed economies are arguably similar, they
have starkly different tax structures. Japan’s corporate tax rate has been higher than the OECD
average and higher than the U.S. rate for most of the last 20 years. Alternatively, the corporate tax
rate in the United Kingdom has been much lower than that in the United States and has very closely
followed the decline in the rate of the other OECD countries. If higher tax rates contribute to the
6 Blouin and Krull (2009) finds that firms that chose to repatriate had limited domestic investment opportunities and that dividends and repurchases by these firms increased significantly during the act, even though this use of repatriated funds was forbidden. Dharmapala, Foley and Forbes (2011) reports that repatriations did not increase domestic investment, employment or R&D; instead they were associated with an increase in shareholder payouts. Faulkender and Petersen (2012) divides repatriating firms based on capital constraints and finds that only capital constrained U.S. multinationals took advantage of the AJCA to finance domestic investments using repatriated foreign earnings. Using the AJCA as a shock to firm-level investment opportunities on multinational companies, Edwards, Kravet, and Wilson (2015) finds that the AJCA reduced the effect of suboptimal investment by firms with cash “trapped” abroad.
6
disparity between corporate profits and economic growth, then we should also observe such
disparity for Japan but not for the United Kingdom.7 The evidence is consistent with this
conjecture.
Second, we compare the changes in financial asset holdings of industries considered
“mobile” for tax purposes (De Simone and Stromberg 2013) to other industries. Firms in mobile
industries can transfer profits to low-tax jurisdictions to reduce their tax burden, but they cannot
repatriate these profits to either make domestic investments or distribute dividends to shareholders
without incurring tax on the repatriated earnings. Therefore, to the extent that firms in mobile
industries have limited investment opportunities abroad, we should observe a significantly larger
increase in financial asset holdings (cash and short-term marketable securities) after the OECD tax
rate falls below the U.S. rate. We find that mobile industries increase their holdings of financial
assets by 10% (as a percentage of total assets) when the difference in the U.S tax rate and that of
OECD was above its time-series median, while other industries’ financial asset holdings increased
by only 1%.
In our multivariate tests, we control for interest rates, recessions and the 2007-2009
financial crisis, globalization, technological innovations, productivity changes, currency
fluctuations, foreign investment opportunities, the corporate environment, and income inequality
in the United States. Further, we triangulate our evidence by employing a variety of tests that take
advantage of an exogenous shock, and cross-sectional and cross-country differences. However, we
do not claim that the higher U.S. tax rate is the only factor responsible for the disparity in the
7 Both Japan and United Kingdom have changed their treatment of earnings made abroad by domestic companies. In 2009 (2010), Japan (the United Kingdom) moved from a worldwide taxation system to a territorial system. We find that in both countries, domestic investment growth increases after the change, suggesting that companies are investing more of their profits domestically after the tax system changes from a worldwide tax system to a territorial one.
7
growth rates. Instead, our evidence suggests that the relatively higher U.S. tax rate is one of the
reasons for the observed disparity.
The effects of taxes and the accounting treatment of foreign earnings of U.S. corporations
on aggregate investments and macroeconomic activity are a relatively unexplored research area
given its potential importance (Hanlon and Heitzman 2010). We contribute to this stream of
literature by providing evidence of the impact of cross-country tax policies on domestic economic
and investment growth. First, while prior studies document the effect of taxes on investments at
the firm level, the evidence does not allow one to conclude whether the effect of relatively higher
U.S. taxes on firm-level domestic investments is large enough to have macroeconomic
consequences (Hanlon and Heitzman 2010). We are among the first to systematically document
that the relation between corporate profits and overall economic growth in the United States has
been altered, a shift that is mechanically unsustainable in the long run. We show that relatively
higher tax rates and the accounting treatment of foreign earnings under the worldwide tax system
in the United States have contributed to the shift in the relation between corporate profits and
economic growth by deterring firms from making investments domestically and repatriating
foreign profits.
Second, we build on the literature that has examined the impact of the AJCA on domestic
investment by documenting the effect of the AJCA at the macroeconomic level. Firm-level
endogeniety has led to conflicting conclusions about the impact of the AJCA on the U.S. economy
since the decision to repatriate and reinvest is correlated with many variables at the firm level
(Faulkender and Petersen 2012). As one of the first to examine this shock in the aggregate, we are
able to avoid the endogenous firm characteristics that have led to conflicting results in the
literature. We show that the temporary tax decrease provided under the AJCA resulted in an
8
increase in aggregate domestic investments, and U.S. economic growth was higher in subsequent
quarters.
Finally, we contribute to the debate over the costs and benefits of a territorial versus
worldwide tax system. Using data from Japan, we document that a change from a worldwide tax
system to a territorial tax system is associated with an increase in the amount of corporate profits
translating into subsequent domestic investments. During the ongoing 2016 U.S. Presidential
campaign, several candidates have proposed tax reforms focusing on the tax treatment of foreign
earnings.8 We provide direct evidence to evaluate the expected consequences of these proposals
by documenting the effect of tax rate decreases and changes from a worldwide tax system to a
territorial one on domestic investment and economic growth.
2. Taxes, corporate profits, and economic growth
A clear theoretical relation exists between taxes and investment decisions. Investments will
be made only when the marginal benefit of the investment exceeds the marginal cost, and taxes
impact the amount and uncertainty of this net-present-value calculation. Hall and Jorgenson (1967)
shows that taxes increase the cost of investment, reducing the likelihood of investing, while tax
credits have the opposite effect. Slemrod (1992) argues that firms respond to taxation through the
timing of their economic transactions, accounting alterations, and real decisions.
Despite this theoretical connection, economists had struggled to document a link between
tax changes and investment in the aggregate, what Hines (1998) called “one of the major puzzles
in the empirical investment literature.” Hasset and Hubbard (2002) suggests that endogeneity
8 For example, Jeb Bush, Rand Paul and Marco Rubio have proposed changing the U.S. tax system from worldwide to territorial. Marco Rubio, Jeb Bush and Donald Trump have proposed repatriation of foreign income at a 6%, 8.75% and 10% rate, respectively (http://taxfoundation.org/comparing-2016-presidential-tax-reform-proposals).
9
makes it difficult to isolate the effects of taxes on investment using time-series data since several
aggregate variables move together over the business cycle. In summarizing this issue, Hanlon and
Heitzman (2010) state that it is likely that a change in tax rates is in response to other
macroeconomic factors that could also impact investments. In addition, the authors argue,
controlling for the effect of contemporaneous non-tax shocks on investments poses other
challenges, and it is difficult to completely rule out their effect. In the cross section, on the other
hand, some empirical studies (Hassett and Hubbard 2002; Hassett and Newmark 2008) find the
expected negative relation between investments and taxes, but drawing macroeconomic inferences
from these studies is difficult (Hanlon and Heitzman 2010).
To mitigate the effects of these confounding factors, Romer and Romer (2010) uses a
unique strategy to isolate the effects of tax changes on macroeconomic variables. The study
examines the narrative record of tax changes and separates the reasons for these changes into four
categories: (1) offsetting a shift in government spending; (2) offsetting another factor affecting
output in the near future; (3) addressing an inherited budget deficit; and (4) achieving long-run
goals like higher growth or increased fairness. Categories (1) and (2) are correlated with other
developments affecting output, and therefore cannot be used to estimate the effects of tax changes
on output, but categories (3) and (4), according to the authors, are unlikely to be systematically
related to other factors impacting output in the short and medium run. Romer and Romer (2010)
use tax changes that fall into the latter two categories as fiscal shocks and show that tax increases
have a large negative effect on investment, while tax cuts have positive and persistent output
effects.
10
Given that tax policy directly affects the net returns from investments, investment location
decisions are strongly influenced by differences in tax costs across countries.9 Studies have
documented that the average tax elasticity of investment is negative, suggesting that an increase in
host countries’ tax rates results in a decrease in U.S. foreign direct investment in that jurisdiction
(Grubert and Mutti 1991; Hines and Rice 1994).10 Altshuler, Grubert, and Newlon (2000) reports
that investment location decisions have become more sensitive to tax rates over time and finds that
the elasticity of real capital to after-tax returns of large U.S. manufacturing multinational
companies increased from 1.5 in 1984 to 2.8 in 1992.
Further, the accounting treatment of taxes on foreign income provides firms with discretion
over the timing of reporting taxable income and/or book income (Krull 2004; Shackleford,
Slemrod, and Sallee 2011). Thus, firms that value flexibility in tax and financial reporting have
incentives to invest outside the United States (Shackelford, Shaviro, and Slemrod 2010). The tax
rules do not require U.S. parent companies to pay any U.S. taxes on the earnings of their foreign
subsidiaries until the profits are repatriated to the United States as dividends.11 U.S. GAAP requires
that a deferred tax liability be recognized because a temporary difference is created since foreign
earnings will only be taxed when they are repatriated. However, a multinational firm can designate
the foreign earnings to be permanently reinvested under APB 23 to defer recognizing the residual
U.S. tax. By electing to designate foreign income as permanently reinvested, the U.S. parent
9 Dyreng and Lindsey (2009) finds that, on average, U.S. firms with operations in tax havens have lower tax bills. When examining Delaware, a domestic tax haven, Dyreng, Lindsey, and Thornock (2013) provides evidence that taxes affect the decision to locate subsidiaries in the state, and parent firms that do locate their subsidiaries there receive substantial tax savings. 10 See Shackelford and Shevlin (2001) for a review of a related literature that examines global tax planning by U.S. multinationals with regard to capital structure. Maydew (2001) provides a discussion of Shackelford and Shevlin (2001). 11 When the foreign earnings are repatriated as dividends, the parent companies pay the “residual” U.S. tax, which is the U.S. tax due net of foreign tax credits for taxes paid to foreign governments.
11
company can reduce its income tax expense and report higher after-tax earnings for the current
year if the tax rate in the host country of the foreign subsidiary is lower than that in the United
States. This increase in earnings is a result of the recognized tax expense being made up only of
the foreign taxes paid at the lower foreign income tax rate.
Accounting deferral of taxes on foreign earnings allowed under APB 23 has proved to be
an important factor in the decision to make investments abroad rather than in the United States.
Several studies provide firm-level evidence showing that the tax treatment of foreign earnings
encourages firms to invest abroad and hold more cash and financial assets (Hartman 1985; Foley,
Hartzell, Titman, and Twite 2007; Graham, Hanlon, and Shevlin 2010; Blouin et al. 2012; Klassen
and Laplante. 2012; Blouin, Krull, and Robinson 2014; Klassen, Laplante, and Carnaghan 2014).
“Trapped cash,” as earnings held abroad for tax reasons are often called, has impacts on the
investing decision both at home and abroad. Hanlon et al. (2014) find that trapped cash is positively
related to increased foreign acquisitions, and that the market reaction to these acquisitions is
negatively associated with the level of trapped cash. Relatedly, Edwards et al. (2015) finds a
negative relation between the profitability of foreign acquisitions and the amount of trapped cash.
The AJCA, which the authors use as a shock to this relation, significantly reduces this effect by
allowing firms to repatriate foreign earnings held as cash abroad at a much lower tax cost. Finally,
Blouin et al. (2014) explores the impact of trapped cash on domestic investment. In addition to
providing evidence that most permanently reinvested earnings (PRE) abroad are held in financial
assets, the study finds a negative relation between the ability of multinational firms to take
advantage of domestic investment opportunities and the level of PRE held in cash by these firms.
In summary, the direct effect of taxes on the after-tax return from investments and the
accounting treatment of foreign earnings provide incentives to U.S. companies to invest in
12
jurisdictions outside the United States and discourages firms from repatriating foreign profits when
the tax costs in the United States are relatively higher. Hence, when the corporate tax regime in
the United States is relatively advantageous compared to that of other jurisdictions, we expect
corporate profits to be channeled to subsequent domestic investments as companies have fewer
incentives to invest abroad or hold foreign earnings outside the United States. Since growth in
domestic investments results in contemporaneous growth in the economy, corporate profits and
economic growth are similar. In contrast, when the United States is at a disadvantage relative to
other jurisdictions due to a higher U.S. corporate tax rate, fewer corporate profits are channeled to
subsequent domestic investments as companies have incentives to invest outside the United States
and not repatriate foreign earnings. The relation between corporate profits and economic growth
may shift as lower growth in domestic investments results in lower contemporaneous growth in
the economy.
Alternatively, while prior studies provide firm-level evidence that relatively higher U.S.
taxes and the tax treatment of foreign earnings have incentivized domestic firms to invest abroad
or hold earnings outside the United States, these effects may not be large enough to have
macroeconomic consequences or they may be diversified when aggregated to the macroeconomic
level such that the relatively higher U.S. taxes have not altered the relation between the growth in
corporate profits and economic growth. Further, U.S. corporations can maximize shareholder
wealth by taking advantage of relatively lower taxes abroad, resulting in wealth effects for their
shareholders in the United States. Prior studies show that wealth effects can alter consumption (see
Poterba 2000 for a review of this literature), which can contribute to overall economic growth.
Therefore, whether the U.S. tax regime can impact the relation between growth of profits of U.S.
corporations and economic growth is an empirical question.
13
3. Sample and empirical analysis
3.1. Sample
The sample for our primary analyses consists of quarterly macroeconomic data from 1975
to 2013 obtained from the BEA. Gross Domestic Product (GDP), Gross National Product (GNP)
and components of these variables (corporate profits, gross private domestic investment,
government spending, employee compensation, and consumption) are quarter-over-quarter
seasonally adjusted percent changes. A detailed description of all the variables is provided in the
Appendix. National corporate profits include foreign profits of U.S. companies. Domestic
corporate profits exclude profits made abroad by domestic companies. Corporate profits, as
defined by the BEA, are measures of the income of all corporations that are required to file
corporate tax returns (Bureau of Economic Analysis 2014). Both measures are adjusted for
changes in the book value of inventory and capital. These adjustments allow for a more direct
examination of changes in actual profits without the influence of book changes in assets held on
the balance sheet.12 We also collect data on the percentage of foreign earnings of U.S. firms that
are repatriated through dividends and withdrawals, and those that are reinvested abroad from the
Bureau of Economic Analysis. Quarterly data on repatriations from the BEA is available from
1981.
We gather the quarterly yields on 10-year and 1-year Treasuries from CRSP. Quarterly
value-weighted aggregate stock returns are downloaded from Kenneth French’s website.13 We
12 The inventory adjustment removes gains or losses from holding inventory that is valued at historical cost. To do this, the BEA converts the valuation of withdrawals from inventory based on current and historical costs to a current-cost basis. The capital adjustment first converts depreciation values to values based on useful lives and empirically based depreciation patterns. Then, it converts depreciation measures to current-cost values like in the inventory adjustment. 13 French’s data are available at http://mba.tuck.dartmouth.edu/pages/faculty/ken.french/data_library.html.
14
follow the National Bureau of Economic Research in defining recession periods. Tax rate data on
OECD countries are retrieved from the OECD website from 1981 onwards. Prior to 1981, these
data are collected from the Price Waterhouse & Co. Taxes in 80 Countries publications for the
years 1976, 1978, and 1980. GDP data on OECD countries are also retrieved from the OECD
website. Our measure of inequality, the percentage of total income earned by the wealthiest 1% of
U.S. citizens, is retrieved from The World Top Income Database. Quarterly output per hour for all
non-farm businesses, our measure of productivity, is retrieved from the Bureau of Labor Statistics.
Accounting data come from the Compustat quarterly dataset. Quarterly default spread, measured
as the difference between the yields on Aaa and Baa corporate bonds, and the weighted average of
the foreign exchange value of the U.S. dollar against a subset of currencies that circulate widely
are retrieved from FRED, the Federal Reserve Bank of St. Louis. Finally, the sample for our
analyses is restricted to the period 1973:Q2 to 2013:Q4 because of quarterly data availability from
Compustat and tax data availability.
3.2. Growth in corporate profits and the economy
3.2.1. Descriptive statistics
We begin our analyses by examining the relation between the growth in corporate profits
and growth in the economy. The descriptive statistics presented in Table 1 Panel A examine
average quarterly growth in various macroeconomic variables during several periods. The average
quarterly growth rate of GNP (GDP) is 1.53% (1.54%) over the full sample period compared to
2.28% for corporate profits, which suggests a disparity between corporate profit growth and
economic growth in our sample period.
15
The descriptive statistics provide evidence that this disparity is greater when the difference
between the tax rates of the United States and OECD is above the median difference (see Figure 1
for a plot of the corporate tax rate of the United States and the average corporate tax rate for the
OECD countries during our sample period). When the difference between the tax rate in the United
States and the average OECD tax rate is less than the median difference (2.60%), national
(domestic) corporate profits, CPN (CPD), grow, on average, by 2.47% (2.67%) each quarter and
GNP and GDP average growth is 1.97%. During the period in which the difference between the
U.S. tax rate and that of the OECD average is above the median difference, corporate profits
growth diverges more from growth in the overall economy: CPN (CPD) grows at an average rate
of 2.11% (2.26%) each quarter, whereas the GNP (GDP) average growth rate is 1.12% (1.12%).
The same pattern is observed in the relation between corporate profit growth and the growth of
domestic investments (INV). When the difference in the tax rates is below the median, the growth
in CPN and INV are closely aligned — 2.47% per quarter for CPN versus 1.98% for INV. These
growth rates diverge significantly when the difference in the tax rates is above the median and the
after-tax return on investments abroad exceeds that of investments in the United States. During the
period when the difference in the tax rates is above the median difference, INV grows at only
1.15% per quarter, whereas CPN grows on average by 2.11% each quarter.
In contrast, we do not observe a shift in the relation between the growth rates of the other
components of GDP (government spending (Gov), compensation (Comp), and consumption
(Con)) and GDP between the two sub-periods. Therefore, Panel A of Table 1 provides preliminary
evidence in support of the claim that the relatively higher U.S. tax rate has contributed to the
disparity between the growth in corporate profits and growth in the overall economy by decreasing
16
the after-tax return on domestic investments, resulting in fewer corporate profits being translated
into domestic investments.
In Panel B, we conduct multivariate regressions to provide further support for the
univariate analysis specific to the implication of the relative U.S. tax regime on other components
of GDP. When we regress the growth in domestic corporate profits (CPD), the value of the U.S.
tax rate minus the average OECD rate (Tax_diff), and the interaction of the two on growth in the
components of GDP, we find that only the growth in domestic investments (INV) has a significant
and positive relation with CPD (Column (1) reports a coefficient of 0.11 on CPD, which is
significant at the 5% level, and Column (2) reports a coefficient of 0.23 on CPD, which is
significant at the 1% level). INV also is the only component of GDP that has a significant relation
with the interaction of CPD and Tax_diff, with a coefficient of -1.70, significant at greater than
1% (see Column (2)). Given that we fail to find any empirical relations between the growth in
other components of GDP and the growth in corporate profits, going forward we focus our analysis
on domestic investments.
3.2.2. Multivariate analysis
Next, we examine the relation between corporate profits and economic growth, and the
impact of tax rates on this relation using multivariate regressions. In doing so, we investigate the
association between domestic, as well as national corporate profits,14 and GDP and GNP,
respectively. Through the examination of the association between overall economic growth and
corporate profits growth, we attempt to capture how the relatively higher U.S. tax rate affects the
14 When examining corporate profits, we conduct our tests using both domestic and national corporate profits to provide robust evidence for our predictions. While the shifting relation between domestic corporate profits and economic growth is less direct in our setting, when taxes are lower abroad, firms not only have an incentive to keep foreign profits abroad but also to invest domestic profits abroad.
17
contribution of corporate profits to overall economic growth by decreasing the incentive to invest
domestically. In addition, the accounting treatment of foreign profits of U.S. multinationals also
discourages U.S. firms from repatriating foreign earnings and potentially deters domestic
investments while increasing investment abroad (Graham et al. 2011; Hanlon et al. 2014).
Specifically, we estimate regressions nested in the following models:
GNPt+1 = α + β1CPNt + β2Tax_difft + β3Tax_difft*CPNt + β4Crisist + β5GNPt + β6Termt + β7DEFt
+ β8T-notet + β9Rett + β10Recessiont + β11Opennesst + β12Techt + β13Productivityt + β14FXt +
β15Inv_oppt + β16Ineqt + εt+1 (1),
GDPt+1 = α + β1CPDt + β2Tax_difft + β3Tax_difft*CPDt + β4Crisist + β5GDPt + β6Termt + β7DEFt
+ β8T-notet + β9Rett + β10Recessiont + β11Opennesst + β12Techt + β13Productivityt + β14FXt +
β15Inv_oppt + β16Ineqt + εt+1 (2),
where GDP (GNP) is the quarterly percentage change in gross domestic (national) product. CPD
(CPN) is quarterly growth rate in domestic (national) corporate profits. Tax_diff is defined as
above. The interaction between Tax_diff and CPD (CPN) is our variable of interest, and we predict
a negative coefficient on this interaction.
We also include several variables to control for other macroeconomic factors that could affect
the relation between corporate profits and economic growth. In particular, to control for the impact
of the 2007-2009 financial crisis, we include Crisis, a dummy equal to 1 from Q4:2007 to Q1:2009,
and 0 otherwise. Kothari, Lewellen, and Warner (2014) finds that interest rates and default spreads
are predictive of next-quarter investments. Therefore, we control for the effects of aggregate
interest rates and changes in default risk by including three proxies: Term, the quarterly difference
between returns on 10-year and 1-year Treasuries; DEF, the quarterly default spread; and T-note,
the quarterly yield on the 10-year Treasury note. Ret, quarterly value-weighted stock returns,
controls for the impact of the corporate environment. Recession is an indicator equal to 1 if the
18
U.S. economy was in a recession during the quarter, as defined by the National Bureau of
Economic Research, and 0 otherwise, and is included to control for financial downturns. Increased
international trade can have an impact on how income is distributed (Giovannoni, Lu, Nguyen,
and Xu 2014).
As international trade increases in an economy, corporate decisions about how to distribute
income and where to invest may be effected, regardless of the tax environment. To control for the
effects of globalization, we follow Krugman (2008) in calculating quarterly Openness of the
United States to international trade as the sum of aggregate imports and exports, scaled by GDP.
Tech is the quarterly ratio of INV to GDP and is used as a proxy for technological changes in the
economy (Greenwood, Hercowitz, and Krussel 1997) that could influence how and where firms
choose to invest. Following Guscina (2006), we measure economy-wide productivity change
(Productivity) as the Bureau of Labor Statistics’ quarterly measure of output per hour for all non-
farm businesses. We include this variable to control for how the shifting role of labor in the U.S.
economy could impact domestic economic growth. FX is the weighted average of the foreign
exchange value of the U.S. dollar against a broad index of currencies that circulate widely, and is
meant to control for the impact of currency fluctuations. Foreign investment opportunities
available to U.S. firms have increased over time, and Nessa, Wilson and Shevlin (2015) report that
investors value foreign earnings based on future investment opportunities available to firms.
Accordingly, Inv_opp is a proxy for investment opportunities abroad and is the average of the
quarter-over-quarter average GDP growth rates for all OECD countries except the United States.
Finally, we include Ineq, the percentage of total U.S. income going to the wealthiest 1% of
residents, to control for the impact of rising inequality on the economy as a whole.
19
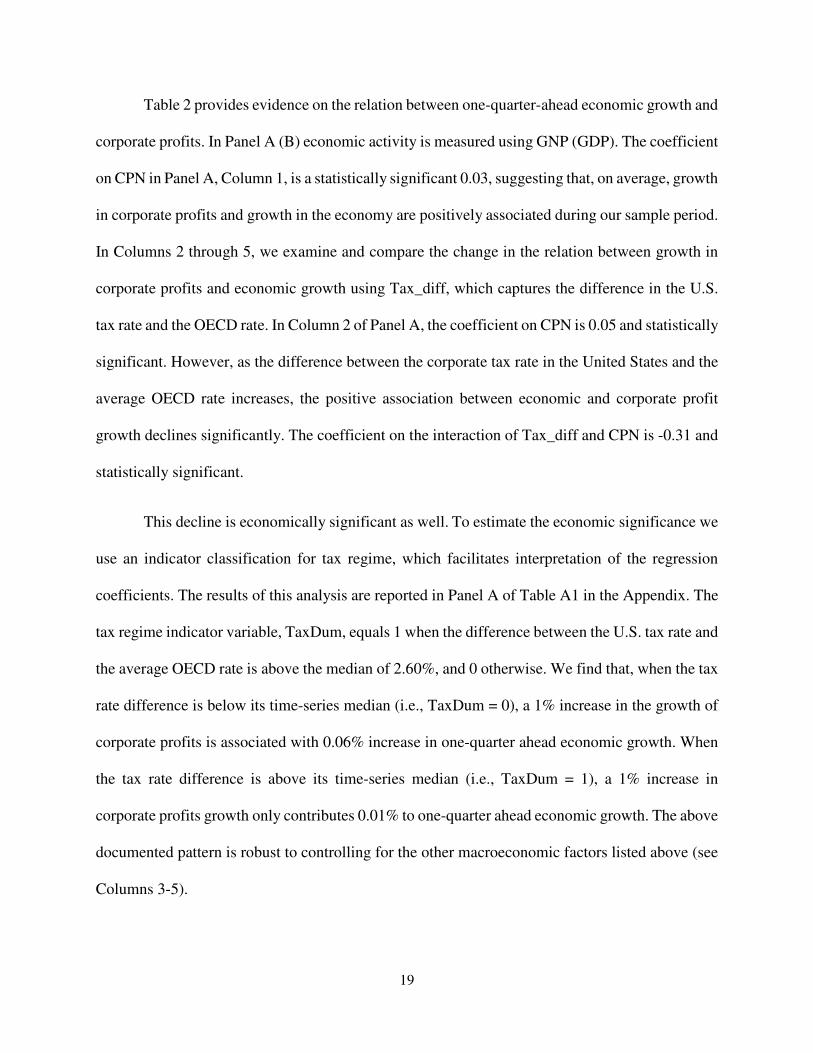
Table 2 provides evidence on the relation between one-quarter-ahead economic growth and
corporate profits. In Panel A (B) economic activity is measured using GNP (GDP). The coefficient
on CPN in Panel A, Column 1, is a statistically significant 0.03, suggesting that, on average, growth
in corporate profits and growth in the economy are positively associated during our sample period.
In Columns 2 through 5, we examine and compare the change in the relation between growth in
corporate profits and economic growth using Tax_diff, which captures the difference in the U.S.
tax rate and the OECD rate. In Column 2 of Panel A, the coefficient on CPN is 0.05 and statistically
significant. However, as the difference between the corporate tax rate in the United States and the
average OECD rate increases, the positive association between economic and corporate profit
growth declines significantly. The coefficient on the interaction of Tax_diff and CPN is -0.31 and
statistically significant.
This decline is economically significant as well. To estimate the economic significance we
use an indicator classification for tax regime, which facilitates interpretation of the regression
coefficients. The results of this analysis are reported in Panel A of Table A1 in the Appendix. The
tax regime indicator variable, TaxDum, equals 1 when the difference between the U.S. tax rate and
the average OECD rate is above the median of 2.60%, and 0 otherwise. We find that, when the tax
rate difference is below its time-series median (i.e., TaxDum = 0), a 1% increase in the growth of
corporate profits is associated with 0.06% increase in one-quarter ahead economic growth. When
the tax rate difference is above its time-series median (i.e., TaxDum = 1), a 1% increase in
corporate profits growth only contributes 0.01% to one-quarter ahead economic growth. The above
documented pattern is robust to controlling for the other macroeconomic factors listed above (see
Columns 3-5).
20
In Panel B of Table 2, we use GDP as the dependent variable and corporate profits are
defined as domestic corporate profits. Consistent with the results of Panel A, the evidence suggests
that the relation between corporate profit growth and economic growth is altered based on the
U.S.-OECD tax differential. In all models, the growth in domestic corporate profits is positively
associated with growth in GDP. However, when we interact Tax_diff with CPD, the association
between the interaction term and GDP is negative and significant in all columns
In summary, the evidence in Table 2 suggests that the difference between the corporate tax
rate in the United States and the average OECD corporate tax rate changes the relation between
U.S. corporate profit growth and economic growth. As the U.S. tax rate increase in relation to the
OECD rate, fewer corporate profits are being directed into domestic economic growth.
3.3. Corporate profits and domestic investments
In this section, we attempt to determine an underlying channel through which the relatively
higher U.S. tax rate has contributed to the structural shift in the relation between economic growth
and corporate profit growth. We conjecture and test whether U.S. companies direct fewer profits
towards domestic investments when the average OECD tax rate is lower than the U.S. rate,
resulting in a relatively lower after-tax return on investments in the United States.15 To test this
conjecture, we estimate regressions nested in the following equation:
INVt+1 = α + β1CPDt + β2Tax_difft + β3Tax_difft*CPDt + β4Crisist + β5INVt + β6GDPt + β7Termt +
β8DEFt + β9T-notet + β10Rett + β11Recession + β11Opennesst + β12Techt + β13Productivityt + β14FXt
+ β15Inv_oppt + β16Ineqt + εt+1, (3)
15 Kothari et al. (2014) and Arif and Lee (2014) investigate the relation between investments and subsequent economic growth, while we focus on the relation between corporate profit growth and one-quarter-ahead growth in aggregate investments, which are included in the calculation of GDP.
21
where INV is the quarterly percentage growth in seasonally adjusted aggregate U.S. domestic
investments. All other variables are defined as above. The results of estimating Equation (3) are
reported in Table 3. Similar to the relation between economic growth and corporate profit growth,
over the full sample period growth in corporate profits is positively associated with growth
domestic investments: the coefficient on CPD is positive and statistically significant in all
specifications. In Column 2, the coefficient on the interaction between Tax_diff and CPD is a
negative 1.70 and statistically significant suggesting that the association between growth in
domestic corporate profits and one-quarter ahead domestic investment growth is less positive when
the U.S. tax rate is relatively higher in comparison to that of the OECD countries.
The decline in the relation between growth in domestic profits and one-quarter-ahead
investments is economically significant as well. In Column 2 of Table A2 of the Appendix, the
coefficient on CPD is 0.24 and coefficient on the interaction of CPD and TaxDum is -0.21. Both
are statistically significant. This suggests that a 1% increase in the growth of corporate profits is
associated with an increase of 0.24% in the growth of one-quarter ahead investments when the
difference between the U.S. tax rate and the OECD rate is below its time-series median (i.e.,
TaxDum = 0). When the tax difference is above its time-series median, a 1% increase in corporate
profits growth is associated with a 0.03 increase in one-quarter ahead investment growth. Further,
the patterns in the relation between growth in corporate profits and one-quarter-ahead investments
are robust to controlling for a variety of other factors (see Columns 3-5 in Tables 3 and A2).
Taken together, the evidence in Tables 1, 2, and 3 suggests that an underlying channel for
the disparity between corporate profit growth and economic growth is that fewer corporate profits
are translating into private domestic investments, a component of GDP, when the U.S. tax rate
exceeds the average OECD tax rate.
22
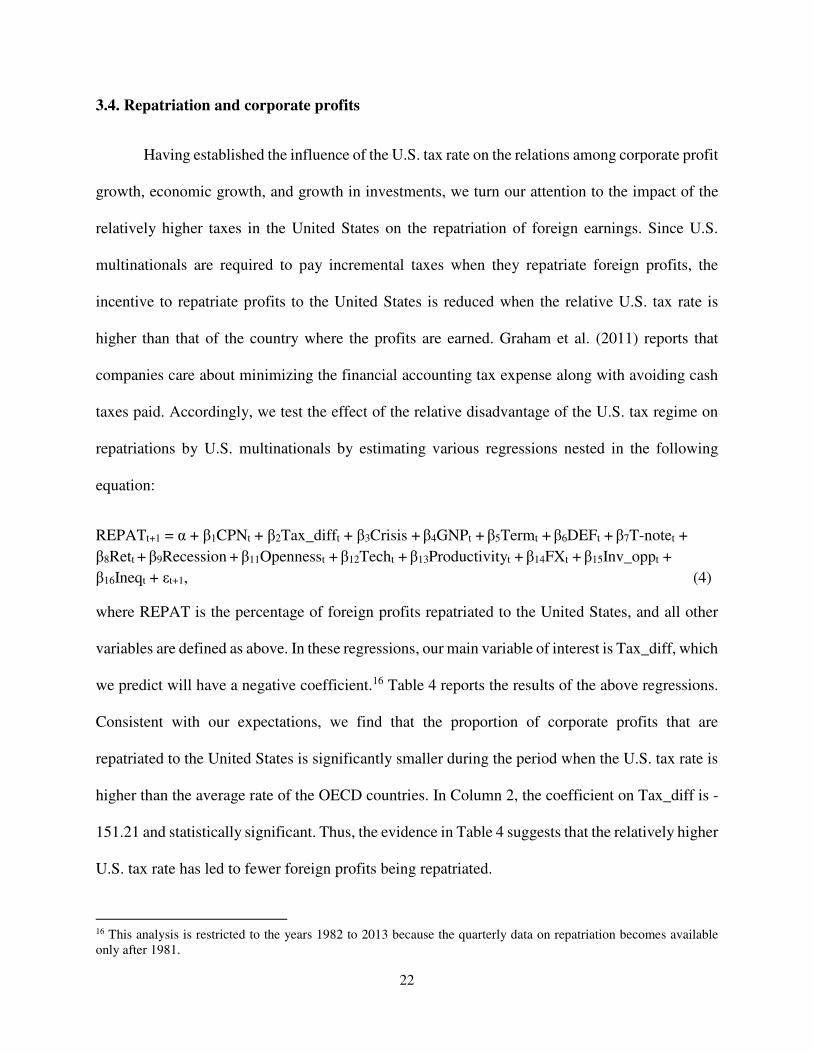
3.4. Repatriation and corporate profits
Having established the influence of the U.S. tax rate on the relations among corporate profit
growth, economic growth, and growth in investments, we turn our attention to the impact of the
relatively higher taxes in the United States on the repatriation of foreign earnings. Since U.S.
multinationals are required to pay incremental taxes when they repatriate foreign profits, the
incentive to repatriate profits to the United States is reduced when the relative U.S. tax rate is
higher than that of the country where the profits are earned. Graham et al. (2011) reports that
companies care about minimizing the financial accounting tax expense along with avoiding cash
taxes paid. Accordingly, we test the effect of the relative disadvantage of the U.S. tax regime on
repatriations by U.S. multinationals by estimating various regressions nested in the following
equation:
REPATt+1 = α + β1CPNt + β2Tax_difft + β3Crisis + β4GNPt + β5Termt + β6DEFt + β7T-notet +
β8Rett + β9Recession + β11Opennesst + β12Techt + β13Productivityt + β14FXt + β15Inv_oppt +
β16Ineqt + εt+1, (4)
where REPAT is the percentage of foreign profits repatriated to the United States, and all other
variables are defined as above. In these regressions, our main variable of interest is Tax_diff, which
we predict will have a negative coefficient.16 Table 4 reports the results of the above regressions.
Consistent with our expectations, we find that the proportion of corporate profits that are
repatriated to the United States is significantly smaller during the period when the U.S. tax rate is
higher than the average rate of the OECD countries. In Column 2, the coefficient on Tax_diff is -
151.21 and statistically significant. Thus, the evidence in Table 4 suggests that the relatively higher
U.S. tax rate has led to fewer foreign profits being repatriated.
16 This analysis is restricted to the years 1982 to 2013 because the quarterly data on repatriation becomes available only after 1981.
23
3.5. Evidence from the American Jobs Creation Act of 2004
In this section, we use the American Jobs Creation Act (AJCA) of 2004 as an exogenous
shock to better establish the effect of the U.S. tax rate on domestic investments and repatriations,
underlying mechanisms that are contributing to the disparity between the growth in corporate
profits and the growth in the economy.
The AJCA, which granted a one-time dividend received deduction of 85% on foreign
earnings repatriated between October 2004 to December 2005, has been used as an exogenous
change to establish the effect of taxes on firm-level repatriations and investments (figure 2 shows
the impact of the AJCA on repatriations). However, the endogenous characteristics of firms that
were or were not able to take advantage of the AJCA have led to mixed evidence of the relation
between the AJCA and firm-level investment decisions. Blouin and Krull (2009) documents that
the repatriating firms had limited domestic investment opportunities, and these firms increased
dividends and repurchases significantly during the AJCA period. Dharmapala et al. (2011) finds
that repatriations did not increase domestic investment, employment, or R&D, even for financially
constrained firms. Instead, the repatriations were associated with an increase in shareholder
payouts. Faulkender and Petersen (2012), on the other hand, classifies firms based on capital
constrains and show that capital-constrained firms did indeed take advantage of the tax reduction
under AJCA to finance domestic investments using repatriated foreign earnings. Edwards et al.
(2015) finds that firms with high levels of trapped cash make less profitable foreign acquisition,
but the AJCA greatly reduced this effect.
We adopt a different approach and use the temporary reduction in the tax costs of
repatriating foreign earnings under the AJCA as an exogenous shock to investigate the effect of
tax rates on aggregate domestic investments and repatriations. A significant benefit of examining
24
the effect of the AJCA at the aggregate level is that we are able to overcome endogeneity related
to firm characteristics. Faulkender and Petersen (2012) point out that the endogenous firm-level
investment decision affects whether funds are repatriated and how they are spent. Unobservable
omitted variables can lead to conflicting conclusions about the impact of the AJCA. We argue that
these firm-level decisions are inconsequential at the aggregate level. If companies repatriate their
earnings, these funds will flow through the economy regardless of how each firm chooses to spend
the funds. Whether the funds are invested internally or paid out to investors, they will contribute
to economic growth.
Specifically, we estimate regressions nested in the following equation to examine the effect
of an exogenous tax rate cut for the repatriation of foreign earnings offered per the AJCA on
repatriations, investments, and economic growth:
DV = α + β1ACT + β2Crisis + β3Termt + β4DEFt + β5T-notet + β6Rett + β7Recession + β8Opennesst
+ β9Techt + β10Productivityt + β11FXt + β12Inv_oppt + β13Ineqt + β14CPt + β15Economic growtht +
εt, (5)
where ACT, our variable of interest, equals 1 for quarter 2004:Q4 to 2005:Q4, the period during
which the AJCA allowed U.S. multinationals to repatriate foreign earnings at a reduced tax rate of
5.25%, and 0 otherwise.17 Our dependent variables are contemporaneous REPAT, and quarter-
ahead INV, GDP and GNP. We predict that the coefficient on ACT will be positive in all
regressions. All other variables are defined as above.
Table 5 presents the results of the effect of the AJCA on our dependent variables. As
predicted, in Column 1 (2) the coefficient on ACT is 57.75 (1.96) and statistically significant.
17 Redmiles (2008) reports that a small percentage of U.S. firms reported repatriations in the 2006 tax years. So, we check the robustness of our findings by including 2006:Q1 in the AJCA period. Our inference remain unchanged if we include 2006:Q1 in the period during which the AJCA allowed repatriations by U.S. multinationals at a reduced tax rate.
25
These results suggest that the reduction in the tax rate on repatriations resulted in a significant
increase in repatriations of foreign earnings and domestic investments. On average, the AJCA tax
reduction was associated with an economically significant increase of approximately 58% and 2%
in quarterly repatriations of foreign earnings and one-quarter ahead domestic investments,
respectively. For comparison, the quarterly average percentage of foreign earnings repatriated by
U.S. multinationals were 49% and domestic investments grew at an average quarterly rate of 1.6%
during our sample period. We find similar results in Columns 3 and 4 for our measures of economic
growth. 18 The coefficient on ACT in Column 3 (4) is 0.67 (0.64) and statistically significant,
suggesting that during the AJCA period, quarter-ahead growth in GDP (GNP) increased, on
average, by 0.67% (0.64%). For comparison, the quarterly average growth rate of GDP and GNP
is approximately 1.5% in our full sample period.
In summary, the evidence in this section and the previous section suggests that tax
incentives have causal effects on domestic investments, as well as repatriations of foreign earnings,
an underlying channel contributing to the disparity between the growth in corporate profits and
growth in the overall economy in the United States.
4. Additional analyses
In this section, we perform several analyses to strengthen the identification of mechanisms
contributing to the disparity between corporate profits and economic growth.
4.1. Corporate profits and economic growth in the Japan and United Kingdom
18 Because the AJCA was structured as a one-time windfall, allowing companies to repatriate foreign profits accumulated over prior periods one time, we are unable to directly examine the impact the Act had on the relation between corporate profit growth and economic growth.
26
To further rule out the alternative mechanisms that might be driving our findings, we
compare the relation between corporate profits and economic growth in the United States to that
in Japan and the United Kingdom. While the three developed economies are arguably similar, their
corporate tax regimes have several important differences. Japan’s corporate tax rate has been
higher than the OECD average and higher than the U.S. rate for most of the last 20 years. On the
other hand, the corporate tax rate in the United Kingdom has been much lower than that in the
United States during a similar period and has very closely followed the decline in the rate of the
other OECD countries.
Further, both Japan and the United Kingdom have recently changed their treatment of
foreign earnings of domestic companies. In 2009 (2010), Japan (the United Kingdom) moved from
a worldwide taxation system — the system used in the United States, where repatriated foreign
profits are taxed at the domestic rate less taxes paid abroad — to a territorial system, where taxes
are paid only in the country in which the earnings are generated, eliminating the incremental
domestic tax upon repatriation of foreign earnings. Therefore, if the higher tax rate in the United
States and its worldwide taxation system have contributed to the growing disparity between
corporate profits and economic growth, we expect that we should not observe such a disparity in
the United Kingdom, regardless of the tax treatment of foreign earnings. In Japan, on the other
hand, we expect the relation between corporate profit growth and economic growth to be similar
to that in the United States, but we expect the disparity in this relation to shrink after 2009 with
Japan moving to a territorial tax regime.
Table 6 reports the results of the comparison of the relation between corporate profits and
economic growth in the United States and those in Japan and the United Kingdom. GDP and
investment data for Japan are downloaded from the Cabinet Office of the Government of Japan.
27
Japanese aggregate corporate profits data are retrieved from Nikkei America Inc. The data are
available on a quarterly basis from 1994 to 2013. GDP, corporate profits, and investment data for
the U.K. are downloaded from the British Office of National Statistics. The U.K. analysis is
restricted to the years 1997 to 2013 because the necessary quarterly U.K. data only becomes
available from 1997 onwards. All other data on Japan and the U.K. are downloaded from IHS
Global Insights and the OECD website. See the Appendix for details.
Consistent with our conjectures, in Japan, where tax rates are relatively higher than the
OECD average, growth in corporate profits is significantly higher than the growth in the overall
economy. Specifically, from 1994 to 2009, when Japan had a worldwide tax system, the tax rate
was, on average, more than 11% higher than the average OECD rate. During this period, as shown
in univariate analysis in Panel A of Table 6, investment and GDP grew at less than 0.2% per
quarter, while corporate profits grew at 8.5% per quarter. After shifting to a territorial tax system
(2010-2013), average growth in investments increased significantly to 0.80% (in comparison,
average growth in investments is 0.28% during the world tax system period). Further, we observe
a marginal shrink in the disparity between growth in corporate profits and GDP after the country
moved to a territorial tax system. Panel B of Table 6 provides further evidence of this shift using
multivariate tests. Columns 1 and 2 show that more corporate profits translate into subsequent
investment after Japan shifts to a territorial tax system, while this relation was not significant under
a worldwide tax system. The evidence suggests that tax rates affect companies’ decisions to invest
domestically and that the tax treatment of foreign earnings impact the relation between corporate
profit growth and economic growth.
In contrast, we do not observe higher corporate profit growth relative to economic growth
in the United Kingdom, where the tax rate is comparable to the average OECD tax rate.
28
Specifically, as shown in Panel A of Table 6, between 1997 and 2010, the U.K. tax rate was, on
average, 29.62%, about 0.4% below the average tax rate of the OECD countries. During this
period, the U.K. economy grew, on average, at about 1.10% each quarter and corporate profits
experienced quarterly growth of 0.77%. After the move to a territorial tax system in 2011, average
domestic investment growth (1.61%) increased significantly compared to the worldwide tax
system period (1997-2010). However, as shown in Columns 3 and 4 of Panel B, Table 6, increases
in domestic investment are not attributable to how corporate profits translate into subsequent
domestic investment. Since the U.K. tax rate is comparable to the OECD average rate during the
entire period sample period, the shift to a territorial tax system should not affect the relation
between corporate profits and subsequent domestic investments.19
Overall, the evidence is consistent with our conjecture that relatively higher tax rates, as
well as the tax treatment of foreign profits, contribute to the disparity between the growth in
corporate profits and the growth in the overall economy.
4.2. Growth in financial assets of “mobile” industries
Firms in certain industries (“mobile” industries, e.g., pharmaceutical and high-tech
industries) have large amounts of intellectual property and produce goods that are used around the
world. Therefore, they are better suited to take advantage of the differences in tax rates across
jurisdictions. Firms in these industries can use strategic transfer pricing, shift actual assets, and
take advantage of global R&D tax incentive among other strategies to move profits to low-tax
countries, thereby reducing their tax burden (De Simone and Stomberg 2013). Kleinbard (2012)
notes that income mobile firms are able to increase their after-tax returns by deflecting high-tax
19 While the U.K. tax rate was marginally below the average OECD rate, it was not below the rates of all OECD countries, providing U.K. companies with the incentive to shift and keep profits in low-tax countries.
29
source country pretax returns to jurisdictions with low taxes, without significant incremental risk.
However, mobile firms cannot repatriate these profits to the United States without incurring an
increased tax bill. Further, limits on their abilities to distribute earnings to shareholders through
dividends and buybacks, leads to higher holdings of cash and marketable securities.20 Firms with
high levels of cash trapped abroad have limited investment opportunities (Edwards et al. 2015).
Therefore, we expect that U.S. mobile industries’ financial asset holdings (i.e., cash and
marketable securities) increase more than other industries as the OECD tax rate falls since firms
in these industries seek profits abroad that remain abroad to avoid repatriation taxes.
Following De Simone and Stomberg (2013), we classify the SIC three-digit industries 283,
357, 367, 737, and 738 as mobile. Barth, Beaver, Hand, and Landsman (1999) classify these
industries as “pharmaceuticals” (283), “computers” (357, 367, and 737), and “services” (738). The
pharmaceutical and computer industries were responsible for half of all repatriated funds during
the AJCA tax holiday (U.S. Senate, 2011), further supporting their classification as mobile.
Table 7 provides the results of our test of whether mobile industries increase their financial
asset holdings at a rate greater than the rest of the corporate sector when the OECD tax rate is
lower compared to the U.S. rate. We compare quarterly aggregate financial asset holdings of firms
in the mobile industries to firms in other industries over quarters when the tax rate difference
between the United States and OECD countries is above and below the time-series median.
Aggregate financial asset holdings are measured as cash and short-term marketable securities
scaled by total assets. All variables are downloaded from the Compustat quarterly file.21
20 Several studies (e.g., Foley et al. 2007; Blouin et al. 2014) find evidence on the firm level that multinational companies hold large amounts of their unrepatriated foreign earnings in cash. 21 We exclude financial firms (SIC codes 6,000-6,999) from our analyses as financial asset holdings can be an important part of these firms’ operating assets and are influenced by regulation.
30
Financial asset holdings for mobile industries increase much more than those in other
industries in quarters when the U.S. tax rate is higher than the OECD rate. Specifically, financial
assets as a percentage of total assets for mobile industries increase by 77% from 13% to 23% when
the tax rate difference is above the median versus when it is below the median. This increase is
economically and statistically significant (t-statistic of the difference is 14.73). For non-mobile
industries, while the increase in financial assets as a percentage of total assets (from 6% to 7%) is
also statistically significant (t-statistic of the difference is 6.19), the economic magnitude of the
increase compared to that the mobile industries is much smaller. The increase in financial assets
of other industries is only 1%. Importantly, the difference-in-difference for the increases of
financial holdings of mobile industries and other industries between the two sub-periods is
economically and statistically significant (100% with a t-statistic of 15.94).
In conclusion, the evidence in Table 7 suggests that U.S. firms in industries that are able to
take advantage of tax rate differences across jurisdictions (i.e., firms in mobile industries) increase
their holdings of financial assets at a higher rate than other firms when the OECD tax rate is lower
relative to the U.S. tax rate. The evidence is consistent with the conjecture that firms are holding
more financial assets instead of repatriating profits (thereby avoiding repatriation taxes) and
making fewer investments in U.S. when the OECD tax rate is lower than the U.S. tax rate.
5. Conclusion
We document that the relation between the growth in corporate profits and the growth in
the economy in the United States depends on the U.S. corporate income tax rate relative to the
average rate of all other OECD countries. We find that during periods when the difference between
the U.S. tax rate and the OECD rate is below its time-series median, growth in corporate profits is
closely related to economic growth. However, when the U.S. tax rate is relatively higher and the
31
difference between the rates is above its time-series median, corporate profits grow at nearly
double the rate of the economy.
The underlying mechanism contributing to the disparity between corporate profits and
economic growth is fewer profits translating into subsequent domestic investments. We find that
the relatively higher U.S. tax rate and the accounting treatment of foreign earnings discourage U.S.
firms from investing their earnings domestically and repatriating their foreign earnings to the
United States. Relatedly, President Barack Obama has recently proposed imposing a lower tax on
foreign earnings (relative to domestic earnings) of U.S. multinationals to encourage the
multinationals to repatriate earnings and use the proceeds for domestic infrastructure investments.
Further, several 2016 Presidential candidates have proposed tax reforms focusing on the relatively
higher tax rates and the treatment of foreign earnings in the United States. Our results provide
evidence of potential issues with the current system of taxation and suggest that a reduction in the
U.S. tax rate and the move to a territorial tax system from a worldwide one can better align
economic growth with growth in corporate profits by encouraging firms to invest domestically and
repatriate foreign earnings.
In addition to the inter-temporal analysis to identify these underlying channels, we exploit
the exogenous shock of the American Jobs Creation Act of 2004, which provided a temporary tax
reduction for repatriating foreign earnings, to identify the causal effect of the relatively higher U.S.
tax rate on aggregate domestic investments and repatriations. The evidence suggests that aggregate
investments and repatriations increased significantly during the years when the AJCA reduced the
tax cost of repatriating foreign earnings, and economic growth was higher in subsequent quarters.
Finally, we also conduct cross-sectional and cross-country analyses to examine the impact of taxes
on the relation between corporate profits and economic growth.
32
Our study is among the first to systematically investigate and document the evolution of
the relation between growth in corporate profits and the economy over time. The growth in
corporate profits at nearly double the rate of the growth in the economy — a phenomenon in the
United States for more than 20 years — is not sustainable indefinitely since, at the current growth
rates, corporate profits would eventually become larger than the total economy. We also contribute
to the literature by showing the effect of taxes on aggregate economic activity and investments,
an area that is relatively underexplored (Hanlon and Heitzman 2010). We find that the relatively
higher U.S. tax rate and the accounting treatment of foreign earnings decreases the after-tax returns
of investing in the United States and deters firms from making investments domestically or
repatriating foreign earnings.
33
References
Altshuler, R., Grubert, H., Newlon, T.S., 2000. Has U.S. investment abroad become more sensitive to tax rates? In International Taxation and Multinational Activity, edited by J. Hines Jr., Chicago: University of Chicago Press, 9-38. Arif, S., Lee, C., 2014. Aggregate investment and investor sentiment. Review of Financial
Studies, 27(11), 3241-3279. Barth, M., Beaver, W., Hand, J., Landsman, W., 1999. Accruals, cash flows, and equity values. Review of Accounting Studies 3, 205-229. Blanchard, O., Perotti, R., 2002. An empirical characterization of the dynamic effects of changes in government spending and taxes on output. The Quarterly Journal of Economics 117(4), 1329-1368. Blouin, J., Krull, L., 2009. Bringing it home: A study of the incentives surrounding the repatriation of foreign earnings under the American Jobs Creation Act of 2004. Journal of
Accounting Research 47(4), 1027-1059. Blouin, J., Krull, L., Robinson, L., 2012. Is U.S. multinational dividend repatriation policy influenced by reporting incentives? The Accounting Review 87(5), 1463-1491. Blouin, J., Krull, L., Robinson, L., 2014. The location, composition, and investment implications of permanently reinvested earnings. Working paper. Bureau of Economic Analysis, 2014. Concepts and methods of the U.S. national income and product accounts. Available at www.bea.gov/national/pdf/all-chapters.pdf. De Mooij, R., Ederveen, S., 2003. Taxation and foreign direct investment: A synthesis of empirical research. International Tax and Public Finance 10, 673-693. De Simone, L., Stomberg, B., 2013. Do investors differentially value tax avoidance by income mobile firms?. Working Paper. Dharmapala, D., Foley, F., Forbes, K., 2011. Watch what I do, not what I say: The unintended consequences of the Homeland Investment Act. Journal of Finance 66(3), 753-787. Dyreng, S., Hanlon, M., Maydew, E., Thornock, J., 2014. Changes in corporate effective tax rates over the past twenty-five years. Working Paper.
Dyreng, S., Lindsay, B., 2009. Using financial accounting data to examine the effect of foreign operations located in tax havens and other countries on U.S. multinational firms’ tax rates. Jounral of Accounting Research 47(5), 1283-1316.
34
Dyreng, S., Lindsey, B., Thornock, J., 2013. Exploring the role Delaware plays as a domestic tax haven. Journal of Financial Economics 108, 751-772. The Economist. 2014. The fury of the makers. October 25. The Economist. 2015. Corporate-tax reform in America: An offer they could refuse. February 7. Edwards, A., Kravet, T., Wilson, R., 2015. Trapped cash and the profitability of foreign acquisitions. Contemporary Accounting Research, forthcoming. Faulkender, M., Petersen, M., 2012. Investment and Capital Constraints: Repatriations under the American Jobs Creation Act. The Review of Financial Studies 25, 3351-3388. Foley, C., Hartzell, J., Titman, S., Twite, G., 2007. Why do firms hold so much cash? A tax-based explanation. Journal of Financial Economics 86, 579-607. Giovannoni, O., Lu, L., Nguyen, D., Xu, A., 2014. What do we know about the labor share and the profit share? Part II: Empirical studies. Working Paper No. 804, Levy Economics Institute of Bard College. Graham, J., Hanlon, M., Shevlin, T., 2010. Barriers to mobility: The lockout effect of U.S. taxation of worldwide corporate profits. National Tax Journal, 63(4), 1111-1144. Graham, J., Hanlon, M., Shevlin, T., 2011. Real effects of accounting rules: Evidence from multinational firms’ investment location and profit repatriation decisions. Journal of Accounting
Research 49(1), 137-185. Greenwood, J., Hercowitz, Z., Krussel, P., 1997. Long-run implications of investment-specific technological change. The American Economic Review 87(3), 342-362. Grubert, H., Mutti, J., 1991. Taxes, tariffs and transfer pricing in multinational corporate decision making. The Review of Economics and Statistics 73(2), 285-293. Guscina, A., 2006. Effects of globalization on labor’s share of income. IMF Working Paper. Hall, R., Jorgenson, D., 1967. Tax policy and investment behavior. The American Economic
Review 57(3), 391-414. Hanlon, M., Heitzman, S., 2010. A review of tax research. Journal of Accounting and Economics 50, 127-178. Hanlon, M., Lester, R., Verdi, R., 2015. The effect of repatriation tax costs on U.S. multinational investment. Journal of Financial Economics 116(1), 179-196. Hartman, D., 1985. Tax policy and foreign direct investment. Journal of Public Economics 26, 107-121.
35
Hassett, K., Hubbard, R. G., 2002. Tax policy and business investment. In Handbook of Public
Economics, volume 3, edited by A.J. Auerbach and M. Feldstein, Elseview, 1293-1343. Hassett, K., Newmark, K., 2008. Taxation and business behavior: A review of recent literature. In Fundamental tax reform: Issues, choices and implications, edited by J.W. Diamond and G.R. Zodrow, Cambridge: MIT Press, 191-213. Hines, J., 1997. Tax policy and the activities of multinational corporations. In Fiscal Policy:
Lessons from Economic Research, edited by A.J. Auerbach, Cambridge: MIT Press, 401-445. Hines, J., 1998. ‘Tax sparing’ and direct investment in developing countries. NBER Working
Paper 6728. Hines, J., Rice, E., 1994. Fiscal paradise: Foreign tax havens and American business. The
Quarterly Journal of Economics 109(1), 149-182. Klassen, K., Laplante, S., 2012. Are U.S. multinational corporations becoming more aggressive income shifters? Journal of Accounting Research 50(5), 1245-1286. Klassen, K., Laplante, S., Carnaghan, C., 2014. A model of multinational income shifting and an application to tax planning with e-commerce. The Journal of the American Taxation Association 36(2), 27-53. Kleinbard, E. 2012. Stateless income’s challenge to tax policy: Part 2. Tax Notes International,
November 12, 2012: 671-687. Krull, L., 2004. Permanently reinvested earnings, taxes, and earnings management. The
Accounting Review 79(3), 745-767. Kothari, S.P., Lewellen, J., Warner, J., 2014. The Behavior of Aggregate Corporate Investment. Working Paper. Krugman, P., 2008. Trade and wages, reconsidered. Brookings Papers on Economic Activity, 103-154. Maydew, E., 2001. Empirical tax research in accounting: A discussion. Journal of Accounting
and Economics 31, 389-403. Nessa, M., Shevlin, T., Wilson R., 2015. What do investors infer about future cash flows from foreign earnings for firms with low average foreign tax rates? Working Paper. Oler, M., Shevlin, T., Wilson, R., 2007. Examining investor expectations concerning tax savings on the repatriation of foreign earnings under the American Jobs Creation Act of 2004. Journal of
the American Taxation Association 29(2), 25-55.
36
Poterba, J. 2000. Stock market wealth and consumption. Journal of Economic Perspectives 14 (2), 99-118. Price Waterhouse & Co., 1976. Corporate taxes in 80 countries. New York. Price Waterhouse & Co., 1978. Corporate taxes in 80 countries. New York. Price Waterhouse & Co., 1980. Corporate taxes in 80 countries. New York. Romer, C., Romer, D., 2010. The macroeconomic effects of tax changes: estimates based on a new measure of fiscal shocks. The American Economic Review 100(3), 763-801. Shackelford, D., Shaviro, D., Slemord, J., 2010. Taxation and the financial sector. In Taxation
and the Financial Crisis, edited by J.S. Alworth and G. Arachi, Oxford: Oxford University Press, 148-173. Shackelford, D., Slemrod, J., Sallee, J., 2011. Financial reporting, tax, and real decisions: toward a unifying framework. International Tax and Public Finance 18, 461-494. Shackelford, D., Shevlin, T., 2001. Empirical tax research in accounting. Journal of Accounting
and Economics 31, 321-387. Slemrod, J., 1992. Do taxes matter? Lessons from the 1980’s. The American Economic Review 82(2), 250-256. U.S. Senate Permanent Subcommittee on Investigations, 2011. Repatriating Offshore Funds: 2004 Tax Windfall for Select Multinationals. October 11.
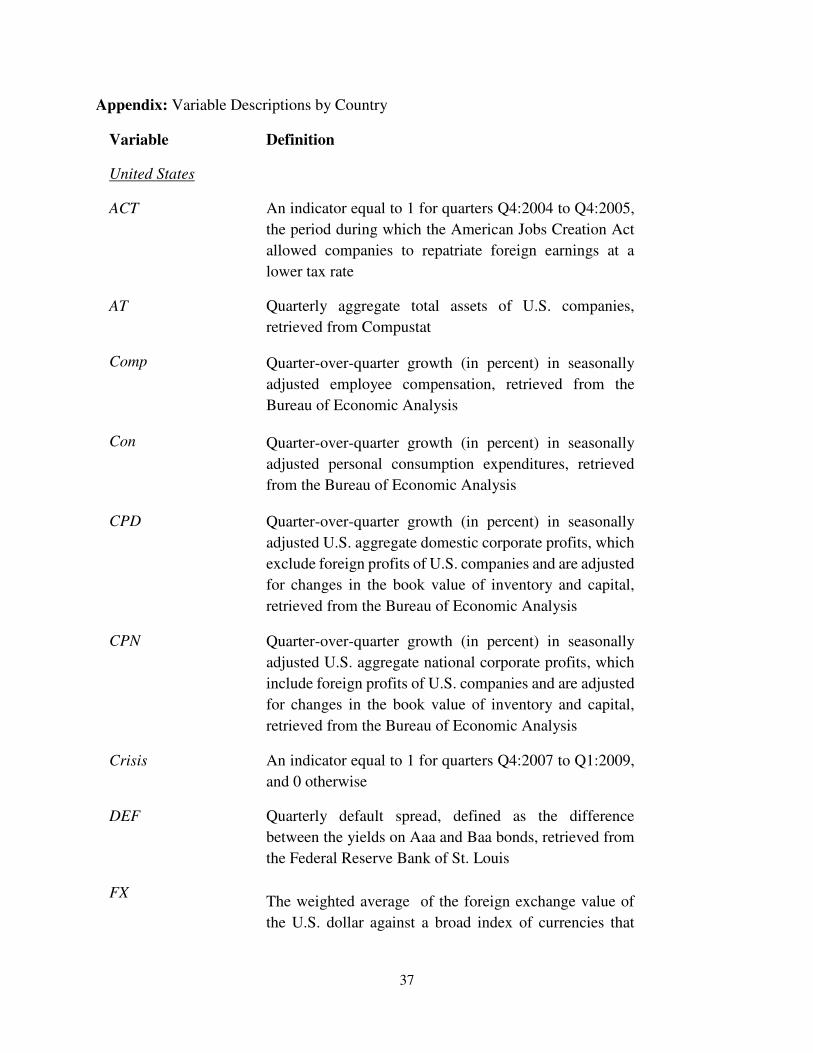
37
Appendix: Variable Descriptions by Country
Variable Definition
United States
ACT An indicator equal to 1 for quarters Q4:2004 to Q4:2005,
the period during which the American Jobs Creation Act
allowed companies to repatriate foreign earnings at a
lower tax rate
AT Quarterly aggregate total assets of U.S. companies,
retrieved from Compustat
Comp Quarter-over-quarter growth (in percent) in seasonally
adjusted employee compensation, retrieved from the
Bureau of Economic Analysis
Con Quarter-over-quarter growth (in percent) in seasonally
adjusted personal consumption expenditures, retrieved
from the Bureau of Economic Analysis
CPD Quarter-over-quarter growth (in percent) in seasonally
adjusted U.S. aggregate domestic corporate profits, which
exclude foreign profits of U.S. companies and are adjusted
for changes in the book value of inventory and capital,
retrieved from the Bureau of Economic Analysis
CPN Quarter-over-quarter growth (in percent) in seasonally
adjusted U.S. aggregate national corporate profits, which
include foreign profits of U.S. companies and are adjusted
for changes in the book value of inventory and capital,
retrieved from the Bureau of Economic Analysis
Crisis An indicator equal to 1 for quarters Q4:2007 to Q1:2009,
and 0 otherwise
DEF Quarterly default spread, defined as the difference
between the yields on Aaa and Baa bonds, retrieved from
the Federal Reserve Bank of St. Louis
FX The weighted average of the foreign exchange value of
the U.S. dollar against a broad index of currencies that
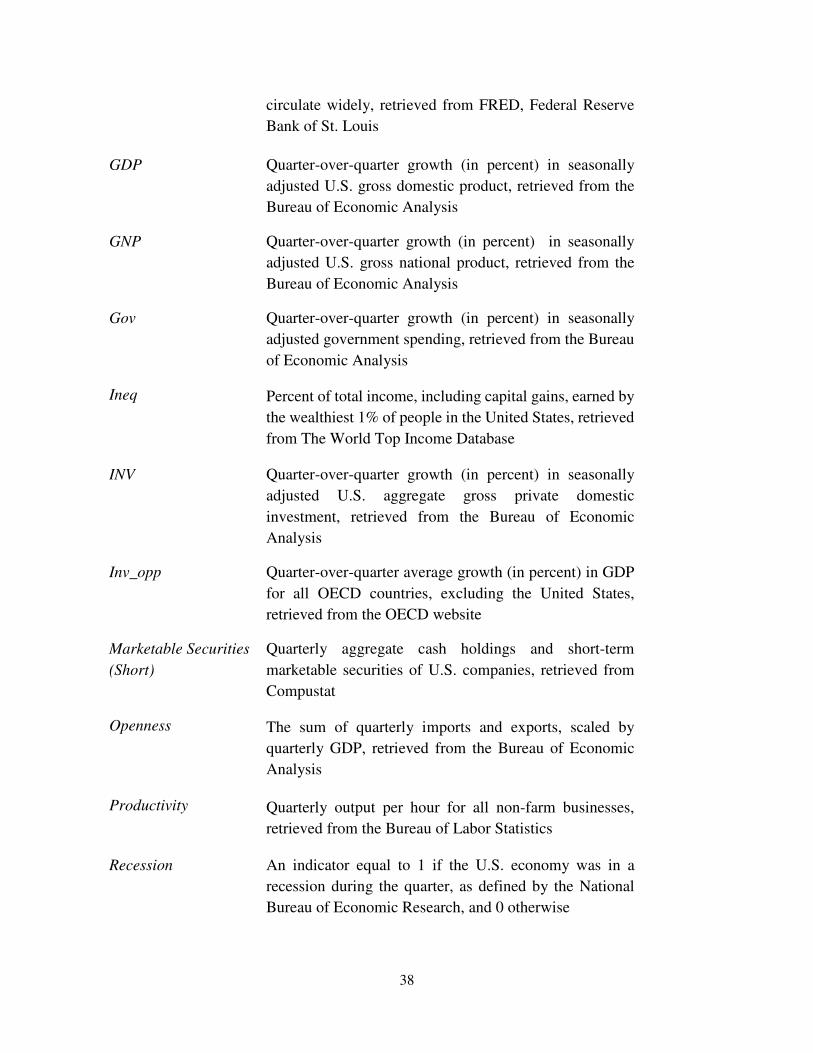
38
circulate widely, retrieved from FRED, Federal Reserve
Bank of St. Louis
GDP Quarter-over-quarter growth (in percent) in seasonally
adjusted U.S. gross domestic product, retrieved from the
Bureau of Economic Analysis
GNP Quarter-over-quarter growth (in percent) in seasonally
adjusted U.S. gross national product, retrieved from the
Bureau of Economic Analysis
Gov Quarter-over-quarter growth (in percent) in seasonally
adjusted government spending, retrieved from the Bureau
of Economic Analysis
Ineq Percent of total income, including capital gains, earned by
the wealthiest 1% of people in the United States, retrieved
from The World Top Income Database
INV Quarter-over-quarter growth (in percent) in seasonally
adjusted U.S. aggregate gross private domestic
investment, retrieved from the Bureau of Economic
Analysis
Inv_opp Quarter-over-quarter average growth (in percent) in GDP
for all OECD countries, excluding the United States,
retrieved from the OECD website
Marketable Securities
(Short)
Quarterly aggregate cash holdings and short-term
marketable securities of U.S. companies, retrieved from
Compustat
Openness The sum of quarterly imports and exports, scaled by
quarterly GDP, retrieved from the Bureau of Economic
Analysis
Productivity Quarterly output per hour for all non-farm businesses,
retrieved from the Bureau of Labor Statistics
Recession An indicator equal to 1 if the U.S. economy was in a
recession during the quarter, as defined by the National
Bureau of Economic Research, and 0 otherwise
39
REINV Percentage of quarterly foreign earnings by U.S. firms that
was reinvested abroad, retrieved from the Bureau of
Economic Analysis
REPAT Percentage of quarterly foreign earnings by U.S. firms that
was repatriated through dividends and withdrawals,
retrieved from the Bureau of Economic Analysis
Ret Quarterly value-weighted aggregate stock returns,
retrieved from Kenneth French’s website.
T-bill Quarterly yield on the 10-year Treasury note, retrieved
from CRSP
Tax_diff Difference between U.S. tax rate and the average tax rate
of OECD countries in that quarter, retrieved from the
OECD for years 1981-2013 and Corporate Taxes in 80
Countries (Price Waterhouse & Co. 1976; Price
Waterhouse & Co. 1978; Price Waterhouse & Co. 1980)
for 1975-1980
Tech Quarterly total investment scaled by quarterly GDP,
retrieved from the Bureau of Economic Analysis
Term Quarterly difference between the returns on 10-year and
1-year Treasuries, retrieved from CRSP
Japan
CPD Quarter-over-quarter growth (in percent) in Japanese
aggregate corporate net operating surplus, retrieved from
Nikkei America
FX Average quarterly Japanese-U.S. exchange rate (yen per
dollar), retrieved from IHS Global Insights
GDP Quarter-over-quarter growth (in percent) in seasonally
adjusted Japanese gross domestic product, retrieved from
the Cabinet Office of the Government of Japan
40
INV Quarter-over-quarter growth (in percent) in seasonally
adjusted Japanese domestic investment, retrieved from the
Cabinet Office of the Government of Japan
Openness The sum of quarterly imports and exports, scaled by
quarterly GDP, retrieved from the Cabinet Bureau of the
Government of Japan and IHS Global Insights
Ret Quarterly return on the Tokyo Stock Exchange All Shares
Index, retrieved from the OECD
T-bill Quarterly yield on the 10-year Japanese government bond,
retrieved from IHS Global Insights
Tech Quarterly total investment scaled by quarterly GDP,
retrieved from the Cabinet Bureau of the Government of
Japan
Term Quarterly difference between the returns on 10-year and
2-year Japanese government bonds, retrieved from IHS
Global Insights
Territorial Indicator equal to 1 when Japan taxes profits made abroad
under a territorial tax system and 0 when profits are taxed
under a worldwide system
United Kingdom
CP Quarter-over-quarter growth (in percent) in U.K.
aggregate corporate net operating surplus, retrieved from
the Office for National Statistics
FX Average quarterly U.K.-U.S. exchange rate (pound per
dollar), retrieved from IHS Global Insights
GDP Quarter-over-quarter growth (in percent) in seasonally
adjusted U.K. gross domestic product, retrieved from the
Office for National Statistics
INV Quarter-over-quarter growth (in percent) in seasonally
adjusted U.K. domestic investment, retrieved from the
Office for National Statistics
41
Openness The sum of quarterly imports and exports, scaled by
quarterly GDP, retrieved from the Office for National
Statistics and IHS Global Insights
Ret Quarterly return on the FTSE 100 Index, retrieved from
the OECD
T-bill Quarterly yield on the 10-year U.K. government bond,
retrieved from IHS Global Insights
Tech Quarterly total investment scaled by quarterly GDP,
retrieved from the Office for National Statistics
Term Quarterly difference between the returns on 10-year and
2-year U.K. government bonds, retrieved from IHS Global
Insights
Territorial Indicator equal to 1 when the U.K. taxes profits made
abroad under a territorial tax system and 0 when profits
are taxed under a worldwide system

42
Figure 1: Corporate Income Taxes Over Time
Figure 1 plots the corporate tax rate of the United States and the average corporate tax rate for all OECD countries.
0.0%
10.0%
20.0%
30.0%
40.0%
50.0%
60.0%
19751977197919811983198519871989199119931995199719992001200320052007200920112013
US
OECD Average
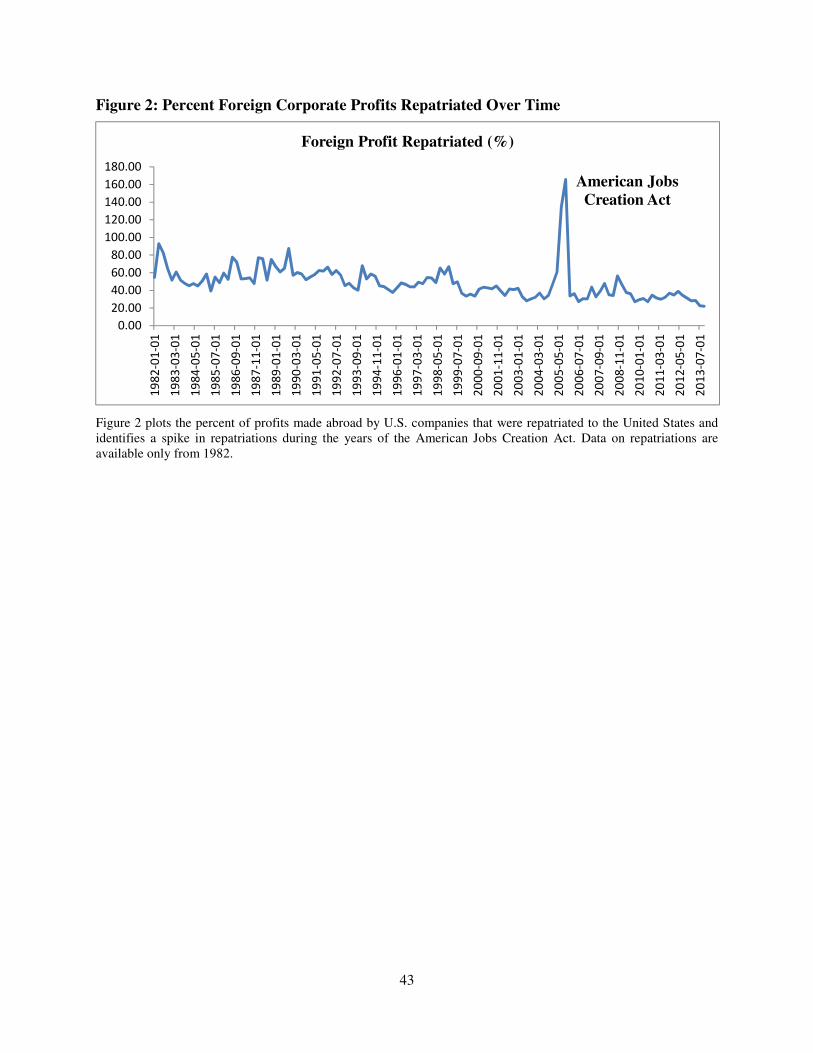
43
Figure 2: Percent Foreign Corporate Profits Repatriated Over Time
Figure 2 plots the percent of profits made abroad by U.S. companies that were repatriated to the United States and identifies a spike in repatriations during the years of the American Jobs Creation Act. Data on repatriations are available only from 1982.
American Jobs
Creation Act
0.00
20.00
40.00
60.00
80.00
100.00
120.00
140.00
160.00
180.001
98
2-0
1-0
1
19
83
-03
-01
19
84
-05
-01
19
85
-07
-01
19
86
-09
-01
19
87
-11
-01
19
89
-01
-01
19
90
-03
-01
19
91
-05
-01
19
92
-07
-01
19
93
-09
-01
19
94
-11
-01
19
96
-01
-01
19
97
-03
-01
19
98
-05
-01
19
99
-07
-01
20
00
-09
-01
20
01
-11
-01
20
03
-01
-01
20
04
-03
-01
20
05
-05
-01
20
06
-07
-01
20
07
-09
-01
20
08
-11
-01
20
10
-01
-01
20
11
-03
-01
20
12
-05
-01
20
13
-07
-01
Foreign Profit Repatriated (%)
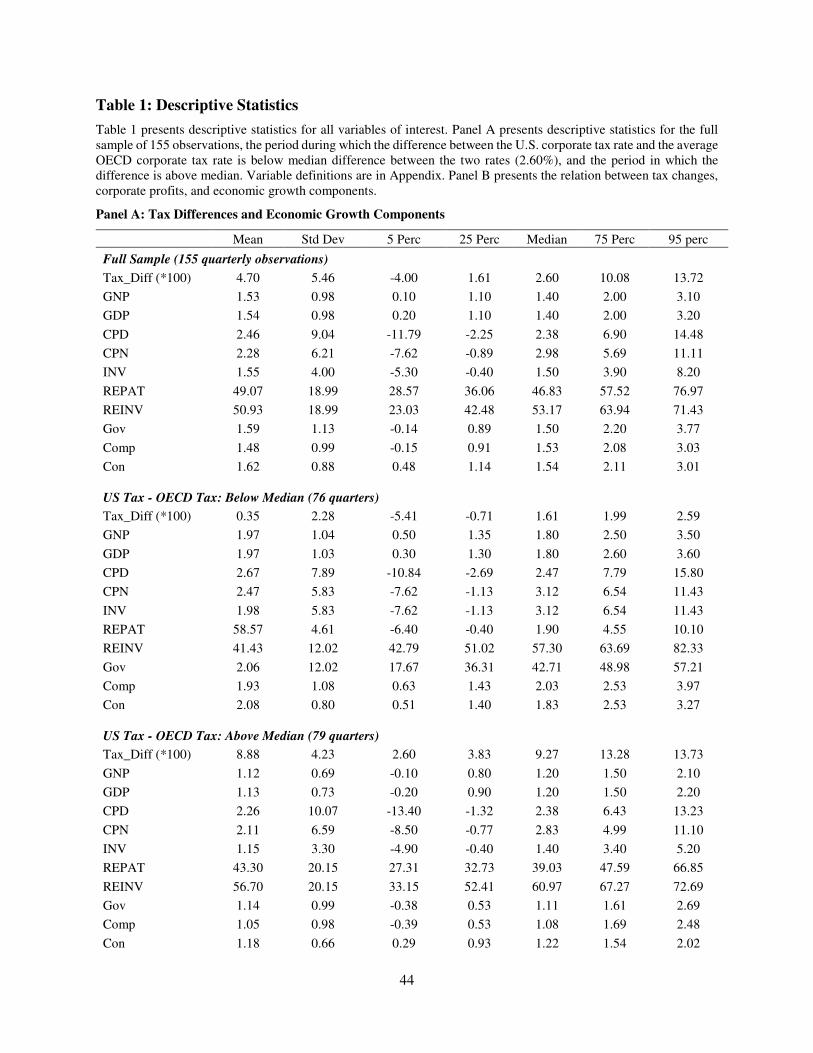
44
Table 1: Descriptive Statistics
Table 1 presents descriptive statistics for all variables of interest. Panel A presents descriptive statistics for the full sample of 155 observations, the period during which the difference between the U.S. corporate tax rate and the average OECD corporate tax rate is below median difference between the two rates (2.60%), and the period in which the difference is above median. Variable definitions are in Appendix. Panel B presents the relation between tax changes, corporate profits, and economic growth components.
Panel A: Tax Differences and Economic Growth Components
Mean Std Dev 5 Perc 25 Perc Median 75 Perc 95 perc
Full Sample (155 quarterly observations)
Tax_Diff (*100) 4.70 5.46 -4.00 1.61 2.60 10.08 13.72
GNP 1.53 0.98 0.10 1.10 1.40 2.00 3.10
GDP 1.54 0.98 0.20 1.10 1.40 2.00 3.20
CPD 2.46 9.04 -11.79 -2.25 2.38 6.90 14.48
CPN 2.28 6.21 -7.62 -0.89 2.98 5.69 11.11
INV 1.55 4.00 -5.30 -0.40 1.50 3.90 8.20
REPAT 49.07 18.99 28.57 36.06 46.83 57.52 76.97
REINV 50.93 18.99 23.03 42.48 53.17 63.94 71.43
Gov 1.59 1.13 -0.14 0.89 1.50 2.20 3.77
Comp 1.48 0.99 -0.15 0.91 1.53 2.08 3.03
Con 1.62 0.88 0.48 1.14 1.54 2.11 3.01
US Tax - OECD Tax: Below Median (76 quarters)
Tax_Diff (*100) 0.35 2.28 -5.41 -0.71 1.61 1.99 2.59
GNP 1.97 1.04 0.50 1.35 1.80 2.50 3.50
GDP 1.97 1.03 0.30 1.30 1.80 2.60 3.60
CPD 2.67 7.89 -10.84 -2.69 2.47 7.79 15.80
CPN 2.47 5.83 -7.62 -1.13 3.12 6.54 11.43
INV 1.98 5.83 -7.62 -1.13 3.12 6.54 11.43
REPAT 58.57 4.61 -6.40 -0.40 1.90 4.55 10.10
REINV 41.43 12.02 42.79 51.02 57.30 63.69 82.33
Gov 2.06 12.02 17.67 36.31 42.71 48.98 57.21
Comp 1.93 1.08 0.63 1.43 2.03 2.53 3.97
Con 2.08 0.80 0.51 1.40 1.83 2.53 3.27
US Tax - OECD Tax: Above Median (79 quarters)
Tax_Diff (*100) 8.88 4.23 2.60 3.83 9.27 13.28 13.73
GNP 1.12 0.69 -0.10 0.80 1.20 1.50 2.10
GDP 1.13 0.73 -0.20 0.90 1.20 1.50 2.20
CPD 2.26 10.07 -13.40 -1.32 2.38 6.43 13.23
CPN 2.11 6.59 -8.50 -0.77 2.83 4.99 11.10
INV 1.15 3.30 -4.90 -0.40 1.40 3.40 5.20
REPAT 43.30 20.15 27.31 32.73 39.03 47.59 66.85
REINV 56.70 20.15 33.15 52.41 60.97 67.27 72.69
Gov 1.14 0.99 -0.38 0.53 1.11 1.61 2.69
Comp 1.05 0.98 -0.39 0.53 1.08 1.69 2.48
Con 1.18 0.66 0.29 0.93 1.22 1.54 2.02
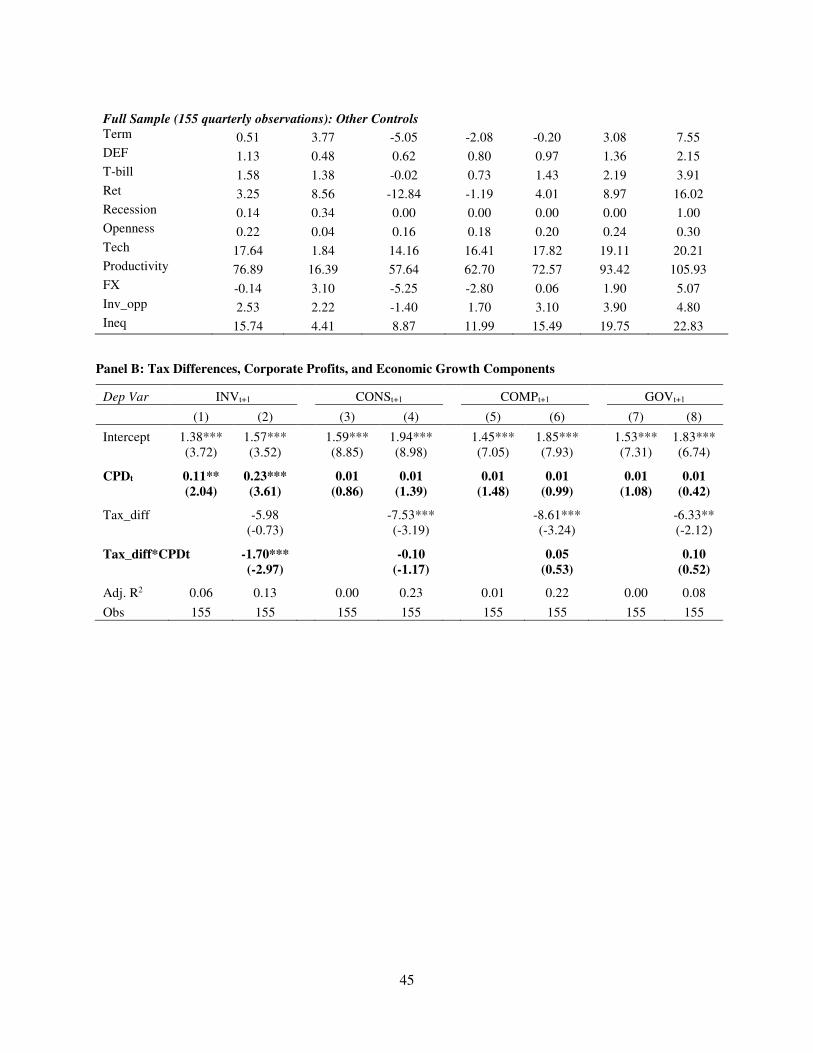
45
Full Sample (155 quarterly observations): Other Controls Term 0.51 3.77 -5.05 -2.08 -0.20 3.08 7.55 DEF 1.13 0.48 0.62 0.80 0.97 1.36 2.15 T-bill 1.58 1.38 -0.02 0.73 1.43 2.19 3.91 Ret 3.25 8.56 -12.84 -1.19 4.01 8.97 16.02 Recession 0.14 0.34 0.00 0.00 0.00 0.00 1.00 Openness 0.22 0.04 0.16 0.18 0.20 0.24 0.30 Tech 17.64 1.84 14.16 16.41 17.82 19.11 20.21 Productivity 76.89 16.39 57.64 62.70 72.57 93.42 105.93 FX -0.14 3.10 -5.25 -2.80 0.06 1.90 5.07 Inv_opp 2.53 2.22 -1.40 1.70 3.10 3.90 4.80 Ineq 15.74 4.41 8.87 11.99 15.49 19.75 22.83
Panel B: Tax Differences, Corporate Profits, and Economic Growth Components
Dep Var INVt+1 CONSt+1 COMPt+1 GOVt+1
(1) (2) (3) (4) (5) (6) (7) (8)
Intercept 1.38*** 1.57*** 1.59*** 1.94*** 1.45*** 1.85*** 1.53*** 1.83*** (3.72) (3.52) (8.85) (8.98) (7.05) (7.93) (7.31) (6.74)
CPDt 0.11** 0.23*** 0.01 0.01 0.01 0.01 0.01 0.01
(2.04) (3.61) (0.86) (1.39) (1.48) (0.99) (1.08) (0.42)
Tax_diff -5.98 -7.53*** -8.61*** -6.33** (-0.73) (-3.19) (-3.24) (-2.12)
Tax_diff*CPDt -1.70*** -0.10 0.05 0.10
(-2.97) (-1.17) (0.53) (0.52)
Adj. R2 0.06 0.13 0.00 0.23 0.01 0.22 0.00 0.08
Obs 155 155 155 155 155 155 155 155
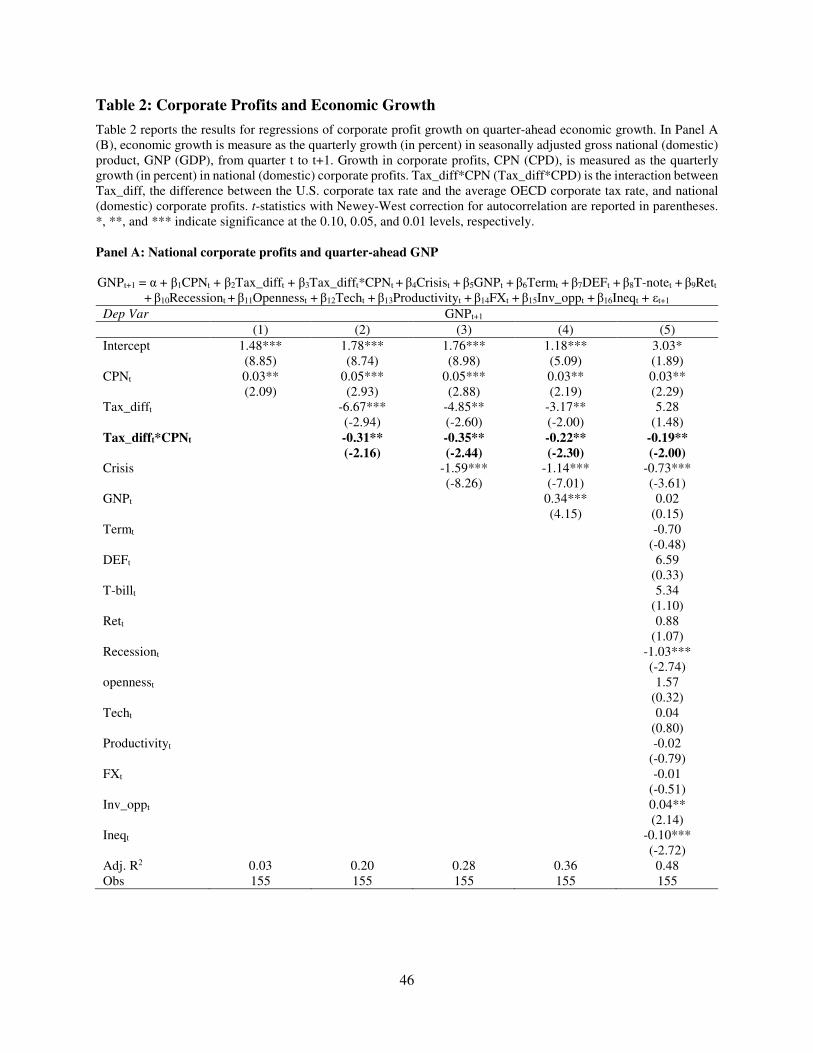
46
Table 2: Corporate Profits and Economic Growth
Table 2 reports the results for regressions of corporate profit growth on quarter-ahead economic growth. In Panel A (B), economic growth is measure as the quarterly growth (in percent) in seasonally adjusted gross national (domestic) product, GNP (GDP), from quarter t to t+1. Growth in corporate profits, CPN (CPD), is measured as the quarterly growth (in percent) in national (domestic) corporate profits. Tax_diff*CPN (Tax_diff*CPD) is the interaction between Tax_diff, the difference between the U.S. corporate tax rate and the average OECD corporate tax rate, and national (domestic) corporate profits. t-statistics with Newey-West correction for autocorrelation are reported in parentheses. *, **, and *** indicate significance at the 0.10, 0.05, and 0.01 levels, respectively. Panel A: National corporate profits and quarter-ahead GNP
GNPt+1 = α + β1CPNt + β2Tax_difft + β3Tax_difft*CPNt + β4Crisist + β5GNPt + β6Termt + β7DEFt + β8T-notet + β9Rett
+ β10Recessiont + β11Opennesst + β12Techt + β13Productivityt + β14FXt + β15Inv_oppt + β16Ineqt + εt+1
Dep Var GNPt+1
(1) (2) (3) (4) (5)
Intercept 1.48*** 1.78*** 1.76*** 1.18*** 3.03* (8.85) (8.74) (8.98) (5.09) (1.89) CPNt 0.03** 0.05*** 0.05*** 0.03** 0.03** (2.09) (2.93) (2.88) (2.19) (2.29) Tax_difft -6.67*** -4.85** -3.17** 5.28 (-2.94) (-2.60) (-2.00) (1.48) Tax_difft*CPNt -0.31** -0.35** -0.22** -0.19**
(-2.16) (-2.44) (-2.30) (-2.00)
Crisis -1.59*** -1.14*** -0.73*** (-8.26) (-7.01) (-3.61) GNPt 0.34*** 0.02 (4.15) (0.15) Termt -0.70 (-0.48) DEFt 6.59 (0.33) T-billt 5.34 (1.10) Rett 0.88 (1.07) Recessiont -1.03*** (-2.74) opennesst 1.57 (0.32) Techt 0.04 (0.80) Productivityt -0.02 (-0.79) FXt -0.01 (-0.51) Inv_oppt 0.04** (2.14) Ineqt -0.10*** (-2.72) Adj. R2 0.03 0.20 0.28 0.36 0.48 Obs 155 155 155 155 155
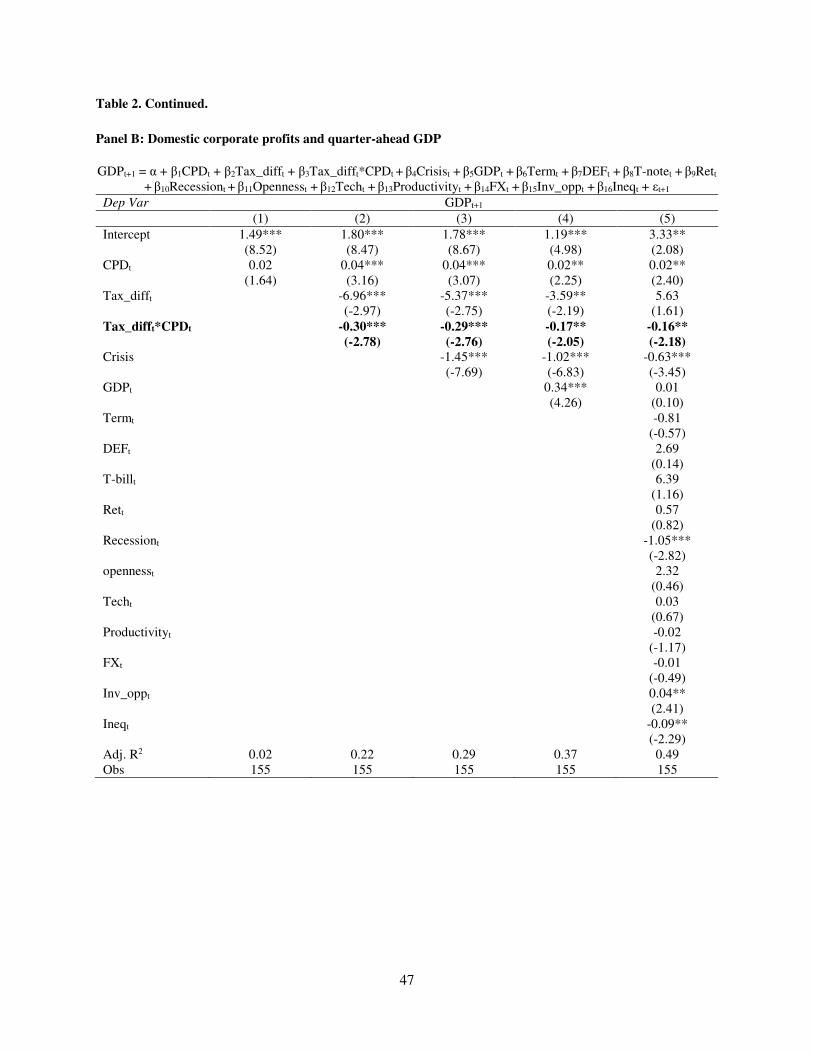
47
Table 2. Continued.
Panel B: Domestic corporate profits and quarter-ahead GDP
GDPt+1 = α + β1CPDt + β2Tax_difft + β3Tax_difft*CPDt + β4Crisist + β5GDPt + β6Termt + β7DEFt + β8T-notet + β9Rett
+ β10Recessiont + β11Opennesst + β12Techt + β13Productivityt + β14FXt + β15Inv_oppt + β16Ineqt + εt+1
Dep Var GDPt+1
(1) (2) (3) (4) (5)
Intercept 1.49*** 1.80*** 1.78*** 1.19*** 3.33** (8.52) (8.47) (8.67) (4.98) (2.08) CPDt 0.02 0.04*** 0.04*** 0.02** 0.02** (1.64) (3.16) (3.07) (2.25) (2.40) Tax_difft -6.96*** -5.37*** -3.59** 5.63 (-2.97) (-2.75) (-2.19) (1.61) Tax_difft*CPDt -0.30*** -0.29*** -0.17** -0.16**
(-2.78) (-2.76) (-2.05) (-2.18)
Crisis -1.45*** -1.02*** -0.63*** (-7.69) (-6.83) (-3.45) GDPt 0.34*** 0.01 (4.26) (0.10) Termt -0.81 (-0.57) DEFt 2.69 (0.14) T-billt 6.39 (1.16) Rett 0.57 (0.82) Recessiont -1.05*** (-2.82) opennesst 2.32 (0.46) Techt 0.03 (0.67) Productivityt -0.02 (-1.17) FXt -0.01 (-0.49) Inv_oppt 0.04** (2.41) Ineqt -0.09** (-2.29) Adj. R2 0.02 0.22 0.29 0.37 0.49 Obs 155 155 155 155 155
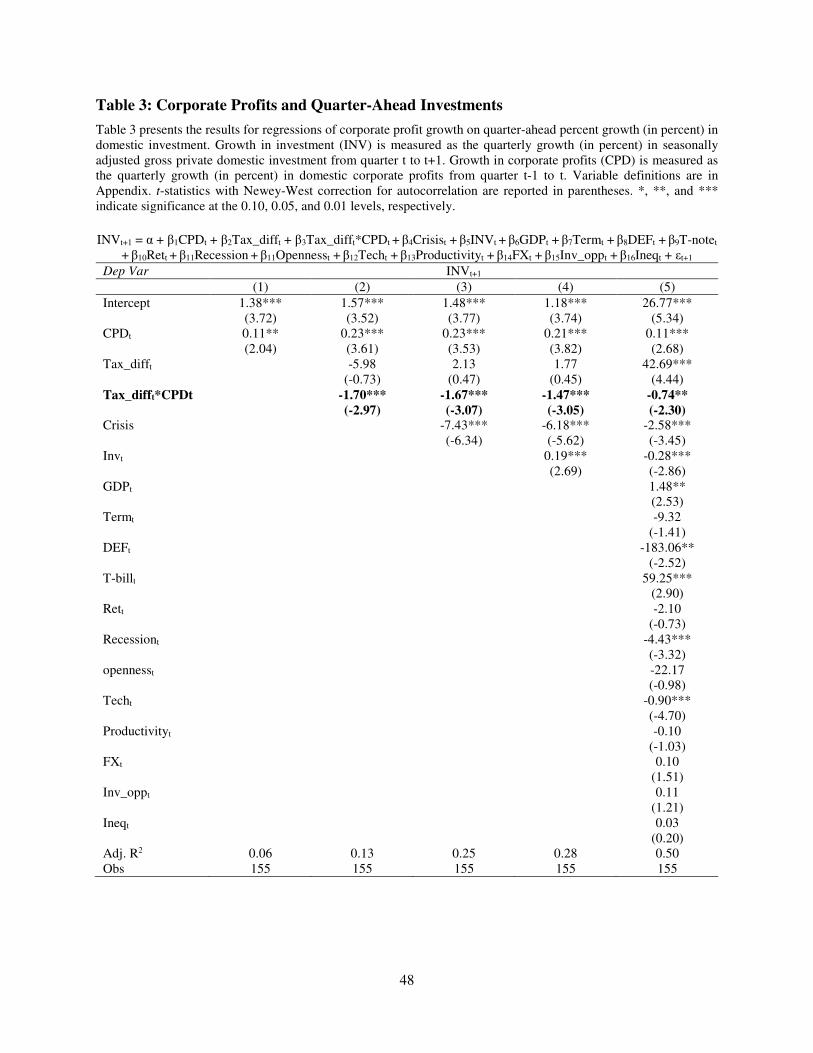
48
Table 3: Corporate Profits and Quarter-Ahead Investments
Table 3 presents the results for regressions of corporate profit growth on quarter-ahead percent growth (in percent) in domestic investment. Growth in investment (INV) is measured as the quarterly growth (in percent) in seasonally adjusted gross private domestic investment from quarter t to t+1. Growth in corporate profits (CPD) is measured as the quarterly growth (in percent) in domestic corporate profits from quarter t-1 to t. Variable definitions are in Appendix. t-statistics with Newey-West correction for autocorrelation are reported in parentheses. *, **, and *** indicate significance at the 0.10, 0.05, and 0.01 levels, respectively.
INVt+1 = α + β1CPDt + β2Tax_difft + β3Tax_difft*CPDt + β4Crisist + β5INVt + β6GDPt + β7Termt + β8DEFt + β9T-notet
+ β10Rett + β11Recession + β11Opennesst + β12Techt + β13Productivityt + β14FXt + β15Inv_oppt + β16Ineqt + εt+1
Dep Var INVt+1
(1) (2) (3) (4) (5)
Intercept 1.38*** 1.57*** 1.48*** 1.18*** 26.77*** (3.72) (3.52) (3.77) (3.74) (5.34) CPDt 0.11** 0.23*** 0.23*** 0.21*** 0.11*** (2.04) (3.61) (3.53) (3.82) (2.68) Tax_difft -5.98 2.13 1.77 42.69*** (-0.73) (0.47) (0.45) (4.44) Tax_difft*CPDt -1.70*** -1.67*** -1.47*** -0.74**
(-2.97) (-3.07) (-3.05) (-2.30) Crisis -7.43*** -6.18*** -2.58*** (-6.34) (-5.62) (-3.45) Invt 0.19*** -0.28*** (2.69) (-2.86) GDPt 1.48** (2.53) Termt -9.32 (-1.41) DEFt -183.06** (-2.52) T-billt 59.25*** (2.90) Rett -2.10 (-0.73) Recessiont -4.43*** (-3.32) opennesst -22.17 (-0.98) Techt -0.90*** (-4.70) Productivityt -0.10 (-1.03) FXt 0.10 (1.51) Inv_oppt 0.11 (1.21) Ineqt 0.03 (0.20) Adj. R2 0.06 0.13 0.25 0.28 0.50 Obs 155 155 155 155 155
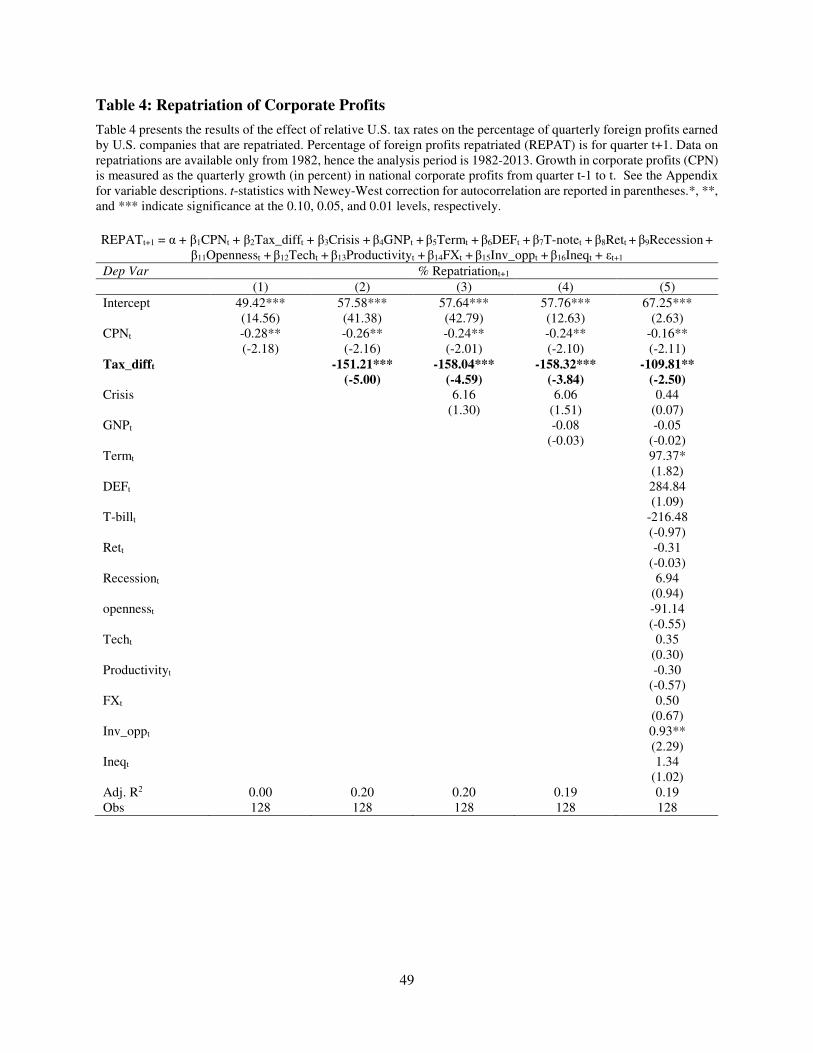
49
Table 4: Repatriation of Corporate Profits
Table 4 presents the results of the effect of relative U.S. tax rates on the percentage of quarterly foreign profits earned by U.S. companies that are repatriated. Percentage of foreign profits repatriated (REPAT) is for quarter t+1. Data on repatriations are available only from 1982, hence the analysis period is 1982-2013. Growth in corporate profits (CPN) is measured as the quarterly growth (in percent) in national corporate profits from quarter t-1 to t. See the Appendix for variable descriptions. t-statistics with Newey-West correction for autocorrelation are reported in parentheses.*, **, and *** indicate significance at the 0.10, 0.05, and 0.01 levels, respectively.
REPATt+1 = α + β1CPNt + β2Tax_difft + β3Crisis + β4GNPt + β5Termt + β6DEFt + β7T-notet + β8Rett + β9Recession +
β11Opennesst + β12Techt + β13Productivityt + β14FXt + β15Inv_oppt + β16Ineqt + εt+1
Dep Var % Repatriationt+1
(1) (2) (3) (4) (5)
Intercept 49.42*** 57.58*** 57.64*** 57.76*** 67.25*** (14.56) (41.38) (42.79) (12.63) (2.63) CPNt -0.28** -0.26** -0.24** -0.24** -0.16** (-2.18) (-2.16) (-2.01) (-2.10) (-2.11) Tax_difft -151.21*** -158.04*** -158.32*** -109.81**
(-5.00) (-4.59) (-3.84) (-2.50)
Crisis 6.16 6.06 0.44 (1.30) (1.51) (0.07) GNPt -0.08 -0.05 (-0.03) (-0.02) Termt 97.37* (1.82) DEFt 284.84 (1.09) T-billt -216.48 (-0.97) Rett -0.31 (-0.03) Recessiont 6.94 (0.94) opennesst -91.14 (-0.55) Techt 0.35 (0.30) Productivityt -0.30 (-0.57) FXt 0.50 (0.67) Inv_oppt 0.93** (2.29) Ineqt 1.34 (1.02) Adj. R2 0.00 0.20 0.20 0.19 0.19 Obs 128 128 128 128 128
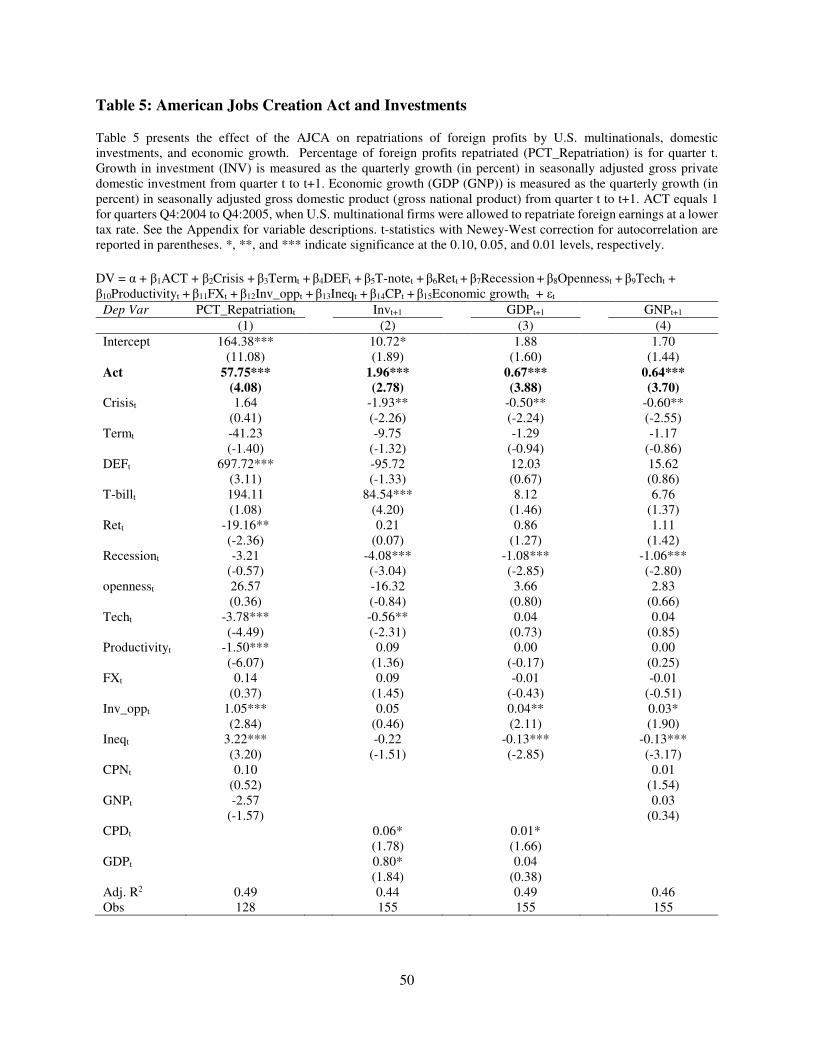
50
Table 5: American Jobs Creation Act and Investments
Table 5 presents the effect of the AJCA on repatriations of foreign profits by U.S. multinationals, domestic investments, and economic growth. Percentage of foreign profits repatriated (PCT_Repatriation) is for quarter t. Growth in investment (INV) is measured as the quarterly growth (in percent) in seasonally adjusted gross private domestic investment from quarter t to t+1. Economic growth (GDP (GNP)) is measured as the quarterly growth (in percent) in seasonally adjusted gross domestic product (gross national product) from quarter t to t+1. ACT equals 1 for quarters Q4:2004 to Q4:2005, when U.S. multinational firms were allowed to repatriate foreign earnings at a lower tax rate. See the Appendix for variable descriptions. t-statistics with Newey-West correction for autocorrelation are reported in parentheses. *, **, and *** indicate significance at the 0.10, 0.05, and 0.01 levels, respectively.
DV = α + β1ACT + β2Crisis + β3Termt + β4DEFt + β5T-notet + β6Rett + β7Recession + β8Opennesst + β9Techt +
β10Productivityt + β11FXt + β12Inv_oppt + β13Ineqt + β14CPt + β15Economic growtht + εt
Dep Var PCT_Repatriationt Invt+1 GDPt+1 GNPt+1
(1) (2) (3) (4)
Intercept 164.38*** 10.72* 1.88 1.70 (11.08) (1.89) (1.60) (1.44) Act 57.75*** 1.96*** 0.67*** 0.64***
(4.08) (2.78) (3.88) (3.70)
Crisist 1.64 -1.93** -0.50** -0.60** (0.41) (-2.26) (-2.24) (-2.55) Termt -41.23 -9.75 -1.29 -1.17 (-1.40) (-1.32) (-0.94) (-0.86) DEFt 697.72*** -95.72 12.03 15.62 (3.11) (-1.33) (0.67) (0.86) T-billt 194.11 84.54*** 8.12 6.76 (1.08) (4.20) (1.46) (1.37) Rett -19.16** 0.21 0.86 1.11 (-2.36) (0.07) (1.27) (1.42) Recessiont -3.21 -4.08*** -1.08*** -1.06*** (-0.57) (-3.04) (-2.85) (-2.80) opennesst 26.57 -16.32 3.66 2.83 (0.36) (-0.84) (0.80) (0.66) Techt -3.78*** -0.56** 0.04 0.04 (-4.49) (-2.31) (0.73) (0.85) Productivityt -1.50*** 0.09 0.00 0.00 (-6.07) (1.36) (-0.17) (0.25) FXt 0.14 0.09 -0.01 -0.01 (0.37) (1.45) (-0.43) (-0.51) Inv_oppt 1.05*** 0.05 0.04** 0.03* (2.84) (0.46) (2.11) (1.90) Ineqt 3.22*** -0.22 -0.13*** -0.13*** (3.20) (-1.51) (-2.85) (-3.17) CPNt 0.10 0.01 (0.52) (1.54) GNPt -2.57 0.03 (-1.57) (0.34) CPDt 0.06* 0.01* (1.78) (1.66) GDPt 0.80* 0.04 (1.84) (0.38) Adj. R2 0.49 0.44 0.49 0.46 Obs 128 155 155 155
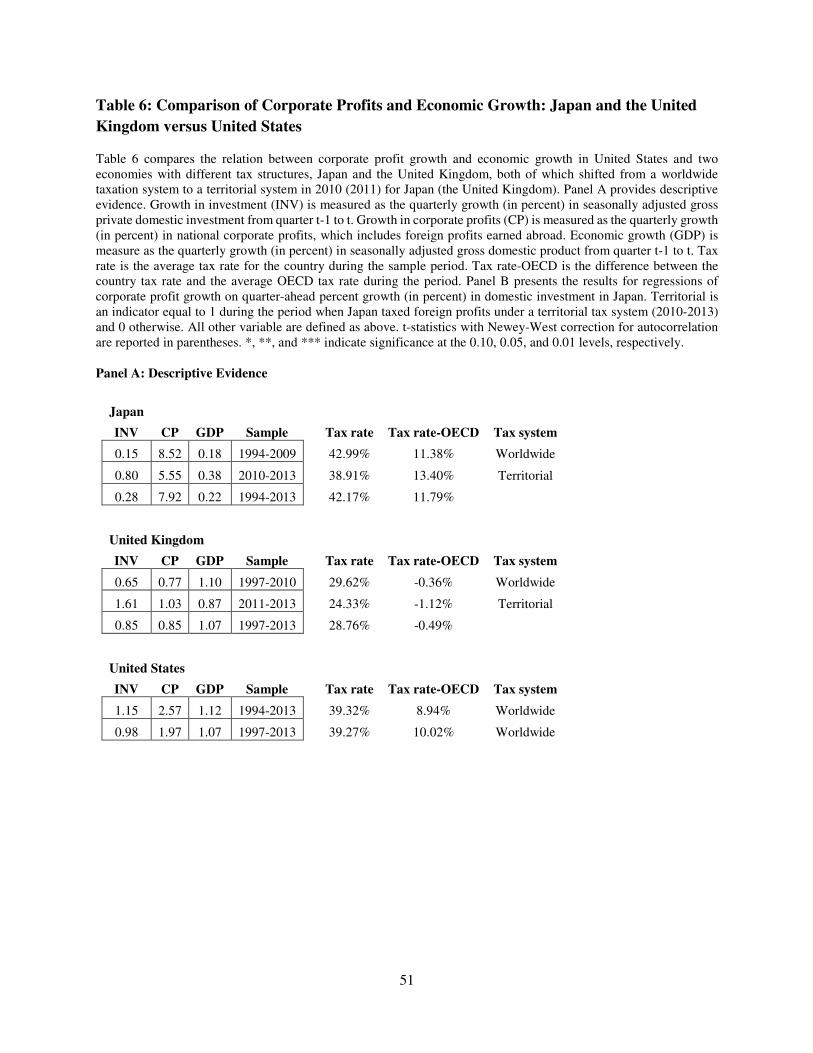
51
Table 6: Comparison of Corporate Profits and Economic Growth: Japan and the United
Kingdom versus United States
Table 6 compares the relation between corporate profit growth and economic growth in United States and two economies with different tax structures, Japan and the United Kingdom, both of which shifted from a worldwide taxation system to a territorial system in 2010 (2011) for Japan (the United Kingdom). Panel A provides descriptive evidence. Growth in investment (INV) is measured as the quarterly growth (in percent) in seasonally adjusted gross private domestic investment from quarter t-1 to t. Growth in corporate profits (CP) is measured as the quarterly growth (in percent) in national corporate profits, which includes foreign profits earned abroad. Economic growth (GDP) is measure as the quarterly growth (in percent) in seasonally adjusted gross domestic product from quarter t-1 to t. Tax rate is the average tax rate for the country during the sample period. Tax rate-OECD is the difference between the country tax rate and the average OECD tax rate during the period. Panel B presents the results for regressions of corporate profit growth on quarter-ahead percent growth (in percent) in domestic investment in Japan. Territorial is an indicator equal to 1 during the period when Japan taxed foreign profits under a territorial tax system (2010-2013) and 0 otherwise. All other variable are defined as above. t-statistics with Newey-West correction for autocorrelation are reported in parentheses. *, **, and *** indicate significance at the 0.10, 0.05, and 0.01 levels, respectively. Panel A: Descriptive Evidence
Japan
INV CP GDP Sample Tax rate Tax rate-OECD Tax system
0.15 8.52 0.18 1994-2009 42.99% 11.38% Worldwide
0.80 5.55 0.38 2010-2013 38.91% 13.40% Territorial
0.28 7.92 0.22 1994-2013 42.17% 11.79%
United Kingdom
INV CP GDP Sample Tax rate Tax rate-OECD Tax system
0.65 0.77 1.10 1997-2010 29.62% -0.36% Worldwide
1.61 1.03 0.87 2011-2013 24.33% -1.12% Territorial
0.85 0.85 1.07 1997-2013 28.76% -0.49%
United States
INV CP GDP Sample Tax rate Tax rate-OECD Tax system
1.15 2.57 1.12 1994-2013 39.32% 8.94% Worldwide
0.98 1.97 1.07 1997-2013 39.27% 10.02% Worldwide
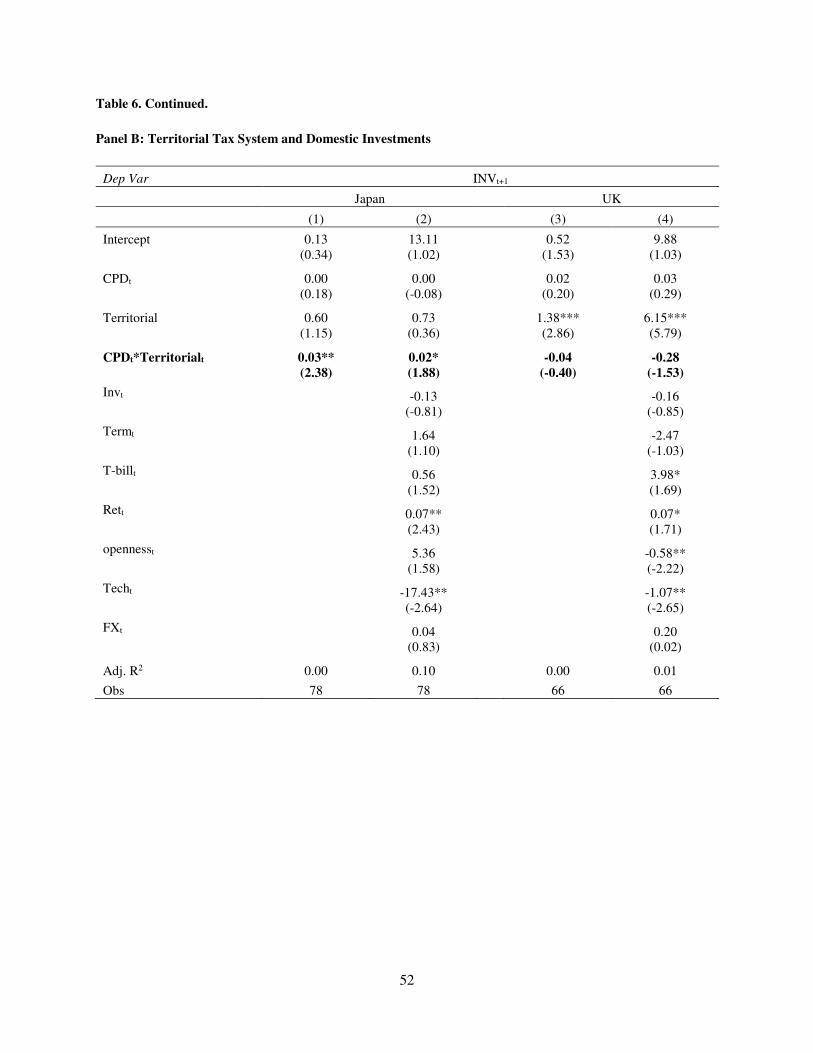
52
Table 6. Continued.
Panel B: Territorial Tax System and Domestic Investments
Dep Var INVt+1
Japan UK
(1) (2) (3) (4)
Intercept 0.13 13.11 0.52 9.88 (0.34) (1.02) (1.53) (1.03)
CPDt 0.00 0.00 0.02 0.03 (0.18) (-0.08) (0.20) (0.29)
Territorial 0.60 0.73 1.38*** 6.15*** (1.15) (0.36) (2.86) (5.79)
CPDt*Territorialt 0.03** 0.02* -0.04 -0.28
(2.38) (1.88) (-0.40) (-1.53)
Invt -0.13 -0.16 (-0.81) (-0.85)
Termt 1.64 -2.47 (1.10) (-1.03)
T-billt 0.56 3.98* (1.52) (1.69)
Rett 0.07** 0.07* (2.43) (1.71)
opennesst 5.36 -0.58** (1.58) (-2.22)
Techt -17.43** -1.07** (-2.64) (-2.65)
FXt 0.04 0.20 (0.83) (0.02)
Adj. R2 0.00 0.10 0.00 0.01
Obs 78 78 66 66
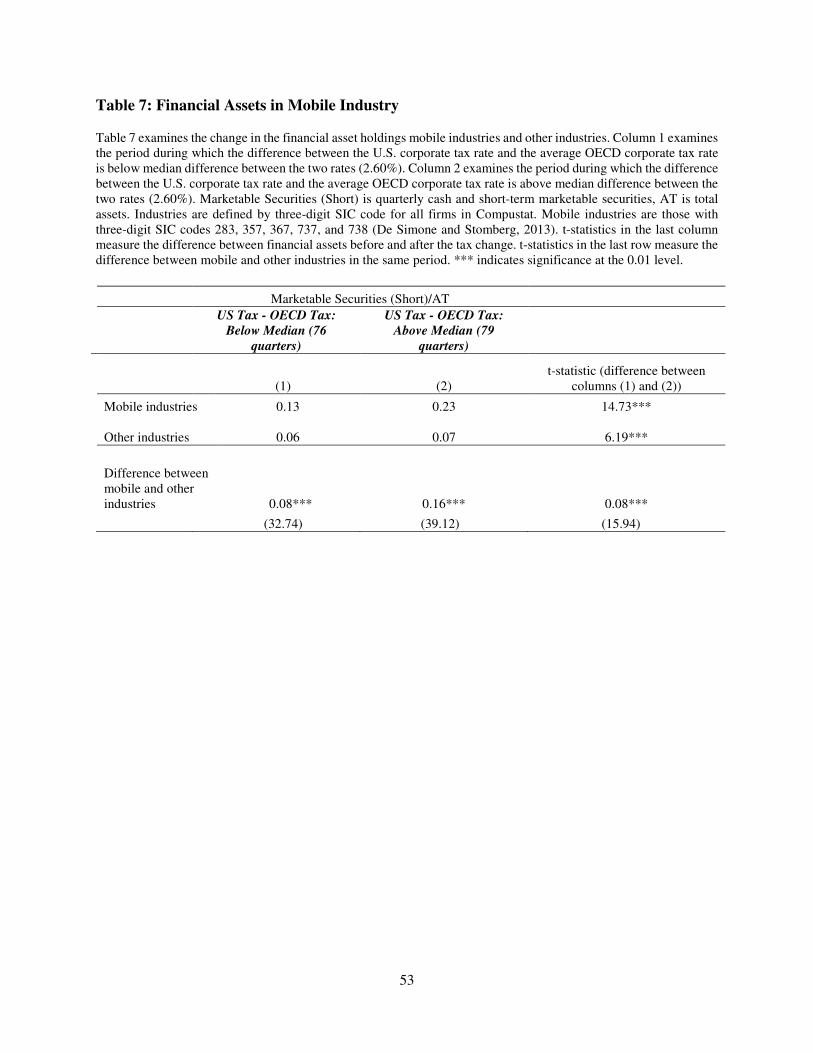
53
Table 7: Financial Assets in Mobile Industry
Table 7 examines the change in the financial asset holdings mobile industries and other industries. Column 1 examines the period during which the difference between the U.S. corporate tax rate and the average OECD corporate tax rate is below median difference between the two rates (2.60%). Column 2 examines the period during which the difference between the U.S. corporate tax rate and the average OECD corporate tax rate is above median difference between the two rates (2.60%). Marketable Securities (Short) is quarterly cash and short-term marketable securities, AT is total assets. Industries are defined by three-digit SIC code for all firms in Compustat. Mobile industries are those with three-digit SIC codes 283, 357, 367, 737, and 738 (De Simone and Stomberg, 2013). t-statistics in the last column measure the difference between financial assets before and after the tax change. t-statistics in the last row measure the difference between mobile and other industries in the same period. *** indicates significance at the 0.01 level.
Marketable Securities (Short)/AT
US Tax - OECD Tax:
Below Median (76
quarters)
US Tax - OECD Tax:
Above Median (79
quarters)
(1) (2) t-statistic (difference between
columns (1) and (2))
Mobile industries 0.13 0.23 14.73*** Other industries 0.06 0.07 6.19***
Difference between mobile and other industries 0.08*** 0.16***
0.08***
(32.74) (39.12) (15.94)
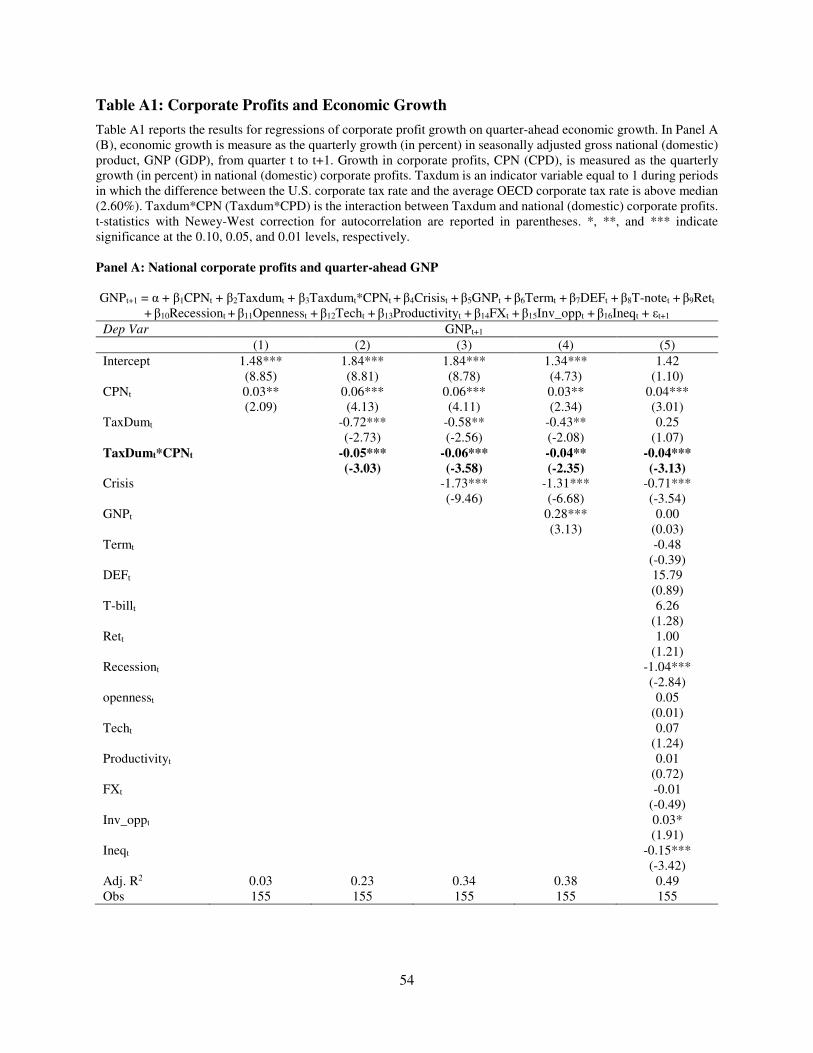
54
Table A1: Corporate Profits and Economic Growth
Table A1 reports the results for regressions of corporate profit growth on quarter-ahead economic growth. In Panel A (B), economic growth is measure as the quarterly growth (in percent) in seasonally adjusted gross national (domestic) product, GNP (GDP), from quarter t to t+1. Growth in corporate profits, CPN (CPD), is measured as the quarterly growth (in percent) in national (domestic) corporate profits. Taxdum is an indicator variable equal to 1 during periods in which the difference between the U.S. corporate tax rate and the average OECD corporate tax rate is above median (2.60%). Taxdum*CPN (Taxdum*CPD) is the interaction between Taxdum and national (domestic) corporate profits. t-statistics with Newey-West correction for autocorrelation are reported in parentheses. *, **, and *** indicate significance at the 0.10, 0.05, and 0.01 levels, respectively. Panel A: National corporate profits and quarter-ahead GNP
GNPt+1 = α + β1CPNt + β2Taxdumt + β3Taxdumt*CPNt + β4Crisist + β5GNPt + β6Termt + β7DEFt + β8T-notet + β9Rett
+ β10Recessiont + β11Opennesst + β12Techt + β13Productivityt + β14FXt + β15Inv_oppt + β16Ineqt + εt+1
Dep Var GNPt+1
(1) (2) (3) (4) (5)
Intercept 1.48*** 1.84*** 1.84*** 1.34*** 1.42 (8.85) (8.81) (8.78) (4.73) (1.10) CPNt 0.03** 0.06*** 0.06*** 0.03** 0.04*** (2.09) (4.13) (4.11) (2.34) (3.01) TaxDumt -0.72*** -0.58** -0.43** 0.25 (-2.73) (-2.56) (-2.08) (1.07) TaxDumt*CPNt -0.05*** -0.06*** -0.04** -0.04***
(-3.03) (-3.58) (-2.35) (-3.13) Crisis -1.73*** -1.31*** -0.71*** (-9.46) (-6.68) (-3.54) GNPt 0.28*** 0.00 (3.13) (0.03) Termt -0.48 (-0.39) DEFt 15.79 (0.89) T-billt 6.26 (1.28) Rett 1.00 (1.21) Recessiont -1.04*** (-2.84) opennesst 0.05 (0.01) Techt 0.07 (1.24) Productivityt 0.01 (0.72) FXt -0.01 (-0.49) Inv_oppt 0.03* (1.91) Ineqt -0.15*** (-3.42) Adj. R2 0.03 0.23 0.34 0.38 0.49 Obs 155 155 155 155 155
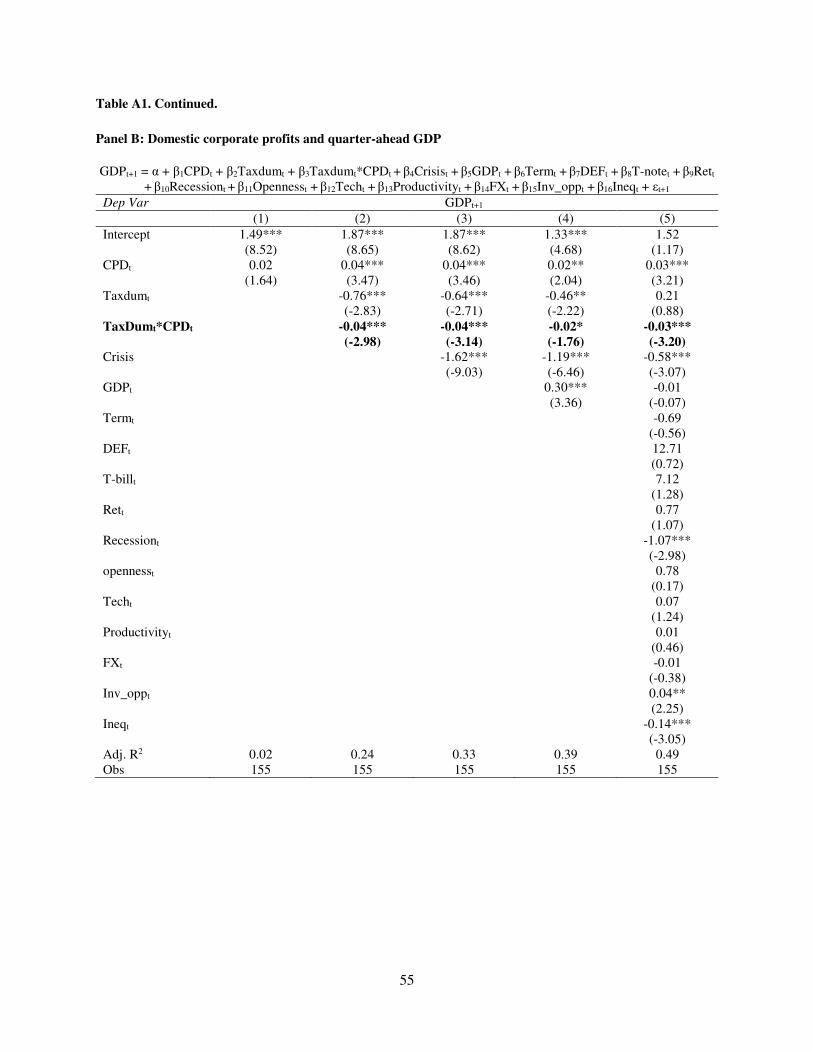
55
Table A1. Continued.
Panel B: Domestic corporate profits and quarter-ahead GDP
GDPt+1 = α + β1CPDt + β2Taxdumt + β3Taxdumt*CPDt + β4Crisist + β5GDPt + β6Termt + β7DEFt + β8T-notet + β9Rett
+ β10Recessiont + β11Opennesst + β12Techt + β13Productivityt + β14FXt + β15Inv_oppt + β16Ineqt + εt+1
Dep Var GDPt+1
(1) (2) (3) (4) (5)
Intercept 1.49*** 1.87*** 1.87*** 1.33*** 1.52 (8.52) (8.65) (8.62) (4.68) (1.17) CPDt 0.02 0.04*** 0.04*** 0.02** 0.03*** (1.64) (3.47) (3.46) (2.04) (3.21) Taxdumt -0.76*** -0.64*** -0.46** 0.21 (-2.83) (-2.71) (-2.22) (0.88) TaxDumt*CPDt -0.04*** -0.04*** -0.02* -0.03***
(-2.98) (-3.14) (-1.76) (-3.20)
Crisis -1.62*** -1.19*** -0.58*** (-9.03) (-6.46) (-3.07) GDPt 0.30*** -0.01 (3.36) (-0.07) Termt -0.69 (-0.56) DEFt 12.71 (0.72) T-billt 7.12 (1.28) Rett 0.77 (1.07) Recessiont -1.07*** (-2.98) opennesst 0.78 (0.17) Techt 0.07 (1.24) Productivityt 0.01 (0.46) FXt -0.01 (-0.38) Inv_oppt 0.04** (2.25) Ineqt -0.14*** (-3.05) Adj. R2 0.02 0.24 0.33 0.39 0.49 Obs 155 155 155 155 155
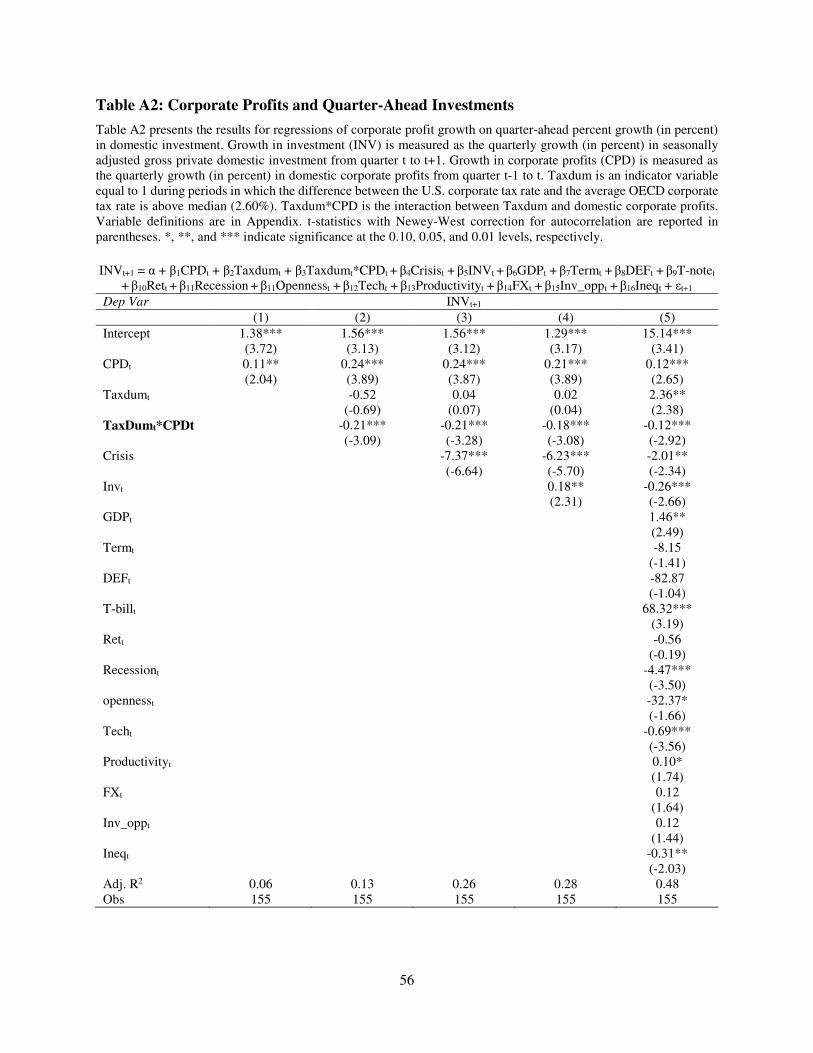
56
Table A2: Corporate Profits and Quarter-Ahead Investments
Table A2 presents the results for regressions of corporate profit growth on quarter-ahead percent growth (in percent) in domestic investment. Growth in investment (INV) is measured as the quarterly growth (in percent) in seasonally adjusted gross private domestic investment from quarter t to t+1. Growth in corporate profits (CPD) is measured as the quarterly growth (in percent) in domestic corporate profits from quarter t-1 to t. Taxdum is an indicator variable equal to 1 during periods in which the difference between the U.S. corporate tax rate and the average OECD corporate tax rate is above median (2.60%). Taxdum*CPD is the interaction between Taxdum and domestic corporate profits. Variable definitions are in Appendix. t-statistics with Newey-West correction for autocorrelation are reported in parentheses. *, **, and *** indicate significance at the 0.10, 0.05, and 0.01 levels, respectively.
INVt+1 = α + β1CPDt + β2Taxdumt + β3Taxdumt*CPDt + β4Crisist + β5INVt + β6GDPt + β7Termt + β8DEFt + β9T-notet
+ β10Rett + β11Recession + β11Opennesst + β12Techt + β13Productivityt + β14FXt + β15Inv_oppt + β16Ineqt + εt+1
Dep Var INVt+1
(1) (2) (3) (4) (5)
Intercept 1.38*** 1.56*** 1.56*** 1.29*** 15.14*** (3.72) (3.13) (3.12) (3.17) (3.41) CPDt 0.11** 0.24*** 0.24*** 0.21*** 0.12*** (2.04) (3.89) (3.87) (3.89) (2.65) Taxdumt -0.52 0.04 0.02 2.36** (-0.69) (0.07) (0.04) (2.38) TaxDumt*CPDt -0.21*** -0.21*** -0.18*** -0.12*** (-3.09) (-3.28) (-3.08) (-2.92) Crisis -7.37*** -6.23*** -2.01** (-6.64) (-5.70) (-2.34) Invt 0.18** -0.26*** (2.31) (-2.66) GDPt 1.46** (2.49) Termt -8.15 (-1.41) DEFt -82.87 (-1.04) T-billt 68.32*** (3.19) Rett -0.56 (-0.19) Recessiont -4.47*** (-3.50) opennesst -32.37* (-1.66) Techt -0.69*** (-3.56) Productivityt 0.10* (1.74) FXt 0.12 (1.64) Inv_oppt 0.12 (1.44) Ineqt -0.31** (-2.03) Adj. R2 0.06 0.13 0.26 0.28 0.48 Obs 155 155 155 155 155