on the development of a pm2.5 monitoring network for real
TRANSCRIPT
http://www.revistadechimie.ro REV.CHIM.(Bucharest)♦ 68♦ No. 4 ♦ 2017796
On the Development of a PM2.5 Monitoring Network for Real-timeMeasurements in Urban Environments
TOM SAVU1*, BOGDAN ALEXANDRU JUGRAVU1, DANIEL DUNEA2*1Politehnica University of Bucharest, 313 Spl. Independentei, 060042, Bucharest, Romania2Valahia University of Targoviste, 13 Sinaia Alley, 130004, Targoviste, Romania
A monitoring network system was designed and developed to be deployed in two Romanian cities duringthe ROkidAIR project for measuring in real time the PM2.5 concentrations. The system comprises 8 stationsthat were built following the successful design and testing of a PM2.5 optical instrument prototype. TheSystem’s Web services, the data acquisition from the monitoring stations, and the data sending to a GIS-integrated geoportal that includes a decision support system, were firstly evaluated for testing theireffectiveness and for eventually defining necessary corrections. After describing the station’s structure andthe Web services’ main functions, the paper presents data about the most important measured operatingparameters of the stations, results from data processing, and conclusions for further developments. Preliminaryinformation collected from a reference gravimetric sampler installed for data inter-comparison with thedeveloped stations is also presented.
Keywords: PM2.5 measurement, monitoring network, Web services, operating parameters, predictivemaintenance, Rokidair Project
*email: [email protected], Phone: +40724892180; [email protected]
The ROkidAIR project aims to improve the urban airquality monitoring and the forecasting activities focusingon the spatial delimitation of critical areas based on thereceptors’ vulnerability and their detailed characterizationin terms of PM2.5 effects on children’s health in twoRomanian cities: Targoviste and Ploiesti. These urbanagglomerations served as pilot areas during the ROkidAIRproject for developing the monitoring network that isplanned to be deployed up to the end of the project (April2017). The system provides synthesized informationconcerning the PM2.5 concentrations and their evolutionobtained from reliable monitoring stations and artificialintelligence (AI) forecasting algorithms [1]. More focusedpublic health interventions at the neighborhood level areenvisaged worldwide to reduce and better control the air-pollution related diseases [2]. The monitoring programsand associated modelling tools must provide outputs thatcan be used to detect temporal trends and spatial variabilityof air pollutants and should establish more or less empiricallinks between human activities and the associatedenvironmental effects [3]. The current minimum numberof sampling points for fixed measurements of PM2.5concentrations (1 point for 0-249,000 residents)recommended by the current monitoring standard is notsufficient because the PM2.5 concentrations have anincreased spatiotemporal variability at city level.Consequently, the number of fixed sampling points in acity should be increased and the continuous monitoringshould be performed using reliable monitors atneighborhood scale [4]. The developed network respondspositively to these requirements with the scope of residents’health protection.
The main components of the ROkidAIR system are alocal monitoring and analysis system for each pilot city,Ploiesti and Targoviste, the web-based GIS module, theROkidAIR Decision Support System (DSS), the ROkidAIRdatabases, the Web services running on a data server anda real time monitoring and service of the ROkidAIR PM2.5stations [1].
After the ROkidAIR stations were built and deployed onsite, the network’s Web services were tested for evaluatingtheir effectiveness and acquired data was used forestimating the functionality of some stations’ subsystemsand for defining future corrections and developments.
Structure of ROkidAIR stationEach ROkidAIR station is equipped with an optical PM2.5
transducer, which is measuring in the 1 ... 10.000 µg/m3
interval with a 2 µg/m3 precision. The airflow through thePM2.5 transducer is driven by a rotary vane pump, capableof a maximum flow of 6.2 L/min. The flow is controlledusing an airflow sensor which is measuring in the 0 ... 5SLPM interval, with a ±3.0% linearity error and ±0.5%repeatability and hysteresis. Before entering the airflowsensor, the sample air is passed through a Perma Pure gasdryer. Every five minutes, the PM2.5 transducer is calibratedusing an airflow that is passing through a zero-dust Sartoriusmembrane having a 0.2 µm equivalent diameter threshold.
Inside and outside temperature and humidity values aremeasured using digital sensors working in the -40 ... 125 °Cand 0 ... 100% rH (relative humidity) intervals, with ±0.2 °Cand ±1.8% rH measuring accuracy. The barometricpressure is measured using a sensor, working in the 0 ... 15psi absolute pressure interval, with a maximum of 2.0%FSS total error band.
The station’s controller is performing the PM2.5measurements and transducer calibration, at programmedtime intervals, also measuring the airflow and controllingthe pump’s driver duty cycle for acquiring a programmedairflow of 2.0 L/min (fig. 1). A calibration is performed noearlier than every five minutes, while a PM2.5measurement is performed no earlier than every minute.The controller is also performing the pressure, temperatureand humidity measurements and is controlling the station’sheating, venting and drying subsystems. The controllertakes date and time information from the GSM network or,when the GSM network is not available, from the station’sreal-time clock, which is periodically updated.

REV.CHIM.(Bucharest)♦ 68♦ No. 4 ♦ 2017 http://www.revistadechimie.ro 797
Fig. 1. ROkidAIR PM2.5 monitoringstation’s controller main functions
Fig. 2. RKA_WS WebService’s diagram
programmed in LabVIEWTM
Fig. 3. Data Web Service’sdiagram programmed in
LabVIEWTM
Measurement data and information about station’s stateare sent through a GPRS connection to the network’s Webserver. If the GPRS connection or the Web server are notavailable, data is stored locally for a later transmission.
ROkidAIR Web servicesThe ROkidAIR network’s Web server is hosting a group
of Web services, developed in the LabVIEW graphicalprogramming language (National Instruments, Austin, TX,USA), for receiving the station’s data and for answering tousers’ queries.
The RKA_WS Web Service (fig. 2) is receiving thestations’ data and is storing it in data files, resulting one filefor each day. If the operation is successful, the sendingstation is receiving a RKAOK message from the WebService. In extremely rare cases, if the date and time data
received from the station is malformed or if the server’sfile system is corrupted, the station is receiving a FileERRmessage.
The Data Web Service (fig. 3) is responsible for receivingthe users’ requests for data. The user request has thefollowing format:
http://IP:port/WSname/Data?Data=SSYYMMDDHHmmwhere:
- IP is the ROkidAIR Web server’s IP;- port is the port on which the Web server is listening for
data and queries;- WSname is the Web server’s name;- SS is the station’s index;- YY, MM, DD, HH and mm are the year, month, day,
hour and minute as specified by the station’s real-timeclock.

http://www.revistadechimie.ro REV.CHIM.(Bucharest)♦ 68♦ No. 4 ♦ 2017798
Table 1THE TEMPORARY LOCATIONS OF ROkidAIR STATIONS FOR FUNCTIONING/RELIABILITY TESTS
Table 2 USE RATES OF THE ROkidAIR STATIONS
Fig. 4. Time interval between two successive data sets, for station 4
Fig. 5. Detailed time interval between two successive data sets for station 4
Table 3 MEAN TIME INTERVALS
The users’ requests for data are logged into daily files,which include the information about the remote host fromwhere the request was made.
If the user’s request can be fulfilled, the Data Webservice is returning an answer having the next format:
Answer = HH,mm,ss,CC,TT,HH,ppwhere:
- HH, mm and ss are the hour, minute and second valuesof the registered record;
- CC is the measured PM2.5 value, in µg/m3;- TT, HH and pp are the measured external
temperature, relative humidity and barometric absolutepressure, in °C, % rH and mmHg.
If the request’s date information is malformed or if thereis no datafile for the specified date value, then the DataWeb service is returning a Nofile message. If the datafileexists but there is no data for the specified station’s index,hour and minute data, then the Web service is returning aNodata message.
Some other Web services are available on the ROkidAIRWeb server for answering the requests about stations’internal parameters (internal temperature and humidity;actual flow through the airflow sensor; pump’s drive duty
cycle for obtaining the specified flow; heating, venting anddrying subsystems states) or for daily sending all theregistered data through email. Because the station’s real-time clock may encounter some data loss on long timeintervals, a separate application is checking for thecontinuity of the time information in each daily datafile.
Measured operating parameters of ROkidAIR stationsFour of the eight ROkidAIR stations (table 1) were
deployed for complex functioning tests and inter-comparisons starting with November 2016 in the cities ofBucharest and Targoviste.
Data send by the stations were recorded duringNovember 23rd and December 15th, 2016. Dividing thenumber of datasets sent by a station during a time intervalby the length of that time interval, in minutes, the followinguse rates from table 2 were obtained for three of thestations.
The variation of the time interval between twosuccessive data sets, for station 4, is shown in figure 4,with details in figure 5. These results are mainly because astation is performing a calibration after each group of fourmeasurements.

REV.CHIM.(Bucharest)♦ 68♦ No. 4 ♦ 2017 http://www.revistadechimie.ro 799
Fig. 6. Data received fromstation 4 on December 8th, 2016– PM2.5 (µg m-3), temperature
(°C), rH (%)
Fig. 7. Internal parameters ofStation 4 on December 8th, 2016
Fig. 8. Heating speedvariation for station 4
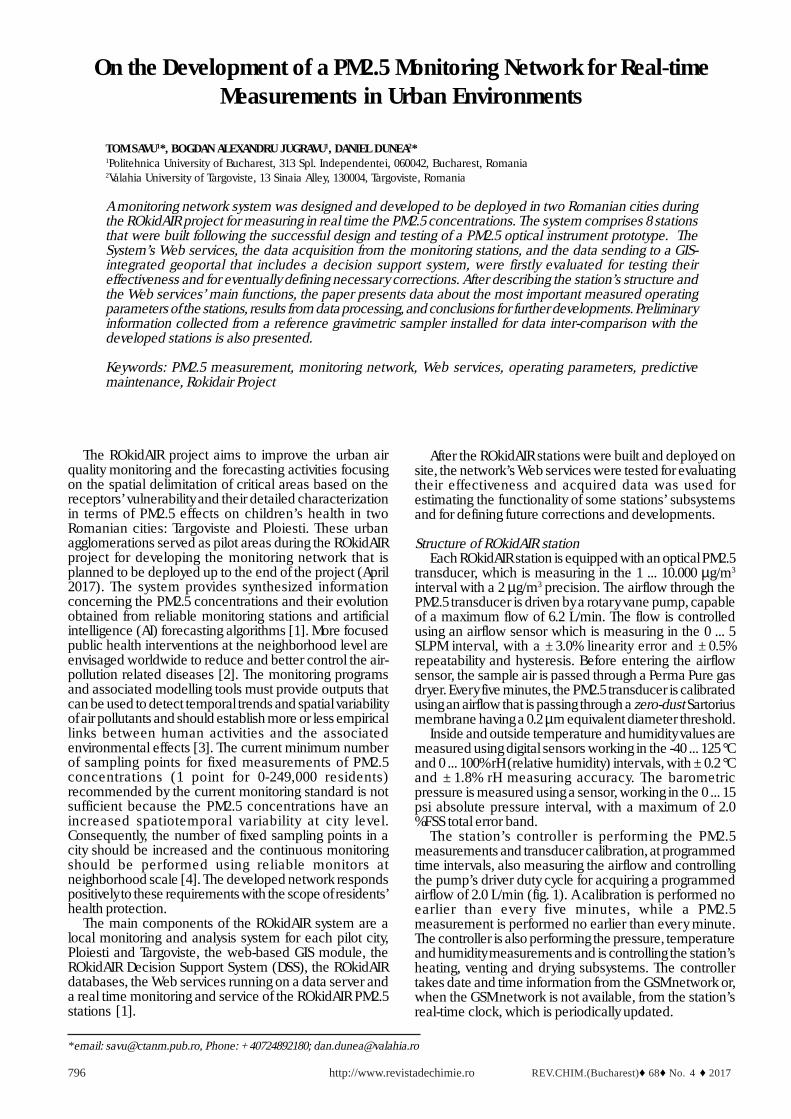
Table 4 AVERAGE AND MAXIMUM COOLING SPEEDS
Table 3 presents the mean values by averaging only forthe time intervals smaller than 180 s.
An example of collected data from PM2.5 stations isshown in figure 6.
The stations’ software was configured to maintain theinternal temperature between 10 and 15oC. Thus, theinternal heating subsystem starts when the internaltemperature is less than 12°C and stops when it succeededto rise the internal temperature to 15oC.
Looking at a station’s internal parameters’ values (fig.7), it can be seen that the heating subsystem, runningcontinuously, succeeded to keep the internal temperatureabove 10oC when the external temperature went downfrom 1oC at midnight to -1oC at 8:00 a.m. When the externaltemperature started to rise during the day up to 5oC, theheating subsystem worked intermittently and the internaltemperature oscillated between 12 and 15oC.
By computing the heating speed [°C/min] as the internaltemperature difference between two moments when theheating subsystem is working (fig.8), it can be easilyobserved that the station’s internal temperature is stronglydependent on the external temperature. One preliminaryconclusion could be that the heating speed is almost zerowhen the external temperature is decreasing and startsgrowing when the external temperature is increasing. Inaddition, it can be estimated that the heating speedremains significant only when the heating subsystem
works intermittently, and this is happening as long as theexternal temperature is above 4°C.
The average heating speed values were 0.07oC/min forstation 2, 0.24oC/min for station 3 and 0.13oC/min for station4. The low value obtained for station 2 is confirming thefact that it was placed in more severe thermal conditions(the average external temperature for station 2 in Targovistewas -1.27°C, while for stations 3 and 4 in Bucharest was0.88°C and 1.22oC respectively).
The stations’ heating subsystems are using heatingelements made in a thick film technology, on stainlesssteel substrates, with a rated power of around 40 W. Thereare two types of heat sinks, which were used for thestations’ heating subsystems. Station 3 is using a CitizenKU-KK5007 heat sink, made from AlMg3 alloy, 50 x 50 x27 mm, 5 mm base thickness, while stations 2 and 4 areusing Fischer ICKS heat sinks, made from aluminum, 50 ´50 x 25 mm, 3.5 mm base thickness. Even if initially it wasbelieved that the larger Fischer heat sinks will be moreeffective because it looks that they were staying cooler sothe heat it was faster dissipated in the station’s enclosure,station 3’s smaller heat sink recorded a heating speedaverage almost double than the one recorded at station 4.In addition, the maximum value of the heating speed wasslightly bigger for station 3, i.e., 2.2oC/min compared with1.6oC/min for station 2 (due to a colder environment) and2.0oC/min for station 4.
http://www.revistadechimie.ro REV.CHIM.(Bucharest)♦ 68♦ No. 4 ♦ 2017800
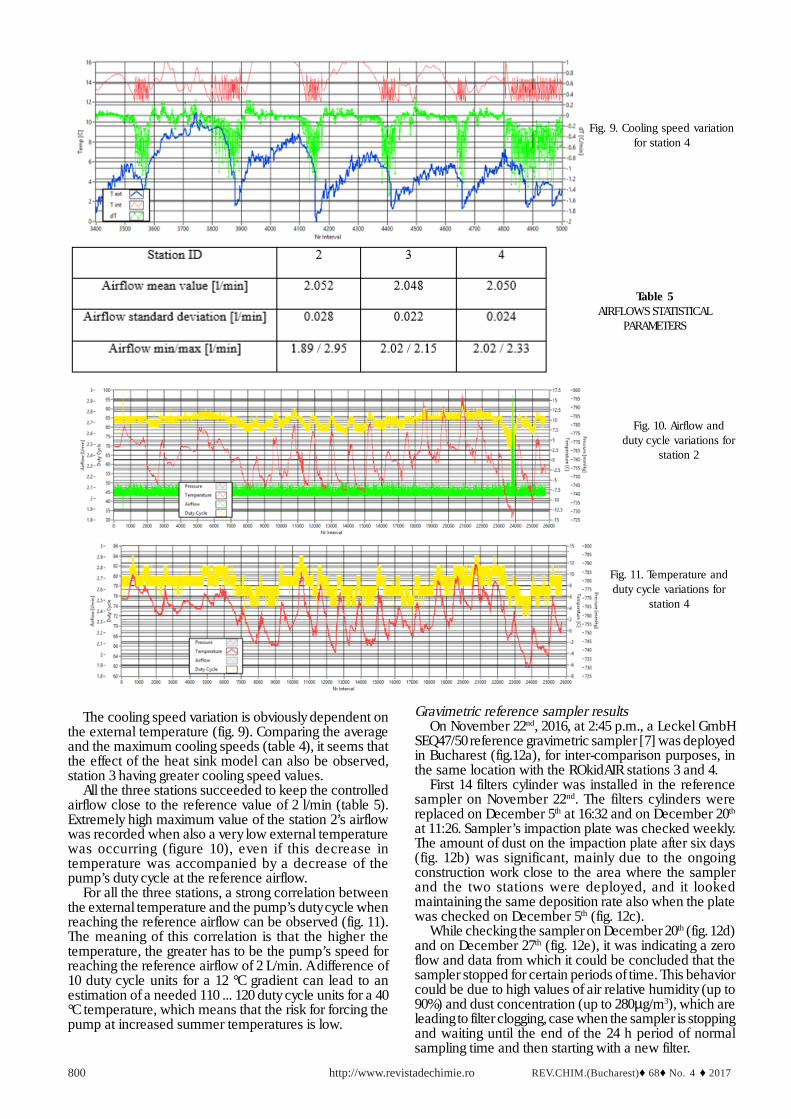
Fig. 10. Airflow andduty cycle variations for
station 2
Fig. 9. Cooling speed variationfor station 4
Table 5AIRFLOWS STATISTICAL
PARAMETERS
Fig. 11. Temperature andduty cycle variations for
station 4
The cooling speed variation is obviously dependent onthe external temperature (fig. 9). Comparing the averageand the maximum cooling speeds (table 4), it seems thatthe effect of the heat sink model can also be observed,station 3 having greater cooling speed values.
All the three stations succeeded to keep the controlledairflow close to the reference value of 2 l/min (table 5).Extremely high maximum value of the station 2’s airflowwas recorded when also a very low external temperaturewas occurring (figure 10), even if this decrease intemperature was accompanied by a decrease of thepump’s duty cycle at the reference airflow.
For all the three stations, a strong correlation betweenthe external temperature and the pump’s duty cycle whenreaching the reference airflow can be observed (fig. 11).The meaning of this correlation is that the higher thetemperature, the greater has to be the pump’s speed forreaching the reference airflow of 2 L/min. A difference of10 duty cycle units for a 12 °C gradient can lead to anestimation of a needed 110 ... 120 duty cycle units for a 40°C temperature, which means that the risk for forcing thepump at increased summer temperatures is low.
Gravimetric reference sampler resultsOn November 22nd, 2016, at 2:45 p.m., a Leckel GmbH
SEQ47/50 reference gravimetric sampler [7] was deployedin Bucharest (fig.12a), for inter-comparison purposes, inthe same location with the ROkidAIR stations 3 and 4.
First 14 filters cylinder was installed in the referencesampler on November 22nd. The filters cylinders werereplaced on December 5th at 16:32 and on December 20th
at 11:26. Sampler’s impaction plate was checked weekly.The amount of dust on the impaction plate after six days(fig. 12b) was significant, mainly due to the ongoingconstruction work close to the area where the samplerand the two stations were deployed, and it lookedmaintaining the same deposition rate also when the platewas checked on December 5th (fig. 12c).
While checking the sampler on December 20th (fig. 12d)and on December 27th (fig. 12e), it was indicating a zeroflow and data from which it could be concluded that thesampler stopped for certain periods of time. This behaviorcould be due to high values of air relative humidity (up to90%) and dust concentration (up to 280µg/m3), which areleading to filter clogging, case when the sampler is stoppingand waiting until the end of the 24 h period of normalsampling time and then starting with a new filter.

REV.CHIM.(Bucharest)♦ 68♦ No. 4 ♦ 2017 http://www.revistadechimie.ro 801
Fig. 12. Dust gathered on the impaction plate of the Leckel GmbHSEQ47/50 reference gravimetric sampler (a); after six days, on
November 28th (b); after 13 days, on December 5th (older traces areblack and distorted) (c); impaction plate on December 20th (older
traces are darker) (d); impaction plate on December 27th (e)
ConclusionsA first initial conclusion was that the 23 days interval,
during which data were received from the stations, waslong enough for drawing a first set of conclusions.
A closer approach into the stations’ software willhopefully allow a reduction in the mean time intervalbetween two successive data sets, reducing it to a desiredvalue of 60 s. Tests will have to be performed on the rotaryvane pumps to determine if a four minutes’ continuous runbetween two calibrations will be possible without heatingthe pumps, thus allowing the mean time interval to dependonly on the speed of the data reading from the PM2.5 sensor.
Improvements on the stations’ software will be appliedfor a better local data management and for allowing toremotely changing some stations functional parameters.Additional Web services will be developed and installedon the Web server, allowing, for example, requests forreceiving complete daily data sets. The number of runningstations is expected to increase, together with the timeinterval for which data is going to be available, so the datavolume that will be processed will require automated
predictive maintenance procedures to be considered.Parameters like the mean time interval, heating speed,airflow standard deviation or extreme values and duty cyclevariation will be used for estimating the stations’ behaviour.
A dynamically setting of the internal temperature intervalaccording to the external temperature will be considered,thus obtaining an easier workload for the heating systemduring extremely cold weather conditions. Improving thestation thermal isolation and increasing the power of theheating subsystem will be also evaluated. Extreme airflowvalues, like those presented in figure 10, will be furtherinvestigated. An automated station’s emergency shutdown, with a prior message sent to the server, will beimplemented.
Acknowledgements: The research leading to these results hasreceived funding from EEA Financial Mechanism 2009-2014 under theproject ROKIDAIR Towards a better protection of children against airpollution threats in the urban areas of Romania contract no. 20SEE/30.06.2014 (http://rokidair.ro/en). The authors would like to thankalso to Senior Engineer Franck René DAUGE, from the NorwegianInstitute for Air Research - NILU, for his support in setting up andmaintaining the reference sampler.
References1. DUNEA, D., IORDACHE, S., POHOATA, A., LUNGU, E., OPREA, M.,SAVU, T., A Relational Database Structure for Linking Air PollutionLevels with Children’s Respiratory Illnesses, Bulletin of the Universityof Agricultural Sciences & Veterinary Medicine series Agriculture,71(2), 2014, p. 205 - 213.2. DUNEA, D., IORDACHE, S., LIU, H.-Y., BOHLER, T., POHOATA, A.,RADULESCU, C., Quantifying the impact of PM2.5 and associated heavymetals on respirator y health of children near metallurgicalfacilities, Environ. Sci. Pollut. Res., 23, 2016, p. 15395–15406.3. DUNEA, D., POHOATA, A., IORDACHE, S., Using wavelet -feedforward neural networks to improve air pollution forecasting inurban environments, Environmental Monitoring and Assessment, 187:477, 2015.4. DUNEA, D., IORDACHE, S., Time series analysis of air pollutantsrecorded from Romanian EMEP stations at mountain sites,Environmental Engineering and Management Journal, 14 (11), 2015,p. 2725-2735.5. OPREA, M., IANACHE, C., MIHALACHE, S.F., DRAGOMIR, E.G.,DUNEA, D., IORDACHE, S., SAVU, T., On the development of anintelligent system for particulate matter air pollution monitoring,analysis and forecasting in urban regions, Proceedings of the 19thInternational Conference on System Theory, Control and Computing(ICSTCC), October 2015, Cheile Gradistei, Romania, p. 711-716.6. SVEN LECKEL INGENIEURBURO GMBH, Sequential Sampler SEQ47/50 Instructional Manual, Berlin, Germany, 2011.
Manuscript received: 10.01.2017