on the benefits of planning and grouping software maintenance requests
DESCRIPTION
On the Benefits of Planning and Grouping Software Maintenance Requests. Gladston Aparecido Junio (PUC Minas , Brazil ) Marcelo Malta (PUC Minas , Brazil ) Humberto Mossri (PUC Minas , Brazil ) Humberto Marques-Neto (PUC Minas , Brazil ) Marco Tulio Valente (UFMG , Brazil ). - PowerPoint PPT PresentationTRANSCRIPT

On the Benefits of Planning and Grouping Software Maintenance Requests
CSMR – Oldenburg, Germany, March 2011
Gladston Aparecido Junio (PUC Minas, Brazil)
Marcelo Malta (PUC Minas, Brazil) Humberto Mossri (PUC Minas, Brazil)
Humberto Marques-Neto (PUC Minas, Brazil)Marco Tulio Valente (UFMG, Brazil)

Motivation
Policies for scheduling maintenance requests: Continuous: requests implemented as quick as possible Periodic: requests packaged in larger projects
In theory, the benefits of periodic policies are widely known Several statistical models have been proposed Example: Banker et. al (+30% of cost reduction)
Do such gains happen in real organizations? Theoretical models have not been validated by field
studies
2

In this Talk
Define a simple process – called PASM – for handling maintenance requests as projects PASM: Process for Grouping Maintenance Requests
Propose a methodology to evaluate maintenance policies
Evaluate the gains achieved by the PASM process in a real software development organization
3

PASM
Three phases: Registration Grouping Processing
4

1st Phase: Registration
5
Pre-defined time frame for registration
Typical requests are buffered
Users can specify that a request is urgent If ratified by the process manager:
Request goes directly to implementation No waiting-costs

2nd Phase: Grouping
6
No rigid guidelines for grouping Two forces: size and cohesion Size:
Compatible with the production capacity Should not imply in waiting costs that users will
not tolerate Cohesion:
Requests of a project should be functionally coherent

3rd Phase: Processing
7
PASM does not fix a development method

Characterization Methodoly

Characterization Methodology
How to evaluate the gains achieved by PASM in a real setting?
Adapted a methodology proposed to understand the behavior of web users
Central idea: Software Maintenance Request Model Graph Nodes: states of each request Edges: transition between such states
9

Software Maintenance Request Model Graph
10

Metrics
QueueTime = WaitTime + ServiceTime
Service Time =
PlanningTime + AnalysisTime +
ImplementationTime + ValidationTime +
DeploymentTime
11
Methodology
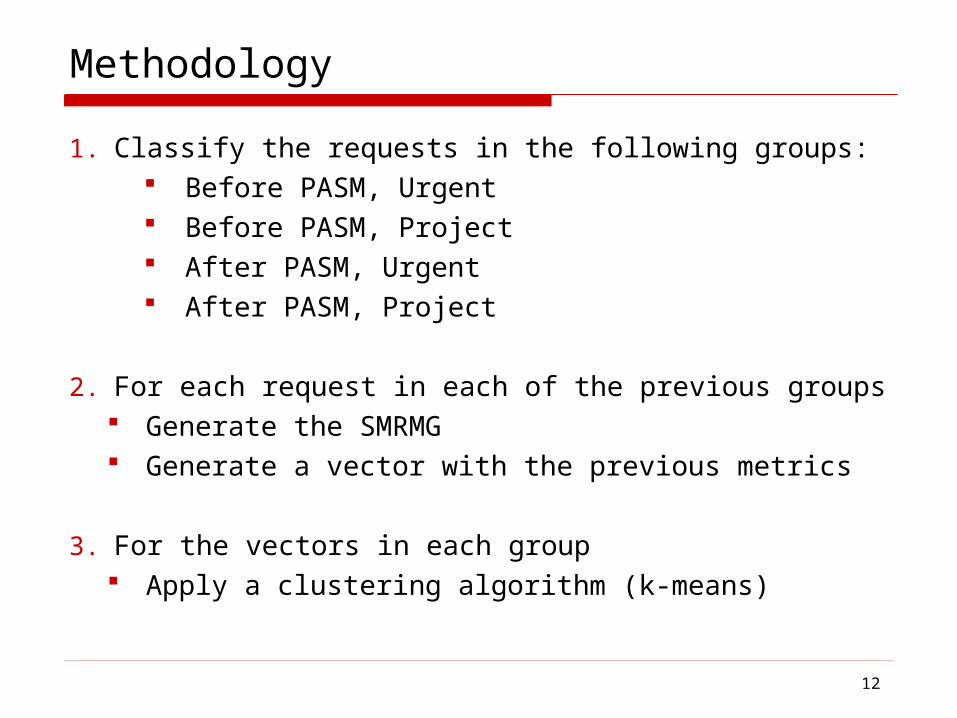
1. Classify the requests in the following groups: Before PASM, Urgent Before PASM, Project After PASM, Urgent After PASM, Project
2. For each request in each of the previous groups Generate the SMRMG Generate a vector with the previous metrics
3. For the vectors in each group Apply a clustering algorithm (k-means)
12

Goal with Clustering
1. Discover the characteristics of the typical projects Before PASM After PASM
2. Evaluate the positive and negative effects of the PASM adoption on such projects
3. Discover the characteristics of typical urgent requests Before PASM After PASM
4. Evaluate the positive and negative effects of the PASM adoption on such requests
13
Evaluation
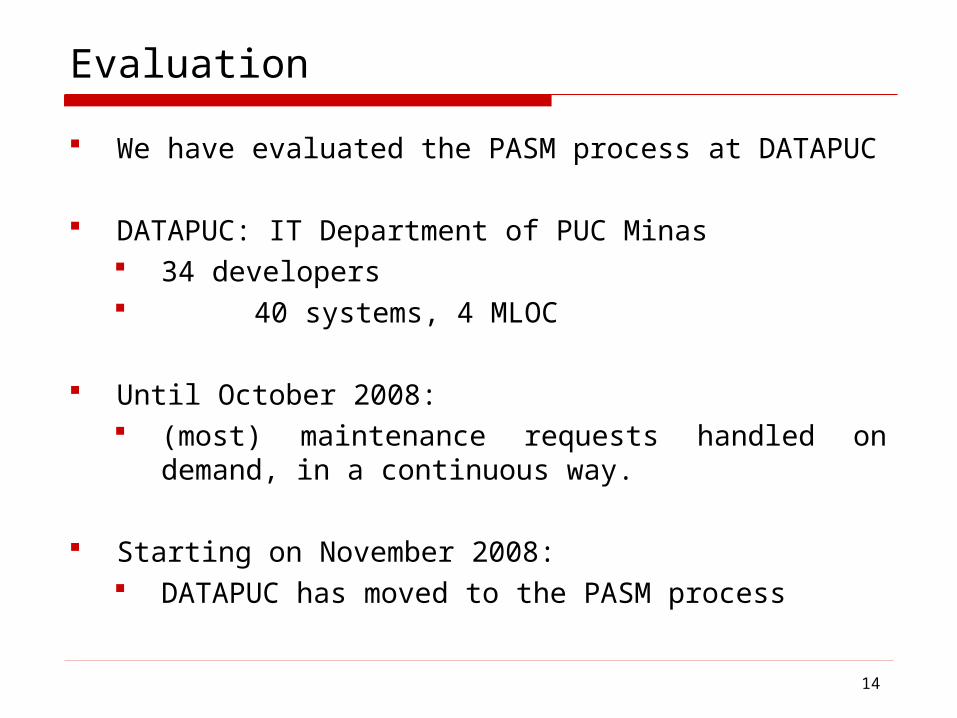
We have evaluated the PASM process at DATAPUC
DATAPUC: IT Department of PUC Minas 34 developers 40 systems, 4 MLOC
Until October 2008: (most) maintenance requests handled on demand, in a
continuous way.
Starting on November 2008: DATAPUC has moved to the PASM process
14

PASM @ DATAPUC
Registering Phase: first 10 days of each month
Grouping: next 20 days Requests are evaluated and grouped in projects
Cycle is repeated in the next month
15
Data Source
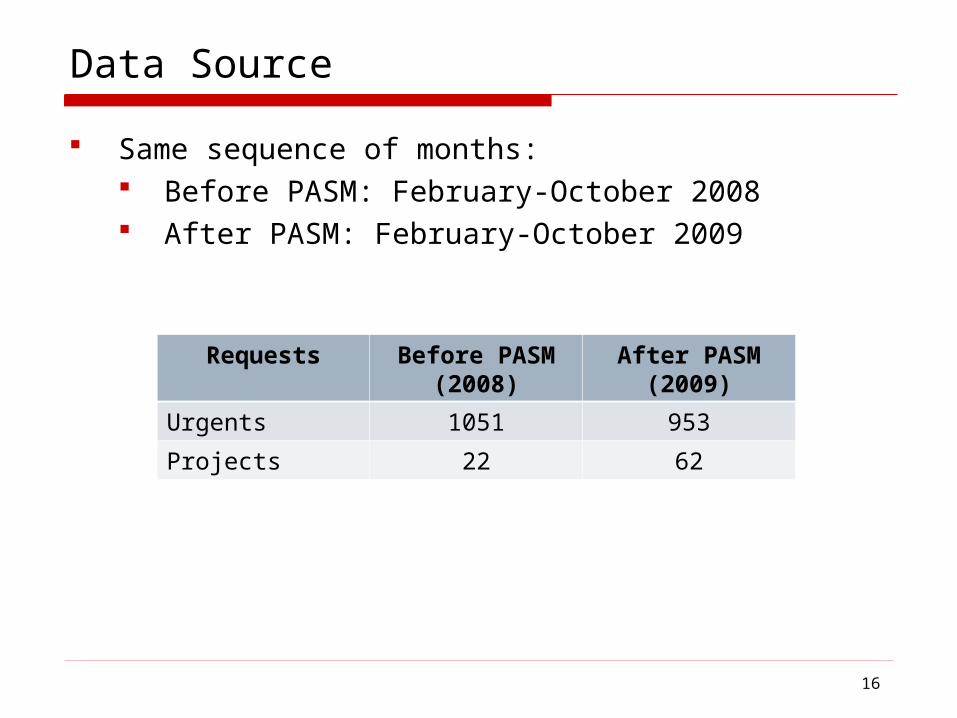
Same sequence of months: Before PASM: February-October 2008 After PASM: February-October 2009
16
Requests Before PASM (2008)
After PASM (2009)
Urgents 1051 953
Projects 22 62

Results: Maintenance Projects
Maintenance Projects: Clusters
18
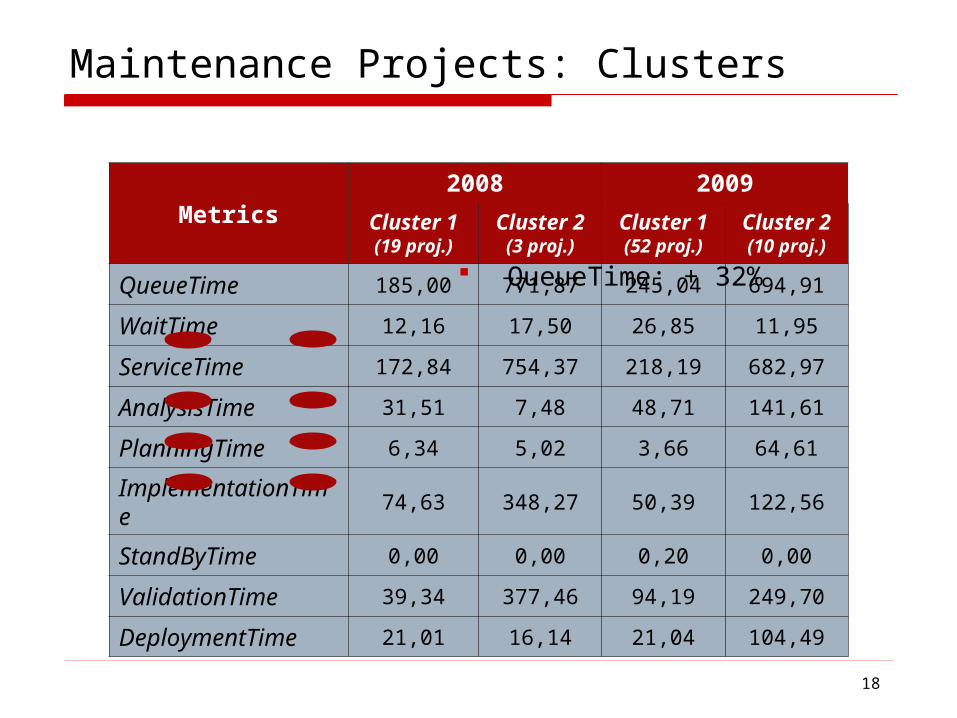
Metrics2008 2009
Cluster 1(19 proj.)
Cluster 2(3 proj.)
Cluster 1(52 proj.)
Cluster 2(10 proj.)
QueueTime 185,00 771,87 245,04 694,91
WaitTime 12,16 17,50 26,85 11,95
ServiceTime 172,84 754,37 218,19 682,97
AnalysisTime 31,51 7,48 48,71 141,61
PlanningTime 6,34 5,02 3,66 64,61
ImplementationTime 74,63 348,27 50,39 122,56
StandByTime 0,00 0,00 0,20 0,00
ValidationTime 39,34 377,46 94,19 249,70
DeploymentTime 21,01 16,14 21,04 104,49
QueueTime: + 32%

Maintenance Projects: SMRMG + Probabilities
19

Maintenance Projects: Summary
More projects: Before PASM: 22 projects After PASM: 62 projects
Dominant development task: Before PASM: implementation (43%) After PASM: validation (43%)
20

Results: Urgent Requests

Urgent Requests: SMRMG
22

Typical Urgent Requests
23
Metrics Cluster 2 - 2008(651 req)
Cluster 5 - 2009(383 req)
QueueTime 16,79 12,82
WaitTime 2,80 3,22
ServiceTime 13,98 9,60
AnalysisTime 4,46 2,45
ImplementationTime 7,02 3,94
StandByTime 2,50 3,21
ValidationTime 0,00 0,00
DeploymentTime 0,00 0,00

Complex, Error-Prone, Urgent Request
24
MetricsCluster 5 -
2008(222 req.)
Cluster 2 - 2009
(212 req.)
QueueTime 25,82 26,51
WaitTime 3,56 3,05
ServiceTime 22,26 23,46
AnalysisTime 8,33 3,23
ImplementationTime 2,28 4,27
StandByTime 1,02 2,07
ValidationTime 10,63 13,89
DeploymentTime 0,00 0,00

Urgent Requests: Summary
QueueTime, after PASM: Typical requests: - 4 hours Complex requests: + 1 hour (more time to validation)
25

Conclusions
Contributions
1. PASM: Process for grouping maintenance requests Lightweighted process Three phases: registration, grouping, processing
2. Methodology to evaluate maintenance policies, based on: Software Maintenance Request Model Graph Clustering techniques Classical queue model metrics
3. Field study to evaluate the benefits achieved by PASM
27

Benefits
More requests handled as projects Side-effects:
More time dedicated to analysis and validation Less time dedicated to implementation
Urgent maintenance requests: Handled in less time
28

Further Work
Promote and evaluate the PASM’s adoption by other organizations
Assess the internal and external quality of the software released under PASM guidelines
29
