on-road transportation report - university of san...
TRANSCRIPT

San Diego County Greenhouse Gas Inventory
An Analysis of Regional Emissions and Strategies to Achieve AB 32 Targets
On-Road Transportation Report
Sean Tanaka
Tanaka Research and Consulting
September 2008

On-Road Transportation Report Acknowledgements
This project could not have happened without the generous support of the San Diego Foundation, San Diego Association of Governments, and NRG Energy, Inc.
The authors would like to thank the following individuals (listed alphabetically by organization) for their help in providing data, reviewing drafts and providing insightful comments, and for their advice and counsel during the project: Kevin Eslinger, Nesamani Kalandiyur, Jeff Long, Ben Montoya, Webster Tasat and Walter Wong of the California Air Resources Board (CARB); Brian Holland of San Diego Association of Governments (SANDAG); and, Rob Anderson, David Barker, and Gregory Katsapis of San Diego Gas and Electric (SDG&E). We would also like to thank Mary Bean for the graphic design of the report and Merry Maisel of Sherwood Associates for editing the report.
For an electronic copy of this report and the full documentation of the San Diego Greenhouse Gas Inventory project, go to www.sandiego.edu/epic/ghginventory.

San Diego County GHG Inventory
Table of Contents 1. Introduction.......................................................................................................................................2. . 1.1.. Key.Findings.............................................................................................................................2 2. Emissions from the On-Road Transportation Sector........................................................................3. . 2.1.. Emissions.Reduction.Targets......................................................................................................5. 3. Emissions Reduction Strategies – Wedges........................................................................................6. . 3.1.. AB.1493.(Pavley.1.and.2)..........................................................................................................7. . 3.2.. Federal.Corporate.Average.Fuel.Economy.(CAFE).Standards.....................................................7. . 3.3.. Low.Carbon.Fuel.Standard.(LCFS)............................................................................................7. . 3.4.. 10%.Reduction.in.Vehicle.Miles.Traveled.(VMT).......................................................................8. . 3.5... Climate.Change.Scoping.Plan:.Reduction.(Measures.9.and.11)..................................................8 4. On-Road Transportation Methodology ......................................................................................... 8. . 4.1.. Computation,.Process,.and.Data................................................................................................8. . 4.2.. Historical.Emissions.and.Forecasts............................................................................................9. . 4.3.. Wedge.Configuration.and.Scenario.Development......................................................................9 End Notes ...................................................................................................................................... 13
Table of Figures. Figure 1. San.Diego.County.GHG.Emissions.by.Category.(2006)..........................................................3 Figure 2. GHG.Emissions.from.On-Road.Transportation,.San.Diego.County.........................................3 Figure 3. GHG.Emissions.from.On-Road.Vehicles,.San.Diego.County.(2006).......................................4 Figure 4. GHG.Emissions.from.Passenger.Cars.and.Light-duty.Trucks,.San.Diego.County....................4 Figure 5. GHG.Emissions.from.On-Road.Transportation.by.Vehicle.Type,.San.Diego.County................4 Figure 6. Fuel.Consumption.by.On-Road.Transportation.Vehicles,.San.Diego.County...........................5 Figure 7. Vehicle.Miles.Traveled.by.On-Road.Vehicles,.San.Diego.County.............................................5 Figure 8. Hypothetical.GHG.Emissions.Reduction.Targets.for.On-Road.Vehicles,.. . . . San.Diego.County..................................................................................................................6 Figure 9. On-Road.Transportation.GHG.Emissions.Reduction.Strategies,.. . . . San.Diego.County..................................................................................................................6 Figure 10. San.Diego.County.On-Road.Transportation:.Wedge.Scenario.1.. . . . (CAFE,.Pavley,.LCFS,.10%.VMT.Reduction,.and.Scoping.Plan)............................................11 Figure 11. San.Diego.County.On-Road.Transportation:.Wedge.Scenario.2.. . . . (CAFE,.LCFS,.10%.VMT.Reduction.and.Scoping.Plan)........................................................12 Figure 12. San.Diego.County.On-Road.Transportation:.Wedge.Scenario.3.. . . . (CAFE,.10%.VMT.Reduction.and.Scoping.Plan)..................................................................12
List of Tables. Table 1. San.Diego.County.On-Road.Transportation:.Vehicle.Class.Examples.........................................3 Table 2. GHG.Emissions.Reduction.Strategies.for.On-Road.Transportation,.. . . San.Diego.County......................................................................................................................6 Table 3. San.Diego.County.On-Road.Transportation:.Scenarios.of.Potential.Reduction.. . . Strategy.Order.and.Net.Emissions...........................................................................................10 Table 4. Summary.of.Wedge.Scenario.Descriptions.and.GHG.Reductions,.. . . San.Diego.County.On-Road.Transportation.............................................................................11

2 San Diego County GHG Inventory
1. Introduction
On-road.transportation.is.a.significant.source.of.greenhouse.gas.(GHG).emissions..In.San.Diego.County,.emissions.from.on-road.vehicles.account.for.about.46%.of.regional.GHG.emissions..This.report,.a.component.of.the.San.Diego.County.Greenhouse.Gas.Inventory.project,.provides.an.estimate.of.historical.GHG.emissions.associated.with.on-road.transportation.from.1990.to.2006.and.future.emissions.to.2020.for.San.Diego.County..Using.emissions.reduction.targets.codified.in.California’s.Global.Warming.Solutions.Act.of.2006.(AB.32).as.a.guide,.this.report.also.establishes.emissions.reductions.targets.for.the.region’s.on-road.transportation.sector..Although.AB.32.does.not.require.individual.sectors.or.jurisdictions.(e.g.,.cities.and.counties).to.reduce.emissions.by.a.specific.amount,.the.project.team.calculated.the.theoretical.emissions.reductions.necessary.in.each.emissions.category.(e.g.,.transportation,.electricity,.etc.).in.order.for.San.Diego.County.to.reduce.emissions.to.1990.levels.by.2020.–.the.statewide.statutory.target.under.AB.32..Finally,.the.report.identifies.and.quantifies.potential.emissions.reduction.strategies.to.determine.the.feasibility.of.reducing.on-road.transportation.related.emissions.to.1990.levels.by.2020.
To.the.extent.possible,.the.project.team.followed.the.same.calculation.methodology.used.by.the.California.Air.Resources.Board.(CARB).to.develop.the.statewide.GHG.inventory..In.some.instances,.when.doing.so.could.yield.a.more.accurate.or.precise.result,.the.project.modified.the.CARB.method..
This.report,.which.is.intended.as.an.overview.of.the.findings.from.research.and.analysis.conducted.for.the.on-road.transportation.sector,.includes.the.following.sections:.
Section.2.provides.an.overview.of.GHG.emissions.from.on-road.transportation.in.San.Diego.County,.including.total.emissions,.a.breakdown.of.emissions.by.vehicle.type.(passenger.car,.light-duty.truck,.heavy-duty.vehicles.etc.),.a.summary.of.the.highest.emitting.vehicle.types.and.their.respective.characteristics.and.activities.and.projections.to.2020..
Section.3.discusses.emissions.reduction.targets.as.well.as.strategies.to.reduce.on-road.transportation.GHG.emissions.to.1990.levels.by.2020.
Section.4.provides.a.detailed.discussion.of.the.method.used.to.estimate.emissions.for.this.category..
1.1. Key Findings
On-road.transportation.is.the.largest.greenhouse-gas-emitting.category,.with.16.MMT.CO2E.in.2006,.a.
10%.increase.over.1990.
Emissions.from.on-road.vehicles.are.expected.to.increase.to.19.MMT.CO2E.by.2020,.a.20%.increase.
over.2006.levels.and.a.33%.increase.over.1990.levels.
Passenger.vehicles.(cars.and.light-duty.trucks).emit.more.greenhouse.gases.than.the.other.vehicle.classes.in.the.on-road.transportation.category..In.2006,.passenger.vehicles.emitted.14.MMT.CO
2E,.89%.of.all.
greenhouse.gas.(GHG).emissions.from.the.on-road.transportation.sector..Light-duty.trucks.include.light-.and.medium-duty.trucks.and.sport.utility.vehicles.(SUVs),.and.these.have.become.the.greatest.emitters..They.accounted.for.24%.of.San.Diego.County’s.total.GHG.emissions.in.2006.
A.combination.of.emissions.reduction.measures,.including.vehicle.efficiency,.clean.fuels,.and.reductions.in.vehicle.miles.traveled,.can.reduce.GHG.emissions.from.the.on-road.transportation.sector.to.1990.levels.by.2020.
•
•
•
•
•
•
•

3On-Road Transportation Report
2. Emissions from the On-Road Transportation Category
The.on-road.transportation.category.is.the.single.largest.contributor.of.GHG.emissions.in.San.Diego.County..In.2006,.emissions.from.this.category.were.16.million.metric.tons.of.carbon.dioxide.equivalent.(MMT.CO
2E),.
which.comprised.approximately.46%.of.all.GHG.emissions.produced.in.San.Diego.County.(Figure.1)..This.category.will.likely.continue.to.be.the.most.dominant.emitter.through.2020,.when.its.emissions.are.expected.to.reach.19.MMT.CO
2E.
On-road.transportation.emissions.are.primarily.the.result.of.fuel.combustion.from.motorized.vehicles.that.travel.San.Diego.County.freeways,.highways,.streets,.and.roads..Carbon.dioxide.(CO
2),.methane.(CH4),.and.
nitrous.oxide.(N2O).are.the.main.greenhouse.
gases.that.transportation.vehicles.emit..This.section.analyzes.the.emissions.of.these.three.gases;.emissions.due.to.refrigerant.losses.are.accounted.for.in.the.industrial.section.
The.vehicle.classes.included.in.this.analysis.are.passenger.cars;.light-,.medium-,.and.heavy-duty.trucks;.buses;.motor.homes;.and.motorcycles..Table.1.lists.examples.of.these.types.of.vehicles..Medium-duty.trucks.have.been.included.in.the.light-duty.trucks.category.because.their.function.is.similar,.primarily.individual/.personal.transport.
Under.a.business-as-usual.scenario.(based.on.the.San.Diego.Association.of.Governments.(SANDAG).Regional.Transportation.Plan),.annual.emissions.from.this.category.are.expected.to.increase.to.19.MMT.CO
2E.by.2020,.a.20%.increase.over.
2006.levels..This.scenario.assumes.that.transportation.growth.and.fuel.consumption.continue.at.the.present.rate.with.no.major.policy.or.behavioral.changes.1.Figure.2.shows.the.total.emissions.from.all.on-road.vehicles.from.1990.to.2005.and.the.forecast.to.2020..

4 San Diego County GHG Inventory
Greenhouse.gas.emissions.vary.significantly.among.vehicle.types..Figure.3.illustrates.that.passenger.cars.and.light-duty.trucks.are.currently.the.largest.contributors.of.greenhouse.gases..Together.these.two.vehicle.categories.account.for.approximately.89%.of.emissions.from.the.on-road.transportation.sector.and.41%.of.all.GHG.emissions.in.the.county.
The.amount.of.GHG.emitted.by.each.vehicle.type.has.varied.over.time..Between.1990.and.2001,.passenger.cars.emitted.the.most;.however,.since.2002,.light-duty.trucks.have.surpassed.passenger.vehicles.as.the.largest.class.of.emitters..Figure.4.shows.this.trend...Light-duty.trucks.are.expected.to.continue.to.be.the.largest.emitting.vehicle.class,.representing.nearly.50%.of.on-road.emissions.and.nearly.22%.of.the.county’s.2020.total.emissions.(Figure.5)..Passenger.cars.are.projected.to.represent.about.38%.of.on-road.emissions.by.that.same.time.
The.two.main.drivers.of.emissions.in.the.on-road.transportation.category.are.total.fuel.consumption.and.vehicle.miles.traveled..Figure.6.shows.fuel.consumption.by.vehicle.type..It.demonstrates.that.passenger.cars.and.light.duty.trucks.consistently.consume.over.85%.of.the.fuel.used.by.on-road.vehicles..Combined.fuel.consumption.from.these.two.vehicle.classes.is.expected.to.increase.21%,.from.1.5.billion.gallons.in.2006.to.more.than.1.8.billion.by.2020..Motorcycles.consume.the.least.amount.of.fuel,.from.6.8.million.gallons.per.year.in.2006.to.a.forecast.10.million.in.2020..
On.the.basis.of.business-as-usual.projections,.light-duty.trucks.will.continue.to.be.the.largest.fuel.consumers.through.2020..However,.continued.dramatic.increases.in.fuel.price.may.shift.a.large.portion.of.light-duty.truck.

5On-Road Transportation Report
use.toward.more.fuel-efficient.passenger.car.use..Heavy-duty.truck.fuel.consumption.is.expected.to.increase.steadily.from.170.million.gallons.in.2006.to.220.million.in.2020,.nearly.30%.
The.number.of.miles.driven.by.a.vehicle.in.a.year.is.a.strong.factor.in.determining.its.emissions..In.1990,.the.total.number.of.vehicle.miles.traveled.was.22.billion..This.number.increased.31%.to.30.billion.by.2006..In.1990,.passenger.cars.accounted.for.about.60%.of.total.vehicle.miles.traveled,.while.light-duty.trucks.accounted.for.35%..By.2006,.these.two.vehicle.classes.each.accounted.for.about.48%.of.overall.miles.traveled.in.San.Diego.County..The.total.number.of.miles.driven.by.on-road.vehicles.annually.in.San.Diego.County.is.expected.to.increase.another.31%.to.37.billion.miles.by.2020,.a.64%.increase.over.1990.levels..Figure.7.demonstrates.the.trend.
2.1. Emissions Reduction Targets
In.2006,.California.Governor.Arnold.Schwarzenegger.signed.the.Global.Warming.Solutions.Act.(AB.32),.establishing.statutory.limits.on.GHG.emissions.in.California..AB.32.seeks.to.reduce.statewide.emissions.to.1990.levels.by.the.year.2020..Even.though.it.does.not.specify.reduction.targets.for.specific.areas.or.jurisdictions,.this.study.calculated.theoretical.reductions.targets.proportionally.for.San.Diego.County..To.meet.the.targets.established.by.AB.32,.San.Diego.would.have.to.reduce.projected.on-road.transportation.emissions.by.4.7.MMT.CO
2E.from.2006.levels.to.reach.1990.levels.–.a.24.7%.reduction.
Earlier,.in.2005,.Governor.Schwarzenegger.signed.Executive.Order.S-3-05,.which.established.long-term.targets.for.GHG.emissions.reductions.to.80%.below.1990.levels.by.2050..While.this.reduction.target.is.not.law,.it.is.generally.accepted.as.the.long-term.target.toward.which.California.regulations.should.aim..Like.AB.32,.Executive.Order.S-3-05.was.intended.to.be.a.statewide.target,.but.if.applied.hypothetically.to.San.Diego.County,.total.emissions.from.on-road.transportation.would.have.to.be.reduced.to.2.9.MMT.CO
2E.–a.
reduction.of.nearly.16.1.MMT.CO2E.below.the.2020.business-as-usual.forecast.and.12.9.MMT.CO
2E.below.
2006.levels.

6 San Diego County GHG Inventory
Figure.8.compares.2006.emissions.levels,.2020.business-as-usual.projections,.AB.32,.and.Executive.Order.S-3-05.targets.
3. Emissions Reduction Strategies – Wedges
To.illustrate.how.San.Diego.County.could.achieve.AB.32.reduction.targets.for.the.on-road.transportation.category,.the.project.team.developed.several.emissions.reductions.strategies.and.calculated.the.“wedges”.illustrated.in.Table.2.and.Figure.9..This.approach.was.adapted.from.the.well-known.study.by.Pacala.and.Socolow,.who.demonstrated.that.global.emissions.could.be.reduced.to.levels.that.would.stabilize.climate.change.with.existing.technologies.2
The.project.team.developed.five.wedges.to.reduce.GHG.emissions.from.the.on-road.transportation.category.to.1990.levels..Each.wedge.relies.on.either.existing.statutes.or.policy.directives.currently.under.consideration.addressing.total.fuel.consumption,.fuel.type,.and.vehicle.miles.traveled.(VMT)..The.wedges.are.also.based.on.effects.of.the.Corporate.Average.Fuel.Economy.(CAFE).standard.included.in.Title.49.of.the.Energy.Independence.and.Security.Act.of.2007;3.California’s.AB.1493,.which.is.also.referred.to.as.the.“Pavley”.bill4;.the.Low.Carbon.Fuel.Standard.(LCFS)5;.a.10%.VMT.reduction;.and.several.vehicle.efficiency.measures.included.in.CARB’s.Climate.Change.Draft.Scoping.Plan.6.Table.2.shows.each.wedge.and.the.amount.of.emissions.that.it.could.reduce.by.2020..The.combined.emissions.reductions.represented.by.these.five.wedges.is.6.8.MMT.CO
2E,.about.45%.of.the.total.amount.needed.to.reach.the.AB.32.targets.for.the.
entire.region...Figure.9.is.a.graphical.representation.of.how.each.wedge.reduces.emissions.from.the.business-as-usual.projection.

7On-Road Transportation Report
3.1. AB 1493 (Pavley 1 and 2)
AB.1493,.or.the.Pavley.Bill,.is.a.standard.for.new.light-duty.passenger.vehicles.that.could.reduce.San.Diego.County.emissions.from.these.vehicles.by.21%.by.2020.7.The.law,.which.has.not.been.implemented.due.to.legal.challenges,.requires.auto.manufacturers.to.reduce.vehicle.emissions.of.carbon.dioxide.(CO
2),.methane.
(CH4),.nitrous.oxide.(N
2O),.and.hydrofluorocarbons.(HFCs).in.light-duty.vehicles..AB.1493.defines.light-
duty.passenger.vehicles.as.including.passenger.cars,.light-duty.trucks,.and.medium-duty.trucks/vehicles..Under.the.law,.manufacturers.would.need.to.reduce.greenhouse.gases.from.tailpipe.emissions.and.fugitive.emissions.from.air-conditioning.systems.
If.implemented,.the.Pavley.bill.regulations.would.begin.with.the.2009.model.year.and.end.in.2016,.when.an.11%.reduction.in.emissions.is.required..The.period.from.2009.to.2016.is.known.as.“Pavley.1”;.the.period.from.2017.to.2020.is.“Pavley.2”.and.would.require.a.20%.GHG.reduction.by.2020..Pavley.2.is.a.commitment.made.by.the.California.Air.Resources.Board.to.extend.progress.from.Pavley.1.and.to.increase.the.greenhouse.gas.reduction.requirement.to.20%.
3.2. Federal Corporate Average Fuel Economy (CAFE) Standards
The.federal.Corporate.Average.Fuel.Economy.(CAFE).standard.determines.the.fuel.efficiency.of.certain.vehicle.classes.in.the.United.States..The.current.standard.has.remained.largely.unchanged.since.1990..In.2007,.as.part.of.the.Energy.and.Security.Act.of.2007,.CAFE.standards.were.increased.for.new.light-duty.vehicles.to.35.miles.per.gallon.by.2020.8.The.new.CAFE.standards.will.take.effect.no.sooner.than.2011,.which.was.the.start.date.used.in.this.analysis..Unlike.the.Pavley.Bill,.which.has.a.specific.GHG.emissions.reduction.target,.the.CAFE.standards.simply.prescribe.fuel.economy,.which.will.also.result.in.greenhouse.gas.reductions.
In.a.study.comparing.Pavley.1.and.2.with.the.federal.CAFE.standard,.CARB.reported.that.the.CAFE.standard.would.reduce.GHG.emissions.by.5%.by.2016.and.12%.by.20209;.the.Pavley.1.and.2.standards.are.expected.to.reduce.emissions.by.20.%.by.2020..The.CAFE.standard.requires.reductions.from.light-.and.heavy-duty.vehicles,.whereas.Pavley.1.and.2.only.require.reductions.from.light-duty.vehicles..A.reduction.requirement.for.heavy-duty.vehicles.has.not.yet.been.determined.for.CAFE;.therefore,.for.purposes.of.this.study,.the.emissions.reduction.requirement.for.heavy-duty.vehicles.is.taken.to.be.the.same.as.the.Federal.standard.for.light-duty.vehicles.on.a.percentage.basis,.which.is.5%.by.2016.and.12%.by.2020..Even.though.the.effects.of.the.Pavley.Bill.are.greater.than.the.effects.of.the.new.CAFE.standards.for.light-duty.vehicles,.we.chose.to.calculate.separate.values.for.each;.however,.the.reader.should.note.that.the.combined.values.presented.for.CAFE.and.Pavley.are.equivalent.to.the.effects.of.Pavley.regarding.light-duty.vehicles.because.we.show.only.the.incremental.increase.of.Pavley.over.the.CAFE.standard.10
3.3. Low Carbon Fuel Standard (LCFS)
The.Low.Carbon.Fuel.Standard.(LCFS).was.included.in.a.California.Governor’s.Executive.Order.that.was.promulgated.in.January.2007..This.strategy.addresses.the.type.of.fuel.used.in.vehicles..Efficiency.standards.affect.the.total.amount.of.fuel.used,.whereas.the.low-carbon.fuel.standard.seeks.to.reduce.the.carbon.content.of.the.fuel,.therefore.reducing.GHG.emissions.even.if.total.fuel.consumption.is.not.reduced..The.Low-Carbon.Fuel.Standard.has.been.approved.by.CARB.as.a.discrete.early.action.item.under.AB.32.and.implementing.regulations.are.currently.under.development..Because.regulations.have.not.been.finalized,.for.the.purposes.of.this.study.it.was.reasonable.to.assume.that.the.effects.of.the.Low-Carbon.Fuel.Standard.would.be.a.10%.reduction.in.GHG.emissions.from.fuel.use.by.2020.
8 San Diego County GHG Inventory
3.4. 10% Reduction in Vehicle Miles Traveled (VMT)
Vehicle.miles.traveled.(VMT).is.the.third.significant.driver.of.emissions..No.standard.exists.to.regulate.the.number.of.miles.driven,.but.reducing.the.total.number.of.miles.driven.by.2020.can.significantly.reduce.GHG.emissions..The.project.team.calculated.the.effects.of.a.10%.reduction.of.vehicle.miles.traveled..This.reduction.is.based.in.part.upon.the.April.2008.Department.of.Transportation,.Federal.Highway.Administration,.“Traffic.Volume.Trends.April.2008”.report,.which.states.“cumulative.travel.for.2008.decreased.by.2.1.percent.”.This.decrease.in.VMT.is.only.for.the.first.quarter.of.200811;.therefore,.it.seemed.both.conservative.and.reasonable.to.extrapolate.to.a.10%.reduction.of.VMT.by.2020.
Although.the.link.between.vehicle.miles.traveled.and.increasing.fuel.prices.is.unclear,.the.report.from.the.Federal.Highway.Administration.indicates.that.this.is.the.largest.downward.trend.in.25.years.12.And.although.predicting.fuel.prices.is.complex.and.beyond.the.scope.of.this.project,.it.is.likely.that.fuel.prices.will.be.higher.in.2020.than.they.are.today,.therefore.putting.downward.pressure.on.vehicle.miles.traveled.
3.5. Climate Change Scoping Plan: Reduction (Measures 9 and 11)13
The.Climate.Change.Scoping.Plan.is.a.comprehensive.plan.that.has.been.developed.by.the.CARB.to.achieve.the.goals.of.AB.32,.the.Global.Warming.Solutions.Act.of.2006..Included.in.the.Scoping.Plan.are.strategies.to.reduce.emissions.by.increasing.efficiency,.optimizing.aerodynamics,.and.converting.combustion-only.vehicles.to.hybrids..Although.these.on-road.emissions.reduction.measures.are.intended.for.implementation.at.the.state.level,.several.on-road.transportation.strategies.in.this.plan.were.scaled.down.to.San.Diego.County.using.data.related.to.CO
2E.emissions,.vehicle.population,.and.vehicle.type..When.scaled.down,.the.
CARB’s.transportation.efficiency,.aerodynamics,.and.hybrid.conversion.strategies.translate.to.an.emissions.reduction.of.0.6.MMT.CO
2E.for.San.Diego.County.by.2020.
The.measures.in.the.Scoping.Plan.are.a.combination.of.strategies.targeting.light-,.medium-,.and.heavy-.duty.vehicles..The.county’s.2020.emissions.reduction.target.for.light-duty.vehicles.is.0.47.MMT.CO
2E,.
which.is.to.be.accomplished.by.improving.vehicle.efficiency..The.county’s.heavy-.and.medium-duty.vehicle.target.in.relationship.to.this.plan.is.a.0.14.MMT.CO
2E.reduction,.achieved.by.optimized.aerodynamics.
and.hybridization.
4. On-Road Transportation Methodology
The.on-road.transportation.methodology.includes.analysis.of.most.motorized.vehicles.that.travel.San.Diego.County.freeways,.highways,.streets,.and.roads..The.vehicle.types.analyzed.include:.passenger.cars;.light-,.medium-,.and.heavy-duty.trucks;.buses;.motor.homes;.and.motorcycles..The.GHG.gases.that.were.analyzed.include.carbon.dioxide.(CO
2),.nitrous.oxide.(N
2O),.and.methane.(CH
4)..These.gases.comprise.the.majority.
of.GHG.gases.emitted.due.to.combustion.from.on-road.vehicles..
4.1. Computation, Process, and Data
The.on-road.transportation.GHG.emissions.were.computed.in.two.steps..First,.by.obtaining.San.Diego.County.on-road.GHG.emission.data.using.the.CARB.on-road.emissions.modeling.tool,.EMissions.FACtor.or.EMFAC...Second,.further.computations.were.conducted.that.followed.the.computational.methodology.used.by.CARB.to.develop.their.California.GHG.emissions.inventory.14.
EMFAC.uses.emissions.rate.and.vehicle.activity.data.to.compute.on-road.vehicle.emissions..Development.of.the.data.is.based.on.variables.such.as.vehicle.population.and.age,.vehicle.type.and.weight,.fuel.type.and.consumption,.vehicle.miles.traveled.(VMT),.vehicle.technology,.and.emissions.reduction.technology.
9On-Road Transportation Report
In.addition.to.the.first.step.of.using.outputs.for.CO2.and.CH4.from.EMFAC,.total.hydrocarbons.(THC),.nitrogen.oxides.(NO
X),.carbon.monoxide.(CO),.molecular.weight.ratios,.fuel.consumption,.and.mass-
balance.methods.were.used.to.compute.the.final.output.of.the.major.GHG.gases.(CO2,.N
2O,.and.CH
4).from.
on-road.vehicles..This.final.computation.is.similar.to.the.methodology.used.by.CARB.to.develop.its.2007.California.GHG.Emissions.Inventory.15.When.the.GHG.emissions.inventory.methodology.for.California.was.not.applicable.or.did.not.make.sense.on.a.county.scale,.the.CARB.methodology.was.modified.to.apply.to.San.Diego.County..The.main.difference.between.the.CARB.computations.and.this.study.is.the.ratio.of.Federal.Highway.Administration.fuel.sales.to.the.EMFAC.computational.fuel.consumption.for.California..This.ratio.was.not.pertinent.to.San.Diego.County.and.computations.were.modified.accordingly.
The.EMFAC.emissions.output.is.generated.in.tons.per.day..This.daily.emissions.rate.was.converted.to.an.annual.emissions.rate.based.on.the.vehicle.type.(noncommercial.or.commercial)..Noncommercial.vehicle.annual.emissions.were.calculated.on.the.basis.of.347.effective.days.per.year.and.included.passenger.cars,.light-duty.trucks,.and.motorcycles..Commercial.vehicles.included.heavy-duty.trucks.and.buses.and.their.annual.output.was.calculated.on.the.basis.of.327.effective.days.per.year,.on.the.assumption.that.vehicle.activity.and.miles.traveled.decrease.on.weekends..GHG.emissions.from.buses.and.motor.homes.were.also.included.in.this.inventory..Owing.to.their.similar.gross.vehicle.weights,.their.respective.emissions.were.included.in.the.heavy-duty.truck.category..
4.2. Historical Emissions and Forecasts
Emissions.from.1990.to.2005.were.computed.by.Tanaka.Research.and.Consulting.using.the.method.described.in.section.4.1..Forecasts.from.2006.to.2020.used.the.same.methodology.described.for.1990.to.2005,.but.the.EMFAC.inputs.were.provided.by.the.SANDAG.Transportation.Division.and.were.based.on.the.Regional.Transportation.Plan..The.final.computation.used.the.same.methodology.as.the.1990.to.2005.time.frame.
4.3. Wedge Configuration and Scenario Development
The.project.team.calculated.the.following.three.wedge.scenarios.using.the.five.wedges.described.above.to.assess.whether.and.by.how.much.the.order.in.which.the.wedges.were.subtracted.from.the.business-as-usual.projection.affected.the.total.reductions:
. 1.. Business-as-usual.(BAU).case.reduced.by.Pavley.1.and.2,.CAFE,.LCFS,.a.10%.VMT.reduction.and..
. . Climate.Change.Scoping.Plan.reduction.
. 2.. BAU.reduced.by.CAFE,.LCFS,.10%.VMT.reduction.and.Climate.Change.Scoping.Plan.reduction.
. 3.. BAU.reduced.by.CAFE,.10%.VMT.reduction.and.Climate.Change.Scoping.Plan.reduction.

10 San Diego County GHG Inventory
To.calculate.the.effect.of.the.emissions.reductions.included.in.each.wedge,.the.project.team.subtracted.the.first.wedge.from.the.business-as-usual.scenario..The.second.wedge.was.subtracted.from.the.result.of.the.first.calculation.(wedge),.and.so.on..The.order.in.which.the.wedges.are.calculated.affects.the.net.emissions.after.all.the.wedges.are.subtracted..Table.3.shows.the.results.of.the.calculation.for.six.scenarios,.each.using.a.different.order..The.project.team.chose.to.calculate.wedges.based.on.order.1.because.its.net.emissions.was.closest.to.the.2020.net.emissions.average.of.the.six.possible.reduction.orders.in.Table.3..Also,.since.implementation.of.the.tailpipe.emissions.standards.included.in.the.Pavley.Bill.has.been.delayed.by.litigation.and.Federal.inaction,.the.project.team.thought.it.was.reasonable.to.make.the.Federal.CAFE.standard.the.first.wedge,.since.it.is.already.law.

11On-Road Transportation Report
Wedge.scenarios.1,.2,.and.3.illustrate.the.significance.of.implementing.the.five.wedges.(CAFE,.Pavley,.LCFS,.Climate.Change.Scoping.Plan,.and.a.10%.VMT.reduction)..A.wedge.summary.is.given.in.Table.4..
Wedge.scenario.1.is.the.most.comprehensive.of.the.three.wedge.scenarios;.it.incorporates.all.five.reduction.strategies:.CAFE,.Pavley,.LCFS.,.10%.VMT.reduction,.and.Scoping.Plan..This.scenario.is.one.of.two.that.were.able.to.meet/exceed.the.AB.32.target.by.reducing.2020.GHG.emissions.to.1990.levels..This.shows.the.importance.of.all.five.reduction.strategies..Scenario.1.has.a.net.GHG.emissions.of.12.2.MMT.CO
2E,.which.
is.1.8.MMT.CO2E.below.the.AB.32.requirement.of.14.3.MMT.CO
2E..The.results.of.scenario.1.are.displayed.
in.Figure.10.
12 San Diego County GHG Inventory
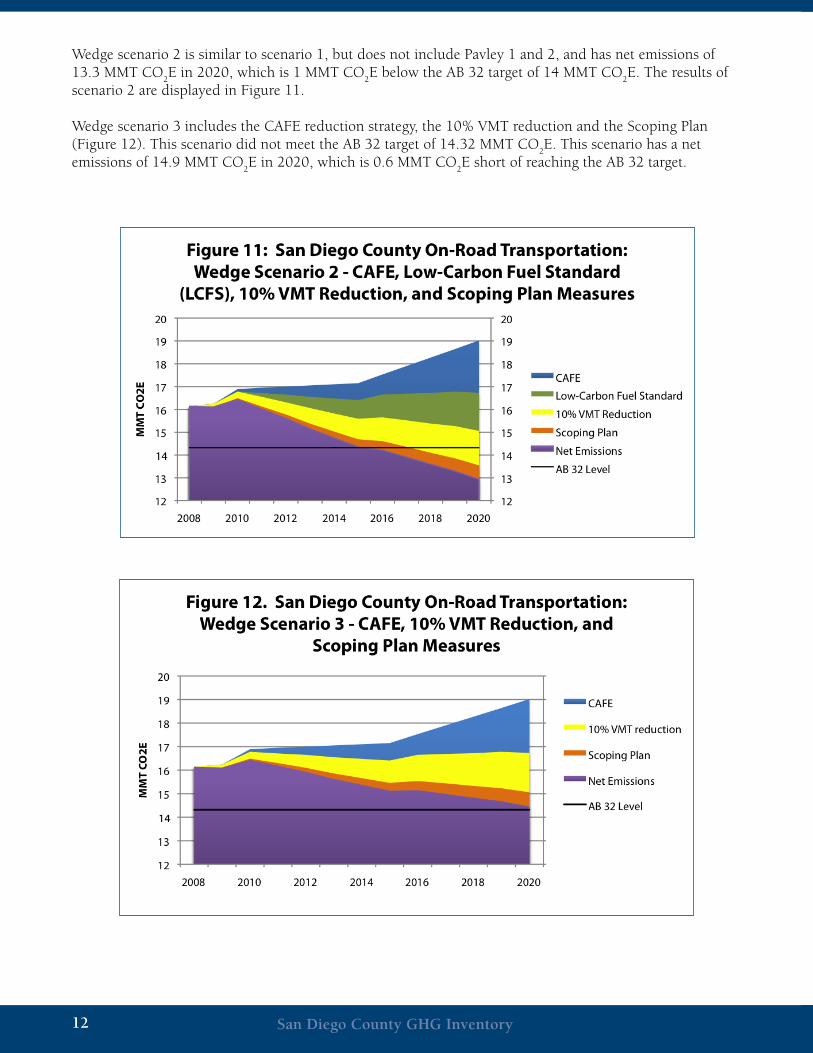
Wedge.scenario.2.is.similar.to.scenario.1,.but.does.not.include.Pavley.1.and.2,.and.has.net.emissions.of.13.3.MMT.CO
2E.in.2020,.which.is.1.MMT.CO
2E.below.the.AB.32.target.of.14.MMT.CO
2E..The.results.of.
scenario.2.are.displayed.in.Figure.11.
Wedge.scenario.3.includes.the.CAFE.reduction.strategy,.the.10%.VMT.reduction.and.the.Scoping.Plan.(Figure.12)..This.scenario.did.not.meet.the.AB.32.target.of.14.32.MMT.CO
2E..This.scenario.has.a.net.
emissions.of.14.9.MMT.CO2E.in.2020,.which.is.0.6.MMT.CO
2E.short.of.reaching.the.AB.32.target.
13On-Road Transportation Report
End Notes
1.. 2030.San.Diego.Regional.Transportation.plan,.www.sandag.org/index.asp?projectid=292&fuseaction=projects.detail)2.. S..Pacala.and.R..Socolow:.Stabilization.Wedges:.Solving.the.Climate.Problem.for.the.Next.50.Years.with.Current... Technologies,.Science,.13.August.2004,.vol..305,.pp..968-972.3.. HR6,.Title.I,.Section.102.4.. Available.at.http://www.climatechange.ca.gov/publications/legislation/ab_1493_bill_20020722_chaptered.pdf5.. Executive.Order.S-1-07;.available.at.http://gov.ca.gov/index.php?/executive-order/5172/6. Climate.Change.Draft.Scoping.Plan.(pursuant.to.AB32);.available.at.. http://www.arb.ca.gov/cc/scopingplan/document/draftscopingplan.pdf7. California.Air.Resources.Board,.February.25,.2008,.“Comparison.of.Greenhouse.Gas.Reductions.for.the.United.States.. and.Canada.Under.U.S..CAFÉ.Standards.and.California.Air.Resources.Board.Greenhouse.Gas.Regulations,”.last.accessed... June.25,.2008,.at.http://www.arb.ca.gov/cc/ccms/reports/pavleycafe_reportfeb25_08.pdf. Computations.by.Tanaka.Research.and.Consulting..2.92.MMT.CO2E.reduction.due.to.AB.1493..16.7.MMT.CO2E.emissions... forecast.at.2020.from.light-duty.vehicles.8.. National.Highway.Traffic.Safety.Administration.(NHTSA).“CAFE.Overview,”.last.viewed.June.28,.2008,.at.. http://www.nhtsa.dot.gov/CARS/rules/CAFE/overview.htm9. California.Air.Resources.Board,.February.25,.2008,.op..cit.10. Ibid.11. U.S..Dept.of.Transportation,.Federal.Highway.Administration,.Office.of.Highway.Policy.Information,.“Traffic.Volume... Trends”.April.2008..http://www.fhwa.dot.gov/ohim/tvtw/08aprtvt/08aprtvt.pdf12. Ibid.13. California.Air.Resources.Board,.Climate.Change.Draft.Scoping.Plan,.June.2008.Discussion.Draft,.Emissions.Reduction... Measures.numbers.9.and.11..Available.at.http://www.arb.ca.gov/cc/scopingplan/document/draftscopingplan.pdf14. California.Air.Resources.Board,.Greenhouse.Gas.Emissions.Inventory:.Index.to.the.Documentation.Pages,.cited.April.15,.2008.... http://www.arb.ca.gov/cc/inventory/doc/doc_index.php15. California.Air.Resources.Board,.Greenhouse.Gas.Emissions.Inventory:.Index.to.the.Documentation.Pages,.cited.April.15,.2008.... http://www.arb.ca.gov/cc/inventory/doc/doc_index.php