on patient flow in hospitals: a data-based queueing...
TRANSCRIPT

Stochastic Systems
ON PATIENT FLOW IN HOSPITALS: A DATA-BASEDQUEUEING-SCIENCE PERSPECTIVE
By Mor Armony∗, Shlomo Israelit†, Avishai Mandelbaum‡,Yariv N. Marmor§, Yulia Tseytlin¶, and Galit B. Yom-Tov‖
NYU∗, Rambam Hospital†, Technion‡,ORT Braude College & Mayo Clinic§, IBM Research¶, Technion‖
Hospitals are complex systems with essential societal benefits andhuge mounting costs. Some costs are inevitable while others are in-curred directly due to inefficient use of resources or indirectly due tosuffering patients. All these costs are exacerbated by the stochasticityof hospital systems, which is often manifested by congestion and longdelays in patient care. A queueing-network view, of patient flow inhospitals, is thus natural for studying and improving its performance.
The goal of our research is to explore patient flow data through thelenses of a queueing scientist. More specifically, we use exploratorydata analysis (EDA) to study patient flow in a large Israeli hospital,which reveals important features that are not readily explainable byexisting models.
Questions raised by our EDA include: Can a simple (parsimonious)queueing model usefully capture the complex operational reality ofthe Emergency Department (ED)? What time resolutions and opera-tional regimes are relevant for modeling patient length of stay in theInternal Wards (IWs)? Towards fair routing of patients from the EDto the IWs, how is workload measured (via bed occupancy levels orpatient turnover rates)? EDA also underscores the importance of anintegrative view of hospital units by, for example, relating ED bottle-necks to IW physician protocols. The significance of such questionsand our related findings raises the need for novel queueing modelsand theory, which we present here as research opportunities.
Hospital data, and specifically patient flow data at the level of theindividual patient, is increasingly collected but is typically confiden-tial and/or proprietary. We have been fortunate to partner with ahospital that allowed us to open up their data for universal access,which enables reproducibility of our findings through a user-friendlyplatform. This will hopefully stimulate readers to carry out their ownEDA, to be followed by new models and theory, which would ulti-mately lead to much needed improvements in hospital patient flowand overall performance.
Keywords and phrases: Queueing Models, Queueing Networks, Healthcare, Patientflow, EDA
1imsart-ssy ver. 2013/03/06 file: "Short_Patient flow main".tex date: December 29, 2013

2 ARMONY ET AL.
CONTENTS
1 Introduction . . . . . . . . . . . . . . . . . . . . . . . . . . . . . . . 31.1 Patient Flow Focus . . . . . . . . . . . . . . . . . . . . . . . . 41.2 EDA, the scientific paradigm and queueing science . . . . . . 51.3 Apologies to the Statistician . . . . . . . . . . . . . . . . . . . 71.4 Rambam hospital . . . . . . . . . . . . . . . . . . . . . . . . . 7
1.4.1 The ED+IW network . . . . . . . . . . . . . . . . . . 91.4.2 Data Description . . . . . . . . . . . . . . . . . . . . . 9
1.5 Some hints to the literature . . . . . . . . . . . . . . . . . . . 91.5.1 A proof of concept . . . . . . . . . . . . . . . . . . . . 11
2 Emergency Department . . . . . . . . . . . . . . . . . . . . . . . . 112.1 Basic facts . . . . . . . . . . . . . . . . . . . . . . . . . . . . . 112.2 Exploratory Data Analysis . . . . . . . . . . . . . . . . . . . . 12
2.2.1 Time dependency . . . . . . . . . . . . . . . . . . . . . 122.2.2 Fitting a simple model to a complex reality . . . . . . 122.2.3 State dependency . . . . . . . . . . . . . . . . . . . . . 15
2.3 Research Opportunities . . . . . . . . . . . . . . . . . . . 173 Internal Wards . . . . . . . . . . . . . . . . . . . . . . . . . . . . . 19
3.1 Basic facts . . . . . . . . . . . . . . . . . . . . . . . . . . . . . 193.2 EDA: LOS—a story of multiple time scales . . . . . . . . . . 20
3.2.1 Research Opportunities . . . . . . . . . . . . . . . 223.3 EDA: Operational regimes and economies of scale . . . . . . . 24
3.3.1 In what regime do IWs operate? Can QED- and ED-regimes co-exist? . . . . . . . . . . . . . . . . . . . . . 25
3.3.2 Research Opportunities . . . . . . . . . . . . . . . 253.3.3 Diseconomies of scale (or how ward size affects LOS) . 263.3.4 Research opportunities . . . . . . . . . . . . . . . . 27
4 Transfer from the ED to IWs . . . . . . . . . . . . . . . . . . . . . 274.1 Basic facts . . . . . . . . . . . . . . . . . . . . . . . . . . . . . 284.2 Delays in transfer . . . . . . . . . . . . . . . . . . . . . . . . . 29
4.2.1 Research Opportunities . . . . . . . . . . . . . . . 304.3 Influence of transfer delays on the ED . . . . . . . . . . . . . 30
4.3.1 Research Opportunities . . . . . . . . . . . . . . . 314.4 Causes of delay . . . . . . . . . . . . . . . . . . . . . . . . . . 324.5 Fairness in the ED-to-IW process . . . . . . . . . . . . . . . . 34
4.5.1 Fairness towards patients . . . . . . . . . . . . . . . . 344.5.2 Research Opportunities . . . . . . . . . . . . . . . 354.5.3 Fairness towards staff . . . . . . . . . . . . . . . . . . 354.5.4 Research Opportunities . . . . . . . . . . . . . . . 36
5 A system view . . . . . . . . . . . . . . . . . . . . . . . . . . . . . 37
imsart-ssy ver. 2013/03/06 file: "Short_Patient flow main".tex date: December 29, 2013

PATIENT FLOW IN HOSPITALS 3
5.1 Research opportunities . . . . . . . . . . . . . . . . . . . . 386 Discussion and concluding remarks . . . . . . . . . . . . . . . . . . 39
6.1 Operational measures as surrogates to overall hospital perfor-mance . . . . . . . . . . . . . . . . . . . . . . . . . . . . . . . 39
6.2 Multi-dimensional workload . . . . . . . . . . . . . . . . . . . 406.3 Capacity . . . . . . . . . . . . . . . . . . . . . . . . . . . . . . 416.4 Time-scales . . . . . . . . . . . . . . . . . . . . . . . . . . . . 426.5 Some concluding comments on data-based research—a great
opportunity but no less of a challenge . . . . . . . . . . . . . 426.5.1 Towards a culture of reproducible research in empiri-
cal OR/AP . . . . . . . . . . . . . . . . . . . . . . . . 43Acknowledgements . . . . . . . . . . . . . . . . . . . . . . . . . . . . . 45References . . . . . . . . . . . . . . . . . . . . . . . . . . . . . . . . . . 47Appendix: Accessing Data repositories and EDA tools at the SEELab 53Author’s addresses . . . . . . . . . . . . . . . . . . . . . . . . . . . . . 54
1. Introduction. Health care systems in general, and hospitals in par-ticular, are major determinants of our quality of life. They also require asignificant fraction of our resources and, at the same time, they suffer from(quoting a physician research partner) “a ridiculous number of inefficiencies;thus everybody—patients, families, nurses, doctors and administrators arefrustrated.” In (too) many instances, this frustration is caused and exacer-bated by delays—“waiting for something to happen”; in turn, these delaysand the corresponding queues signal inefficiencies. Hospitals hence presenta propitious ground for research in Queueing Theory and, more generally,Applied Probability and Operations Research (OR). Such research wouldideally culminate in reduced congestion (crowding) and its accompanyingimportant benefits: clinical, financial, psychological and societal. And a pre-requisite for this to happen and for the benefits to accrue, we strongly be-lieve, is that the supporting research is data-based.
Unfortunately, however, operational hospital data is accessible to veryfew researchers, and patient-level data is in fact publicly unavailable. Thereasons span data nonexistence or poor quality, through concerns for pa-tient confidentiality, to proprietorial attitudes of the data owners. We arethus humbly attempting, in this present work, to change this landscape ofdata-based OR and, in doing so, introduce a new standard. Specifically,we identify and propose research opportunities and challenges that arisefrom exploratory analysis of ample hospital data. Just as significantly, wealso open up our data and make it universally accessible at the TechnionIE&M Laboratory for Service Enterprise Engineering (SEELab): the data
imsart-ssy ver. 2013/03/06 file: "Short_Patient flow main".tex date: December 29, 2013

4 ARMONY ET AL.
can be either downloaded or analyzed online, through a user friendly plat-form (SEEStat) for Exploratory Data Analysis (EDA). Our goal is thus toprovide an entry to and accelerate the learning of data-based OR of hospi-tals; Interested researchers can reproduce our EDA, and use it as a triggerand a starting point for further data mining and novel research of their own.
1.1. Patient Flow Focus. Of particular interest to both researchers andpractitioners is patient flow in hospitals: improving it can have a significantimpact on quality of care as well as on patient satisfaction; and restrict-ing attention to it adds a necessary focus to our work. Indeed, the medicalcommunity has acknowledged the importance of patient flow management(e.g. Standard LD.3.10.10, which the Joint Commission on Accreditation ofHospital Organizations (JCAHO, 2004) set for patient flow leadership). Thisacknowledgment is natural given that operational measures of patient floware relatively easy to measure, and that they inherently serve as “surrogates”for other quality of care measures. For example, the rate of readmission tothe hospital, within a relatively short time, often serves as a proxy of clin-ical quality of care. Similarly, the rate of LWBS (Left without being seen)is a common proxy for accessibility to care. In parallel, patient flow hascaught the attention of researchers in Operations Research, Applied Prob-ability, Service Engineering and Operations Management, with QueueingTheory serving as a common central thread that connects these disciplines.This is not surprising: hospital systems, being congestion-prone, naturallyfit the framework of Queueing Theory, which captures the tradeoffs between(operational) service quality vs. resource efficiency.
Our starting point is that a queueing network encapsulates the opera-tional dimensions of patient flow in hospitals, with the medical units beingthe nodes of the network, patients are the customers, while beds, medi-cal staff and medical equipment are the servers. But what are the specialfeatures of this queueing network in terms of its system primitives, keyperformance measures and available controls? To address this question, westudy an extensive data set of patient flow through the lense of a queue-ing scientist. Our study highlights interesting phenomena that arise in thedata, which leads to a discussion of their implications on system operationsand queueing modeling, and culminates in the proposal of related researchopportunities.
However, patient flow, as highlighted by our title (“On Patient Flow . . .”),is still too broad a subject for a single study. We thus focus on the inter-wardresolution, as presented in the flow chart (process map) of Figure 1; this is incontrast to intra-ward or out-of-hospital patient flow. Furthermore, having
imsart-ssy ver. 2013/03/06 file: "Short_Patient flow main".tex date: December 29, 2013
PATIENT FLOW IN HOSPITALS 5
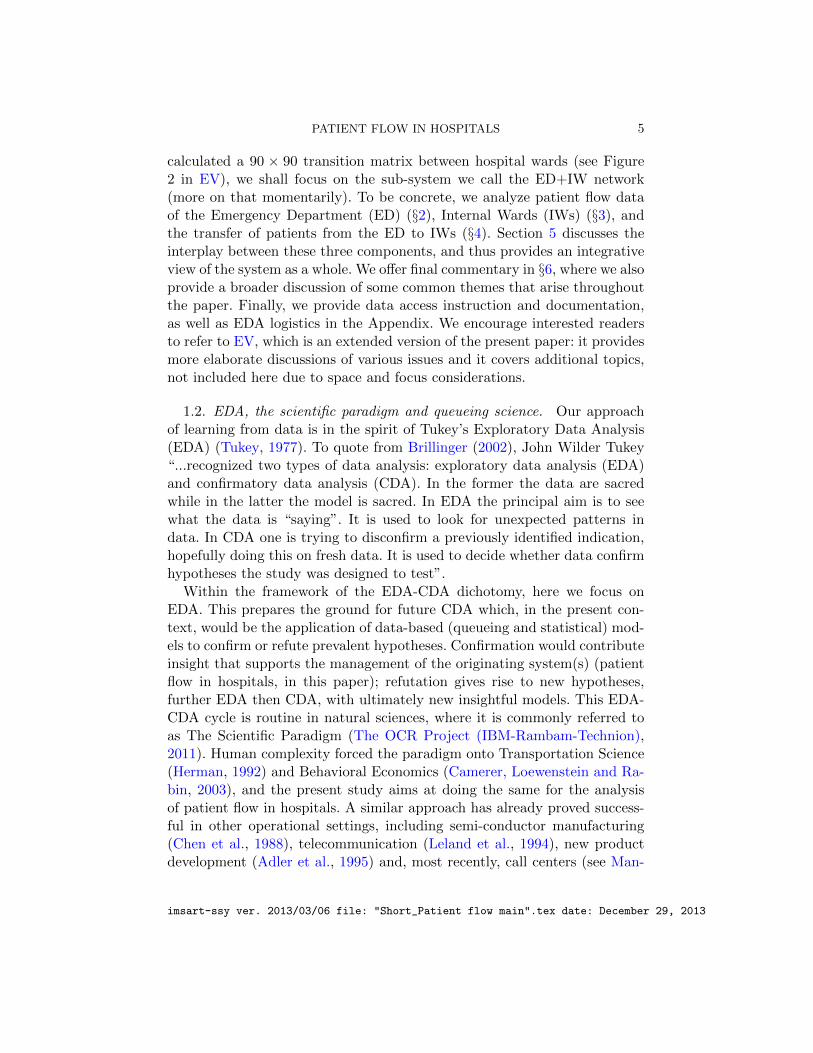
calculated a 90 × 90 transition matrix between hospital wards (see Figure2 in EV), we shall focus on the sub-system we call the ED+IW network(more on that momentarily). To be concrete, we analyze patient flow dataof the Emergency Department (ED) (§2), Internal Wards (IWs) (§3), andthe transfer of patients from the ED to IWs (§4). Section 5 discusses theinterplay between these three components, and thus provides an integrativeview of the system as a whole. We offer final commentary in §6, where we alsoprovide a broader discussion of some common themes that arise throughoutthe paper. Finally, we provide data access instruction and documentation,as well as EDA logistics in the Appendix. We encourage interested readersto refer to EV, which is an extended version of the present paper: it providesmore elaborate discussions of various issues and it covers additional topics,not included here due to space and focus considerations.
1.2. EDA, the scientific paradigm and queueing science. Our approachof learning from data is in the spirit of Tukey’s Exploratory Data Analysis(EDA) (Tukey, 1977). To quote from Brillinger (2002), John Wilder Tukey“...recognized two types of data analysis: exploratory data analysis (EDA)and confirmatory data analysis (CDA). In the former the data are sacredwhile in the latter the model is sacred. In EDA the principal aim is to seewhat the data is “saying”. It is used to look for unexpected patterns indata. In CDA one is trying to disconfirm a previously identified indication,hopefully doing this on fresh data. It is used to decide whether data confirmhypotheses the study was designed to test”.
Within the framework of the EDA-CDA dichotomy, here we focus onEDA. This prepares the ground for future CDA which, in the present con-text, would be the application of data-based (queueing and statistical) mod-els to confirm or refute prevalent hypotheses. Confirmation would contributeinsight that supports the management of the originating system(s) (patientflow in hospitals, in this paper); refutation gives rise to new hypotheses,further EDA then CDA, with ultimately new insightful models. This EDA-CDA cycle is routine in natural sciences, where it is commonly referred toas The Scientific Paradigm (The OCR Project (IBM-Rambam-Technion),2011). Human complexity forced the paradigm onto Transportation Science(Herman, 1992) and Behavioral Economics (Camerer, Loewenstein and Ra-bin, 2003), and the present study aims at doing the same for the analysisof patient flow in hospitals. A similar approach has already proved success-ful in other operational settings, including semi-conductor manufacturing(Chen et al., 1988), telecommunication (Leland et al., 1994), new productdevelopment (Adler et al., 1995) and, most recently, call centers (see Man-
imsart-ssy ver. 2013/03/06 file: "Short_Patient flow main".tex date: December 29, 2013

6 ARMONY ET AL.
ED
Ped
iatr
ic
Neu
rolo
gyN
ephr
olog
yD
errm
atol
ogy
Inte
rnal
Inte
nsiv
eC
are
Car
diol
ogy
Rhe
umat
olog
y
Uro
logy
Oto
rhin
olar
yngo
logy
Ort
hope
dics
Sur
gery
Mat
erni
ty
Gyn
ecol
ogy
Psy
chia
try
Oph
thal
mol
ogy
R
L
D
Out
R
R
R
R
RR
R
RR
RR
R
R
R
R
R
L
LL
L
L
L
L
L
L
D
D
D
D
DD
D
D
DD
D
D
Out
Out
Out
Out
Out
Out
Out
Out
Out
Out
Out
Out
Out
One
day
at th
e Ho
spita
l
Ram
bam
Au
gust
200
4, A
vera
ge D
ay
Disc
harg
ed
Disa
ppea
red
Dece
ased
Tran
sfer
326.0
31.7
28.4
11.8
29.1
18.3
18.3
19.3
37.44.3
5.4
12.2
23.511.8
4.9 3.5
8.2
196.7
7.1
3.7
1.3
1.2
2.5
1.4
2.7
9.7
2.0
5.0 6.8
0.8
0.6
1.4
0.9
1.1 1.9
2.0
0.9
2.9
0.8
1.3
2.3
4.3
0.3 4.9
0.5
0.6
1.7
2.2
1.3
1.8
3.2
1.1
1.6
0.6 0.2
0.3
0.6
0.2
0.3
0.1
0.1
0.6
0.2
0.4
Fig 1. Patient Flow (Process Map) at inter-ward resolution. For example, during theperiod over which the flow was calculated (August 2004), 326 patients arrived to the EDper day on average, and 18.3 transferred from the ED to Surgery. (To avoid clutter, arcswith monthly flow below 4 patients were filtered out; Created by SEEGraph, at the TechnionSEELab.)
imsart-ssy ver. 2013/03/06 file: "Short_Patient flow main".tex date: December 29, 2013

PATIENT FLOW IN HOSPITALS 7
delbaum, Sakov and Zeltyn (2000) and Brown et al. (2005) for the empiricalfindings, and Gans, Koole and Mandelbaum (2003) and Aksin, Armony andMehrotra (2007) for surveys on follow-up work).
1.3. Apologies to the Statistician. We conclude our EDA discussion withtwo “apologies” to the Statistician. Firstly, the goals of the present study, itstarget audience and space considerations render secondary the role of “rigor-ous” statistical analysis (e.g. hypothesis testing, confidence intervals, modelselection). Indeed, we believe that its intentional omission is both necessaryand justified. Accordingly, we either mention a statistical rationalizationonly in passing (e.g. for the fact that patients Length-of-Stay (LOS) distri-bution is Log-Normal in resolution of days and it is a mixture of Normaldistributions in an hourly resolution), or we simply content ourselves witha convincing visual evidence (the privilege of having a large data set).
Secondly, our data originates from a single Israeli hospital, operating dur-ing 2004–2008. This raises doubts regarding the generality of the scientificand practical relevance of the present findings, and rightly so. Neverthe-less, other studies of Israeli hospitals (Marmor (2003); Tseytlin (2009) andEV) indicate that these hospitals have many common features. This stillleaves the concern that Israeli hospitals during the considered period areperhaps too “unique”—however, in many significant ways they are not: hos-pitals are slow to change and, more concretely, a parallel recent study by Shiet al. (2012) in a major Singapore hospital, together with other privately-communicated empirical research by colleagues, reveal phenomena that arecommon across hospitals (e.g. the LOS distributions in Figure 9). All in all,our hope is that reading the manuscript will dispel all doubts concerningits broad relevance and significance (practical, statistical and scientific ingeneral).
1.4. Rambam hospital. Our data originates at the Rambam Medical Cen-ter, which is a large Israeli academic hospital. This hospital caters to a pop-ulation of more than two million people, and it serves as a tertiary referralcenter for twelve district hospitals. The hospital consists of about 1000 bedsand 45 medical units, with about 75,000 patients hospitalized annually. Thedata includes detailed information on patient flow throughout the hospi-tal, over a period of several years (2004–2008), and at the resolution levelof Figure 1. In particular, the data allows one to follow the paths of indi-vidual patients throughout their stay at the hospital, including admission,discharge, and transfers between hospital units.
Traditionally, hospital studies have focused on individual units, in isola-tion from the rest of the hospital; but this approach ignores interactions
imsart-ssy ver. 2013/03/06 file: "Short_Patient flow main".tex date: December 29, 2013
8 ARMONY ET AL.
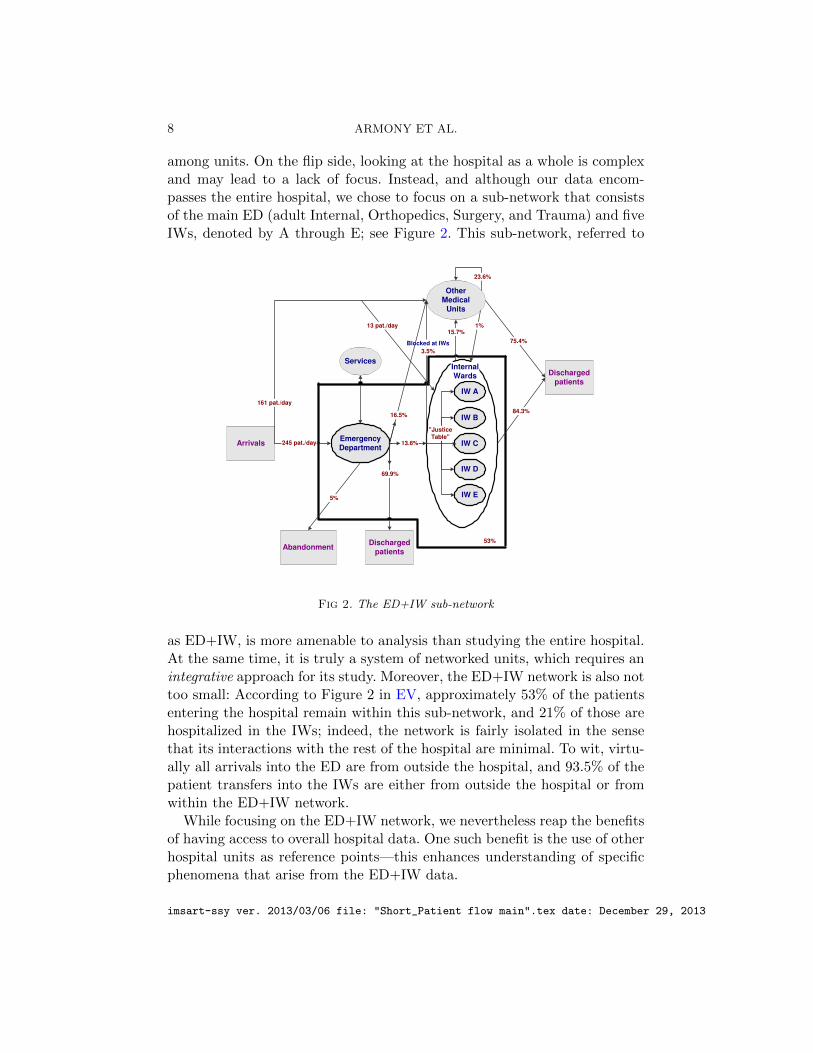
among units. On the flip side, looking at the hospital as a whole is complexand may lead to a lack of focus. Instead, and although our data encom-passes the entire hospital, we chose to focus on a sub-network that consistsof the main ED (adult Internal, Orthopedics, Surgery, and Trauma) and fiveIWs, denoted by A through E; see Figure 2. This sub-network, referred to
ArrivalsEmergencyDepartment
Abandonment
Services
IW A
IW C
IW B
IW D
IW E
Dischargedpatients
Dischargedpatients
InternalWards
OtherMedical
Units
53%
13.6%
"JusticeTable"
Blocked at IWs
3.5%
69.9%
5%
15.7%
23.6%
84.3%
75.4%
245 pat./day
161 pat./day
1%
16.5%
13 pat./day
Fig 2. The ED+IW sub-network
as ED+IW, is more amenable to analysis than studying the entire hospital.At the same time, it is truly a system of networked units, which requires anintegrative approach for its study. Moreover, the ED+IW network is also nottoo small: According to Figure 2 in EV, approximately 53% of the patientsentering the hospital remain within this sub-network, and 21% of those arehospitalized in the IWs; indeed, the network is fairly isolated in the sensethat its interactions with the rest of the hospital are minimal. To wit, virtu-ally all arrivals into the ED are from outside the hospital, and 93.5% of thepatient transfers into the IWs are either from outside the hospital or fromwithin the ED+IW network.
While focusing on the ED+IW network, we nevertheless reap the benefitsof having access to overall hospital data. One such benefit is the use of otherhospital units as reference points—this enhances understanding of specificphenomena that arise from the ED+IW data.
imsart-ssy ver. 2013/03/06 file: "Short_Patient flow main".tex date: December 29, 2013

PATIENT FLOW IN HOSPITALS 9
1.4.1. The ED+IW network. The main ED has 40 beds and it treatson average 245 patients daily. An internal patient, whom an ED physiciandecides to hospitalize, is directed to one of the five Internal wards. The IWshave about 170 beds that accommodate around 1000 patients per month.Internal Wards are responsible for the treatment of a wide range of internalconditions, thus providing inpatient medical care to thousands of patientseach year. Wards A–D share more or less the same medical capabilities—each can treat similar (multiple) types of patients. Ward E, on the otherhand, attends to only the less severe (walking) cases; in particular, thisward cannot admit ventilated patients.
1.4.2. Data Description. Rambam’s 2004–2008 patient-level flow dataconsists of 4 compatible “tables”, that capture hospital operations as fol-lows. The first table (Visits) contains records of ED patients, including theirID, arrival and departure times, arrival mode (e.g. independently or by am-bulance), cause of arrival, some demographic data, and more. The secondtable (Justice Table) contains details of the patients that were transferredfrom the ED to the IWs. This includes information on the time of assign-ment from the ED to an IW, the identity of this IW, as well as assignmentcancelations and reassignment times when relevant. The third table (Hospi-tal Transfers) consists of patient-level records of arrivals to and departuresfrom hospital wards. It also contains data on the ward responsible for eachpatient as, sometimes, due to lack of capacity, patients are not treated inthe ward that is clinically most suitable for them; hence, there could be adistinction between the physical location of a patient and the ward thatis clinically in charge of that patient. The last table (Treatment) containsindividual records of first treatment time in the IWs. Altogether, our dataconsists of over one million records, which has enabled the presently reportedEDA and more.
1.5. Some hints to the literature. Patient flow in hospitals has been stud-ied extensively. Readers are referred to the many papers in Hall (2006) andthe recent Shi et al. (2012)—both providing leads to further references. Inthe present subsection, we merely touch on published work, along the threedimensions that are most relevant for our study: a network view, queueingmodels and data-based analysis. Many additional references to recent andongoing research, on particular issues that arise throughout the paper, willbe further cited as we go along. This subsection concludes with what can beviewed as “proof of concept”: a description of some existing research thatthe present work and our empirical foundation have already triggered andsupported.
imsart-ssy ver. 2013/03/06 file: "Short_Patient flow main".tex date: December 29, 2013
10 ARMONY ET AL.
Most research on patient flow has concentrated on the ED and how toimprove ED flows in within. There are a few exceptions that offer a broaderview. For example, Cooper et al. (2001) identifies a main source of ED con-gestion to be controlled variability, downstream from the ED (e.g. operating-room schedules that are customized to physician needs rather than beingoperationally optimized). In the same spirit, de Bruin et al. (2007) observesthat “refused admissions at the First Cardiac Aid are primarily caused byunavailability of beds downstream the care chain.” These blocked admissionscan be controlled via proper bed allocation along the care chain of Cardiacin-patients; and to support such allocations, a queueing network model wasproposed, with parameters that were estimated from hospital data. Broad-ening the view further, Hall et al. (2006) develops data-based descriptions ofhospital flows, starting at the highest unit-level (yearly view) down to spe-cific sub-wards (e.g. imaging). The resulting flow charts are supplementedwith descriptions of various factors that cause delays in hospitals, and thensome means that hospitals employ to alleviate these delays. Finally, Shi et al.(2012) develops data-based models that lead to managerial insights on theED-to-Ward transfer process.
There has been a growing body of research that treats operational prob-lems in hospitals with Operations Research (OR) techniques. Brandeau,Sainfort and Pierskalla (2004) is a handbook of OR methods and applica-tions in health care; the part that is most relevant to this paper is its chapteron Health Care Operations Management (OM). Next, Green (2008) surveysthe potential of OR in helping reduce hospital delays, with an emphasison queueing models. Two recent handbooks on System Scheduling and OMin Healthcare are Hall (2012) and Denton (2013)—both include chaptersworth reading and additional leads on OR/OM and queueing perspectivesof patient flow. Of special interest is Chapter 8 in Hall (2012), where Hall de-scribes the challenging reality of bed management in hospitals. Jennings andde Vericourt (2008, 2011) and Green and Yankovic (2011) apply queueingmodels to determine the number of nurses needed in a medical ward. Green(2004) and de Bruin et al. (2009) rely on queueing models such as Erlang-C and loss systems, to recommend bed allocation strategies for hospitalwards. Lastly, Green, Kolesar and Whitt (2007) and Yom-Tov and Mandel-baum (2011) develop (time-varying) queueing networks to help determinethe number of physicians and nurses required in an ED.
There is also an increased awareness of the significant role that data can,and often must, play in patient flow research. For example, Kc and Terwiesch(2009) use econometric methods to investigate the influence of workload onservice time and readmission probability in Intensive Care Units (ICUs).
imsart-ssy ver. 2013/03/06 file: "Short_Patient flow main".tex date: December 29, 2013

PATIENT FLOW IN HOSPITALS 11
This inspired Chan, Yom-Tov and Escobar (2011) to model an ICU as astate-dependent queueing network, in order to gain insight on how speedupand readmission effects influence the ICU.
1.5.1. A proof of concept. The present research has already provided theempirical foundations for several graduate theses, each culminating in oneor several research papers: Marmor (2010) studied ED architectures andstaffing (see Zeltyn et al. (2011) and Marmor et al. (2012)); Yom-Tov (2010)focused on time-varying models with customer returns to the ED (Yom-Tov and Mandelbaum, 2011) and the IWs; Tseytlin (2009) investigated thetransfer process from the ED to the IWs (Mandelbaum, Momcilovic andTseytlin, 2012); Maman (2009) explored over-dispersion characteristics ofthe arrival process into the ED (Maman, Zeltyn and Mandelbaum, 2011);and Huang (2013) develops scheduling controls that help ED physicianschoose between newly-arriving vs. in-process patients, while still adheringto triage constraints (Huang, Carmeli and Mandelbaum, 2011). These areall examples of the EDA-CDA process, alluded to in Subsection 1.2.
2. Emergency Department. Patient flow in the Emergency Depart-ment (ED) is a complex process that involves a multitude of interrelatedsteps (see Figure 8 of EV). This process has been widely investigated, bothacademically (Hall, 2006) and in practice (IHI, 2011; McHugh et al., 2011).We shall hence be content here with its empirical macro view, which al-ready turns out to be highly informative. Specifically, we view the ED as ablack-box, and then highlight interesting phenomena that relate to its pa-tient arrivals, departures, and occupancy counts. Our EDA underscores theimportance of including time- and state- dependent effects in a queueingmodel of the ED. Yet, and albeit this dependence, it also reveals that a sim-ple stationary model may well fit patient-count during periods when the EDis most congested. For limited purposes, therefore, our EDA supports theuse of “black-box” stationary models for the ED, which has been prevalentin the literature (e.g. Green et al. (2006) and de Bruin et al. (2009)).
2.1. Basic facts. Rambam’s main ED attends to 200–250 patients daily:close to 60% are classified as Internal (general) patients and the rest are Sur-gical/Orthopedic, excluding a few per day that suffer from multiple trauma.The ED has three major areas: Trauma acute, Internal acute, and Surgi-cal/Orthopedic acute; some of the patients in the latter two are “Walking”patients that do not require a bed. While there are formally 40 beds in theED, this bed capacity is highly flexible and can be doubled and more. Hencethere is effectively no upper bound on how many patients can simultaneously
imsart-ssy ver. 2013/03/06 file: "Short_Patient flow main".tex date: December 29, 2013

12 ARMONY ET AL.
reside within the ED—either in beds or sitting and waiting. The hospitalhas other EDs, physically detached from the main one discussed here—theseare dedicated to other patient types such as Pediatrics or Ophthalmology.Throughout the rest of our paper we focus on the main ED and simply referto it as the ED. Moreover, within the ED, we focus on Internal (general) pa-tients, in beds or walking: they both constitute the majority of ED patientsand give rise to most operational challenges.
During weekdays, the average length of stay (ALOS) of patients in theED is 4.25 hours: this covers the duration from entry until the decisionto discharge or hospitalize; it does not include boarding time, which is theduration between hospitalization decision to actual transfer. We estimateboarding time to be 3.2 hours on average (See Section 4.2). In addition,10% (5%) of weekday patients experience LOS that is over 8 (11) hours,and about 3–5% leave on their own (LWBS = left without being seen by adoctor, LAMA = left against medical advice, or Absconded = disappearedthroughout the process and are not LWBS or LAMA). Finally, out of the2004–2005 ED patients, around 37% were eventually readmitted; and, over-all, 3%, 11%, and 16% of the patients returned within 2, 14, and 30 days,respectively.
2.2. Exploratory Data Analysis. In this section we highlight some of ourEDA findings that relate to patient arrivals and patient-count distribution.We observe both time- and state-dependent behavior of these entities, someof which are not readily explained by existing queueing models.
2.2.1. Time dependency. As observed also in Green, Kolesar and Whitt(2007), the ED hourly arrival rate varies significantly during the day. InRambam’s ED, it varies by a factor of almost 10; See Figure 3. We alsoobserve a time-lag between the arrival rate and occupancy levels, which isdue to the former changing significantly during a patient LOS (Bertsimasand Mourtzinou, 1997). This lag must be accounted for in staffing recom-mendations (Feldman et al., 2008; Green, Kolesar and Whitt, 2007).
Analyzing the same data, Maman (2009) also found support for the dailyarrival process to fit a time-varying Poisson process, but with heterogeneitylevels across days such that the arrival rate itself must be random (slightlyover-dispersed). Kim and Whitt (2013) identified similar patterns in a largeKorean hospital. The time-varying arrivals contribute to an overall timevarying ED environment, which we focus on next.
2.2.2. Fitting a simple model to a complex reality. Figure 4 (left) shows24 patient-count histograms for internal ED patients, each corresponding to
imsart-ssy ver. 2013/03/06 file: "Short_Patient flow main".tex date: December 29, 2013

PATIENT FLOW IN HOSPITALS 13
0
5
10
15
20
25
30
35
0
3
5
8
10
13
00:00 02:00 04:00 06:00 08:00 10:00 12:00 14:00 16:00 18:00 20:00 22:00
Num
ber o
f Pat
ient
s
Arriv
al R
ate
Time (60 min. resolution)
HomeHospital , Emergency Internal Medicine Unit January 2004 October 2007, All day
Patient Arrivals at Emergency Department Number of Patients in Emergency Department (average)
Fig 3. Average number of patients and arrival rate by hour of the day
a specific hour of the day, with reference (right) to mean patient count, alsoby hour of the day. (Similar shapes arise from total ED patient count—seeFigure 10 in EV.)
The figure displays a clear time-of-day behavior: There are two distinctbell-shaped distributions that correspond to low occupancy (15 patients)during the AM (3–9AM), and high (30 patients) during the PM (12–11PM);with two transitionary periods of low-to-high (9AM–12PM) and high-to-low (11PM–3AM). We refer to these four periods as the four “occupancyregimes”.
0 20 40 60 80
100 120 140 160 180 200 220 240 260 280 300 320 340
0 5 10 15 20 25 30 35 40 45 50 55 60 65 70
Freq
uenc
ies
Number of patients (resolution 1)
HomeHospital Time by ED Internal state (sec.) January 2004-October 2007, All days
[00:00 - 01:00) [01:00 - 02:00) [02:00 - 03:00) [03:00 - 04:00) [04:00 - 05:00) [05:00 - 06:00) [06:00 - 07:00) [07:00 - 08:00) [08:00 - 09:00) [09:00 - 10:00) [10:00 - 11:00) [11:00 - 12:00) [12:00 - 13:00) [13:00 - 14:00) [14:00 - 15:00) [15:00 - 16:00) [16:00 - 17:00) [17:00 - 18:00) [18:00 - 19:00) [19:00 - 20:00) [20:00 - 21:00) [21:00 - 22:00) [22:00 - 23:00) [23:00 - 24:00)
10
15
20
25
30
35
0 2 4 6 8 10 12 14 16 18 20 22
Aver
age
num
ber o
f cas
es
Time (60 min. resolution)
HomeHospital Number of Patients in Emergency Department (average), Emergency Internal Medicine Unit
January 2004-October 2007, All days
Fig 4. Internal ED Occupancy histogram by hour of the day
Interestingly, when asking SEEStat to fit a mixture of three normal dis-
imsart-ssy ver. 2013/03/06 file: "Short_Patient flow main".tex date: December 29, 2013

14 ARMONY ET AL.
tributions to the ED occupancy distribution, the fit algorithm automaticallydetects the low, high and transitionary phases (See Figure 5).
0 250 500 750
1000 1250 1500 1750 2000 2250 2500 2750 3000 3250 3500
0 5 10 15 20 25 30 35 40 45 50 55 60 65 70
Freq
uenc
ies
Number of patients (resolution 1)
HomeHospital Time by ED Internal state (sec.) January 2004-October 2007, All days
Fitting Mixtures of Distributions Normal (26.47%): location = 13 scale = 4.15 Normal (24.17%): location = 20 scale = 6.09 Normal (49.36%): location = 30 scale = 9.84
Early Morning Normal
Intermediate hours Normal PM
Normal
Fig 5. Fitting a mixture of three normal distributions to the ED occupancy distribution
Further EDA (in EV) suggests that, during peak times (PM), when con-trolling for factors such as day-of-the-week, patient type and calendar year,one obtains a good fit for the empirical distribution by a “steady-state” nor-mal distribution with equal mean and variance. Hence, one might speculatethat the underlying system dynamics can be modeled by an M/M/∞ queue,which has a Poisson steady-state (mean=variance). Alternatively, it may alsobe described as an M/M/N+M model with equal service and abandonment(LWBS, LAMA, or Absconded) rates. It follows that one cannot conclusivelyselect a model through its empirical steady-state distribution—which is atrap that is easy to fall into and from which Whitt (2012) saved us.
One is thus led to the relevance-limits of “black-box” ED models: theymay support operational decisions that depend only on total patient countbut not on (and neither do these decisions alter) internal dynamics; or theycan model ED sojourn times within a larger hospital model. If in addition,and following Whitt (2012), a birth-death steady-state model is found ap-propriate for the “black-box”, then its reversibility accommodates also appli-cations that do change total count: for example, ambulance diversion in theface of total count that exceeds a certain threshold, which then truncates thecount to this threshold (and the steady-state distribution is truncated corre-
imsart-ssy ver. 2013/03/06 file: "Short_Patient flow main".tex date: December 29, 2013
PATIENT FLOW IN HOSPITALS 15
spondingly; see Kelly (1979)). On the other hand, black-box models cannotsupport ED staffing (e.g. Yom-Tov and Mandelbaum (2011) acknowledgessome internal network dynamics), or ambulance diversion that depends onthe number of boarding patients (awaiting hospitalization). We discuss thisfurther in Section 2.3.
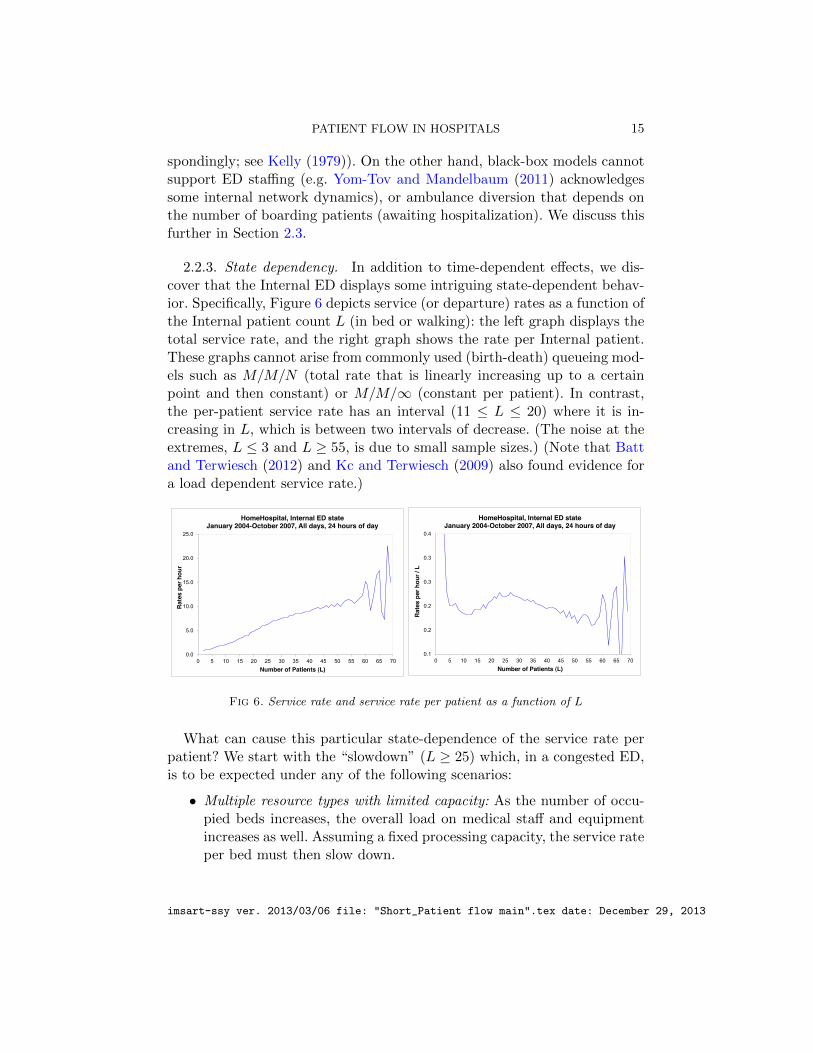
2.2.3. State dependency. In addition to time-dependent effects, we dis-cover that the Internal ED displays some intriguing state-dependent behav-ior. Specifically, Figure 6 depicts service (or departure) rates as a function ofthe Internal patient count L (in bed or walking): the left graph displays thetotal service rate, and the right graph shows the rate per Internal patient.These graphs cannot arise from commonly used (birth-death) queueing mod-els such as M/M/N (total rate that is linearly increasing up to a certainpoint and then constant) or M/M/∞ (constant per patient). In contrast,the per-patient service rate has an interval (11 ≤ L ≤ 20) where it is in-creasing in L, which is between two intervals of decrease. (The noise at theextremes, L ≤ 3 and L ≥ 55, is due to small sample sizes.) (Note that Battand Terwiesch (2012) and Kc and Terwiesch (2009) also found evidence fora load dependent service rate.)
0.0
5.0
10.0
15.0
20.0
25.0
0 5 10 15 20 25 30 35 40 45 50 55 60 65 70
Rate
s pe
r hou
r
Number of Patients (L)
HomeHospital, Internal ED state January 2004-October 2007, All days, 24 hours of day
0.1
0.2
0.2
0.3
0.3
0.4
0 5 10 15 20 25 30 35 40 45 50 55 60 65 70
Rate
s pe
r hou
r / L
Number of Patients (L)
HomeHospital, Internal ED state January 2004-October 2007, All days, 24 hours of day
Fig 6. Service rate and service rate per patient as a function of L
What can cause this particular state-dependence of the service rate perpatient? We start with the “slowdown” (L ≥ 25) which, in a congested ED,is to be expected under any of the following scenarios:
• Multiple resource types with limited capacity: As the number of occu-pied beds increases, the overall load on medical staff and equipmentincreases as well. Assuming a fixed processing capacity, the service rateper bed must then slow down.
imsart-ssy ver. 2013/03/06 file: "Short_Patient flow main".tex date: December 29, 2013
16 ARMONY ET AL.
• Psychological: Medical staff could become emotionally overwhelmed,to a point that exacerbates slow down (Sullivan and Baghat, 1992).• Choking: Service slowdown may also be attributed to so-called resource
“choking”: medical staff becomes increasingly occupied with caring forto-be-transferred (boarding) ED patients (who create work while theywait and, moreover, their condition could actually deteriorate), thatthey might end up choking off the throughput of the to-be-releasedpatients (see Figure 13 in Section 4.3). The choking phenomenon is wellknown in other environments such as transportation (Chen, Jia andVaraiya, 2001) and telecommunications (Gerla and Kleinrock, 1980)where it is also referred to as throughput degradation.• Time dependency and patient heterogeneity: Finally, slowdown as well
as speedup may be attributed to the combination of time dependentarrivals and heterogenous patient mix (Marmor et al., 2011). We nowexpand on the speedup effect.
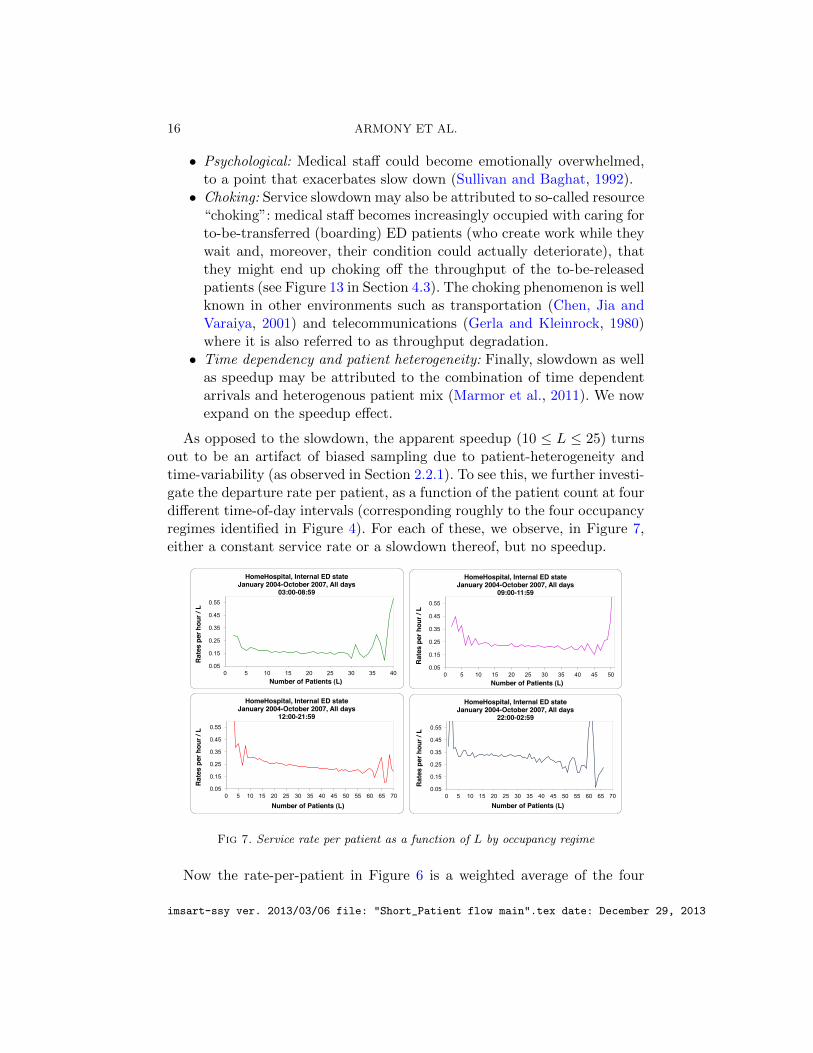
As opposed to the slowdown, the apparent speedup (10 ≤ L ≤ 25) turnsout to be an artifact of biased sampling due to patient-heterogeneity andtime-variability (as observed in Section 2.2.1). To see this, we further investi-gate the departure rate per patient, as a function of the patient count at fourdifferent time-of-day intervals (corresponding roughly to the four occupancyregimes identified in Figure 4). For each of these, we observe, in Figure 7,either a constant service rate or a slowdown thereof, but no speedup.
0.05
0.15
0.25
0.35
0.45
0.55
0 5 10 15 20 25 30 35 40
Rate
s pe
r hou
r / L
Number of Patients (L)
HomeHospital, Internal ED state January 2004-October 2007, All days
03:00-08:59
0.05
0.15
0.25
0.35
0.45
0.55
0 5 10 15 20 25 30 35 40 45 50
Rate
s pe
r hou
r / L
Number of Patients (L)
HomeHospital, Internal ED state January 2004-October 2007, All days
09:00-11:59
0.05
0.15
0.25
0.35
0.45
0.55
0 5 10 15 20 25 30 35 40 45 50 55 60 65 70
Rate
s pe
r hou
r / L
Number of Patients (L)
HomeHospital, Internal ED state January 2004-October 2007, All days
12:00-21:59
0.05
0.15
0.25
0.35
0.45
0.55
0 5 10 15 20 25 30 35 40 45 50 55 60 65 70
Rate
s pe
r hou
r / L
Number of Patients (L)
HomeHospital, Internal ED state January 2004-October 2007, All days
22:00-02:59
Fig 7. Service rate per patient as a function of L by occupancy regime
Now the rate-per-patient in Figure 6 is a weighted average of the four
imsart-ssy ver. 2013/03/06 file: "Short_Patient flow main".tex date: December 29, 2013

PATIENT FLOW IN HOSPITALS 17
graphs of Figure 7. But these weights are not constant as a function of thepatient count, as seen in Figure 8. Moreover, the service rate as a functionof patient count varies at different times of the day. So what appears to bea speedup (increasing graph) is merely a weighted average of non-increasinggraphs with state-dependent weights.
0.06
0.16
0.26
0.36
10 12 14 16 18 20 Serv
ice
rate
s pe
r hou
r / L
Number of Patients (L)
HomeHospital, Internal ED state January 2004-October 2007, All days
Total - 24 hours of day 12:00 to 21:59 03:00 to 08:59 09:00 to 11:59 22:00 to 02:59
0.0
0.1
0.2
0.3
0.4
0.5
0.6
0.7
10 12 14 16 18 20
Rela
tive
Freq
uenc
y
Number of Patients (L)
HomeHospital, Internal ED state January 2004-October 2007, All days
12:00-21:59 03:00-08:59 09:00-11:59 22:00-02:59
Fig 8. Service rate as a function of 10 ≤ L ≤ 20 and Relative frequency (weight) ofoccupancy regime per L
2.3. Research Opportunities. Our EDA leaves many open questionsfor further exploration. For example: What is the source for the unique shapeof the time dependent arrival pattern, which is common in many servicesystems (including hospitals across the globe and call centers)? What is thedominant factor in explaining the slowdown in service rate per patient, andwhat can be done to alleviate this slowdown? Considering time and statedependency, how does one separate these two effects? Which one is moredominant and under what circumstances?
The observations in this section raise some broader research directionswithin a few (somewhat overlapping) model dimensions: granularity, perfor-mance metrics, and applications.
• Model granularity: Our focus in this section has been on overall ED(Internal) patient count. This aggregates ED dynamics into merelyarrivals and departures which, as described in Subsection 2.2.2, yieldsa useful black-box model but of a limited scope. In contrast, one couldconsider a micro-level that acknowledges explicitly all events withinthe ED, for example events arising during patient routes, service timesand resources utilization—more on that momentarily.The macro- and micro-models are two extreme cases of model gran-ularity, with a range of levels in between (e.g. Yom-Tov and Man-delbaum (2011), Huang, Carmeli and Mandelbaum (2011), and Mar-
imsart-ssy ver. 2013/03/06 file: "Short_Patient flow main".tex date: December 29, 2013
18 ARMONY ET AL.
mor et al. (2012)). In addition, one may also use a combination ofthe macro-micro models where various black boxes serve as analyticalnodes within an elaborate system.The granularity level to be used depends on target application, avail-ability of data and analytical techniques. Put differently, what kind ofoperational decisions require which model granularity? And more con-cretely, for our proposed “blackbox” model—what are the purposesfor which this simple model is sufficient and what are this model’slimitations?• Performance metrics: There are numerous ED performance metrics
that have not been discussed here or have merely been touched upon.These pertain to time-till-first-consultation, length of stay (LOS), causesof operational delays (scarce resources, synchronization gaps), aban-donment types (LWBS, LAMA, absconded), readmissions, workloadsand offered load, bed utilization, boarding times, staff-to-bed ratios,and customers who are blocked upon their ED arrival (e.g. ambulancediversion) or departure (boarding). Of special importance are ED con-gestion metrics (Hwang et al. (2011) lists over 70), which have givenrise to prevalent crowding indices (e.g. Bernstein et al. (2003); Hootet al. (2007)).Metrics must be assigned units, be measured (often a challenge) or beestimated. As an example for the latter, (im)patience of LWBS patients(i.e. the time these patients are willing to wait before leaving) is ob-served only if patients announce their departure. Otherwise patientsare either served, in which case their waiting time provides a lowerbound for their (im)patience, or they are discovered missing whencalled for service, which provides an upper bound. Statistical infer-ence of ED (im)patience therefore requires novel models and methods:these would combine current-status (Sun, 2006) and survival-analysis(Brown et al., 2005) setups—in the latter, abandonment times areobserved, while they are not in the former.• Applications: Applications of queueing models for ED patient flow in-
clude the following categories: ED design, capacity sizing, staffing (e.g.,Yom-Tov and Mandelbaum (2011)), and flow control (e.g., Allon, Deoand Lin (2010); Dobson, Tezcan and Tilson (2013); Hagtvedt et al.(2009); Huang, Carmeli and Mandelbaum (2011)).An outcome of ED design is flow architecture (Marmor et al., 2012).Related examples that would enjoy research are operational (fast-track) vs. clinical priorities (see also Zeltyn et al. (2011)), physician-led triage vs. the prevalent nurse-led (Burstrom et al., 2012; Oredsson
imsart-ssy ver. 2013/03/06 file: "Short_Patient flow main".tex date: December 29, 2013

PATIENT FLOW IN HOSPITALS 19
et al., 2011), and the creation of a dedicated sub-ED (e.g. for patientswith chest-pain; Zalenski et al. (1998)).An important broader challenge is the evaluation of ED (EmergencyDepartment) vs. ER (Emergency Room) designs: the former functionsas a bonafide hospital ward that provides treatment to most patients,while the latter is mainly a router to hospital wards, which treatsscarcely few. A final challenge is to model information within the ED.Indeed, ED processes are geared towards accumulation of information,up to a level that suffices to support the final decision of discharge vs.admit; and the tradeoff in these processes is the classical exploration(e.g. administer new tests or additional treatment) vs. exploitation (i.e.make a final decision based on the current information); see Gittins,Glazebrook and Weber (2011) and Huang, Carmeli and Mandelbaum(2011).
3. Internal Wards. Internal Wards (IWs), often referred to as Gen-eral Internal Wards or Internal Medicine Wards, are the “clinical heart” of ahospital. Yet, relative to EDs, Operating Rooms and Intensive Care Units,IWs have received less attention in the Operations literature; this is hardlyjustified. IWs and other medical wards offer a rich environment in needof OR/OM research, which our EDA can only tap: it has revealed multipletime-scales of LOS, intriguing phenomena of scale-diseconomies and coexist-ing operational-regimes of resources (beds, physicians). These characteristicsare attributed to IW inflow design, capacity management and operationalpolicies (e.g. discharge procedures, physician rounds).
3.1. Basic facts. Rambam hospital has five Internal wards. Wards A–D are identical from a clinical perspective; the patients treated in thesewards share the same array of clinical conditions. Ward E is different inthat it admits only patients of less severe conditions. Table 1 summarizesthe operational profiles of IWs. For example, bed capacity ranges from 24to 45 beds and Average LOS (ALOS) from 3.9 to 6 days.
IWs B and E are by far the smallest (least number of beds) and the“fastest” (shortest ALOS, highest throughput). The superior operationalperformance of IW E is to be expected as it treats the clinically simplestcases. In contrast, the “speed” of IW B is not as intuitive because this wardis assigned the same patient mix as IWs A,C, and D.
A shorter ALOS could reflect a more efficient clinical treatment or, al-ternatively, a less conservative discharge policy. Either must not arise fromclinically premature discharges of patients, which would hurt patients qual-
imsart-ssy ver. 2013/03/06 file: "Short_Patient flow main".tex date: December 29, 2013

20 ARMONY ET AL.
Table 1Internal wards operational profile
Ward A Ward B Ward C Ward D Ward E
Average LOS (days) 6.0 3.9 4.9 5.1 3.7(STD) (7.9) (5.4) (10.1) (6.6) (3.3)
Mean occupancy level 97.7% 94.4% 86.7% 96.9% 103.2%
Mean # patients per month 206.3 193.5 209.7 216.5 178.7
Standard (maximal) 45 (52) 30 (35) 44 (46) 42 (44) 24capacity (# beds)
Mean # patients per bed 4.58 6.45 4.77 5.16 7.44per month
Readmission rate 10.6% 11.2% 11.8% 9.0% 6.4%(within 1 month)
Data refer to period May 1, 2006–October 30, 2007 (excluding the months1-3/2007, when Ward B was in charge of an additional 20-bed sub-ward).
ity of care. To get a grasp on that quality, we use its operational (accessi-ble hence common) proxy, namely patient readmission rate (proportion ofpatients who are re-hospitalized within a pre-specified period of time: onemonth in our case). In Table 1 we observe that the readmission rate of IWB is comparable to the other wards. Moreover, patient surveys by Elkin andRozenberg (2007) indicated that satisfaction levels do not differ significantlyacross wards. We conclude that IW B appears to be operationally superioryet clinically comparable to the other wards. This fact may be attributed tothe smaller size of IW B, which we return to later in Section 3.3.3.
3.2. EDA: LOS—a story of multiple time scales. In this section, we ex-amine the distribution of the LOS in the IWs. While it is to be expectedthat clinical conditions affect patients LOS, the influence of operational andmanagerial protocols is less obvious. It turns out that some of this influencecan be uncovered by examining the LOS distribution at the appropriate timescale.
Figure 9 shows the LOS distribution in IW A, in two time scales: daysand hours. At a daily resolution, the Log-Normal distribution turns outto fit the data well. It does so also in other service systems though anexplanation for its prevalence is still lacking (Brown et al., 2005). Whenconsidering an hourly resolution, however, a completely different distributionshape is observed: there are peaks that are periodically 24 hours apart, whichcorresponds to a mixture of daily distributions. (We found that a normalmixture fits usefully well, as depicted by the 7 normal mixture-componentsover the range of 0–150 hours in Figure 9.)
imsart-ssy ver. 2013/03/06 file: "Short_Patient flow main".tex date: December 29, 2013

PATIENT FLOW IN HOSPITALS 21
0 1 2 3 4 5 6 7 8 9
10 11 12 13 14 15 16
0 1 2 3 4 5 6 7 8 9 10 11 12 13 14 15 16 17 18 19 20
Rela
tive
frequ
enci
es %
Time (1 day resolution)
HomeHospital Patient length of stay in Ward (days) (by ward_department), Internal Medicine A
January 2004-October 2007, All days
Empirical Lognormal (mu=1.38 sigma=0.83)
Empirical: N = 8934, mean = 5.7, std = 6.3 Lognormal: mean = 5.6, std = 5.6
0.0
0.1
0.2
0.3
0.4
0.5
0.6
0.7
0.8
0.9
1.0
1.1
0 24 48 72 96 120 144 168 192 216 240 264 288 312 336 360
Rela
tive
frequ
enci
es %
Time (1 hour resolution)
HomeHospital Patient length of stay in Ward (hours) (by ward_department), Internal Medicine A January 2004 - October 2007, all days
Fitting Mixtures of Distributions
Empirical Total Normal Normal Normal Normal Normal Normal Normal
Fig 9. LOS distribution of IW A in two time-scales: daily and hourly
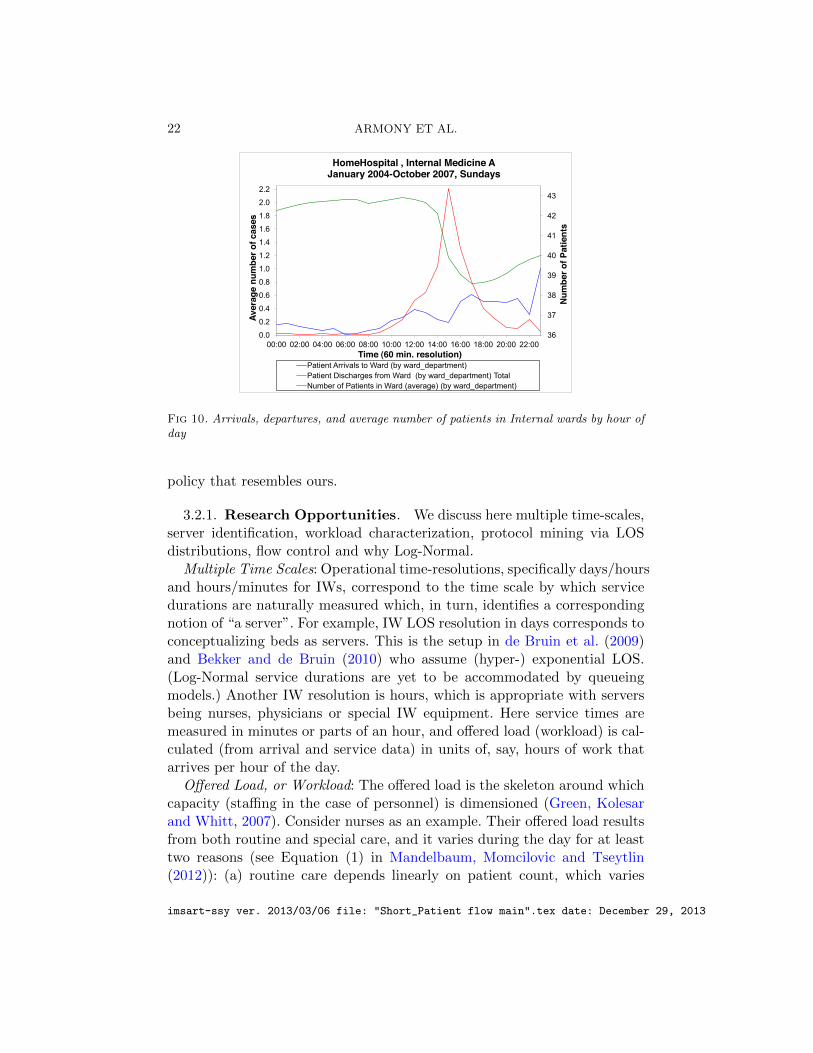
These two graphs reveal the impact of two operational protocols: Thedaily time scale represents physician decisions, made every morning, onwhether to discharge a patient on that same day or to extend hospitalizationby at least one more day. The second decision is the hour-of-day at whichthe patient is actually discharged. This latter decision is made according tothe following discharge process: It starts with the physician who writes thedischarge letters (after finishing the morning rounds); then nurses take careof paperwork, instructing patients (and their families) on how to continuemedical treatment after discharge, and then arranging for transportation (ifneeded). The discharge procedure is performed over “batches” of patientsand, hence, takes a few hours. The result is a relatively low variance ofthe discharge time, as most patients are released between 3pm and 4pm—see Figure 10; which yields an explanation for the observed peaks that arespaced 24 hours apart. The variation around these peaks is determined bythe arrival process: patients are hospitalized in IWs almost exclusively overa 12-hour period (10am–10pm), with a peak in arrival rate between 3pm–7pm (Figure 10). Following similar observations in a Singaporean hospital,Shi et al. (2012) offer a 2-time-scale mathematical model that supports ourEDA.
Note that the arrival process to the IWs is mostly a departure processfrom the ED, and hence the timing of its peak (3pm–7pm) is naturallycoupled with IW discharge peaks (3pm–4pm). In other words, and as furtherdiscussed in Section 5, the discharge policy from IWs significantly influencesED congestion. This led Shi et al. (2012) to propose flow-stabilization asa means for reducing ED congestion, which is caused by a ward discharge
imsart-ssy ver. 2013/03/06 file: "Short_Patient flow main".tex date: December 29, 2013
22 ARMONY ET AL.
36
37
38
39
40
41
42
43
0.0
0.2
0.4
0.6
0.8
1.0
1.2
1.4
1.6
1.8
2.0
2.2
00:00 02:00 04:00 06:00 08:00 10:00 12:00 14:00 16:00 18:00 20:00 22:00
Num
ber o
f Pat
ient
s
Aver
age
num
ber o
f cas
es
Time (60 min. resolution)
HomeHospital , Internal Medicine A January 2004-October 2007, Sundays
Patient Arrivals to Ward (by ward_department) Patient Discharges from Ward (by ward_department) Total Number of Patients in Ward (average) (by ward_department)
Fig 10. Arrivals, departures, and average number of patients in Internal wards by hour ofday
policy that resembles ours.
3.2.1. Research Opportunities. We discuss here multiple time-scales,server identification, workload characterization, protocol mining via LOSdistributions, flow control and why Log-Normal.
Multiple Time Scales: Operational time-resolutions, specifically days/hoursand hours/minutes for IWs, correspond to the time scale by which servicedurations are naturally measured which, in turn, identifies a correspondingnotion of “a server”. For example, IW LOS resolution in days corresponds toconceptualizing beds as servers. This is the setup in de Bruin et al. (2009)and Bekker and de Bruin (2010) who assume (hyper-) exponential LOS.(Log-Normal service durations are yet to be accommodated by queueingmodels.) Another IW resolution is hours, which is appropriate with serversbeing nurses, physicians or special IW equipment. Here service times aremeasured in minutes or parts of an hour, and offered load (workload) is cal-culated (from arrival and service data) in units of, say, hours of work thatarrives per hour of the day.
Offered Load, or Workload: The offered load is the skeleton around whichcapacity (staffing in the case of personnel) is dimensioned (Green, Kolesarand Whitt, 2007). Consider nurses as an example. Their offered load resultsfrom both routine and special care, and it varies during the day for at leasttwo reasons (see Equation (1) in Mandelbaum, Momcilovic and Tseytlin(2012)): (a) routine care depends linearly on patient count, which varies
imsart-ssy ver. 2013/03/06 file: "Short_Patient flow main".tex date: December 29, 2013

PATIENT FLOW IN HOSPITALS 23
over a day (Figure 10), and (b) admission and discharge of patients requireadditional work beyond routine, and it is more frequent during some hoursthan others (Figure 10). Combining both of these time variations, it is clearthat staffing levels must (and actually do) vary during the day, hence theimportance of observing and understanding the system in hourly resolution.As mentioned above, some efforts to develop queueing models for nursestaffing in medical wards have been carried out by Jennings and de Vericourt(2011), Green and Yankovic (2011) and Yom-Tov (2010). However, theseworks neither explain or incorporate the LOS distribution observed in ourdata, nor do they distinguish between routine, admission, and dischargeworkload. Even such a distinction might not be rich enough: indeed, thehospital environment calls for a broader view of workload, which we discussin Section 6.2.
LOS and Protocols: LOS or Delay distributions encapsulate importantoperational characteristics, and can hence be used to suggest, measure ortrack improvements. Consider, for example, the hourly effect of IW LOS(Figure 9), which is due to IW discharge protocols. It calls for an effort inthe direction of smoothing IW discharge rates over the day (Shi et al., 2012).Or differences in shape of LOS distribution between two Maternity wards(§4.2.1 in EV), which result from differing patient mix, suggests the redesignof routing protocols towards a more balanced workload (Plonski et al., 2013).Queueing models are natural for analyzing the interplay between LOS distri-butions and operational protocols, the latter being the drivers of operationalperformance. This leads to open data-based questions in two directions: ei-ther incorporating protocols (e.g. patient priorities, resource scheduling) inqueueing models and validating the theoretical LOS distribution againstdata (performance); or, conversely, mining protocols from data. We nowgive two examples, one for each of the two directions.
Flow Control: How will changes in the IW discharge process influence thesystem? For example, would the balancing of discharges, more uniformlyover the day, benefit the entire hospital? How would such a change influencedelays of patients waiting to be transferred into the IW from the ED? Thisconnection between ED boarding and ward discharges was explored by Shiet al. (2012). We return to it in Section 5.
Why Log-Normal? A long-standing challenge is to explain the prevalenceof Log-Normal as a distribution of service durations (e.g. IW LOS in dayshere, or durations of telephone calls in Brown et al. (2005)). Is Log-normalitydue to service protocols? It is perhaps an inherent attribute of customer ser-vice requirements? Note that Log-Normal has an intrinsic structure that isboth multiplicative—its logarithm is a central limit, and additive—it is in-
imsart-ssy ver. 2013/03/06 file: "Short_Patient flow main".tex date: December 29, 2013
24 ARMONY ET AL.
finitely divisible, being an integral against a Gamma process (Thorin, 1977).Can these properties help one explain the empirical Log-Normal service timedistribution?
3.3. EDA: Operational regimes and economies of scale. An asymptotictheory of many-server queues has been developed in recent years (Gans,Koole and Mandelbaum (2003) can serve as a starting point), which hashighlighted three main operational regimes: Efficiency Driven (ED), QualityDriven (QD) and Quality & Efficiency Driven (QED). The ED-regime pri-oritizes resource efficiency: servers are highly utilized (close to 100%), whichresults in long waits for service. In fact, waiting durations in the ED regimeare at least in the order of service times. In the QD regime, the emphasisis on the operational quality of service: customers hardly wait for service,which requires that servers be amply staffed and thus available to serve.Finally, the QED regime carefully balances service quality and server effi-ciency, thus aiming at high levels of both and achieving it in systems thatare large enough. For example, in well-run call centers, server utilizationcould exceed 90% while, at the same time, about half of the customers areserved without delay, and those delayed wait one order of magnitude lessthan their service duration (seconds vs. minutes). The QED regime also ex-hibits economies of scale in the sense that, as the system grows, operationalperformance improves (e.g. less wait and less abandonment, under equalworkload per server).
Many-server queueing theory is based on asymptotic analysis, as the num-ber of servers grows indefinitely. Nevertheless, QED theory has been foundvaluable also for small systems (few servers) that are not exceedingly over-loaded. This robustness to system size is due to fast rates of convergence(Janssen, van Leeuwaarden and Zwart, 2011) and, significantly, it rendersQED theory relevant to healthcare systems (Jennings and de Vericourt,2011; Yom-Tov and Mandelbaum, 2011). One should mention that, prior tothe era of many-server theory, asymptotic queueing theory was mostly con-cerned with relatively small systems—that is few servers that are too over-loaded for QED to be applicable (e.g. hours waiting time for service times ofminutes). This regime is nowadays referred to as conventional heavy-traffic(Chen and Yao, 2001) and, at our level of discussion, it is convenient toincorporate it into the ED-regime.
In the following subsection, we seek to identify the operational regimethat best fits the IWs. We then investigate (§3.3.3) the existence of theeconomies-of-scale phenomenon in the hospital environment. We shall ar-gue that, although IW beds plausibly operate in the QED regime, there is
imsart-ssy ver. 2013/03/06 file: "Short_Patient flow main".tex date: December 29, 2013

PATIENT FLOW IN HOSPITALS 25
nevertheless evidence for diseconomies of scale.
3.3.1. In what regime do IWs operate? Can QED- and ED-regimes co-exist?. We start by identifying the operational regimes that are relevant toour system of IWs. This system has multiple types of servers (beds, nurses,physicians, medical equipment), and each must be considered separately.Here we focus on beds and physicians.
We argue that IW beds operate (as servers) in the QED regime. To sup-port this statement, we first note that our system of IWs has many (10’s)beds/servers. Next we consider three of its performance measures: (a) bedoccupancy levels; (b) fraction of patients that are hospitalized in non-IWswhile still being under the medical care of IW physicians (patients who wereblocked from being treated in IWs due to bed scarcity); (c) ratio betweenwaiting time for a bed (server) and LOS (service time).
Considering data from the year 2008, we find that 3.54% of the ED pa-tients were blocked, the occupancy level of IW beds was 93.1%, and patientswaited hours (boarding) for service that lasted days (hospitalization). Suchoperational performance is QED—single digit blocking probability, 90+%utilization and waiting duration that is one order of magnitude less than ser-vice. Preliminary formal analysis, carried out in Section 4.3.1 of EV, demon-strates that QED performance of a loss model (Erlang-B, as in de Bruin et al.(2009)) usefully fits these operational performance measures of the IWs.
Turning to physicians as servers, we argue that they operate in the EDregime (conventional heavy traffic). This is based on the following observa-tion: from 4pm to 8am on the following morning, there is a single physicianon duty in each IW, and this physician admits the majority of new patientsof the day. Therefore, patients that are admitted to an IW (only if there isan available bed) must wait until both a nurse and the physician on call be-come available. The admission process by the physician lasts approximately30 minutes, and waiting time for physicians is plausibly hours (it takes anaverage of 3.2 hours to transfer a patient from the ED to the IWs; see Section4.2). Performance of physicians is therefore Efficiency Driven.
3.3.2. Research Opportunities. We identified two operational regimes,QED and ED, that coexist within the ED+IW: waiting in the ED for IW ser-vice. What queueing models and operational regimes can valuably capturethis reality? Note that such models must accommodate three time scales:minutes for physician treatment, hours for transfer delays, and days for hos-pitalization LOS. Some questions that naturally arise are the following: Howdo the regimes influence each other? Can we assume that the “bottleneck”of the system is the ED resource (physicians)? Thus, can one conclude that
imsart-ssy ver. 2013/03/06 file: "Short_Patient flow main".tex date: December 29, 2013

26 ARMONY ET AL.
adding physicians is necessary for reducing transfer delays, while adding bedswould have only a marginal impact on these delays? (Note that bed capac-ity plays the dual role of static capacity—capping the number of patientsthat can be simultaneously hospitalized, and dynamic capacity—serving asa proxy for the processing capacity of medical personnel.) How would achange of physician priority influence the system, say giving higher priorityto incoming patients (from the ED) over the already hospitalized (in theIWs)? Does the fact that physicians operate in the ED-regime eliminate theeconomies of scale that one expects to find in QED systems? Empirical ob-servations that will now be presented suggest that this might indeed be thecase.
3.3.3. Diseconomies of scale (or how ward size affects LOS). Our data(Table 1) exhibits what appears to be a form of diseconomies of scale: asmaller ward (IW B) has a relative workload that is comparable to thelarger wards, yet it enjoys a higher turnover rate per bed and a shorterALOS, with no apparent negative influence on the quality of medical care.The phenomenon is reinforced by observing changes in LOS of IW B, whenthe number of beds in that ward changes. Figure 11 presents changes inALOS and the average patient count, in IWs B and D over the years. During2007, the ALOS of Ward B significantly increased. This was attributed to atemporary capacity increase, over a period of two months, during which IWB was made responsible for 20 additional beds. We observe that, althoughthe same operational methods were used, they seem to work better in asmaller ward. In concert with the latter observation, we note a reduction inALOS of IW D, mainly from 2007 when ward size decreased as a result ofa renovation. One is thus led to conjecture that there are some drawbacksin operating large medical units—e.g. larger wards are more challenging tomanage, at least under existing conditions.
Several factors could limit the blessings of scale economies:
• Staffing policy : It is customary, in this hospital, to assign an IW nurseto a fixed number of beds; then nominate one experienced nurse to be afloater for solving emerging problems and help as needed. This settinggives little operational advantage to large units, if at all: the largerthe unit the less a single floater can help each nurse. The tradeoff thatis raised is between personal care (dedicated servers) vs. operationalefficiency (flexible). This tradeoff has been addressed in queueing mod-els (Aksin, Karaesmen and Ormeci, 2007; Jouini, Dallery and Aksin,2009), and in outpatient medical care (Balasubramanian, Muriel andWang, 2012; Balasubramanian et al., 2010), but inpatient healthcare
imsart-ssy ver. 2013/03/06 file: "Short_Patient flow main".tex date: December 29, 2013

PATIENT FLOW IN HOSPITALS 27
!"#
$""#
$$"#
$%"#
$&"#
$'"#
$("#
$)"#
%"#
%(#
&"#
&(#
'"#
'(#
("#
%""'# %""(# %"")# %""*# %""+#
!"#$%&#'(#)
&*+',-'.*%/'0!(1
.2'
!"#$%&#'345
6#$',-'7%*8#)*9''
:#%$'
!"#$%&#'3456#$',-'7%*8#)*9'%);'!"#$%&#'(1.'8)'<)*#$)%='>%$;9'?'%);'@'6/':#%$'
,-#./#012#13#4567896:# ,-#;/#012#13#4567896:# ,-#./#<=>?# ,-#;/#<=>?#
Fig 11. Average LOS and number of patients in Internal wards B and D by year
will surely add novel idiosyncracies.• Centralized medical responsibility : Ward physicians share the respon-
sibility over all patients. Every morning, the senior physicians, resi-dents, interns, and medical students examine every patient case to-gether (physicians’ rounds) and discuss courses of treatment. This isessential as Rambam hospital is a teaching hospital, and one of its cen-tral missions is the education and training of doctors. Naturally, thelarger the unit the longer its morning round and, consequently, lesscapacity is available for other tasks (e.g. admissions and discharges)—this could lead to a prolonged ALOS.
3.3.4. Research opportunities. In Section 4.3.2 of EV we provide ad-ditional plausible explanations for the observed diseconomies of scale. Thisphenomenon is important to model carefully and understand, as it can sig-nificantly affect decisions on unit sizing and operational strategy. WhileQueueing Theory is well equipped to address the operational dimensions ofsuch decisions, it will have to collaborate with other disciplines such as or-ganizational behavior for complete comprehension. Now suppose one takessize differences among wards as a given fact (e.g. due to space constraintsthat cannot be relaxed). Then the following question arises: What protocolshould be used to route patients from the ED to the wards, in order to fairlyand efficiently distribute workload among them? This challenge is directlyrelated to the process of transferring patients from the ED to the IWs, whichis our next subject.
4. Transfer from the ED to IWs. The “ED-to-IW” process is thechannel of hospitalization for 21% of the Internal ED patients. We focus on
imsart-ssy ver. 2013/03/06 file: "Short_Patient flow main".tex date: December 29, 2013

28 ARMONY ET AL.
a problem that commonly arises in this process—long patient waiting timesin the ED for a transfer to the IWs—and discuss its influence on patientsand staff. We view the process in the context of flow control, where patientsare routed from the Emergency Department to Internal Wards.
Routing in hospitals differs from other service systems for various reasonsincluding incentive schemes, customers’ (patients’) limited control (oftenbordering on helplessness), and the timing of the routing decision. Thus,although the transfer process involves routing-related issues similar to thosethat have been looked at extensively in the queueing literature, our dataindicate that unusual system characteristics significantly affect delays andfairness features in a hospital setting. Studying the transfer process in thissetting leads to many research opportunities.
4.1. Basic facts. We begin with a short description of the patient trans-fer process from the ED to the IWs in Rambam hospital. A patient, whoman ED physician decides to hospitalize in an IW, is assigned to one of thefive wards, according to a certain routing policy (described momentarily).If that ward is full, its staff may ask for reassignment with the approvalof the Head nurse of the hospital. Once the assigned ward is set, the wardstaff prepares for this patient’s arrival. In order for the transfer to start, abed and medical staff must be available, and the bed and equipment mustbe prepared for the patient (including potential rearrangement of currentIW patients). Up to that point, the patient waits in the ED and is underits care and responsibility. If none of the IWs is able to admit the patientwithin a reasonable time, the patient is “blocked”, namely transferred to anon-internal ward. Then the latter undertakes nursing responsibility whilemedical treatment is still obtained from an IW physician.
An integral component of the transfer process is a routing policy, or pa-tients assignment algorithm. As described in Section 3.2, Wards A–D providesimilar medical services, while Ward E treats only the less severe “walking”patients. The similarity between Wards A–D requires a systematic assign-ment scheme of patients to these wards. Rambam hospital determines theassignment via a round-robin (cyclical) order among each patient type (ven-tilated, special care, and regular), while accounting for ward size (e.g. if WardX has twice as many beds as Ward Y, then Ward X gets two assignmentsper one assignment of Y). This scheme is implemented by a computer soft-ware called “The Justice Table”. As the name suggests, the algorithm wasdesigned by the hospital to ensure fair distribution of patient load amongwards, so that staff workload on will be balanced. A survey among 5 ad-ditional hospitals in Israel (EV, Section 5.6) reveals that a cyclical routing
imsart-ssy ver. 2013/03/06 file: "Short_Patient flow main".tex date: December 29, 2013

PATIENT FLOW IN HOSPITALS 29
policy is very common; yet, some hospitals apply alternative assignmentschemes. For example, one hospital uses random assignment by patient ID.Surprisingly, only one of the surveyed hospitals uses an assignment thattakes into account real-time bed occupancy.
4.2. Delays in transfer. As is customary elsewhere, the operational goalof our hospital is to admit ED patients to the IWs within four hours fromdecision of hospitalization. However, the delays are often significantly longer.The waiting-time histogram in Wards A–D for the years 2006-2008 is de-picted in Figure 12. We observe significant delays: while the average delaywas 3.2 hours, 23% of the patients were delayed by more than 4 hours.
!"#
$"#
%!"#
%$"#
&!"#
&$"#
'!"#
%# &# '# (# $# )# *# +# ,# %!#%%#%&#%'#%(#%$#%)#%*#%+#%,#
!"#$%&'"()*"+,
"-./(
0&1"(234,*56(
-./01230.4#
56.7132#839.#
:.;<239#
=>032#
Patient AVG % delay % delayType (STD) ≤ 4 h > 10 h
Regular 3.00 77% 2%(2.53)
Special 3.33 74% 5%Care (3.16)
Ventilated 8.39 41% 41%(6.59)
All Types 3.22 75% 4%(2.98)
Fig 12. Transfer time by patient type, in hours
* Data refer to period 5/1/06–10/30/08 (excluding the months 1–3/07 whenWard B was in charge of an additional sub-ward)
An interesting phenomenon is observed when analyzing transfer delaysby patient types. We note that, on average, ventilated patients wait muchlonger (8.4 hours) than regular and special care patients (average of 3 and3.3 hours respectively)—see Figure 12. In particular, the delay distributionof these ventilated patients is bi-modal with 41% of such patients delayedby more than 10 hours. Ventilated patients must have the highest priorityin transfer but, in reality, many do not benefit from it.
How can it be that many of the ventilated patients experience such longdelays? We observe that the ventilated shorter delays (< 4 hours) havea pattern that resembles that of the other two patient types. The longerdelays are harder to decipher. Possible explanations include: (a) Ventilatedpatients are hospitalized in a sub-ward inside the IW (A–D), often referredto as Transitional (intensive) Care Unit (TCU) (Zhu, Armony and Chan,2013). Each such TCU has only 4–5 beds. The average occupancy rate ofthe TCUs at Rambam hospital is 98.6%; the combination of high occupancy
imsart-ssy ver. 2013/03/06 file: "Short_Patient flow main".tex date: December 29, 2013
30 ARMONY ET AL.
with a small number of beds results in much longer waits during overloadedperiods. (b) Ventilated patients require a highly qualified staff to transferthem to their ward (especially since they are attached to an oxygen source).Coordinating such transfers takes longer.
4.2.1. Research Opportunities. Delays in transfer provide additionalopportunities to those discussed at the end of §3.2.1. First there is the chal-lenge of deciphering protocols—here ED-to-IW routing—from data such asin Figure 12. Then one would like to be able to analyze and optimize patient-flow protocols in queueing models, specifically here fork-join networks withheterogeneous customers. Such models, under the FCFS discipline, wereapproximated in Nguyen (1994). Their control was discussed in Atar, Man-delbaum and Zviran (2012) and Leite and Fragoso (2013).
4.3. Influence of transfer delays on the ED. Patients awaiting transfer(boarding patients) do overload the ED: beds remain occupied while newpatients continue to arrive, and the ED staff remains responsible for thoseboarding patients. Therefore, the ED in fact takes care of two types ofpatients: boarding patients (awaiting hospitalization) and in-process patients(under evaluation or treatment in the ED). Both types may suffer fromtransfer delays.
Boarding patients may experience significant discomfort while waiting:the ED is noisy, it is not private and does not serve hot meals. In ad-dition, ED patients do not enjoy the best professional medical treatmentfor their particular situation, and do not have dedicated attention as inthe wards. Moreover, longer ED stays are associated with higher risk forhospital-acquired infections (nosocomial infections). Such delays may in-crease both hospital LOS and mortality rates, similarly to risks of delaysin ICU transfer (e.g. Chalfin et al. (2007); Long and Mathews (2012); Maa(2011)). Hence, the longer patients wait in the ED, the higher the likelihoodfor clinical deterioration and the lower is their satisfaction.
In-process ED patients may suffer from delays in treatment, as additionalworkload imposed by transfer patients can be significant. Figure 13 showsour estimates of the fraction of time that ED physicians spent caring for thetransfer patients, assuming (the Rambam experience) that every such pa-tient requires 1.5 minutes of physician’s time every 15 minutes. We observethat transfer patients take up to 11% of physician time in the ED. Thisextra workload for the ED staff, that occurs at times when their workloadis already high, results in “wasted” capacity and throughput degradation:a phenomenon that is well acknowledged in transportation (Chen, Jia and
imsart-ssy ver. 2013/03/06 file: "Short_Patient flow main".tex date: December 29, 2013

PATIENT FLOW IN HOSPITALS 31
Varaiya, 2001) and telecommunication (Gerla and Kleinrock, 1980) and dis-cussed earlier in Section 2.2.3.
0
0.02
0.04
0.06
0.08
0.1
0.12
0.14
0.0 0.5 1.0 1.5 2.0 2.5 3.0 3.5 4.0 4.5 5.0
00:00 02:00 04:00 06:00 08:00 10:00 12:00 14:00 16:00 18:00 20:00 22:00
Frac
tion
of L
oad
Num
ber o
f Pat
ient
s
Time (15 min. resolution)
HomeHospital Number of Patients in ED-to-Ward transfer (average) (by physical location),
Department of Internal Medicine January 2004-October 2007, All days
Number of Patients in ED-to-Ward transfer Fraction of Physician Load
Fig 13. Number of patients in ED-to-IW transfer (A–E) and the fraction of time that EDphysicians devote to these patients
To summarize, by improving patient flow from the ED to the IWs, inparticular reducing transfer times, hospitals can improve the service andtreatment provided to both transfer and in-process patients. In turn, re-ducing the workload on the ED will lead to a better response to arrivingpatients and is likely to save lives.
4.3.1. Research Opportunities. The delays in transfer give rise tointeresting research questions. For example:
1. Modeling transfer queue: Transfer patients may be viewed as customerswaiting in queue to be served in the IW. Traditionally, it has been as-sumed that the customers receive service only once they reach the ser-vice station, and not while waiting in queue. In contrast, here a waitingpatient is “served” by both the ED and the IW. In the ED, clinicaltreatment is provided: according to regulations, transfer patients mustbe examined at least every 15 minutes. In the ward, “service” actuallystarts prior to the physical arrival of the patient, when the ward staff,once informed about a to-be-admitted patient, starts preparing for thearrival of this specific patient. The above has implications on modelingthe ED-to-IW process, and it affects staffing, work scheduling, etc.
2. Emergency Department architecture: As described, ED staff takes careof two types of patients: transfer and in-process patients. Each typehas its own service requirements, leading to differing service distribu-tions and differing distribution of time between successive treatments.
imsart-ssy ver. 2013/03/06 file: "Short_Patient flow main".tex date: December 29, 2013

32 ARMONY ET AL.
While transfer patients receive periodic service according to a nearly-deterministic schedule (unless complications arise), in-process serviceis more random.One may consider two options for ED architecture: (a) treat transferand in-process patients together in the same physical location, as isdone at Rambam, or (b) move the transfer patients to a transitionalunit (sometimes called “delay room” or “observation room”), wherethey wait for transfer; this is done, for example, in a Singapore hospi-tal that we were in contact with. Note that using option (b) implieshaving dedicated staff, equipment and space for this unit. The follow-ing question naturally arises: Under what conditions in each of theseED architectures more appropriate?Note that the Singapore hospital architecture is even more complicatedthan (b), as the responsibility for the transfer patients is handed overto IW physicians after a two-hour delay. This provides the IW medicalstaff with an incentive to transfer the patients to the ward, as soon aspossible, where they can be comfortably treated. In EV, Section 5.6,we discuss how different architectures are related to incentive schemesand, in turn, influence delay times.
4.4. Causes of delay. In order to understand the causes of long delays inthe ED-to-IW transfer, we interviewed hospital staff, conducted a time andmotion study, and further explored our data. We have learned that delaysare not only caused by bed unavailability; patients often wait even whenthere are available beds. Indeed, our data show that the fraction of patientswho had an available bed in their designated ward, upon their assignmenttime, was 43%, 48%, 76%, 55%, for Wards A–D, respectively. However, asFigure 12 shows, the probability to be admitted to the wards, immediately(or within a short time) after hospitalization decision, was much smaller. Infact, over the same period of time, only 4.9% of the patients were admittedto an IW within 30 minutes from their assignment to this ward. Our findingsidentify 13 causes for delay, which are summarized in the Cause-and-Effect(Fishbone) diagram depicted in Figure 14. We elaborate here on two thathave interesting modeling aspects.
1. Input-queued vs. Output-queued system: Recall that the preparationfor a particular transfer patient starts in the designated ward, prior tothe actual transfer. This forces the hospital to adopt an output-queuedscheme (Stolyar, 2005), where each patient is first assigned to an IWand then waits until the ward is able to admit. This is in contrast to ascheme in which patients are placed in a “common” queue, are routed
imsart-ssy ver. 2013/03/06 file: "Short_Patient flow main".tex date: December 29, 2013
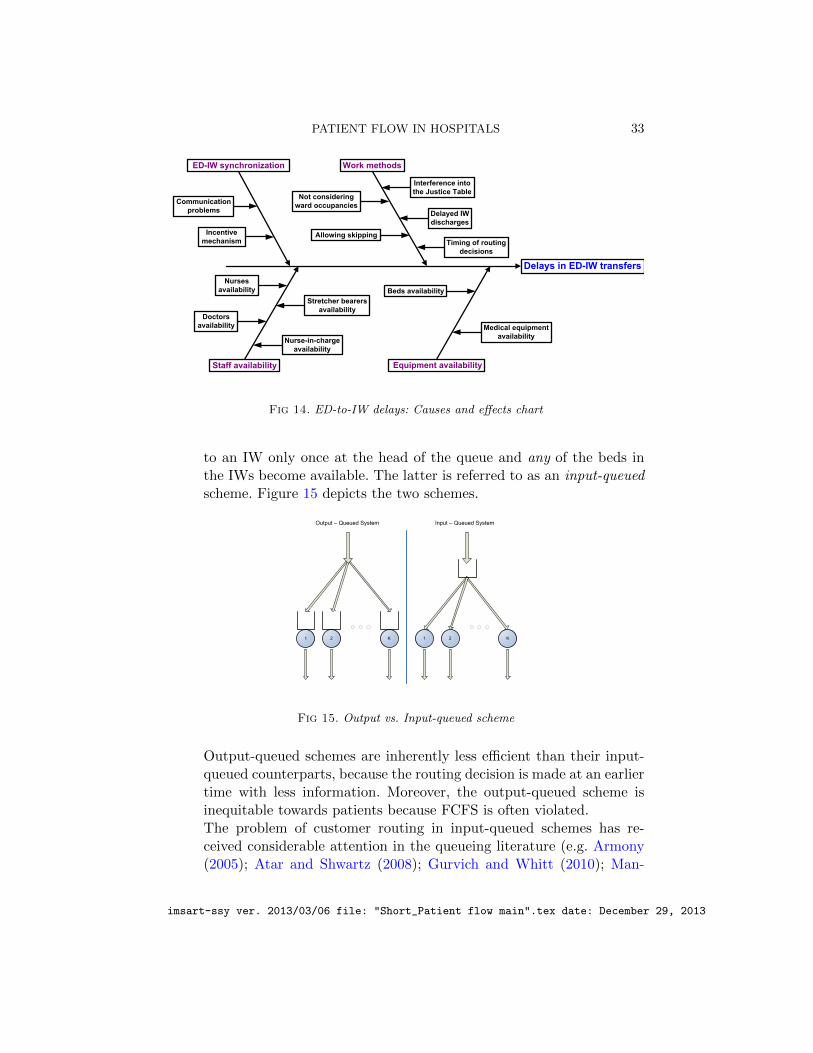
PATIENT FLOW IN HOSPITALS 33
Delays in ED-IW transfers
ED-IW synchronization Work methods
Staff availability Equipment availability
Communicationproblems
Not consideringward occupancies
Allowing skipping
Delayed IWdischarges
Nursesavailability
Doctorsavailability
Stretcher bearersavailability
Nurse-in-chargeavailability
Beds availability
Medical equipmentavailability
Interference intothe Justice Table
Timing of routingdecisions
Incentive mechanism
Fig 14. ED-to-IW delays: Causes and effects chart
to an IW only once at the head of the queue and any of the beds inthe IWs become available. The latter is referred to as an input-queuedscheme. Figure 15 depicts the two schemes.
1 2 K 1 2 K
Fig 15. Output vs. Input-queued scheme
Output-queued schemes are inherently less efficient than their input-queued counterparts, because the routing decision is made at an earliertime with less information. Moreover, the output-queued scheme isinequitable towards patients because FCFS is often violated.The problem of customer routing in input-queued schemes has re-ceived considerable attention in the queueing literature (e.g. Armony(2005); Atar and Shwartz (2008); Gurvich and Whitt (2010); Man-
imsart-ssy ver. 2013/03/06 file: "Short_Patient flow main".tex date: December 29, 2013

34 ARMONY ET AL.
delbaum and Stolyar (2004)). Similar issues in output-queued systemshave been generally overlooked. Exceptions include Stolyar (2005) andTezcan (2008) who establish that the two systems have asymptoticallysimilar performance, in both the conventional and the many-serverheavy traffic regimes. This implies that inefficiencies, which arise inour ED-to-IW process due to the use of an output-queued scheme,become negligible in highly loaded systems. More generally, insightsgained from studying the input-queued systems, as in the above ref-erences, may carry over to the output-queued systems. But how welldoes that insight translate to an environment such as a medical unit?This should be tested empirically, as was done to a certain extent inTseytlin and Zviran (2008).
2. The role of information availability in routing and its influence ontransfer delays: An additional important aspect of routing schemes,which directly affects patient delays, is the availability of informationin the system, at the moment of the routing decision. On the one hand,hospitals may base the routing on no information, namely use a staticrouting policy like round robin. On the other extreme, a full infor-mation policy that takes into account current occupancy levels andprojected future dismissals and transfers is feasible, if the informationsystem is accurate and accommodating enough. It is interesting to in-vestigate the effect of information availability on system performanceand fairness towards patients and medical staff.
4.5. Fairness in the ED-to-IW process. Transfer policies may have ram-ifications on issues related to fairness towards customers (patients) and to-wards servers (medical and nursing staff). We investigate both aspects inthe next several subsections.
4.5.1. Fairness towards patients. In Section 4.4 we pointed out thatoutput-queued schemes lead to diminished patient fairness, as FCFS order isoften violated. (For references on the significance of FCFS in customer jus-tice perception see Mandelbaum, Momcilovic and Tseytlin (2012).) Indeed,our Rambam data indicate that 45% of the ED-to-IW transfer patients were“overtaken” by another patient (see Table 2). Moreover, more than a thirdof those were overtaken by at least three other patients. Although this figureincludes overtaking between patient types, which may be due to clinical con-siderations, within each patient type there were significant FCFS violationsas well. Specifically, 31% were overtaken by at least one patient of the sametype, most of them not within the same ward, and hence these violationsare likely due to the output-queued scheme.
imsart-ssy ver. 2013/03/06 file: "Short_Patient flow main".tex date: December 29, 2013

PATIENT FLOW IN HOSPITALS 35
Table 2Percentage of FCFS violations per type within each IW
IW \ Type Regular Special care Ventilated Total
Ward A 7.57% 7.33% 0.00% 7.37%
Ward B 3.86% 5.72% 0.00% 4.84%
Ward C 7.09% 6.62% 0.00% 6.80%
Ward D 8.18% 7.48% 2.70% 7.81%
Total within wards 6.91% 6.80% 0.67% 6.80%
Total in ED-to-IW 31% 31% 5%
While output-queues are inherently inefficient and unfair, they are un-likely to change in Rambam hospital due to the practical/clinical consid-erations described above, as well as psychological consideration (e.g., earlyward assignment reduces uncertainty which in turn reduces anxiety for pa-tients and their families). The use of output-queues in the ED-to-IW processillustrates some idiosyncrasies of flow control in healthcare.
4.5.2. Research Opportunities. A natural question is how to bestmaintain patient fairness in the output-queued scheme: What routing poli-cies will keep the order close to FCFS? Is FCFS asymptotically maintainedin heavy-traffic?
What other fairness criteria should be considered? Assuming that patientshave preferences (clinical or prior experiences) for a specific ward, fairnessmay be defined with respect to the number of patients who are not assignedto their top priority. Related to this is the work of Thompson et al. (2009)that looks into minimizing the cost that reflects the number of “non-ideal”ward assignments; we propose to also look at the equity between patientsin this context. One may alternatively consider achieving equity in terms ofblocking probability (recall the discussion in §3.3.1) or patients delay. Forthe latter, Chan, Armony and Bambos (2011) show that such fairness isachieved via Maximum Weighted Matching.
4.5.3. Fairness towards staff. In Section 4.4 we discussed the implica-tions of the routing policy on delays in the ED-to-IW process; in addition,routing also has a significant impact on wards’ workload. High workloadtends to cause personnel burnout, especially if work allocation is perceivedas unjust (references can be found in Armony and Ward (2010)). Rambamhospital takes fairness into consideration, as is implied from the name “Jus-tice Table”. However, is the patient allocation to the wards indeed fair?
There are many candidates for defining server “fairness”. One natural
imsart-ssy ver. 2013/03/06 file: "Short_Patient flow main".tex date: December 29, 2013

36 ARMONY ET AL.
measure is equity in the occupancy level. Since the number of nurses anddoctors is typically proportional to the number of beds, equal occupancylevels imply that each nurse/doctor treats the same number of patients,on average. But does this imply that their workload is evenly distributed?As already mentioned in §3.2.1, staff workload in hospitals is not spreaduniformly over a patient’s stay, as patients admissions/discharges tend tobe work intensive and treatment during the first days of hospitalizationrequire much more time and effort from the staff than in the following days(Elkin and Rozenberg, 2007). Thus, one may consider an alternative fairnesscriterion: balancing the incoming load, or the “flux”—number of admittedpatients per bed per time unit, among the wards. In Table 1 we observethat Ward B has a high average occupancy rate. In addition, as it is boththe smallest and the “fastest” (shortest ALOS) ward, then (by Little’s law)it has a higher flux. Since nursers and doctors are assigned to particularwards, the load on Ward B staff is hence the highest. We conclude that themost efficient ward is subject to the highest load—that is, patient allocationappears unfair towards servers.
Our data have already motivated some work on fair routing. Analyticalresults for input-queued systems were derived in Mandelbaum, Momcilovicand Tseytlin (2012), where both occupancy level and flux are taken intoaccount with respect to fairness. The authors in Tseytlin and Zviran (2008)perform a simulation study of the output-queued system under various rout-ing schemes. They proposed an algorithm that balances a weighted functionof occupancy and flux to achieve both fairness and short delays.
4.5.4. Research Opportunities. In the context of output-queued sys-tems, a more rigorous analytical study is needed to formalize the conclusionsof Tseytlin and Zviran (2008). Specifically, how to combine the occupancyand flux criteria into a single effective workload measure, which would bebalanced across wards. Even in the context of input-queued systems, it is ourview that Armony and Ward (2010); Mandelbaum, Momcilovic and Tseytlin(2012) and Ward and Armony (2013) have just taken the first steps towardsstaff fairness, as they do not fully account for the dynamic nature of work-load in healthcare. As patients progress in their hospital stay, their medicalneeds change (mostly reduce) and the accuracy in which one can predicttheir LOS increases. This information could be very useful in successfullybalancing workload.
The underlying definition of operational fairness, in our discussion thusfar, proposed equal workload across medical staff. A prerequisite for solvingthe “fairness problem” is then to define and calculate workload appropri-
imsart-ssy ver. 2013/03/06 file: "Short_Patient flow main".tex date: December 29, 2013

PATIENT FLOW IN HOSPITALS 37
ately. As argued in Section 6.2, such calculations must include not only directtime per resource but also emotional and cognitive efforts, as well as otherrelevant factors. For example, the mix of medical conditions and patientseverity might also be included in workload calculation. For the latter, it isnot straightforward to determine whether wards would be inclined to admitthe less severe patients (who add less workload, and potentially less emo-tional stress), or the more severe patients who would challenge the medicalstaff, and provide them with further learning and research opportunities;the latter is especially relevant in teaching hospitals such as Rambam.
5. A system view. In Sections 2, 3, and 4 we treated the three networkcomponents (ED, IWs, transfers) unilaterally. In contrast, we now under-score the importance of looking at this network as a whole, as these threecomponents are clearly interdependent. For concreteness, we focus on howthe discharge policy in the IW affects ED-to-IW transfer times which, inturn, affect ED workload. We thereby argue that an integrative system viewis needed here.
It is natural to expect that the higher the occupancy in the IWs thelonger the delays in transfer, due to limited IW resources. The left diagramin Figure 16 displays the average delay in transfer alongside the averagenumber of patients per ward—in IWs A–D, by day of the week. We observethat, as expected, the two measures have a similar weekly pattern. Theright diagram in Figure 16 shows delays in the transfer process and theaverage number of patients in the IWs, as they vary throughout the day.The correlation here is not as apparent as in the daily resolution; otherfactors, such as the IW discharge process, play a role.
We observe that the longest delays are experienced by patients assignedto the IWs in early morning (6am–8am)—these patients need to wait onaverage 5 hours or more. This is due to the fact that IW physicians performtheir morning rounds at this time and cannot admit new patients. Thenwe note a consistent decline in the transfer delay up until noon. Patientsassigned to the IWs during these times are admitted into the IWs between1–3pm. This is about the time when the physicians’ morning rounds arecomplete; staff and beds are starting to become available. Indeed, there is asharp decline in the number of IW patients around 3–4pm when most of theIWs discharges are complete. Shi et al. (2012), in their study of a Singaporehospital, discover similar discharge patterns, though the discharge procedurethere occurs somewhat earlier in the day.
Further data analysis reveals that patients that are transferred to theIWs before 9am have significantly shorter LOS; early hospitalization reduces
imsart-ssy ver. 2013/03/06 file: "Short_Patient flow main".tex date: December 29, 2013

38 ARMONY ET AL.
ALOS by 1 day. Thus, we argue that it is extremely important to shortenthe ED-to-IW transfer process and improve the admission process in theIWs so that the first day of hospitalization is not “wasted”.
In Section 4.3, we discussed how transfer delays impact physician work-load in the ED and hence may influence quality of care there. Thus, weobserve a chain of events in which the discharge policy in the IWs impactsthe delays in transfer, which in turn affects workload in the ED. In partic-ular, a system-view perspective is called for.
34
35
36
37
38
39
40
0.00.51.01.52.02.53.03.54.04.5
Num
ber o
f Pat
ient
s
Dela
y tim
e (h
ours
)
HomeHospital, Total for May-December 2006, April-
October2007
Average Delay in ED-to-Ward transfer (hours) A-D (by physical location)Number of Patients in Ward (average) A-D (by physical location)
35
36
37
38
39
0
1
2
3
4
5
6
00:0
0
02:0
0
04:0
0
06:0
0
08:0
0
10:0
0
12:0
0
14:0
0
16:0
0
18:0
0
20:0
0
22:0
0
Num
ber o
f Pat
ient
s
Dela
y tim
e (h
ours
)
Time (60 min. resolution)
HomeHospital, Internal Medicine A-DTotal for May2006 - December2006, April2007 - October2007,All days
Average Delay in ED-to-Ward transfer (hours)Number of Patients in Ward (average)
Fig 16. ED-to-IW transfer delays and number of patients in IW
5.1. Research opportunities. Our discussion suggests that daily rou-tines (schedules) in the IWs have significant impact on transfer delays andthereby on ED workload. The question arises as to how one might wish tochange these daily routines in view of this impact. The question fits wellwithin a queueing context. The present daily routine at Rambam may beviewed as a priority scheme where current IW patients enjoy priority duringmorning physicians’ rounds, and discharged patients obtain priority in theafternoon, followed by newly-admitted patients. Is it possible to positivelyaffect system performance by altering these priorities? More broadly, thechallenge is to design priority schemes for a time-varying queueing network.
Our discussion here brings us back to the broader issue—that is the needfor a system view, in order to understand and relieve delays in patient flow.Consider, for example, the patients that are boarding in EDs (Figure 16) orin ICUs (Long and Mathews, 2012). Such boarding delays are often due toscarce resources or synchronization gaps (Zaied, 2011), which are rooted inparts of the system that differ from those where the delays are manifested.For example, scarce resources in the IWs exacerbate ED delays, and tardyprocessing of MRI results can prolong ICU LOS. It follows that a system
imsart-ssy ver. 2013/03/06 file: "Short_Patient flow main".tex date: December 29, 2013
PATIENT FLOW IN HOSPITALS 39
view is required for the analysis of patient flow in hospitals.
6. Discussion and concluding remarks. We have described researchopportunities that arose from EDA of patient flow. We now highlight somecommon themes that have surfaced throughout the process. Specifically, weexpand on the relationship between operational performance measures tooverall hospital performance, discuss the concepts of workload and capacityand underline the importance of paying attention to time scales.
6.1. Operational measures as surrogates to overall hospital performance.Hospital performance is measured across a variety of dimensions: clinical,financial, operational, psychological (patient satisfaction) and societal. Themost important measures are clinical but, practically, operational perfor-mance is the easiest to quantify, measure, track online and react upon. More-over, operational performance is tightly coupled with the other dimensions,which explains its choice as a “language” that captures overall performance.For example, the fraction of patients who LWBS is a proxy for accessibilityto care, and readmissions pertain to clinical quality of care.
Operational performance measures are often associated with patient flow.Among these, we discussed LWBS and “blocking” (Section 3.3.1), wherepatients end up being hospitalized in a ward different from that which ismedically best for them (see Yom-Tov (2010) for more details); boarding(transfer) time from the ED to the appropriate medical unit; and measuresrelated to LOS, in the ED or IWs, such as merely averages (or medians), orfractions staying beyond a desired threshold. Other measures that have notbeen mentioned require intra-ward data, which is beyond our granularity.Examples include the time until triage or until a patient is first seen byan ED physician (Zeltyn et al., 2011), the number of visits to a physicianduring an ED sojourn (Huang, Carmeli and Mandelbaum, 2011) and thetime-ingredients of an ED visit (treatment and waiting—for a resource, forsynchronization or for a treatment to take effect; see Zaied (2011) and Atar,Mandelbaum and Zviran (2012)).
An operational measure that policy makers have been focusing on recentlyis readmissions. This is part of efforts to extend quality of care measuresfrom within-hospital processes to after-hospital short-term outcomes (Medi-care USA, 2013). As mentioned, the likelihood of readmission to the hospi-tal, within a relatively short time, is a natural indirect measure for qualityof care (similarly to first-call-resolution rates in call centers). Consequently,readmission rates are accounted for when profiling hospitals’ quality and de-termining reimbursements for their services. It is commonly acknowledged,however, that one should consider readmissions judiciously as some of them
imsart-ssy ver. 2013/03/06 file: "Short_Patient flow main".tex date: December 29, 2013

40 ARMONY ET AL.
could be due to factors outside the hospital control (e.g. patients’ own be-havior, or care after discharge), or they may be an integral part of the treat-ment regiment. For example, returns within a few months to chemotherapyare typically planned and are unrelated to poor quality. But there are alsochemotherapy returns after 1–2 weeks, which arise from complications aftertreatment. To properly incorporate readmissions in a queueing model (suchas in Yom-Tov and Mandelbaum (2011)) one should distinguish betweenthese two readmission types by, for example, modeling planned (unplanned)readmissions as deterministic (stochastic) returns. Our hospital data sup-ports the analysis of readmissions (Mandelbaum et al., 2013), which arefurther discussed in Section 4.2.2 of EV. Note that readmissions should bemeasured in their natural time-scale. For example, readmission to an EDshould be measured in a time scale of days-weeks, while readmissions to anIW have a natural time-scale of weeks-months. We will return to time scalesshortly.
6.2. Multi-dimensional workload. Operational performance of a service-system is determined by the gap, positive or negative, between its workloadand the capacity assigned to process it. Workload is associated with a re-source and, as such, used to gauge the requirements from that resource: forexample, workload of nurses helps determine appropriate nurse staffing lev-els. Workload has also been shown to affect staff satisfaction level (Aikenet al., 2002) and patients’ quality of care (Batt and Terwiesch, 2012; Kc andTerwiesch, 2009).
In Queueing models, workload is typically an average quantity that is de-fined in steady-state: if λ is the arrival-rate of patients and S is the servicetime required from the nurse by a patient, then R = λ×E[S] is the workloadof the nurse, which is commonly referred to as offered load. In time-varyingenvironments (Green, Kolesar and Whitt, 2007; Reich, 2011), notably hos-pitals, the offered-load R(·) is defined through the time-varying Little’s law(Bertsimas and Mourtzinou, 1997; Green, Kolesar and Whitt, 2007):
R(t) =
∫ t
0λ(u)P{S > t− u}du, t ≥ 0,
in which λ(·) is the time-varying arrival rate (some mild assumptions arerequired for the integral to make sense).
As workload is matched against capacity, it must be measured in opera-tional units. However, the workload of a nurse is affected by various factorsbeyond the mere time-content of nurse’s tasks. For example, 1-minute of astandard chore does not compare with a 1-minute life-saving challenge. The
imsart-ssy ver. 2013/03/06 file: "Short_Patient flow main".tex date: December 29, 2013

PATIENT FLOW IN HOSPITALS 41
calculation of nurses’ workload must therefore accommodate operational,emotional and cognitive factors, yet the outcome must be in standardizedunits that are “translatable” into staffing levels (Plonski et al., 2013).
It follows from the above that a comprehensive definition of personnelworkload is inevitably complex. In the context of a medical ward, a naturalapproximation to workload is relative occupancy, namely the number of hos-pitalized patients in a ward, divided by the number of its beds. Assuminga constant beds-to-nurse ratio (Jennings and de Vericourt, 2011), homoge-neous patient mix and an even distribution of workload over a patient’s stay,occupancy is then well correlated with the daily-routine workload. However,as already discussed in Section 4.5.3, the level of medical attention that pa-tients require typically declines during their stay. In addition, routine choresare less work intensive than admissions and discharges of patients, and thelatter are naturally associated with patient turnover or flux, as opposed tobed occupancy. A proxy for workload must, therefore, acknowledge bothoccupancy and turnover, and possibly be also sensitive to the “age” (timesince admission) of hospitalized patients.
Hence, we argue that the standard approach (presented above) for work-load might be too simplified for the hospital environment. Here one mustaccount for time-varying multi-dimensional aspects, which calls for researchthat aims at understanding, quantifying and measuring workload in health-care.
6.3. Capacity. Offered load characterizes operational demand for servicewhich, in turn, must be matched by supply of the appropriate capacity. Ca-pacity of a hospital or a ward is commonly expressed in terms of the numberof beds (or rooms, or physical space). However, it is also necessary to asso-ciate with a ward its processing capacity, which is determined by its humanand equipment resources: nurses, physicians, support personnel, and medicalapparatus. One thus distinguishes between static capacity (e.g. beds) anddynamic (processing) capacity of a resource. This distinction has operationaland cost accounting implications in that static capacity is thought of as fixedover the relevant horizon, hence its cost is fixed; processing capacity, on theother hand, is considered variable in that it is flexible (controllable), bothlevel- and hence cost-wise.
The association of flexible capacity with variable costs plays an impor-tant role in the Accounting/Strategic view of a hospital; Kaplan and Porter(2011) argue that most hospital costs are mistakenly judged as fixed whilethey ought to be viewed as variable costs, which means that the correspond-ing resource levels are flexible. This is an important observation, as it renders
imsart-ssy ver. 2013/03/06 file: "Short_Patient flow main".tex date: December 29, 2013

42 ARMONY ET AL.
controllable most resources in a hospital.Our final point pertains to the characterization of capacity when it is
flexible. Consider, for example, determining the capacity of the Ophthalmol-ogy ward in Rambam hospital, which happens to admit overflow patientsfrom Internal wards (analogously to cross-trained agents in a call center;see Aksin, Karaesmen and Ormeci (2007)). Practically, this entails alloca-tion of appropriate equipment, training of Ophthalmology ward personnelto be able to cater to IW patients and developing protocols for overflow ofIW patients to Ophthalmology. Then the (dynamic) capacity of the Oph-thalmology ward, if measured in patients-per-day say, would depend on itspatient mix. The latter depends on the routing protocol which, in turn, de-termines the offered load. It follows that capacity and protocols better bedetermined jointly (unless their decoupling can be justified, as in Armony,Gurvich and Mandelbaum (2008)).
6.4. Time-scales. When analyzing ED-to-IWs flow (§4), the wards op-erate naturally on a time-scale of days while the ED time scale is hours.It follows that the wards serve as a random environment for the ED (Ra-makrishnan, Sier and Taylor, 2005). Figure 9 (§3.2) reveals that the hourlyscale is also of interest for IWs. These empirical examples arise from a ser-vice system that evolves in multiple time scales, which are all natural formeasuring and modeling its performance. The mathematical manifestationof such scales is asymptotic analysis that highlights what matters at eachscale, while averaging out details that are deemed insignificant (e.g., Man-delbaum, Momcilovic and Tseytlin (2012), Shi et al. (2012), Gurvich andPerry (2012) and Zacharias and Armony (2013)).
The analysis—theoretical as well as empirical—of hospital units that op-erate under multiple time-scales offers further significant research opportu-nities. Hierarchical control of a hospital (e.g. strategic, tactical, and opera-tional) is one such example, in which the strategic level generates constraintsfor tactical decisions which, in turn, percolate down to the operational level(e.g. Zeltyn et al. (2011)). To be specific, the number of beds in a ward is de-termined strategically which, tactically and operationally, sets staffing levelsfor nurses (Jennings and de Vericourt, 2011). This relates to our discussionin §3.2, where time scales helped determine what constitutes a server—abed or a nurse.
6.5. Some concluding comments on data-based research—a great opportu-nity but no less of a challenge. Healthcare operations research is appropri-ately booming, and queueing applications to patient flow are trying to followsuit. In this context, the goal of the present work has been two-fold: first,
imsart-ssy ver. 2013/03/06 file: "Short_Patient flow main".tex date: December 29, 2013

PATIENT FLOW IN HOSPITALS 43
to encourage and strengthen, through data and its EDA, the natural linkbetween theory and applications; and second, facilitate data-based learningfor researchers who seek to reinforce this important link.
While theory has been the comfort zone of Operations Research (OR)and Applied Probability (AP), the situation dramatically differs when (big)data is brought into the picture. Specifically, the traditional still prevalentmodel for data-based OR/AP research has been one where an individualresearcher, or a small group, obtains and analyzes data for the sake of anisolated research project. Our experience is that such a model cannot ad-dress today’s empirical needs. For example, hospital data is typically large,complex, contaminated and incomplete, which calls for a professional in-evitably time-consuming treatment. Next, using data in a single project, ora few for that matter, is wasteful—on the other hand, data-reuse and shar-ing, across student generations or research groups, requires infrastructure,documentation, maintenance and coordination. Finally, healthcare data isoften confidential and proprietary, and that prevents reproducibility andslows down progress. (We will return to this last point momentarily.)
Fundamental changes are therefore essential—both within our OR/APcommunity as well as our potential healthcare partners: changes in educa-tion, organization and funding priorities, which takes us beyond our scopehere. But we are optimistic. Indeed, comprehensive data-collection is becom-ing increasingly feasible, systematic and cheaper, for example via Real-timeLocation Systems (RTLS), which will ultimately integrate with Personal-Health and Financial Records. This will enable partnerships with providersof healthcare services, that are based on multidisciplinary (clinical, opera-tional, financial, psychological) tracking of complete care-paths. Also, track-ing resolution and scope will be at the level of the individual patient andprovider, covering the full cycle of care.
6.5.1. Towards a culture of reproducible research in empirical OR/AP.Data-based OR/AP research must strive for reproducibility of research outcomes—a fundamental principle in the traditional sciences. Reproducibility enablesscrutiny of analysis and recommendations. This yields credibility and trust,which is an absolute prerequisite for influencing hospital practices.
Reproducible (Operations) Research is discussed in Nestler (2011), whichis also a source for additional references and links. There have been some sys-tematic attempts to establish a reproducibility culture in research (Donohoet al., 2009). It ought to start with funding agencies and journal policies: e.g.the Editorial Statement of the Finance Department in Management Sciencereads: “Authors of empirical and quantitative papers should provide or make
imsart-ssy ver. 2013/03/06 file: "Short_Patient flow main".tex date: December 29, 2013

44 ARMONY ET AL.
available enough information and data so that the results are reproducible.”It can advance with research such as Karr (2009), that aims at statisticalanalysis of distributed (unsharable) databases (e.g. hospital data); it willideally culminate in a multitude of research labs, each providing free accessto its data and serving its own research community and beyond.
A model for such a lab is the Technion SEELab, where readers can accessRambamData. Little effort will be then required to reproduce our presentEDA and going beyond it. In fact, most of our figures were created bySEEStat—a SEELab-developed user-friendly platform for online (real-time)EDA—and readers can recreate this process by following Nadjhahrov et al.(2013).
imsart-ssy ver. 2013/03/06 file: "Short_Patient flow main".tex date: December 29, 2013

PATIENT FLOW IN HOSPITALS 45
Acknowledgements. We dedicate our paper to the memory of the lateDavid Sinreich. As a professor at the Technion IE&M, David was a pioneerand an example-to-follow, in acknowledging the necessity and importanceof data- and simulation-based research in healthcare. In particular, the EDdata collection that he orchestrated in 8 Israeli hospitals served as a proof-of-feasibility for our EDA.
Our research, and its seed financial backing, started within the OCR(Open Collaborative Research) Project, funded by IBM and led jointly byIBM Haifa Research (headed by Oded Cohn), Rambam Hospital (DirectorRafi Beyar) and Technion IE&M Faculty (Former Dean Boaz Golany).
Data analysis, maintenance of data repositories, and continuous adviceand support have been cheerfully provided by the Technion SEE Laboratoryand its affiliates: Valery Trofimov, Igor Gavako, Ella Nadjharov, ShimritMaman, Katya Kutsy, Nitzan Carmeli, and Arik Senderovic.
The authors, and the research presented here, owe a great deal to manyadditional individuals and institutions. This long list, which we can here ac-knowledge only in part, clearly must start with our host Rambam hospital—its capable management, dedicated nursing staff and physicians, and espe-cially: Rafi Beyar, Rambam Director and CEO, who invited us at the outsetto “use” the healthcare campus as our research laboratory; we gladly ac-cepted the invitation, and have been since accompanied and advised byZaher Azzam (Head of Rambam Internal Ward B), Sara Tzafrir (Head ofRambam Information Systems), and the OCR steering committee: HanaAdami (Head of Rambam Nursing), Yaron Barel (Rambam VP for Oper-ations), Boaz Carmeli (IBM Research), Fuad Basis (Rambam ED), DannyGopher (Technion IE&M), Avi Shtub (Technion IE&M), Segev Wasserkrug(IBM Research), Amir Weiman (Head of Rambam Accounting) and PninaVortman (IBM Research).
We are thankful to Technion students Kosta Elkin, Noga Rozenberg andAsaf Zviran: their projects and cooperation helped us analyze the ED-to-IWs process.
Financially, the research of YM, GY and YT was supported by graduatefellowships from Technion’s Graduate School and the Israel National Insti-tute for Health Services and Health Policy Research. The joint research ofMA and AM was funded by BSF (Bi-national Science Foundation) Grants2005175/2008480. AM was partially supported by ISF Grant 1357/08 andby the Technion funds for promotion of research and sponsored research.MA was partially funded by the Lady Davis Fellowship as a visitor at theTechnion IE&M faculty.
Some of AM’s research was funded by and carried out while visiting the
imsart-ssy ver. 2013/03/06 file: "Short_Patient flow main".tex date: December 29, 2013
46 ARMONY ET AL.
Statistics and Applied Mathematical Sciences Institute (SAMSI) of the NSF;the Department of Statistics and Operations Research (STOR), the Uni-versity of North Carolina at Chapel Hill; the Department of Information,Operations and Management Sciences (IOMS), Leonard N. Stern Schoolof Business, New York University; and the Department of Statistics, TheWharton School, University of Pennsylvania – the hospitality of all theseinstitutions is acknowledged and truly appreciated.
Our paper greatly benefited from feedback by colleagues and a thoroughand insightful refereeing process. Ward Whitt discovered a flaw in our em-pirical analysis that led to the rewriting of the ED section. Jim Dai readcarefully the first version and provided significant and helpful editorial feed-back. Last but certainly not least, we are grateful to the editor of Stochas-tic Systems, Peter Glynn, for leading and guiding us patiently and safelythrough the revision process.
imsart-ssy ver. 2013/03/06 file: "Short_Patient flow main".tex date: December 29, 2013

PATIENT FLOW IN HOSPITALS 47
REFERENCES
Adler, P. S., Mandelbaum, A., Nguyen, V. and Schwerer, E. (1995). From Projectto Process Management: An Empirically-Based Framework for Analyzing Product De-velopment Time. Management Science 41 458–484. 1.2
Aiken, L. H., Clarke, S. P., Sloane, D. M., Sochalski, J. and Silber, J. H. (2002).Hospital Nurse Staffing and Patient Mortality, Nurse Burnout, and Job Dissatisfaction.JAMA 288 1987–1993. 6.2
Aksin, Z., Armony, M. and Mehrotra, V. M. (2007). The Modern Call-Center: AMulti-Disciplinary Perspective on Operations Management Research. Production andOperations Management 16 655–688. 1.2
Aksin, O. Z., Karaesmen, F. and Ormeci, E. L. (2007). A Review of Workforce Cross-Training in Call Centers from an Operations Management Perspective. In WorkforceCross Training Handbook (D. Nembhard, ed.) CRC Press. 3.3.3, 6.3
Allon, G., Deo, S. and Lin, W. (2010). Impact of Size and Occupancy of Hospital onthe Extent of Ambulance Diversion: Theory and Evidence. Working paper. 2.3
Armony, M. (2005). Dynamic Routing in Large-Scale Service Systems with Heteroge-neous Servers. Queueing Systems 51 287–329. 1
Armony, M., Gurvich, I. and Mandelbaum, A. (2008). Service-Level Differentiationin Call Centers with Fully Flexible Servers. Management Science 54 279–294. 6.3
Armony, M. and Ward, A. (2010). Fair Dynamic Routing in Large-ScaleHeterogeneous-Server Systems. Operations Research 58 624–637. 4.5.3, 4.5.4
Armony, M., Israelit, S., Mandelbaum, A., Marmor, Y. N., Tseytlin, Y. andYom-Tov, G. B. (2013). Patient Flow in Hospitals: A Data-Based Queueing-SciencePerspective. An Extended Version (EV). 1.1, 1.3, 1.4, 2, 2.2.2, 2.2.2, 3.2.1, 3.3.1, 3.3.4,4.1, 2, 6.1
Atar, R., Mandelbaum, A. and Zviran, A. (2012). Control of Fork-Join Networks inHeavy Traffic. Allerton Conference,. 4.2.1, 6.1
Atar, R. and Shwartz, A. (2008). Efficient Routing in Heavy Traffic under PartialSampling of Service Times. Mathematics of Operations Research 33 899–909. 1
Balasubramanian, H., Muriel, A. and Wang, L. (2012). The Impact of Flexibilityand Capacity Allocation on the Performance of Primary Care Practices. Flexible Servicesand Manufacturing Journal 24 422–447. 3.3.3
Balasubramanian, H., Banerjee, R., Denton, B., Naessens, J., Wood, D. andStahl, J. (2010). Improving clinical access and continuity using physician panel redesign.Journal of General Internal Medicine 25 1109–1115. 3.3.3
Batt, R. J. and Terwiesch, C. (2012). Doctors Under Load: An Empirical Study ofState-Dependent Service Times in Emergency Care. Working paper. 2.2.3, 6.2
Bekker, R. and de Bruin, A. M. (2010). Time-Dependent Analysis for Refused Ad-missions in Clinical Wards. Annals of Operations Research 178 45–65. 3.2.1
Bernstein, S. L., Verghese, V., Leung, W., Lunney, A. T. and Perez, I. (2003).Development and Validation of a New Index to Measure Emergency Department Crowd-ing. Academic Emergency Medicine 10 938–942. 2.3
Bertsimas, D. and Mourtzinou, G. (1997). Transient Laws of Non-stationary Queue-ing Systems and their Applications. Queueing Systems 25 115–155. 2.2.1, 6.2
Brandeau, M. L., Sainfort, F. and Pierskalla, W. P., eds. (2004). OperationsResearch and Health Care: A Handbook of Methods and Applications. Kluwer AcademicPublishers, London. 1.5
imsart-ssy ver. 2013/03/06 file: "Short_Patient flow main".tex date: December 29, 2013

48 ARMONY ET AL.
Brillinger, D. (2002). John Wilder Tukey (1915–2000). Notices of the American Math-ematical Society 193–201. 1.2
Brown, L., Gans, N., Mandelbaum, A., Sakov, A., Shen, H., Zeltyn, S. andZhao, L. (2005). Statistical Analysis of a Telephone Call Center: A Queueing-SciencePerspective. Journal of the American Statistical Association 100 36–50. 1.2, 2.3, 3.2,3.2.1
Burstrom, L., Nordberg, M., Ornung, G., Castren, M., Wiklund, T., En-gstrom, M. L. and Enlund, M. (2012). Physician-Led Team Triage Based on LeanPrinciples May be Superior for Efficiency and Quality? A Comparison of Three Emer-gency Departments with Different Triage Models. Scandinavian Journal Trauma, Resus-citation, and Emergency Medicine 20 20–57. 2.3
Camerer, C. F., Loewenstein, G. and Rabin, M., eds. (2003). Advances in BehavioralEconomics. Princeton University Press. 1.2
Chalfin, D. B., Trzeciak, S., Likourezos, A., Baumann, B. M. andDellinger, R. P. (2007). Impact of Delayed Transfer of Critically Ill Patients fromthe Emergency Department to the Intensive Care Unit. Critical Care Medicine 35 1477–1483. 4.3
Chan, C., Armony, M. and Bambos, N. (2011). Fairness in Overloaded ParallelQueues. Working paper. 4.5.2
Chan, C., Yom-Tov, G. B. and Escobar, G. (2011). When to use Speedup: An Ex-amination of Service Systems with Returns. Working paper. 1.5
Chen, C., Jia, Z. and Varaiya, P. (2001). Causes and Cures of Highway Congestion.Control Systems, IEEE 21 26–33. 2.2.3, 4.3
Chen, H. and Yao, D. D. (2001). Fundamentals of Queuing Networks: Performance,Asymptotics, and Optimization. Springer. 3.3
Chen, H., Harrison, J. M., Mandelbaum, A., van Ackere, A. and Wein, L. (1988).Empirical Evaluation of a Queueing Network Model for Semiconductor Wafer Fabrica-tion. Operations Research 36 202–216. 1.2
Cooper, A. B., Litvak, E., Long, M. C. and McManus, M. L. (2001). EmergencyDepartment Diversion: Causes and Solutions. Academic Emergency Medicine 8 1108–1110. 1.5
de Bruin, A. M., van Rossum, A. C., Visser, M. C. and Koole, G. M. (2007).Modeling the Emergency Cardiac In-Patient Flow: An Application of Queuing Theory.Health Care Management Science 10 125–137. 1.5
de Bruin, A. M., Bekker, R., van Zanten, L. and Koole, G. M. (2009). Dimension-ing Hospital Wards using the Erlang Loss Model. Annals of Operations Research 17823–43. 1.5, 2, 3.2.1, 3.3.1
Denton, B. T., ed. (2013). Handbook of Healthcare Operations Management: Methodsand Applications. Springer. 1.5
Dobson, G., Tezcan, T. and Tilson, V. (2013). Optimal Workflow Decisions for In-vestigators in Systems with Interruptions. Management Science. Forthcoming. 2.3
Donoho, D. L., Maleki, A., Shahram, M., Rahman, I. U. and Stodden, V. (2009).Reproducible Research in Computational Harmonic Analysis. IEEE Computing in Sci-ence & Engineering 11 8–18. 6.5.1
Elkin, K. and Rozenberg, N. (2007). Patients Flow from the Emergency Departmentto the Internal Wards. IE&M project, Technion (In Hebrew). 3.1, 4.5.3
imsart-ssy ver. 2013/03/06 file: "Short_Patient flow main".tex date: December 29, 2013

PATIENT FLOW IN HOSPITALS 49
Feldman, Z., Mandelbaum, A., Massey, W. A. and Whitt, W. (2008). Staffingof Time-Varying Queues to Achieve Time-Stable Performance. Management Science 54324–338. 2.2.1
Gans, N., Koole, G. and Mandelbaum, A. (2003). Telephone Call Centers: Tutorial,Review and Research Prospects. Manufactoring, Services and Operations Management5 79–141. 1.2, 3.3
Gerla, M. and Kleinrock, L. (1980). Flow Control: A Comparative Survey. IEEETransactions on Communcations 28 553–574. 2.2.3, 4.3
Gittins, J., Glazebrook, K. and Weber, R. (2011). Multi-armed Bandit AllocationIndices. Wiley. 2.3
Green, L. (2004). Capacity Planning and Management in Hospitals. In Operations Re-search and Health Care: A Handbook of Methods and Applications (M. L. Brandeau,F. Sainfort and W. P. Pierskalla, eds.) 14–41. Kluwer Academic Publishers, London. 1.5
Green, L. V. (2008). Using Operations Research to Reduce Delays for Healthcare. InTutorials in Operations Research (Z.-L. Chen and S. Raghavan, eds.) 1–16. INFORMS.1.5
Green, L. V., Kolesar, P. J. and Whitt, W. (2007). Coping with Time-VaryingDemand When Setting Staffing Requirements for a Service System. Production and Op-erations Management 16 13–39. 1.5, 2.2.1, 3.2.1, 6.2
Green, L. and Yankovic, N. (2011). Identifying Good Nursing Levels: A QueuingApproach. Operations Research 59 942–955. 1.5, 3.2.1
Green, L., Soares, J., Giglio, J. F. and Green, R. A. (2006). Using Queuing The-ory to Increase the Effectiveness of Emergency Department Provider Staffing. AcademicEmergency Medicine 13 61–68. 2
Gurvich, I. and Perry, O. (2012). Overflow Networks: Approximations and Implica-tions to Call-Center Outsourcing. Operations Research 60 996–1009. 6.4
Gurvich, I. and Whitt, W. (2010). Service-Level Differentiation in Many-Server ServiceSystems via Queue-Ratio Routing. Operations Research 58 316–328. 1
Hagtvedt, R., Ferguson, M., Griffin, P., Jones, G. T. and Keskinocak, P. (2009).Cooperative Strategies To Reduce Ambulance Diversion. Proceedings of the 2009 WinterSimulation Conference 266 1085–1090. 2.3
Hall, R. W., ed. (2006). Patient Flow: Reducing Delay in Healthcare Delivery. Springer.1.5, 2
Hall, R. W., ed. (2012). Handbook of Healthcare System Scheduling. Springer. 1.5
Hall, R., Belson, D., Murali, P. and Dessouky, M. (2006). Modeling Patient FlowsThrough the Healthcare System. In Patient Flow: Reducing Delay in Healthcare Delivery(R. W. Hall, ed.) 1 1–45. Springer. 1.5
Herman, R. (1992). Technology, Human Interaction, and Complexity: Reflections onVehicular Traffic Science. Operations Research 40 199–211. 1.2
Hoot, N. R., Zhou, C., Jones, I. and Aronsky, D. (2007). Measuring and ForecastingEmergency Department Crowding in Real Time. Annals of Emergency Medicine 49 747–755. 2.3
Huang, J. (2013). Patient Flow Management in Emergency Departments PhD thesis,National University of Singapore (NUS). 1.5.1
Huang, J., Carmeli, B. and Mandelbaum, A. (2011). Control of Patient Flow inEmergency Departments: Multiclass Queues with Feedback and Deadlines. Working pa-per. 1.5.1, 2.3, 6.1
imsart-ssy ver. 2013/03/06 file: "Short_Patient flow main".tex date: December 29, 2013

50 ARMONY ET AL.
Hwang, U., McCarthy, M. L., Aronsky, D., Asplin, B., Crane, P. W.,Craven, C. K., Epstein, S. K., Fee, C., Handel, D. A., Pines, J. M., Rath-lev, N. K., Schafermeyer, R. W., Zwemer, F. L. and Bernstein, S. L. (2011).Measures of Crowding in the Emergency Department: A Systematic Review. AcademicEmergency Medicine 18 527–538. 2.3
IHI, (2011). Patient First: Efficient Patient Flow Management Impact on theED. Institute for healthcare improvement. http://www.ihi.org/knowledge/Pages/
ImprovementStories/PatientFirstEfficientPatientFlowManagementED.aspx. 2
Janssen, A. J. E. M., van Leeuwaarden, J. S. H. and Zwart, B. (2011). RefiningSquare-Root Safety Staffing by Expanding Erlang C. Operations Research 56 1512–1522.3.3
JCAHO, (2004). JCAHO Requirement: New Leadership Standard on Managing PatientFlow for Hospitals. Joint Commission Perspectives 24 13–14. 1.1
Jennings, O. B. and de Vericourt, F. (2008). Dimensioning Large-Scale MembershipServices. Operations Research 56 173–187. 1.5
Jennings, O. B. and de Vericourt, F. (2011). Nurse Staffing in Medical Units: AQueueing Perspective. Operations Research 59 1320–1331. 1.5, 3.2.1, 3.3, 6.2, 6.4
Jouini, O., Dallery, Y. and Aksin, O. Z. (2009). Queueing Models for Full-FlexibleMulti-class Call Centers with Real-Time Anticipated Delays. International Journal ofProduction Economics 120 389–399. 3.3.3
Kaplan, R. S. and Porter, M. E. (2011). How to Solve the Cost Crisis in Health Care.Harvard Business Review 89 46–64. 6.3
Karr, A. F. (2009). Secure Statistical Analysis of Distributed Databases, EmphasizingWhat We Don’t Know. Journal of Privacy and Confidentiality 1. http://repository.cmu.edu/jpc/vol1/iss2/5. 6.5.1
Kc, D. and Terwiesch, C. (2009). Impact of Workload on Service Time and PatientSafety: An Econometric Analysis of Hospital Operations. Management Science 55 1486-1498. 1.5, 2.2.3, 6.2
Kelly, F. P. (1979). Markov Processes and Reversibility. Wiley. 2.2.2
Kim, S. H. and Whitt, W. (2013). Are Call Center and Hospital Arrivals Well Modeledby Nonhomogeneous Poisson Processes? Working paper, Columbia University. 2.2.1
Leite, S. C. and Fragoso, M. D. (2013). Diffusion Approximation for SignalingStochastic Networks. Stochastic Processes and their Applications 123 2957–2982. 4.2.1
Leland, W. E., Taqqu, M. S., Willinger, W. and Wilson, D. V. (1994). On theSelf-Similar Nature of Ethernet Traffic (Extended Version). Operations Research 2 1–15.1.2
Long, E. F. and Mathews, K. M. (2012). “Patients Without Patience”: A PriorityQueuing Simulation Model of the Intensive Care Unit. Working paper. 4.3, 5.1
Maa, J. (2011). The Waits that Matter. The New England Journal of Medicine. 4.3
Maman, S. (2009). Uncertainty in the Demand for Service: The Case of Call Centersand Emergency Departments. Master’s thesis, Technion—Israel Institute of Technology.1.5.1, 2.2.1
Maman, S., Zeltyn, S. and Mandelbaum, A. (2011). Uncertainty in the Demand forService: The Case of Call Centers and Emergency Departments. Working paper. 1.5.1
Mandelbaum, A., Momcilovic, P. and Tseytlin, Y. (2012). On Fair Routing FromEmergency Departments to Hospital Wards: QED Queues with Heterogeneous Servers.Management Science 58 1273–1291. 1.5.1, 3.2.1, 4.5.1, 4.5.3, 4.5.4, 6.4
imsart-ssy ver. 2013/03/06 file: "Short_Patient flow main".tex date: December 29, 2013

PATIENT FLOW IN HOSPITALS 51
Mandelbaum, A., Sakov, A. and Zeltyn, S. (2000). Empirical Analysis of aCall Center. Technical Report, http://iew3.technion.ac.il/serveng/References/
ccdata.pdf. 1.2
Mandelbaum, A. and Stolyar, S. (2004). Scheduling Flexible Servers with ConvexDelay Costs: Heavy-Traffic Optimality of the Generalized cµ-Rule. Operations Research52 836–855. 1
Mandelbaum, A., Trofimov, V., Gavako, I. and Nadjhahrov, E. (2013). Home-Hospital (Rambam): Readmission Analysis. http://seeserver.iem.technion.ac.il/
databases/Docs/HomeHospital_visits_return.pdf. 6.1
Marmor, Y. N. (2003). Developing a Simulation Tool for Analyzing Emergency De-partment Performance. Master’s thesis, Technion—Israel Institute of Technology. 1.3
Marmor, Y. N. (2010). Emergency-Departments Simulation in Support of Service-Engineering: Staffing, Design, and Real-Time Tracking. PhD thesis, Technion—IsraelInstitute of Technology. 1.5.1
Marmor, Y. N., Rohleder, T., Huschka, T., Cook, D. and Thompson, J. (2011).Cardio Vascular Surgery Simulation in Support of System Engineering Decision Making.In preparation. 2.2.3
Marmor, Y. N., Golany, B., Israelit, S. and Mandelbaum, A. (2012). Design-ing Patient Flow in Emergency Departments. IIE Transactions on Healthcare SystemsEngineering 2 233–247. 1.5.1, 2.3
McHugh, M., Van Dyke, K., McClelland, M. and Moss, D. (2011). Improv-ing Patient Flow and Reducing Emergency Department Crowding. Agency for health-care research and quality. http://www.ahrq.gov/research/findings/final-reports/ptflow/index.html. 2
Medicare USA, (2013). Hospital Compare: 30-Day Death and Readmission MeasuresData. http://www.medicare.gov/HospitalCompare/Data/RCD/30-day-measures.aspx.6.1
Nadjhahrov, E., Trofimov, V., Gavako, I. and Mandelbaum, A. (2013). Home-Hospital (Rambam): EDA via SEEStat 3.0 to Reproduce “On Patients Flow inHospitals”. http://ie.technion.ac.il/Labs/Serveng/files/HHD/reproducing_flow_paper.pdf. 6.5.1, 6.5.1
Nestler, S. (2011). Reproducible (Operations) Research: A Primer on ReproducibleResearch and Why the O.R. Community Should Care About it. ORMS-Today 38. 6.5.1
Nguyen, V. (1994). The Trouble with Diversity: Fork-Join Networks with HeterogeneousCustomer Population. The Annals of Applied Probability 1–25. 4.2.1
Oredsson, S., Jonsson, H., Rognes, J., Lind, L., Goransson, K. E., Ehren-berg, A., Asplund, K., Castren, M. and Farrohknia, N. (2011). A SystematicReview of Triage-Related Interventions to Improve Patient Flow in Emergency Depart-ments. Scandinavian Journal Trauma, Resuscitation, and Emergency Medicine July 1919–43. 2.3
Plonski, O., Efrat, D., Dorban, A., David, N., Gologorsky, M., Zaied, I., Man-delbaum, A. and Rafaeli, A. (2013). Fairness in Patient Routing: Maternity Ward inRambam Hospital. Technical report. 3.2.1, 6.2
Ramakrishnan, M., Sier, D. and Taylor, P. G. (2005). A Two-Time-Scale Model forHospital Patient Flow. IMA Journal of Management Mathematics 16 197–215. 6.4
Rambam, Rambam Health Care Campus, Haifa, Israel. http://www.rambam.org.il/Home+Page/. 1.4
imsart-ssy ver. 2013/03/06 file: "Short_Patient flow main".tex date: December 29, 2013

52 ARMONY ET AL.
RambamData, Rambam Hospital data repositories. Technion SEELab, http://
seeserver.iem.technion.ac.il/databases/. 6.5.1, 6.5.1
Reich, M. (2011). The Workload Process: Modelling, Inference and Applications. Mas-ter’s thesis, Technion—Israel Institute of Technology. 6.2
SEELab, SEE Lab, Technion—Israel Institute of Technology. http://ie.technion.
ac.il/Labs/Serveng/. 1, 1, 6.5.1, 6.5.1
SEEServer, Server of the Center for Service Enterprise Engineering. http://
seeserver.iem.technion.ac.il/see-terminal/. 6.5.1
SEEStat, SEEStat documentation, Technion—Israel Institute of Technology. http:
//ie.technion.ac.il/Labs/Serveng/. 1, 6.5.1, 6.5.1
Shi, P., Chou, M. C., Dai, J. G., Ding, D. and Sim, J. (2012). Hopital InpatientOperations: Mathematical Models and Managerial Insights. Working paper. 1.3, 1.5,3.2, 3.2.1, 5, 6.4
Stolyar, S. (2005). Optimal Routing in Output-Queued Flexible Server Systems. Prob-ability in the Engineering and Informational Sciences 19 141–189. 1, 1
Sullivan, S. E. and Baghat, R. S. (1992). Organizational Stress, Job Satisfaction,and Job Performance: Where Do We Go from Here? Journal of Management 18 353–375. 2.2.3
Sun, J. (2006). The Statistical Analysis of Interval-Censored Failure Time Data.Springer. 2.3
Tezcan, T. (2008). Optimal Control of Distributed Parallel Server Systems under theHalfin and Whitt Regime. Math of Operations Research 33 51–90. 1
The OCR Project (IBM-Rambam-Technion), (2011). Service Science in Hospitals:A Research-Based Partnership for Innovating and Transforming Patients Care. http:
//ie.technion.ac.il/Labs/Serveng/files/Project_summary_for_SRII.pdf. 1.2
Thompson, S., Nunez, M., Garfinkel, R. and Dean, M. D. (2009). Efficient Short-Term Allocation and Reallocation of Patients to Floors of a Hospital During DemandSurges. Operations Research 57 261–273. 4.5.2
Thorin, O. (1977). On the Infinite Divisibility of the Lognormal Distribution. Scandi-navian Actuarial Journal 1977 121–148. 3.2.1
Tseytlin, Y. (2009). Queueing Systems with Heterogeneous Servers: On Fair Routingof Patients in Emergency Departments. Master’s thesis, Technion—Israel Institute ofTechnology. 1.3, 1.5.1
Tseytlin, Y. and Zviran, A. (2008). Simulation of Patients Routing from an Emer-gency Department to Internal Wards in Rambam Hospital. OR Graduate Project, IE&M,Technion. 1, 4.5.3, 4.5.4
Tukey, J. W. (1977). Exploratory Data Analysis. Addison Wesley. 1.2
Ward, A. and Armony, M. (2013). Blind Fair Routing in Large-Scale Service Systemswith Heterogeneous Customers and Servers. Operations Research 61 228–243. 4.5.4
Whitt, W. (2012). Fitting Birth-and-Death Queueing Models to Data. Statistics andProbability Letters 82 998–1004. 2.2.2
Yom-Tov, G. B. (2010). Queues in Hospitals: Queueing Networks with ReEnteringCustomers in the QED Regime. PhD thesis, Technion—Israel Institute of Technology.1.5.1, 3.2.1, 6.1
Yom-Tov, G. B. and Mandelbaum, A. (2011). Erlang-R: A Time-Varying Queue withReEntrant Customers, in Support of Healthcare Staffing. Forthcoming MS&OM. 1.5,1.5.1, 2.2.2, 2.3, 3.3, 6.1
imsart-ssy ver. 2013/03/06 file: "Short_Patient flow main".tex date: December 29, 2013

PATIENT FLOW IN HOSPITALS 53
Zacharias, C. and Armony, M. (2013). Joint Panel Sizing and Appointment Schedulingin Outpatient Care. Working paper. 6.4
Zaied, I. (2011). The Offered Load in Fork-Join Networks: Calculations and Applica-tions to Service Engineering of Emergency Department Master’s thesis, Technion—IsraelInstitute of Technology. 5.1, 6.1
Zalenski, R. J., Rydman, R. J., Ting, S., Kampe, L. and Selker, H. P. (1998).A National Survey of Emergency Department Chest Pain Centers in the United States.The American Journal of Cardiology 81 1305–1309. 2.3
Zeltyn, S., Marmor, Y. N., Mandelbaum, A., Carmeli, B., Greenshpan, O.,Mesika, Y., Wasserkrug, S., Vortman, P., Schwartz, D., Moskovitch, K.,Tzafrir, S., Basis, F., Shtub, A. and Lauterman, T. (2011). Simulation-Based Mod-els of Emergency Departments: Real-Time Control, Operations Planning and ScenarioAnalysis. Transactions on Modeling and Computer Simulation (TOMACS) 21. 1.5.1,2.3, 6.1, 6.4
Zhu, B., Armony, M. and Chan, C. W. (2013). Critical Care in Hospitals: When toIntroduce a Step Down Unit? Working paper, Columbia University. 4.2
Appendix: Accessing Data repositories and EDA tools at theSEELab. SEELab is a data-based research laboratory, residing at theIE&M Faculty of the Technion in Haifa, Israel. (SEE stands for “ServiceEnterprise Engineering”.) SEELab maintains a repository for transaction-level operational data (log-files) from large service operations. This data iscollected and cleaned, thus preparing it for research and teaching. Currently,SEELab databases include call-by-call multi-year data from 4 call centers, aninternet academic website, 8 emergency departments (mainly their arrivalsdata) and 4 years of data from the Rambam Hospital—this is the empiricalfoundation for the present paper.
The EDA environment of SEELab is SEEStat—a software platform thatenables real-time statistical analysis of service data at seconds-to-monthstime resolutions. SEEStat was used to create most of our figures. It imple-ments many statistical algorithms: parametric distribution fitting and selec-tion, fitting of distribution mixtures, survival analysis and more—with allalgorithms interacting seamlessly with all the databases. SEEStat also inter-acts with SEEGraph, a pilot-environment for structure-mining, on-demandcreation, display and animation of data-based process maps (e.g. Figure 1).
Three SEELab data-bases are publicly accessible at the SEELab serverSEEServer: two from call centers and one from the Rambam hospital. Forexample, data from a U.S. banking call center covers the operational historyof close to 220 million calls, over close to 3 years; 40 million of these calls wereserved by (up to 1000) agents and the rest by a VRU (answering machine).The Rambam data is described in §1.4.
SEEStat Online: The connection protocol to SEELab data, for any re-
imsart-ssy ver. 2013/03/06 file: "Short_Patient flow main".tex date: December 29, 2013
54 ARMONY ET AL.
search or teaching purpose, is simply as follows: go to the SEELab webpagehttp://ie.technion.ac.il/Labs/Serveng;then proceed, either via the link SEEStat Online, or directly throughhttp://seeserver.iem.technion.ac.il/see-terminal, and complete theregistration procedure. Within a day or so, you will receive a confirma-tion of your registration, plus a password that allows you access to SEE-Stat, SEELab’s EDA environment, and via SEEStat to the above-mentioneddatabases. Note that your confirmation email includes two attachments: atrouble-shooting document and a self-taught tutorial that is based on callcenter data and the Rambam hospital data. We propose that you print outthe tutorial, connect to SEEStat and then let the tutorial guide you, hands-on, through SEEStat basics—this should take no more than 1.5 hours.
On data cleaning and maintenance. There were plenty of records thatwere flawed due to archiving or simply system errors. These were identifiedvia their inconsistency with trustable data and hence corrected or removed.But more challenging was the identification of records that had been includedin the data due to some regulations, rather than physical transactions. Forexample, some unreasonable workload profiles led to the discovery of a highfraction of “transfers” from the ED to a virtual ward, all occurring preciselyat 11:59pm; subsequent analysis managed to associate each of these transferswith a physical transfer, from the ED to some actual ward on the followingday. The reason for the inclusion of such virtual transfers was financial,having to do with regulations of insurance reimbursement. And this is justone out of many examples.
Reproducing our EDA and beyond. Rambam data is publicly available,either for downloading (RambamData consists of records per individual cus-tomers) or through SEEStat. The download link includes data documenta-tion. To facilitate reproducibility, the document Nadjhahrov et al. (2013)provides a detailed description of the creation process of our EDA, whichincludes all figures (except for Figure 12) in the present paper.
Mor ArmonyStern School of Business, NYU44 West 4th StreetNew York, NY 10012E-mail: [email protected]
Shlomo IsraelitDirector, Emergency Trauma DepartmentRambam Health Care Campus (RHCC)6 Ha’Aliya StreetHaifa, Israel 31096E-mail: s [email protected]
imsart-ssy ver. 2013/03/06 file: "Short_Patient flow main".tex date: December 29, 2013

PATIENT FLOW IN HOSPITALS 55
Avishai MandelbaumFaculty of Industrial Engineering and ManagementTechnion—Israel Institute of TechnologyTechnion city, Haifa, Israel, 32000E-mail: [email protected]
Yariv N. MarmorDepartment of Industrial Engineering and ManagementORT Braude CollegeKarmiel, IsraelHealth Care Policy and Research DepartmentMayo Clinic200 First Street SWRochester, MN, USA, 55905E-mail: [email protected]
Yulia TseytlinIBM Haifa Research LabHaifa University CampusMount Carmel, Haifa, Israel, 31905E-mail: [email protected]
Galit B. Yom-TovFaculty of Industrial Engineering and ManagementTechnion—Israel Institute of TechnologyTechnion city, Haifa, Israel, 32000E-mail: [email protected]
imsart-ssy ver. 2013/03/06 file: "Short_Patient flow main".tex date: December 29, 2013