on-orbit radiometric calibration of the planet dove ... · sensor type bayer-masked ccd camera...
TRANSCRIPT

Uluru, Australia, DEC 2, 2015
On-Orbit Radiometric
Calibration of the Planet
Dove Constellation
Nick Wilson
Joshua Greenberg
Arin Jumpasut
Alan Collison
September 20th, 2017

Topics
● Introduction to the Dove Satellite
and Constellation
● How Dove imagery is
radiometrically calibrated
● How radiometric calibration is
updated on-orbit
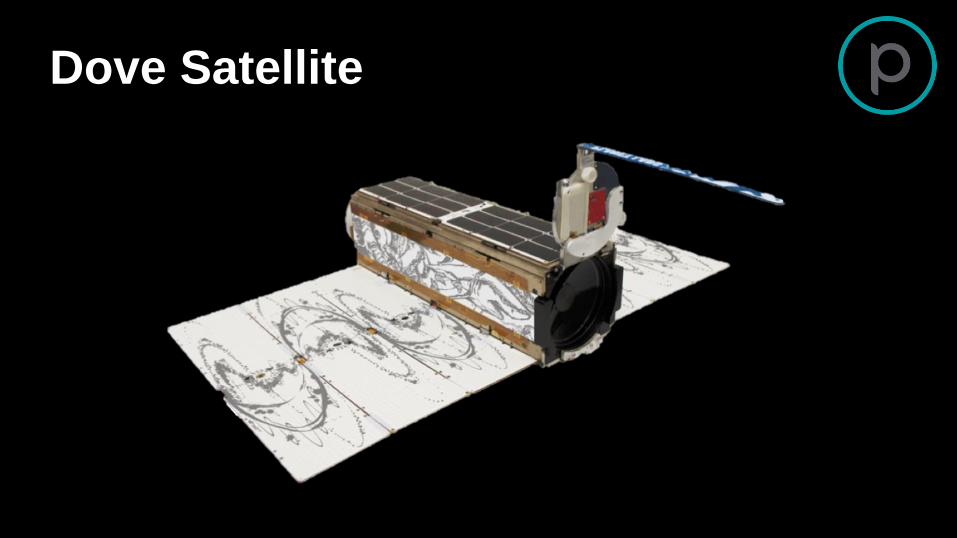
Dove Satellite

Landsat 8
Planet Dove
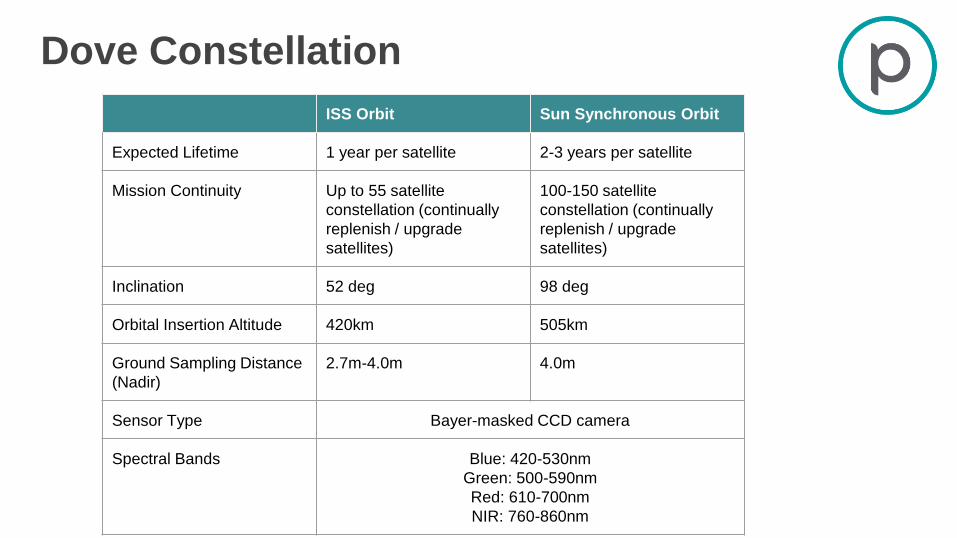
ISS Orbit Sun Synchronous Orbit
Expected Lifetime 1 year per satellite 2-3 years per satellite
Mission Continuity Up to 55 satellite
constellation (continually
replenish / upgrade
satellites)
100-150 satellite
constellation (continually
replenish / upgrade
satellites)
Inclination 52 deg 98 deg
Orbital Insertion Altitude 420km 505km
Ground Sampling Distance
(Nadir)
2.7m-4.0m 4.0m
Sensor Type Bayer-masked CCD camera
Spectral Bands Blue: 420-530nm
Green: 500-590nm
Red: 610-700nm
NIR: 760-860nm
Dove Constellation

Dove Constellation
Flock 2p (12) Flock 3p (88)
Flock 2k (48)
Active Calibrated Satellites in Sun Synchronous
and ISS orbits
Flock 2e (32)
(ISS)

Radiometric Correction Flow

Image Calibration
Pixel-Level Calibration
● Removes effects of the optics on
the imagery (vignette)
● Removes dust and smudges
● Normalizes image for acquisition
environment
● Normalizes image to nominal
acquisition parameters
Image Calibration
● Converts corrected pixel DNs to
units of Radiance
● Calibration model is unique to
each satellite
● Monitored and updated through
time using on-orbit methods

Raw Image

Where
C = corrected image
R = raw image
F = flat field image
D = dark field
m = image-averaged value of (F-D)
(R - D) * m
C =
(F - D)
Dark Fielding and Flat Fielding

The Dark Field
Corrects:
● Camera bias and reduces tap imbalance
Measurement:
● Collected pre-launch
● On-Orbit: Images over the Pacific at night
when the satellite is in eclipse.
● Scaled by Analog gain of image being
processed
Operational Range:
0 - 65 degrees C

Creating and Storing Dark Field
● Dark Field temperature model
created for each tap, for every
satellite
● Model is predicted DN by
temperature range
● Dark Fields are always
collected with an Analog
Offset of 64 (equivalent of 16
DN).

The Flat Field
Corrects
● Vignette smudges & dust, and some tap
imbalance
Measurement:
● Collected pre-launch - average of 100
scenes from integrating sphere
● On-Orbit: Average of 2000 cloud scenes
● Each ‘component’ image is dark
subtracted
● Unique flat field for each TDI camera
setting used on-orbit

TDI Flat Fields
● All Dove Cameras operate using Time
Delayed Integration (TDI).
● TDI Results in a physical shift in how the
pixels integrate - increases SNR
● Artifacts like dust on the lens get elongated
compared to their shape without TDI.
● If you use a flat field generated with a different
number of TDI lines (Or direction) than the
image being corrected, you introduce image
artifacts.
Image artifact (dust on optics) made worse
by using a Flat Field that didn’t match TDI of
scene

Blue Band
Before On-Orbit Dark
Field/Flat Fielding

After On-Orbit Dark
Field/Flat Fielding
Blue Band

Smudge on the
Lens
Dust on the
Lens

Mostly
removed...

Collect Settings & Debayer
Exposure time and
reconstruction of full image
Collect Settings:
● Corrects for scene settings at time of acquisition
○ Exposure Time and TDI
● Mosaics Bayer Mask image to a 4 band image
using Microsoft Debayering Algorithm.
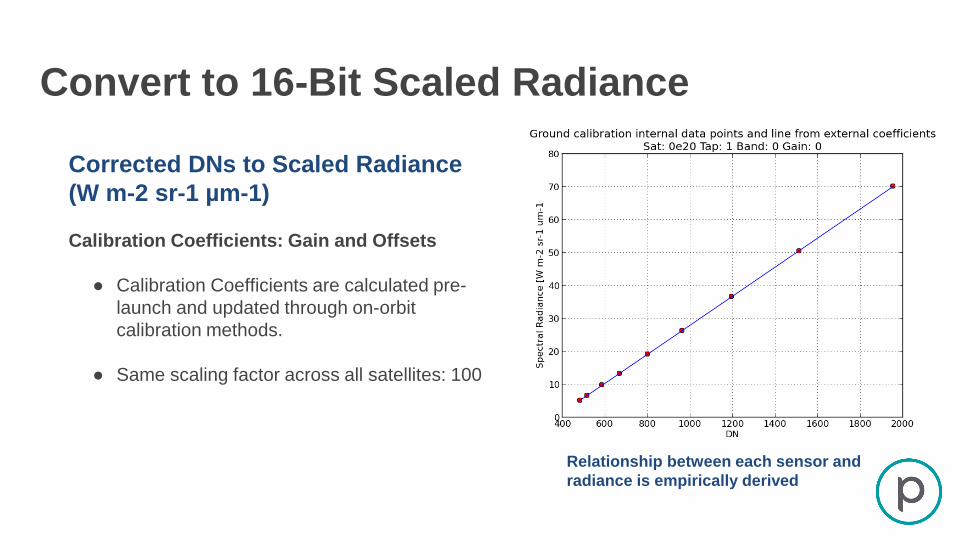
Convert to 16-Bit Scaled Radiance
Corrected DNs to Scaled Radiance
(W m-2 sr-1 µm-1)
Calibration Coefficients: Gain and Offsets
● Calibration Coefficients are calculated pre-
launch and updated through on-orbit
calibration methods.
● Same scaling factor across all satellites: 100
Relationship between each sensor and
radiance is empirically derived
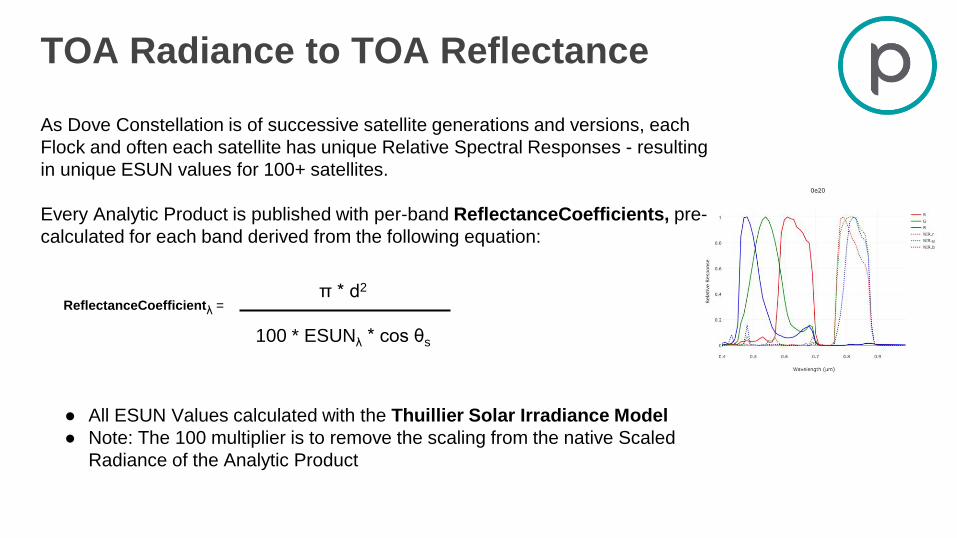
TOA Radiance to TOA Reflectance
As Dove Constellation is of successive satellite generations and versions, each
Flock and often each satellite has unique Relative Spectral Responses - resulting
in unique ESUN values for 100+ satellites.
Every Analytic Product is published with per-band ReflectanceCoefficients, pre-
calculated for each band derived from the following equation:
● All ESUN Values calculated with the Thuillier Solar Irradiance Model
● Note: The 100 multiplier is to remove the scaling from the native Scaled
Radiance of the Analytic Product
π * d2
100 * ESUNλ * cos θs
ReflectanceCoefficientλ =

TOA Radiance Image - Analytic Product

© Planet - Proprietary & ConfidentialShallow Seas, Bahamas FEB 4, 2016
On-Orbit Radiometric Calibration

Calibration Approach
Cross Calibrating Doves to RapidEye
● Instantaneous crossovers sampled,
corrected, and stored.○ Crossovers sourced from RapidEye (RE) and
Dove to Dove Crossovers if RE data lacking
● Crossovers cover the brightness range from
50 to 150 watts/m-2 sr-1 µm-1
● Average of 5 crossover events and 500
samples used per-satellite/band to update
calibration

Calibration Sites
Globally distributed network of desert calibration sites
27 sites covering a range of bright and dark features to capture full dynamic range

Instantaneous Crossovers
Dove and Landsat 8 crossover event over
Algodones Dunes
Crossover Event Requirements
Maximum time delta between collects: 2 hours
Maximum view angle: 10 degrees
Maximum saturated pixel percent: 20%
Maximum cloud percent: 20%
Mask clouds & saturated pixels with UDM
Approach is fully automated - crossovers are
queried daily, processed, and measurements
stored for analysis.

Calibration Site Sampling
Dunhuang
Namibia B Railroad Valley
Criteria for Calibration Site Sampling
● Sample size is 1000 X 1000 Pixels (~3.5 km
resolution)
● Sampling in spectrally homogenous
locations within calibration site
● Spectra is characterized using Hyperion
Imagery
Example Calibration Site sample grids

Hyperion-Derived SpectraInitial process: Derive a single spectra for a calibration
site representing the yearly average spectra.
● Derived from 12 hyperion images per site
● Source 1 hyperion image for each month
○ Query for available 2015 data and moving
backwards in time until a collect for a given
month is found
● Future steps will be to derive seasonal average
spectra
Characterizing Calibration Sites
Example Hyperion
Image used to derive
calibration site spectra

Dove & RapidEye RSR

Dove & Landsat 8 RSR

Crossover samples are compared in TOA Radiance Space
Spectral Band Adjustment Factor (SBAF)Calculated per-band to adjust for RSR differences between sensors
Sun Angle CorrectionAdjusts for up to 2 hour time difference between collects
* Applied to Landsat 8 imagery, correcting Landsat 8 to Planet Dove bands & crossover illumination
Crossover Sample Processing

Fitting Calibration Model
Uses a Bayesian Approach:
Mixed Linear Models
● A ridge parameter is estimated using crossover data
from all satellites in the constellation
● Offset for each satellite is forced to be constant
across constellation
○ Measured as the per-band average offset for
scenes near 40 W m-2 sr-1 μm-1 radiance
● Per-satellite fits are estimated using their discrete
crossovers with Rapideye, weighted by the ridge
parameter of the constellation and forced through
the constellation-wide offset.
Fitting the ridge parameter with all
crossover data

Assessing Ground-Derived Calibration
Absolute Accuracy & Precision @1sigma by satellite

After Calibration Update Applied
Absolute Accuracy & Precision @1sigma by satellite

PlanetScope RadCalNet Comparison
Abs AccuracyPrecision (1-
sigma)
Blue -5.15 4.33
Green -1.08 4.61
Red 0.0005 3.48
NIR -3.50 3.76
13 Collects from 7 Satellites
between July and October 2016
On-Orbit Calibration: Railroad ValleyExcluding Baotou & La Crau Sites

© Planet - Proprietary & Confidential
Monitoring of satellite health
The lunar data is used to monitor
long term trends and satellite health
● The first satellites started collecting moon
shots in Q4 of 2016 and have had
continuous monitoring moon shots since
then
● Moon shots have helped to diagnose and
validate fixes to misaligned star cams and
other hardware problems
● This graph shows the results for a
satellite’s four taps in all the bands
