on-orbit modulation transfer function (mtf) measurements ... · on-orbit modulation transfer...
TRANSCRIPT

On-orbit Modulation Transfer Function (MTF) Measurements for
IKONOS and QuickBird
Civil Commercial Imagery Evaluation Workshop
3/15/2006
Dennis Helder, Jason Choi, and Cody AndersonImage Processing LaboratoryElectrical Engineering and Computer Science DepartmentSouth Dakota State University
https://ntrs.nasa.gov/search.jsp?R=20070038252 2019-02-08T18:58:53+00:00Z
2
Outline• Introduction• Techniques• Target/Site Description• Results
– Ikonos– Quickbird
• Conclusions
Other IP Lab Contributors:Tim RugglesJim DewaldShriharsha MadhavanRuss VanDerWerffAmit AngalCam HelderLarry LeighDave Aaron
This work was supported by NASA grant NNS04AB66C

3
Introduction
• Point Spread Function– A method of evaluating the spatial
resolution of an imaging system.– A measure of the spread of a single
point of light. • Modulation Transfer function
(MTF)– MTF is a measure of the spatial
frequency response.– MTF is often calculated from the point
spread function (PSF).– System response at the Nyquist
frequency (or 0.5 cycle/pixel) is often used as a figure of merit.
0 0.05 0.1 0.15 0.2 0.25 0.3 0.35 0.4 0.45 0.50
0.1
0.2
0.3
0.4
0.5
0.6
0.7
0.8
0.9
1MTF
Nor
mal
ized
val
ue
Normalized frequency
Value at Nyquist = 0.0568

4
• 2-dimensional PSF and MTF are difficult to obtain.• Often 1 dimensional functions are used:
– 1-D PSF is the line spread function (LSF).– LSF can be obtained by differentiation of the edge spread function
(ESF).
)},({),( yxPSFH yx ℑ=ωω
)0,0(),(
),(H
HMTF yx
yx
ωωωω =

5
Techniques• Edge Method
– Sub-pixel edge locations were found by Fermi function fit.– A least-square error line was calculated through the edge locations.– Modified Savitzky-Golay filtering was applied on each line.– The filtered profile was differentiated to obtain LSF– MTF calculated by applying Fourier transform to LSF.
Edge Method

6
• Pulse method– A pulse input is given to the imaging system.– Output of the system is the resulting image.– Edge detection and mSG filtering was applied to obtain
output profile. – Take Fourier transform of the input and output.– MTF is calculated by dividing output by input and
normalizing DC component to unity.
Pulse method 10 12 14 16 18 20 22 24
2
4
6
8
10
12
14
Edge detection
Pix
els
Pixels
Curve inflection pointLeast square fit line

7
SNR Definition

8
Target Description
Field Plan

9
Field campaign pictures on 6-22-2005

10
• NASA Stennis Tarp Target– Radiometrically and spectrally stable target with a large
DN difference from 3.6% and 52.1% reflectance panels.
– Edge oriented to obtained sub-sampled edge profile.– Blue tarps oriented at same angle.
NASA Stennis tarps
6°True North
Edge Angle

11
IKONOS Acquisitions• IKONOS Scene Information
Date Sensor Targets Resampling or MTF processing Product Type
CC / MTFC On Standard Geometrically Corrected
CC / MTFC Off Standard Geometrically Corrected
8/1/2005 IKONOSStennis tarps
Blue tarpsMirrors

12
Test image
Pix
el
Pixel
Angle=5.404 [deg]
5 10 15 20 25 30 35
5
10
15
Sub-pixel edge location
Least square error line
-5 -4 -3 -2 -1 0 1 2 3 4 5200
400
600
800
1000
1200
1400mSG filtering with raw data
DN
Pixel
DNdiff
= 1040.92STD
ave = 11.25
SNR = 92.54
Raw data
mSG filtering
-5 -4 -3 -2 -1 0 1 2 3 4 5-0.2
-0.1
0
0.1
0.2
0.3
0.4
0.5
0.6
0.7
0.8
0.9
1
1.1
1.2
FWHM = 1.6226 [Pixel]
Trimmed LSF
Nor
mal
ized
Diff
eren
tiatio
n va
lue
Pixel0 0.1 0.2 0.3 0.4 0.5
0
0.1
0.2
0.3
0.4
0.5
0.6
0.7
0.8
0.9
1
1.1
1.2MTF
Normalized frequency
Nor
mal
ized
val
ue
Value at Nyquist = 0.1117
Date Sensor Band Product Target Elevation Azimuth
8/1/2005 IKONOS Pan. CC/MTF off Stennis 66.0 118.7

13
Test image
Pix
el
Pixel
Angle=5.384 [deg]
5 10 15 20 25 30 35
5
10
15
Sub-pixel edge location
Least square error line
-5 -4 -3 -2 -1 0 1 2 3 4 5
200
400
600
800
1000
1200
1400mSG filtering with raw data
DN
Pixel
DNdiff = 1043.96STDave = 12.93
SNR = 80.74
Raw data
mSG filtering
-5 -4 -3 -2 -1 0 1 2 3 4 5-0.2
-0.1
0
0.1
0.2
0.3
0.4
0.5
0.6
0.7
0.8
0.9
1
1.1
1.2
FWHM = 1.1322 [Pixel]
Trimmed LSF
Nor
mal
ized
Diff
eren
tiatio
n va
lue
Pixel0 0.1 0.2 0.3 0.4 0.5
0
0.1
0.2
0.3
0.4
0.5
0.6
0.7
0.8
0.9
1
1.1
1.2MTF
Normalized frequency
Nor
mal
ized
val
ue
Value at Nyquist = 0.4983
Date Sensor Band Product Target Elevation Azimuth
8/1/2005 IKONOS Pan. CC/MTF on Stennis 66.0 118.7

14
5 10 15
2
4
6
8
10
12
Pixel
Pix
el
Test image
Angle = 5.112 [deg]
Fermi edge location
Least square error line
-4 -3 -2 -1 0 1 2 3 4 5 6 7300
400
500
600
700
800
900
1000
1100Modified S-Golay interpolation with raw data
DN
Pixel
DNdiff = 629.36
STDave = 8.17
SNR = 77.03
Raw data
Modified S-Golay filtering
-3 -2 -1 0 1 2 3 4 5 6-0.2
0
0.2
0.4
0.6
0.8
1
1.2
Pixel
Nor
mal
ized
Diff
eren
tiatio
n va
lue
Trimmed LSF
FWHM = 3.0169 [Pixel] Output
Input
0 0.1 0.2 0.3 0.4 0.5 0.6 0.7 0.8 0.9 10
10
20
30
40
50
60
Normalized Frequency
Fou
rier
tran
sfom
val
ue o
f in
put
and
outp
ut Fourier tranform of input and ouput
Discrete Output
Discrete Input
0 0.1 0.2 0.3 0.4 0.5 0.6 0.7 0.8 0.9 10
10
20
30
40
50
60
70
Normalized Frequency
Fou
rier
tran
sfor
m
Continuous Fourier tranform
Discrete Output
Continuous Input
0 0.1 0.2 0.3 0.4 0.50
0.10.20.30.40.50.60.70.80.9
11.11.2
MTF from Continuous Input
Normalized frequency
Value at Nyquist = 0.3745
Nor
mal
ized
MT
F v
alue
Date Sensor Band Product Target Elevation Azimuth
8/1/2005 IKONOS Blue CC/MTF off Blue tarp 66.0 118.7

15
5 10 15
2
4
6
8
10
12
14
Pixel
Pix
el
Test image
Angle = 5.850 [deg]
Fermi edge location
Least square error line
-4 -3 -2 -1 0 1 2 3 4 5 6 7300
400
500
600
700
800
900
1000
1100Modified S-Golay interpolation with raw data
DN
Pixel
DNdiff = 674.37
STDave = 8.43
SNR = 79.98
Raw data
Modified S-Golay filtering
-3 -2 -1 0 1 2 3 4 5 6-0.2
0
0.2
0.4
0.6
0.8
1
1.2
Pixel
Nor
mal
ized
Diff
eren
tiatio
n va
lue
Trimmed LSF
FWHM = 3.0051 [Pixel] Output
Input
0 0.1 0.2 0.3 0.4 0.5 0.6 0.7 0.8 0.9 10
10
20
30
40
50
60
Normalized Frequency
Fou
rier
tran
sfom
val
ue o
f in
put
and
outp
ut Fourier tranform of input and ouput
Discrete Output
Discrete Input
0 0.1 0.2 0.3 0.4 0.5 0.6 0.7 0.8 0.9 10
10
20
30
40
50
60
70
Normalized Frequency
Fou
rier
tran
sfor
m
Continuous Fourier tranform
Discrete Output
Continuous Input
0 0.1 0.2 0.3 0.4 0.50
0.10.20.30.40.50.60.70.80.9
11.11.2
MTF from Continuous Input
Normalized frequency
Value at Nyquist = 0.5207
Nor
mal
ized
MT
F v
alue
Date Sensor Band Product Target Elevation Azimuth
8/1/2005 IKONOS Blue CC/MTF on Blue tarp 66.0 118.7
16
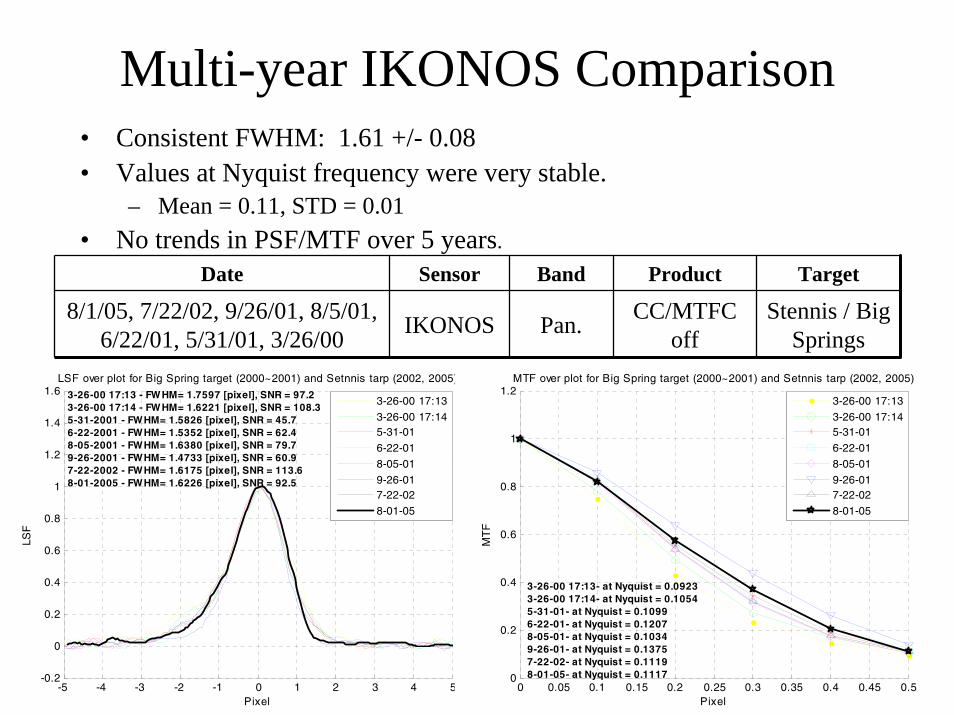
Multi-year IKONOS Comparison• Consistent FWHM: 1.61 +/- 0.08• Values at Nyquist frequency were very stable.
– Mean = 0.11, STD = 0.01• No trends in PSF/MTF over 5 years.
-5 -4 -3 -2 -1 0 1 2 3 4 5-0.2
0
0.2
0.4
0.6
0.8
1
1.2
1.4
1.6
Pixel
LSF
LSF over plot for Big Spring target (2000~2001) and Setnnis tarp (2002, 2005)
3-26-00 17:13 - FWHM= 1.7597 [pixel], SNR = 97.23-26-00 17:14 - FWHM= 1.6221 [pixel], SNR = 108.35-31-2001 - FWHM= 1.5826 [pixel], SNR = 45.76-22-2001 - FWHM= 1.5352 [pixel], SNR = 62.48-05-2001 - FWHM= 1.6380 [pixel], SNR = 79.79-26-2001 - FWHM= 1.4733 [pixel], SNR = 60.97-22-2002 - FWHM= 1.6175 [pixel], SNR = 113.68-01-2005 - FWHM= 1.6226 [pixel], SNR = 92.5
3-26-00 17:13
3-26-00 17:145-31-01
6-22-01
8-05-01
9-26-017-22-02
8-01-05
0 0.05 0.1 0.15 0.2 0.25 0.3 0.35 0.4 0.45 0.50
0.2
0.4
0.6
0.8
1
1.2
Pixel
MTF over plot for Big Spring target (2000~2001) and Setnnis tarp (2002, 2005)
3-26-00 17:13- at Nyquist = 0.09233-26-00 17:14- at Nyquist = 0.10545-31-01- at Nyquist = 0.10996-22-01- at Nyquist = 0.12078-05-01- at Nyquist = 0.10349-26-01- at Nyquist = 0.13757-22-02- at Nyquist = 0.11198-01-05- at Nyquist = 0.1117
MT
F
3-26-00 17:13
3-26-00 17:145-31-01
6-22-01
8-05-01
9-26-017-22-02
8-01-05
Date Sensor Band Product Target
8/1/05, 7/22/02, 9/26/01, 8/5/01, 6/22/01, 5/31/01, 3/26/00 IKONOS Pan. CC/MTFC
offStennis / Big
Springs

17
IKONOS SDSU campus on 8/1/2005CC Without MTFCCC With MTFC
Noisier & Sharper than CC

18
IKONOS Summary• Very consistent, high-quality sensor
– Pan FWHM = 1.61 +/- 0.08– Pan MTF @ Nyquist = 0.11 +/- 0.01– Multispectral MTF @ Nyquist = 0.52 (2005 data)
• ‘MTFC on’ processing provides increased MTF response with typical trade-off of increased contrast with some additional noise in Pan, less in Blue band.– Pan FWHM = 1.08 +/- 0.10– Pan MTF @ Nyquist = 0.48 +/- 0.08
• No indication of sensor degradation in five years.

19
Quickbird Acquisitions• Quickbird scene information
Date Sensor Targets Resampling or MTF processing Product Type
ResamplingKernel= CC
Standard2A(Radiometrically corrected)
MTF Standard2A
CC Standard2A
MTF Standard2A
CC Standard2A
MTF Standard2A10/18/2005 QuickBird
Stennis tarpsBlue tarps
Mirrors CC Standard2A
6/22/2005 QuickBirdVertical Stennis
tarpsBlue tarps
Mirrors MTF Standard2A
10/5/2004 QuickbirdBlue tarps
Mirrors
8/30/2004 QuickbirdBlue tarps
Mirrors

20
Quickbird 8-30-2004 Quickbird 10-5-2004
QB 6-22-2005 QB 10-18-2005

21
Test image
Pix
el
Pixel
Angle=-5.787 [deg]
10 20 30 40 50 60
5
10
15
20
25
Sub-pixel edge location
Least square error line
-5 -4 -3 -2 -1 0 1 2 3 4 5
200
400
600
800
1000
1200
mSG filtering with raw data
DN
Pixel
DNdiff = 1038.19STDave = 10.02
SNR = 103.62
Raw data
mSG filtering
-5 -4 -3 -2 -1 0 1 2 3 4 5-0.2
-0.1
0
0.1
0.2
0.3
0.4
0.5
0.6
0.7
0.8
0.9
1
1.1
1.2
FWHM = 1.8939 [Pixel]
Trimmed LSF
Nor
mal
ized
Diff
eren
tiatio
n va
lue
Pixel0 0.1 0.2 0.3 0.4 0.5
0
0.1
0.2
0.3
0.4
0.5
0.6
0.7
0.8
0.9
1
1.1
1.2MTF
Normalized frequency
Nor
mal
ized
val
ue
Value at Nyquist = 0.0364
Date Sensor Band Resampling Target Elevation Azimuth
6/22/2005 Quickbird Pan. CC Stennis along 88.2 75.9
22
Test image
Pix
el
Pixel
Angle=-5.681 [deg]
10 20 30 40 50 60
5
10
15
20
25
Sub-pixel edge location
Least square error line
-5 -4 -3 -2 -1 0 1 2 3 4 5
200
400
600
800
1000
1200
1400
mSG filtering with raw data
DN
Pixel
DNdiff = 1041.02STDave = 15.78
SNR = 65.97
Raw data
mSG filtering
-5 -4 -3 -2 -1 0 1 2 3 4 5-0.2
-0.1
0
0.1
0.2
0.3
0.4
0.5
0.6
0.7
0.8
0.9
1
1.1
1.2
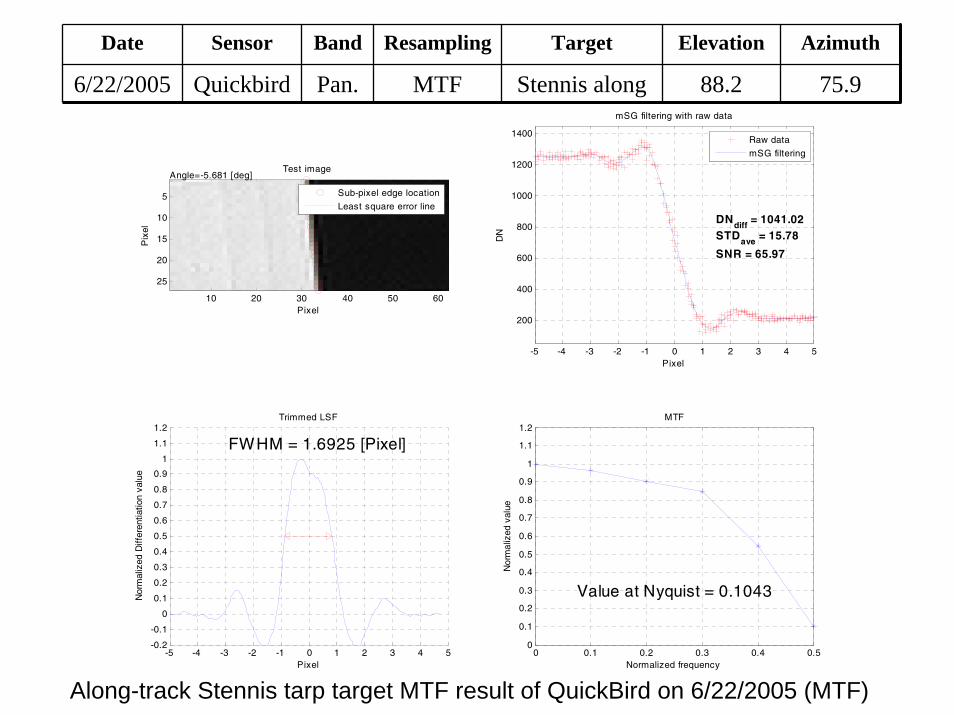
FWHM = 1.6925 [Pixel]
Trimmed LSF
Nor
mal
ized
Diff
eren
tiatio
n va
lue
Pixel0 0.1 0.2 0.3 0.4 0.5
0
0.1
0.2
0.3
0.4
0.5
0.6
0.7
0.8
0.9
1
1.1
1.2MTF
Normalized frequency
Nor
mal
ized
val
ue
Value at Nyquist = 0.1043
Along-track Stennis tarp target MTF result of QuickBird on 6/22/2005 (MTF)
Date Sensor Band Resampling Target Elevation Azimuth
6/22/2005 Quickbird Pan. MTF Stennis along 88.2 75.9

23
5 10 15
5
10
15
20
Pixel
Pix
el
Test image
Angle = 5.912 [deg]
Fermi edge location
Least square error line
-4 -3 -2 -1 0 1 2 3 4 5 6 7
200
400
600
800
1000Modified S-Golay interpolation with raw data
DN
Pixel
DNdiff = 612.68
STDave = 5.41
SNR = 113.16
Raw data
Modified S-Golay filtering
-3 -2 -1 0 1 2 3 4 5 6-0.2
0
0.2
0.4
0.6
0.8
1
1.2
Pixel
Nor
mal
ized
Diff
eren
tiatio
n va
lue
Trimmed LSF
FWHM = 2.3216 [Pixel] Output
Input
0 0.1 0.2 0.3 0.4 0.5 0.6 0.7 0.8 0.9 10
10
20
30
40
50
Normalized Frequency
Fou
rier
tran
sfom
val
ue o
f in
put
and
outp
ut Fourier tranform of input and ouput
Discrete Output
Discrete Input
0 0.1 0.2 0.3 0.4 0.5 0.6 0.7 0.8 0.9 10
10
20
30
40
50
Normalized Frequency
Fou
rier
tran
sfor
m
Continuous Fourier tranform
Discrete Output
Continuous Input
0 0.1 0.2 0.3 0.4 0.50
0.10.20.30.40.50.60.70.80.9
11.11.2
MTF from Continuous Input
Normalized frequency
Value at Nyquist = 0.1679
Nor
mal
ized
MT
F v
alue
Date Sensor Band Resampling Target Elevation Azimuth
6/22/2005 Quickbird Blue CC Blue tarp cross 88.2 75.9

24
5 10 15
5
10
15
20
Pixel
Pix
el
Test image
Angle = 5.699 [deg]
Fermi edge location
Least square error line
-4 -3 -2 -1 0 1 2 3 4 5 6 7
200
400
600
800
1000Modified S-Golay interpolation with raw data
DN
Pixel
DNdiff = 761.86
STDave = 6.75
SNR = 112.84
Raw data
Modified S-Golay filtering
-3 -2 -1 0 1 2 3 4 5 6-0.2
0
0.2
0.4
0.6
0.8
1
1.2
Pixel
Nor
mal
ized
Diff
eren
tiatio
n va
lue
Trimmed LSF
FWHM = 2.0699 [Pixel] Output
Input
0 0.1 0.2 0.3 0.4 0.5 0.6 0.7 0.8 0.9 10
10
20
30
40
50
Normalized Frequency
Fou
rier
tran
sfom
val
ue o
f in
put
and
outp
ut Fourier tranform of input and ouput
Discrete Output
Discrete Input
0 0.1 0.2 0.3 0.4 0.5 0.6 0.7 0.8 0.9 10
10
20
30
40
50
Normalized Frequency
Fou
rier
tran
sfor
m
Continuous Fourier tranform
Discrete Output
Continuous Input
0 0.1 0.2 0.3 0.4 0.50
0.10.20.30.40.50.60.70.80.9
11.11.2
MTF from Continuous Input
Normalized frequency
Value at Nyquist = 0.2306
Nor
mal
ized
MT
F v
alue
Date Sensor Band Resampling Target Elevation Azimuth
6/22/2005 Quickbird Blue MTF Blue tarp cross 88.2 75.9

250 0.05 0.1 0.15 0.2 0.25 0.3 0.35 0.4 0.45 0.5
0
0.2
0.4
0.6
0.8
1
1.2
Normalized frequency [cycle/pixel]
Nor
mal
ized
MT
F
Stennis tarp MTF plots on 6/22/05 (CC) 10/18/05 (MTF) from QuickBird
6/22/05, CC = 0.0364 6/22/05, MTF = 0.104310/18/05, CC = 0.093810/18/05, MTF = 0.2581
6/22/05,CC, along-T.
6/22/05, MTF, along-T.
10/18/05, CC, across-T.
10/18/05, MTF, across-T.
QuickBird panchromatic band Along / Cross Track Direction Comparison
• First estimate of along-track PSF/MTF.• Along-track PSF/MTF not significantly different than cross-
track.
-5 -4 -3 -2 -1 0 1 2 3 4 5-0.4
-0.2
0
0.2
0.4
0.6
0.8
1
1.2
1.4
Pixel
Nor
mal
ized
LS
F
Stennis tarp LSF plots on 6/22/05 (CC) 10/18/05 (MTF) from QuickBird
6/22/05 CC = 1.8939 [pixel], SNR = 103.6 6/22/05 MTF = 1.6925 [pixel], SNR = 66.010/18/05 CC = 1.8945 [pixel], SNR = 44.210/18/05 MTF = 1.7109 [pixel], SNR = 56.4
6/22/05, CC, along-T.
6/22/05, MTF, along-T.
10/18/05, CC, across-T.
10/18/05, MTF, across-T.
Date Sensor Band Resampling Target
6/22/05, 10/18/05 Quickbird Pan. MTF / CC Stennis

26-3 -2 -1 0 1 2 3 4 5 6 7
-0.2
0
0.2
0.4
0.6
0.8
1
1.2
1.4
1.6
Pixel
Nor
mal
ized
Pul
se R
espo
nse
Fun
ctio
n (P
RF
)
PRF plots for QuickBird on 6/22/05 and 10/18/05 with CC interpolated scenes
6/22/05 Cross-T. FWHM = 2.3216 [pixel], SNR = 113.210/18/05 Cross-T. FWHM= 2.3264 [pixel], SNR = 94.6 6/22/05 Along-T. FWHM = 2.4979 [pixel], SNR = 72.010/18/05 Along-T. FWHM= 2.4777 [pixel], SNR = 22.4
6/22/05 Cross-T.
10/18/05 Cross-T.6/22/05 Along-T.
10/18/05 Along-T.
0 0.05 0.1 0.15 0.2 0.25 0.3 0.35 0.4 0.45 0.50
0.2
0.4
0.6
0.8
1
1.2
Normalized frequency [cycle/pixel]
MTF plots for QuickBird on 6/22/05 and 10/18/05 with CC interpolated scenes
6/22/05 Cross-T. MTF=0.167910/18/05 Cross-T. MTF=0.1420 6/22/05 Along-T. MTF=0.127010/18/05 Along-T. MTF=0.1095
Nor
mal
ized
MT
F
6/22/05 Cross-T.
10/18/05 Cross-T.
6/22/05 Along-T.
10/18/05 Along-T.
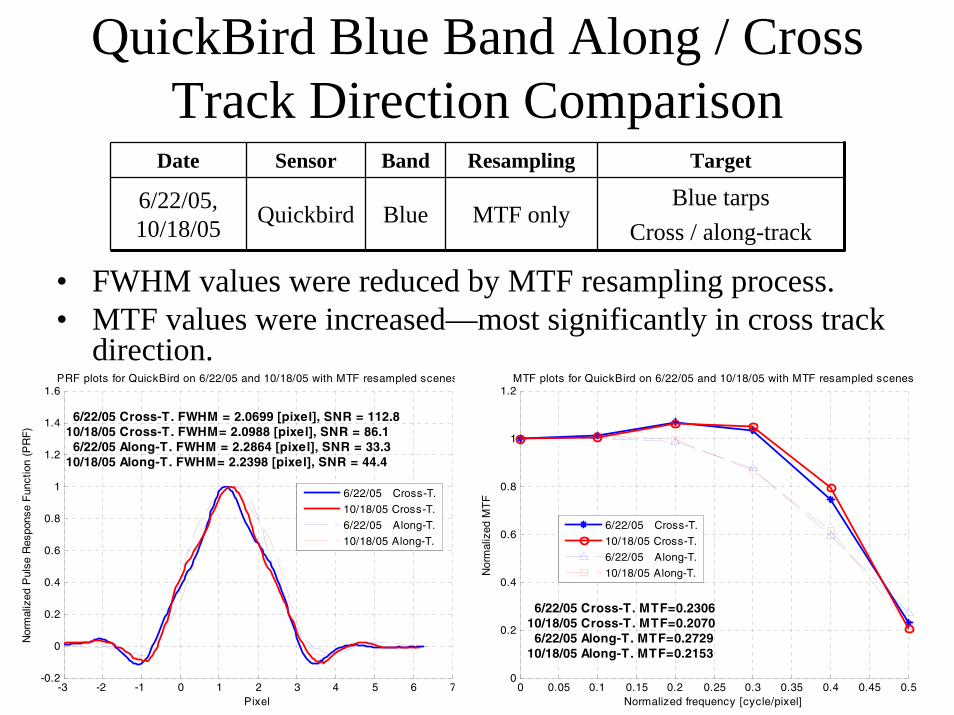
QuickBird Blue Band Along / Cross Track Direction Comparison
• Cross-track profile exhibits narrower PRF FWHM and under shoots. • System MTF shape differs in the orthogonal directions.
Date Sensor Band Resampling Target
6/22/05, 10/18/05 Quickbird Blue CC only
Blue tarps Cross / along-track
27
QuickBird Blue Band Along / Cross Track Direction Comparison
• FWHM values were reduced by MTF resampling process.• MTF values were increased—most significantly in cross track
direction.
-3 -2 -1 0 1 2 3 4 5 6 7-0.2
0
0.2
0.4
0.6
0.8
1
1.2
1.4
1.6
Pixel
Nor
mal
ized
Pul
se R
espo
nse
Fun
ctio
n (P
RF
)
PRF plots for QuickBird on 6/22/05 and 10/18/05 with MTF resampled scenes
6/22/05 Cross-T. FWHM = 2.0699 [pixel], SNR = 112.810/18/05 Cross-T. FWHM= 2.0988 [pixel], SNR = 86.1 6/22/05 Along-T. FWHM = 2.2864 [pixel], SNR = 33.310/18/05 Along-T. FWHM= 2.2398 [pixel], SNR = 44.4
6/22/05 Cross-T.
10/18/05 Cross-T.
6/22/05 Along-T.
10/18/05 Along-T.
0 0.05 0.1 0.15 0.2 0.25 0.3 0.35 0.4 0.45 0.50
0.2
0.4
0.6
0.8
1
1.2
Normalized frequency [cycle/pixel]
Nor
mal
ized
MT
F
MTF plots for QuickBird on 6/22/05 and 10/18/05 with MTF resampled scenes
6/22/05 Cross-T. MTF=0.230610/18/05 Cross-T. MTF=0.2070 6/22/05 Along-T. MTF=0.272910/18/05 Along-T. MTF=0.2153
6/22/05 Cross-T.
10/18/05 Cross-T.
6/22/05 Along-T.
10/18/05 Along-T.
Date Sensor Band Resampling Target
6/22/05, 10/18/05 Quickbird Blue MTF only
Blue tarps Cross / along-track

28
Band Resamp. mean sigma mean sigma Obs.
Pan. CC Cross 1.89 0.09 1Along 1.89 0.04 1
MTF Cross 1.71 0.26 1Along 1.69 0.10 1
Blue CC Cross 2.32 0.01 0.18 0.07 4Along 2.49 0.01 0.12 0.01 2
MTF Cross 2.11 0.05 0.30 0.17 4Along 2.27 0.02 0.25 0.03 2
Quickbird Results Summary 2004-2005Scan
Direction
FWHM (gsd)
MTF at Nyquist (cycles/gsd)
Notes:1. Blue Band FWHM’s are for Pulse Response Functions.2. Only one Pan band observation! Essentially same PSF/MTF in
both scan directions.3. MTF resampling provides noticeable contrast improvement;
SNR is lowered, but still acceptable.4. Overall SNR is good to excellent.5. PRF is very repeatable in Blue band; MTF is noticeably less so

29
Quickbird SDSU campus on 6/22/2005CC resamplingMTF resampling MTF resampling CC resampling
Noisier & Sharper than CC

30
2002/2003/2005 QuickBird Comparisons
• GSD changed from 0.7 to 0.6 meters after 2003.
• Spatial resolution performance appears consistent from 2002 to 2005.
-3 -2 -1 0 1 2 3-0.2
0
0.2
0.4
0.6
0.8
1
1.2
1.4
meters
Nor
mal
ized
LS
F
LSF over plot for Stennis tarp
7/20/02, CC, FWHM= 1.0755 [pixel], SNR = 100.1
8/25/02, CC, FWHM= 1.0436 [pixel], SNR = 100.5
9/7/02, CC, FWHM= 1.0228 [pixel], SNR = 141.39/15/03, CC, FWHM= 0.8596 [pixel], SNR = 110.4
10/18/05, CC, FWHM= 1.1367 [pixel], SNR = 44.2
0 0.1 0.2 0.3 0.4 0.5 0.6 0.7 0.8 0.9 10
0.2
0.4
0.6
0.8
1
1.2
Normalized frequency [cycle/meter]
Nor
mal
ized
MT
F
MTF over plot for Stennis tarp target
7/20/02, CC, MTF = 0.15248/25/02, CC, MTF = 0.1575
9/7/02, CC, MTF = 0.1786
9/15/03, CC, MTF = 0.1449
10/18/05, CC, MTF = 0.0938
Nyquist location in 2002Nyquist location after 2003
Date Sensor Band Resampling Target
7/20/02, 8/25/02, 9/7/02, 9/15/03, 10/18/05 Quickbird Pan. CC Stennis tarp

31
Overall Quickbird Conclusions
• Initial along-scan PSF/MTF estimates indicate slightly more blur than cross-scan, as expected.
• Good to excellent SNR.• MTF compensation provides noticeable contrast
boost with normal loss of SNR in Panchromatic band, but minimal loss of SNR in Blue band.
• No degradation of Panchromatic band PSF/MTF indicated from 2002 through 2005.