on-field event management: minimum impact, maximum readiness · on-field event management: minimum...
TRANSCRIPT

On-Field Event Management:Minimum Impact, Maximum Readiness
QuEST Global
Rajesh Kumar HandujaChief Engineer Aero engines, SDU APAC

On-Field Event Management: Minimum Impact, Maximum Readiness
On-Field Event Management: Minimum Impact, Maximum Readiness
1© 2016, QuEST Global Services
Introduction
Aviation industry is a highly capital intensive
industry. In the midst of intense competition,
profit margins are getting squeezed by the day.
Airlines and aero engine manufacturers are
striving hard to improve their profit margins. It is a
fact that their profits are directly related to the
operational readiness of the equipment. A
potential way of improving profits, therefore, is
by reducing the maintenance expenditures and
downtime.
Original Equipment Manufacturers (OEM)
design and manufacture the equipment with
theoretically robust reliability predictions.
However, the actual performance of the
equipment can significantly vary from
predictions depending on the operating
environment and other conditions.
Theoretically, aero engines and the associated
hardware are designed to run seamlessly for
their entire predicted life (e.g. 20,000 hours). In
reality, this is hardly the case, and during the
service operations, a variety of unpredicted
faults like fluid leaks, high Exhaust Gas
Temperature (EGT), and valves not closing will
occur. These issues are termed as on-field
events that lead to undue delays in operation,
cancellation of flights, or in some cases, to an
Aircraft-On-Ground (AOG) situation.
These unpredicted events cause interruptions
leading to additional maintenance and penalties
that finally eat up the profits. While these events
are unavoidable, the impact on profits can be
reduced if the operational impact of the events is
minimized. To reduce the impact of the events, it
is vital to have a well-structured event
management (EM) mechanism.
Ideally, a well-structured EM process should
have the following constituents:
1) Real-time data gathering2) Data categorization3) Data analysis to identify the key issues as well as repeating issues4) Root cause analysis mechanism5) Identification of corrective actions6) Development and implementation of corrective action7) Preventive improvement action
The following sections will describe the EM
process constituents in detail, present a case
study on EM, and summarize how EM capability
at QuEST can help the customers decrease the
cost impact of unplanned maintenance events.
Data Gathering
There can be various ways of collecting on-field
event data. Airlines can maintain their data
records of the events and share this data with the
aero engine manufacturers on a regular basis.
Alternatively, an online database (owned by the
aero engine manufacturer and accessible to the
airliners) can be an ideal way of capturing real-
time data and ensuring availability of data to aero
engine manufacturers for further processing. In
the current scenario, most aero engine
manufacturers have set up their online database
systems with access to key stakeholders.
Data Categorization
The available event data should be categorized
under various failure headings for allocating
analysis activities to various departments. For

example, the events related to the failure of the
ignition system should be separated from the
events related to the smoke in the cabin. The
proper categorization will facilitate effective
allocation of the events into appropriate areas for
further analysis. The data should be segregated
based on engine type. This is required so that the
OEMs or suppliers will focus on addressing the
relevant failure events rather than spending time
in reviewing everything
Data Analysis
The data, post-categorization, should be
analyzed in detail to understand the impact and
root cause, as well as for identifying corrective
actions. It is possible to include multiple domain
experts in the cross-functional team for carrying
out the data analysis for a single category of
events because of the complexity of the systems
and the various components and sub-
components designed to perform a single
function. For example, the function of Variable
Inlet Guide Vanes (VIGVs) is to facilitate
“prevention of engine surge” but an electro-
hydro-mechanical mechanism controls
operation of the VIGVs. So to analyze the events
related to the failure of VIGVs, the data should be
analyzed by electrical specialists, design
specialists, and service engineers.
Similarly, an “Engine Failed to Start” event in the
engine could be due to various reasons viz.:
i) No fuel supply,ii) No ignition,iii) Incorrect tuning of the engine controller,iv) Failure of engine controller, and so on.
In such a case, there may be a need to integrate
an engine specialist, electrical specialist, and
electronic systems specialist to work together as
a team and to investigate the event.
Root Cause Analysis
Once the event data has been scrutinized to
identify various failures in a particular system, do
the root cause analysis to reach the basis of the
problem. The root cause analysis can be carried
out by using standard statistical methods. A few
of them are listed below:
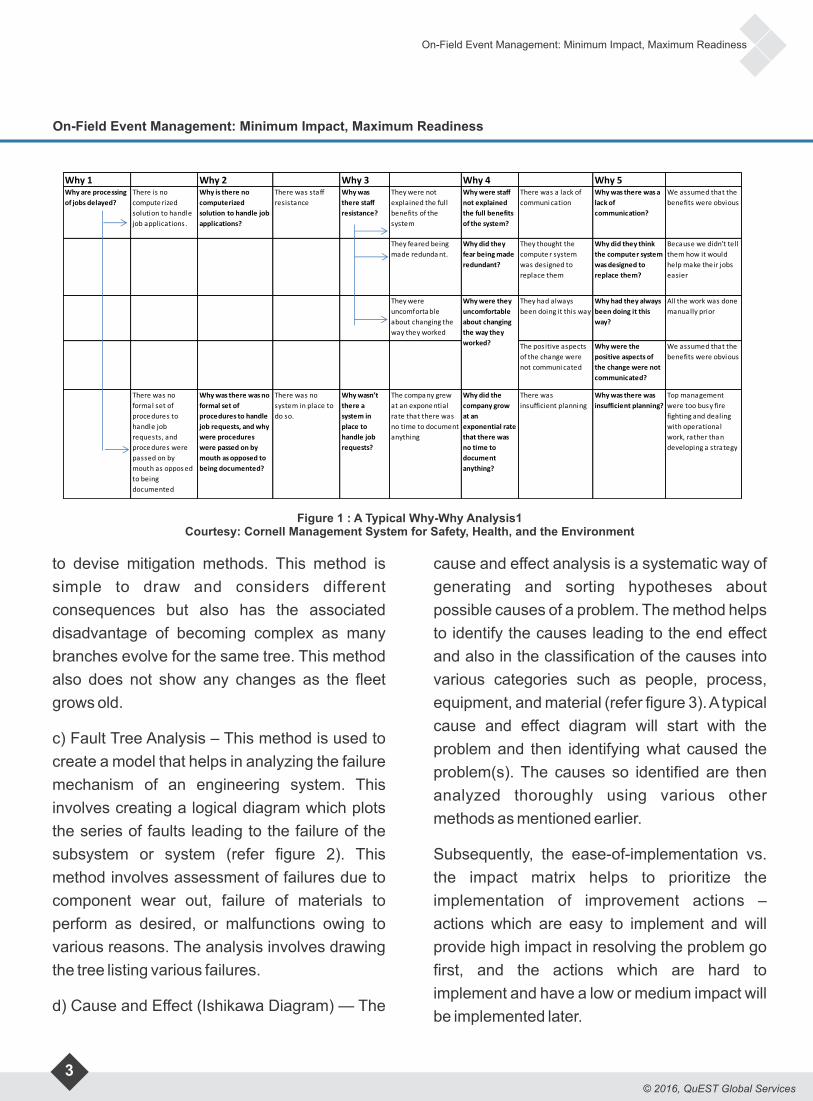
a) Why-Why Analysis – This is an iterative
technique to resolve a problem. The term WHY
is used by asking sequential questions to identify
the root cause of the problem. It is considered
that by asking questions using WHY 5 times will
guide us to the root cause of the problem,
however, there still may be potential to ask a few
more questions (may be 6 or 7). After identifying
the root cause(s), suitable corrective or
preventive actions should be defined and
implemented. Involvement of the right set of
people and asking the right questions is the key
to the success of this process. The focus of the
Why-Why analysis should remain on revealing
the systemic issues rather than blaming the
individuals. A spreadsheet comes handy in
running this problem-solving method. Figure 1
shows a typical sample of a Why-Why analysis.
b) Event Tree Analysis – This method uses the
forward prediction method, initiating from a
significant event. A tree (refer figure 2) of
possible events that are expected to happen,
leading to multiple conclusions, is plotted. An
analysis of each branch is then carried out to
identify the probable failure mechanism and then
2© 2016, QuEST Global Services
On-Field Event Management: Minimum Impact, Maximum Readiness
On-Field Event Management: Minimum Impact, Maximum Readiness
3© 2016, QuEST Global Services
to devise mitigation methods. This method is
simple to draw and considers different
consequences but also has the associated
disadvantage of becoming complex as many
branches evolve for the same tree. This method
also does not show any changes as the fleet
grows old.
c) Fault Tree Analysis – This method is used to
create a model that helps in analyzing the failure
mechanism of an engineering system. This
involves creating a logical diagram which plots
the series of faults leading to the failure of the
subsystem or system (refer figure 2). This
method involves assessment of failures due to
component wear out, failure of materials to
perform as desired, or malfunctions owing to
various reasons. The analysis involves drawing
the tree listing various failures.
d) Cause and Effect (Ishikawa Diagram) — The
cause and effect analysis is a systematic way of
generating and sorting hypotheses about
possible causes of a problem. The method helps
to identify the causes leading to the end effect
and also in the classification of the causes into
various categories such as people, process,
equipment, and material (refer figure 3). A typical
cause and effect diagram will start with the
problem and then identifying what caused the
problem(s). The causes so identified are then
analyzed thoroughly using various other
methods as mentioned earlier.
Subsequently, the ease-of-implementation vs.
the impact matrix helps to prioritize the
implementation of improvement actions –
actions which are easy to implement and will
provide high impact in resolving the problem go
first, and the actions which are hard to
implement and have a low or medium impact will
be implemented later.
Why 1 Why 2 Why 3 Why 4 Why 5Why are processing
of jobs delayed?
There is no
compute rized
solution to handle
job applications.
Why is there no
computerized
solution to handle job
applications?
There was staff
resistance
Why was
there staff
resistance?
They were not
explained the full
benefits of the
system
Why were staff
not explained
the full benefits
of the system?
There was a lack of
communi cation
Why was there was a
lack of
communication?
We assumed that the
benefits were obvious
They feared being
made redunda nt.
Why did they
fear being made
redundant?
They thought the
compute r system
was designed to
replace them
Why did they think
the computer system
was designed to
replace them?
Because we didn't tell
them how it would
help make their jobs
easier
They were
uncomforta ble
about changing the
way they worked
They had always
been doing it this way
Why had they always
been doing it this
way?
All the work was done
manually prior
The pos itive aspects
of the change were
not communi cated
Why were the
positive aspects of
the change were not
communicated?
We assumed that the
benefits were obvious
There was no
formal set of
proce dures to
handle job
requests, and
proce dures were
passed on by
mouth as oppos ed
to being
documented
Why was there was no
formal set of
procedures to handle
job requests, and why
were procedures
were passed on by
mouth as opposed to
being documented?
There was no
system in place to
do so.
Why wasn’t
there a
system in
place to
handle job
requests?
The compa ny grew
at an expone ntial
rate that there was
no time to document
anything
Why did the
company grow
at an
exponential rate
that there was
no time to
document
anything?
There was
insufficient planning
Why was there was
insufficient planning?
Top management
were too busy fire
fighting and dealing
with operational
work, rather than
developing a strategy
Why were they
uncomfortable
about changing
the way they
worked?
Figure 1 : A Typical Why-Why Analysis1Courtesy: Cornell Management System for Safety, Health, and the Environment
On-Field Event Management: Minimum Impact, Maximum Readiness
On-Field Event Management: Minimum Impact, Maximum Readiness

4© 2016, QuEST Global Services
Figure 2 : Event / Fault Tree
Figure 3 : Fish Bone Diagram
On-Field Event Management: Minimum Impact, Maximum Readiness
On-Field Event Management: Minimum Impact, Maximum Readiness
PROCESS
PEOPLEDelay in Technical Review
Insufficient Information about the variance
Non availability of standard listof inputs needed
Non availability of resources(sickness, attrition, long leave, etc..)
Non availability of inputs needed(Drawing)
Lack of Knowledge Database forquick reference to historical data
Frequent requirement to switch between customer tools
Non availability of tools to managetask allocation
Unpredictable work load
Allocation of fast track requestsdisrupting the progress of normal tasks
Less number of TechnicalReviewers
Team Competency
Cumbersome Work Instructions
1
1
1
2
2
2
2
1
TOOLS
ENVIROMENT
4
4
1
2
2
TAT> 3Days

5© 2016, QuEST Global Services
Identify and Implement Corrective Actions
Effective root cause identification will be useful in
identifying the appropriate corrective actions.
There can be multiple corrective actions
required to address the problems effectively.
The corrective actions are then further
developed and tested in isolation and in
combination. The corrective actions may involve
des ign improvemen ts , and p rocess
improvements. If the corrective actions involve
design alterations, then development and
testing may first be carried out using computer
models, followed by testing prototypes on
development vehicles. When sufficient
successful development experience is gained,
then live implementation of corrective actions is
initiated. The in-field implementation of the
improvement is also typically deployed initially
into a part of the fleet. The implementation of the
corrective actions is followed by data gathering
to assess the results.
Preventive Actions
Post Successful implementation of the
corrective action(s) in the affected fleet, the
improvement actions may be deployed to similar
equipment in other fleets preventing the events
before they occur. However, the implementation
of such preventive actions may involve tailoring
of the methods and principles to suit the specific
fleet conditions.
Case Study
Issue: Loss of engine performance indicated
through Engine Health Monitoring (EHM)
reports. An alert was raised to the operator to
borescope the turbine section for any
anomalies. Post borescope, turbine blades and
nozzle guide vanes were found to be damaged.
The engine was, therefore, removed from
service.
Data Gathering and Categorization
Following parameters were gathered for the
affected engine to analyze the event in detail:a) The engine health reports — To validate the engine performance parametersb) Previous shop visit report and recent line maintenance datac) Event history — To identify any events related to the turbine failure, such as high Turbine Gas Temperature (TGT) for more than 5 seconds, high vibration, and surge.
Based on the initial findings and details collected
from the field, the event was categorized as
basic (engine related), unplanned (not as per
the planned maintenance schedule), and
removal (engine removed from service). The
operator was then instructed to ship the engine
to the overhaul shop for further repairs.
Data Analysis
The data collected post-categorization was
keyed into the EM system. This data was
analyzed to identify similar failures in the past
within and across fleets of similar engines. The
required data was extracted by eliminating the
events not related to similar failures.
The shop visit report showed the primary and
secondary findings of the damage. The findings
indicated excessive rubbing of the seal
segments with the turbine blade shrouds. Three
instances of such events were recorded earlier
in the fleet. However, this was the first instance of
On-Field Event Management: Minimum Impact, Maximum Readiness
On-Field Event Management: Minimum Impact, Maximum Readiness

6© 2016, QuEST Global Services
this engine and with only 600 hours since the last
shop visit.
Given the data of the findings from the previous
reports and feedback from the overhaul shop
reports, the data was plotted onto a Pareto
graph to understand the top drivers of such
events. The top driver analysis yielded results to
notify the top issue of failure as rubbing of the
turbine blades with the sealing strip.
Root Cause Analysis
With the shop visit findings for the current engine
and the details from the historic shop visit
reports, 'Why-Why' approach was used to
determine the possible scenario and understand
the root cause.The root cause from the historical and current
evidence was determined to be the worn tang on
the seal segments, which led to the contact with
the outer shroud fins of the blade.
Corrective Action
The investigation into the failure mechanism led
to the conclusion that there is a potential of the
blade and the seal segment rubbing. Hence, as
a containment action (to prevent failure until a
permanent solution is introduced), a borescope
inspection (to be repeated every 100 flight
hours) in the turbine region was introduced to
check sagging of the shroud segment and report
the anomalies, if any, to the OEM.
The detailed problem investigation revealed that
a design change is necessary. Hence a new
design was introduced instructing to machine off
the radial height (by few millimeters) of the
abradable material to accommodate the wear
criteria. This increased the diametral clearance
marginally. The performance evaluation of the
engine was conducted with the increase in the
tip clearance. It was found to be affecting
minimally without compromising the engine
certification requirements.
Preventive Action
This is a recently introduced design change and
is yet to be monitored for desired results in the
affected fleet. If successful, the best practices
may be deployed to other fleets with similar
engines.
Emerging Trends
The EM process is used only in a few capital-
intensive industries like the Aeronautics and the
Aerospace, and by a very limited number of
high-end automobile companies. However,
there is a scope of taking this process into other
industries like Home Appliances, Surface
Why 1 Why 2 Why 3 Why 4Loss in Engine
Performance?Due to
rubbing of the
turbine blade
with the seal
segments
Why did the turbine
blades rub with the
seal segments?
The seal segments
slipped from their
position and
sagged down
Why did the
seal segments
sag?
The seal segment
locking tangs were
worn
Why did the
wear occur on
tangs?
The tang was worn
due to excessive
thermal expansion
and contraction
Figure 4 : Why-Why Analysis
On-Field Event Management: Minimum Impact, Maximum Readiness
On-Field Event Management: Minimum Impact, Maximum Readiness

7© 2016, QuEST Global Services
Transportation. There is an increasing trend to
offer extended warranties for various products in
these sectors. The OEMs offering extended
warranty for their products, own the
maintenance and break-down support. To
reduce break-down maintenance and escalating
maintenance costs, alongside a growing
customer demand for more re l iab le
components, more and more industries are
adopting EM.
The other major sectors where the EM can be
implemented are:
▪ Home appliances (refrigerators, washing machines, televisions, and more)▪ Safety and security systems (fire-fighting, closed-circuit cameras, access control system, and more)▪ Telecommunication (reliability of the hardware and associated software, connectivity, and others)▪ Trains and road transport (high-speed trains, and modernized buses)▪ Power generation systems▪ Software▪ Healthcare▪ Oil and gas exploration
QuEST Global as a Technology and
Consulting Outsourcing Partner
QuEST Global Services Pte. Ltd, an ISO 9001
company, is a diversified product development
solutions company. We cater to multiple high
technology verticals such as Aero Engines,
Aerospace and Defense, Industrial Products,
Medical Devices, Oil & Gas, and Power
Generation. Our portfolio of services and
solutions covers all aspects of the product
development and engineering processes such
as Product Design, Product Development,
P r o t o t y p i n g , Te s t i n g , C e r t i f i c a t i o n ,
Manufacturing Support, Product Support
(sustenance, repair, and documentation),
Product Re-Engineering, and Consulting
Services. Our service offerings cover
Mechanical Engineering, Electrical as well as
E lect ron ics and Embedded Systems
engineering of the product development
process. With our diversified portfolio and
geographic spread we have been able to
conceptualize, design and develop, test,
manufacture, certify, and support different kinds
of products worldwide.
Summary
QuEST has a dedicated team of qualified
engineers supporting EM and service
investigation work streams for major aero engine
and aero structure customers. Over the years,
QuEST has built the capability for an end to end
EM process. It includes data gathering, data
maintenance, investigation, and representation
of the findings as well as proposing the
appropriate solutions for various types of events.
QuEST provides length and breadth of services
all along the product life cycle right from the
concept to the aftermarket support, and the
retirement phase of the products. Therefore, the
corrective or improvement actions identified
during the EM processes are further taken up by
the teams at QuEST for development,
implementation, monitor, and control.
QuEST also has the proven capability to
manage the cross-functional activities involving
multiple stakeholders (e.g. OEM engineering
On-Field Event Management: Minimum Impact, Maximum Readiness
On-Field Event Management: Minimum Impact, Maximum Readiness

References
a) 5-whys Analysis using an Excel Spreadsheet Table http://www.bulsuk.com/2009/07/5-why-analysis-using-table.html
Author Profile
Rajesh Kumar Handuja Chief Engineer , - Aero engines, SDU APAC.
Rajesh is a specialist in Aftermarket Services for Aero Engines. He has extensive experience in
supporting In-Service Products, Lifecycle Cost Analysis, and Managing Maintenance Burden.
Before joining QuEST in 2008, Rajesh was with the Indian Air Force for 20 years in various capacities. He
holds a Bachelor's degree in Mechanical Engineering and has done his Master in Business
Administration in Human Resource Development.
While with the Indian Air Force, he was involved in the on-wing and in-shop maintenance of aero engines.
He developed the technical process for Fan Blade Replacement and in-storage preservation of various
fuel aggregates for the aero engine of a Russian military aircraft used by the Indian Air Force. He was
instrumental in setting up a medium repair facility.
At QuEST, Rajesh is a Technical Solutions Leader for service engineering and lifecycle engineering. He
has vast experience in establishing work streams from scratch. His current responsibilities also include
capability development and new business development. He is driving the Capability Led Growth initiative
at QuEST.
He has also authored the following papers:
a) Opportunities to reduce Total Cost of Ownership in Aftermarket Servicesb) Reliability Analysis and Emerging Trends
Rajesh can be reached at [email protected]
8© 2016, QuEST Global Services
teams, third party vendors, and multiple teams at
QuEST). QuEST has demonstrated capabilities
across verticals and customers. By offshoring
this work-stream, customers can benefit from
the rich experience and the well -established
processes at QuEST without having to re-invent
the wheel all over.
On-Field Event Management: Minimum Impact, Maximum Readiness
On-Field Event Management: Minimum Impact, Maximum Readiness

© 2015, QuEST Global Services
www.quest-global.com
© 2016, QuEST Global Services