on farm biogas production with solid manure in organic … · on farm biogas production with solid...
TRANSCRIPT
1
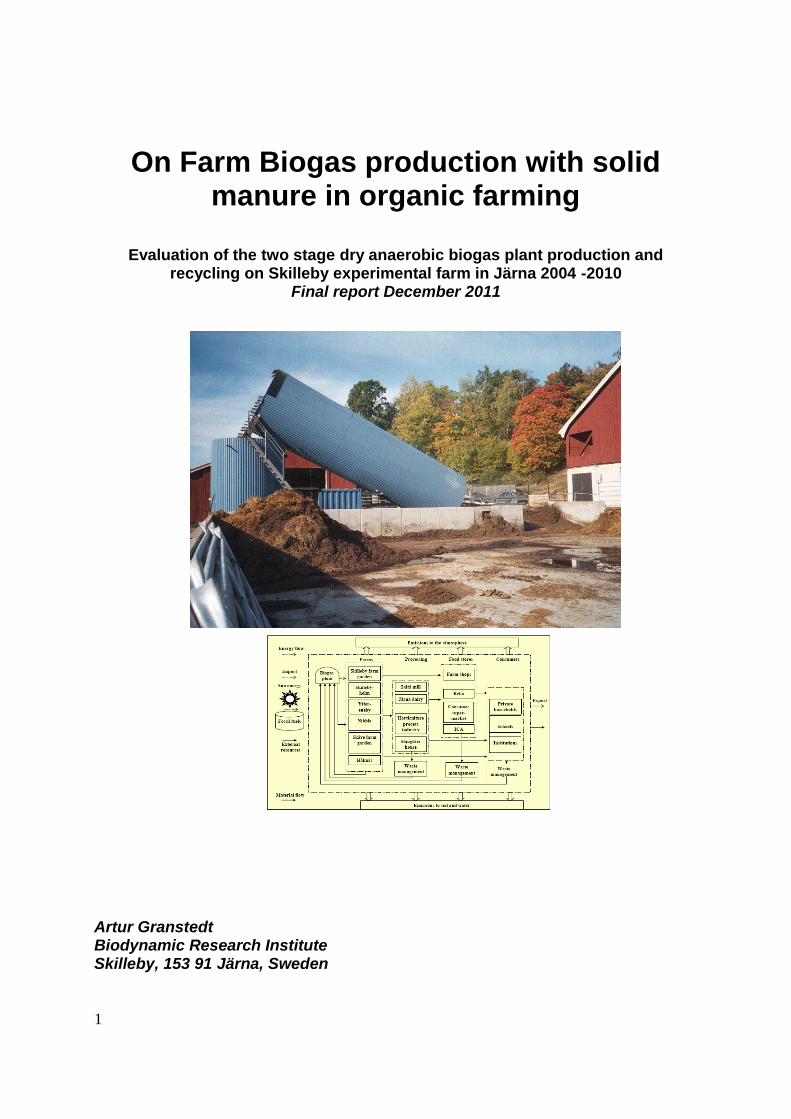
On Farm Biogas production with solid
manure in organic farming
Evaluation of the two stage dry anaerobic biogas plant production and recycling on Skilleby experimental farm in Järna 2004 -2010
Final report December 2011
Artur Granstedt Biodynamic Research Institute Skilleby, 153 91 Järna, Sweden

2
Evaluation of the two stage dry anaerobic biogas plant and the influence on production and recycling on Skilleby experimental farm in Järna 2004 -2010
Background European countries are committed to reduce CO2 emissions originating from fossil fuels.
Additional changes in policy priorities as well as the development of agricultural technology
are important driving forces. Organic farming principles for their part include the use of
renewable energy resources and the minimisation of nutrient losses on-farm as far as possible.
On-farm produced biogas may replace fossil fuels and thereby contribute to achieve the target
of reduced green house gas emissions. Losses of nitrogen are also reduced by dry anaerobic
digestion of organic material. In accordance with the EU-regulation (EU 1774/2002) animal
by-products can also be used for biogas production.
Most on-farm biogas plants in Europe use slurry and co-substrate for biogas production. This
technology is reasonable only on farms, where slurry technology is already in use. Slurry
based biogas plants are well developed in those European countries where investment
subsidies for biogas plants are granted and prices for electric power production are low. Such
favourable conditions prevail mainly in Germany. Farms, which use a dry manure chain
technology, and farms without livestock are not able to use the prevailing on-farm biogas
technology.
The top 10 benefits of dry anaerobic-digestion biogas plants are clearly in line with organic
farming principles and strengthen sustainable agriculture (Hoffmann, 2002, quote from
Schäfer, Lehto and Teye, 2006):
1. Dry anaerobic digestion is suitable for nearly all farm residues like manure, plant
residues, and household organic wastes. Higher energy density compared to slurry
digestion requires reduced reactor capacity and reduces construction costs.
2. High dry matter content reduces transport costs due to reduced mass transfer in
respect of the produced biogas quantity per mass unit.
3. Mobile digester modules allow batch production and continuous, easily controllable
gas production.
4. Dry anaerobic digestion residues can be composted and in this way fertilisers, also suitable
for off-farm use, are produced. Composted manure may also be better for food quality
compared to liquid manure.
5. Dry anaerobic batch digestion does not need special techniques like slurry pumps,
mixers, shredders, and liquid manure injectors for distribution. Most of the machinery
needed for filling and discharging the digester like front loaders and manure
spreaders are often already available on-farm.
6. The amount of energy required for heating the process is lower than in slurry reactors
because of
reduced reactor size. Process energy of dry anaerobic batch digestion is not
required because continuous homogenisation is not needed.
7. There is improved process stability and reliability. There occur no problems like foam or
sedimentation. Possible digestion breakdowns are easily dealt with in batch
3
digesters by exchanging the module.
8.There are reduced odour emissions because there is no slurry involved.
9. There is reduced nutrient run-off during storage and distribution of digester residues
because there is no liquid mass transfer.
10. The process is suitable for farms without slurry technology, especially farms using deep
litter
systems e.g. chicken production. 50% of Swedish manure originates from farms
handling solid dung.
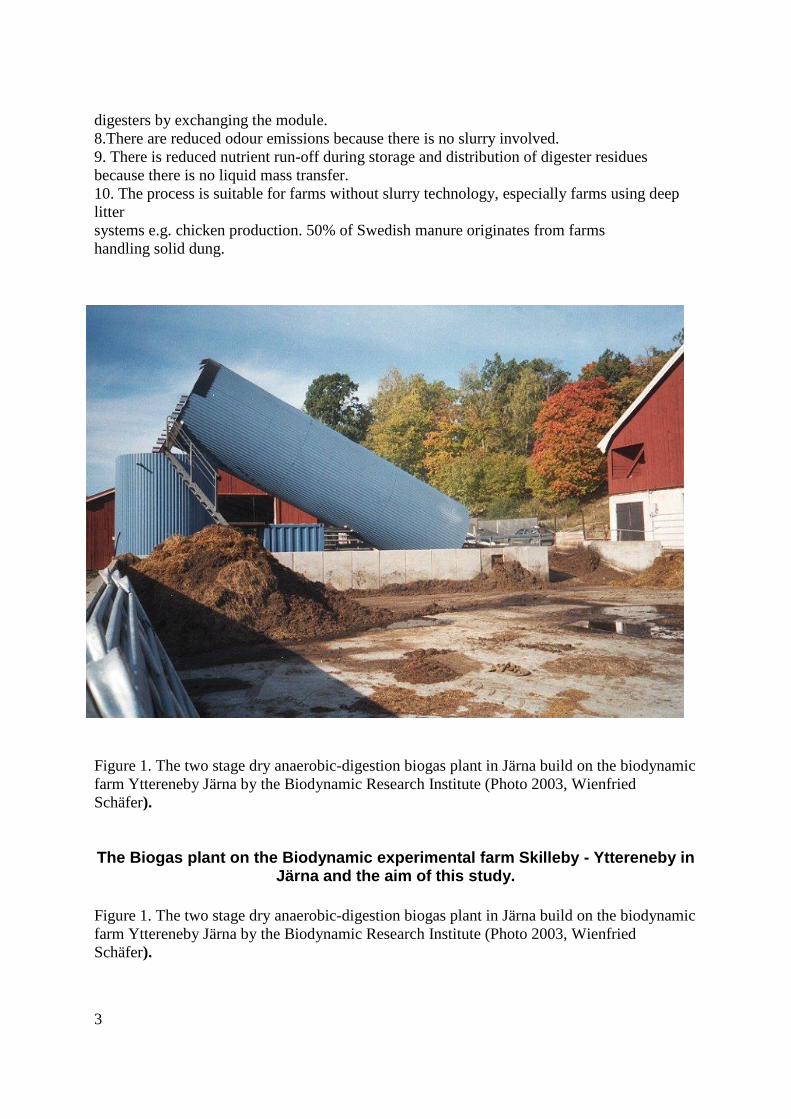
Figure 1. The two stage dry anaerobic-digestion biogas plant in Järna build on the biodynamic
farm Yttereneby Järna by the Biodynamic Research Institute (Photo 2003, Wienfried
Schäfer).
The Biogas plant on the Biodynamic experimental farm Skilleby - Yttereneby in Järna and the aim of this study.
Figure 1. The two stage dry anaerobic-digestion biogas plant in Järna build on the biodynamic
farm Yttereneby Järna by the Biodynamic Research Institute (Photo 2003, Wienfried
Schäfer).

4
One of the world's first large scale on-farm dry anaerobic-digestion biogas plants has been
built on the mainly self-supporting farm organism, Skilleby-Yttereneby by the Biodynamic
Research Institute in Järna. This on-farm biogas plant is integrated into the farming system
and employs a new process technique: Dairy cattle manure and organic residues originating
from the farm and nearby food processing units are digested in two different reactors.
The first reactor is continuously filled with solid manure from a stanchion barn. The organic
matter contains 17.7 to 19.6 % total solids. After digestion the residue is discharged and
separated into a liquid and a solid fraction. The liquid fraction is further digested in a methane
reactor and the effluent is used as liquid fertiliser. The solid fraction is composted and used as
manure on the winter wheat in the five year crop rotation. The use of the composted manure
has been evaluated as part of the long term study during 2006 – 2010.
The Biogas plant is build on the farm YtterEneby which functions as a unit with Skilleby
experimental farm. The purpose of the plant is to evaluate and demonstrate the possibility to
achieve ecological recycling agriculture which is fully based on the local renewable resources,
is environmentally sustainable and with the best possible productivity and food quality.
The following goals were formulated:
1. To make agriculture production self sufficient in energy
2. To reduce the negative impact on the environment compared to traditional manure
management with respect to green house gas emissions, leaching of plant nutrients,
and ammoniac emissions.
3. To increase the efficiency in agriculture production through effective internal
recycling of plant nutrients in manure and liquid manure and with reduced losses
from the farming system in line with ecological recycling agriculture (ERA)
principles (Granstedt, et al 2008).
The objective of this study is to evaluate the extent to which these goals have been reached
and identify possible improvements. In addition this study will evaluate:
4. the capacity of manure to improve the fertility of and humus content in soil thereby
improving yields and food quality .
The evaluation includes the technical evaluation of the biogas plant, the material and nutrient
flows on the whole Skilleby/Yttereneby farm unit and field studies over many years.
The two-stage fermentation process results in the production of two fractions of manure , one
solid fraction and one liquid fraction. The solid fraction has been composted and compared
with non-fermented manure. The liquid manure has been used like urine. The evaluation has
been done as an integrated part of the long-term on-farm study of manure recycling and
utilisation on Skilleby- Yttereneby .
The technical evaluation of the biogas plant covers the period between 2003 - 2005, the
biological evaluation of the fermentation and on farm studies including comparative field
trials were carried out between 2006 and 2008. The future of the biogas plant at Yttereneby
has not yet been decided. To cover the costs for managing the biogas plant it would be
necessary to increase production and the price of the biogas in order to cover production

5
costs. This would be possible if the application to the Swedish Board of Agriculture to use
slaughter wastes from the local wild meat slaughterhouse close to the farm is approved and
the subsides for investments to produce electric power from the gas produced in the biogas
plant are granted.
Material and methods
Technical description of Skilleby – Yttereneby biogas plant
The first reactor is continuously filled with solid manure from a stanchion barn. The organic
matter contains 17.7 to 19.6 % total solids. After discharge the digestion residue is separated
into a liquid and a solid fraction. The liquid fraction is further digested in a methane reactor
and the effluent is used as liquid fertiliser. A complete technical description of the biogas
plant has been published (Schäfer, Lehto and Teye, 2006).

6
Figure 2. The Material flow chart of the biogas plant at Yttereneby, Järna, Sweden (
Schäfer, Lehto and Teye, 2006)
Figure 3. Material flow diagram with manure, feeding and mixing marked.
(Schäfer, Lehto and Teye, 2006)

7
Figure 4. Pictures illustrating manure from the cow, feeding and mixing
Feeding and mixing 1 (Figure 3 and 4)
A hydraulic powered scraper shifts manure into feeder channel (1 in figure 2). The manure of 65
livestock units kept in a dairy stanchion is a mixture of faeces, straw and oat husks. A part of the
output of the hydrolysis is conveyed back to the feeder channel and inoculated into the fresh manure.
The urine is separated in the stall via a perforated scraper floor.
Figure 4. Pictures illustrating manure from the cow, feeding and mixing
Hydrolysis reactor (figure 5)
The manure is pressed to the top of the 30o inclined hydrolysis reactor with a 53 m
3 capacity. The
bottom of the hydrolysis reactor on both sides of the feeder pipe is provided with hot water channels.
The 400 mm wide feeder pipe is made of PVC. The substrate is discharged through a bottomless
drawer in the lower part of the reactor. The drawer is guided within a regular channel and powered
by a hydraulic cylinder.
.
8
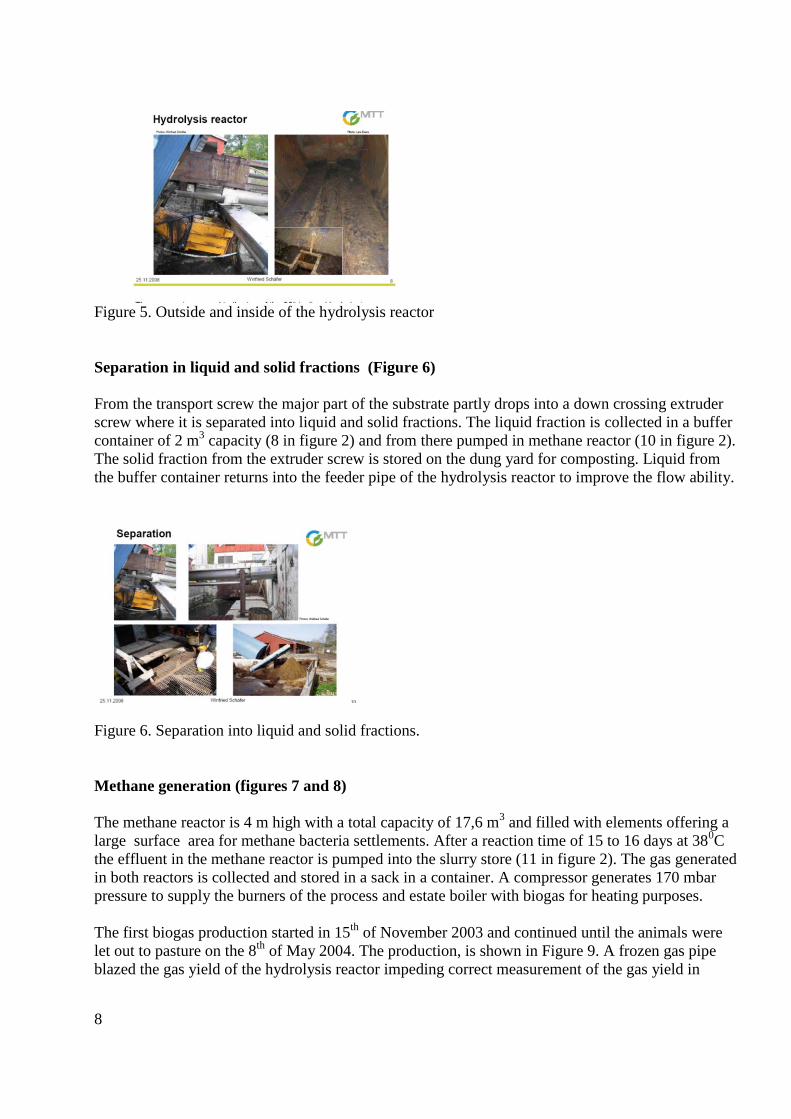
Figure 5. Outside and inside of the hydrolysis reactor
Separation in liquid and solid fractions (Figure 6)
From the transport screw the major part of the substrate partly drops into a down crossing extruder
screw where it is separated into liquid and solid fractions. The liquid fraction is collected in a buffer
container of 2 m3 capacity (8 in figure 2) and from there pumped in methane reactor (10 in figure 2).
The solid fraction from the extruder screw is stored on the dung yard for composting. Liquid from
the buffer container returns into the feeder pipe of the hydrolysis reactor to improve the flow ability.
Figure 6. Separation into liquid and solid fractions.
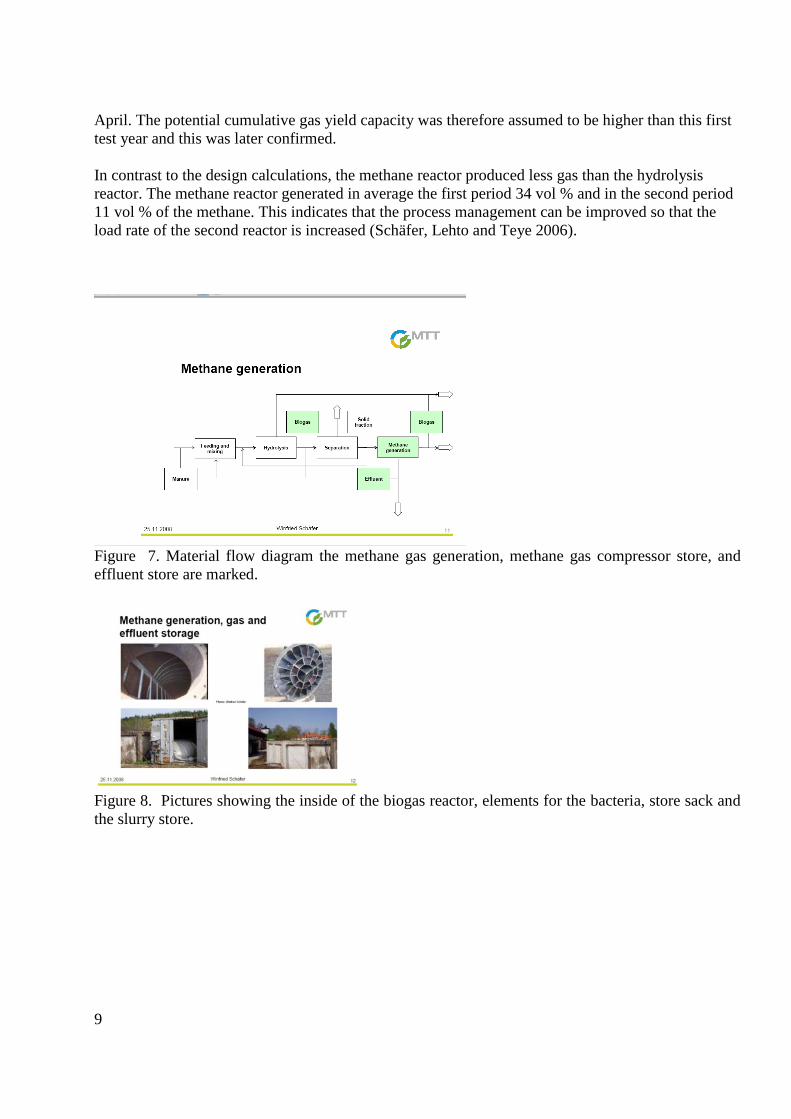
Methane generation (figures 7 and 8)
The methane reactor is 4 m high with a total capacity of 17,6 m3 and filled with elements offering a
large surface area for methane bacteria settlements. After a reaction time of 15 to 16 days at 380C
the effluent in the methane reactor is pumped into the slurry store (11 in figure 2). The gas generated
in both reactors is collected and stored in a sack in a container. A compressor generates 170 mbar
pressure to supply the burners of the process and estate boiler with biogas for heating purposes.
The first biogas production started in 15th
of November 2003 and continued until the animals were
let out to pasture on the 8th
of May 2004. The production, is shown in Figure 9. A frozen gas pipe
blazed the gas yield of the hydrolysis reactor impeding correct measurement of the gas yield in
9
April. The potential cumulative gas yield capacity was therefore assumed to be higher than this first
test year and this was later confirmed.
In contrast to the design calculations, the methane reactor produced less gas than the hydrolysis
reactor. The methane reactor generated in average the first period 34 vol % and in the second period
11 vol % of the methane. This indicates that the process management can be improved so that the
load rate of the second reactor is increased (Schäfer, Lehto and Teye 2006).
Figure 7. Material flow diagram the methane gas generation, methane gas compressor store, and
effluent store are marked.
Figure 8. Pictures showing the inside of the biogas reactor, elements for the bacteria, store sack and
the slurry store.

10
Figure 9. Observed biogas yield, mean day temperature, total observed cumulative methane yield
and yield separated into the production from the methane reactor and from the hydrolysis reactor
(Schäfer, Lehto and Teye 2006.
The farm
Geographic localisation and climatic conditions
The Skilleby-Ytterenby farm has until recently been two farms, Skilleby and Yttereneby but
nowadaysis running as one unit. The field experiment wasfirst started on Skilleby in 1991.
The biogas plant was constructed in 2002 and received manure from the cow barn which is
shared by both farms. The farm is situated 50 km south of Stockholm, on a clay soil in
eastern Sörmland (Figure 10) with a northern latitude 59o30´ , at 30-40 metres above sea
level, with an annual average precipitation of 590 mm, a yearly average temperature 6,2oC
and 6-8 snow free months (Figure 2). The topsoil is generally frozen 3-4 months in the year
(December – March). The weather conditions are presented in more detail for the
experimental period in Supplement 1. The Skilleby experimental farm has 42 ha arable land
which lie on each side of a small water way which after some kilometres south east of the
farm feeds into the Stafbofjärden in the Baltic Sea. Since 2002 Yttereneby and Skillebyfarms
have been managed as one working unit with 137 ha with the same five years crop rotation
on each and the manure distributed on both until 2010.
Soil conditions The soils are composed mainly of clay loam with a humus content between 2,8 and 4,2 %, a
large proportion of silt predisposes them to crust formation. The soil under topsoil depth is
stratified, with glacial clay at the bottom. The natural history for this soil formation is shown
in Figure 11 where the top soil with the secondary sorting of the soil texture fractions (post
glacial clay, loam and silt) are seen. The glacial clay is close to the topsoil in elevated areas.
In the more low-lying areas the clay content is lower and the soils dry out more quickly in the
spring. This geological background where most of younger fossil sediments were eroded

11
during the last ice age, and the sediment clay is based mainlyon primary rocks, explains why
the soil is high in potassium and low in phosphorus.
Three soil samples were taken from each experimental plot from the top soil (o – 20 cm),
from 30 – 60 cm depth and 60 – 90 cm depth at the start of the long term field experiment
1991. These samples were analysed for their chemical and biological properties including Ctot,
Ntot, pH, P-Al, K-AL, Ca-Al, Mg.AL. These analyses were repeated after each five year crop
rotation period and are of special interest for the evaluation of the biogas manure effects on
soil on HV1 (2006), HV2 (2007), HV 5 (2008), HV 3 (2009) and HV 4 (2010). The P-AL
values in top soil are mainly between 2 – 3 and the K-AL values between 10 – 15 mg in 100 g
soil and pH values between 5,5 -6,0 according the figures presented from HV1 and HV2 in
Supplement 2.
The Biodynamic Research Institute
A B
Figure 10. Localisation of the Skilleby long term trial in East Central Sweden, at latitude 59
o
North and longitude 18 o East, 30 – 40 m above sea level.

12
The Biodynamic Research Institute
Map with simplified high coast-
line (HK), Area above the HK
and under the HK.
In Sweden most arable land is found
where there are sedimentary soil types
below the high coast- line after last ice
time 10 000 years ago..
Natural history
Figure 11. The soils are postglacial sedimentary clay and loam with low humus content in the
lower parts mixed with some mud clay
The Biodynamic Research Institute
Granstedt, A., L-Baeckström, G.( 2000): Studies of
the preceding crop effect of ley in ecological
agriculture. American Journal of Alternative
Agriculture, vol. 15, no. 2, pages 68–78. Washington
University.
Figure 12. The focus of the Skilleby long term trial has been to study how soil fertility and
food quality is effected by manure managements regimes and soil treatments. Between 1991
and 1996 a special study comparing the effects on different durations of ley and the effects of
the preceding crop (Granstedt and Baeckström, 2000).

13
Crops, fodder production, animal husbandry, manure and plant nutrient recycling
The distribution of crops and animal husbandry is exemplified for 1997 in Figure 13. The
animal husbandry consist of milk and meat production adapted to the farm'sown fodder
production on 84 % of the total arable area (Granstedt, 2000). the remaining 16 % of the area
is used for production of food crops. The nitrogen input is based on the biological nitrogen
fixation mainly in the first and second year clover grass crops. The proceeding crops' effect
and long term crop rotation effect of clover grass on Skilleby farm was studied during 1991 to
1995 and published in Granstedt and L-Baeckström (2000). The plant nutrients in the
harvested field crops are mainly recycled through thesolid and liquid manure. The total
animal density is 0, 7 (Figure 13 says 0,6 AU/ha on the farm and also that some feed is
imported – clarify) animal unit per ha producing, on average, 250 tonnes of stable manure and
180 tonnes of liquid manure each year. The plant nutrient recycling is presented in Figure 22
(Granstedt et al 2008).
7/8/2011 AG
The prototype farm
Yttereneby –
Skilleby in Järna)
•The animal density is
adjusted to the farm’s
feed production
capacity. In this case
fodder crops on 84 %
and crops for sale on
16 % of the farm area
and with a animal
density of 0,6 AU/ha
(= average for Sweden
and European food
consumption)
Yttereneby and Skilleby 2003
Import---> Recycling Export
Feed Herd: Milk
Seed 47 cows Meat products
39 heifers
10 calves
29 sheep
0,6 AU / ha
450 m3 urine + 600 m
3 manure
+dung/urine pasture
Biogas
Arable land ha Crop rotation
Crop rotation 106 Year 1 Spring cerals + insowing
Pasture 29 2 Ley I
Vegetable - 3 Ley II
root croops 2 4 Ley III
Total 137 5 Winter cerals
Natural pasture 25
0,5%
Veget.
Root crops
1,5%
Bred grain
15%
Ley (grass
land)
47%
Pasture
21%
Feed grain
15
%
Ow
n f
eed
>84
% o
f th
e a
rea {
Bread
grain
Example of Ecological Recycling Agriculture / ERA

14
Figure 13. Fodder food crops and animal production and recycling of solid and liquid manure
(urine) on Skilleby - Yttereneby farm.
.
Crop rotation
When it started in 1967 this biodynamic farm had a seven year crop rotation with two and
sometimes three years of clover grass leys followed by bread grain, oats, green fodder and
bread grain with oats or barley sown in. The nutrient management on Skilleby with special
focus on nitrogen is well documented in a doctor's thesis by Granstedt (1990 and 1992).
From 1991, when the long-term field experiment was initiated, a new five year crop rotation
was established and followed until today:
1) oats with under sowing of clover grass
2) clover grass ley I
3) clover grass ley II (support of liquid manure)
4) clover grass ley III (only one cut before cultivation, application of farm yard
manure and sowing of winter wheat.)
5) winter wheat (with additional support of liquid manure some years).
This crop rotation was designed to improve the humus content and soil fertility.
The effects of applications of non-composted and composted manure were studied, with and
without biodynamic preparation treatments, at three levels of application (12.5, 25 and 50 tons
per ha 1991-1995 and 0, 25 and 50 tons per ha 1996-2008). This resulted in 12 treatments all
together and with 2 – 4 replications of each treatment. The trial was established on each of
the five fields in the crop rotation on Skilleby farm. From 2003 – 2010 manure from the
biogas plant was used as stable manure and special studies to compare the manure from the
biogas plant and manure direct from Nibble farm with no biogas treatment but both
composted and non-composted were carried out between 2006 – 2010. The results of nutrient
content analysis in the manure for the years 2006 and 2007 area presented in Table 1 and
Table 2.

15
Design of field trial
The Biodynamic Research Institute
Rotation Skilleby experimental
farm
1. Summer crop + ins
2. Ley I
3. Ley II
4. Ley III
5. W. wheat
Farm own manure (0.6 au/ha)
On farm long term experiment from
1991
- non-composted and composted
manure
- with and without biodynamic
preparation (split plot design)
- three levels: 12.5 (0), 25 (normal)
and 50 tons per ha)
- 2 – 4 replicates on the five rotation
fields Figure 14. The field trials are located on representative spots in each field starting with winter
wheat in the autumn 1991 on field number one. The following year winter wheat was sown on
field number 2 and so on until 1995 when the trial plots were established on the last field,
number 5.
The Biodynamic Research Institute
Experimental plan from 1991
Without BD preparation-
BD preparation each plot each yearSubplots +
50 tonK3
25 tonK2
Composted manure 12.5 ton ( 0 from 1995)K1
50 tonF3
25 ton F2
Not composted manure 12.5 ton ( 0 from 1995) F1
Treatments winter wheat
Main plot
Skilleby long-term trial started in 1991 and still continuing
Figure 15. Field trial implementation and the experiment design.

16
Manure
Table 1. Nutrient content analysis of fresh, stored (not composted) and composted manure
2006.
Table 2. Nutrient content analysis of fresh, stored (not composted) and composted manure
2007 Manure Skilleby field experiment 2007
Farm treatment Yttereneby BG Nibble Nibble
Manure tetment Comp. +BDP Comp. -BDP Comp +BD Comp -BD Not comp.
Dry matter % 24,0 24,2 31,7 27,9 21,7
Tot N, kg ton-1
6,9 6,5 8,1 7,8 6,3
Organic N ton-1
6,0 6,3 7,3 7,4 5,4
NH4 N ton-1
0,89 0,18 0,84 0,36 0,85
Tot P, kg ton-1
1,19 1,38 1,64 1,93 1,43
Tot K, kg ton-1
7,19 9,64 7,85 12,89 9,79
Tot Mg, kg ton-1
1,42 1,61 1,86 2,10 1,55
Tot Ca, kg ton-1
4,8 4,2 5,5 5,3 3,9
Tot Na, kg ton-1
0,5 0,4 0,5 0,6 0,5
Tot C, kg ton-1
71 61 116 61 59
C/N 11,8 9,3 14,3 7,9 9,4
Tot S, kg ton-1
0,89 0,99 1,00 1,20 0,96
This field experiment compares manure from the biogas plant on Yttereneby and manure from
the reference farm Nibble. The neighbouring Nibble farm has the same crop rotation and
animal production, the same type of solid manure production similar soil conditions and
productivity as the experimental farm. Fresh and composted manure from Nibble reference

17
farm (NM) was used and compared with the fresh and composted manure from the
Yttereneby fermented biogas plant (BGM). The nutrient content of the different manure
fractions from 2006 and 2007 are presented in Table 1 and Table 2. The principal differences
in the composting process between the two types of manure (BGM and NM) is reflected in
the temperatures reached during the composting process. See Figure 16. The temperature
increased only 10 degrees in the processed manure from the biogas plant but in the manure
from Nibble farm the temperature increased with 25 oC in the treatment without the
biodynamic preparation (No BD) and with 35 oC in the treatment with the biodynamic
preparation (BD).
010203040506070
2007
-05-15
2007
-05-17
2007
-05-19
2007
-05-21
2007
-05-23
2007
-05-25
2007
-05-27
2007
-05-29
2007
-05-31
2007
-06-02
oC
Biogas manureBD
Biogas ManureNo BD
Nibble manureBD
Nibble manureNo BD
Figure 16. Temperature 30 cm deep in the manure compost heaps from Nibble farm (NM) and
from the biogas plant (BGM) between period 15th
May and 2nd
June 2007. The picture shows
over the four covered heaps on the experimental field : biogas manure with and without
biodynamic preparations BGM/BP and BGM/no BDP, and Nibble manure with and without
biodynamic preparations NM/ BD and NM/ no BD.
Nutrient flow through the biogas plant
During 2006 and 2007 fractions of solid and liquid manure samples from 4 stages in the the
biogas plant process and two from the composting process were collected and analysed (Table
3). These were compared with comparable manure fractions from the biodynamic reference
farm Nibble (Table 1 and 2) before and after the composting process ending in 2006. The
effects of these differences, including the different levels of available nutrients and organic
biomass were studied in field trials 2007 and then also 2009 and 2010.

18
Table 3. Biomass and nutrient contents in manure fractions at different stages: input (faeces
+ straw) to hydrolysis reactor , the separated solid fraction output from the hydrolysis reactor,
the separated liquid fraction from the hydrolysis reactor = input to methane reactor, output
from the methane reactor for use as liquid manure, 5 - solid manure discharge after storing
and before composting, and 6 the solid manure discharge after composting.

19
Stage 1-4 in Yttereneby biogas plant Stage 5 - 6 field treatment
Farm treatmentStable manure Liquid fraction Yttereneby stable BG FYM 2006
Manure tetment Input Output Input Output BG plant 26 May CM BG 26 sept
Dry matter % 29,0 17,7 5,9 6,9 23,5 28,4
Ctot, kg ton-1
141 84 2,6 3,2 93,6 95,9
Ntot, kg ton-1
5,0 5,6 3,9 3,5 6,2 8,2
C/N 28,2 15,0 0,7 0,9 15,0 11,7
Organic N ton-1
2,1 2,9 0,9 1,0 5,8 8,1
NO3 N ton-1
1,90 1,70 1,30 1,70
NH4 N ton-1
0,97 1,00 1,70 0,84 0,4 0,1
Ptot, kg ton-1
0,94 1,15 0,60 0,82 1,0 1,5
Rest Tot C 68,66 2,34 Rest Tot C 64,01
C gas prod. 69,74 0,26 CCO2 losses 29,63
Gas prod % 49,46 9,94 Loss % 31,64
Rest Ntot 4,58 2,56 Rest Ntot 5,47
Ntot loss 0,42 1,34 Ntot loss 0,77
Loss % 8,45 34,33 Loss % 12,35
Quanties t d-1
2,2 1,05 1,1 1,1 1,05 0,72
Quanties t y-1
660 315 330 330 315 215
Analysis
The analysis have been done by the agricultural laboratory, Agrilab, Ullsväg 33, 756 51
Uppsala.
Calculation
The change and possible increase or reduction of carbon and humus content (C % units? What
are these – they are not shown on the chart) is in this study evaluated through
calculation of the differences in total carbon content between the study years.
Mass balance calculations for losses of nitrogen and carbon and the theoretically calculated
production of biogas are based on Ptot content assuming no losses of P in the aerobic
and anaerobic treatments of the manure and on homogeny and representative samples
of manure.

20
Results
Production of biogas and net production of renewable energy
The observed production of biogas during the first test period between November 2003 and
May 2004 is shown in Figure 9 and during the period April 2005 – May 2006 in Figure 17.
The latter show an average gas production of 50 m3
(500 kWh) and a potential of 70 - 90 m3
d-1
( 700 – 900 kWh). The potential exchange also confirmed during laboratory conditions
was about50 % of total carbon in the manure (Figure 18). The accumulated production during
one year was 18 644 m3 but with a documented potential to produce 29 000 m
3. The overall
energy use for the biogas plant was documented at 238 kWh d-1
according the observed data
the first year (Schäfer, Lehto and Teye, 2006). The energy input demand depends on the
temperature and the mass of input material, the environmental daily mean temperature , the
wind speed and the amount of heat energy for heating the input material. The daily manure
during winter time (200 daysyear-1
) was 2 m3d
-1. With an additional 0,5 m
3d
-1 food residues
from the kitchen at the ecological hospital Widarkliniken and an improvement of the
hydrolysis reactor's isolation the production of biogas was stabilised at 70 m3d
-1 with a net
production capacity of 500 kWhd-1
. The average use of vehicle fuels on the ecological
recycling farms has been calculated by the BERAS project to be app. 554 kWhd-1
(Granstedt, et al 2006).
Figure 17. The gas production per day during April 2005 – May 2006

21
Figure 18. a) Exchange of carbon kg d-1
in biogas (figures in the diagram) from the output
from cow barn to manure application in field in two stages. Biogas hydrolysis for the stable
manure is observed to be 50 % of total carbon in 1 m3 with a dry matter of 29 % and the
observed final losses of 22 kg carbon from in the following composting process (Skilleby-
Ytterenby. b) Losses (estimated) during storing of manure and measured losses during the
storing and final the composting process in the manure system without biogas (Nibble farm).
Nutrient flow through the biogas plant, the farm and the whole farm balance
During 2006 and 2007 samples was collected and analysed from the four stages of biogas
plant process and before and after composting. The Carbon ( C) and Nitrogen (N) flows were
calculated and compared with comparable data from the Nibble farm manure fractions
which have not been fermented in a biogas plant but are otherwise comparable. (Table 3??)
Figure 19 describes the material and flow on the normal situation without biogas
fermentation based on the manure from Nibble farm. (Check Figure 19 – it shows biogas
manure not Nibble manure!) Figure 20 describes the material and nutrient flow in the two-
stags dry anaerobic fermentation process on the Yttereneby farm.
The quality and quantity of the initial manure input is comparable from both system but the
following the differences manure treatment systems result in differences in nutrient losses
that impact crop production. Traditional solid manure management is stored over winter on a
dung plate during which time it is assumed that 15 % of the nitrogen is lost to the
atmosphere (Malgeryd, et al 2002) before the measured nitrogen losses of 29 % (minimum
26% and maximum31%) during the aerobic fermentation in the compost heap (24 % loss of N
content after winter storage). This calculated total nitrogen loss of 9 N kg-1
y-1
(39 %) can be
compared with the calculated total loss of 4,5 N kg-1
y-1
(19 %). from the two fractions of
manure from the biogas plant manure system on Yttereneby farm.

22
Manure material and nitrogen flow from cow barn to field in dry digestation system
N kg 495 N kg 802 Tot losses of input
N kg ha 4 N kg ha 6 N kg ha 9
% 15 % 24 % of input 39
Input of
manure to
hydrolys
reactor 1
Input compost Output compost
organic matter BG manure BG manure
t t t
660 561 312
N kg N kg N kg
3 300 2 805 2 003 Tot manure
N kg N kg N kg N kg ha 15
24 20 15 % of input 61
Figure 19. Manure and nutrient flow from cow barn via one stage biogas hydrolysis reactor,
winter storage on dung plate and aerobic composting from May – September before field
application on winter wheat in the five year crop rotation.
Manure material and nitrogen flow from cow barn to field biogas plant system
N kg 308 N kg 132
N kg ha-1
2 N kg ha-1
1
% 9 % 4 T ot losse s
N kg ha- 1
5
Input. re a ct. 2 Output re a ct. 2 % 19
liquid fra ction liquid fra ction
t t
330 330
Input o f Output o f N to t kg N to t kg
ma nure to proce sse d 1 287 1 155
hydro lys ma nure N t o t kg h a- 1
N t o t kg h a- 1
re a cto r 1 from re a cto r 1 9 8
organic matter organic matter
t t N kg 180
660 645 N kg ha-1
1 T ot ma nure
N to t kg N to t kg % 5 N kg ha- 1
20
3 300 2993 % 81
N t o t kg h a- 1
N t o t kg h a- 1
Input compost Output compost
24 22 BG ma nure BG ma nure
t t
315 215
N to t kg N to t kg
1 763 1 584
N t o t kg h a- 1
N t o t kg h a- 1
13 12
Figure 20. Manure and nutrient flow from cow barn via two-stage anaerobic process in
hydrolysis and methane reactor, separate storage of solid and liquid fractions during winter
and aerobic composting of solid fraction from May – September before field application on
winter wheat in the five year crop rotation.
The losses of nitrogen from the fresh manure is 50 % lower in this two-stage process than in
the traditional system. This has consequences for the whole farming system due to a lower
total surplus and lower potential emissions of nitrogen according to the two nutrient balances.
Figure 21 and Figur 22 show the differences in the calculated nutrient balance and flows in
the system with and without the biogas plant on Yttereneby calculated for the same year.

23
Flow of N/P/K kg ha-1
in the agricultural-ecosystem Yttereneby-Skilleby
Dagfinn Reder (0,6 animal unit/ha) farm 2002-2003
Total Total
input sale
58 2 3 22 4 5
Agricultural system
Purchase Vegetable
of feed Sale of cash crops 6 1 1 products
stuffs
3 2 3
Animal
foods
Own feed 72 8 37 16 3 4
Purchase
of seeds Removed Harvest Animal
1 0 0 harvest remains product.
77 9 38 29 3 15 75 10 40
Crop
106 12 53
Biol N- Release from
fixation the animals
45 59 7 36
Manure
Atmosph. Soil
deposition inorganic 36 7 36
8 68 10 47 Soil
organic
Artificial
fertilizer
0 0 0
9 -2 -6 4 0 4 23
Surplus/defecit Field losses Gas
losses from soil from manure losses
Total
surplus/deficit
36 -2 -2
Calculation factors N P K Given figures N P K
Store losses from manure 0,4 Purchace to anim. prod. 3 2 3
Field losses from manure 0,1 0,05 0,1 Purch. seeds 1 0 0
Fodder/animal production 4,6 3,0 10 Biol. N-fix 45
Atmosph. dep. 8
Artificial fertilizer 0
Crop export 5,5 1 1
Export of animal prod. 16 3 4
Calculated values
Own feed 72 8 37
Harvest remain 29 3 15
Figure 21. Flow of N/P/K kg ha-1
year-1
in the agricultural-ecosystem Yttereneby-Skilleby
farm (137 ha and 0,6 animal unit/ha) 2002-2003 without biogas plant.

24
Flow of N/P/K kg ha-1
in the agricultural-ecosystem Yttereneby-Skilleby
Dagfinn Reder (137 ha, 0,6 animal unit/ha) farm 2002-2003
after introduction of biogas production
Total Total
input sale
58 2 3 23 4 5
Agricultural system
Purchase Vegetable
of feed Sale of cash crops 7 1 1 products
stuffs
3 2 3
Animal
foods
Own feed 72 8 37 16 3 4
Purchase
of seeds Removed Harvest Animal
1 0 0 harvest remains product.
78 9 38 31 3,6 15 75 10 40
Crop
110 13 54
Biol N- Release from
fixation the animals
45 59 7 36
Manure
Atmosph. Soil
deposition inorganic 40 7 36
8 75 10 47 Soil
organic
Artificial
fertilizer
0 0 0
12 -2 -6 4 0 4 19
Surplus/defecit Field losses Gas
losses from soil from manure losses
Total
surplus/deficit
35 -2 -2
Calculation factors N P K Given figures N P K
Store losses from manure 0,33 Purchace to anim. prod. 3 2 3
Field losses from manure 0,1 0,05 0,1 Purch. seeds 1 0 0
Fodder/animal production 4,6 3,0 10 Biol. N-fix 45
Harvest remain/harvest 0,4 0,4 0,4 Atmosph. dep. 8
Artificial fertilizer 0
Crop export 6,6 1 1
Export of animal prod. 16 3 4
Calculated figures
Own feed 72 8 37
Harvest remain 31 4 15
Gas losses 19
Figure 22. Flow of N/P/K kg ha-1
year-1
in the agricultural-ecosystem Yttereneby-Skilleby
farm (137 ha and 0,6 animal unit/ha) 2002-2003 with anaerobic fermentation in biogas plant.

25
Field studies
Carbon content in soil
See Figure 14 for a description of the 12 different treatments carried out on plots in each of
the five crops rotation fields.
The average total carbon content in top soil increased on all treatment plots during the 14 year
periods in HV 1 from 1991 to 2005, in HV2 from 1992 to 2006, in HV3 from 1993- 2007, in
HV4 from 1994 to 2008 and in HV 5 during the 5 years 2002 – 2007 (Figure 23). But a
variation of carbon content resulting from the different treatments was also observed.
HV 1 -5
0,000
1,000
2,000
3,000
To
t C
% 0
-20
cm
Year 1
Year 2
Change
Year 1 2,117 1,754 2,113 1,824 1,702
Year 2 2,308 1,799 2,165 1,887 1,768
Change 0,191 0,046 0,052 0,062 0,066
HV 1 91/05 HV2 92/06 HV3 93/07 HV4 94/08 HV 5 02/07
Figure 23. The average total carbon content in the top soil and the average increase from year
1 to year 2 measured in the field experiment HV1 (year 1991- 2005), HV2 year 1992 -2006),
HV3 (year 1993-2007), HV4 (year 1994-2008) and HV5 (year 2002-2005).
The highest carbon content was measured in field HV1 and HV 3 in the five year crop
rotation and in HV 1 the highest average increase during the study period (Figure 23) was
recorded. The total carbon content in the soil increased in all treatments in HV1 from 1991 to
2005 and increased on average between 1,3 and 5% each five-year crop rotation period
(Figure 24).
After 2001 a 5 cm deeper ploughing was introduced which explain the lower observed
increase in HV2, HV3 andHV 4 compare to HV 1 (before change of ploughing depth) and
HV 5 (after change ploughing deth).

26
Figure 24. Average total carbon in top soil in all treatments in HV 1 1991, 1995, 2000 and
2005. General trend is marked.
Influence of amount of manure
The influence of the amount of manure applied on total carbon and humus content is possible
to observe by comparing the change of total carbon in top soil between the different
treatments (Figure 25).
The average carbon content in the soil was higher in the treatment using normal amounts (25
tons per ha) of manure for fertilising compared with zero application. In the treatments with
high manure levels (50 tons per ha) the average carbon and humus content was significantly
higher (104 % higher) than in the plots with zero application.
HV I
2,12
2,16
2,28 2,31
1,95
2,00
2,05
2,10
2,15
2,20
2,25
2,30
2,35
1991 1995 2000 2005
C % top soil

27
HV 1-5
0,00
0,02
0,04
0,06
0,08
0,10
0,12
C %
un
its i
n
top
so
il
HV 1-5 0,08 0,10 0,08 0,03
All treatments FYM 3 FYM 2 No manure
abab
b
a
Figure 25. Change in the total amount of carbon in the top soil after 3 years of crop rotation
(year 4, 5 and 1) (see Figure 14) , average in all treatments, with high manure (FYM 3),
normal farm manure (FYM 2) and no manure application. Figure a and b above diagram mark
a significant difference only between FYM 3 and No manure.
Influence of composted and not composted manure
The average carbon content increase was higher in HV 1 and HV 5 (P<0,1) in the treatments
with composted manure compared to non-composted manure (Figure 26). No statistically
certain changes were observed in HV 2 HV3 and HV4.

28
Change tot-C in top soil FM and CM HV 1-5
0,000
0,100
0,200
0,300
To
t-C
% u
nit
s
FM 0,163 0,040 0,047 0,104 0,051
CM 0,219 0,051 0,063 0,070 0,108
HV 1 HV2 HV3 HV4 HV 5
(b)
(b)(a)
(a)
Figure 26. Change of total carbon in top soil from 1991 - 2005, averages for non-composted
(FM) and composted manure (CM).
In HV 1 the total carbon content in top soil was studied each year (Figure 27). The carbon
content increased steadily and with a higher increase in the soils treated with composted
manure.
HV I
0,03
0,16 0,16
0,05
0,18
0,22
0,00
0,05
0,10
0,15
0,20
0,25
1995 2000 2006
Cang
e C
% u
nits
in to
p so
il
FM CM
Figure 27. Change of total carbon in top soil from 1991 – 1995, 1991 – 2000 and 1991 –
2005, averages for non-composted (FM) and composted manure (CM).
2005

29
Influence of biodynamic preparation on total carbon in topsoil
The carbon content was increased on average higher in HV1 and 5 (P<0,1) in the treatments
with composted and biodynamic preparations compared with use of non-composted manure
Figure 28) but not in HV 2, 3 and 4. In HV1, treatments with composted manure levels of 25
tons per ha (CM II) the top soil carbon increased each crop rotations period and with
significant higher level in the BDP treatments (P<0,05 ) the years 1995 and 2005 (Figure 29).
Change tot C in top soil HV 1-5
0,000
0,050
0,100
0,150
0,200
0,250
0,300
HV 1
91/05
HV2
92/06
HV3
93/08
HV4
94/09
HV 5
02/07
To
t C
% u
nit
s i
n t
op
so
il
FM-
FM+
CM-
CM+
(a)(b)
Figure 28. Change of total carbon in top soil in HV 1 from 1991 – 1995, 1992 – 2006, 1993-
2008, 1994-2009 and HV 5 1992 – 2007 for non-composted (FM) and composted manure
(CM) without (-) and with (+) the use of biodynamic preparations (BDP).

30
Change tot C in top soil HV1 CM2
-0,200
-0,100
0,000
0,100
0,200
0,300
0,400
To
t C
% u
nit
s
- BDP -0,080 0,100 0,078
+BDP 0,231 0,287 0,335
Year 91-95 Year 91-00 Year 91-05
b
a
a
b
Figure 29. HV1 with composted manure level of 25 tons per ha (CM2) without a (-BDP) and
with b (+BDP) biodynamic preparation treatments.
Influence of manure from the biogas plant on total carbon in soil
From 2003 manure from the biogas plant was used and HV results give a indication of the
higher humus content after use of composted biogas treated manure compare with non-
composted manure. The same trend was seen on HV1 but not on HV2, 3 and 4. On HV 5 the
highest humus carbon content and humus formation was observed after use of the biodynamic
treatments (Figure 28). More follow-up studies to better understand the factors affecting these
results are needed. For example it would be valuable to study the carbon immobilisation and
humus formation after one more crop rotation and compare with treatments using manure
from Nibble farm that has not been through the biogas plant.
An increase of total carbon content in the deeper soil layers was observed (+ 77 %) after
comparing total carbon in seven archive samples from 1991 with actual samples from 2009
(Figure 30).

31
Tot C in B-horizon (60-90 cm) HV I
-0,200
0,000
0,200
0,400
0,600
To
t C
% 6
0 -
90
cm
Year 1991 0,320 0,180 0,310 0,200 0,24571
Year 2009 0,310 0,340 0,400 0,413 0,38429
Change -0,010 0,160 0,090 0,213 0,13857
FM2
(n=1)
CM1(n=
1)
CM2
(n=2)
CM3
(n=3)M. s. 1-7
Figure 30. Measured total carbon in the deeper soil layer (60 – 90 cm), HV1 1991 and 2009
from one sample plot with 25 ton fresh manure per ha (FM2), one sample plot with 12,5 ton
composted manure and next crop rotations no manure (CM1), average two samples plots with
25 ton composted manure (CM2) and average three samples plots with 50 ton composted
manure to winter wheat (CM3) in the five year crop rotation and the mean the seven samples.
Number of earthworms
In 2008 the biomass of earth worms in top soil was measured to be between 700 – 1200 kg
per ha and tended to increase on plots with increasing amounts of manure. Treatment with the
biodynamic preparations tended to lower the amount of earth worms when using fresh stable
manure but not when using composted manure (Figure 32). The worm activity measured in
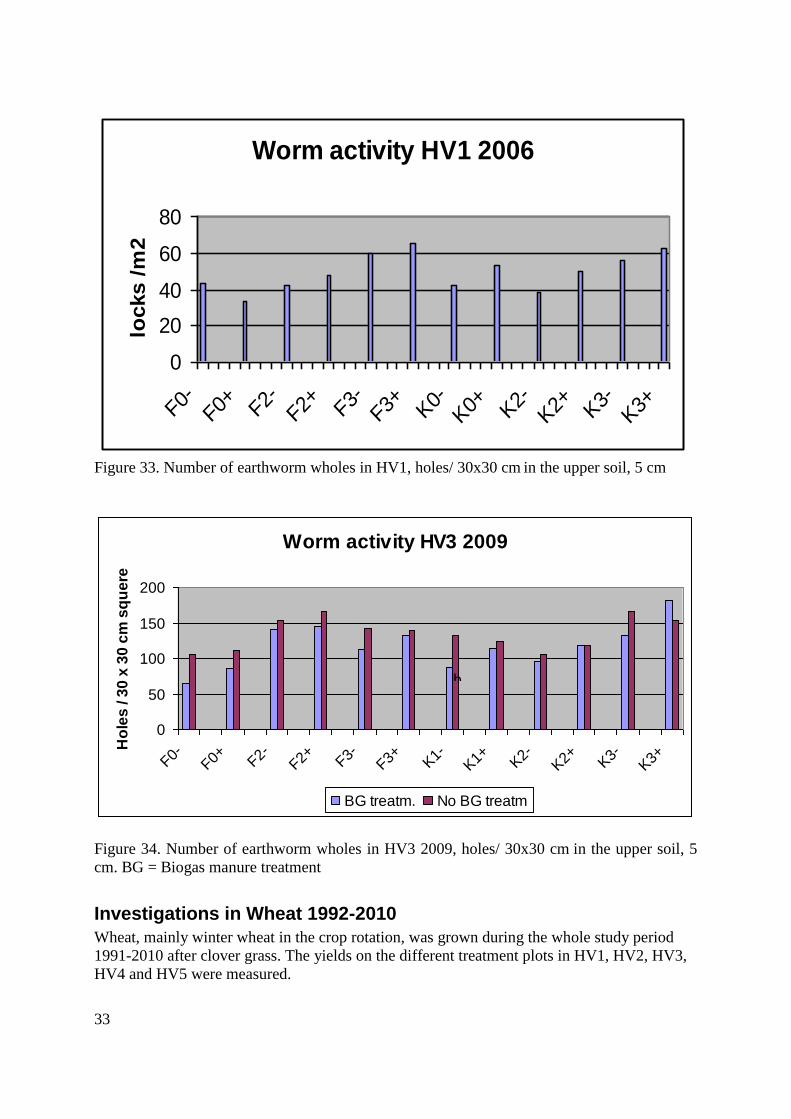
2006 in HV1(counted as worm holes per 30x30 cm square) was significantly higher in plots
with increasing amounts of manure and significantly higher in the plots treated with
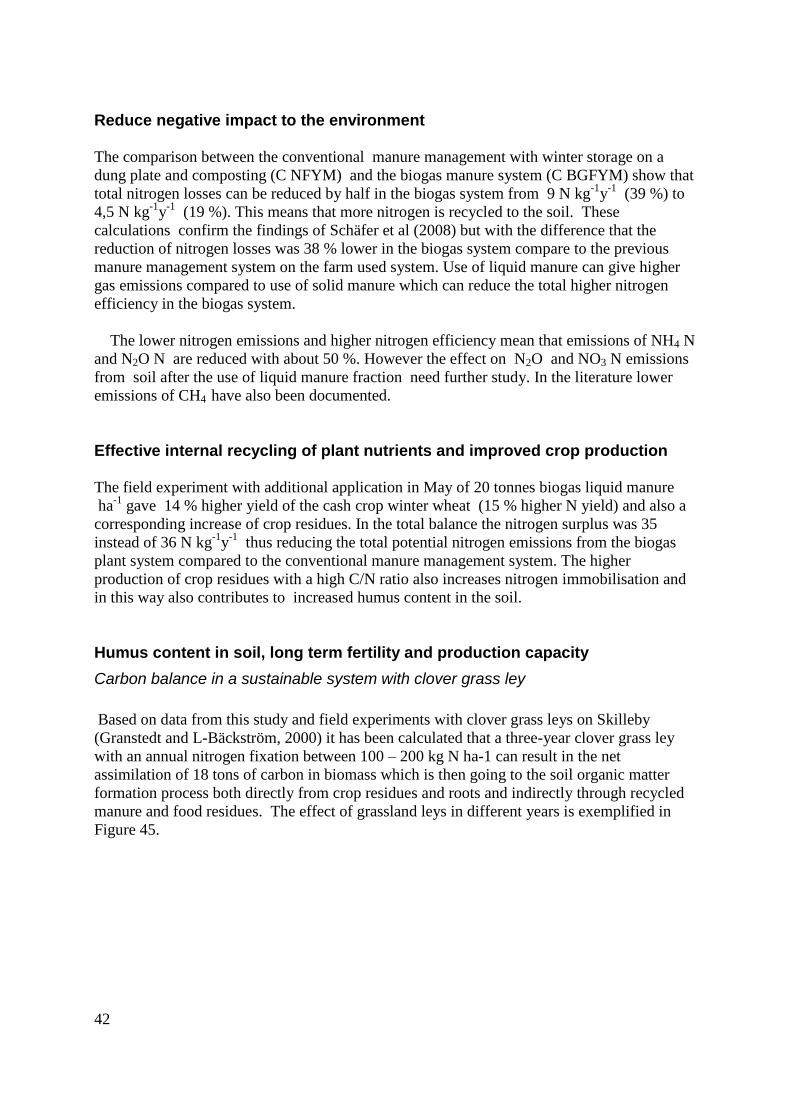
biodynamic preparations (Figure 33). In 2009 in HV 3 manure with and without biogas
treatment was used in the plots divided in two sub plots but without randomisation (Figure
34). Here the worm activity showed tendency to be lower in plots with manure from the
biogas plant but can also be an effect of the soil.

32
Figure 31. Field studies for collecting worms in soil.
Worms 8-13 October 2008 HV 1 , 1 - 12
0
500
1000
1500
kg
/h
a 0-30 cm
1022 796 929 745 1075 939 858 630 645 711 1075 1208
F1- F1+ F2- F2+ F3- F3+ K1- K1+ K2- K2+ K3- K3+
Figure 32. Total biomass of earth worms, kg/ha, in top soil, 0-30 cm, in the different
treatments. See figure 15.
33
Worm activity HV1 2006
0
20
40
60
80
F0-F0+ F2-
F2+ F3-F3+ K
0-K0+ K
2-K2+ K
3-K3+
locks /
m2
Figure 33. Number of earthworm wholes in HV1, holes/ 30x30 cm
in the upper soil, 5 cm
Worm activity HV3 2009
0
50
100
150
200
F0-F0+ F2-
F2+ F3-F3+ K
1-K1+ K
2-K2+ K
3-K3+
Ho
les
/ 3
0 x
30
cm
sq
ue
re
BG treatm. No BG treatm
b
Figure 34. Number of earthworm wholes in HV3 2009, holes/ 30x30 cm in the upper soil, 5
cm. BG = Biogas manure treatment
Investigations in Wheat 1992-2010
Wheat, mainly winter wheat in the crop rotation, was grown during the whole study period
1991-2010 after clover grass. The yields on the different treatment plots in HV1, HV2, HV3,
HV4 and HV5 were measured.

34
Influence on yields of type of manure
In 14 of the total of 19 seasons, the yield was higher when composted manure was used
compared to non-composted manure. by an average of 3, 5 % over the whole period (Figure
35 and Table 4).
Influence on yields of the biodynamic preparations
In plots treated with the biodynamic preparations the yields were on average higher in 11 of
the 19 seasons, and in 5 of these significantly higher (P<0,05). In three seasons the yields
from the plots treated with biodynamic preparations was on average lower and in one year
this decreased yield was significant (P<0,05). The differences were higher during the first 6
years (average 5 %) compared to 2% average during the whole period. To study the trends
over time of the relation between the manure treatments and the effects on yield after three
years clover grass ley, data from the 1992 yield on plots with two previous clover grass leys
has been excluded. Two year clover grass as pre crop give higher pre crop effect compared to
three years clover grass land (Granstedt and L-Baeckström, 2000).
0
1 000
2 000
3 000
4 000
5 000
6 000
HV
1
Hv
2
HV
3
HV
4
HV
1
HV
2
HV
5
HV
3
HV
4
HV
1
HV
2
HV
5
HV
3
HV
4
HV
1
HV
2
HV
5
HV
3
HV
4
1992 1993 1994 1995 1996 1997 1998 1999 2000 2001 2002 2003 2004 2005 2006 2007 2008 2009 2010
F
K
Figure 35. Yield of winter wheat with non-composted manure(F) and with compostedg (K) of
manure, 1992 -2010

35
Table 4. Yield Winter wheat (85 % dm) withnon-composted (F) and composted (K) of
manure, 1992 -2010
F K
1992 HV1 5 253 5 307
1993 Hv2 3 003 2 716
1994 HV3 2 803 3 099
1995 HV4 2 204 2 095
1996 HV1 3 527 3 516
1997 HV2 3 050 3 285
1998 HV5 2 971 2 928
1999 HV3 2 774 2 938
2000 HV4 2 739 2 777
2001 HV1 2 980 3 015
2002 HV2 4 694 4 957
2003 HV5 3 949 4 096
2004 HV3 1 715 2 127
2005 HV4 4 211 4 385
2006 HV1 2 887 2 933
2007 HV2 2 984 2 737
2008 HV5 2 559 2 737
2009 HV3 2 455 2 963
2010 HV4 4 426 4 736
0
1 000
2 000
3 000
4 000
5 000
6 000
HV 1 Hv2 HV 3 HV 4 HV 1 HV 2 HV 5 HV 3 HV 4 HV 1 HV 2 HV 5 HV 3 HV 4 HV 1 HV 2 HV 5 HV 3 HV 4
No B DP
WithB DP
Figure 36. Yields of Winter wheat, in plots treated with compost with and without (No BDP)
BD preparations treatments 1992 -2010.

36
Table 5. Yields of winter wheat, in plots treated with compost with and without (No BDP) BD
preparations treatments 1992 -2010.
No BDP With BDP
1992 HV1 5 293 5 261
1993 Hv2 2 822 2 898
1994 HV3 2 871 3 028
1995 HV4 2 189 2 110
1996 HV1 3 412 3 631
1997 HV2 3 099 3 237
1998 HV5 2 926 2 973
1999 HV3 2 880 2 832
2000 HV4 2 677 2 839
2001 HV1 2 980 3 015
2002 HV2 4 601 5 049
2003 HV5 4 042 4 003
2004 HV3 2 071 1 900
2005 HV4 4 309 4 287
2006 HV1 2 893 2 927
2007 HV2 2 829 2 892
2008 HV5 2 598 2 698
2009 HV3 2 638 2 718
2010 HV4 4 506 4 655
Average 3 244 3 313
Relative 1,0213
Influence on yields of the amount of manure
Figure 37 describes the yields of winter wheat during the period 1993 to 2010 for the three
manure levels and figure 38 shows the difference between the yield with no manure (FYM1)
with the exception of 1993 -1996 when 12,5 tons of manure were applied in FYM1to winter
wheat. FYM2 represents 25 (alternatively 30 tonnes?) per ha and FYM3 50 tonnes per ha.
0
1 000
2 000
3 000
4 000
5 000
6 000
7 000
Yie
ld k
g/h
a
FYM 1 2 600 2 884 2 164 2 585 2 988 2 828 2 544 2 550 2 195 3 419 3 366 2 114 3 914 2 113 2 618 2 684 2 449 4 136
FYM2 2 869 3 154 1 961 3 657 3 323 3 021 2 962 2 815 3 289 5 015 3 864 1 570 4 540 3 132 2 825 2 620 2 556 4 945
FYM3 2 996 2 994 2 434 4 306 3 193 2 958 3 062 2 892 3 509 6 041 4 295 2 272 4 021 3 485 3 139 2 964 3 029 4 420
HV2
1993
HV3
1994
HV4
1995
HV1
1996
HV2
1997
HV5
1998
hv3
1999
HV4
2000
HV1
2001
HV2
2002
HV5
2003
HV3
2004
HV4
2005
HV1
2006
HV2
2007
HV5
2008
HV3
2009
HV5
2010
Figure 37 describes the yields of winter wheat during the period 1993 to 2010 for the three
manure levels and Figure 38 shows the difference between the yield with no manure (FYM1)
with the exception of 1993 -1996 when 12,5 tons of manure were applied in FYM1 to winter

37
wheat. FYM2 represents 25 tons (alternatively 30 tons) per ha and FYM3 50 (alternatively
60 tons) per ha.
The mean yield of 3 445 kg per ha on plots with the high manure application (FYM 3) was
significantly higher than the yield from plots with low manure application (FYM1) (P<0,05)
and the yields from the plots with normal manure application (FYM 2) show a tendency to be
higher (P<0,1) (Figure 37).
0
500
1 000
1 500
2 000
2 500
3 000
3 500
4 000
kg
/ha
kg/ha 2 786 3 229 3 445
FYM 1 FYM 2 FYM 3
(a)
(b)(ab)
y = -0,008x2 + 4,6613x + 2741,6
R2 = 0,0664
0
1000
2000
3000
4000
5000
6000
7000
0,00 50,00 100,00 150,00 200,00 250,00 300,00 350,00
FYM tot N kg/ha
Yie
ld k
g/h
a
Figure 38. The average yields of winter wheat, in plots treated with low (FYM 1), normal
(FYM 2) and high (FYM 3) level of manure (composted and non-composted manure
treatments) 1993 -2010. (The difference between (a), and (b) is statistically significant)
Figure 39. The relation between the total nitrogen content in applied manure (both composted
and non composted) in plots treated with low (FYM 1), normal (FYM 2) and high (FYM 3)
manure applications and the yield of winter wheat,.
The relation between total nitrogen in applied manure (tot N kg/ha) and the yield of winter
wheat (kg/ha) for the five experimental fields 1993 - 2010 is presented in figure 39.
Influence on yields of composted and non-composted manure
Figure 40 shows the relation between yields of winter wheat and manure that has (CM) and
has not been composted (FM) from 1993 to 2010. The regression lines indicate a very weak
tendency for increased yield during the period 1993 - 2010 (y=26+2853, R2=0,08 and
y=42+2823, R2=0,03 respectively) with a tendency for higher yields with composted manure
4 of the years (1994, 1997, 2004, 2005, P<0,1 and significantly higher 2009, P<0,05).

38
0
1 000
2 000
3 000
4 000
5 000
6 000
Yield kg/ha
FM CM
FM 3 003 2 803 2 204 3 527 3 050 2 971 2 774 2 739 2 980 4 694 3 949 1 715 4 211 2 887 2 984 2 559 2 455 4 426
CM 2 716 3 099 2 095 3 516 3 285 2 928 2 938 2 777 3 015 4 957 4 096 2 127 4 385 2 933 2 737 2 737 2 963 4 736
Hv2 HV3 HV4 HV1 HV2 HV5 HV3 HV4 HV1 HV2 HV5 HV3 HV4 HV1 HV2 HV5 HV3 HV4
1 993 1 994 1 995 1 996 1 997 1 998 1 999 2 000 2 001 2 002 2 003 2 004 2 005 2 006 2 007 2 008 2 009 2 010
Figure 40. The relation between non-composted (FM) and composted (CM) manure and the
yields of winter wheat 1993 - 2020
Influence of biogas fermentation on yields
From 2003 manure from the biogas plant (BGFYM) was used and studied through
comparison studies with Nibble manure (NFYM) both non-composted (F) and composted (C)
from 2006 to 2010 (Figure 41 and 42). There was no significant difference in yield on plots
treated with biogas and Nibble manure. In HV4 and 5 only the normal manure application
(30 kg per ha) of Nibble and biogas manure were compared. In 2006, the first year of this
comparison study, only non-composted manure was used in the field HV1. The results
showed that both biogas and Nibble composted manure gave higher yields than non-
composted manure. The biogas plant produces two fractions of manure, one solid and one
liquid fraction. Mass balance calculations show that about the same amount of solid manure is
produced from the biogas plant as composted biogas manure from the compost heap. The
effect on yield of the additional liquid manure from biogas plant (BLM) was studied in 2010
(Figure 43). The addition of 20m3 BLM per ha to the F2 treatment (30 t per ha of non-20 m3
BLM to the C2 treatment (30 t per ha of composted manure) gave a significantly higher yield
of 760 kg ha-1
. (16 %). The average nitrogen yield of winter wheat was 73 and 81,5 kg N ha-1
respectively and gave 13 and 10 kg N ha-1
in higher yield respectively (+ 18 and 12 %).

39
Winter Weat 2006-2010
0
1 000
2 000
3 000
4 000
5 000
6 000
Year
Yie
ld k
g /
ha
F NFYM 2 887 2 938 2 681
F BGFYM 2 930 3 077 2 618
C NFYM 2 845 3 027 3 081 4 509
C BGFYM 2 689 2 737 2 909 4 949
HV1 HV2 HV5 HV3 HV4
2006 2007 2008 2009 2010
Figure 41. Yield of winter wheat after treatments with Nibble farm yard manure (NFYM) and
biogas farm yard manure (BGFYM) both non- composted manure (F) and composted manure
(C) during the five years 2006 – 2010 on the five years crop rotation on the fields HV1 – HV5
on Skilleby experimental farm.
W Wheat HV4 2010
0
1 000
2 000
3 000
4 000
5 000
6 000
yie
ld k
g/h
a
BGM 4 203 4 723
plus BLM 4 675 5 483
F2 C2
Figure 42. Average annual yield of winter
wheat after treatments with normal farm
yard manure (NFYM) and biogas farm
yard manure (BGFYM) used as non-
composted manure (F) and composted
manure (C) during the five years 2006 –
2010 on the five years crop rotation on
the fields HV1 – HV5 on Skilleby
experimental farm.
Figure 43. The yield of winter wheat on HV4
2010 with regular application (30 t per h
)of non-composted and composted (F2
and C2) biogas farm yard manure
(BGFYM) and additional application of
20 m3 biogas liquid manure ( BLM) per
ha.
Winter Wheat 2006-2010
0
1 000
2 000
3 000
4 000
kg / ha and
year
F NFYM 2 835
F BGFYM 2 875
C NFYM 3 366
C BGFYM 3 321
1

40
Discussion
Introduction One hundred years ago agriculture production depended on the use of local renewable energy
resources. The farmer used the wood from the forest for heating and raised horses and oxen
for draft power The farmer was also dependent on maximal recycling of nutrients and humus
building organic material from manure in combination with crop rotations with a high share
grasslands to build biomass and biological nitrogen fixation (Granstedt, 1995).
Recent economic developments in countries like Sweden have forced a specialisation in
agriculture with increasing areas of arable land under crop production without clover and
grass leys and without animal production producing farm yard manure. Animal production is
on other hand concentrated to a smaller group of specialised animal farms were high surpluses
of nutrients cause dangerous levels of emissions to the environment This highly specialised
agriculture is to a great extent dependent on external inputs of both fossil energy and
imported fertilizers fodder as well as a growing use of pesticides especially in simplified crop
rotations with low variation.
In a farming system without animals and leys a reduction of 0,24% per year of the carbon
content in the top soil has been observed On an average mineral soil this can mean a loss of
about 600 kg C or 1440 kg CO2 per ha and year (Bertilsson, 2010). At the same time the lack
of nutrient recycling has led to a decrease of trace elements in soils.
Ecological recycling agriculture documented through on farm studies in the countries around
the Baltic Sea (Granstedt et al 2008) has shown the potential of the integration of crop and
animal production (where the animal production is adapted to the farms own fodder
production capacity) to increase the recycling, reduce use of external resources and reduce
losses of nitrogen and phosphorus compounds to the environment. An additional important
step to realise sustainable agriculture based on local resources is the capacity to produce
renewable energy on the farms. Through anaerobic fermentation of manure before recycling
it is possible to produce methane gas for heating and power for agricultural machines and
transports.
One of the world's first large scale dry anaerobic-digestion on-farm biogas plant has been
built in Järna/Sweden in the context of the highly self-supporting farm organism, Skilleby-
Yttereneby by Biodynamic Research Institute in Järna. This on-farm biogas plant employs a
new process technique: Dairy cattle manure and organic residues originating from the farm
and the surrounding food processing units are digested in two different reactors.
This biogas plant has been evaluated in relation to the following goals:
1) Biogas production and energy self-sufficiency at farm level
2) Reduce negative impact to the environment
3) Effective internal recycling of plant nutrients and improved crop production
4) Improved humus content, fertility and long term production capacity of soil.

41
Biogas production and self sufficiency with energy on farm level The biogas production was evaluated during the years 2003 – 2009. During optimal
conditions it was possible to convert in percent of total carbon close to 50 % of the total
carbon content in the 2 m3
produced manure per day (Figure 43).
Figure 43. Exchange of carbon in gases of the total carbon content in manure.
The X axes shows the different stages of biogas production from the manure input to the
biogas plant on Skilleby-Ytterenby farm in Järna.
During one year total methane gases production was 18 644 m3 but with a documented
potential to produce 29 000 m3.
The production capacity of the plant is presented in figures 9,
17 and 18. Of this the biogas plant needs energy for heating the reactors to stabilise the
temperature to the optimal process temperature of 370C 37 and uses up about 9 000 m
3 during
one year. With an additional 0,5 m3d
-1 food residues from kitchens in the nearby ecological
hospital Widarkliniken and process improvements biogas production increased to more than
70 m3d
-1 and a net production capacity of 500 kWh d
-1. The average use of vehicle fuels on
ecological recycling farms was in the BERAS project calculated to 554 kWh d-1
(Granstedt,
et al 2006).
It can be concluded that based on the farms own manure it is possible to produce 50 – 100 %
of the farms requirements for the vehicle fuels and that the higher level can be realised if it
possible to add additional carbon sources such as food residues. This energy production in
combination with biological nitrogen fixation, recycled manure and animal production based
on the farms own fodder demonstrates how, with the help of modern technology, it is
possible to realise a self-sufficient sustainable agriculture production based on local and
renewable resources.
100 81 74
55
0 19 26
45
0 10 20 30 40 50 60 70 80 90
100
Fresh Low Normal High
Exchange stages
Gas % of C tot
C in CO2 and CH4
C in org. matter
42
Reduce negative impact to the environment
The comparison between the conventional manure management with winter storage on a
dung plate and composting (C NFYM) and the biogas manure system (C BGFYM) show that
total nitrogen losses can be reduced by half in the biogas system from 9 N kg-1
y-1
(39 %) to
4,5 N kg-1
y-1
(19 %). This means that more nitrogen is recycled to the soil. These
calculations confirm the findings of Schäfer et al (2008) but with the difference that the
reduction of nitrogen losses was 38 % lower in the biogas system compare to the previous
manure management system on the farm used system. Use of liquid manure can give higher
gas emissions compared to use of solid manure which can reduce the total higher nitrogen
efficiency in the biogas system.
The lower nitrogen emissions and higher nitrogen efficiency mean that emissions of NH4 N
and N2O N are reduced with about 50 %. However the effect on N2O and NO3 N emissions
from soil after the use of liquid manure fraction need further study. In the literature lower
emissions of CH4 have also been documented.
Effective internal recycling of plant nutrients and improved crop production The field experiment with additional application in May of 20 tonnes biogas liquid manure
ha-1
gave 14 % higher yield of the cash crop winter wheat (15 % higher N yield) and also a
corresponding increase of crop residues. In the total balance the nitrogen surplus was 35
instead of 36 N kg-1
y-1
thus reducing the total potential nitrogen emissions from the biogas
plant system compared to the conventional manure management system. The higher
production of crop residues with a high C/N ratio also increases nitrogen immobilisation and
in this way also contributes to increased humus content in the soil.
Humus content in soil, long term fertility and production capacity
Carbon balance in a sustainable system with clover grass ley
Based on data from this study and field experiments with clover grass leys on Skilleby
(Granstedt and L-Bäckström, 2000) it has been calculated that a three-year clover grass ley
with an annual nitrogen fixation between 100 – 200 kg N ha-1 can result in the net
assimilation of 18 tons of carbon in biomass which is then going to the soil organic matter
formation process both directly from crop residues and roots and indirectly through recycled
manure and food residues. The effect of grassland leys in different years is exemplified in
Figure 45.

43
Soil Organic Matter in topsoil as a fuction by ley
0
1
2
3
4
5
6
7
8
0 2 3 5
Number of leys in 6 years crop rotation
SO
M %
Silt loam
Silt loam
Till clay
Soil Organic Matter = SOM in top soil after three rotations in North Sweden (Persson, 1994)
Soil Organic Matter in topsoil as a fuction by ley
0
1
2
3
4
5
6
7
8
0 2 3 5
Number of leys in 6 years crop rotation
SO
M %
Silt loam
Silt loam
Till clay
Figure 45. Soil organic matter after three crop rotations with different numbers of leys in the 6
years crop rotation (Persson, 1994)
Previous experiment
In the thirty-two year long K-experiment (1958 – 1990) the treatments with organic manure
combined with the clover/grass ley gave a clear increase of organic carbon in the topsoil
compared with no use of organic manure (Reents, Pettersson & Wistinghausen, 1992). The
mineral fertilized treatments and the unfertilized treatment gave no increase of the carbon and
humus content despite the inclusion of leys in the crop rotation. The total amount of organic
carbon to a depth of 60 cm, after interpolation of the humus content in the soil layers between
them, was calculated to an annual average increase of organic carbon in the order of 800 kg
per ha in the biodynamic treatment (Granstedt and Kjellenberg, 2008). This amount is
comparable to what is reported from the renowned Rhodale long term experiment from 1981
to 2005 in Pennsylvania in USA in a more legume based farming system with farm yard
manure, Soya beans and clover/grass ley (Hepperly, Douds & Seidel, 2006) and correspond
with the DOK experiment in Switzerland where the effect of biodynamic (BD) preparation
and composted manure are also reported (Mäder et al, 2002).
In a study comparing biodynamic and conventional cultivation, the UJ-experiment (1971-
1979), it was possible to analyse the importance of leys in each system (Pettersson, 1982).
The humus concentration in the biodynamic trial B2 with ley increased from 2.72% to 3.06%
(1.58 to 1,77 % C-org) during the 8-year trial period (slightly more than 10%) while the
humus content remained at the same level in the trial with conventional cultivation A1
without leys (Figure 46).

44
Soil Organic Carbon Järna experiment
1,45
1,5
1,55
1,6
1,65
1,7
1,75
1,8
1971 1973 1976 1979
Co
rg -
%
0
-20
cm
B2
B1
A2
A1
L+FYM
L+MinF
FYM
Min
Figure 46. Trials comparing biodynamic and conventional cultivation in Järna 1971 – 1979. (
L – ley, MinF – mineral fertiliser and FYM – farmyard manure)
In these trials the importance of leys and organic fertilizer for the assimilation of organic
carbon and the building up and maintenance of the humus content in the soil and with this the
associated biological soil properties is apparent (Dlouhý 1981, Pettersson, 1982, Granstedt
and Kjellenberg 1999).
During the 15 years from 1991 to 2005 the total carbon increased on average from 2.12 to
2.31 % in top soil on field experiment HV1 on Skilleby. Despite a change to deeper ploughing
before sowing winter wheat it was possible to observe an increase of organic carbon content
and formation of soil organic matter on all fields HV1 – HV 5 and a significantly higher
increase for the manure treatment compared to the no manure treatments for all fields together
(See Figure 25). The significant average increase in the 20 cm topsoil on HV 1 field was
calculated to 5 725 kg C ha-1
from 63 500 to 69 225 kg C ha-1
assuming 3000 tonnes top soil
per ha (1 % carbon = 30 000kg). This increase of carbon in soil through formation of soil
organic biomass (SOM) is in accordance with the findings of earlier studies referred to above
Influence of composting and use of Biodynamic treatments
In the Swiss DOK trials in FiBL which compared biodynamic, organic and conventional
treatments the humus content (SOM) was, after 20 years in conventional farming 2, 8 % , in
organic farming with organic manure 3,15 % and in biodynamic (BD) treatment 3,65 %
(Mäder et al, 2002). The separate effect of the composting process and the BD effect was not

45
studied. In the Järna study (HV1 in Figure 27) composted manure gave a 10,3 % increase of
the organic carbon during 14 years (1991 -2005) compare to non-composted manure's 7,3 % -
(34 % higher effect). The BD treatments gave a significantly higher increase compared to no
BD on the organic carbon and SOM in HV1 (Figure 29) and HV5 (Figure 28). These results
correspond to results in the long term study in Darmstadt, Germany (Abele, 1987)Further
studies to better understanding how this is possible are needed.
Influence of amount and composting of manure on soil fertility and plant nutrient
managements.
The total amount of worms were calculated to be more than 1000 kg biomass per ha for trial
plots with high (50 kg) applications of composted manure in HV1. The samples were taken
over a rather long time period due to variable weather conditions. Clearer differences were
seen between treatments from the counting of worm locks which gave a significant higher
indication of worm activity in plots with higher manure application and also an effect of BD
treatments. The high density of worms is one important factor explaining the fact that, despite
the net export of plant nutrients, there was no decrease of soluble nutrient contents in soils and
in some cases an increase during the project time.
Influence of the amount and composting of manure on yield of winter wheat.
The average yield on the normal (25 – 30 t per ha) manure level FYM 2 (composted and not
composted manure) was 3329 kg and was on average 16 % higher than the low (0 t per ha)
manure treatment FYM 1. The average yield in FYM 3 treatment was 23 % higher than
FYM 1 and was the only statistically significant difference. Despite a high variation in the
yield there seems to be a weak increase of the yield which from the year 2002 was about 42
kg per ha for the treatments with composted manure compare with 26 kg /ha for the
treatments with non-composted manure. For the whole study period an increase of soil
organic matter (SOM) was observed in soil with high applications of composted manure and
there was also a tendency of higher yields in plots treated with composted manure. More
research is needed to understand the complexity of factors that influence yields over the long
term.
Influence of the extent of biogas treatment on SOM, soil fertility and long term productivity.
The increase of humus content in HV 5 which had applications of only biogas manure from
2003 (Figure 28) follow the same trend as in HV 1 studied from 1991 (an increase of the soil
carbon status for all treatments). This increase in humus content has occurred despite the fact
that in the biogas treatments up to 66 % of the total carbon in the manure is lost through the
production of methane gas and loss of CO2 during both the biogas fermentation and the
following composting process (Figure 18 a). Only 34 % of the original carbon in manure is
incorporated into the soil organic biomass (SOM). This is in contrast to the 50% that is
incorporated from composted manure (Figure 18 b). It is possible that both types of manure
eventually result in the formation of the same amount of SOM corresponding to about a third
of the original biomass in manure but perhaps with lower biological activity during both the
composting process (Figure 16) and in the soil when biogas manure is used. The long term
implications of this need to be studied.

46
Conclusions
One of the world's first large scale dry anaerobic-digestion on-farm biogas plants is in Järna
Sweden on the ecological recycling farm Skilleby-Yttereneby which is to a large extent self-
sufficient. This plant is run by the Biodynamic Research Institute in Järna. The biogas plant's
fermentation process is divided into two stages: one which gives solid rest products of manure
that are composted before field application and one which produces a liquid fraction for direct
use as a complementary liquid manure in crop production.
The biogas production is based on approximately 2 tons manure per day from app. 50 dairy
cows and 50 calves. This number of animals, (0,6 animal units per ha on 137 ha), is based on
the principles of Ecological Recycling Agriculture (ERA). This means that the number of
animals is adapted to the amount of fodder that can be sustainable produced on the farm in a 5
year crop rotation with 3 years clover grassland for biological nitrogen fixation and soil
improvement.
The production process was evaluated during the years 2003 – 2009. During optimal
conditions it was possible to convert nearly 50 % of the total manure carbon content to biogas
(about 60% CH4 and 40 % CO2) from the 2 m3
manure per day.
Additional ecological food residues from public kitchens were also used as substrate
indicating the possibility to also recycle plant nutrients from food products back to agriculture
and in this way also increase the biogas production on the farm. With this complement of
food residues it was possible to produce the same amount or more of renewable net energy
used as fuel for the farm vehicles.
The 50% reduction of nitrogen compounds (NH4 N and N2O N) emissions from the manure
system as well as lowered methane gas emissions from manure mean that more nitrogen is
recycled to the soil for crop production and green house gases emissions and acidification are
decreased.
An additional benefit to the farmer is the more effective recycling of nitrogen in the form of
liquid manure that can be optimally utilised for crop production. In this documented case the
result was a 14 % higher yield of bread grain. The recycling from both the farm and food
sector, producing bio-energy and compost from solid manure make it possible for farmers to
become self-sufficient in plant nutrients while simultaneously improving soil fertility
These field studies comparing composted and non-composted manure show how a farming
system based on a five year crop rotation combined with a balanced animal production based
on on-farm fodder production and with recycling and composting of the manure can in the
long term improve soil fertility and the conditions for a better yield. This is possible to
achieve with solid manure which is first used for biogas production and is then composted
before field application.
This study shows how ecological farming based on recycling has the capacity to be self-
sufficient in energy through biogas production from solid manure and food residues while at
47
the same time improving soil fertility and reducing the surplus of carbon in the atmosphere by
improving the soils capacity to store carbon.
Acknowledgements
The author warmly thanks colleagues who in different ways have contributed to this report
and the realisation of the now evaluated Biogas Plant, especially Lars Evers who with support
from Bertil Siversson, was responsible for the construction and running of the Plant, the ,
process improvements and data collection. Thanks also to farmer Dagfinn Reder and his staff
who opened up their farm to make the construction of the biogas plant and this research
possible, with all the practical consequences this had for their daily work. Thanks also to the
farm owner, Agape Foundation, who gave economic support and guaranties and the group of
private and institutional financial supporters making the building of the biogas plant possible.
Warm thanks my colleague, Dr Winfried Schäfer who together with colleagues at MTT in
Finland, carried out the technical documentation and evaluation of the biogas plant. Finally
warm thanks to Ekhaga Foundation for the support which made this evaluation possible.
Conclusion in Swedish follows.
Sammanfattning på svenska
Gårdsbaserad biogasproduktion med fast stallgödsel i ekologisk odling
En av världens första fullskaleanläggningar på gårdsnivå baserad på fast stallgödsel blev
färdigbygd 2003 på Skilleby-Yttereneby försöksgård i Järna och vars miljö och
produktionsnytta nu har utvärderats. Anläggningen är bygd och utvecklad av Stiftelsen
Biodynamiska Forskningsinstitutet i Järna under ledning av Artur Granstedt. Konstruktör har
varit Lars Evers anställd vid institutet samt Bertil Siversson på BioMil AB.
Gården är självförsörjande på både foder och gödsel och kan genom biogasanläggningen bli
självförsörjande även på energi. Rötningsprocessen sker i två steg. Det första steget ger en
restprodukt av rötad gödsel som genomgår en efterkompostering och användes på hösten som
gödsel till höstsäd. Steg två består av en anaerob metangasjäsning av den flytande
rötningsresten från steg ett och ger en flytande restprodukt som används som flytgödsel i
växande gröda.
Biogasproduktionen baseras på ca 2 ton fast stallgödsel per dag som efter urinseparering
matas ut med tryckare från ladugården med ca 50 mjölkkor och ca 50 ungdjur och kalvar för
gårdens rekrytering. Antalet djur (0,6 djurenheter per ha och en totalareal på 137 ha) är
baserat på principerna för ekologiskt kretsloppsjordbruk (Ecological Recycling Agriculture
and Society). Det betyder att antalet djur är anpassat till den mängd foder gården uthålligt kan
producera samtidigt som det finns utrymme för odling av livsmedelsgrödor på ca 15 % av
arealen i den femåriga växtföljden med tillräcklig andel kvävefixerande och djuprotade

48
vallbaljväxter för gårdens självförsörjning med kväve och mineralämnen (vårsäd men insådd,
tre år vall följt av höstvete som gödslas före sådd).
Produktionsprocessen och rötresternas efterföljande användning utvärderades genom mätning
av producerad biogas, analyser av rötrester och beräkning av nettoproducerad energi.
Miljökonsekvensanalyser gjordes genom analyser av rötad biomassa, massbalansberäkningar
och beräkningar av växtnäringsflödena på gårdsnivå. Fältförsök genomfördes med
användande av rötrester som gödsel i jämförelser med traditionell stallgödselhantering och
som gjorde det möjligt att påvisa inverkan på humusuppbyggnad, markens
bördighetsegenskaper och skördeutfall.
Under optimala betingelser visade det sig möjligt att omforma nära 50 % av gödselns totala
kolinnehåll till biogas(omkring 60% CH4 och 40 % CO2) från omkring 2 m3
gödsel per dag.
Ytterligare tillförsel av substrat till biogasanläggningen i form köksavfall från en ekologisk
restaurang gjorde det möjligt att öka biogasproduktionen och samtidigt också öka
recirkulering av växtnäring från livsmedelsavfallet tillbaka till åkern. Med detta komplement
så uppnåddes mer effektiv växtnäringscirkulering och en nettoproduktion av förnyelsebar
energi motsvarande gårdens energibehov för traktorer och maskiner.
En 50 % reduktion av emissionen av kväveföreningar (NH4 N and N2O N) kunde på påvisas
genom att motsvarande mera kväve erhölls i form av kväve i den flytande restprodukten som
användes som flytgödsel. Detta innebär reducerade emissioner av växthusgaser samtidigt med
en effektivare resursanvändning och som gynnade växtproduktionen. I fältförsöken påvisades
14 % högre skörd av brödsäd jämfört med traditionell stallgödselhantering med fastgödsel och
efterföljande kompostering så som det tillämpades på försöksgården innan
biogasanläggningen byggdes.
Fältstudierna omfattade jämförelser mellan komposterad och icke komposterad gödsel i det
här tillämpade odlingssystemet med femårig växtföljden, treåriga baljväxtblandvallar och
därtill anpassad djurhållning. En mullhaltsökning motsvarande ca 400 kg kol per ha och år
under ett växtföljdsomlopp har här kunnat påvisas och med något högre värden för
komposterad gödsel. De påvisade mullhaltsökningarna gällde också för biogasrötad gödsel
med efterföljande kompostering.
Studien visar hur ekologiskt lantbruk baserat på kretslopp har möjligheten att vara
självförsörjande på energi genom biogasproduktion baserad på fast stallgödsel och
livsmedelsavfall och samtidigt öka bördigheten i marken. Emissionerna av koldioxid till
atmosfären minskar när det markbundna kolförrådet ökar. Till dessa miljöfördelar kommer de
minskade emissioner av växthusgaser som själva biogasproduktionen innebär med minskade
emissioner från förbrukning av fossila drivmedel på gårdsnivå.
Studien med utvärdering av biogasanläggningens miljönytta och betydelse för
lantbruksproduktionen har kunnat genomföras tack vare anslag från Ekhagastiftelsen.
49
References
Abele U. 1987. Produktqualität und Düngung- mineralisch, organisch, biologisch-dynamisch,
Ed, Mün, ster-Hiltrup (1987).
Bertilsson, G. 2010. Mat, Klimat och miljö. En möjlighetsbok. Recito förlag, Borås.
Dlouhy J. 1981. Alternativa odlingsformer- växtprodukters kvalitet vid konventionell och
biodynamisk odling, in Inst f Växtodling, Ed. SLU, Uppsala.
Granstedt A. 1992. Case studies on the flow and supply of nitrogen in alternative farming in
Sweden. Biological Agriculture and Horticulture 9:15-63.
Granstedt A. 1995. Long term field experiment in Sweden (K-Trial). Effects on organic and
inorganic fertilizers on soil and crops. , in Fertilization, crop yield and quality Main effects of
various organic and mineral fertilization on soil organic matter turnover and plant growth
Concerted action supported by the European Community Fertilization Systems in Organic
Farming, Ed by Raupp J, pp 16-21
Granstedt A. 2000. Stallgödselanvändning i ekologisk odling med hänsyn till hushållning med
växtnäringsämnen och produktion i ekologisk odling, in Ekologiskt Lantbruk, Ed. Swedish
university of agricultural Sciences., Uppsala.).
Granstedt, A., L-Baeckström, G. 2000. Studies of the preceding crop effect of leys in
ecological agriculture. American Journal of Alternative Agriculture, vol. 15, no. 2, pages 68–
78. Washington University.
Granstedt, A and Kjellenberg L. 2008. Organic and biodynamic cultivation - a possible way
of increasing humus capital, improving soil fertility and providing a significant carbon sink in
Nordic conditions. Proceedings of the Second Scientific Conference of the International
Society of Organic Agriculture Research (ISOFAR), held at the 16th IFOAM Organic World
Congress Modena, Italy, June 18-20, 2008.
Granstedt, A. Thomsson, O. and Schneider, T. 2006, Environmental impacts of ecological
food systems - final report from BERAS. Work Package 2. CUL, SLU
Hepperly, Douds, Seidel, 2006. The Rodale Institute Farming Systems Trial 1981 to 2005. In
Raupp, Pekrun, Oltmanns and Köpke. Long Term Field Experiments in Organic Farming.
ISOFAR Scientific Series. Berlin.
Kjellenberg, L., Granstedt A. and Pettersson BD. 2005. The connection between soil, crop
and manure. Resuts from the K-trial, a 33-year study on the effect of fertilisation on the
properties of soil and crop, Ed. Biodynamic Research Institute, Järna, Sweden (2005).

50
Kjellenberg L, Pettersson BD and Granstedt A. 1998. Samband mellan Mark Gröda Gödsling
- Resultat från K-försöket en 33-årig studie av gödslingens inverkan på mark och grödors
egenskaper in Nordisk Forskningsring meddelande, Ed. Nordisk Forskningsring för
biodynamisk odling, Järna.
Malgeryd, J., Karlsson, S., Rhode, L. & Salomon, E. 2002. Lönsam stallgödselhantering –
teknik, växtnäringshushållning, kvalitet och ekonomi. JTI-Institutet för jordbruk- och
miljöteknik. Tekning för Lantbruket 99.
Mäder, P., Fliessbach, A., Dubois, D., Gunst,L., Fried, P., & Niggli, U. 2000. Soil Fertility
and Biodiversity in Organic Farming. Science VOL 296 pp 1592-1597.
Persson, J., 1994. Soil Fertility and Regulating Factors. Naturvårdsverket, Stockholm.
Pettersson B. D. 1982. Konventionell och biodynamisk odling, in Nordisk Forskningsring
meddelande, Ed. Nordisk Forskningsring, Järna.
Pettersson B.D, Reents H and Wistinghausen Ev, Düngung und Bodeneigenschaften, in
Nordisk Forskningsring meddelande, Ed. Nordisk Forskningsring för biodynamisk odling,
Järna (1992).
Schäfer, W., Lehto, M and Teye, F. 2006. Dry anaerobic digestion of organic residues on
farm. Solid compost from biogas plant digestation residues –a new product. MTT, Agrifood
Research, Finland.

51
Supplement 1. Weather conditions
Data on temperature and precipitation was obtained from the Swedish Meteorological and
Hydrological Institute weather stations in the proximity (within 20 km), from the field trial
and from 2004 and onwards on a climatic station located on the farm (figures 10- 16 ).
6,5
6,7
7,2
7,4
8,2
6,0
6,5
7,0
7,5
8,0
8,5
2004 2005 2006 2007 2008
Ave
rage
yea
r tem
pera
ture
s o C
Figure 1. Supplement 1. Average annual temperatures during 2004 – 2008.
514543
345
419
648
0
100
200
300
400
500
600
700
2004 2005 2006 2007 2008
pre
cip
itati
on
s p
er
yea m
mr
Figure 2, Supplement 1. Average annual precipitation during 2004 – 2008
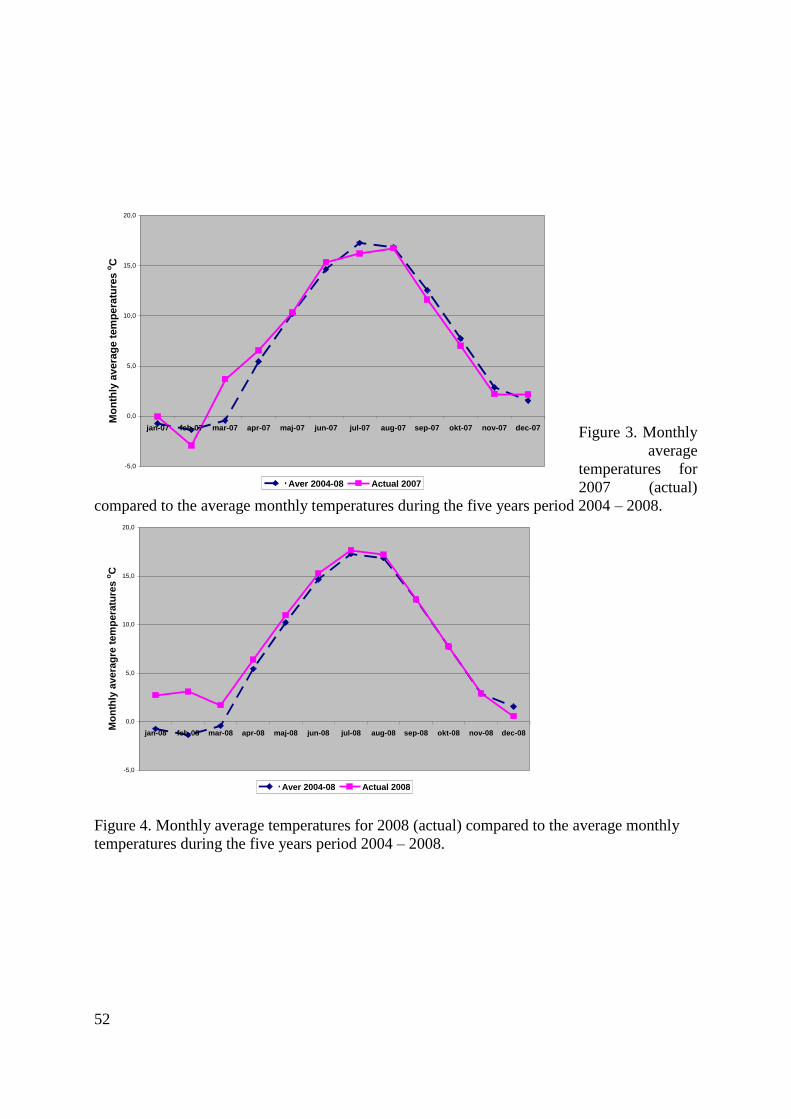
52
Figure 3. Monthly
average
temperatures for
2007 (actual)
compared to the average monthly temperatures during the five years period 2004 – 2008.
-5,0
0,0
5,0
10,0
15,0
20,0
jan-08 feb-08 mar-08 apr-08 maj-08 jun-08 jul-08 aug-08 sep-08 okt-08 nov-08 dec-08
Mo
nth
ly a
vera
gre
tem
pera
ture
s o
C
Aver 2004-08 Actual 2008
Figure 4. Monthly average temperatures for 2008 (actual) compared to the average monthly
temperatures during the five years period 2004 – 2008.
-5,0
0,0
5,0
10,0
15,0
20,0
jan-07 feb-07 mar-07 apr-07 maj-07 jun-07 jul-07 aug-07 sep-07 okt-07 nov-07 dec-07
Mo
nth
ly a
vera
ge
tem
pe
ratu
res o
C
Aver 2004-08 Actual 2007

53
Supplement 2. Chemical properties
pH top soil HV I
5,0
5,5
6,0
6,5
F1
F1
+
F2
-
F2
+
F3
-
F3
+
K1
-
K1
+
K2
-
K2
+
K3
-
K3
+
pH
1991 1995 2000 2005 2005
P-AL top soil HV I
0,0
0,5
1,0
1,5
2,0
2,5
3,0
3,5
4,0
F1
F1
+
F2
-
F2
+
F3
-
F3
+
K1
-
K1
+
K2
-
K2
+
K3
-
K3
+
P-A
L m
g/1
00
g
1991
1995
2000
2005
K-AL top soil HVI
0,0
5,0
10,0
15,0
20,0
F1F1+ F2-
F2+ F3-F3+ K
1-K1+ K
2-K2+ K
3-K3+
K-A
L m
g/1
00g
1991 1995 2000 2005 2005

54
Mg-AL top soil HV I
0,05,0
10,015,020,025,030,035,0
F1F1+ F2-
F2+ F3-F3+ K
1-K1+ K
2-K2+ K
3-K3+
Mg
AL
mg
/10
0g
1991 1995 2000 2005 2005
Ca-AL top soil HV I
0,0
50,0
100,0
150,0
200,0
250,0
300,0
F1F1+ F2-
F2+ F3-F3+ K
1-K1+ K
2-K2+ K
3-K3+
Ca
-Al m
g/1
00
g
1991 1995 2000 2005 2005
Figure 1 - 5 Supplement 2. Soil chemical analysis 1991, 1995, 2000 and 2005 field trial plot
HV1.
pH top soil HV2
5,60
5,80
6,00
6,20
6,40
6,60
6,80
pH-92 pH-95 pH 2007
pH-92 6,05 6,09 6,14 6,14 6,11 6,12 6,11 6,12 6,03 6,05 6,09 6,07
pH-95 6,35 6,50 6,53 6,43 6,45 6,43 6,35 6,43 6,23 6,28 6,30 6,30
pH 2007 6,43 6,38 6,58 6,48 6,48 6,55 6,13 6,38 6,40 6,48 6,40 6,53
f 0- f 0+ f 2- f 2+ f 3- f 3+ k0- k0+ k2- k2+ k3- k3+

55
P-AL top soil HV2
0,00
1,00
2,00
3,00
4,00
mg
/100 g
jo
rd
P-AL 92 P-95 P-AL 2007
P-AL 92 1,8 1,9 2,1 2,0 2,0 2,1 2,1 2,2 1,8 1,9 2,3 2,1
P-95 1,4 1,5 2,2 1,7 1,9 1,7 1,9 2,3 1,4 1,5 1,8 1,9
P-AL 2007 1,8 2,6 2,5 2,5 2,6 2,7 2,2 2,4 2,3 2,4 2,8 3,2
f0-f0
+f2-
f2
+f3-
f3
+k0-
k0
+k2-
k2
+k3-
k3
+
K- AL top soil HV2
0,00
5,00
10,00
15,00
mg
/ 1
00 g
jo
rd
K-AL-92 K-AL-95 K-AL 2007
K-AL-92 9,0 9,0 8,7 8,7 9,5 9,41 8,91 8,8 8,5 8,5 9,31 9,0
K-AL-95 10,3 10,7 11,3 11,2 12,5 12,0 10,3 10,7 11,0 10,1 11,7 10,7
K-AL 2007 10,2 10,4 11,7 11,2 13,0 12,6 10,0 10,1 11,8 11,3 13,4 12,5
f 0- f 0+ f 2- f 2+ f 3- f 3+ k0-k0
+k2-
k2
+k3-
k3
+
Figure 6 - 8 Supplement 2. Soil chemical analysis 1991, 1995, 2000 and 2005 field trial plot
HV2.