ommonwealth of assachusetts renewable energy and energy
TRANSCRIPT
COMMONWEALTH OF MASSACHUSETTS
RENEWABLE ENERGY AND ENERGY
EFFICIENCY POTENTIAL AT STATE‐OWNED FACILITIES AND LANDS
Prepared by: Massachusetts Executive Office of Energy and Environmental Affairs Massachusetts Clean Energy Center
February 20, 2009
Developed by: Navigant Consulting, Inc. 77 South Bedford Street Suite 400 Burlington, MA 01803
781‐270‐8314 www.navigantconsulting.com
Table of Contents
Executive Summary.................................................................................................................... 1
Introduction ................................................................................................................................. 6
Scope of the Effort ................................................................................................................................................ 6Context and Accomplishments to Date ............................................................................................................. 7Current Activities ................................................................................................................................................. 8
Renewable Energy Analysis ...................................................................................................... 9
Windpower............................................................................................................................................................ 9Photovoltaics ....................................................................................................................................................... 16Hydroelectric....................................................................................................................................................... 19Solar Thermal Hot Water................................................................................................................................... 22Biomass ................................................................................................................................................................ 25Geothermal Heat Pumps ................................................................................................................................... 29
Energy Efficiency Analysis ...................................................................................................... 32
Energy Efficiency Accomplishments ............................................................................................................... 32Energy Efficiency Potential ............................................................................................................................... 33Methodology, Data Sources, and Assumptions ............................................................................................. 34Conclusions ......................................................................................................................................................... 34
Summary and Conclusions...................................................................................................... 36
Page i
Executive Summary
Renewable Energy and Energy Efficiency Potential at State‐Owned Properties in the Commonwealth of Massachusetts
This report provides estimates of renewable energy and energy efficiency potential at facilities and lands owned by the Commonwealth of Massachusetts. In doing so, this document provides the investigation into clean energy sector potential mandated under the Massachusetts Green Jobs Act of 2008.
The Commonwealth has already made notable progress in moving renewable energy and energy efficiency forward at state owned facilities and lands. Installed renewable energy on state‐owned property now exceeds 12 MW. Over 15,900 MMBTU per year are generated by biomass heat and other renewable sources, equivalent to about 4,700 MWh per year.1 Energy efficiency savings of over $27 million per year have been achieved at properties managed by the Department of Capital Asset Management (DCAM). Additionally, Executive Order 484 set energy efficiency, renewable energy, and greenhouse gas targets for Massachusetts agencies in 2007 and established the Leading by Example Program to implement those targets.
This analysis identifies Existing, Planned, and Potential renewable energy installations. • The Existing category includes projects which are currently installed and operational on state‐
owned properties and facilities. • The Planned category includes projects on state‐owned properties and facilities which have
undergone site‐specific feasibility studies and have received approval and/or funding. However, unlike the other renewable technologies examined, solar thermal hot water projects in the Planned category have only undergone feasibility studies, and have not yet received approval and/or funding.
• The Potential category includes projects on state‐owned properties and facilities which have been identified as having the potential for future installations, but have not undergone feasibility studies or received approval and/or funding. Such opportunities will be subject to the typical economic and environmental considerations that accompany project development.
The data available for this analysis varied in level of detail. A combination of data with high levels of detail, including some site specific data, and data with low levels of detail were available. While not representative of comprehensive engineering and feasibility studies throughout all Commonwealth properties, the information in this report represents a best estimate within each technological category. It is important to note that some of the planned and potential projects listed may not come to fruition, while others not identified may be realized.
Table 1 summarizes existing, planned, and potential renewable energy development on state‐owned property as determined by data provided by the Commonwealth. The capacity of this development is provided in MW, as well as projected generation in MWh, for those installations which produce electricity. Projected generation of MMBTU per year is provided for those installations which have a thermal generation component, such as solar thermal hot water, biomass pure heat generation, the heat component of biomass combined heat and power, and geothermal heat pumps. A final column, Equivalent Savings, represents the value of offset electricity savings for wind, solar, and hydro, the value of offset natural gas for solar thermal hot water and geothermal heat pumps, and the value of offset oil
1 MWh equivalents are provided for comparative purposes only. It is anticipated that renewable energy heat production will primarily offset natural gas and oil use, not electricity use. Electricity equivalent has been adjusted to remove electricity used to operate the geothermal heat pump.
Page 1
for biomass as determined based on assumed electricity, natural gas, and heating oil prices obtained from the Commonwealth. These prices are subject to extreme volatility.
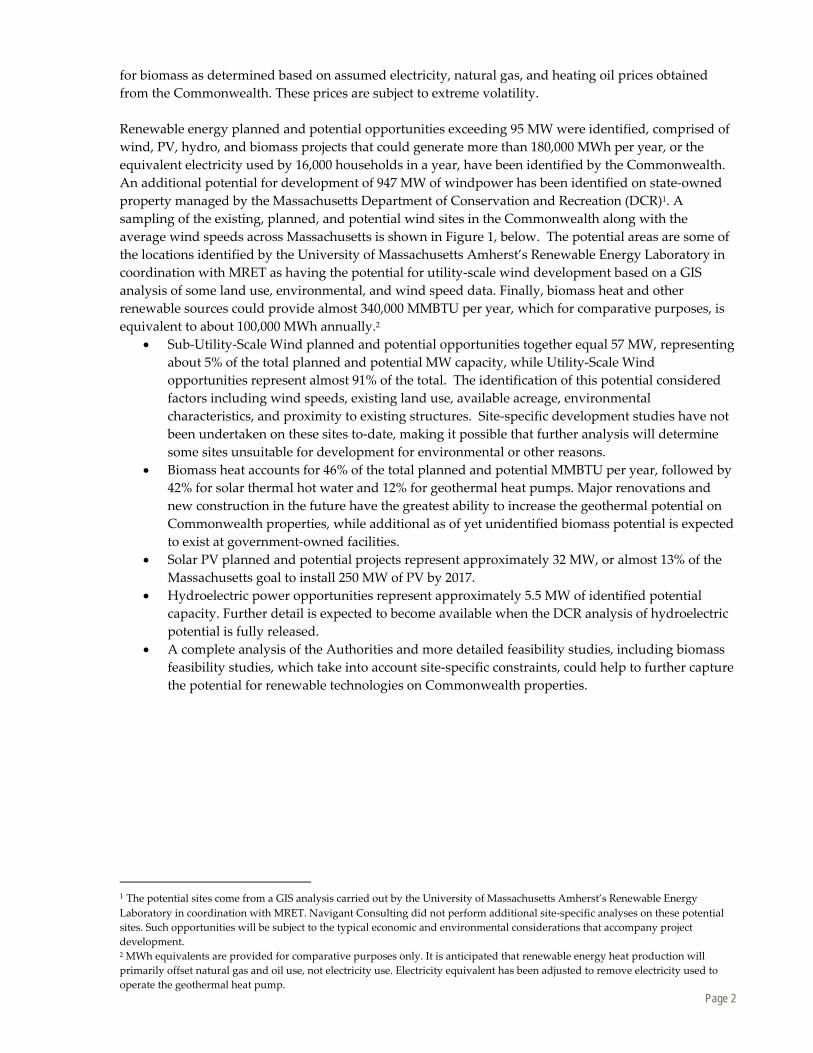
Renewable energy planned and potential opportunities exceeding 95 MW were identified, comprised of wind, PV, hydro, and biomass projects that could generate more than 180,000 MWh per year, or the equivalent electricity used by 16,000 households in a year, have been identified by the Commonwealth. An additional potential for development of 947 MW of windpower has been identified on state‐owned property managed by the Massachusetts Department of Conservation and Recreation (DCR)1. A sampling of the existing, planned, and potential wind sites in the Commonwealth along with the average wind speeds across Massachusetts is shown in Figure 1, below. The potential areas are some of the locations identified by the University of Massachusetts Amherst’s Renewable Energy Laboratory in coordination with MRET as having the potential for utility‐scale wind development based on a GIS analysis of some land use, environmental, and wind speed data. Finally, biomass heat and other renewable sources could provide almost 340,000 MMBTU per year, which for comparative purposes, is equivalent to about 100,000 MWh annually.2
• Sub‐Utility‐Scale Wind planned and potential opportunities together equal 57 MW, representing about 5% of the total planned and potential MW capacity, while Utility‐Scale Wind opportunities represent almost 91% of the total. The identification of this potential considered factors including wind speeds, existing land use, available acreage, environmental characteristics, and proximity to existing structures. Site‐specific development studies have not been undertaken on these sites to‐date, making it possible that further analysis will determine some sites unsuitable for development for environmental or other reasons.
• Biomass heat accounts for 46% of the total planned and potential MMBTU per year, followed by 42% for solar thermal hot water and 12% for geothermal heat pumps. Major renovations and new construction in the future have the greatest ability to increase the geothermal potential on Commonwealth properties, while additional as of yet unidentified biomass potential is expected to exist at government‐owned facilities.
• Solar PV planned and potential projects represent approximately 32 MW, or almost 13% of the Massachusetts goal to install 250 MW of PV by 2017.
• Hydroelectric power opportunities represent approximately 5.5 MW of identified potential capacity. Further detail is expected to become available when the DCR analysis of hydroelectric potential is fully released.
• A complete analysis of the Authorities and more detailed feasibility studies, including biomass feasibility studies, which take into account site‐specific constraints, could help to further capture the potential for renewable technologies on Commonwealth properties.
1 The potential sites come from a GIS analysis carried out by the University of Massachusetts Amherst’s Renewable Energy Laboratory in coordination with MRET. Navigant Consulting did not perform additional site‐specific analyses on these potential sites. Such opportunities will be subject to the typical economic and environmental considerations that accompany project development. 2 MWh equivalents are provided for comparative purposes only. It is anticipated that renewable energy heat production will primarily offset natural gas and oil use, not electricity use. Electricity equivalent has been adjusted to remove electricity used to operate the geothermal heat pump.
Page 2
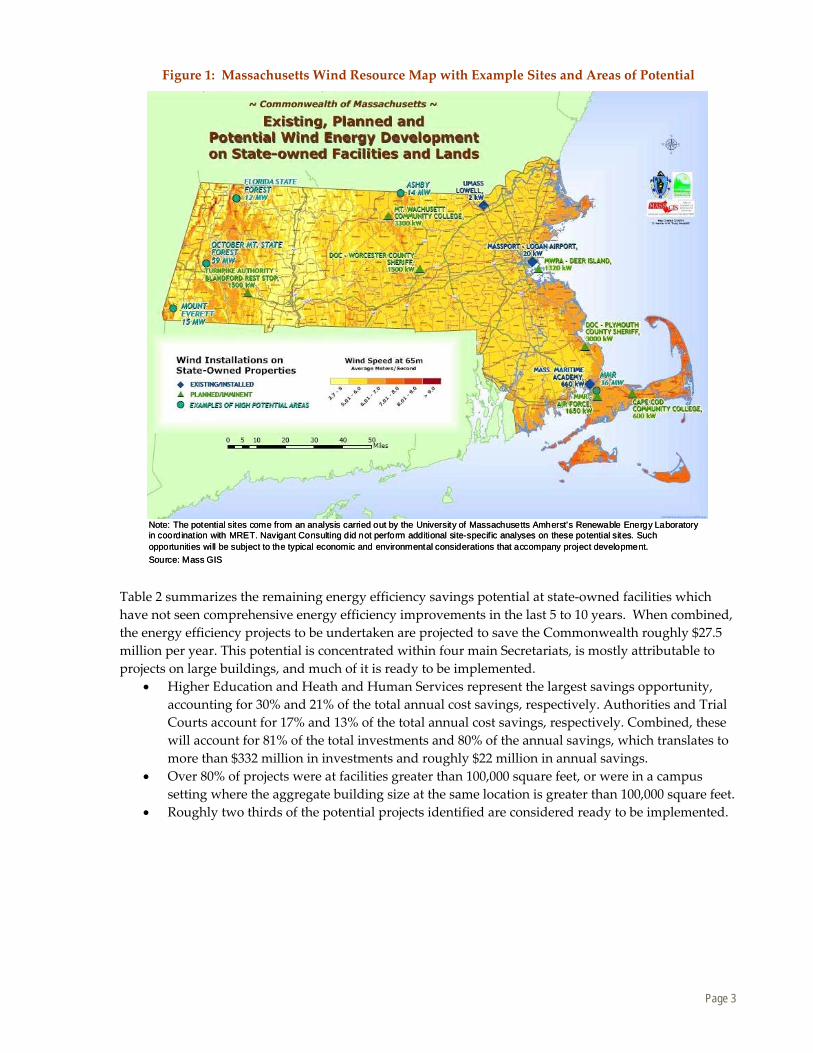
Figure 1: Massachusetts Wind Resource Map with Example Sites and Areas of Potential
Note: The potential sites come from an analysis carried out by the University of Massachusetts Amherst’s Renewable Energy LaboratoryNote: The potential sites come from an analysis carried out by the University of Massachusetts Amherst’s Renewable Energy Laboratoryin coordination with MRET. Navigant Consulting did not perform additional site-specific analyses on these potential sites. Suchin coordination with MRET. Navigant Consulting did not perform additional site-specific analyses on these potential sites. Suchopportunities will be subject to the typical economic and environmental considerations that accompany project development.opportunities will be subject to the typical economic and environmental considerations that accompany project development.Source: Mass GISSource: Mass GIS
Table 2 summarizes the remaining energy efficiency savings potential at state‐owned facilities which have not seen comprehensive energy efficiency improvements in the last 5 to 10 years. When combined, the energy efficiency projects to be undertaken are projected to save the Commonwealth roughly $27.5 million per year. This potential is concentrated within four main Secretariats, is mostly attributable to projects on large buildings, and much of it is ready to be implemented.
• Higher Education and Heath and Human Services represent the largest savings opportunity, accounting for 30% and 21% of the total annual cost savings, respectively. Authorities and Trial Courts account for 17% and 13% of the total annual cost savings, respectively. Combined, these will account for 81% of the total investments and 80% of the annual savings, which translates to more than $332 million in investments and roughly $22 million in annual savings.
• Over 80% of projects were at facilities greater than 100,000 square feet, or were in a campus setting where the aggregate building size at the same location is greater than 100,000 square feet.
• Roughly two thirds of the potential projects identified are considered ready to be implemented.
Page 3

Table 1: Existing, Planned, and Potential Renewable Energy Development on State‐Owned Facilities and Lands1
Renewable Energy ‐ Existing Technology MW
Annual MWh
Annual MMBtu
Equivalent Savings ($)2
Wind Power – Sub‐Utility‐Scale3 0.68 1,100 N/A $165,000
Wind Power – Utility Scale3 ‐ ‐ N/A ‐Solar Photovoltaic 0.29 327 N/A $49,050
Hydroelectric 7.9 22,200 N/A $3,330,000
Solar Thermal Hot Water N/A N/A 15.4 $185
Biomass 3.55 26,368 15,608 $4,222,766
Geothermal Heat Pumps N/A N/A 303 $3,645
TOTAL EXISTING 12.4 49,995 15,926 $7,770,645
Renewable Energy ‐ Planned Technology MW Annual
MWh Annual MMBtu
Equivalent Savings ($)
Wind Power – Sub‐Utility‐Scale3 15 27,400 N/A $4,110,000
Wind Power – Utility Scale3 ‐ ‐ N/A ‐Solar Photovoltaic 1 1,135 N/A $170,250
Hydroelectric ‐ ‐ N/A ‐Solar Thermal Hot Water N/A N/A 1,785 $21,470
Biomass 2.6 19,583 147,861 $5,472,210
Geothermal Heat Pumps N/A N/A 14,773 $177,693
TOTAL PLANNED 19 48,118 164,419 $9,951,623
Renewable Energy ‐ Potential Technology MW Annual
MWh Annual MMBtu
Equivalent Savings ($)
Wind Power – Sub‐Utility‐Scale3 42 78,000 N/A $11,700,000
Other Windpower Potential – Utility Scale3,5 947 2,200,000 N/A $330,000,000
Solar Photovoltaic 30.95 34,899 N/A $5,234,850
Hydroelectric 5.5 19,216 N/A $2,882,400
Solar Thermal Hot Water N/A N/A 141,857 $1,706,286
Biomass ‐ ‐ 6,770 $116,057
Geothermal Heat Pumps N/A N/A 26,636 $320,384
TOTAL POTENTIAL 1,025 2,332,115 175,263 $351,959,977
1. “Existing” includes installed and operational projects on state‐owned properties/facilities. “Planned” includes projects on state‐owned properties/facilities which have undergone site‐specific feasibility studies and have received approval and/or funding. However, unlike the other renewable technologies, solar thermal hot water projects in the Planned category have only undergone feasibility studies. “Potential” includes projects on state‐owned properties/facilities with potential for future installations but which have not undergone feasibility studies or received approval and/or funding.
2. Equivalent Savings represents the value of offset electricity savings for wind, solar, and hydro, the value of offset natural gas for solar thermal hot water and geothermal heat pumps, and the value of offset oil for biomass as determined based on assumed electricity, natural gas, and heating oil prices obtained from the Commonwealth. These prices are subject to extreme volatility.
3. For this analysis, sub‐utility‐scale projects refer to those projects using less than 5 turbines and/or turbines less than 1.5 MW in nameplate capacity. Utility‐Scale projects refer to those projects equal to or greater than 5 turbines and a minimum 1.5 MW nameplate turbine capacity.
5. Identified by the Commonwealthʹs Office of Geographic and Environmental Information (MassGIS) as potentially suitable for wind development based on geographic information system (GIS) analyses. These analyses considered factors including wind speeds, existing land use, available acreage, environmental characteristics, and proximity to existing structures. However, site‐specific development studies have not been undertaken on these sites to‐date, making it possible that further analysis will determine some sites unsuitable for development for other reasons (e.g., a site‐specific analysis might determine that the terrain of a particular site might make development too expensive).
Page 4
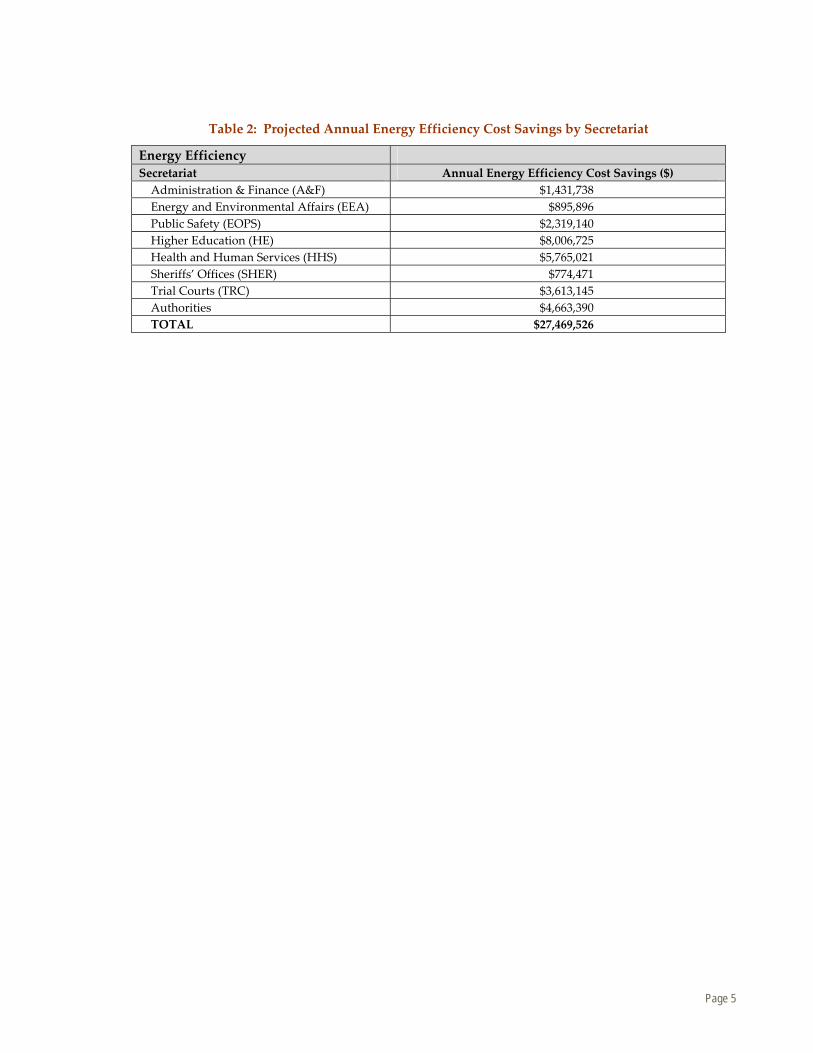
Table 2: Projected Annual Energy Efficiency Cost Savings by Secretariat
Energy Efficiency Secretariat Annual Energy Efficiency Cost Savings ($) Administration & Finance (A&F) $1,431,738
Energy and Environmental Affairs (EEA) $895,896
Public Safety (EOPS) $2,319,140
Higher Education (HE) $8,006,725
Health and Human Services (HHS) $5,765,021
Sheriffs’ Offices (SHER) $774,471
Trial Courts (TRC) $3,613,145
Authorities $4,663,390
TOTAL $27,469,526
Page 5
Introduction
Scope of the Effort This report was prepared for the Massachusetts Executive Office of Energy and Environmental Affairs (EOEEA) and the Massachusetts Clean Energy Center. It offers a high‐level assessment of the potential for renewable energy development and energy efficiency improvement on property owned by the Commonwealth. In doing so, this document provides the clean energy sector investigations mandated under the Massachusetts Green Jobs Act of 2008. The primary source of information used to assemble the report is data collected from various state agencies by the Commonwealth. No additional primary research or engineering site feasibility assessments were undertaken as part of this report.
The focus of this effort is on state‐owned properties managed by DCAM. Where information on facilities owned by Authorities was available, that information was also included. However, this does not represent all potential on Authority properties.
The analysis identifies Existing, Planned, and Potential renewable energy installations. • The Existing category includes projects which are currently installed and operational on state‐
owned properties and facilities. • The Planned category includes projects on state‐owned properties and facilities which have
undergone site‐specific feasibility studies and have received approval and/or funding. However, unlike the other renewable technologies examined, solar thermal hot water projects in the Planned category have only undergone feasibility studies, but have not yet received approval and/or funding.
• The Potential category includes projects on state‐owned properties and facilities which have been identified as having the potential for future installations but which have not undergone feasibility studies or received approval and/or funding.
The data available for this analysis varied in level of detail. A combination of data with high levels of detail, including some site specific data, and data with low levels of detail were available. While not representative of comprehensive engineering and feasibility studies throughout all Commonwealth properties, the information in this report represents a best estimate within each technology category. It is important to note that some of the planned and potential projects listed may not come to fruition, while others not identified may be realized.
Renewable Energy Potential
Planned and potential renewable energy development is presented for state‐owned properties and facilities. Renewable energy considered include wind, solar photovoltaic (PV), hydroelectric, solar thermal hot water, biomass, and geothermal heat pumps. Current installed renewable technology capacity on Commonwealth property for each technology is also provided.
Energy Efficiency Potential
Energy efficiency potential is presented for state‐owned properties which have not seen comprehensive energy efficiency improvements in the last 5 to 10 years. Potential energy efficiency projects were identified at facilities managed by DCAM, which fall under the Commonwealth Secretariats, and at the Massachusetts Authority facilities, which include the Massachusetts Bay Transit Authority (MBTA), Massachusetts Port Authority (Massport), and Massachusetts Water Resources Authority (MWRA).
Page 6

Context and Accomplishments to Date
Context
The Massachusetts Green Jobs Act of 2008 authorizes and requires a study to examine the clean energy sector in the Commonwealth. This report fulfills the request for information regarding energy efficiency and renewable energy opportunities on state‐owned property, providing potential in terms of MW, MWh, MMBTU/yr, and cost savings where appropriate.
Accomplishments
Successful efforts to advance renewable energy installations and energy efficiency projects on state‐owned properties and facilities have already been undertaken. These have resulted in increased renewable energy installations, energy efficiency savings, and forward‐looking goals and programs.
More than 12 MW of renewable energy have already been installed on government‐owned facilities and properties. Of that total, hydroelectric comprises 7.9 MW, biomass electricity generation comprises 3.55 MW, and the balance is comprised of wind and solar PV. Biomass heat, geothermal heat pumps, and solar thermal water heating installations provide over 15,900 MMBTU per year of heat transfer, which is equivalent to about 4,700 MWh per year,1 with the bulk of this total coming from biomass heat. For comparative purposes, 11 MWh are equal to the average annual electricity use per household,2 and 1 MWh is equal to 3.413 MMBTU.
The energy efficiency of state‐owned facilities has significantly improved in the past 25 years. Over $200 million has been invested in energy efficiency projects at Commonwealth facilities managed by DCAM, yielding annual savings totaling over $27 million. The various Massachusetts Authorities have also been active and have achieved comparable results.
In 2007, Governor Deval Patrick established targets for Commonwealth agencies through Executive Order No. 484 which include emissions reductions, energy consumption reductions, renewable energy targets, bioheat use, potable water use reductions, and green building standards.
EOEEA has achieved additional accomplishments during 2008 and 2009. These include working with legislative leaders to pass legislation that has made Massachusetts a leader in clean energy innovation and in addressing climate change: the Green Communities Act, Clean Energy Biofuels Act, Green Jobs Act, Global Warming Solutions Act, and Oceans Act. In addition, the Commonwealth Solar Rebate Program was launched in 2008. It has since provided support to more than 400 installations for capacity of over 4 MW in solar power. EOEEA also convened a Zero Net Energy Buildings Task Force charged with developing guidelines for super‐efficient buildings, and issued the Governor’s Clean Energy Challenge, a challenge to businesses to reduce their greenhouse gas emissions by 10 percent over the next three years.
Finally, in 2009, Governor Patrick set a goal of 2,000 MW of installed wind power by 2020, citing new mandates that require greater use of renewable energy and sharp reductions in greenhouse gas emissions, and economic opportunity for Massachusetts to become a hub of wind‐energy engineering.
1 MWh equivalents are provided for comparative purposes only. It is anticipated that renewable energy heat production willprimarily offset natural gas and oil use, not electricity use. Electricity equivalent has been adjusted to remove electricity used tooperate the geothermal heat pump.2 Energy Information Administration. Data representative of U.S. average for 2007.
Page 7
Current Activities In addition to past accomplishments, several current efforts in this area are underway, including those spearheaded by the Leading by Example Program (LBE). Established in April 2007 by Governor Deval Patrick’s Executive Order No. 484, LBE is charged with ensuring the implementation of Executive Order 484. The program provides leadership, technical assistance, and funding opportunities to reduce the overall environmental impact of government operations, with an emphasis on climate and energy impacts. Various LBE initiatives are moving energy efficiency and renewable energy forward, including setting energy performance benchmarks for Commonwealth agencies and working with Commonwealth agencies and public higher education campuses to improve energy efficiency, reduce greenhouse gas emissions, and install renewable energy technologies for on‐site generation. The program is overseen by EOEEA and the Executive Office for Administration and Finance (EOAF).
In addition to EOEEA’s accomplishments, many of which are ongoing, EOEEA has set a goal of making all new malls and “big box” retail stores energy efficient and powered in part by solar energy by 2010, and began dialogue with development community to identify the technical assistance, financing support, and regulatory standards necessary to achieve this goal. They have also begun a process to “stretch” the building code for energy efficiency. This change would be available as a local option for municipalities that want to set building standards 20 to 30 percent higher than the current Massachusetts building code in energy efficiency.
Page 8

Renewable Energy Analysis
Windpower Windpower represents the largest potential renewable energy resource on Commonwealth property. The grounds of various Commonwealth facilities are potential sites for smaller‐scale wind installations, while some large tracts of Commonwealth‐owned land on ridgelines and near the coast offer the possibility of utility‐scale windpower generation. The distribution of these sites across Massachusetts is driven by the wind resource, which primarily consists of Class 2 to 4 winds. The best winds, which are represented by the darkest colors in Figure 2 below, are concentrated along the coastline in the east and ridgelines in the western and north‐central portions of the Commonwealth.
To date, the development of windpower on Commonwealth property has been limited, but a number of sites with potential have been identified. A sampling of the existing, planned, and potential wind sites on Commonwealth‐owned lands along with the average wind speeds are shown in Figure 2. The potential areas are some of the locations identified by the University of Massachusetts Amherst’s Renewable Energy Laboratory in coordination with MRET as having the potential for utility‐scale wind development based on a GIS analysis of some land use, environmental, and wind speed data.
Figure 2: Massachusetts Wind Resource Map with Example Sites and Areas of Potential
Note: The potential sites come from an analysis carried out by the University of Massachusetts Amherst’s Renewable Energy LaboratoryNote: The potential sites come from an analysis carried out by the University of Massachusetts Amherst’s Renewable Energy Laboratoryin coordination with MRET. Navigant Consulting did not perform additional site-specific analyses on these potential sites. Suchin coordination with MRET. Navigant Consulting did not perform additional site-specific analyses on these potential sites. Suchopportunities will be subject to the typical economic and environmental considerations that accompany project development.opportunities will be subject to the typical economic and environmental considerations that accompany project development.Source: Mass GISSource: Mass GIS
The assessment of existing, planned and potential wind generation included a review of development on properties owned by the Commonwealth, including Authority properties and Article 97 conservation lands. The discussion below separates wind projects into two categories: utility‐scale projects, which are
Page 9
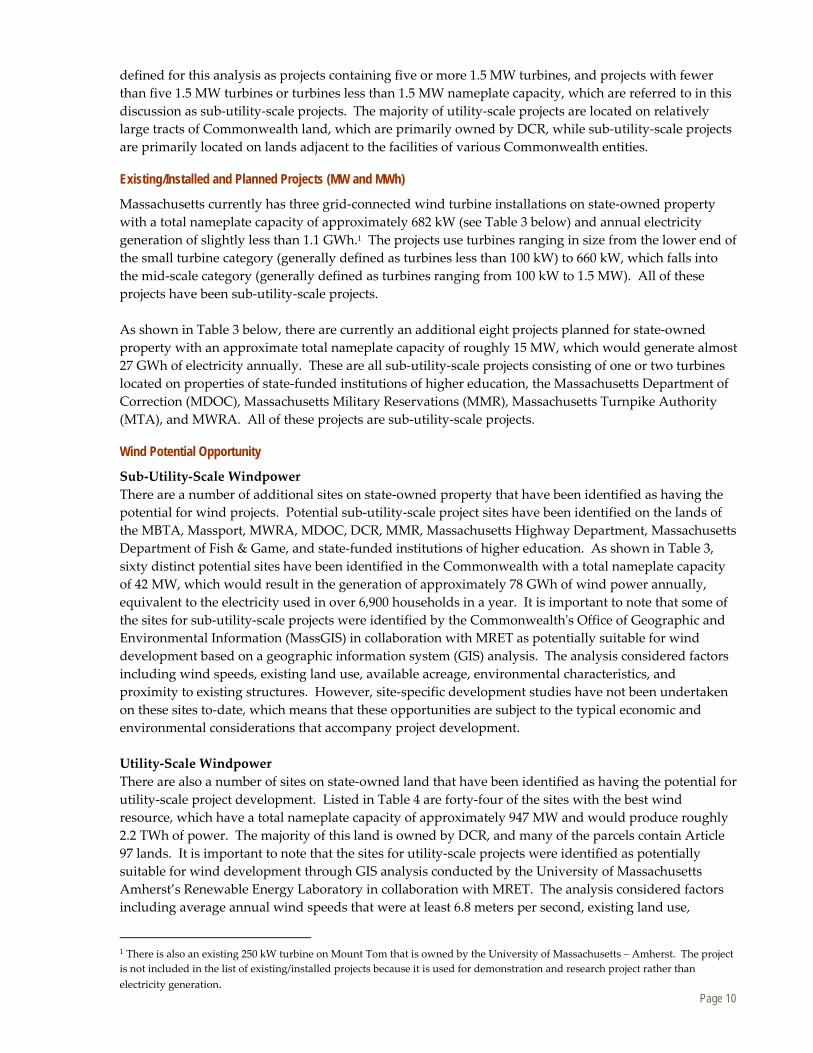
defined for this analysis as projects containing five or more 1.5 MW turbines, and projects with fewer than five 1.5 MW turbines or turbines less than 1.5 MW nameplate capacity, which are referred to in this discussion as sub‐utility‐scale projects. The majority of utility‐scale projects are located on relatively large tracts of Commonwealth land, which are primarily owned by DCR, while sub‐utility‐scale projects are primarily located on lands adjacent to the facilities of various Commonwealth entities.
Existing/Installed and Planned Projects (MW and MWh)
Massachusetts currently has three grid‐connected wind turbine installations on state‐owned property with a total nameplate capacity of approximately 682 kW (see Table 3 below) and annual electricity generation of slightly less than 1.1 GWh.1 The projects use turbines ranging in size from the lower end of the small turbine category (generally defined as turbines less than 100 kW) to 660 kW, which falls into the mid‐scale category (generally defined as turbines ranging from 100 kW to 1.5 MW). All of these projects have been sub‐utility‐scale projects.
As shown in Table 3 below, there are currently an additional eight projects planned for state‐owned property with an approximate total nameplate capacity of roughly 15 MW, which would generate almost 27 GWh of electricity annually. These are all sub‐utility‐scale projects consisting of one or two turbines located on properties of state‐funded institutions of higher education, the Massachusetts Department of Correction (MDOC), Massachusetts Military Reservations (MMR), Massachusetts Turnpike Authority (MTA), and MWRA. All of these projects are sub‐utility‐scale projects.
Wind Potential Opportunity
Sub‐Utility‐Scale Windpower There are a number of additional sites on state‐owned property that have been identified as having the potential for wind projects. Potential sub‐utility‐scale project sites have been identified on the lands of the MBTA, Massport, MWRA, MDOC, DCR, MMR, Massachusetts Highway Department, Massachusetts Department of Fish & Game, and state‐funded institutions of higher education. As shown in Table 3, sixty distinct potential sites have been identified in the Commonwealth with a total nameplate capacity of 42 MW, which would result in the generation of approximately 78 GWh of wind power annually, equivalent to the electricity used in over 6,900 households in a year. It is important to note that some of the sites for sub‐utility‐scale projects were identified by the Commonwealthʹs Office of Geographic and Environmental Information (MassGIS) in collaboration with MRET as potentially suitable for wind development based on a geographic information system (GIS) analysis. The analysis considered factors including wind speeds, existing land use, available acreage, environmental characteristics, and proximity to existing structures. However, site‐specific development studies have not been undertaken on these sites to‐date, which means that these opportunities are subject to the typical economic and environmental considerations that accompany project development.
Utility‐Scale Windpower There are also a number of sites on state‐owned land that have been identified as having the potential for utility‐scale project development. Listed in Table 4 are forty‐four of the sites with the best wind resource, which have a total nameplate capacity of approximately 947 MW and would produce roughly 2.2 TWh of power. The majority of this land is owned by DCR, and many of the parcels contain Article 97 lands. It is important to note that the sites for utility‐scale projects were identified as potentially suitable for wind development through GIS analysis conducted by the University of Massachusetts Amherst’s Renewable Energy Laboratory in collaboration with MRET. The analysis considered factors including average annual wind speeds that were at least 6.8 meters per second, existing land use,
1 There is also an existing 250 kW turbine on Mount Tom that is owned by the University of Massachusetts – Amherst. The project is not included in the list of existing/installed projects because it is used for demonstration and research project rather than
electricity generation. Page 10
available acreage to accommodate at least five wind turbines, environmental characteristics, and proximity to existing structures. However, site‐specific development studies have not been undertaken on these sites to‐date, which means that these opportunities are subject to the typical economic and environmental considerations that accompany project development. If wind development proves economically feasible at 6.0 m/s wind speeds, then additional potential wind development sites will become available.
Offshore wind over Commonwealth waters (i.e., waters within three nautical miles of the Massachusetts coastline) constitutes a possible additional wind resource on state lands. However, no comprehensive analysis of such potential has been completed to date (such an assessment will completed as part of the development of the Commonwealth’s Ocean Management Plan) and assessing the offshore wind potential in these waters was beyond the scope of this analysis.
Page 11
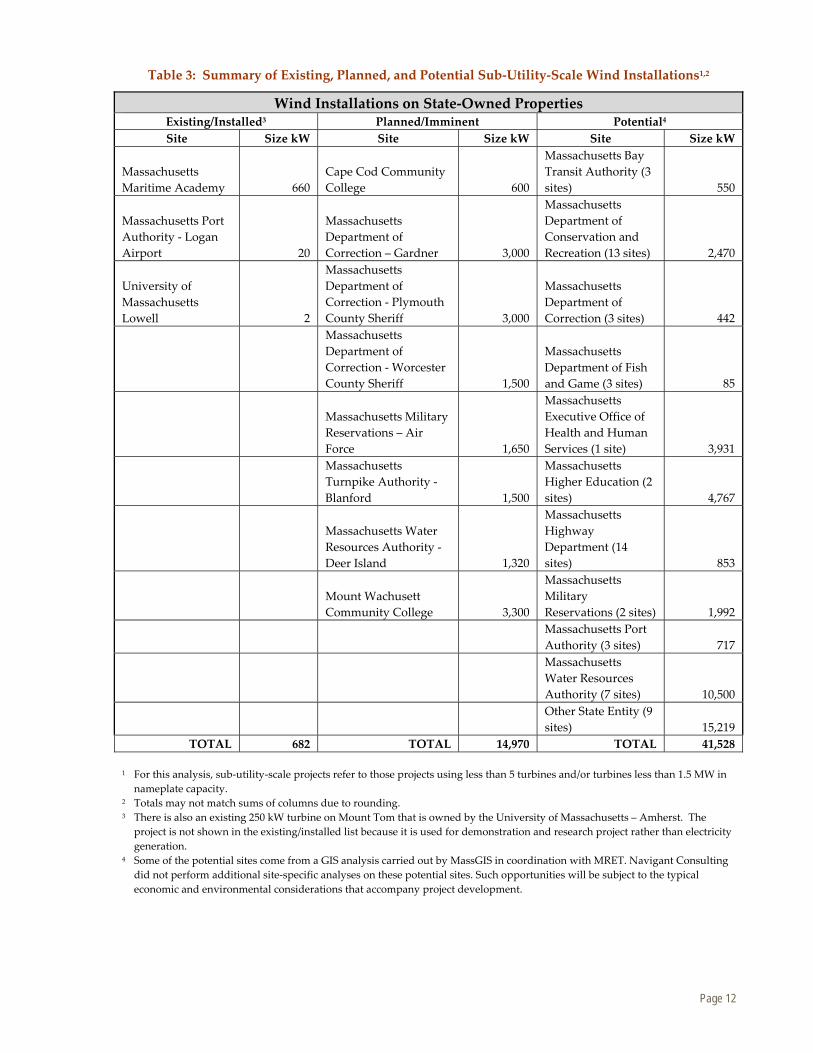
Table 3: Summary of Existing, Planned, and Potential Sub‐Utility‐Scale Wind Installations1,2
Wind Installations on State‐Owned Properties Existing/Installed3 Planned/Imminent Potential4 Site Size kW Site Size kW Site Size kW
Massachusetts Maritime Academy 660
Cape Cod Community College 600
Massachusetts Bay Transit Authority (3 sites) 550
Massachusetts Port Authority ‐ Logan Airport 20
Massachusetts Department of Correction – Gardner 3,000
Massachusetts Department of Conservation and Recreation (13 sites) 2,470
University of Massachusetts Lowell 2
Massachusetts Department of Correction ‐ Plymouth County Sheriff 3,000
Massachusetts Department of Correction (3 sites) 442
Massachusetts Department of Correction ‐Worcester County Sheriff 1,500
Massachusetts Department of Fish and Game (3 sites) 85
Massachusetts Military Reservations – Air Force 1,650
Massachusetts Executive Office of Health and Human Services (1 site) 3,931
Massachusetts Turnpike Authority ‐Blanford 1,500
Massachusetts Higher Education (2 sites) 4,767
Massachusetts Water Resources Authority ‐Deer Island 1,320
Massachusetts Highway Department (14 sites) 853
Mount Wachusett Community College 3,300
Massachusetts Military Reservations (2 sites) 1,992
Massachusetts Port Authority (3 sites) 717
Massachusetts Water Resources Authority (7 sites) 10,500
Other State Entity (9 sites) 15,219
TOTAL 682 TOTAL 14,970 TOTAL 41,528
1 For this analysis, sub‐utility‐scale projects refer to those projects using less than 5 turbines and/or turbines less than 1.5 MW in nameplate capacity.
2 Totals may not match sums of columns due to rounding. 3 There is also an existing 250 kW turbine on Mount Tom that is owned by the University of Massachusetts – Amherst. The
project is not shown in the existing/installed list because it is used for demonstration and research project rather than electricity generation.
4 Some of the potential sites come from a GIS analysis carried out by MassGIS in coordination with MRET. Navigant Consulting did not perform additional site‐specific analyses on these potential sites. Such opportunities will be subject to the typical economic and environmental considerations that accompany project development.
Page 12
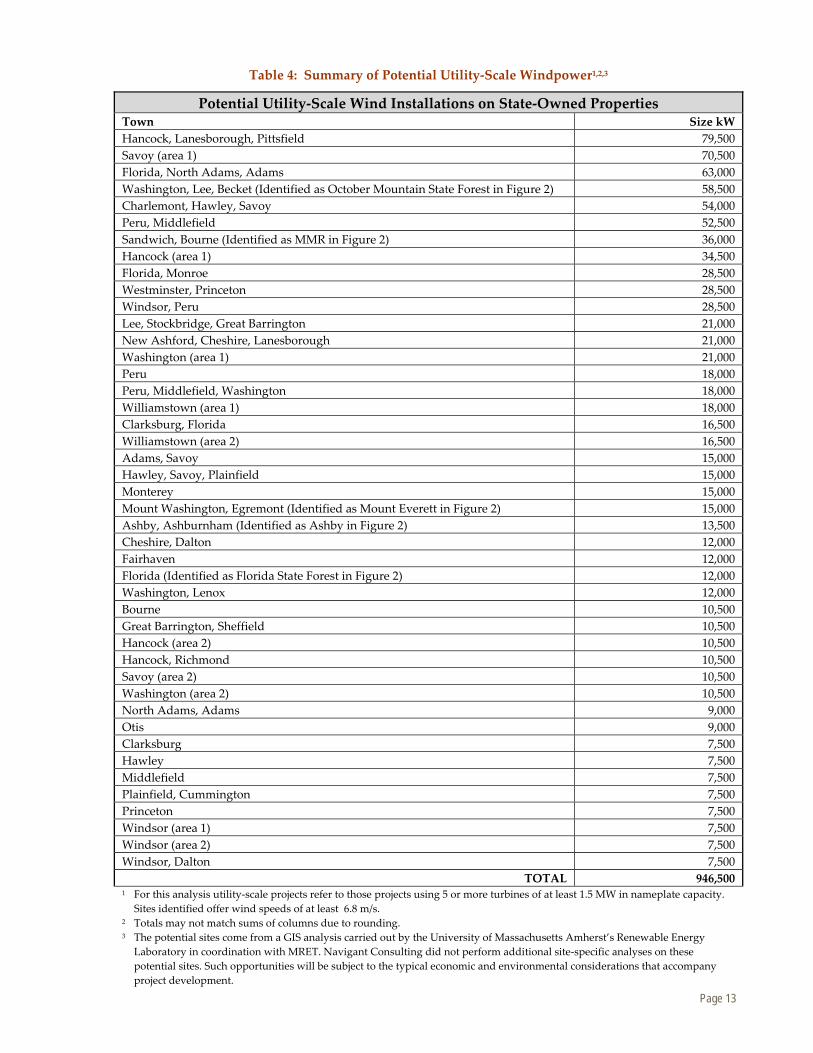
Table 4: Summary of Potential Utility‐Scale Windpower1,2,3
Potential Utility‐Scale Wind Installations on State‐Owned Properties Town Size kW
Hancock, Lanesborough, Pittsfield 79,500
Savoy (area 1) 70,500
Florida, North Adams, Adams 63,000
Washington, Lee, Becket (Identified as October Mountain State Forest in Figure 2) 58,500
Charlemont, Hawley, Savoy 54,000
Peru, Middlefield 52,500
Sandwich, Bourne (Identified as MMR in Figure 2) 36,000
Hancock (area 1) 34,500
Florida, Monroe 28,500
Westminster, Princeton 28,500
Windsor, Peru 28,500
Lee, Stockbridge, Great Barrington 21,000
New Ashford, Cheshire, Lanesborough 21,000
Washington (area 1) 21,000
Peru 18,000
Peru, Middlefield, Washington 18,000
Williamstown (area 1) 18,000
Clarksburg, Florida 16,500
Williamstown (area 2) 16,500
Adams, Savoy 15,000
Hawley, Savoy, Plainfield 15,000
Monterey 15,000
Mount Washington, Egremont (Identified as Mount Everett in Figure 2) 15,000
Ashby, Ashburnham (Identified as Ashby in Figure 2) 13,500
Cheshire, Dalton 12,000
Fairhaven 12,000
Florida (Identified as Florida State Forest in Figure 2) 12,000
Washington, Lenox 12,000
Bourne 10,500
Great Barrington, Sheffield 10,500
Hancock (area 2) 10,500
Hancock, Richmond 10,500
Savoy (area 2) 10,500
Washington (area 2) 10,500
North Adams, Adams 9,000
Otis 9,000
Clarksburg 7,500
Hawley 7,500
Middlefield 7,500
Plainfield, Cummington 7,500
Princeton 7,500
Windsor (area 1) 7,500
Windsor (area 2) 7,500
Windsor, Dalton 7,500 TOTAL 946,500
1 For this analysis utility‐scale projects refer to those projects using 5 or more turbines of at least 1.5 MW in nameplate capacity. Sites identified offer wind speeds of at least 6.8 m/s.
2 Totals may not match sums of columns due to rounding. 3 The potential sites come from a GIS analysis carried out by the University of Massachusetts Amherst’s Renewable Energy
Laboratory in coordination with MRET. Navigant Consulting did not perform additional site‐specific analyses on these potential sites. Such opportunities will be subject to the typical economic and environmental considerations that accompany project development.
Page 13

Methodology, Data Sources, and Assumptions
The nameplate capacities of current and planned projects as well as areas of additional potential were provided by the Commonwealth. In the case of the potential utility‐scale sites, the sites included in this report were limited to sites with Class 3 and above winds as those winds are typically the minimum required for economically viable utility‐scale development. For a limited subset of potential sites, the Commonwealth provided estimates of the available land area rather than capacities. For those sites, Navigant Consulting estimated the capacities using a wind farm density factor of 5 megawatts/square kilometer, which is based on the 20 Percent Wind Energy Penetration in the United States: A Technical Analysis of the Energy Resource, prepared by Black and Veatch for the American Wind Energy Association in October of 2007.
In some instances, the capacity data provided by the Commonwealth for a project was accompanied by a corresponding estimate of annual electricity generation for the wind facilities. For the remaining projects, annual generation was estimated using an assumed capacity factor. A 27% capacity factor was assumed for utility‐scale potential sites for which available wind data indicated that wind speeds over these lands were of at least 6.8 m/sec at a hub height of 65 meters (these wind speeds fall approximately within the Class 3 category and above). For the smaller projects, a 21% capacity factor was used, which represents an average cross‐wind‐class capacity factor for projects in Massachusetts. The cross‐wind‐class factor was used because of data limitations regarding wind regimes for these smaller projects. The capacity factors were developed from National Renewable Energy Laboratory data for New England projects found in the Annual Report on U.S. Wind Power Installation, Cost, and Performance Trends: 2007, which was printed in May 2008, as well as interviews with community wind developers and regulators in Massachusetts.
It should be noted that, aside from the data provided by the Commonwealth, no additional primary research or site‐specific engineering feasibility assessments were performed for any of the identified wind sites as part of this assessment.
Conclusions
Massachusetts has past experience with wind projects that it can leverage to substantially increase wind power generation given the significant amount of untapped wind resource available on Commonwealth property. Projects that are currently planned will result in a 23‐fold increase in wind installed capacity on Commonwealth property. If all the sub‐utility‐scale sites that have been identified as planned and potential projects are built, the total nameplate capacity on Commonwealth property would rise to 57 MW, which would translate to approximately 106 GWh of generation. The additional development of projects at all the utility‐scale potential sites would bring the grand total to 1.0 GW of nameplate capacity on Commonwealth property, which would produce approximately 2.3 TWh of generation.
Figures 3 and 4 below provide a breakdown of the existing, planned, and potential sub‐utility‐scale and utility‐scale project capacities on Commonwealth property.
Page 14
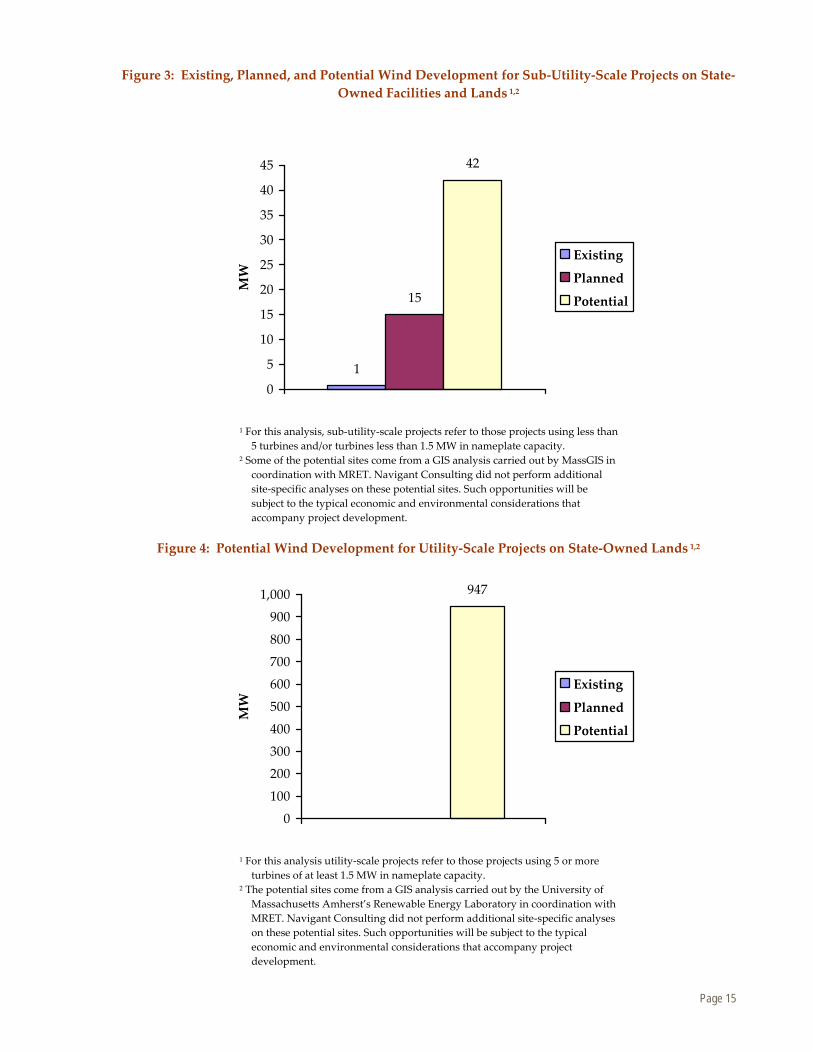
Figure 3: Existing, Planned, and Potential Wind Development for Sub‐Utility‐Scale Projects on State‐Owned Facilities and Lands 1,2
1
15
42
0
5
10
15
20
25
30
35
40
45
MW
Existing
Planned
Potential
1 For this analysis, sub‐utility‐scale projects refer to those projects using less than 5 turbines and/or turbines less than 1.5 MW in nameplate capacity.
2 Some of the potential sites come from a GIS analysis carried out by MassGIS in coordination with MRET. Navigant Consulting did not perform additional site‐specific analyses on these potential sites. Such opportunities will be subject to the typical economic and environmental considerations that accompany project development.
Figure 4: Potential Wind Development for Utility‐Scale Projects on State‐Owned Lands 1,2
947
0
100
200
300
400
500
600
700
800
900
1,000
MW
Existing
Planned
Potential
1 For this analysis utility‐scale projects refer to those projects using 5 or more turbines of at least 1.5 MW in nameplate capacity.
2 The potential sites come from a GIS analysis carried out by the University of Massachusetts Amherst’s Renewable Energy Laboratory in coordination with MRET. Navigant Consulting did not perform additional site‐specific analyses on these potential sites. Such opportunities will be subject to the typical economic and environmental considerations that accompany project development.
Page 15
Photovoltaics Massachusetts has sufficient insolation for photovoltaic generation, exceeding the solar resources of Germany, one of the world’s leading markets. In fact, Germany’s southernmost metropolis is farther north than Bangor, Maine. Insolation is defined as the sun’s energy, given in kilowatt‐hours per square meter per day (kWh/m2/day), incident on a region over a calendar year. The Commonwealth has an annual average of approximately 4 kWh/m2/day.
The assessment of existing, planned and potential solar photovoltaic included a review of installations on state‐owned buildings and properties as well as installations at Authority properties. However, this does not represent all potential on Authority properties. An assessment of all Authority property potential has yet to be completed. The potential assessment looked primarily at rooftops of existing or proposed buildings, along with a number of larger field installations.
Existing/Installed and Planned Projects (kW and MWh)
The Commonwealth has considerable solar PV experience, with 290 kW installed on state‐owned properties alone. The two largest installations are at Deer Island and the Massachusetts Maritime Academy, with nameplate capacities of 100 kW and 81 kW, respectively. There are also a number of smaller installations at higher education facilities, including University of Massachusetts, Cape Cod Community College, Mount Wachusett Community College, and the Massachusetts College of Liberal Arts. Remaining installations are on DCR properties and Department of Correction (DOC) facilities. These installations generate approximately 327 MWh per year, or the equivalent annual electricity used by 29 households1. Table 5, below, provides a summary of these existing projects, as well as planned and potential projects, on state‐owned properties.
In addition to the existing solar facilities, there are approximately 1,000 kW of solar installations that are planned, Table 5. These installations are larger in size, approximately 60 kW to 100 kW each, and expand solar power penetration primarily in higher education facilities and Department of Correction facilities. The DOC facilities in Norfolk, Bridgewater, Concord, Cedar Junction and Middlesex will receive a cumulative total of 350 kW. Additional projects include 89 kW for Salem State College, 60 kW for North Shore Community College and 82 kW for Springfield Technical Community College. The planned installations would generate over 1.1 GWh per year, or the equivalent annual electricity used by 100 households. A summary of existing, planned and potential installations in terms of kW is listed in Table 5 below.
PV Potential Opportunity
Based on data provided by the Commonwealth, the potential for additional installations on state‐owned properties is an estimated 30,952 kW, representing an increase of over 100 times the existing installed capacity, and generating over 34 GWh per year, or the equivalent annual electricity use of over 3,100 households. Table 5, below, provides a summary of the potential capacity in kW. Of this total, nearly half, 15,000 kW, has the potential to be installed on state‐owned building rooftops. The remaining PV potential has the potential to be installed on various Authority properties such as water pumping stations, parking garages and convention centers. However, this does not represent all PV potential on Authority properties as an assessment of all Authority property potential has yet to be completed.
1 For comparative purposes, the average U.S. household in 2007 used 11 MWh per year. Average use based on Energy Information Administration monthly average US household electricity use for 2007.
Page 16
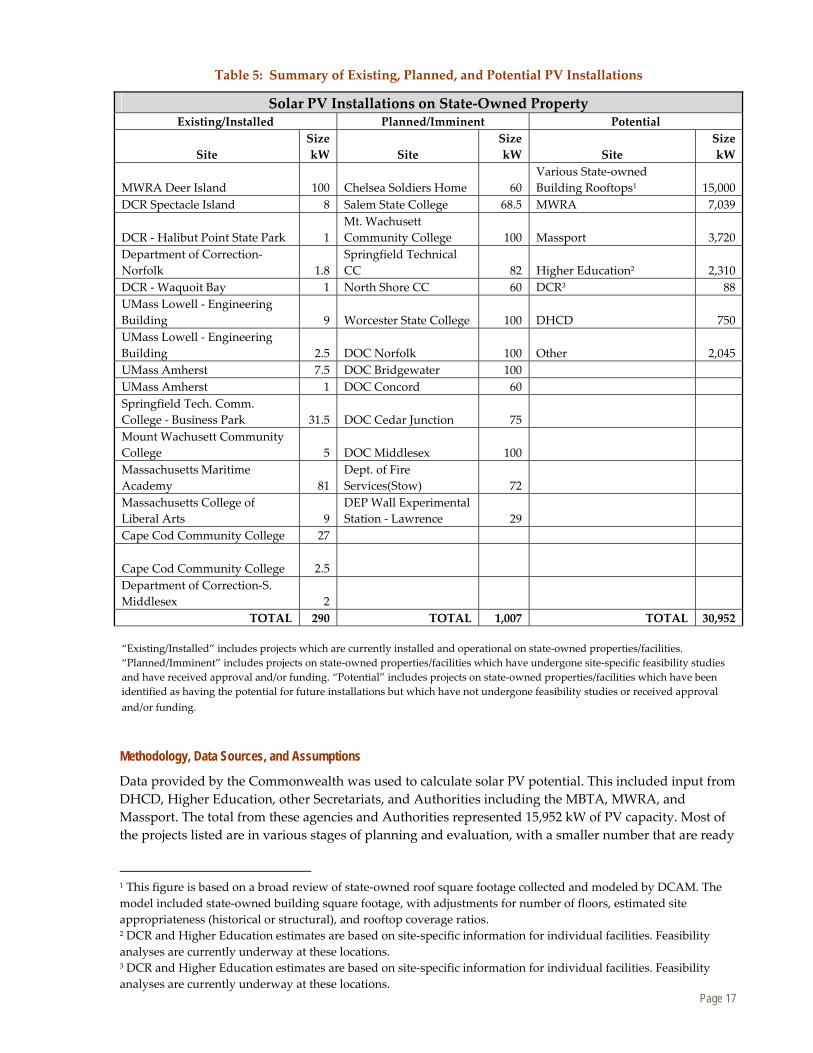
Table 5: Summary of Existing, Planned, and Potential PV Installations
Solar PV Installations on State‐Owned Property Existing/Installed Planned/Imminent Potential
Site Size kW Site
Size kW Site
Size kW
MWRA Deer Island 100 Chelsea Soldiers Home 60 Various State‐owned Building Rooftops1 15,000
DCR Spectacle Island 8 Salem State College 68.5 MWRA 7,039
DCR ‐ Halibut Point State Park 1 Mt. Wachusett Community College 100 Massport 3,720
Department of Correction‐Norfolk 1.8
Springfield Technical CC 82 Higher Education2 2,310
DCR ‐Waquoit Bay 1 North Shore CC 60 DCR3 88
UMass Lowell ‐ Engineering Building 9 Worcester State College 100 DHCD 750
UMass Lowell ‐ Engineering Building 2.5 DOC Norfolk 100 Other 2,045
UMass Amherst 7.5 DOC Bridgewater 100
UMass Amherst 1 DOC Concord 60
Springfield Tech. Comm. College ‐ Business Park 31.5 DOC Cedar Junction 75
Mount Wachusett Community College 5 DOC Middlesex 100
Massachusetts Maritime Academy 81
Dept. of Fire Services(Stow) 72
Massachusetts College of Liberal Arts 9
DEP Wall Experimental Station ‐ Lawrence 29
Cape Cod Community College 27
Cape Cod Community College 2.5
Department of Correction‐S. Middlesex 2
TOTAL 290 TOTAL 1,007 TOTAL 30,952
“Existing/Installed” includes projects which are currently installed and operational on state‐owned properties/facilities. “Planned/Imminent” includes projects on state‐owned properties/facilities which have undergone site‐specific feasibility studies and have received approval and/or funding. “Potential” includes projects on state‐owned properties/facilities which have been identified as having the potential for future installations but which have not undergone feasibility studies or received approval and/or funding.
Methodology, Data Sources, and Assumptions
Data provided by the Commonwealth was used to calculate solar PV potential. This included input from DHCD, Higher Education, other Secretariats, and Authorities including the MBTA, MWRA, and Massport. The total from these agencies and Authorities represented 15,952 kW of PV capacity. Most of the projects listed are in various stages of planning and evaluation, with a smaller number that are ready
1 This figure is based on a broad review of state‐owned roof square footage collected and modeled by DCAM. The model included state‐owned building square footage, with adjustments for number of floors, estimated site appropriateness (historical or structural), and rooftop coverage ratios. 2 DCR and Higher Education estimates are based on site‐specific information for individual facilities. Feasibility analyses are currently underway at these locations. 3 DCR and Higher Education estimates are based on site‐specific information for individual facilities. Feasibility analyses are currently underway at these locations.
Page 17

to be implemented. Additionally, a rooftop solar penetration model was developed by DCAM to obtain a preliminary estimate of potential on state‐owned buildings. This model included state‐owned building square footage, with adjustments for number of floors, estimated site appropriateness (historical or structural), and rooftop coverage ratios. This first‐order analysis resulted in a total of 15,000 kW on state‐owned building rooftops. To calculate PV generation, annual system output was projected assuming the arrays would be installed on flat roofs. The National Renewable Energy Laboratoryʹs Solar Advisory Model was used to calculate a capacity factor. This model uses TMY2 weather data to provide location‐specific capacity factors for representative cities throughout the United States. Boston was chosen as a representative city for Massachusetts for the purposes of this analysis.
It should be noted that this report did not involve primary research or engineering site feasibility assessments beyond the data provided by the Commonwealth, nor was an assessment made of flat‐roofs vs. pitched roofs.
Conclusions
There are about 7 MW of solar installed on all properties in Massachusetts as a whole. Of this total, 290 kW are installed on state‐owned facilities and properties. Another 1,007 kW of installations are planned for government‐owned facilities and properties. Based on initial analysis, the potential for solar PV on state‐owned properties is estimated at 30,952 kW, more than 100 times the current installed capacity on Massachusetts‐owned properties and facilities. Together, the planned and potential PV opportunities identified represent approximately 32 MW, or almost 13% of the Massachusetts goal to install 250 MW of PV by 2017.
Table 5, above, provides a list of the existing, planned and potential solar PV kW capacity on state‐owned property. Figure 5, below, graphically summarizes the same findings.
Figure 5: Existing, Planned, and Potential PV Resource Development on State‐Owned Property
290 1,007
30,952
0
5,000
10,000
15,000
20,000
25,000
30,000
35,000
kW Existing
Planned
Potential
Page 18
Hydroelectric The assessment of existing, planned and potential hydroelectric systems included traditional, small, and micro‐hydroelectric systems. Hydroelectric projects on state‐owned and Massachusetts Authority‐owned land and facilities were considered. However, this does not represent all potential on Authority properties. An assessment of all Authority property potential has yet to be completed.
Existing/Installed and Planned Projects (MW and MWh)
Massachusetts currently has three hydroelectric plants operating at Commonwealth facilities/properties. They are all affiliated with MWRA. The Deer Island Wastewater Treatment Plant has two 1 MW hydroelectric generators that recover energy from the outflow of water, and generate approximately 5,800 MWh per year. The Oakdale Power Station has a 3.5 MW hydroelectric generator that produces approximately 13,000 MWh per year. Finally, the Cosgrove Intake has a 2.4 MW hydroelectric generator that produces approximately 3,400 MWh annually. In total, this represents 7.9 MW and 22,200 MWh per year, or the equivalent annual electricity use of over 1,970 households. These projects are summarized in Table 6 below. Currently, no other projects are planned.
Hydroelectric Potential Opportunity
A study on the potential for hydroelectric power is underway DCR. The results of this study are not public yet and were not made fully available for this report. However, high level results of the study were available. DCR conducted a study of hundreds of dams, and identified a preliminary list of 20 dams that have the potential to support hydroelectric systems. Of these 20 dams, 19 have no capacity currently developed, which, if fully developed, could support 3.9 MW. These 19 sites are identified by large red stars on the map in Figure 6, below. One additional dam has some existing capacity currently developed and needs further analysis before its potential for additional capacity can be determined. To calculate potential generation, DCR used actual historical flow and dam height for the sites was taken into consideration, to calculate an average capacity factor of about 50% across all sites. Applying this to the 3.9 MW potential capacity, the DCR study reports a potential of 17,266 MWh per year from the preliminary 19 sites with no current existing capacity, or the equivalent annual electricity use of over 1,500 households.
In addition, the MWRA cites two projects in development. The first project, located at the Loring Road Covered Storage facility, would be 0.2 MW and would likely produce 1,200 MWh per year, or the equivalent annual electricity use of over 100 households. The second project is in the feasibility study stage and would be located at the Wachusett Dam. MWRA expects it would be 0.154 MW in size and produce 750 MWh per year. In addition, the MWRA is considering reactivation of Winsor Dam hydroelectric station at Quabbin, off‐line for 20 years due to fire and re‐permitting challenges. The Winsor Dam had a capacity of 1.2 MW.
The map below in Figure 6 provides the locations of 19 preliminary sites identified in the DCR analysis as having potential for small hydro on state‐owned property. These top sites are identified by large red stars on the map below.
Page 19
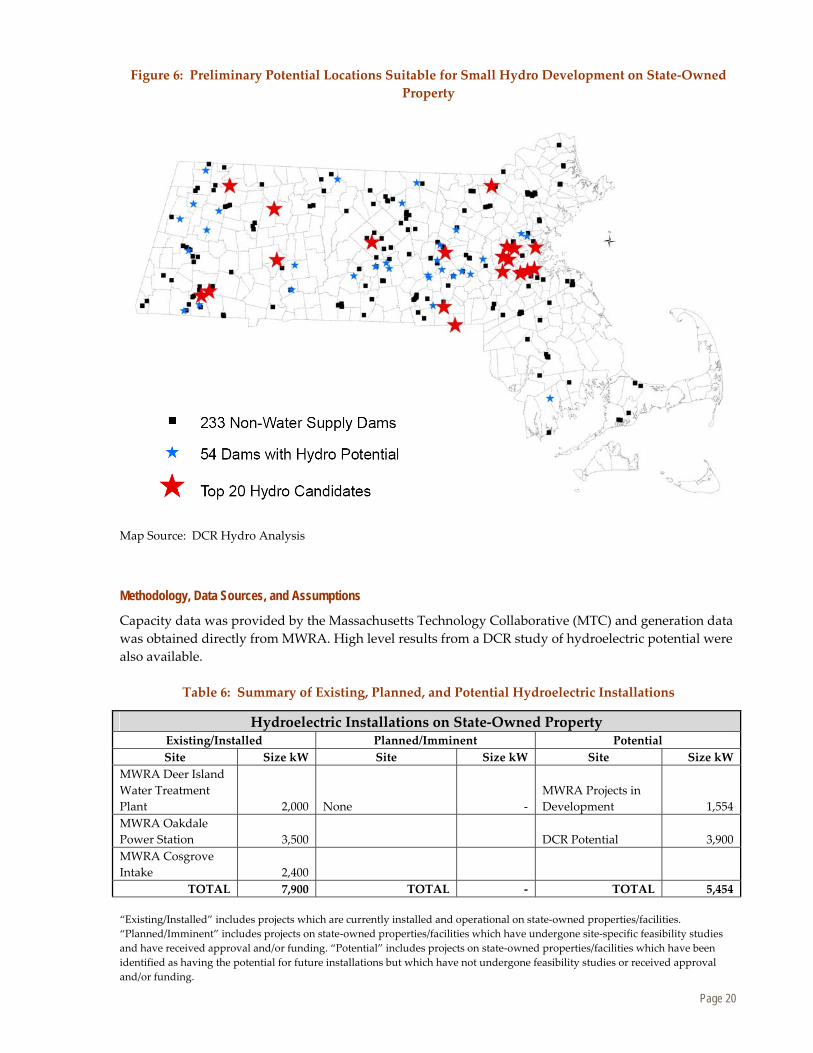
Figure 6: Preliminary Potential Locations Suitable for Small Hydro Development on State‐Owned Property
Map Source: DCR Hydro Analysis
Methodology, Data Sources, and Assumptions
Capacity data was provided by the Massachusetts Technology Collaborative (MTC) and generation data was obtained directly from MWRA. High level results from a DCR study of hydroelectric potential were also available.
Table 6: Summary of Existing, Planned, and Potential Hydroelectric Installations
Hydroelectric Installations on State‐Owned Property Existing/Installed Planned/Imminent Potential Site Size kW Site Size kW Site Size kW
MWRA Deer Island Water Treatment Plant 2,000 None ‐
MWRA Projects in Development 1,554
MWRA Oakdale Power Station 3,500 DCR Potential 3,900
MWRA Cosgrove Intake 2,400
TOTAL 7,900 TOTAL ‐ TOTAL 5,454
“Existing/Installed” includes projects which are currently installed and operational on state‐owned properties/facilities. “Planned/Imminent” includes projects on state‐owned properties/facilities which have undergone site‐specific feasibility studies and have received approval and/or funding. “Potential” includes projects on state‐owned properties/facilities which have been identified as having the potential for future installations but which have not undergone feasibility studies or received approval and/or funding.
Page 20
Conclusions
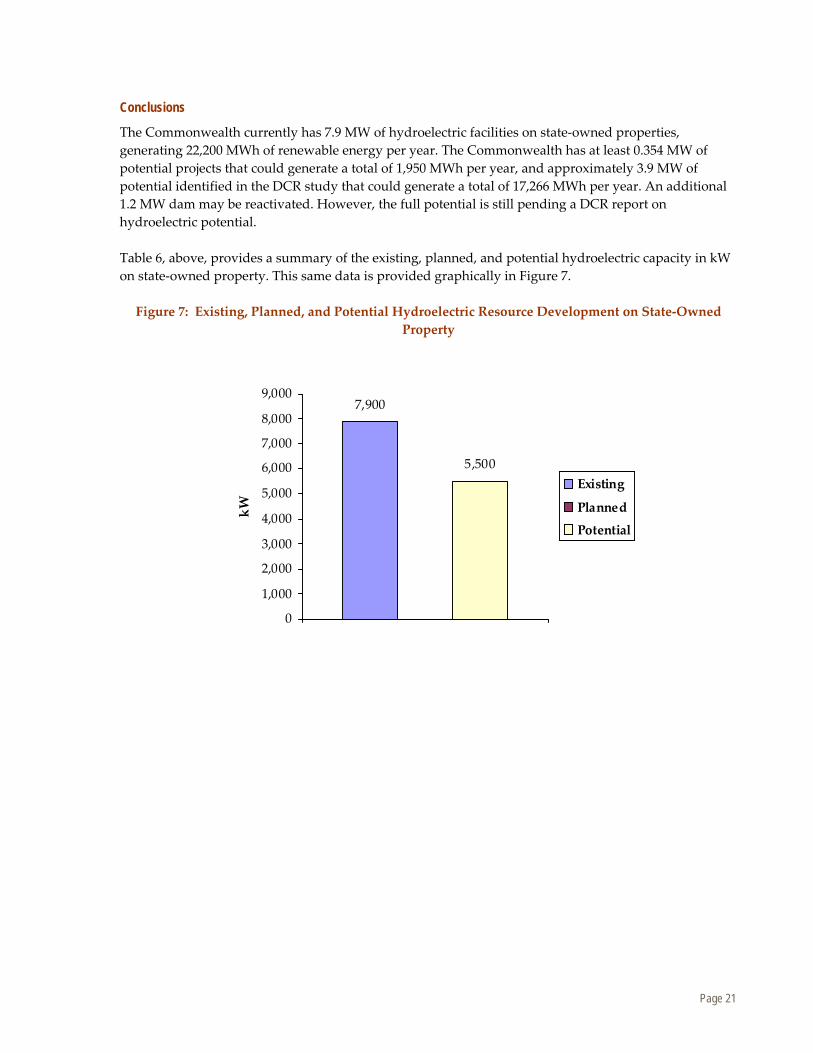
The Commonwealth currently has 7.9 MW of hydroelectric facilities on state‐owned properties, generating 22,200 MWh of renewable energy per year. The Commonwealth has at least 0.354 MW of potential projects that could generate a total of 1,950 MWh per year, and approximately 3.9 MW of potential identified in the DCR study that could generate a total of 17,266 MWh per year. An additional 1.2 MW dam may be reactivated. However, the full potential is still pending a DCR report on hydroelectric potential.
Table 6, above, provides a summary of the existing, planned, and potential hydroelectric capacity in kW on state‐owned property. This same data is provided graphically in Figure 7.
Figure 7: Existing, Planned, and Potential Hydroelectric Resource Development on State‐OwnedProperty
7,900
5,500
0
1,000
2,000
3,000
4,000
5,000
6,000
7,000
8,000
9,000
kW Existing
Planned
Potential
Page 21

Solar Thermal Hot Water The assessment of existing, planned and potential solar thermal hot water systems included a review of state‐owned and Authority‐owned facilities and properties. However, this does not represent all potential on Authority properties. An assessment of all Authority property potential has yet to be completed.
Massachusetts has sufficient insolation to provide solar thermal water heating year round, and has solar resources exceeding those of Germany, one of the world’s leading solar markets. In fact, Germany’s southernmost metropolis is farther north than Bangor, Maine. Insolation is defined as the sun’s energy incident on a region over a calendar year, given in kilowatt‐hours per meter square per day (kWh/m2/day). Massachusetts’ annual average insolation is approximately 4 kWh/m2/day.
Existing/Installed and Planned Projects (MMBTU/yr)
Massachusetts currently has two state‐owned facilities with solar thermal hot water systems: Halibut Point State Park Visitor Center and the Waquoit Bay Gate House Dorm. Together, these systems provide an estimated 15.4 MMBTU per year of water heating, equivalent to 5 MWh per year.1 Several planned projects totaling 170 panels for pools at four Commonwealth facilities have undergone feasibility studies but have not received funding. These facilities include the Costello Gym Pool at the University of Massachusetts‐Lowell and pools at the Massachusetts Hospital School, the Hogan Regional Center, and Massasoit Community College. Planned projects would produce an estimated 1,785 MMBTU of heat, equivalent to 520 MWh per year.2 These projects are summarized in Table 7 below.
Table 7: Summary of Existing, Planned, and Potential Solar Thermal Hot Water Installations
Solar Thermal Hot Water Installations on State‐Owned Property
Existing/Installed Planned/Imminent
(Feasibility Study Only) Potential
Site MMBTU/
yr Site MMBTU/
yr Site MMBTU/
yr Halibut Pt. State Park Visitor Center 3.4
UMass Lowell ‐ Costello Gym Pool 420
Higher Education and Other Pools 10,963
Waquoit Bay Gate House Dorm 12 MA Hospital School Pool 630 Dorms 19,602
Hogan Regional Center Pools 315
Beach and Campground Bathhouses 7,772
Massasoit Community College ‐ Pool 420 Dept. of Correction 81,731
Health and Human Services 21,789
TOTAL 15.4 TOTAL 1,785 TOTAL 141,857
“Existing/Installed” includes projects which are currently installed and operational on state‐owned properties/facilities. “Planned/Imminent” includes projects on state‐owned properties/facilities which have undergone site‐specific feasibility studies. However, unlike the Planned section of the other renewable technologies examined, these projects have not yet received approval and/or funding. “Potential” includes projects on state‐owned properties/facilities which have been identified as having the potential for future installations but which have not undergone feasibility studies or received approval and/or funding.
1 MWh equivalents are provided for comparative purposes only. It is anticipated that renewable energy heat production willprimarily offset natural gas and oil use, not electricity use.2 MWh equivalents are provided for comparative purposes only. It is anticipated that renewable energy heat production willprimarily offset natural gas and oil use, not electricity use.
Page 22

Solar Thermal Potential Opportunity
Based on data provided by the Commonwealth, the additional potential for solar thermal hot water installations on state‐owned properties would provide an estimated 141,857 MMBTU of water heating capacity per year, equivalent to 41,500 MWh per year1. Of this total, about 10,963 MMBTU could come from installations at state‐owned pools at Higher Education, DMR, and other facilities, assuming these pools continue to operate in the future. The remaining solar thermal potential could be installed on various properties such as state‐owned prisons, Health and Human Services (HHS) facilities, dorms, and inland, ocean, and campground bath houses to help meet building hot water load needs.
Methodology, Data Sources, and Assumptions
Solar thermal development was calculated based on data on existing, planned, and potential project sites collected and compiled by the Commonwealth. This includes one MWRA site. In some instances, number of panels, number of building occupants, square footage, number of floors, and pool volume were provided. Pool volume was not provided for several college pools. For these pools, a volume of 200,000 gallons per pool was assumed, based on the average size of athletic pools at other state‐owned higher education institutions.
To calculate solar thermal potential for domestic hot water needs, flat‐mounted glazed systems were assumed. An annual average of 1.1 kBTU/square foot/day of solar heat was assumed based on insolation data from the National Renewable Energy Laboratory.2 Average annual solar water heating system output in these conditions was determined based on Solar Rating and Certification Corporation (SRCC) system performance data.3
For ocean and inland lake bathhouses and campground shower facilities, assumptions for input and output water temperatures, hot water shower flow, and fraction of hot water load to be met by solar thermal heating were used to calculate the solar thermal output during the months that the facilities are operational. To determine hot water flow per showerhead per minute, an assumed input water temperature of approximately 50 degrees Fahrenheit, fixture output temperatures of 140 degrees Fahrenheit, and a hot water mixing equation provided by the American Society of Heating, Refrigeration, and Air‐Conditioning Engineers (ASHRAE) and Federal water flow regulations were used.4,5 Based on frequency of use, a hot water load was determined for each facility. In the absence of roof space data, solar thermal system sizing was constrained based on offsetting 65% of the hot water load for each facility.
For state‐owned correctional facilities and Department of Health and Human Services (HHS) facilities, building population numbers and water usage assumptions were used to determine hot water load. An assumption of 40 gallons per inmate per day of hot water usage was developed with the aid of information from the Department of Correction and cross referenced with average correctional facility water usage in other states. This assumption, which corresponds closely with Electric Power Research Institute (EPRI) Technical Assessment Guide estimates for hot water use per person for lodging facilities, was also used in HHS facility calculations. In the absence of roof space data, solar thermal system sizing was constrained based on offsetting 65% of the hot water load for each facility.
1 MWh equivalents are provided for comparative purposes only. It is anticipated that renewable energy heat production willprimarily offset natural gas and oil use, not electricity use.2 National Renewable Energy Lab. PVWATTS. <http://rredc.nrel.gov/solar/codes_algs/PVWATTS/>3Solar Rating & Certification Corporation. Directory of SRCC Certified Solar Collector Ratings.4 American Society of Heating, Refrigeration, and Air‐Conditioning Engineers. Hot Water Mixing Equation. ASHRAE Chapter 48,Table 9, Row 9, Showers. 2004.5 U.S. Department of Energy. Energy Efficiency and Renewable Energy Website> Water Heating.
Page 23
To estimate potential for dorms, dorm occupancy was used to estimate hot water use per dorm, and available roof space was used to constrain the hot water load that could be met with solar thermal. Assumptions for estimating hot water load included a 270 day dorm occupancy period and an estimated 12 gallons of 140 degree Fahrenheit water per shower. It was assumed that systems would be sized to meet 65% of this load. An available roof space factor of 50 percent, accounting for shading, structural soundness, orientation, HVAC equipment, and other roof uses, was also applied to constrain the portion of the load which could be met based on available roof space.
For the two existing systems identified, the installed system size was used to estimate annual thermal output. To calculate solar thermal development potential for pool water heating, the use of horizontally mounted, flat‐panel glazed heating systems was assumed. System sizing in terms of number of collectors was provided in some cases, and was used to estimate system sizing for the remaining cases. Average solar pool heating system output in these conditions was determined based on an average of SRCC system performance data for large collectors subject to solar resources similar to those of Massachusetts. No primary research or engineering site feasibility assessments were completed beyond the data provided by the Commonwealth as part of this initial assessment.
Conclusions
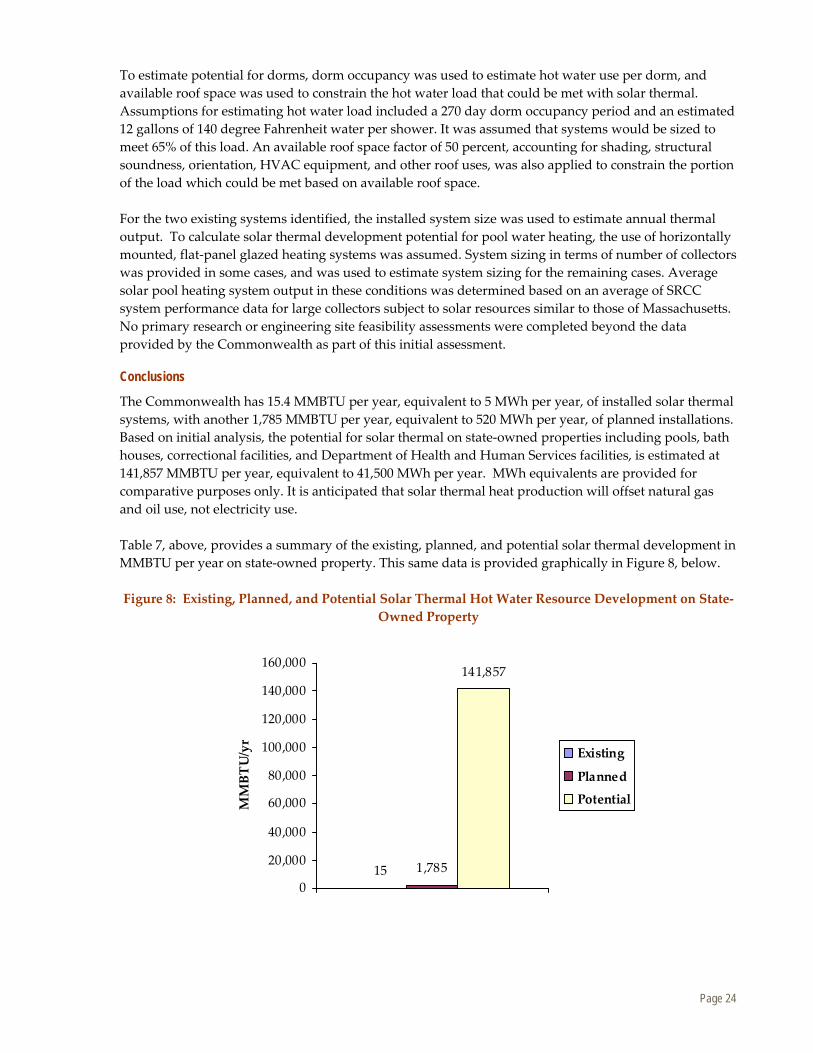
The Commonwealth has 15.4 MMBTU per year, equivalent to 5 MWh per year, of installed solar thermal systems, with another 1,785 MMBTU per year, equivalent to 520 MWh per year, of planned installations. Based on initial analysis, the potential for solar thermal on state‐owned properties including pools, bath houses, correctional facilities, and Department of Health and Human Services facilities, is estimated at 141,857 MMBTU per year, equivalent to 41,500 MWh per year. MWh equivalents are provided for comparative purposes only. It is anticipated that solar thermal heat production will offset natural gas and oil use, not electricity use.
Table 7, above, provides a summary of the existing, planned, and potential solar thermal development in MMBTU per year on state‐owned property. This same data is provided graphically in Figure 8, below.
Figure 8: Existing, Planned, and Potential Solar Thermal Hot Water Resource Development on State‐Owned Property
15 1,785
141,857
0
20,000
40,000
60,000
80,000
100,000
120,000
140,000
160,000
MMBTU/yr
Existing
Planned
Potential
Page 24
Biomass The assessment of existing, planned, and potential biomass development included a review of installations at state‐owned buildings and properties as well as installations at Authority properties. However, this does not represent all potential on Authority properties. An assessment of all Authority property potential has yet to be completed. Biomass technologies considered include direct combustion, gasification, and biogas from anaerobic digestion. Pure electricity generation, pure heat generation, as well as combined heat and power (CHP) applications were included.
Forest residues currently dominate the feedstock resources for biomass power in Massachusetts, and are most abundant in western Massachusetts. Forest residues include logging, land clearing, and unused forest growth. Only sustainably‐harvested forest residues would be used for the forest residue fuel needs of the units identified below. Though energy crops (i.e. willow, hybrid poplar, switchgrass) do not currently contribute to the feedstock resource, there is potential for them to do so in the future.
Existing/Installed and Planned Projects
There are five existing biomass plants on state‐owned property. These include electricity generation at MWRA’s Deer Island Treatment Plant, a combined heat and power system at Mount Wachusett Community College, a pellet stove at a Turnpike Authority building, and biomass boilers at DCR’s Quabbin Administration Building and Mt. Wachusett Community College. Together, these represent 3.55 MW of capacity and generate approximately 26,400 MWh per year, or the equivalent annual electricity use of over 2,300 households. The heat component of these installations provides approximately 15,600 MMBTU of heating per year, equivalent to 4,600 MWh per year. MMBTU to MWh equivalents are provided for comparative purposes only. It is anticipated that renewable heat production will offset natural gas and oil use, not electricity use.
Three sites have been identified with planned biomass development. These include a 1,750 kW combined heat and power biomass unit at the University of Massachusetts‐Amherst, an 850 kW combined heat and power unit at Springfield Technical Community College, and a 30 kW digester gas microturbine at the MWRA Clinton Treatment Plant, and a 600 bhp and 800 bhp biomass boilers at University of Massachusetts ‐ Dartmouth. These installations would generate approximately 19,600 MWh of electricity per year, or the equivalent annual electricity use of over 1,700 households. The heat component of the CHP installations could provide approximately 147,860 MMBTU of heat annually, equivalent to 43,000 MWh per year.1 For the forest residue fuel needs of these units, only sustainably‐harvested forest residues would be used. These are summarized in Table 8 below.
Biomass Potential Opportunity
Based on data provided by the Commonwealth, there are at least eleven potential sites at state‐owned facilities which could host biomass systems. These include one law enforcement site which would feature an 80 bhp heating unit, and a minimum of 10 small pellet stoves could be installed at Commonwealth properties including garages and Department of Conservation and Recreation (DCR) visitor centers. For the forest residue fuel needs of these units, only sustainably‐harvested forest residues would be used.
These projects are likely to produce 6,770 MMBTU of heating per year, equivalent to 2,000 MWh per year2.
1 MWh equivalents are provided for comparative purposes only. It is anticipated that renewable heat production will primarilyoffset natural gas and oil use, not electricity use.2 MWh equivalents are provided for comparative purposes only. It is anticipated that renewable heat production will primarilyoffset natural gas and oil use, not electricity use.
Page 25
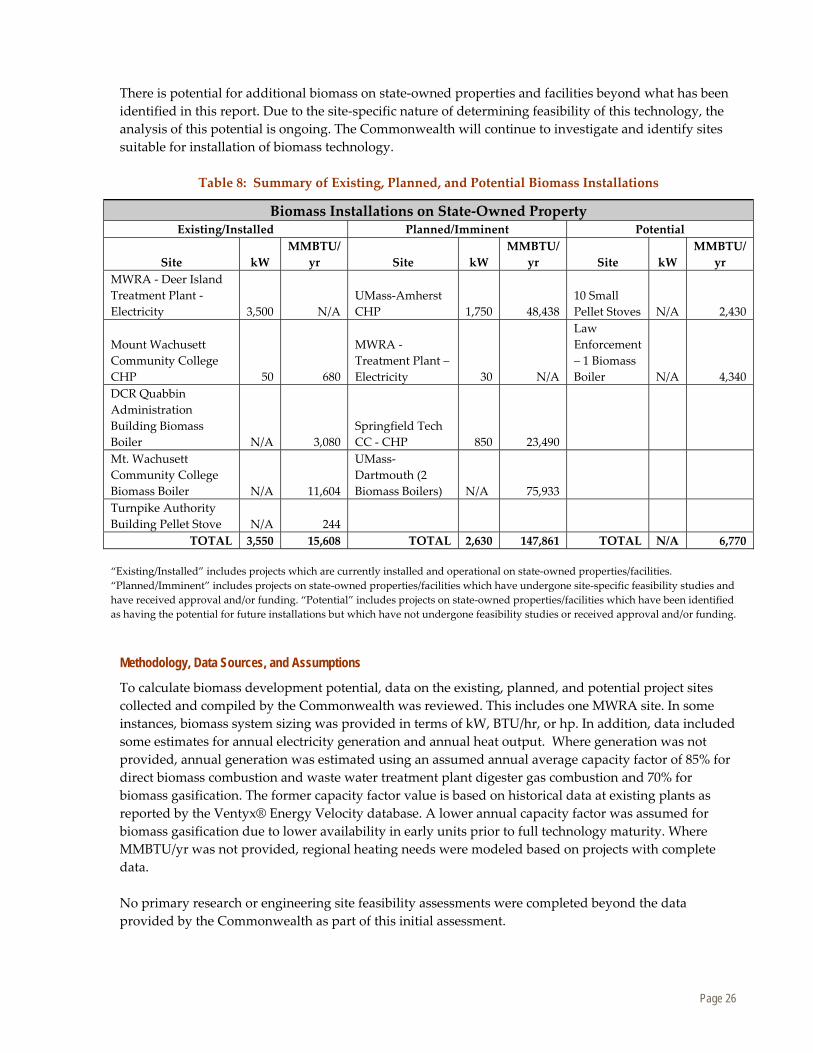
There is potential for additional biomass on state‐owned properties and facilities beyond what has been identified in this report. Due to the site‐specific nature of determining feasibility of this technology, the analysis of this potential is ongoing. The Commonwealth will continue to investigate and identify sites suitable for installation of biomass technology.
Table 8: Summary of Existing, Planned, and Potential Biomass Installations
Biomass Installations on State‐Owned Property Existing/Installed Planned/Imminent Potential
Site kW MMBTU/
yr Site kW MMBTU/
yr Site kW MMBTU/
yr MWRA ‐ Deer Island Treatment Plant ‐Electricity 3,500 N/A
UMass‐Amherst CHP 1,750 48,438
10 Small Pellet Stoves N/A 2,430
Mount Wachusett Community College CHP 50 680
MWRA ‐Treatment Plant – Electricity 30 N/A
Law Enforcement – 1 Biomass Boiler N/A 4,340
DCR Quabbin Administration Building Biomass Boiler N/A 3,080
Springfield Tech CC ‐ CHP 850 23,490
Mt. Wachusett Community College Biomass Boiler N/A 11,604
UMass‐Dartmouth (2 Biomass Boilers) N/A 75,933
Turnpike Authority Building Pellet Stove N/A 244
TOTAL 3,550 15,608 TOTAL 2,630 147,861 TOTAL N/A 6,770
“Existing/Installed” includes projects which are currently installed and operational on state‐owned properties/facilities. “Planned/Imminent” includes projects on state‐owned properties/facilities which have undergone site‐specific feasibility studies and have received approval and/or funding. “Potential” includes projects on state‐owned properties/facilities which have been identified as having the potential for future installations but which have not undergone feasibility studies or received approval and/or funding.
Methodology, Data Sources, and Assumptions
To calculate biomass development potential, data on the existing, planned, and potential project sites collected and compiled by the Commonwealth was reviewed. This includes one MWRA site. In some instances, biomass system sizing was provided in terms of kW, BTU/hr, or hp. In addition, data included some estimates for annual electricity generation and annual heat output. Where generation was not provided, annual generation was estimated using an assumed annual average capacity factor of 85% for direct biomass combustion and waste water treatment plant digester gas combustion and 70% for biomass gasification. The former capacity factor value is based on historical data at existing plants as reported by the Ventyx® Energy Velocity database. A lower annual capacity factor was assumed for biomass gasification due to lower availability in early units prior to full technology maturity. Where MMBTU/yr was not provided, regional heating needs were modeled based on projects with complete data.
No primary research or engineering site feasibility assessments were completed beyond the dataprovided by the Commonwealth as part of this initial assessment.
Page 26
Conclusions
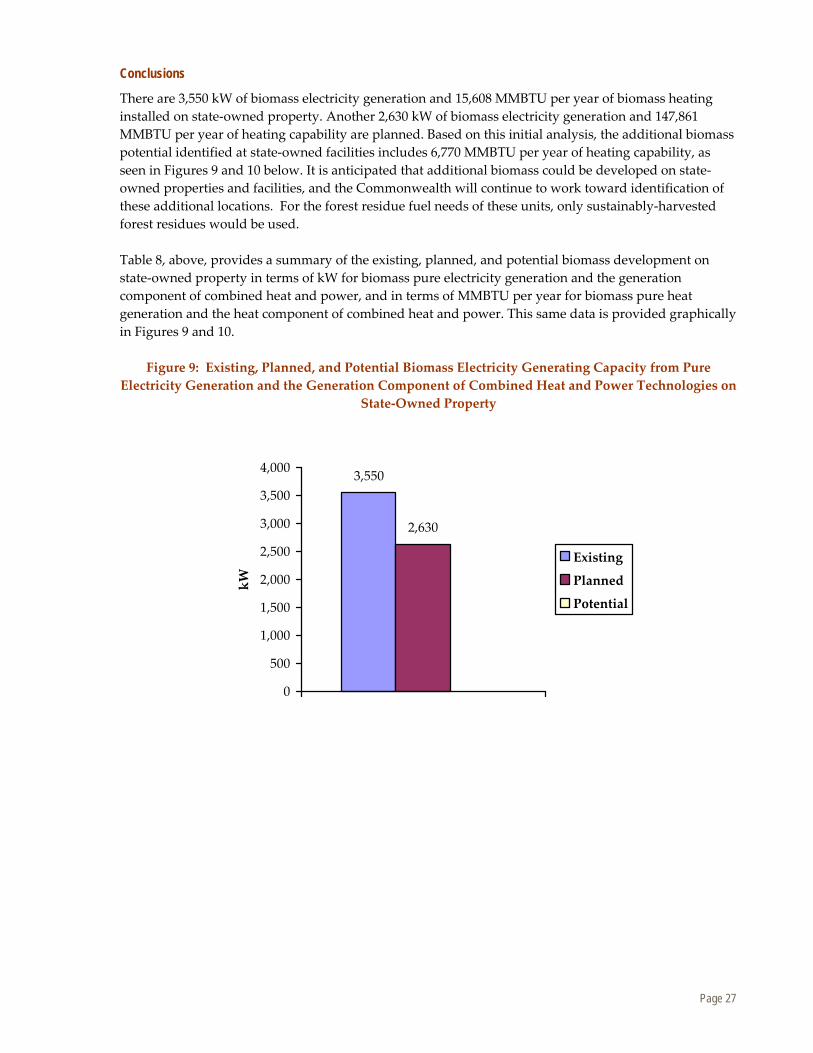
There are 3,550 kW of biomass electricity generation and 15,608 MMBTU per year of biomass heating installed on state‐owned property. Another 2,630 kW of biomass electricity generation and 147,861 MMBTU per year of heating capability are planned. Based on this initial analysis, the additional biomass potential identified at state‐owned facilities includes 6,770 MMBTU per year of heating capability, as seen in Figures 9 and 10 below. It is anticipated that additional biomass could be developed on state‐owned properties and facilities, and the Commonwealth will continue to work toward identification of these additional locations. For the forest residue fuel needs of these units, only sustainably‐harvested forest residues would be used.
Table 8, above, provides a summary of the existing, planned, and potential biomass development on state‐owned property in terms of kW for biomass pure electricity generation and the generation component of combined heat and power, and in terms of MMBTU per year for biomass pure heat generation and the heat component of combined heat and power. This same data is provided graphically in Figures 9 and 10.
Figure 9: Existing, Planned, and Potential Biomass Electricity Generating Capacity from PureElectricity Generation and the Generation Component of Combined Heat and Power Technologies on
State‐Owned Property
3,550
2,630
0
500
1,000
1,500
2,000
2,500
3,000
3,500
4,000
kW Existing
Planned
Potential
Page 27

Figure 10: Existing, Planned, and Potential Biomass Heating Development from Pure HeatGeneration and the Heat Component of Combined Heat and Power Technologies on State‐Owned
MMBTU/yr
Property
160,000 147,861
140,000
120,000
100,000
80,000
60,000
40,00015,608
20,000 6,770
0
Existing
Planned
Potential
Page 28
Geothermal Heat Pumps The assessment of existing, planned and potential geothermal development consisted of a review of ground source heat pump development at state‐owned buildings and properties as well as installations at Authority properties. However, this does not represent all potential on Authority properties. An assessment of all Authority property potential has yet to be completed. Open, closed, horizontal and vertical loop geothermal heat pump systems were included in the scope of the assessment. These technologies transfer heat to or from a building, using the Earth as a heat source when operating in heating mode, or as a heat sink, when operating in cooling mode. Geothermal electricity generation was not included in this assessment.
Existing/Installed and Planned Projects (MMBTU/yr)
There is currently one state‐owned property, Halibut Point State Park Visitor Center, with a geothermal heat pump installed. It provides approximately 303 MMBTU of heating and cooling per year, equivalent to 62 MWh per year. MWh equivalents are provided for comparative purposes only.1 It is anticipated that renewable energy heat transfer will primarily offset natural gas and oil use, not electricity use.
Planned projects on state‐owned facilities include Springfield Technical Community College, the Greylock Glen Outdoor Recreation and Environmental Education Center’s future Lodge and Performing Arts Center, and a building at Massasoit Community College in Brockton. These installations would likely provide 14,773 MMBTU of heating and cooling per year, equivalent to 3,000 MWh per year,2 as summarized in Table 9 below.
Geothermal Heat Pump Potential Opportunity
Based on data collected by the Commonwealth, three state‐owned facilities were identified as having potential for geothermal heat pump installations. Two of the sites identified are located at higher education institutions, providing approximately 22,820 MMBTU per year. The remaining project is located at a Department of Fish and Wildlife building and would provide 3,816 MMBTU per year. The total geothermal heat pump potential for these three projects is approximately 26,636 MMBTU of combined heating and cooling per year, equivalent to 5,400 MWh per year.3
Methodology, Data Sources, and Assumptions
To calculate geothermal heat pump potential, data on the existing, planned, and potential project sites and their square footage collected and compiled by the Commonwealth was reviewed. In some instances, DCAM provided geothermal system sizing. Where information was not provided, sizing was estimated using an assumed summer cooling load of 2 tons per 1000 square feet and a winter heating load of 4 tons per 1000 square feet.4
No primary research or engineering site feasibility assessments were completed beyond the data provided by the Commonwealth as part of this initial assessment.
1 Electricity equivalent has been adjusted to remove electricity used to operate the geothermal heat pump. 2 MWh equivalents are provided for comparative purposes only. It is anticipated that renewable energy heat production will primarily offset natural gas and oil use, not electricity use. Electricity equivalent has been adjusted to remove electricity used to operate the geothermal heat pump. 3 MWh equivalents are provided for comparative purposes only. It is anticipated that renewable energy heat production will primarily offset natural gas and oil use, not electricity use. Electricity equivalent has been adjusted to remove electricity used to operate the geothermal heat pump. 4 Based on discussions with geothermal heat pump system designers in the Commonwealth of Massachusetts. Falls within typical ton/1000 sq. ft. value range for climate Zone 4 and 5 building heating and cooling needs.
Page 29
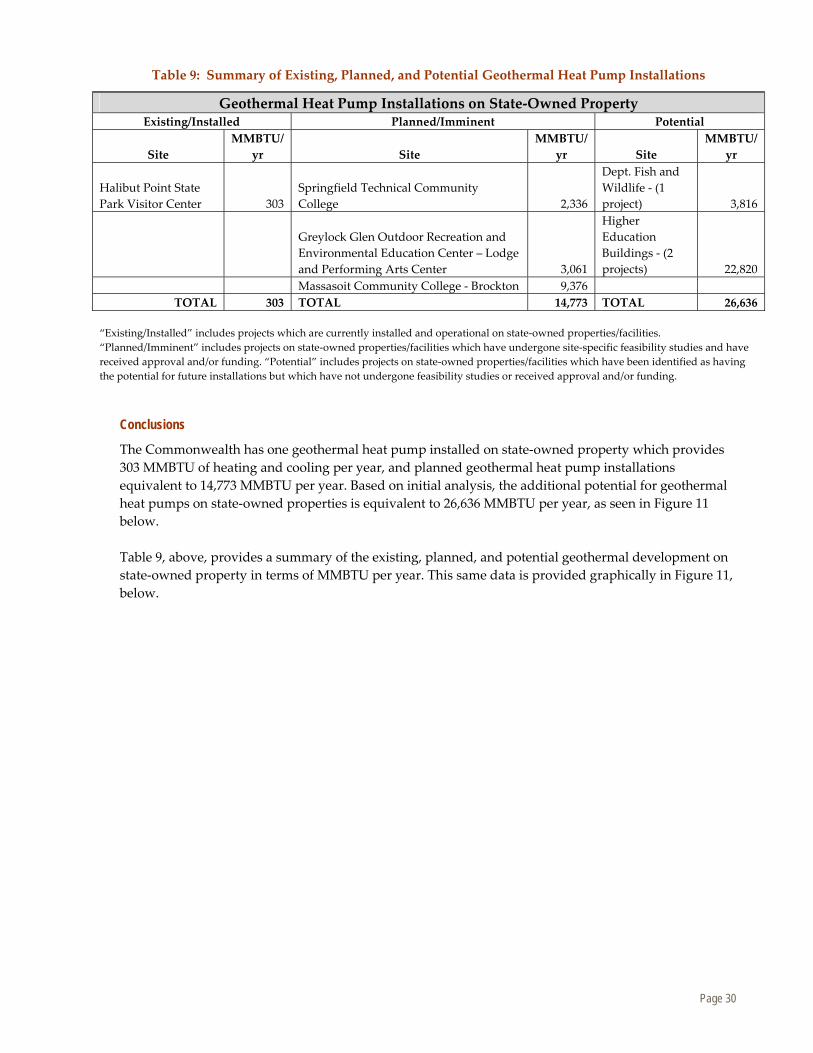
Table 9: Summary of Existing, Planned, and Potential Geothermal Heat Pump Installations
Geothermal Heat Pump Installations on State‐Owned Property Existing/Installed Planned/Imminent Potential
Site MMBTU/
yr Site MMBTU/
yr Site MMBTU/
yr
Halibut Point State Park Visitor Center 303
Springfield Technical Community College 2,336
Dept. Fish and Wildlife ‐ (1 project) 3,816
Greylock Glen Outdoor Recreation and Environmental Education Center – Lodge and Performing Arts Center 3,061
Higher Education Buildings ‐ (2 projects) 22,820
Massasoit Community College ‐ Brockton 9,376 TOTAL 303 TOTAL 14,773 TOTAL 26,636
“Existing/Installed” includes projects which are currently installed and operational on state‐owned properties/facilities. “Planned/Imminent” includes projects on state‐owned properties/facilities which have undergone site‐specific feasibility studies and have received approval and/or funding. “Potential” includes projects on state‐owned properties/facilities which have been identified as having the potential for future installations but which have not undergone feasibility studies or received approval and/or funding.
Conclusions
The Commonwealth has one geothermal heat pump installed on state‐owned property which provides 303 MMBTU of heating and cooling per year, and planned geothermal heat pump installations equivalent to 14,773 MMBTU per year. Based on initial analysis, the additional potential for geothermal heat pumps on state‐owned properties is equivalent to 26,636 MMBTU per year, as seen in Figure 11 below.
Table 9, above, provides a summary of the existing, planned, and potential geothermal development on state‐owned property in terms of MMBTU per year. This same data is provided graphically in Figure 11, below.
Page 30
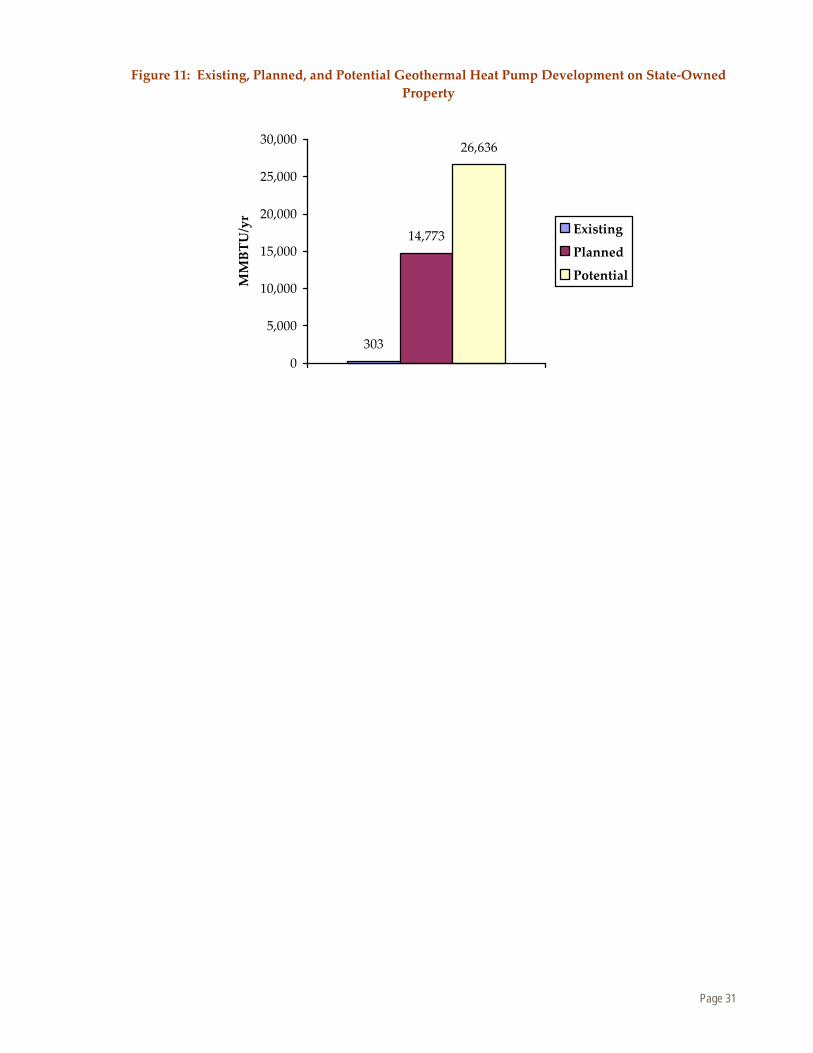
Figure 11: Existing, Planned, and Potential Geothermal Heat Pump Development on State‐Owned
MMBTU/yr
Property
30,000 26,636
25,000
20,000
14,773 15,000
10,000
5,000 303
0
Existing
Planned
Potential
Page 31
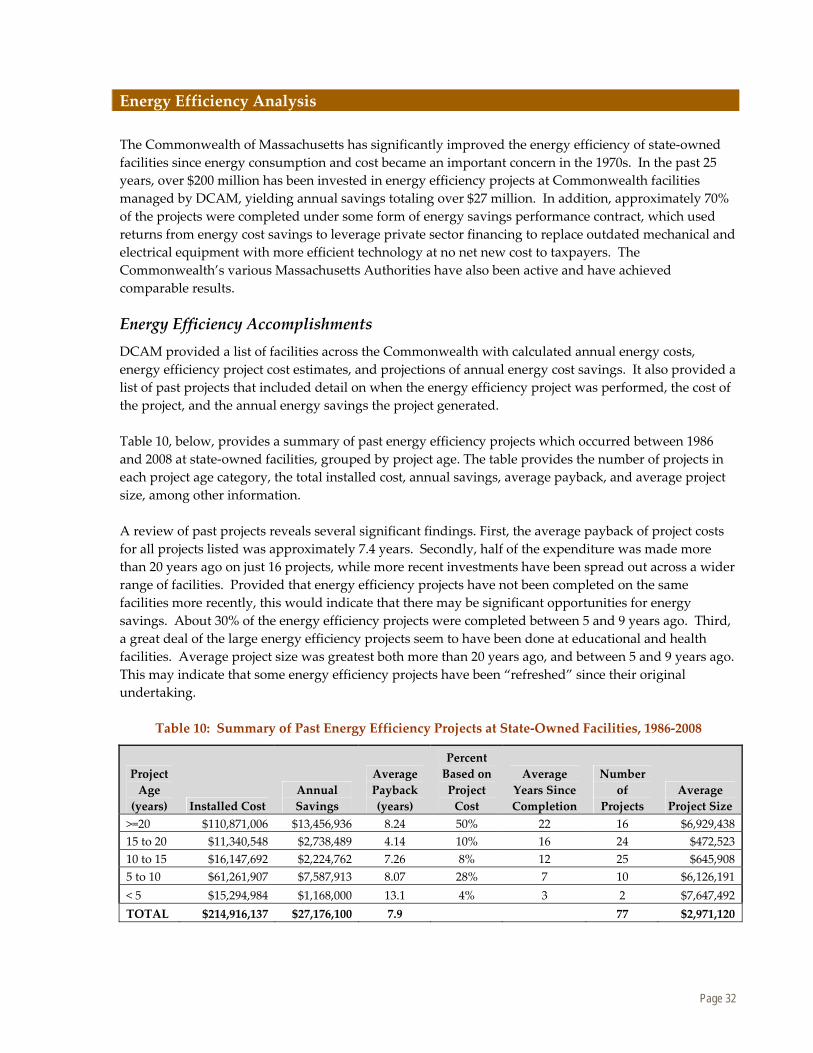
Energy Efficiency Analysis
The Commonwealth of Massachusetts has significantly improved the energy efficiency of state‐owned facilities since energy consumption and cost became an important concern in the 1970s. In the past 25 years, over $200 million has been invested in energy efficiency projects at Commonwealth facilities managed by DCAM, yielding annual savings totaling over $27 million. In addition, approximately 70% of the projects were completed under some form of energy savings performance contract, which used returns from energy cost savings to leverage private sector financing to replace outdated mechanical and electrical equipment with more efficient technology at no net new cost to taxpayers. The Commonwealth’s various Massachusetts Authorities have also been active and have achieved comparable results.
Energy Efficiency Accomplishments DCAM provided a list of facilities across the Commonwealth with calculated annual energy costs, energy efficiency project cost estimates, and projections of annual energy cost savings. It also provided a list of past projects that included detail on when the energy efficiency project was performed, the cost of the project, and the annual energy savings the project generated.
Table 10, below, provides a summary of past energy efficiency projects which occurred between 1986 and 2008 at state‐owned facilities, grouped by project age. The table provides the number of projects in each project age category, the total installed cost, annual savings, average payback, and average project size, among other information.
A review of past projects reveals several significant findings. First, the average payback of project costs for all projects listed was approximately 7.4 years. Secondly, half of the expenditure was made more than 20 years ago on just 16 projects, while more recent investments have been spread out across a wider range of facilities. Provided that energy efficiency projects have not been completed on the same facilities more recently, this would indicate that there may be significant opportunities for energy savings. About 30% of the energy efficiency projects were completed between 5 and 9 years ago. Third, a great deal of the large energy efficiency projects seem to have been done at educational and health facilities. Average project size was greatest both more than 20 years ago, and between 5 and 9 years ago. This may indicate that some energy efficiency projects have been “refreshed” since their original undertaking.
Table 10: Summary of Past Energy Efficiency Projects at State‐Owned Facilities, 1986‐2008
Percent Project Average Based on Average Number Age Annual Payback Project Years Since of Average (years) Installed Cost Savings (years) Cost Completion Projects Project Size
>=20 $110,871,006 $13,456,936 8.24 50% 22 16 $6,929,438
15 to 20 $11,340,548 $2,738,489 4.14 10% 16 24 $472,523
10 to 15 $16,147,692 $2,224,762 7.26 8% 12 25 $645,908
5 to 10 $61,261,907 $7,587,913 8.07 28% 7 10 $6,126,191
< 5 $15,294,984 $1,168,000 13.1 4% 3 2 $7,647,492
TOTAL $214,916,137 $27,176,100 7.9 77 $2,971,120
Page 32
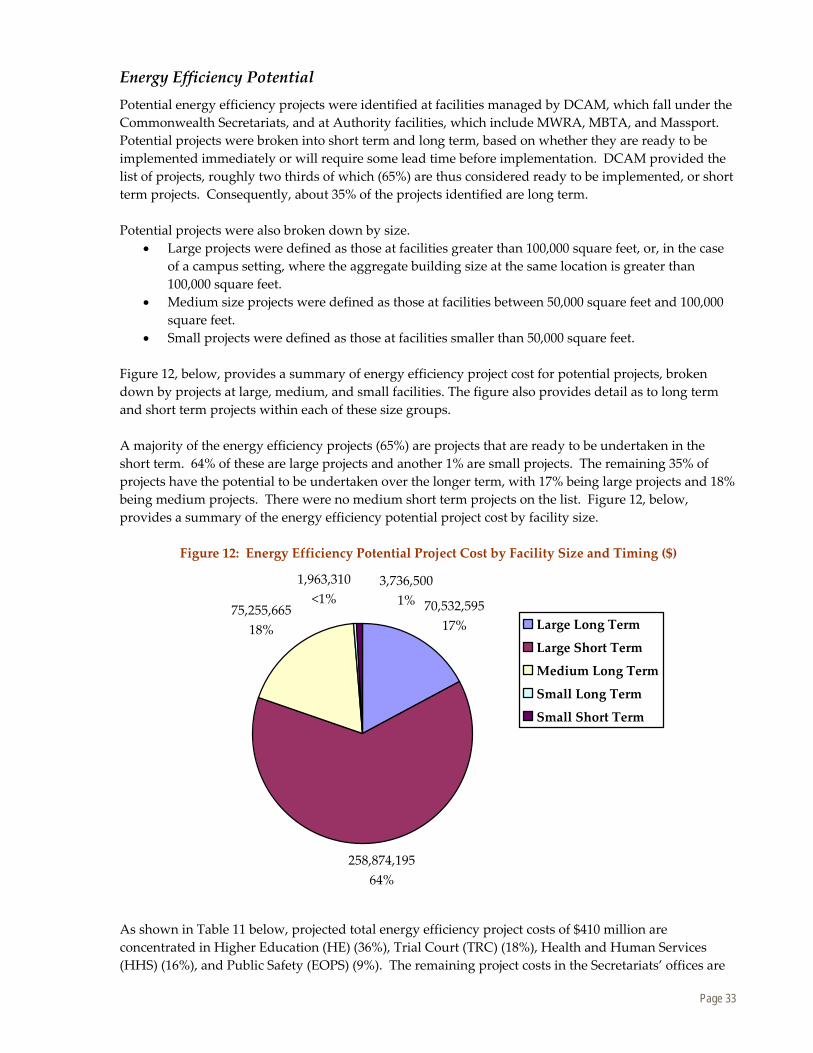
Energy Efficiency Potential Potential energy efficiency projects were identified at facilities managed by DCAM, which fall under the Commonwealth Secretariats, and at Authority facilities, which include MWRA, MBTA, and Massport. Potential projects were broken into short term and long term, based on whether they are ready to be implemented immediately or will require some lead time before implementation. DCAM provided the list of projects, roughly two thirds of which (65%) are thus considered ready to be implemented, or short term projects. Consequently, about 35% of the projects identified are long term.
Potential projects were also broken down by size. • Large projects were defined as those at facilities greater than 100,000 square feet, or, in the case
of a campus setting, where the aggregate building size at the same location is greater than 100,000 square feet.
• Medium size projects were defined as those at facilities between 50,000 square feet and 100,000 square feet.
• Small projects were defined as those at facilities smaller than 50,000 square feet.
Figure 12, below, provides a summary of energy efficiency project cost for potential projects, broken down by projects at large, medium, and small facilities. The figure also provides detail as to long term and short term projects within each of these size groups.
A majority of the energy efficiency projects (65%) are projects that are ready to be undertaken in the short term. 64% of these are large projects and another 1% are small projects. The remaining 35% of projects have the potential to be undertaken over the longer term, with 17% being large projects and 18% being medium projects. There were no medium short term projects on the list. Figure 12, below, provides a summary of the energy efficiency potential project cost by facility size.
Figure 12: Energy Efficiency Potential Project Cost by Facility Size and Timing ($)
1,963,310 3,736,500
75,255,665 <1% 1% 70,532,595
Large Long Term
Large Short Term
Medium Long Term
Small Long Term
Small Short Term
258,874,195
64%
18% 17%
As shown in Table 11 below, projected total energy efficiency project costs of $410 million are concentrated in Higher Education (HE) (36%), Trial Court (TRC) (18%), Health and Human Services (HHS) (16%), and Public Safety (EOPS) (9%). The remaining project costs in the Secretariats’ offices are
Page 33
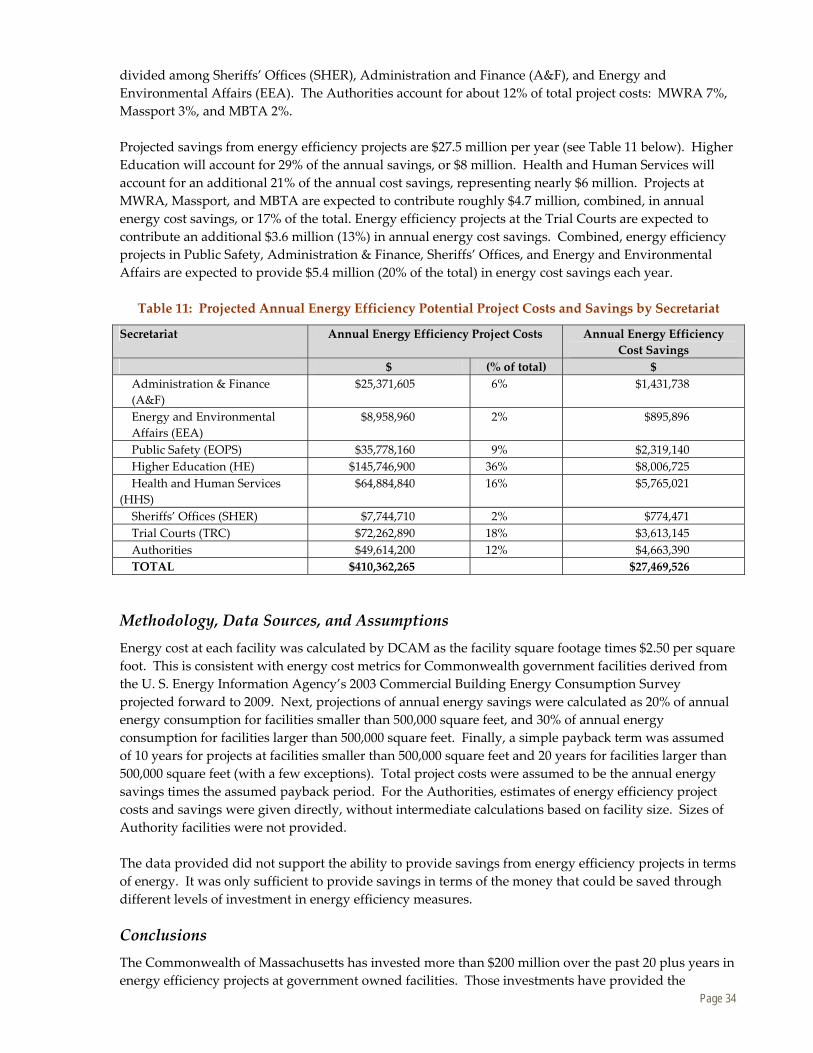
divided among Sheriffs’ Offices (SHER), Administration and Finance (A&F), and Energy and Environmental Affairs (EEA). The Authorities account for about 12% of total project costs: MWRA 7%, Massport 3%, and MBTA 2%.
Projected savings from energy efficiency projects are $27.5 million per year (see Table 11 below). Higher Education will account for 29% of the annual savings, or $8 million. Health and Human Services will account for an additional 21% of the annual cost savings, representing nearly $6 million. Projects at MWRA, Massport, and MBTA are expected to contribute roughly $4.7 million, combined, in annual energy cost savings, or 17% of the total. Energy efficiency projects at the Trial Courts are expected to contribute an additional $3.6 million (13%) in annual energy cost savings. Combined, energy efficiency projects in Public Safety, Administration & Finance, Sheriffs’ Offices, and Energy and Environmental Affairs are expected to provide $5.4 million (20% of the total) in energy cost savings each year.
Table 11: Projected Annual Energy Efficiency Potential Project Costs and Savings by Secretariat
Secretariat Annual Energy Efficiency Project Costs Annual Energy Efficiency Cost Savings
$ (% of total) $ Administration & Finance (A&F)
$25,371,605 6% $1,431,738
Energy and Environmental Affairs (EEA)
$8,958,960 2% $895,896
Public Safety (EOPS) $35,778,160 9% $2,319,140
Higher Education (HE) $145,746,900 36% $8,006,725
Health and Human Services (HHS)
$64,884,840 16% $5,765,021
Sheriffs’ Offices (SHER) $7,744,710 2% $774,471
Trial Courts (TRC) $72,262,890 18% $3,613,145
Authorities $49,614,200 12% $4,663,390 TOTAL $410,362,265 $27,469,526
Methodology, Data Sources, and Assumptions Energy cost at each facility was calculated by DCAM as the facility square footage times $2.50 per square foot. This is consistent with energy cost metrics for Commonwealth government facilities derived from the U. S. Energy Information Agency’s 2003 Commercial Building Energy Consumption Survey projected forward to 2009. Next, projections of annual energy savings were calculated as 20% of annual energy consumption for facilities smaller than 500,000 square feet, and 30% of annual energy consumption for facilities larger than 500,000 square feet. Finally, a simple payback term was assumed of 10 years for projects at facilities smaller than 500,000 square feet and 20 years for facilities larger than 500,000 square feet (with a few exceptions). Total project costs were assumed to be the annual energy savings times the assumed payback period. For the Authorities, estimates of energy efficiency project costs and savings were given directly, without intermediate calculations based on facility size. Sizes of Authority facilities were not provided.
The data provided did not support the ability to provide savings from energy efficiency projects in terms of energy. It was only sufficient to provide savings in terms of the money that could be saved through different levels of investment in energy efficiency measures.
Conclusions The Commonwealth of Massachusetts has invested more than $200 million over the past 20 plus years in energy efficiency projects at government owned facilities. Those investments have provided the
Page 34

Commonwealth with average paybacks on its investments of 7.4 years, and have saved it an average of $345,000 per project and an average of $5.25 million per year.
Energy efficiency projects currently planned for the short, medium, and long term have the potential to build on this record of achievement. When combined, the energy efficiency projects to be undertaken are projected to save the Commonwealth roughly $27.5 million dollars per year. Investments and annual savings are expected to be the greatest in Higher Education, Health and Human Services, Trial Courts, and at the Authorities. Combined, these will account for 81% of the total investments and 80% of the annual savings, which translates to more than $332 million in investments and roughly $22 million in annual savings.
Page 35
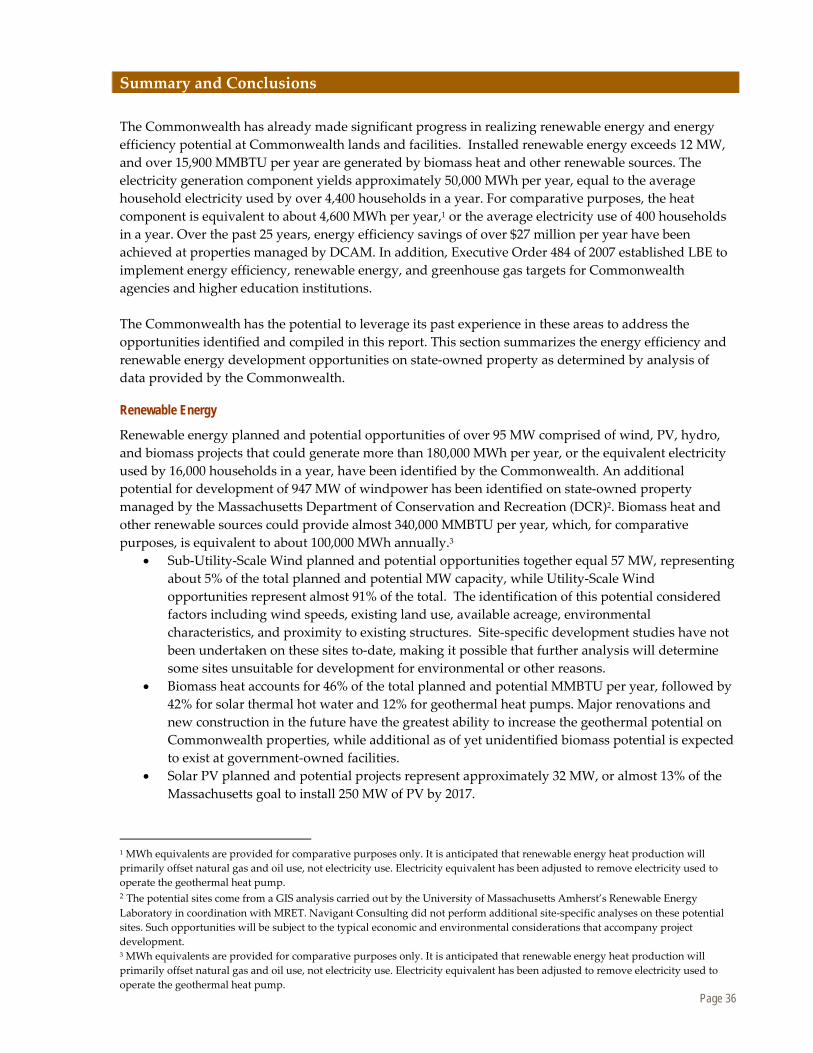
Summary and Conclusions
The Commonwealth has already made significant progress in realizing renewable energy and energy efficiency potential at Commonwealth lands and facilities. Installed renewable energy exceeds 12 MW, and over 15,900 MMBTU per year are generated by biomass heat and other renewable sources. The electricity generation component yields approximately 50,000 MWh per year, equal to the average household electricity used by over 4,400 households in a year. For comparative purposes, the heat component is equivalent to about 4,600 MWh per year,1 or the average electricity use of 400 households in a year. Over the past 25 years, energy efficiency savings of over $27 million per year have been achieved at properties managed by DCAM. In addition, Executive Order 484 of 2007 established LBE to implement energy efficiency, renewable energy, and greenhouse gas targets for Commonwealth agencies and higher education institutions.
The Commonwealth has the potential to leverage its past experience in these areas to address the opportunities identified and compiled in this report. This section summarizes the energy efficiency and renewable energy development opportunities on state‐owned property as determined by analysis of data provided by the Commonwealth.
Renewable Energy
Renewable energy planned and potential opportunities of over 95 MW comprised of wind, PV, hydro, and biomass projects that could generate more than 180,000 MWh per year, or the equivalent electricity used by 16,000 households in a year, have been identified by the Commonwealth. An additional potential for development of 947 MW of windpower has been identified on state‐owned property managed by the Massachusetts Department of Conservation and Recreation (DCR)2. Biomass heat and other renewable sources could provide almost 340,000 MMBTU per year, which, for comparative purposes, is equivalent to about 100,000 MWh annually.3
• Sub‐Utility‐Scale Wind planned and potential opportunities together equal 57 MW, representing about 5% of the total planned and potential MW capacity, while Utility‐Scale Wind opportunities represent almost 91% of the total. The identification of this potential considered factors including wind speeds, existing land use, available acreage, environmental characteristics, and proximity to existing structures. Site‐specific development studies have not been undertaken on these sites to‐date, making it possible that further analysis will determine some sites unsuitable for development for environmental or other reasons.
• Biomass heat accounts for 46% of the total planned and potential MMBTU per year, followed by 42% for solar thermal hot water and 12% for geothermal heat pumps. Major renovations and new construction in the future have the greatest ability to increase the geothermal potential on Commonwealth properties, while additional as of yet unidentified biomass potential is expected to exist at government‐owned facilities.
• Solar PV planned and potential projects represent approximately 32 MW, or almost 13% of the Massachusetts goal to install 250 MW of PV by 2017.
1 MWh equivalents are provided for comparative purposes only. It is anticipated that renewable energy heat production will primarily offset natural gas and oil use, not electricity use. Electricity equivalent has been adjusted to remove electricity used to operate the geothermal heat pump. 2 The potential sites come from a GIS analysis carried out by the University of Massachusetts Amherst’s Renewable Energy Laboratory in coordination with MRET. Navigant Consulting did not perform additional site‐specific analyses on these potential sites. Such opportunities will be subject to the typical economic and environmental considerations that accompany project development. 3 MWh equivalents are provided for comparative purposes only. It is anticipated that renewable energy heat production will primarily offset natural gas and oil use, not electricity use. Electricity equivalent has been adjusted to remove electricity used to operate the geothermal heat pump.
Page 36
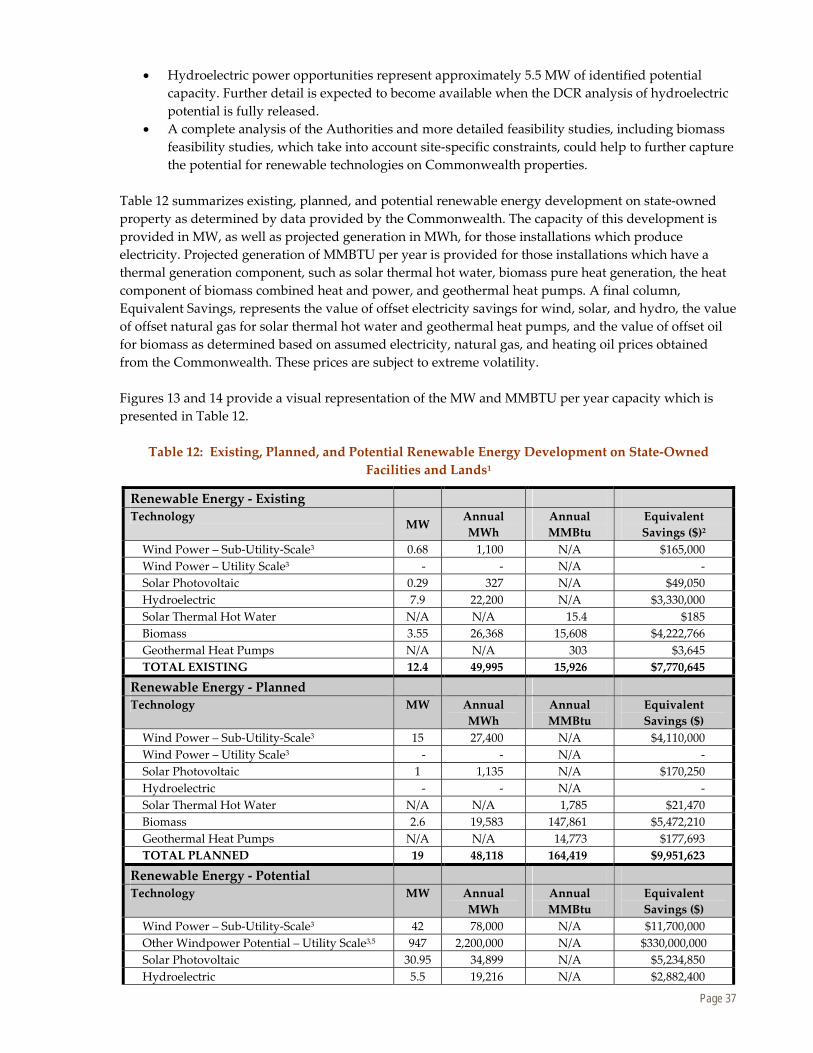
• Hydroelectric power opportunities represent approximately 5.5 MW of identified potential capacity. Further detail is expected to become available when the DCR analysis of hydroelectric potential is fully released.
• A complete analysis of the Authorities and more detailed feasibility studies, including biomass feasibility studies, which take into account site‐specific constraints, could help to further capture the potential for renewable technologies on Commonwealth properties.
Table 12 summarizes existing, planned, and potential renewable energy development on state‐owned property as determined by data provided by the Commonwealth. The capacity of this development is provided in MW, as well as projected generation in MWh, for those installations which produce electricity. Projected generation of MMBTU per year is provided for those installations which have a thermal generation component, such as solar thermal hot water, biomass pure heat generation, the heat component of biomass combined heat and power, and geothermal heat pumps. A final column, Equivalent Savings, represents the value of offset electricity savings for wind, solar, and hydro, the value of offset natural gas for solar thermal hot water and geothermal heat pumps, and the value of offset oil for biomass as determined based on assumed electricity, natural gas, and heating oil prices obtained from the Commonwealth. These prices are subject to extreme volatility.
Figures 13 and 14 provide a visual representation of the MW and MMBTU per year capacity which is presented in Table 12.
Table 12: Existing, Planned, and Potential Renewable Energy Development on State‐OwnedFacilities and Lands1
Renewable Energy ‐ Existing Technology MW
Annual MWh
Annual MMBtu
Equivalent Savings ($)2
Wind Power – Sub‐Utility‐Scale3 0.68 1,100 N/A $165,000
Wind Power – Utility Scale3 ‐ ‐ N/A ‐Solar Photovoltaic 0.29 327 N/A $49,050
Hydroelectric 7.9 22,200 N/A $3,330,000
Solar Thermal Hot Water N/A N/A 15.4 $185
Biomass 3.55 26,368 15,608 $4,222,766
Geothermal Heat Pumps N/A N/A 303 $3,645
TOTAL EXISTING 12.4 49,995 15,926 $7,770,645
Renewable Energy ‐ Planned Technology MW Annual
MWh Annual MMBtu
Equivalent Savings ($)
Wind Power – Sub‐Utility‐Scale3 15 27,400 N/A $4,110,000
Wind Power – Utility Scale3 ‐ ‐ N/A ‐Solar Photovoltaic 1 1,135 N/A $170,250
Hydroelectric ‐ ‐ N/A ‐Solar Thermal Hot Water N/A N/A 1,785 $21,470
Biomass 2.6 19,583 147,861 $5,472,210
Geothermal Heat Pumps N/A N/A 14,773 $177,693
TOTAL PLANNED 19 48,118 164,419 $9,951,623
Renewable Energy ‐ Potential Technology MW Annual
MWh Annual MMBtu
Equivalent Savings ($)
Wind Power – Sub‐Utility‐Scale3 42 78,000 N/A $11,700,000
Other Windpower Potential – Utility Scale3,5 947 2,200,000 N/A $330,000,000
Solar Photovoltaic 30.95 34,899 N/A $5,234,850
Hydroelectric 5.5 19,216 N/A $2,882,400
Page 37
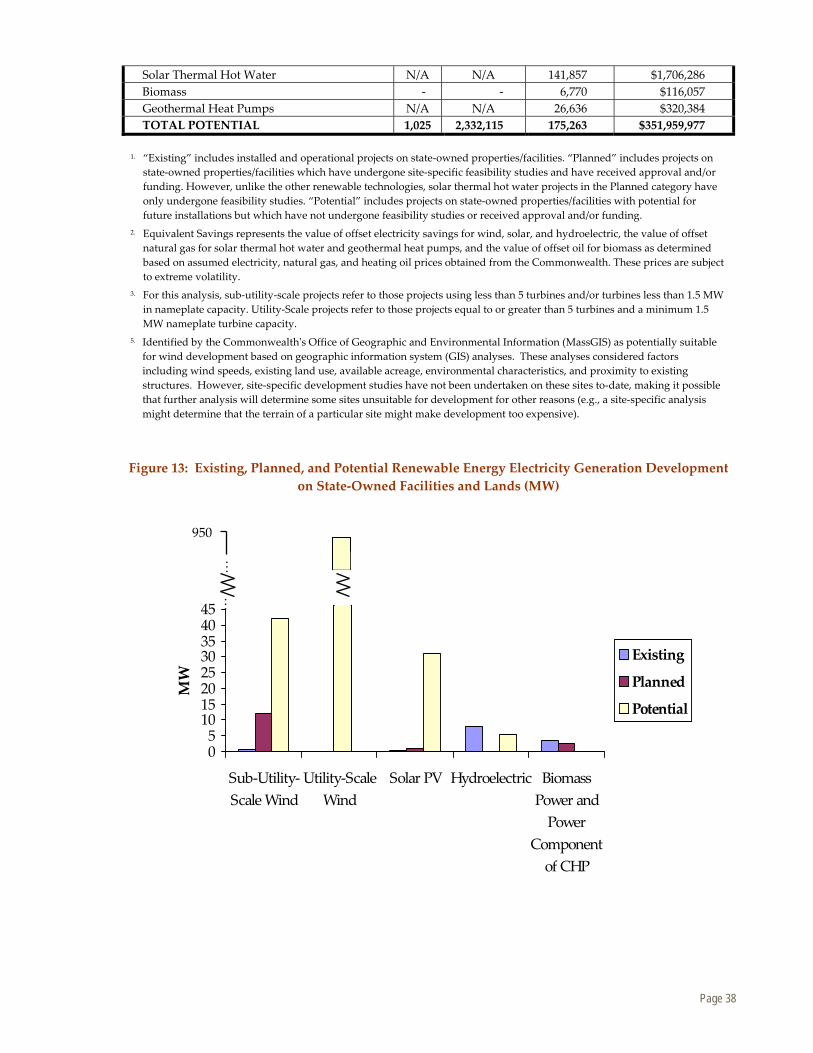
Solar Thermal Hot Water N/A N/A 141,857 $1,706,286
Biomass ‐ ‐ 6,770 $116,057
Geothermal Heat Pumps N/A N/A 26,636 $320,384
TOTAL POTENTIAL 1,025 2,332,115 175,263 $351,959,977
1. “Existing” includes installed and operational projects on state‐owned properties/facilities. “Planned” includes projects on state‐owned properties/facilities which have undergone site‐specific feasibility studies and have received approval and/or funding. However, unlike the other renewable technologies, solar thermal hot water projects in the Planned category have only undergone feasibility studies. “Potential” includes projects on state‐owned properties/facilities with potential for future installations but which have not undergone feasibility studies or received approval and/or funding.
2. Equivalent Savings represents the value of offset electricity savings for wind, solar, and hydroelectric, the value of offset natural gas for solar thermal hot water and geothermal heat pumps, and the value of offset oil for biomass as determined based on assumed electricity, natural gas, and heating oil prices obtained from the Commonwealth. These prices are subject to extreme volatility.
3. For this analysis, sub‐utility‐scale projects refer to those projects using less than 5 turbines and/or turbines less than 1.5 MW in nameplate capacity. Utility‐Scale projects refer to those projects equal to or greater than 5 turbines and a minimum 1.5 MW nameplate turbine capacity.
5. Identified by the Commonwealthʹs Office of Geographic and Environmental Information (MassGIS) as potentially suitable for wind development based on geographic information system (GIS) analyses. These analyses considered factors including wind speeds, existing land use, available acreage, environmental characteristics, and proximity to existing structures. However, site‐specific development studies have not been undertaken on these sites to‐date, making it possible that further analysis will determine some sites unsuitable for development for other reasons (e.g., a site‐specific analysis might determine that the terrain of a particular site might make development too expensive).
Figure 13: Existing, Planned, and Potential Renewable Energy Electricity Generation Development on State‐Owned Facilities and Lands (MW)
950
...
.
MW
45 40 35 30 25 20 15 10 5 0
.
Existing
Planned
Potential
.
Sub‐Utility‐Utility‐Scale Solar PV Hydroelectric Biomass Scale Wind Wind Power and
Power Component of CHP
Page 38
Figure 14: Existing, Planned, and Potential Renewable Energy Heat Generation Development onState‐Owned Facilities and Lands (MMBTU/yr)
Geothermal Heat Biomass Heat and Solar Thermal HotPumps Heat from Biomass Water
CHP
Energy Efficiency
Table 13 summarizes the remaining energy efficiency savings potential at state‐owned facilities which have not seen comprehensive energy efficiency improvements in the last 5 to 10 years. When combined, the energy efficiency projects to be undertaken are projected to save the Commonwealth roughly $27.5 million per year. This potential is concentrated within four main Secretariats, is mostly attributable to projects on large buildings, and much of it is ready to be implemented.
• Higher Education and Heath and Human Services represent the largest savings opportunity, accounting for 30% and 21% of the total annual cost savings, respectively. Authorities and Trial Courts account for 17% and 13% of the total annual cost savings, respectively. Combined, these will account for 81% of the total investments and 80% of the annual savings, which translates to more than $332 million in investments and roughly $22 million in annual savings.
• Over 80% of projects were at facilities greater than 100,000 square feet, or were in a campus setting where the aggregate building size at the same location is greater than 100,000 square feet.
• Roughly two thirds of the potential projects identified are considered ready to be implemented.
Table 13: Projected Annual Energy Efficiency Cost Savings by Secretariat
0
20,000
40,000
60,000
80,000
100,000
120,000
140,000
160,000 MMBTU/yr
Existing
Planned
Potential
Energy Efficiency
Secretariat Annual Energy Efficiency Cost Savings ($) Administration & Finance (A&F) $1,431,738
Energy and Environmental Affairs (EEA) $895,896
Public Safety (EOPS) $2,319,140
Higher Education (HE) $8,006,725
Health and Human Services (HHS) $5,765,021
Sheriffs’ Offices (SHER) $774,471
Trial Courts (TRC) $3,613,145
Authorities $4,663,390
TOTAL $27,469,526
Page 39