omb circular a-133 single audit report year ended june 30 ......management of the city is...
TRANSCRIPT

CITY OF ST. LOUIS, MISSOURI
OMB Circular A-133 Single Audit Report
Year ended June 30, 2012
(With Independent Auditors’ Reports Thereon)

CITY OF ST. LOUIS, MISSOURI
OMB Circular A-133 Single Audit Report
Year ended June 30, 2012
Table of Contents
Page Independent Auditors’ Reports on Internal Control Over Financial Reporting and on Compliance and Other Matters Based on an Audit of Financial Statements Performed in Accordance With Government Auditing Standards:
City of St. Louis, Missouri ...................................................................................................... 1 – 2
Lambert – St. Louis International Airport, an enterprise fund of the City of St. Louis, Missouri ............................................................................................................................ 3 – 4 Metropolitan Police Department of the City of St. Louis, Missouri, a discretely presented component unit of the City of St. Louis, Missouri ............................................................ 5 – 6
Independent Auditors’ Report on Compliance With Requirements That Could Have a Direct and Material Effect on Each Major Program and on Internal Control Over Compliance in Accordance With OMB Circular A-133 ........................................................................................ 7 – 9 Schedule of Expenditures of Federal Awards ............................................................................... 10 – 27 Notes to Schedule of Expenditures of Federal Awards ................................................................. 28 – 29 Schedule of Findings and Questioned Costs ................................................................................. 30 – 48 The City’s audited basic financial statements, as of and for the year ended June 30, 2012, are separately attached hereto.

[This page intentionally left blank]

KPMG LLP Suite 900 10 South Broadway St. Louis, MO 63102-1761
KPMG LLP is a Delaware limited liability partnership, the U.S. member firm of KPMG International Cooperative (“KPMG International”), a Swiss entity.
Independent Auditors’ Report on Internal Control Over Financial Reporting and on Compliance and Other Matters Based on an Audit of Financial Statements
Performed in Accordance With Government Auditing Standards
To the Honorable Mayor and Members of the Board of Aldermen City of St. Louis, Missouri: We have audited the financial statements of the governmental activities, the business-type activities, the aggregate discretely presented component units, each major fund, and the aggregate remaining fund information of the City of St. Louis, Missouri (the City), as of and for the year ended June 30, 2012, which collectively comprise the City’s basic financial statements, and have issued our report thereon dated December 26, 2012. Our report on the basic financial statements was modified to include a reference to other auditors. We conducted our audit in accordance with auditing standards generally accepted in the United States of America and the standards applicable to financial audits contained in Government Auditing Standards, issued by the Comptroller General of the United States. Other auditors audited the financial statements of the pension trust funds and the St. Louis Development Corporation, a discretely presented component unit, as described in our report on the City’s basic financial statements. This report does not include the results of the other auditors’ testing of internal control over financial reporting or compliance and other matters that are reported on separately by those auditors. The financial statements of the pension trust funds were not audited in accordance with Government Auditing Standards.
For purposes of this report, our consideration of internal control over financial reporting and our tests of compliance with certain provisions of laws, regulations, contracts, and grant agreements, and other matters did not include Lambert – St. Louis International Airport, an enterprise fund of the City, and The Metropolitan Police Department of the City of St. Louis, Missouri, a discretely presented component unit of the City. We have issued separate reports dated December 10, 2012 and December 17, 2012, respectively, on our consideration of internal control over financial reporting and our tests of compliance with certain provisions of laws, regulations, contracts, and grant agreements, and other matters for these entities. The findings, if any, included in those reports are not included herein.
Internal Control Over Financial Reporting Management of the City is responsible for establishing and maintaining effective internal control over financial reporting. In planning and performing our audit, we considered the City’s internal control over financial reporting as a basis for designing our auditing procedures for the purpose of expressing our opinions on the financial statements, but not for the purpose of expressing an opinion on the effectiveness of the City’s internal control over financial reporting. Accordingly, we do not express an opinion on the effectiveness of the City’s internal control over financial reporting.
A deficiency in internal control over financial reporting exists when the design or operation of a control does not allow management or employees, in the normal course of performing their assigned functions, to prevent, or detect and correct misstatements on a timely basis. A material weakness is a deficiency, or combination of deficiencies, in internal control over financial reporting, such that there is a reasonable possibility that a material misstatement of the entity’s financial statements will not be prevented, or detected and corrected on a timely basis.

2
Our consideration of internal control over financial reporting was for the limited purpose described in the first paragraph of this section and was not designed to identify all deficiencies in internal control over financial reporting that might be deficiencies, significant deficiencies, or material weaknesses. We did not identify any deficiencies in internal control over financial reporting that we consider to be material weaknesses, as defined above. However, we identified certain deficiencies in internal control over financial reporting that we consider to be significant deficiencies and that are described in the accompanying schedule of findings and questioned costs as findings 2012-01 and 2012-02. A significant deficiency is a deficiency, or combination of deficiencies, in internal control over financial reporting that is less severe than a material weakness, yet important enough to merit attention by those charged with governance.
Compliance and Other Matters As part of obtaining reasonable assurance about whether the City’s financial statements are free of material misstatement, we performed tests of its compliance with certain provisions of laws, regulations, contracts, and grant agreements, noncompliance with which could have a direct and material effect on the determination of financial statement amounts. However, providing an opinion on compliance with those provisions was not an objective of our audit, and accordingly, we do not express such an opinion. The results of our tests disclosed no instances of noncompliance or other matters that are required to be reported under Government Auditing Standards.
We noted certain matters that we reported to management of the City in a separate letter dated December 26, 2012.
The City’s responses to the findings identified in our audit are described in the accompanying schedule of findings and questioned costs. We did not audit the City’s responses and, accordingly, we express no opinion on them.
This report is intended solely for the information and use of the Mayor, members of the Board of Aldermen, City management, others within the City, and federal awarding agencies and pass-through entities and is not intended to be and should not be used by anyone other than these specified parties.
St. Louis, Missouri December 26, 2012

KPMG LLP Suite 900 10 South Broadway St. Louis, MO 63102-1761
KPMG LLP is a Delaware limited liability partnership, the U.S. member firm of KPMG International Cooperative (“KPMG International”), a Swiss entity.
3
Independent Auditors’ Report on Internal Control Over Financial Reporting and on Compliance and Other Matters Based on an Audit of Financial Statements
Performed in Accordance With Government Auditing Standards
Honorable Mayor and Members of The Board of Aldermen of the City of St. Louis, Missouri: We have audited the basic financial statements of Lambert – St. Louis International Airport (Airport), an enterprise fund of the City of St. Louis, Missouri (City), as of and for the year ended June 30, 2012, and have issued our report thereon dated December 10, 2012. We conducted our audit in accordance with auditing standards generally accepted in the United States of America and the standards applicable to financial audits contained in Government Auditing Standards, issued by the Comptroller General of the United States.
Internal Control over Financial Reporting
Management of the Airport is responsible for establishing and maintaining effective internal control over financial reporting. In planning and performing our audit, we considered the Airport’s internal control over financial reporting as a basis for designing our auditing procedures for the purpose of expressing our opinion on the financial statements, but not for the purpose of expressing an opinion on the effectiveness of the Airport’s internal control over financial reporting. Accordingly, we do not express an opinion on the effectiveness of the Airport’s internal control over financial reporting.
A deficiency in internal control over financial reporting exists when the design or operation of a control does not allow management or employees, in the normal course of performing their assigned functions, to prevent, or detect and correct misstatements on a timely basis. A material weakness is a deficiency, or combination of deficiencies, in internal control over financial reporting, such that there is a reasonable possibility that a material misstatement of the entity’s financial statements will not be prevented, or detected and corrected on a timely basis.
Our consideration of internal control over financial reporting was for the limited purpose described in the first paragraph of this section and was not designed to identify all deficiencies in internal control over financial reporting that might be deficiencies, significant deficiencies, or material weaknesses. We did not identify any deficiencies in internal control over financial reporting that we consider to be material weaknesses, as defined above.
Compliance and Other Matters
As part of obtaining reasonable assurance about whether the Airport’s financial statements are free of material misstatement, we performed tests of its compliance with certain provisions of laws, regulations, contracts, and grant agreements, noncompliance with which could have a direct and material effect on the determination of financial statement amounts. However, providing an opinion on compliance with those provisions was not an objective of our audit, and accordingly, we do not express such an opinion. The results of our tests disclosed no instances of noncompliance or other matters that are required to be reported under Government Auditing Standards.

4
This report is intended solely for the information and use of the Mayor, Board of Aldermen, City management, and federal awarding agencies and pass-through entities and is not intended to be and should not be used by anyone other than these specified parties.
St. Louis, Missouri December 10, 2012

KPMG LLP Suite 900 10 South Broadway St. Louis, MO 63102-1761
KPMG LLP is a Delaware limited liability partnership, the U.S. member firm of KPMG International Cooperative (“KPMG International”), a Swiss entity.
5
Independent Auditors’ Report on Internal Control Over Financial Reporting and on Compliance and Other Matters Based on an Audit of Financial Statements
Performed in Accordance With Government Auditing Standards
To the Board of Police Commissioners The Metropolitan Police Department of the City of St. Louis, Missouri:
We have audited the financial statements of the governmental activities, each major fund, and the aggregate remaining fund information of The Metropolitan Police Department of the City of St. Louis, Missouri (Department), a component unit of the City of St. Louis, Missouri, as of and for the year ended June 30, 2012, which collectively comprise the Department’s basic financial statements, and have issued our report thereon dated December 17, 2012. Our report on the basic financial statements was modified because the Department received 93% of the governmental activities revenues from the City of St. Louis, Missouri and 99% of the major fund (general fund) revenues from the City of St. Louis, Missouri for the year ended June 30, 2012. We conducted our audit in accordance with auditing standards generally accepted in the United States of America and the standards applicable to financial audits contained in Government Auditing Standards, issued by the Comptroller General of the United States. Internal Control Over Financial Reporting Management of the Department is responsible for establishing and maintaining effective internal control over financial reporting. In planning and performing our audit, we considered the Department’s internal control over financial reporting as a basis for designing our auditing procedures for the purpose of expressing opinions on the financial statements, but not for the purpose of expressing an opinion on the effectiveness of the Department’s internal control over financial reporting. Accordingly, we do not express an opinion on the effectiveness of the Department’s internal control over financial reporting. A deficiency in internal control over financial reporting exists when the design or operation of a control does not allow management or employees, in the normal course of performing their assigned functions, to prevent, or detect and correct misstatements on a timely basis. A material weakness is a deficiency, or combination of deficiencies, in internal control over financial reporting, such that there is a reasonable possibility that a material misstatement of the entity’s financial statements will not be prevented, or detected and corrected on a timely basis.
Our consideration of internal control over financial reporting was for the limited purpose described in the first paragraph of this section and was not designed to identify all deficiencies in internal control over financial reporting that might be deficiencies, significant deficiencies, or material weaknesses. We did not identify any deficiencies in internal control over financial reporting that we consider to be material weaknesses, as defined above. However, we identified a certain deficiency in internal control over financial reporting that we consider to be a significant deficiency and that is described in the accompanying schedule of findings and questioned costs as finding 2012-03. A significant deficiency is a deficiency, or combination of deficiencies, in internal control over financial reporting that is less severe than a material weakness, yet important enough to merit attention by those charged with governance.

6
Compliance and Other Matters As part of obtaining reasonable assurance about whether the Department’s financial statements are free of material misstatement, we performed tests of its compliance with certain provisions of laws, regulations, contracts, and grant agreements, noncompliance with which could have a direct and material effect on the determination of financial statement amounts. However, providing an opinion on compliance with those provisions was not an objective of our audit, and accordingly, we do not express such an opinion. The results of our tests disclosed no instances of noncompliance or other matters that are required to be reported under Government Auditing Standards. The Department’s response to the finding identified in our audit is described in the accompanying schedule of findings and questioned costs. We did not audit the Department’s response and, accordingly, we express no opinion on it. This report is intended solely for the information and use of the Board of Police Commissioners, Department management, and federal awarding agencies and pass-through entities and is not intended to be and should not be used by anyone other than these specified parties.
St. Louis, Missouri December 17, 2012

KPMG LLP Suite 900 10 South Broadway St. Louis, MO 63102-1761
KPMG LLP is a Delaware limited liability partnership, the U.S. member firm of KPMG International Cooperative (“KPMG International”), a Swiss entity.
7
Independent Auditors’ Report on Compliance With Requirements That Could Have a Direct and Material Effect on Each Major Program and on Internal Control Over
Compliance in Accordance With OMB Circular A-133
To the Honorable Mayor and Members of the Board of Aldermen City of St. Louis, Missouri:
Compliance
We have audited the City of St. Louis, Missouri’s compliance with the types of compliance requirements described in the U.S. Office of Management and Budget (OMB) Circular A-133 Compliance Supplement that could have a direct and material effect on each of the City of St. Louis, Missouri’s major federal programs for the year ended June 30, 2012. The City of St. Louis, Missouri’s major federal programs are identified in the summary of auditors’ results section of the accompanying schedule of findings and questioned costs. Compliance with the requirements of laws, regulations, contracts, and grants applicable to each of its major federal programs is the responsibility of the City of St. Louis, Missouri’s management. Our responsibility is to express an opinion on the City of St. Louis, Missouri’s compliance based on our audit.
The City of St. Louis, Missouri’s basic financial statements include the operations of the St. Louis Development Corporation, a discretely presented component unit, and St. Louis Area Agency on Aging, a department of the City of St. Louis, Missouri, which expended $15,516,230 and $3,101,856, respectively in federal awards during the year ended June 30, 2012, which are not included on the City of St. Louis, Missouri’s schedule of expenditures of federal awards for the year ended June 30, 2012. Our audit, described below, did not include the federal awards of St. Louis Development Corporation, because this discretely presented component unit engaged other auditors to perform an audit in accordance with the requirements of OMB Circular A-133, Audits of States, Local Governments, and Non-Profit Organizations. Additionally, our auditing procedures, described below, did not include the federal awards of St. Louis Area Agency on Aging, because this department engaged other auditors to perform an audit in accordance with the requirements of OMB Circular A-133, Audits of States, Local Governments, and Non-Profit Organizations.
We conducted our audit of compliance in accordance with auditing standards generally accepted in the United States of America; the standards applicable to financial audits contained in Government Auditing Standards, issued by the Comptroller General of the United States; and OMB Circular A-133, Audits of States, Local Governments, and Non-Profit Organizations. Those standards and OMB Circular A-133 require that we plan and perform the audit to obtain reasonable assurance about whether noncompliance with the types of compliance requirements referred to above that could have a direct and material effect on a major federal program occurred. An audit includes examining, on a test basis, evidence about the City of St. Louis, Missouri’s compliance with those requirements and performing such other procedures as we considered necessary in the circumstances. We believe that our audit provides a reasonable basis for our opinion. Our audit does not provide a legal determination of the City of St. Louis, Missouri’s compliance with those requirements.

8
In our opinion, the City of St. Louis, Missouri complied, in all material respects, with the compliance requirements referred to above that could have a direct and material effect on each of its major federal programs for the year ended June 30, 2012. However, the results of our auditing procedures disclosed instances of noncompliance with those requirements, which are required to be reported in accordance with OMB Circular A-133 and which are described in the accompanying schedule of findings and questioned costs as Findings 2012-04, 2012-05, 2012-06, 2012-07, 2012-08, 2012-09, 2012-10, and 2012-11.
Internal Control over Compliance
Management of the City of St. Louis, Missouri is responsible for establishing and maintaining effective internal control over compliance with the requirements of laws, regulations, contracts, and grants applicable to federal programs. In planning and performing our audit, we considered the City of St. Louis, Missouri’s internal control over compliance with the requirements that could have a direct and material effect on a major federal program to determine the auditing procedures for the purpose of expressing our opinion on compliance and to test and report on internal control over compliance in accordance with OMB Circular A-133, but not for the purpose of expressing an opinion on the effectiveness of internal control over compliance. Accordingly, we do not express an opinion on the effectiveness of the City of St. Louis, Missouri’s internal control over compliance.
Our consideration of internal control over compliance was for the limited purpose described in the preceding paragraph and was not designed to identify all deficiencies in internal control over compliance that might be significant deficiencies or material weaknesses and therefore, there can be no assurance that all deficiencies, significant deficiencies, or material weaknesses have been identified. However, as discussed below, we identified certain deficiencies in internal control over compliance that we consider to be material weaknesses and other deficiencies that we considered to be significant deficiencies.
A deficiency in internal control over compliance exists when the design or operation of a control over compliance does not allow management or employees, in the normal course of performing their assigned functions, to prevent, or detect and correct, noncompliance with a type of compliance requirement of a federal program on a timely basis. A material weakness in internal control over compliance is a deficiency, or combination of deficiencies, in internal control over compliance, such that there is reasonable possibility that material noncompliance with a type of compliance requirement of a federal program will not be prevented, or detected and corrected, on a timely basis. We consider the deficiencies in internal control over compliance described in the accompanying schedule of findings and questioned costs as Findings 2012-04, 2012-05, 2012-09, and 2012-10 to be material weaknesses.
A significant deficiency in internal control over compliance is a deficiency, or a combination of deficiencies, in internal control over compliance with a type of compliance requirement of a federal program that is less severe than a material weakness in internal control over compliance yet important enough to merit attention by those charged with governance. We consider the deficiencies in internal control over compliance described in the accompanying schedule of findings and questioned costs as Findings 2012-06, 2012-07, 2012-08, and 2012-11 to be significant deficiencies.
Schedule of Expenditures of Federal Awards
We have audited the financial statements of the governmental activities, the business-type activities, the aggregate discretely presented component units, each major fund, and the aggregate remaining fund information of the City of St. Louis as of and for the year ended June 30, 2012, and have issued our report thereon dated December 26, 2012 which contained unqualified opinions on those financial statements. Our report on the basic financial statements was modified because we did not audit the financial statements of the pension trust funds or the St. Louis Development Corporation. The assets and revenues (additions) of the pension trust funds represent 89% and 28% of the assets and revenues (additions), respectively, of the

9
aggregate remaining fund information. The assets and revenues of the St. Louis Development Corporation represent 56% and 16% of the assets and revenues, respectively, of the aggregate discretely presented component units. Our audit was conducted for the purpose of forming our opinions on the financial statements that collectively comprise the City of St. Louis’s basic financial statements. We have not performed any procedures with respect to the audited financial statements subsequent to December 26, 2012. The accompanying schedule of expenditures of federal awards is presented for purposes of additional analysis as required by OMB Circular A-133 and is not a required part of the basic financial statements. Such information is the responsibility of management and was derived from and relates directly to the underlying accounting and other records used to prepare the basic financial statements. The information has been subjected to the auditing procedures applied in the audit of the basic financial statements and certain additional procedures, including comparing and reconciling such information directly to the underlying accounting and other records used to prepare the basic financial statements or to the financial statements themselves, and other additional procedures in accordance with auditing standards generally accepted in the United States of America. In our opinion, the schedule of expenditure of federal awards is fairly stated in all material respects in relation to the basic financial statements as a whole.
The City of St. Louis, Missouri’s responses to the findings identified in our audit are described in the accompanying schedule of findings and questioned costs. We did not audit the City of St. Louis, Missouri’s responses, and accordingly, we express no opinion on the responses.
This report is intended solely for the information and use of the Mayor, members of the Board of Aldermen, City management, others within the City, and federal awarding agencies and pass-through entities and is not intended to be and should not be used by anyone other than these specified parties.
St. Louis, Missouri March 29, 2013

[This page intentionally left blank]

Federal Grantor/Federal Financial Assistance Pass Through FY12Program/Program Cluster Title Grantor Description Fund Center CFDA# Expenditures
UNITED STATES DEPARTMENT OF AGRICULTURE:
Child and Adult Care Food Program Missouri Department of Health CHILD AND ADULT FOOD PROGRAM 10.558 1167 8140500 10.558 130,325$ Missouri Department of Health CHILD AND ADULT FOOD PROG 1011-0910 1167 8140700 10.558 680,136
810,461
Summer Food Service Program for Children Missouri Department of Health & Senior Services SUMM FOOD SERV PROG 5159-9159 10.559 1166 7154101 10.559 2,375 Missouri Department of Health & Senior Services SUMM FOOD SERV PROG 51510-91510 10.559 1166 7154102 10.559 4,151 Missouri Department of Health & Senior Services SUMM FOOD SERV PROG 5158-9158 10.559 1166 7155000 10.559 762 Missouri Department of Health & Senior Services SUMMER FOOD SER PROG 051511-091511 10.559 1166 7155900 10.559 2,720 Missouri Department of Health & Senior Services SUMMER FOOD PRG 0411-0911 10.559 1167 8140600 10.559 308,267 Missouri Department of Health & Senior Services SUMMER FOOD PRG 0412-0912 1167 8140800 10.559 275,980
594,255
State Administrative Expenses for Child Nutrition Missouri Department of Health & Senior Services CHILD NUTRITION 050111-113012 10.560 1166 7192634 10.560 993 993
Total United States Department of Agriculture 1,405,709
UNITED STATES DEPARTMENT OF HOUSING AND URBAN DEVELOPMENT:
Community Development Block Grants/Entitlement Grants ----- Planning & Urban Design 08-90-02 1163 1414900 14.218 2,907 CDBG Entitlement Grants Cluster (Non-ARRA) ----- Grand Oak Hill 06-36-33 1163 1422633 14.218 (3,668)
----- LRA Housing Development Pool 06-33-55 1163 1422655 14.218 (1) ----- Mcel Carr Square 1163 1424137 14.218 (334) ----- LCRS 2008 Acquisition Pool 1163 1424356 14.218 125,000 ----- Beyond Housing Healthy Home 08-36-22 1163 1424622 14.218 (6,935)
CITY OF ST. LOUIS, MISSOURISchedule of Expenditures of Federal Awards
Year ended June 30, 2012
----- YEAR 37 REVENUE & 108 PAYMENT 14.218 1165 1227900 14.218 1,397,454 ----- YEAR 38 REVENUE & 108 PAYMENT 14.218 1165 1228900 14.218 33,020 ----- CITY COUNSELOR PROB PROP 11-10-63 1165 1397100 14.218 91,242 ----- CITY COUNSELOR LEGAL SVCS 11-90-03 1165 1397900 14.218 106,748 ----- CITY COUNSELOR PROB PROP 12-10-63 1165 1398100 14.218 114,163 ----- CITY COUNSELOR LEGAL SVCS 12-90-03 1165 1398900 14.218 119,328 ----- PDA ADMINISTRATION 10-90-02 1165 1416900 14.218 12,832 ----- PDA ADMINISTRATION 11-90-02 1165 1417900 14.218 681,668 ----- PDA ADMINISTRATION 12-90-02 1165 1418900 14.218 671,000 ----- UJAMA COMMUNITY CTR 09-21-93 1165 1425293 14.218 91,169 ----- CDA HOUSING PRODUCTION PROG 09-35-02 1165 1425300 14.218 70,000 ----- BEYOND HOUSING HEALTHY HM 09-36-22 1165 1425622 14.218 (6,325) ----- GRAND OAK HILL HOUSING PROGRAM 09-36-33 1165 1425633 14.218 3,962 ----- SLD LRA HOUSING ACQUIS 09-33-55 1165 1425655 14.218 65,360 ----- JUNIOR STAFF DEVELOP 14.218 10-11-31 1165 1426131 14.218 (1) ----- CDA HOUSING PRODUCTION PROG 10-35-02 1165 1426300 14.218 31,863 ----- REBUILD STL TOGETHER 10-36-12 1165 1426312 14.218 1,710 ----- THE ACTS PARTNERSHIP PROGRAM 10-36-17 1165 1426317 14.218 (239) ----- SENIOR HOME SECURITY 10-36-21 1165 1426321 14.218 51,830 ----- DUTCHTOWN SOUTH CBDO 10-31-53 1165 1426353 14.218 5,000 ----- VASHON-JEFF VANDER LOU CBDO 10-36-66 1165 1426366 14.218 15,090 ----- NEIGHBORHOOD COMMERCIAL DIST 10-50-03 1165 1426503 14.218 (20,214) ----- RIVERVIEW HOME REPAIR 10-36-55 1165 1426605 14.218 204,366 ----- GRAND OAK HILL HOUSING PROGRAM 10-36-33 1165 1426633 14.218 15,290 ----- SLDC PROPERTY BOARD UP/MAINT 10-70-35 1165 1426735 14.218 (9,011) ----- STL DEVELOP ADMIN ECONOMIC DEV 10-90-90 1165 1426990 14.218 (13,870)
(continued)10

Federal Grantor/Federal Financial Assistance Pass Through FY12Program/Program Cluster Title Grantor Description Fund Center CFDA# Expenditures
CITY OF ST. LOUIS, MISSOURISchedule of Expenditures of Federal Awards
Year ended June 30, 2012
----- LRA ACQUISITION POOL 11-33-55 1165 1427055 14.218 225,457 ----- WOMEN AGAINST HARDSHIP 11-10-04 1165 1427104 14.218 20,729 ----- COVAM COCHRAN OUTREACH 3101210 11-14-90 1165 1427109 14.218 12,751 ----- FAMILY CARE HEALTH CTR 11-13-10 1165 1427110 14.218 17,330 ----- HERBERT HOOVER BOYS & GIRLS CLUB 1165 1427131 14.218 139,783 ----- MCELROY DAY CARE 11-11-37 1165 1427137 14.218 7,050 ----- CATHOLIC CHARITIES HSNG RESOURCE 111412 1165 1427142 14.218 144,393 ----- ST ELIZABETH ADULT CARE PROG 11-12-43 1165 1427143 14.218 6,763 ----- YOUTH FAMILY CTR - ENRICHMENT 11-11-50 1165 1427150 14.218 15,943 ----- UNION SARAH SENIOR CENTER 11-12-51 1165 1427151 14.218 9,330 ----- HI POINTE CENTER 11-10-55 1165 1427155 14.218 45,965 ----- COMMUNITY EDUCATION CENTERS 11-10-60 1165 1427160 14.218 449,928 ----- BEVO SENIOR SERVICES 11-12-65 1165 1427165 14.218 58,940 ----- METRO STL EQUAL HSNG COUNCIL 11-10-69 1165 1427169 14.218 8,177 ----- CARONDELET FAM LITERACY 11-10-81 1165 1427181 14.218 355 ----- HARAMBEE YOUTH 11-11-89 1165 1427189 14.218 21,117 ----- HARAMBEE YOUTH JOB TRAINING 11-11-93 1165 1427193 14.218 39,682 ----- BIG BROS-BIG SISTERS URBAN EXP 11-11-94 1165 1427194 14.218 3,300 ----- JUNIOR STAFF DEVELOP 11-11-31 1165 1427194 14.218 2,400 ----- BETTER FAM LIFE URB RHYSUMPRO 11-11-95 1165 1427195 14.218 12,319 ----- ST LOUIS GATEWAY CLASSIC 11-26-77 1165 1427277 14.218 3,079 ----- CDA HOUSING PRODUCTION PROG 11-35-02 1165 1427300 14.218 180,000 ----- DESALES COMMUNITY 11-31-09 1165 1427309 14.218 59,471 ----- VASHON JVL HOME REPAIR PROGRAM 11-36-11 1165 1427311 14.218 10,910 ----- REBUILD STL TOGETHER 11-36-12 1165 1427312 14.218 184,403 ----- RIVERVIEW-WEST FLORISSANT TMAP 11-36-13 1165 1427313 14.218 10,117 ----- VASHON JEFF VANDER LOU TMAP 11-36-15 1165 1427315 14.218 26,601 ----- HAMILTON HEIGHTS MAP 11-36-16 1165 1427316 14.218 5,355 ----- THE ACTS PARTNERSHIP PROGRAM 11-36-17 1165 1427317 14.218 77,214 ----- SENIOR HOME SECURITY 11-36-21 1165 1427321 14.218 591,984 ----- SHAW NEIGHBORHOOD HSNG CORP 11-31-24 1165 1427324 14.218 36,310 ----- SOUTHWEST GARDEN NEIGHBORHOOD 11-31-30 1165 1427330 14.218 22,134 ----- CARONDELET COMM BETTERMENT 11-36-31 1165 1427331 14.218 78,357 ----- GRAND OAK HILL CBDO & MAP 11-31-33 1165 1427333 14.218 114,742 ----- SKINKER DEBALIVIERE CBDO 11-31-40 1165 1427340 14.218 19,633 ----- HAMILTON HEIGHTS NEIGH ASSOC 11-31-48 1165 1427348 14.218 53,666 ----- OLD NORTH ST LOUIS CBDO 11-31-52 1165 1427352 14.218 26,088 ----- DUTCHTOWN SOUTH CBDO 11-31-53 1165 1427353 14.218 51,977 ----- RIVERVIEW WEST FLORISSANT CBDO 11-31-55 1165 1427355 14.218 131,374 ----- PARK CENTRAL DEVELOPMENT 11-31-65 1165 1427365 14.218 101,333 ----- VASHON-JEFF VANDER LOU CBDO 11-36-66 1165 1427366 14.218 249,920 ----- COMMUNITY RENEWAL CBDO/MAP 11-31-71 1165 1427371 14.218 78,404 ----- BETTER FAMILY LIFE NEIGH ASSOC 11-31-72 1165 1427372 14.218 102,677 ----- GREATERVILLE NEIGH PRESERV 11-31-73 1165 1427373 14.218 131,761 ----- UJAMMA CBDO 11-31-74 1165 1427374 14.218 42,330 ----- HYDE PARK OUTREACH 11-31-77 1165 1427377 14.218 37,308 ----- CDA REHAB ADMINISTRATION 11-32-01 1165 1427400 14.218 272,293 ----- NEIGHBORHOOD COMMERCIAL DIST 11-50-03 1165 1427503 14.218 1,572,130 ----- SLDC BUS DEV SUPPORT 11-50-06 1165 1427506 14.218 212,888 ----- GRAND OAK HILL HOUSING PROGRAM 11-36-33 1165 1427633 14.218 72,330 ----- RIVERVIEW WFLOR HOME RPR 11-36-55 1165 1427655 14.218 79,077 ----- COMMUNITY RENEWAL HOME REP 11-36-71 1165 1427671 14.218 49,840 ----- SLDC MAJOR PROJECT ADMIN 11-32-02 1165 1427702 14.218 164,714 ----- SLDC PROPERTY BOARD UP/MAINT 11-70-35 1165 1427735 14.218 38,032
(continued)11

Federal Grantor/Federal Financial Assistance Pass Through FY12Program/Program Cluster Title Grantor Description Fund Center CFDA# Expenditures
CITY OF ST. LOUIS, MISSOURISchedule of Expenditures of Federal Awards
Year ended June 30, 2012
----- CDA ADMINISTRATION 11-90-00 1165 1427900 14.218 725,751 ----- STL DEVELOP ADMIN ECONOMIC DEV 11-90-90 1165 1427990 14.218 157,368 ----- WOMEN AGAINST HARDSHIP 12-10-04 1165 1428104 14.218 27,628 ----- FAMILY CARE HEALTH CTR 12-13-10 1165 1428110 14.218 18,500 ----- VAUGHN TNT ASSOC ELMER HAMM 12-11-36 1165 1428136 14.218 8,550 ----- CATHOLIC CHARITIES HSNG RES 12-14-12 1165 1428142 14.218 124,290 ----- ST ELIZABETH ADULT CARE PROG 12-12-43 1165 1428143 14.218 7,700 ----- HI POINTE CENTER 12-10-55 1165 1428155 14.218 47,912 ----- COMMUNITY EDUCATION CENTERS 12-10-60 1165 1428160 14.218 132,459 ----- BEVO SENIOR SERVICES 12-12-65 1165 1428165 14.218 29,625 ----- METRO STL EQUAL HSNG COUNCIL 12-10-69 1165 1428169 14.218 28,097 ----- COMMUNITY HEALTH-IN-PARTNERSHIP 12-13-79 1165 1428179 14.218 49,662 ----- ST LOUIS TAX ASSISTANCE 12-10-82 1165 1428182 14.218 8,532 ----- HARAMBEE YOUTH JOB TRAINING 12-11-93 1165 1428193 14.218 79,246 ----- BIG BROS-BIG SISTERS URBAN EXP 12-11-94 1165 1428194 14.218 57,000 ----- SLDC MAJOR PROJECT ADMIN 12-32-02 1165 1428302 14.218 103,908 ----- DESALES COMMUNITY 12-31-09 1165 1428309 14.218 70,938 ----- RIVERVIEW-WEST FLORISSANT TMAP 12-36-13 1165 1428313 14.218 40,218 ----- VASHON JEFF VANDER LOU TMAP 12-36-15 1165 1428315 14.218 89,335 ----- HAMILTON HEIGHTS MAP 12-36-16 1165 1428316 14.218 44,338 ----- THE ACTS PARTNERSHIP PROGRAM 12-36-17 1165 1428317 14.218 80,505 ----- SENIOR HOME SECURITY 12-36-21 1165 1428321 14.218 340,913 ----- SHAW NEIGHBORHOOD HSNG CORP 12-31-24 1165 1428324 14.218 28,446 ----- SOUTHWEST GARDEN NEIGHBORHOOD 12-31-30 1165 1428330 14.218 19,412 ----- CARONDELET COMM BETTERMENT 12-36-31 1165 1428331 14.218 92,265 ----- GRAND OAK HILL CBDO & MAP 12-31-33 1165 1428333 14.218 118,197 ----- SKINKIER DEBALIVIERE CBDL 12-31-40 1165 1428340 14.218 28,031 ----- HAMILTON HEIGHTS NEIGH ASSOC 12-31-48 1165 1428348 14.218 56,383 ----- OLD NORTH ST LOUIS CBDL 12-31-52 1165 1428352 14.218 21,072 ----- DUTCHTOWN SOUTH CBDO 12-31-53 1165 1428353 14.218 18,856 ----- RIVERVIEW WEST FLORISSANT CBDL 12-31-55 1165 1428355 14.218 144,796 ----- PARK CENTRAL DEVELOPMENT 12-31-65 1165 1428365 14.218 104,066 ----- VASHON-JEFF VANDER LOU CBDO 12-36-66 1165 1428366 14.218 223,213 ----- COMMUNITY RENEWAL CBDO/MAP 12-31-71 1165 1428371 14.218 57,027 ----- BETTER FAMILY LIFE NEIGH ASSOC 12-31-72 1165 1428372 14.218 52,781 ----- GREATERVILLE NEIGH PRESERV 12-31-73 1165 1428373 14.218 110,540 ----- UJAMMA CBDO 12-31-74 1165 1428374 14.218 60,370 ----- CDA REHAB ADMINISTRATION 12-32-01 1165 1428400 14.218 163,875 ----- NEIGHBORHOOD COMMERCIAL DIST 12-50-03 1165 1428503 14.218 385,725 ----- SLDC BUS DEV SUPPORT 12-50-06 1165 1428506 14.218 622,482 ----- RIVERVIEW WFLOR HOME RPR 12-36-55 1165 1428655 14.218 115,347 ----- SLDC PROPERTY BOARD UP/ MAINT 12-70-35 1165 1428735 14.218 251,650 ----- CDA ADMINISTRATION 12-90-00 1165 1428900 14.218 573,080 ----- STL DEVELOP ADMIN ECONOMIS DEV 12-90-90 1165 1428990 14.218 146,882 ----- INTERNAL AUD/FISCAL MON 10-90-05 1165 1606900 14.218 (31,075) ----- FEDERAL GRANTS ADM SUPPORT 10-90-04 1165 1606999 14.218 (4,853) ----- INTERNAL AUD/FISCAL MON 11-90-05 1165 1607900 14.218 85,813 ----- FEDERAL GRANTS ADM SUPPORT 11-90-04 1165 1607999 14.218 38,829 ----- INTERNAL AUDIT/FISCAL MON 12-90-05 1165 1608900 14.218 53,265 ----- INTERNAL AUDIT/FISCAL MON 12-90-05 1165 1608999 14.218 16,882 ----- EXPANDED RECREATION SERV PROG 11-11-85 1165 2137100 14.218 156,436 ----- EXPANDED RECREATION SERV PROG 12-11-85 1165 2138100 14.218 129,187 ----- OPERATION BRIGHTSIDE 10-10-35 1165 2156100 14.218 2,227 ----- OPERATION BRIGHTSIDE 11-10-35 1165 2157100 14.218 154,644
(continued)12

Federal Grantor/Federal Financial Assistance Pass Through FY12Program/Program Cluster Title Grantor Description Fund Center CFDA# Expenditures
CITY OF ST. LOUIS, MISSOURISchedule of Expenditures of Federal Awards
Year ended June 30, 2012
----- OPERATION BRIGHTSIDE 12-10-35 1165 2158100 14.218 133,655 ----- PROBLEM PROPERTY TEAM CTY CRTS 11-10-64 1165 3167100 14.218 18,891 ----- INNOVATIVE CONCEPT SCHOOL 09-11-08 1165 3205100 14.218 30,027 ----- INNOVATIVE CONCEPT SCHOOL 12-11-08 1165 3208100 14.218 130 ----- HEALTHY HOME REPAIR 11-36-20 1165 6207300 14.218 155,354 ----- HEALTHY HOME REPAIR 12-36-20 1165 6208300 14.218 140,512 ----- PROBLEM PROPERTY TEAM 11-10-65 1165 6227100 14.218 7,564 ----- PROBLEM PROPERTY TEAM 12-10-65 1165 6228100 14.218 4,135 ----- ACCESSIBLE BUSINESS LEAD(ABLE) 10-50-10 1165 8006500 14.218 2,500 ----- ACCESSIBLE BUSINESS LEAD(ABLE) 11-50-10 1165 8007500 14.218 6,000 ----- ELDERLY SERVICES (SLAAA) 12-12-40 1165 8008240 14.218 147,498 ----- BPS PARKS IMPROVEMENT 09-29-94 1165 9005200 14.218 67,858 ----- BPS NEIGHBORHOOD CAP IMPROV 10-29-95 1165 9006200 14.218 137,620 ----- BPS NEIGHBORHOOD CAP IMPROV 10-29-95 1165 9007200 14.218 49,073 ----- NSP HOUSING PROD 09-NSP-35-02 1164 1425301 14.218 37,031 ----- LRA/NSP LAND ACQUIS 09-NSP-33-55 14.218 1164 1425655 14.218 (10,172) ----- CDA NSP HOUSING PROG 10-NSP-35-02 1164 1426301 14.218 1,165,585 ----- 11-NSP-35-02 CDA HOUSING PRODUCTION PROG 1164 1427301 14.218 177,495 ----- NSP CDA REHAB WORK PROG 11-NSP-32-01 1164 1427401 14.218 66,436 ----- NSP CDA ADMIN WORK PROG 11-NSP-90-00 1164 1427901 14.218 37,900 ----- NSP CDA REHAB WORK PROG 12-NSP-32-01 1164 1428401 14.218 125,263 ----- NSP CDA ADMIN WORK PROG 12-NSP-90-00 1164 1428901 14.218 120,213
Total Community Development Block Grants/Entitlement Grants 18,869,462 CDBG Entitlement Grants Cluster (Non-ARRA)
Community Development Block Grant ARRA Entitlement Grants (CDBG-R) - ----- ARRA UJAMAA CBDO CDBGR-1 14.253 1164 1420001 14.253 (40,439) CDBG Entitlement Grants Cluster (ARRA) ----- ARRA CATH CHAR FOOD RECOV CDBGR3 14.253 1164 1420002 14.253 2,492
----- ARRA SLDC LACLEDE LANDING CDBRG5 14.253 1164 1420005 14.253 161,863 ----- ARRA SHAW ABANDON PORP 0110-0912 14.235 1164 1420008 14.253 90,565 ----- ARRA BFL CEB CENTER CDBG-R18 1164 1420018 14.253 696,831 ----- ARRA CDA HOUSING PROD CDBGR-19 14.253 1164 1420019 14.253 40,466 ----- ARRA CDA ADMIN & IMPLEM 11-REC-90-00 1164 1427902 14.253 33,550 ----- ARRA CDA ADMIN & IMPLEM 12-REC-90-00 1164 1428902 14.253 51,528 ----- ARRA BPS STIMULUS CBDGR-4 14.253 1164 9000004 14.253 1,605,755
Total Community Development Block Grants/Entitlement Grants 2,642,611 CDBG Entitlement Grants Cluster (ARRA)
Total Non-ARRA and ARRA-CDBG Entitlement Grants Cluster 21,512,073
Community Development Block Grants/State’s Program and Non-Entitlement Missouri Department of Economic Development NSP 2009 LRA ACQUIS 09-NSPST-33-55 1164 1425656 14.228 (9,688) Grants in Hawaii Missouri Department of Economic Development CDBGD-1 DISASTER HOUSING 1164 1426030 14.228 1,440,000
Missouri Department of Economic Development SLCC Train For Tomorrow CDBGD-2 1164 1426031 14.228 605,366 Missouri Department of Economic Development CDBGD-3 LRA ACQUISITION DISASTER FD 1164 1426055 14.228 1,058,000 Missouri Department of Economic Development NSP NSP3 ALLOCATIONS 10-NSPST-35-02 1164 1426302 14.228 2,344,141 Missouri Department of Economic Development 11-NSPST-35-02 2011-DN-03 1164 1427302 14.228 145,303
5,583,122
Emergency Shelter Grants Program ----- ESG DIRECT HMLS SVCS 14.231 0107-1208 1167 8002320 14.231 (3) ----- ESG DIRECT HMLS SVCS 14.231 0106-1206 1167 8008623 14.231 (1,309) ----- DIRECT HOMELESS SVCS FY 08 1167 8009821 14.231 1,311 ----- ESG ADMIN DHS 0109-1210 1167 8120300 14.231 5,081 ----- ESG ADMIN IAS 0109-1209 14.231 1167 8120351 14.231 (5,081) ----- ESG ADMIN 0110-1210 14.231 1167 8120500 14.231 18,548 ----- FESG Direct Svcs 0711-0612 1167 8120536 14.231 4,587
(continued)13

Federal Grantor/Federal Financial Assistance Pass Through FY12Program/Program Cluster Title Grantor Description Fund Center CFDA# Expenditures
CITY OF ST. LOUIS, MISSOURISchedule of Expenditures of Federal Awards
Year ended June 30, 2012
----- FESG DHS ADMIN 0111-0513 14.231 1167 8120800 14.231 (710) ----- FESG Places for People 0111-1211 1167 8120802 14.231 11,116 ----- FESG HAVEN OF GRACE 0111-1211 14.231 1167 8120805 14.231 4,056 ----- FESG HUMANITRI 0111-1211 14.231 1167 8120806 14.231 8,084 ----- FESG LYDIAS HOUSE 0111-1211 14.231 1167 8120807 14.231 7,317 ----- FESG MUNI INFO SYSTEMS 0111-1211 14.231 1167 8120808 14.231 40,010 ----- FESG Our Lady's Inn 0111-1211 1167 8120809 14.231 13,902 ----- FESG REDEV OPP FOR WOM 0111-1211 14.231 1167 8120812 14.231 27,409 ----- FESG Salvation Army Harbor Lt 1167 8120813 14.231 126,000 ----- FESG SHALOM HOUSE 0111-1211 14.231 1167 8120814 14.231 12,905 ----- FESG ST MARTHAS HALL 0111-1211 14.231 1167 8120816 14.231 20,882 ----- FESG ST PATRICK CENTER 0111-1211 14.231 1167 8120817 14.231 27,807 ----- FESG CATH CHAR HRC 0111-1211 14.231 1167 8120821 14.231 52,497 ----- FESG STL TRNS HOPE HOU 0111-1211 14.231 1167 8120822 14.231 17,858 ----- FESG COVENANT HOUSE 0111-1211 14.231 1167 8120823 14.231 4,647 ----- FESG WOMENS SAFE HOUSE 0111-1211 14.231 1167 8120824 14.231 13,747 ----- FESG Arch City Defenders FY11 1167 8120829 14.231 3,379 ----- FESG Direct Homeless Svcs 12.11 1167 8120836 14.231 2,395 ----- Gateway Homeless 1167 8121004 14.231 50,380 ----- Haven Of Grace 1167 8121005 14.231 8,962 ----- Humanitri 1167 8121006 14.231 21,984 ----- Lydia's House 1167 8121007 14.231 23,230 ----- Municipal Information 1167 8121008 14.231 6,167 ----- Peter & Paul Community 1167 8121010 14.231 10,145 ----- Redevelopment Opportunities 1167 8121012 14.231 21,515 ----- Shalom House 1167 8121014 14.231 17,629 ----- St Martha's Hall 1167 8121016 14.231 14,941 ----- ST PATRICK CENTER 1167 8121017 14.231 29,866 ----- Catholic Charities 1167 8121021 14.231 41,610 ----- St Louis Transitional Hope House 1167 8121022 14.231 8,629 ----- Women's Safe House 1167 8121024 14.231 13,705 ----- Arch City Defenders 1167 8121029 14.231 2,693
687,891
Supportive Housing Program ----- SHP-ADMIN 14.235 030106-043011 1167 8009900 14.235 8,191 ----- SHP ST PAT CTR ROSATI 1008-0911 1167 8009931 14.235 102,035 ----- SHP ADMIN DHS 0309-0912 1167 8110200 14.235 8,451 ----- SHP ST VIN DPAUL PPLUS 1209-1112 1167 8110236 14.235 342,642 ----- SHP Shalom House 1011-0912 1167 8110237 14.235 28,083 ----- SHP ADMIN 14.235 1009-1211 1167 8110600 14.235 55,625 ----- PETER & PAUL COMM SERV 802 0810-0711 1167 8110603 14.235 6,549 ----- METRO HOMELESS CTR 802 1010-0911 1167 8110607 14.235 51,489 ----- ST LOUIS TRANS HOPE HOUSE 802 1010-0911 1167 8110613 14.235 189,430 ----- DOORWAYS (MARYLAND) 802 0111-1211 1167 8110623 14.235 332,940 ----- DOORWAYS (DELMAR) 901 1010-0911 1167 8110624 14.235 13,207 ----- DOORWAYS (JUMP START) 901 1110-1011 1167 8110625 14.235 82,751 ----- ST PATRICK CTR (PJP HOUSI) 901 1009-0911 1167 8110626 14.235 61,558 ----- SHP PLACES FOR PEOPLE 1110-1011 14.235 1167 8110628 14.235 60,276 ----- EMPLOYMENT CONNECTION 802 1010-0911 1167 8110634 14.235 38,761 ----- SHP Gateway Homeless 1011-0914 1167 8110635 14.235 71,434 ----- Catholic Charities 1167 8110636 14.235 96,468 ----- SHP Administration 1009-1211 1167 8111000 14.235 36,887 ----- SHP Humanitri Mentoring 0711-0612 1167 8111102 14.235 195,811 ----- SHP Peter & Paul (Labre) 0811-0712 1167 8111003 14.235 263,219
(continued)14

Federal Grantor/Federal Financial Assistance Pass Through FY12Program/Program Cluster Title Grantor Description Fund Center CFDA# Expenditures
CITY OF ST. LOUIS, MISSOURISchedule of Expenditures of Federal Awards
Year ended June 30, 2012
----- SHP St Patrick Center (Employ) 0711-0612 1167 8111004 14.235 291,402 ----- SHP Shalom House 1011-0912 1167 8111007 14.235 181,282 ----- SHP St Phillippine Home 0711-0612 1167 8111010 14.235 584,290 ----- SHP St Louis Trans Hope House 1011-0912 1167 8111013 14.235 550,014 ----- SHP YWCM Metro St Louis 1167 8111020 14.235 76,597 ----- SHP Humanitri Anchors 0311-0212 1167 8111021 14.235 102,284 ----- SHP Doorways Maryland 0112-1212 1167 8111023 14.235 393,653 ----- SHP Doorways Delmar 0711-0612 1167 8111024 14.235 77,381 ----- SHP Doorways Jump Start 1111-1012 1167 8111025 14.235 154,589 ----- SHP St Patrick Center PHJ 1011-0912 1167 8111026 14.235 234,429 ----- SHP DD Resources Gr Horizans 0711-0612 1167 8111027 14.235 139,438 ----- SHP Places for People 1111-1012 1167 8110128 14.235 137,014 ----- SHP Covenant House 0711-0612 1167 8111030 14.235 253,513 ----- SHP St Patrick Rosati 1011-0912 1167 8111031 14.235 308,265 ----- SHP DD Resources Horizin Club 0711-0612 1167 8111032 14.235 186,193 ----- SHP St Vincent DePaul 0511-0412 1167 8111033 14.235 234,683 ----- SHP Employment Connection 1011-0912 1167 8111034 14.235 124,841 ----- SHP Humanitri 1167 8111221 14.235 62,148 ----- Society of St Vincent DePaul 1167 8111233 14.235 47,958
6,185,781
HOME Investment Partnership Program ----- HLTY HOME&CONST NHS 14.239 06-HM-36-22 1164 1422622 14.239 (46,897) ----- CARONDELET CBDO 07-HM36-31 1164 1423331 14.239 (3,225) ----- BEYOND HSG CONSTR MGT PROG 07-HM36-22 1164 1423622 14.239 39,518 ----- CDA HSNG PROG 14.239 08-HM-35-02 FY08 1164 1424300 14.239 (44,930) ----- GRAND-OAK HM PRG 14.239 08-HM-36-33 FY08 1164 1424633 14.239 (900) ----- CDA HOUSING PRODUCTION PROG 09-HM-35-02 1164 1425300 14.239 36,551 ----- CARONDELET COMM BETTERMENT 09-HM-36-31 1164 1425331 14.239 3,225 ----- GRAND OAK HILL HSNG 14.239 09-HM-36-33 1164 1425633 14.239 3,668 ----- CDA HOUSING PRODUCTION 10-HM-35-02 1164 1426300 14.239 4,290,230 ----- REBUILD STL TOGETHER 10-HM-36-12 14.239 1164 1426312 14.239 41,180 ----- HOME SERVICES 10-HM-36-21 14.239 1164 1426321 14.239 56,825 ----- CARONDELET COMM BETTERMENT 10-HM-36-31 1164 1426331 14.239 24,729 ----- CDA REHAB ADMIN 14.239 10-HM-32-01 1164 1426400 14.239 149 ----- GRAND OAK HILL HSNG 14.239 10-HM-36-33 1164 1426633 14.239 (3,962) ----- CDA HOUSING PRODUCTION 11-HM-35-02 1164 1427300 14.239 691,982 ----- HOME SERVICES 11-HM-36-21 14.239 1164 1427321 14.239 480,387 ----- CARONDELET COMM BETTERMENT 11-HM-36-31 1164 1427331 14.239 18,500 ----- CDA REHAB ADMIN 14.239 11-HM-32-01 1164 1427400 14.239 92,969 ----- GRAND OAK HILL HSNG 14.239 11-HM-36-33 1164 1427633 14.239 117,285 ----- CDA ADMINISTRATION 14.239 11-HM-00 1164 1427900 14.239 47,356 ----- HOME SERVICES 10-HM-36-21 14.239 1164 1428321 14.239 13,500 ----- CARONDELET COMM BETTERMENT 10-HM-36-31 1164 1428331 14.239 41,166 ----- CDA REHAB ADMIN 14.239 10-HM-32-01 1164 1428400 14.239 55,650 ----- RIVERVIEW HOME RPR 12-HM-36-55 14.239 1164 1428655 14.239 62,187 ----- CDA ADMINISTRATION 14.239 12-HM-00 1164 1428900 14.239 35,148 ----- LRA HSG DEV HOME 14.239 03-HM-33-55 1164 1429355 14.239 46
6,052,337
Housing Opportunities for Persons with AIDS ----- HOPWA 1/1/08-12/31/08 14.241 1166 7114653 14.241 (5,349) ----- HOPWA 010109-123109 14.241 1166 7117500 14.241 10,583 ----- DOORWAYS/HOPWA 010110-063011 14.241 1166 7118531 14.241 27,989 ----- Hopwa-Peter & Paul 0211-1211 14.241 1166 7118924 14.241 183,904
(continued)15

Federal Grantor/Federal Financial Assistance Pass Through FY12Program/Program Cluster Title Grantor Description Fund Center CFDA# Expenditures
CITY OF ST. LOUIS, MISSOURISchedule of Expenditures of Federal Awards
Year ended June 30, 2012
----- Hopwa-Doorways 0211-1211 14.241 1166 7118925 14.241 831,186 ----- HOPWA - DOORWAYS 1166 7119739 14.241 164,903 ----- HOPWA - PETER AND PAUL COMMUNITY 1166 7119740 14.241 80,660
1,293,876
Community Development Block Grants/Brownfields ----- CHEROKEE ST B-08-SP-MO-154 14.246 1164 9000154 14.246 8,903 Economic Development Initiative 8,903
Community Development Block Grants/Section 108 Loan Guarantee ----- Darst Webbe - Hope VI 1151 1224273 14.248 3,136 3,136
Homelessness Prevention and Rapid Re-Housing Program - ARRA ----- ARRA HPRP ADMIN 0709-0712 14.257 1167 8110300 14.257 105,943 ----- ARRA HPRP CATH CHAR HRC 1209-0712 14.257 1167 8110301 14.257 350,502 ----- ARRA HPRP HUMAN DEVEL 10-09 7-28-12 1167 8110302 14.257 116,940 ----- ARRA HPRP GRACE HILL 1009-072812 14.257 1167 8110303 14.257 822,532 ----- ARRA HPRP LEGAL SERV EMO 1009-712 14.257 1167 8110304 14.257 107,395 ----- ARRA HPRP MUNI INFORM 0709-0712 14.257 1167 8110305 14.257 39,526 ----- ARRA HPRP ST VINCENT DEP 1009-712 14.257 1167 8110306 14.257 (120,000) ----- ARRA HPRP URBAN LEAGUE 1009-0712 14.257 1167 8110307 14.257 345,012 ----- ARRA HPRP DIRCT HOMLESS 0709-0712 14.257 1167 8110308 14.257 459,477 Missouri Department of Social Services ARRA HPRP CATH CHR HRC 1209-0711 14.257 1167 8110501 14.257 119,204
2,346,531
Fair Housing Assistance Program - State and Local ----- HUD FHAP CREA K107019 14.401 1010-0911 1168 1261400 14.401 22,002 ----- HUD CREA P/SHIP FUNDS 0212-0912 14.401 1168 1261402 14.401 21,970 ----- HUD FHAP CREA K107019 14.401 1011-0912 1168 1261412 14.401 79,936
123,908
Lead-based Paint Hazard Control in Privately-Owned Housing ----- LD H2 CTL GR MGT PG 14.900 06-LHC-03 1164 1426003 14.900 145,128 ----- LD HZ CTL GRNT MGT PRG 14.900 08-LHC-04 1164 6208004 14.900 (10,295) ----- LEAD HAZARD CONTROL 08-LHC-01 1164 7168001 14.900 39,107
173,940
Lead Hazard Reduction Demonstration Grant Program ----- LD HZ INSP & PEM 14.905 06LHRD-01 1164 1421503 14.905 66,909 ----- LD HZ REDUCT DEM MGMT 14.905 08-LHRD-03 1164 1428503 14.905 258,102 ----- LD HZ REDUCT DEM MGMT 14.905 11-LHRD-04 1164 6201504 14.905 146,278 ----- LD HZ REDUCT DEM MGMT 14.905 08-LHRD-04 1164 6208504 14.905 219 ----- LEAD HAZARD REDUCTION 11-LHRD-01 1164 7161501 14.905 27,983 ----- LEAD HAZARD REDUCTION 08-LHRD01 1164 7168501 14.905 148,448
647,939
Total United States Department of Housing And Urban Development 44,619,437
UNITED STATES DEPARTMENT OF JUSTICE:
Shared Federally Forfeited Property Program ----- Asset Forfeiture - Police various various 16.000 412,896 ----- Asset Forfeiture - Airport 1112 4208000 16.000 103,923
516,819
(continued)16

Federal Grantor/Federal Financial Assistance Pass Through FY12Program/Program Cluster Title Grantor Description Fund Center CFDA# Expenditures
CITY OF ST. LOUIS, MISSOURISchedule of Expenditures of Federal Awards
Year ended June 30, 2012
Law Enforcement Assistance Narcotics & Dangerous Drug Training ----- Intelligence Anti Gang Task Force 1140 6501005 16.004 86,580 ----- Violent Crime/Fugitive Task Force 1140 6501008 16.004 172,487 ----- DEA Task Force 1140 6501010 16.004 104,671 ----- Public Corruption Task Force 1140 6501013 16.004 2,521 MO Highway Patrol Midwest HIDTA 1140 6501048 16.004 15,325 ----- US Marshalls Task Force 1140 6501162 16.004 34,038
415,622
Alcohol, Tobacco, & Firearms Training Assistance ----- ATF Task Force 1140 6501012 16.012 79,128 79,128
Federal Bureau of Investigations OCDETF ----- Organized Crime Drug Enforcement Task Force 1140 various 16.301 1,010 1,010
Anti-Terrorism Emergency Reserve ----- Joint Terrorism task Force 1140 6501078 16.321 33,543 Missouri Department of Transportation Buffer Zone Protection 1140 6502018 16.321 177,296
210,839
Juvenile Accountability Block Grant (JABG) Misouri Department of Public Safety JABG DIRECTOR OFFICE 16.523 1169 6223700 16.523 107,333 Misouri Department of Public Safety JABG Nightwatch SLPMD 1010-0911 1169 6224200 16.523 208 Misouri Department of Public Safety JABIG police Dept 100107-093008 16.523 1169 6224300 16.523 55,829 Misouri Department of Public Safety JABG Nightwatch Juvenile Court 1010-0911 1169 6224400 16.523 64,544 Misouri Department of Public Safety JABG Nightwatch SLPMD 1010-0911 1169 6224500 16.523 91,874 Misouri Department of Public Safety JBIG SLMPD Ngtw 100108 - 093009 16.523 1169 6224600 16.523 45,745 Misouri Department of Public Safety JUV ACT BLOCK GRANT 10109-93010 16.523 1169 6224700 16.523 70,443 City of St. Louis Public Safety Juvenile Accountability 1140 6501082 16.523 130,280
566,256
Juvenile Justice and Delinquency Prevention_Allocation to States ----- Out of Home 16.540 0702-0603 1168 3201500 16.540 3,381 3,381
National Institute of Justice Research, Evaluation, & Development Missouri Department of Public Safety MO Crime Lab Upgrade (MCLUP 2010) 1140 6502003 16.564 126,878 Project Grants 126,878
Crime Victim Assistance Missouri Department of Public Safety VOCA 2010 VICTIM CRIME 1010-0911 16.575 1168 3124900 16.575 45,839 Missouri Department of Public Safety SSVF Victim Services 0711-0613 16.575 1168 3125200 16.575 93,944 Missouri Department of Public Safety VOCA Victim Service Adv 1011-0912 16.575 1168 3125300 16.575 134,865
274,648
Edward Bryne Memorial Formula Grant Program - Non-ARRA Missouri Department of Public Safety Narcotics Control Assistance Programs (Non-ARRA) 1140 6502005 16.579 195,075 195,075
Edward Bryne Memorial Formula Grant Program (Rocovery Act) - ARRA Missouri Department of Public Safety ARRA-Narcotics Control Assistance Programs 1140 6502007 16.579 42,550 42,550
Total Non-ARRA and ARRA - Edward Bryne Memorial Formula Grant Program 237,625
Violence Against Women Formula Grants - Non-ARRA Missouri Department of Public Safety Domestice Abuse Response Team (D.A.R.T.) 1140 6501066 16.588 34,961 Missouri Department of Public Safety VAWA Victim Svcs 16.588 1168 3125000 16.588 24,336 ----- DOJ - Volence Women 2004WEAX0069 16.588 1169 3202800 16.588 151,124
210,421
(continued)17

Federal Grantor/Federal Financial Assistance Pass Through FY12Program/Program Cluster Title Grantor Description Fund Center CFDA# Expenditures
CITY OF ST. LOUIS, MISSOURISchedule of Expenditures of Federal Awards
Year ended June 30, 2012
Violence Against Women Formula Grants (Recovery Act) - ARRA Missouri Department of Public Safety ARRA-VOCA 010112-123112 16.588 1168 3125400 16.588 129,170 129,170
Total Non-ARRA and ARRA - Violence Against Women Formula Grants 339,591
Grants to Encourage Arrest Policies and Enforcement of Protection Orders Program St. Louis Family Court Enforcement of Protection Orders 1140 6501146 16.590 111,715 111,715
Community Capacity Development Office ----- Weed & Seed 1140 6501076 16.595 69,782 69,782
Community Prosection and Project Safe Neighborhoods ----- Project Safe Neighborhoods 2010 1140 6501009 16.609 30,725 ----- Project Safe Neighborhoods 2008 1140 6501166 16.609 1,093
31,818
Immigration & Custom Enforcement ----- Immigration & Customs Enforcement 1140 6501017 16.614 2,625 2,625
Public Safety Partnership and Community Policing Grants - ARRA ----- ARRA Cops Hiring Recovery Grant 1140 6501003 16.710 2,584,742 2,584,742
Public Safety Partnership and Community Policing Grants - Non-ARRA ----- In Car Video System 1140 6501175 16.710 101,512 101,512
Total Non-ARRA and ARRA - Public Safety Partnership and Community Policing Grants 2,686,254
Gang Resistance Education and Training Missouri Department of Public Safety Underage Drinking Grant 1140 6502022 16.737 13,652 13,652
Edward Byrne Memorial Justice Assistance Grant Program - ------ JAG-Domestic Violence 0710-0611 2009-JAG-019 1168 3124700 16.738 235 Justice Assistance Grant (JAG) Grant Program Cluster - Non-ARRA ------ JAG-DMSTC Violence Inv 0711-0612 16.738 1168 3125100 16.738 33,803
------ JAG-Envir Task Frc 16.738 100107-09302011 1169 6222750 16.738 14,292 ------ JAG-Gang Abate 16.738 100107-09302011 1169 6222760 16.738 2,460 ------ JAG-CITY COUNSELOR 10109-93012 16.738 1169 6223800 16.738 64,274 ------ JAG-CIRCUIT ATTORNEY 10109-93012 16.738 1169 6223900 16.738 133,576 ------ JAG-CRIME VICTIM ADV CTR 10109-093012 16.738 1169 6224000 16.738 50,081 ------ JAG Rodger Gibson 0612-0914 16.738 1169 6224836 16.738 1,037 ------ JAG Anthony Caruso 0612-0914 16.738 1169 6224837 16.738 2,080
301,838
Edward Byrne Memorial Justice Assistance Grant Program - ------ ARRA CIRCUIT ATTORNEY'S DRUG/CRIME 1169 6223000 16.738 410,133 Justice Assistance Grant (JAG) Grant Program Cluster - ARRA ------ ARRA FAMILY COURT 1169 6223100 16.738 506,607
------ ARRA CIRCUIT ATTONEY ARCH REC SYS 1169 6223200 16.738 5,213 ------ ARRA YOUTH EMPOWERMENT SERVICES 1169 6223300 16.738 121,953 ------ ARRA 22ND JUDICIAL DRUG COURT 1169 6223400 16.738 506,936 ------ ARRA Environmental Quality Inv 1169 6223600 16.738 1,063 ------ ARRA RONALD HASTY 100109-093010 1169 6223601 16.738 23,352 ------ ARRA MICHAEL DEEBA 100109-093010 16.738 1169 6223602 16.738 17,888 ------ ARRA LARRY RICHARDS 100109-093010 16.738 1169 6223603 16.738 6,217 ------ ARRA RODGER GIBSON 100109-093010 16.738 1169 6223604 16.738 15,576 ------ ARRA STEVEN TUCKER 100109-093010 16.738 1169 6223605 16.738 12,064 ------ ARRA Vernon Taylor 100109-093010 1169 6223609 16.738 2,444
(continued)18

Federal Grantor/Federal Financial Assistance Pass Through FY12Program/Program Cluster Title Grantor Description Fund Center CFDA# Expenditures
CITY OF ST. LOUIS, MISSOURISchedule of Expenditures of Federal Awards
Year ended June 30, 2012
------ ARRA-JAG R. Sheetz 0711-0912 16.738 1169 6223610 16.738 16,125 ------ ARRA-JAG R. Sheetz 0711-0912 16.738 1169 6223611 16.738 13,000 ------ ARRA Jag Mark Meyers 0711-0612 16.738 1169 6223612 16.738 9,155
1,667,726
Total Non-ARRA and ARRA-Edward Byrne Memorial Justice Assistance 1,969,564 Grant Program - Justice Assistance Grant (JAG) Grant Program Cluster
Forensic DNA Backlog Reduction Program ----- DNA Backlog 2010 1140 6501177 16.741 250,444 ----- Coverdell Forensic Science 2011 1140 6501178 16.741 47,569 ----- DNA Backlog 2011 1140 6501179 16.741 208,752
506,765
Paul Coverdell Forensic Sciences Improvement Grant Program ----- Coverdell - Reimbursed Travel 1140 6502009 16.742 148,848 148,848
Economic High Tech & Cyber Crime Prevention ----- Financial Crimes Task Force 1140 6501148 16.752 6,349 6,349
Congressionally Recommended Awards ----- BJA Patrol Vehicles 1140 6501011 16.753 253,789 253,789
Internet Crimes against Childrens Task Force - ARRA ----- ARRA - Internet Crime for Children Regional 1140 6501001 16.800 51,964 51,964
Second Chance Act Prisoner Reentry Initiative ----- Prisoner Re-Entry Program 1140 6501176 16.812 72,910 72,910
Total United States Department of Justice 8,697,832
UNITES STATES DEPARTMENT OF LABOR:
Workforce Investment Act (WIA) Cluster-Adult Program - (Non-ARRA) Missouri Department of Economic Development WIA Admin Adult 0710-0611 1162 1210101 17.258 10,164 Missouri Department of Economic Development WIA 15% ADT ACC 126-11 0111-1211 1162 1210126 17.258 7,709 Missouri Department of Economic Development DWD 15% Admin Adult BB 0710-0611 1162 1210131 17.258 7 Missouri Department of Economic Development DWD 15% Admin Adult FSC 0710-0611 1162 1210141 17.258 247 Missouri Department of Economic Development WIA Adult Formula 0710-0611 1162 1210161 17.258 44,962 Missouri Department of Economic Development WIA ADMIN-ADULT 0712-0613 17.258 1162 1212610 17.258 8 Missouri Department of Economic Development WIA ADULT FORMULA 0712-0613 17.258 1162 1212661 17.258 107 Missouri Department of Economic Development WIIA Admin - adult 0711-0612 17.258 1162 1216501 17.258 131,937 Missouri Department of Economic Development WIA ADULT SLCC 107-12 0412-0612 17.258 1162 1216507 17.258 2,104 Missouri Department of Economic Development WIA 15% AD ACCESS 126-12 0112-612 17.258 1162 1216526 17.258 4,655 Missouri Department of Economic Development WIA Adult Dese 102-12-711-612 17.25 1162 1216560 17.258 17,042 Missouri Department of Economic Development WIA Adult Formula 0710-0611 1162 1216561 17.258 868,457 Missouri Department of Economic Development WIA Adult m/GDWL 112-12 711-612 17.258 1162 1216562 17.258 57,000 Missouri Department of Economic Development WIA Adult SLCC 103-12 0711-0612 17.258 1162 1216563 17.258 378,301 Missouri Department of Economic Development WIA Adult SLCOIC 141-12 0711-0612 17.258 1162 1216564 17.258 10,000 Missouri Department of Economic Development WIA OJT-ADULT FY12 0711-0612 17.258 1162 1216565 17.258 5,676 Missouri Department of Economic Development WIA ITA Adult 0711-0612 17.258 1162 1216569 17.258 41,090 Missouri Department of Economic Development WIA In-House Feeder Payroll Dist 07-08 1162 1600700 17.258 31,365
1,610,831
(continued)19

Federal Grantor/Federal Financial Assistance Pass Through FY12Program/Program Cluster Title Grantor Description Fund Center CFDA# Expenditures
CITY OF ST. LOUIS, MISSOURISchedule of Expenditures of Federal Awards
Year ended June 30, 2012
Workforce Investment Act (WIA) Cluster-Youth Activities (Non-ARRA) Missouri Department of Economic Development WIA Admin-Youth 0710-0611 1162 1210701 17.259 11,509 Missouri Department of Economic Development WIA Youth Mers SPYC 212-11 0211-1111 1162 1210723 17.259 31,465 Missouri Department of Economic Development WIA 15 % Youth ACC 126-11 111-1211 1162 1210726 17.259 9,103 Missouri Department of Economic Development DWD 15% Admin Youth BB 0710-0611 1162 1210731 17.259 9 Missouri Department of Economic Development DWD 15% Admin Youth FSC 0710-0611 1162 1210741 17.259 291 Missouri Department of Economic Development WIA Youth In-School 0710-0611 1162 1210761 17.259 5,668 Missouri Department of Economic Development WIA Youth Out-of-School 0710-0611 1162 1210771 17.259 7,042 Missouri Department of Economic Development WIA Summer In-School Youth 0710-0611 1162 1210781 17.259 5,803 Missouri Department of Economic Development WIA Summer Out-of-School Outh 0710-0611 1162 1210791 17.259 348 Missouri Department of Economic Development WIA ADMIN-YOUTH 0712-0613 17.259 1162 1212711 17.259 9 Missouri Department of Economic Development WIA YTH I/S 0712-0613 17.259 1162 1212761 17.259 3 Missouri Department of Economic Development WIA YTH O/S 0712-0613 17.259 1162 1212771 17.259 3 Missouri Department of Economic Development WIA Admin Youth 0711-0612 17.259 1162 1216601 17.259 171,866 Missouri Department of Economic Development WIA 15% YO ACCESS 126-12 0112-612 17.259 1162 1216626 17.259 8,407 Missouri Department of Economic Development WIA YTH O/S BFL 231-12 711-612 17.259 1162 1216660 17.259 256,308 Missouri Department of Economic Development WIA YTH IN-SCHL 0711-0612 172.59 1162 1216661 17.259 147,104 Missouri Department of Economic Development WIA YTH I/S M/GDWL 211-12 711-612 17.259 1162 1216662 17.259 195,140 Missouri Department of Economic Development WIA YTH I/S SLCC 1032-12 0711-0612 17.259 1162 1216663 17.259 157,488 Missouri Department of Economic Development WIA YTH I/S SLCC 906-12 0711-0612 17.259 1162 1216666 17.259 9,431 Missouri Department of Economic Development WIA YTH OUT-OF-SCHL 0711-0612 17.259 1162 1216671 17.259 186,568 Missouri Department of Economic Development WIA YTH O/S M/GDWL 212-12 711-612 17.259 1162 1216672 17.259 213,781 Missouri Department of Economic Development WIA YTH O/S SLCC 103-12 0711-0612 17.259 1162 1216673 17.259 104,994 Missouri Department of Economic Development WIA YTH O/S SLCC 906-12 0711-0612 17.259 1162 1216676 17.259 6,291 Missouri Department of Economic Development WIA YTH SUMMER I/S 0711-0612 17.259 1162 1216681 17.259 258,534 Missouri Department of Economic Development WIA YTH SUMMER O/S 0711-0612 17.259 1162 1216691 17.259 34,939
1,822,104
Workforce Investment Act (WIA) Cluster-Dislocated Workers Missouri Department of Economic Development WIA Admin-Dis Worker 0710-0611 1162 1210801 17.260 5,597 (Non-ARRA) Missouri Department of Economic Development WIA Dis Worker Formula 0710-0611 1162 1210861 17.260 51,584
Missouri Department of Economic Development WIA admin in house 17.260 07/01/06-06-30-07 1162 1215601 17.260 394 Missouri Department of Economic Development Brac Implementation Neg Admin 17.260 1162 1218201 17.260 232 Missouri Department of Economic Development Chrysler Neg Admin 17.260 0108-1209 1162 1218701 17.260 379 Missouri Department of Economic Development Statewide Auto NEG 0109-0210 1162 1219601 17.260 162 Missouri Department of Economic Development WIA 15% D/W AcCC 126-11 0111-1211 1162 1210826 17.278 10,524 Missouri Department of Economic Development DWD 15% Admin Dis Worker BB 0710-0611 1162 1210831 17.278 9 Missouri Department of Economic Development DWD 15% Admin Dis Worker FSC 17-278 0710-0611 1162 1210841 17.278 337 Missouri Department of Economic Development WIA 15% Dis Worker OJT Pool 0710-0611 1162 1210872 17.278 (50,162) Missouri Department of Economic Development WIA ADMIN-D/W 0712-0613 17.278 1162 1212812 17.278 7 Missouri Department of Economic Development WIA DIS/WK FORMULA 0712-0613 17.278 1162 1212891 17.278 69 Missouri Department of Economic Development WIA ADMIN-DIS/WK 0711-0612 17.278 1162 1216701 17.278 87,992 Missouri Department of Economic Development WIA DW SLCC 107-12 0412-0612 17.278 1162 1216707 17.278 1,346 Missouri Department of Economic Development WIA 15% DW ACCESS 126-12 0112-612 17.278 1162 1216726 17.278 5,938 Missouri Department of Economic Development WIA 25% D/WKR DESE 152-12 711-612 17.278 1162 1216752 17.278 92,758 Missouri Department of Economic Development WIA ITA 25% DW 0711-0612 17.278 1162 1216759 17.278 9,938 Missouri Department of Economic Development WIA DIS/WK FORMULA 0711-0612 17.278 1162 1216761 17.278 564,489 Missouri Department of Economic Development WIA D/WKR DESE 102-12 711-612 17.278 1162 1216762 17.278 2,432 Missouri Department of Economic Development WIA DIS/WKR SLCC 103-12 0711-0612 17.278 1162 1216763 17.278 239,360 Missouri Department of Economic Development WIA DISWR SLCOIC 141-12 0711-0612 17.278 1162 1216768 17.278 10,000 Missouri Department of Economic Development WIA RAPID RESPONSE 0711-0612 17.278 1162 1216771 17.278 72,936 Missouri Department of Economic Development WIA 25% DW OJT POOL 17.278 0711-0612 1162 1216799 17.278 37,012
1,143,333
(continued)20

Federal Grantor/Federal Financial Assistance Pass Through FY12Program/Program Cluster Title Grantor Description Fund Center CFDA# Expenditures
CITY OF ST. LOUIS, MISSOURISchedule of Expenditures of Federal Awards
Year ended June 30, 2012
Workforce Investment Act (WIA) National Emergency Grants (Non-ARRA) Missouri Department of Economic Development DWD NEG ADM 25060611 #2 711-612 17.277 1162 1216765 17.277 2,605 Missouri Department of Economic Development DWD NEG OJT 25060611 #2 711-612 17.278 1162 1216766 17.277 33,357
35,962
Total Workforce Investment Act (WIA) Cluster - Non-ARRA 4,612,230
ARRA - Worforce Investment Act (WIA) Cluster - Adult Program Missouri Department of Economic Development ARRA NEG/OJT Dis Worker 0710-0611 1162 1219582 17.260 17,615 Missouri Department of Economic Development ARRA OJT NEG-ADMIN 0710-0612 17.250 1162 1219583 17.260 1,858
19,473
Total ARRA - Workforce Investment Act (WIA) Cluster 19,473
Total Non-ARRA and ARRA - Workforce Investment Act (WIA) Cluster 4,631,703
H-1B Job Training Grants ----- DOL/ETA ADMIN JA-22529 1011-0915 17.268 1162 1216861 17.268 2,429 ----- DOL/ETA OJT JA-22529 1011-0915 17.268 1162 1216862 17.268 12,314
14,743
Community Based Job Training Grants ----- DOL CBJTG Admin 0710-0611 1162 1212241 17.269 2,987 ----- DOL CBJTG Southwestern Illinois College 412-11 0710-0611 1162 1212242 17.269 1 ----- DOL CBJTG JC 410-12 0711-0612 17.269 1162 1216840 17.269 423,886 ----- DOL/ETA ADMIN CBJTG 0711-0612 17.269 1162 1216841 17.269 28,660 ----- DOL CBJTG SWIC 412-12 0711-0612 17.269 1162 1216842 17.269 95,584 ----- DOL CBJTG ECC 413-12 0711-0612 17.269 1162 1216843 17.269 213,706 ----- DOL CBJTG SLCC 415-12 0711-0612 17.269 1162 1216845 17.269 249,205 ----- DOL CBJTG SLCC 407-12 0212-0612 17.269 1162 1216847 17.269 33,467 ----- DOL CBJTG SLCC 408-12 0711-0612 17.269 1162 1216849 17.269 318,923 ----- DOL CBJTG SCCC 409-12 0711-0612 17.269 1162 1216849 17.269 161,115
1,527,534
Homeless Veterans Reintegration Project (HVRP) ----- EMPLOYMENT CONNECTION 0710-0312 17.805 1167 8120701 17.805 33,692 ----- Homeless Veterans Reintergr 0711-0612 1167 8130900 17.805 12,488 ----- Employment Connection 0711-0612 1167 8130901 17.805 208,453
254,633
Total United States Department Of Labor 6,428,613
UNITED STATES DEPARTMENT OF TRANSPORTATION:
Airport Improvement Program (Non-ARRA) ----- AIP 1214 various 20.106 7,867,475 7,867,475
Highway Planning and Construction Cluster - Non-ARRA Missouri Department of Transportation West Florissant Signal Interconnect/Upgrade 1211 various 20.205 6,061 Missouri Department of Transportation Vandeventer Signal Interconnect/Upgrade 1211 various 20.205 26,235 Missouri Department of Transportation Lindell/Olive Signal Interconnect/Upgrade 1211 various 20.205 3,250 Missouri Department of Transportation Vandeventer Signal Interconnect/Upgrade 1211 various 20.205 31,315 Missouri Department of Transportation West Florissant Signal Interconnect/Upgrade 1211 various 20.205 9,986 Missouri Department of Transportation Lindell/Olive Signal Interconnect/Upgrade 1211 various 20.205 11,266 Missouri Department of Transportation Broadway & 7th. Street Improvements 1211 various 20.205 74,964 Missouri Department of Transportation 4th. & Broadway Overlay & Pedestrian Improvement 1211 various 20.205 69,586 Missouri Department of Transportation Replacement of Kingshighway Bridge over UPRR 1211 various 20.205 503,096 Missouri Department of Transportation Replacement of Kingshighway Bridge over UPRR 1211 various 20.205 79,869
(continued)21

Federal Grantor/Federal Financial Assistance Pass Through FY12Program/Program Cluster Title Grantor Description Fund Center CFDA# Expenditures
CITY OF ST. LOUIS, MISSOURISchedule of Expenditures of Federal Awards
Year ended June 30, 2012
Missouri Department of Transportation CMAQ 2E Traffic Signal Installation 1211 various 20.205 8,043 Missouri Department of Transportation CMAQ (III) Traffic Signal Installation, Plan H 1211 various 20.205 60,007 Missouri Department of Transportation Riverview Drive Bridge over Maline Creek 1211 various 20.205 162,217 Missouri Department of Transportation Kingshighway Viaduct - Penrose & I-70 -Pkg. "C" 1211 various 20.205 254,678 Missouri Department of Transportation Jefferson Ave. Viaduct over Metrolink & Mill Creek R.R. Ph. 2 1211 various 20.205 78,372 Missouri Department of Transportation Riverview Blvd. Rehabilitation, Bircher to Halls Ferry Circle 1211 various 20.205 727,283 Missouri Department of Transportation Salisbury Street Streetscape Enhancements 1211 various 20.205 37,313 Missouri Department of Transportation Market St. Interconnect 1211 various 20.205 56,000 Missouri Department of Transportation On System Bridge Preventive Maintenance Program 1211 various 20.205 396,536 Missouri Department of Transportation Soulard Bike Path Extension 1211 various 20.205 194,467 Missouri Department of Transportation Kingshighway Memorial Blvd. Improvements 1211 various 20.205 619,644 Missouri Department of Transportation Grand Ave. Viaduct over Mill Creek Valley 1211 various 20.205 10,236,704 Missouri Department of Transportation Vandeventer Signal Interconnect/Upgrade 1211 various 20.205 953,056 Missouri Department of Transportation Lindell/Olive Signal Interconnect/Upgrade 1211 various 20.205 312,869 Missouri Department of Transportation North Tucker Reconstruction Phase II 1211 various 20.205 1,482,754 Missouri Department of Transportation Bridge Inspections 1211 various 20.205 7,262 Missouri Department of Transportation ROW - Wellington Ave. Bridge 1211 various 20.205 51,517 Missouri Department of Transportation Bridge Training 1211 various 20.205 6,566
16,460,916
Highway Planning and Construction Cluster- ARRA Missouri Department of Transportation ARRA Pedestrian Improvements 1168 9000001 20.205 120,224 Missouri Department of Transportation ARRA Vandeventer Streetscape 0609-1111 1168 9000003 20.205 75,676 Missouri Department of Transportation ARRA S. Broadway Streetscape 1168 9000004 20.205 42,528 Missouri Department of Transportation ARRA N. Tucker Bridge 0609-1111 1168 9000005 20.205 5,975,213 Missouri Department of Transportation ARRA Grand Center- Grand BLVD 1168 9000007 20.205 593,283 Missouri Department of Transportation ARRA Morganford Signal Connect 0609-1111 1168 9000008 20.205 1,077,359 Missouri Department of Transportation ARRA S. Grand Improvements 0609-1111 1168 9000009 20.205 708,394 Missouri Department of Transportation ARRA Dr. MLK Pedestrian LTG 0609-1111 1168 9000011 20.205 71,566 Missouri Department of Transportation ARRA Municiple Terminal Dock 1168 9000012 20.205 3,002 Missouri Department of Transportation ARRA MANCHESTER STREET ENHANCEMENTS 1168 9000013 20.205 215,846 Missouri Department of Transportation ARRA SALISBURY ENHANCEMENT PHASE 2 1168 9000015 20.205 4,736 Missouri Department of Transportation ARRA GOODFELLOW REHAB PRJ 1168 9000016 20.205 1,106,992
9,994,819
Total Non-ARRA and ARRA - Highway Planning and Construction Cluster 26,455,735
National Motor Carrier Safety Missouri Department of Transportation Motor Carrier Safety Program-MCSAP 1140 6502001 20.218 538,946 538,946
State and Community Highway Safety - Highway Safety Cluster Missouri Department of Transportation DWI/Sobriety Checkpoints 1140 6502002 20.600 188,480 1140 6502032 20.600 28,841 1140 6502035 20.600 85,853
303,174
Safety Belt Performance Grants - Highway Safety Cluster Central Missouri State University Seat Belt Enforcement 1140 6502000 20.609 7,089 7,089
Total Highway Safety Cluster 310,263
Total United States Department Of Transportation 35,172,419
(continued)22

Federal Grantor/Federal Financial Assistance Pass Through FY12Program/Program Cluster Title Grantor Description Fund Center CFDA# Expenditures
CITY OF ST. LOUIS, MISSOURISchedule of Expenditures of Federal Awards
Year ended June 30, 2012
UNITED STATES EQUAL EMPLOYMENT OPPORTUNITY COMMISSION:
Employment Discrimination-State, Local Fair Employment ----- FEPA EEOC EECCN090059 1010-0911 1168 1261500 30.002 6,512 Practices Agency ----- FEPA EEOC EECCN090059 1010-0911 1168 1261512 30.002 24,088
30,600
Total United States Equal Employment Opportunity Commission 30,600
GENERAL SERVICES ADMINISTRATION:
Election Reform Payments ----- Voting Equipment Management 1111-1212 39.011 1168 3340800 39.011 1,554 1,554
Total General Services Administration 1,554
UNITED STATES ENVIRONMENTAL PROTECTION AGENCY:
Surveys, Studies, Research, Investigations, Demonstrations and Special Purpose Grants/Purpose Activities Relating to the Missouri Department of Natural Resources FINE PM2.5 AIR MONITOR 0411-0911 66.034 1166 7156000 66.034 21,655 Clean Air Act Missouri Department of Natural Resources FINE PM2.5 AIR MNTR 66.034 0410-0311 1166 7156600 66.034 (313)
21,342
Performance Partnership Grants Missouri Department of Natural Resources PERFORMANCE PARTNER 10110-093011 66.605 1166 7155520 66.605 255,475 255,475
Solid Waste Management Assistance Grants Missouri Department of Natural Resources Special Events Recycling 8/09-1/11 1168 5161300 66.808 6,206 6,206
Total United States Environmental Protection Agency 283,023
UNITED STATES DEPARTMENT OF ENERGY:
Energy Efficiency and Conservation Block Grant Program (EECBG) - ARRA ----- ARRA-Master Plan & Strategy 0709-0712 1168 9000759 81.128 (157) ----- ARRA-EECBG CITY HALL BLDG RETROFIT 1168 9000802 81.128 767,223 ----- ARRA-EECBG-CARNAHAN COURTS RETROFIT 1168 9000803 81.128 1,337,290 ----- ARRA-EECBG GREENHOUSE GAS INVENTORY 1168 9000804 81.128 81,043 ----- ARRA-EECBG Innovative Fin Tech 1168 9000806 81.128 65,785 ----- ARRA-EECBG Public Commuter Bike Station 1168 9000807 81.128 158,564 ----- ARRA-EECBG Strategy 0710-0611 1168 9000808 81.128 30,027
2,439,775
Total United States Department of Energy 2,439,775
UNITED STATES DEPARTMENT OF HEALTH AND HUMAN SERVICES:
Public Health Emergency Preparedness Missouri Department of Health & Senior Services REG PUB HLTH BASE 081010-080911 93.069 1166 7000416 93.069 (1,722) Missouri Department of Health & Senior Services REG PUB HLTH CRI 081010-080911 93.069 1166 7000417 93.069 100,959 Missouri Department of Health & Senior Services CRI-PUB HLTH 081011-081011-080912 93.069 1166 7000418 93.069 54,137 Missouri Department of Health & Senior Services BASE-PUB HLTH 081011-080912 93.069 1166 7000419 93.069 126,449
(continued)23

Federal Grantor/Federal Financial Assistance Pass Through FY12Program/Program Cluster Title Grantor Description Fund Center CFDA# Expenditures
CITY OF ST. LOUIS, MISSOURISchedule of Expenditures of Federal Awards
Year ended June 30, 2012
Missouri Department of Health & Senior Services PBLC HLTH EMRG RSP 0709-0710 93.069 CDC 1166 7000660 93.069 1,229 Missouri Department of Health & Senior Services PHERS-H1N1 AMEND 3 0810-0511 93.069 1166 7000661 93.069 92,039 Missouri Department of Health & Senior Services MDHSS PHEP 081011-080912 93.069 1166 7000703 93.069 19,669
392,760
Environmental Public Health and Emergency Response Missouri Department of Health & Senior Services MDHSS HH LD POIS PREV 0911-0812 93.070 1166 7000704 93.070 15,337 15,337
Project Grants and Cooperative Agreements for Tuberculosis Control Programs Missouri Department of Health & Senior Services TB OUTREACH 010111-123112 93.116 1166 7110210 93.116 40,987 Missouri Department of Health & Senior Services TB OUTREACH 010112-123112 93.116 1166 7110220 93.116 24,754
65,741
Injury Prevention and Control Reasearch and State and Community Based Programs ----- Mtg Neighborors 09-30-06 09-29-07 1169 6110200 93.136 82,893 82,893
Coordinated Services and Access to Research for Women, Infants, Children and Youth Missouri Department of Health & Senior Services WASHU YOUTH CASE MGMT 0810-0711 93.153 1166 7119200 93.153 (7,165)
(7,165)
Childhood Lead Poisoning Prevention Projects_State and Local Childhood Lead Missouri Department of Health & Senior Services CHILDHD LD POISONING 0710-0611 1166 7001400 93.197 7,686 Poisoning Prevention and Surveillance of Blood Lead Levels in Children 7,686
Substance Abuse and Mental Health Services_Projects of Regional and ----- SAMSHA POSS 5HT9TI019925-03 1010-0911 1168 3210401 93.243 38,207 National Significance ----- Seeking Safety 2009-DC-BX-0023 909-811 1168 3210500 93.243 15,269
----- SAMSHA BTG 5H79TI021534 0910-0911 93.24 1168 3210601 93.243 81,945 ----- SAMHSA BTG 5 h79TI021534/3 911 93.243 1168 3210602 93.243 237,288
372,709
Rural Access to Emergency Devices Grant ----- STL Public Defib Demo 9109-83111 93.259 1169 6110501 93.259 80,686 ----- STL Public Defib Demo 9109-83112 93.259 1169 6110500 93.259 11,540
92,226
Centers for Disease Control and Prevention_Investigations and Technical Assistance Missouri Department of Health & Senior Services ARBOVIRUS MOSQUITO SUR 0611-1111 93.283 1166 7146700 93.283 3,490 Missouri Department of Health & Senior Services SHOW ME HLTHY MISSOURIANS 07/08 93.283 1166 7192500 93.283 79
3,569
Temporary Assistance for Needy Families (TANF) State Programs - TANF Cluster Missouri Department of Economic Development TANF WIA CAP 0710-0611 1162 1212261 93.558 (11) Missouri Department of Economic Development TANF MWA Admin BFL 1010-0911 1162 1212290 93.558 2,081 Missouri Department of Economic Development TANF MWA Prog BFL 1010-0911 1162 1212291 93.558 42,249 Missouri Department of Economic Development TANF MWA SLCC 695-11 1010/0911 93.558 1162 1212295 93.558 98,411 Missouri Department of Economic Development TANF MWA ADMIN 1011-0612 93.558 1162 1216891 93.558 1,821 Missouri Department of Economic Development TANF MWA PROGRAM 1011-0612 93.588 1162 1216892 93.558 20,463 Missouri Department of Economic Development TANF MWA SLCC 695-12 1011-0612 93.558 1162 1216895 93.558 267,249
432,263
Community Services Block Grant - CSBG Cluster Missouri Department of Health HCP Peter & Paul 1010-0911 93.569 1167 8120902 93.569 5,250 5,250
Child Care and Development Block Grant - CCDF Cluster Missouri Department of Health & Senior Services SANI INSPECT 100107-063008 93.575 1166 7154700 93.575 19,551 Missouri Department of Health & Senior Services CC SANI INSP 1010-0913 93.575 1166 7155700 93.575 14,935
34,486
(continued)24

Federal Grantor/Federal Financial Assistance Pass Through FY12Program/Program Cluster Title Grantor Description Fund Center CFDA# Expenditures
CITY OF ST. LOUIS, MISSOURISchedule of Expenditures of Federal Awards
Year ended June 30, 2012
Refugee and Entrant Assistance Discretionary Grant Missouri Department of Health & Senior Services REFUGEE HLTH SCREEN 0711-0612 93.576 1166 7119400 93.576 36,225 36,225
Family Violence Prevention and Services/Grants for Battered Women Shelters Missouri Department of Health & Senior Services CHILD AUTOPSY 07-01-10 06-30-11 95.671 1168 3350900 93.671 327 Grants to States and Indian Tribes 327
Communities Putting Prevention to Work - ARRA Missouri Department of Health & Senior Services ARRA CHLD HLTH 1009-0910 93.713;712;575 1166 7154710 93.713 4,828 Missouri Department of Health & Senior Services ARRA CHLD CONSULT 1009-0910 93.713 1166 7154711 93.713 1,741
ARRA CHILD ASTHMA 070110-083111 93.713 1166 7154712 93.713 15,700 22,269
HIV Emergency Relief Project Grants ----- RYAN WHITE PART A 0308-0209 93.914 1166 7116600 93.914 397 ----- RYAN WHITE PART A 030110-022811 93.914 1166 7118600 93.914 (2,450) ----- RWI PART A 0311-0212 93.914 1166 7118800 93.914 226,568 ----- RWI-A PLANNING SUPPORT 0311-0212 93.914 1166 7118810 93.914 106,702 ----- RWI-Places for People 0311-0212 93.914 1166 7118826 93.914 39,147 ----- RWI PTA DOORWAYS 0311-0212 93.914 1166 7118827 93.914 73,240 ----- RWI PTA FOOD OUTREACH 0311-0212 93.914 1166 7118828 93.914 153,578 ----- RWI PTA LACKLAND ACQ 0311-0212 93.914 1166 7118829 93.914 2,105,742 ----- RWI-St. Clair County 0311-0212 93.914 1166 7118830 93.914 453,952 ----- RWI PTA STL CHLD HSPTL 0311-0212 93.914 1166 7118831 93.914 41,334 ----- RWI PTA STL EFFORT/AID 0311-0212 93.914 1166 7118832 93.914 455,990 ----- RWI PTA WASHU TRMT AD 0311-0212 93.914 1166 7118833 93.914 26,497 ----- RWI PTA WashU Case Mgmt 0311-0212 93.914 1166 7118834 93.914 465,262 ----- RWI-A WILLIAMS & ASSOC 0311-0212 93.914 1166 7118835 93.914 58,344 ----- MAI 0511-0212 93.914 1166 7119000 93.914 108,939 ----- RWI PTA Lackland Acq 0311-0212 93.914 1166 7119036 93.914 26,435 ----- RWI-PTA Stl Effort for AIDS 0311-0212 93.914 1166 7119037 93.914 86,696 ----- RWI PTA Southern Illinois Healthcare 0311-0212 1166 7119038 93.914 22,212 ----- RWI PTA MIA Washington University 0311-0212 1166 7119039 93.914 58,209 ----- RWI PTA WILLIAMS&ASSOC 0311-0212 93.914 1166 7119040 93.914 7,441 ----- RWI PTA 030112-022813 93.914 1166 7119600 93.914 115,315 ----- RWI-A PLANNING COUNCIL 0312-0213 93.914 1166 7119610 93.914 45,636 ----- RW PTA PLACES FOR PPL 0312-0213 93.914 1166 7119627 93.914 46,937 ----- RW PTS WILLIAIMS & ASSOC 0312-0213 93.914 1166 7119628 93.914 16,624 ----- RW PTA STL EFFORT AIDS 0312-0213 93.914 1166 7119629 93.914 225,856 ----- RW PTA LACKLAND ACQUIS 0312-0213 93.914 1166 7119630 93.914 926,299 ----- RW PTA PLACES FOR PPL 0312-0213 93.914 1166 7119631 93.914 15,870 ----- RW PTA STCLAIR CO HLTH 0312-0213 93.914 1166 7119633 93.914 239,589 ----- RW PTA FOOD OUTREACH 0312-0213 93.914 1166 7119634 93.914 36,923 ----- RW PTA DOORWAYS 0312-0213 93.914 1166 7119635 93.914 64,301 ----- MAI 030112-022813 93.914 1166 7119800 93.914 43,109 ----- MAI SOUTHERN ILL FDN 0312-0213 93.914 1166 7119820 93.914 18,811 ----- MAI STL EFFT FOR AIDS 0312-0213 93.914 1166 7119821 93.914 46,791 ----- MAI WASHINGTON UNIVERSITY 0312 - 0213 1166 7119822 93.914 23,288 ----- MAI HIS-LACKLAND ACQUI 0312-0213 93.914 1166 7119823 93.914 4,593 ----- RW PTA WASHINGTON UNVIERSITY 1166 7119625 93.914 216,687 ----- RW PTA CHILDREN HOSPITAL 0312 - 0213 1166 7119626 93.914 19,333 ----- RW PTA WASHINGTON UNIVERSITY 0312-0213 93.914 1166 7119632 93.914 12,722
6,632,919
(continued)25

Federal Grantor/Federal Financial Assistance Pass Through FY12Program/Program Cluster Title Grantor Description Fund Center CFDA# Expenditures
CITY OF ST. LOUIS, MISSOURISchedule of Expenditures of Federal Awards
Year ended June 30, 2012
HIV Care Formula Grants Missouri Department of Health & Senior Services RYAN WHITE CS MGMT 040110-033111 93.917 1166 7117800 93.917 (1,939) Missouri Department of Health & Senior Services RWI-B HIV CASE MGMT 0411-0312 93.917 1166 7119100 93.917 77,002 Missouri Department of Health & Senior Services RWI PTB Places for People 0411-0312 1166 7119145 93.917 32,258 Missouri Department of Health & Senior Services RWI PTB St. Louis Effort for AIDS 0411-0312 1166 7119146 93.917 97,905 Missouri Department of Health & Senior Services RWI PTB SLU New Hope Center 0411-0312 1166 7119147 93.917 133,100 Missouri Department of Health & Senior Services RWI PTB-Washington Univ 0411-0312 1166 7119148 93.917 95,013 Missouri Department of Health & Senior Services HIV CASE MGMT RWP+B 0412-0313 93.917 1166 7119900 93.917 27,086 Missouri Department of Health & Senior Services HIV CASE REPTB STL EFA 0412-0313 93.917 1166 7119936 93.917 32,501 Missouri Department of Health & Senior Services HIV CASE MANAGEMENT SLU 0412-0313 1166 7119937 93.917 45,120 Missouri Department of Health & Senior Services HIV CASE RWPTB WASHU 0412-0313 1166 7119938 93.917 31,724
569,770
Cooperative Agreements for State-Based Comprehensive Breast and Cervical Missouri Department of Health & Senior Services SHOW ME HLTHY WOMEN 0711-0612 93.919 1166 7192633 93.919 62,447 Cancer Early Detection Programs Missouri Department of Health & Senior Services SHOW ME HEALTHY WOMEN 0710-0711 93.919 1166 7194500 93.919 6,830
69,277
HIV Prevention Activities_Health Department Based Missouri Department of Health & Senior Services HIV PREVENTION 0109-1209 93.940 1166 7117200 93.940 (480) (480)
Human Immunodeficiency Virus (HIV) Acquired Immunodeficiency Syndrome Missouri Department of Health & Senior Services HIV PREVENTION 0110-01210 93.944/268/940 1166 7117210 93.944 28,484 (AIDS) Surveillance Missouri Department of Health & Senior Services STL EFFORT AIDS 0111-1211 93.944 1166 7117216 93.944 55,649
Missouri Department of Health & Senior Services WILLIAMS & ASSOCIATE 0111-1211 93.944 1166 7117217 93.944 30,727 Missouri Department of Health & Senior Services WASHINGTON UNIVERSITY 0111-1211 93.944 1166 7117218 93.944 92,879 Missouri Department of Health & Senior Services STL METRO AIDS HERR 0111-1211 93.944 1166 7117220 93.944 248,255 Missouri Department of Health & Senior Services STL METRO AIDS-HERR 0112-1212 93.940 1166 7117230 93.944 227,608 Missouri Department of Health & Senior Services HIV PREV STL EFFT AIDS 0112-1212 93.944 1166 7117231 93.944 65,266 Missouri Department of Health & Senior Services HIV PREV WILLIAMS&ASSOC 0112-1212 93.944 1166 7117232 93.944 31,646 Missouri Department of Health & Senior Services HIV PREV WASHU PROJ AR 0112-1212 93.944 1166 7117233 93.944 65,453 Mi i D f H l h & S i S i HIV SURVLLANCE 0110 1210 93 944/268/940 1166 7117310 93 944 (10 382)Missouri Department of Health & Senior Services HIV SURVLLANCE 0110-1210 93.944/268/940 1166 7117310 93.944 (10,382) Missouri Department of Health & Senior Services STL AIDS SURVEILLANCE 0112-1212 93.944 1166 7117320 93.944 78,207 Missouri Department of Health & Senior Services STL AIDS SURVEILLANCE 0111-1211 93.944 1166 7117321 93.944 11,326 Missouri Department of Health & Senior Services STL AIDS SURVEILLANCE 0111-1211 93.944 1166 7118700 93.944 38,108 Missouri Department of Health & Senior Services HIV SURVEILLANCE 0111-1211 93.944 1166 7118701 93.944 54,506 Missouri Department of Health & Senior Services HIV SURV 0111-1211 93.944 1166 7118702 93.944 46,396
1,064,128
Child Support Enforcement ----- Parent Locator 1116 3120005 93.563 1,795,454 1,795,454
Maternal and Child Health Services Block Grant to the States Missouri Department of Health & Senior Services CHILDCARE HLTH CONSULT 1010-0911 93.994 1166 7154720 93.994 11,126 Missouri Department of Health & Senior Services ARRA CHLDCAR HLTH CON 1010-0911 93.994 1166 7155800 93.994 1,133 Missouri Department of Health & Senior Services MATERNAL CHILD HEALTH 1010-0911 93.994 1166 7192630 93.994 32,660 Missouri Department of Health & Senior Services MCH MATERNAL CHLD HLTH 1010-0911 93.994 1166 7192631 93.994 444 Missouri Department of Health & Senior Services CHILDCARE HLTH CONCULT 1011-0912 93.994 1166 7192636 93.994 110 Missouri Department of Health & Senior Services MCH-ADC12380092 1011-0912 93.994 1166 7199400 93.994 107,095
152,568
Total United States Department Of Health and Human Services 11,840,212
UNITED STATES DEPARTMENT OF HOMELAND SECURITY:
Non Profit Security Program US Homeland Security Non-Cash Assistance - Police Grants 1910 1600000 97.008 13,937 13,937
(continued)26

Federal Grantor/Federal Financial Assistance Pass Through FY12Program/Program Cluster Title Grantor Description Fund Center CFDA# Expenditures
CITY OF ST. LOUIS, MISSOURISchedule of Expenditures of Federal Awards
Year ended June 30, 2012
Assistance to Firefighters Grant ----- FEMA Fireprotect 070111-0630012 97.044 1169 6110730 97.044 36,212 ----- Fema Fire Prev & Safety 0610-0611 1169 6110800 97.044 15,837 ----- Fema MRL fit & Well 032610-032611 1169 6110600 97.044 68,640 ----- Fema Safer Grant 04211-062513 97.044 1169 6110710 97.044 1,621,351 ----- Fema-AMSC Boat Train - 97.044 1169 6110400 97.044 (114) ----- FEMA Fir Oper/Trng 1210-1211 97.044 1169 6110900 97.044 275,646
2,017,572
Homeland Security Grant Program - Homeland Security Cluster ----- HOMELAND SEC RESPONSE 0707-0610 97.067 1169 6250700 97.067 1 ----- Mo Dept Homeland Security 0510-0611 1169 6250900 97.067 41,163
41,164
National Explosive Detection Canine Team Program ----- Canine Team Program 1511 4200000 97.072 434,282 434,282
Law Enforcement Officer Reimbursement Agreement Program ----- LEO Reimbursement Program 1511 4200000 97.090 219,359 219,359
Homeland Security Biowatch Program Missouri Department of Natural Resources SPEICAL PURPOSE MONIT 0710-0611 97.091 1166 7155220 97.091 6,669 6,669
U.S. Dept. of Homeland Security - Non-ARRA Grant ----- Design Baggage Screening EDS 1214 6735700 97.100 69,918 69,918
U.S. Dept. of Homeland Security - ARRA Grant ----- Design Baggage Screening EDS 1214 6735700 97.100 1,398,126 1,398,126
Total Non-ARRA and ARRA - U.S. Dept. of Homeland Security 1,468,044
Advanced Surveillance Program (ASP) ----- Advance Surveillance Program 1214 6811000 97.118 9,390 9,390
Total United States Department of Homeland Security 4,210,417
TOTAL EXPENDITURES OF FEDERAL AWARDS 115,129,591$
See accompanying independent auditors' report and notes to the schedule of expenditures of federal awards.
27

28
CITY OF ST. LOUIS, MISSOURI
Notes to Schedule of Expenditures of Federal Awards
Year ended June 30, 2012
(1) General The accompanying schedule of expenditures of federal awards (the schedule) presents the activity
of all federal financial award programs of the City of St. Louis, Missouri (the City) for the year ended June 30, 2012. The City’s reporting entity is defined in Note 1 to the City’s basic financial statements. For the purposes of the schedule, federal awards include grants, contracts, loans, and loan guarantee agreements entered into directly between the City and agencies and departments of the federal government or passed through other government agencies or other organizations. The schedule also includes federal awards under the American Recovery and Reinvestment Act of 2010 (ARRA) and such awards are identified in both the program title and description columns of the schedule.
(2) Basis of Accounting The accompanying schedule is presented using the accrual basis of accounting, which is
described in Note 1 to the City’s basic financial statements. (3) Basis of Presentation The accompanying schedule does not include expenditures related to federal awards programs
administered by the St. Louis Development Corporation, a discretely presented component unit, and St. Louis Area Agency on Aging, a department of the City of St. Louis, Missouri, because their federal awards programs are reported upon separately.
(4) Grants to Subrecipients The City has contracts with various service providers to meet the objectives of the various federal
award programs. The following expenditures of federal awards were incurred by subrecipients and reimbursed by the City for the year ended June 30, 2012:
CFDA No. Expenditures
14.218 $ 10,390,143 14.228 1,653,678 14.231 670,053 14.235 6,113,514 14.239 847,232 14.241 1,288,642 14.253 911,312 14.257 2,240,588

29
CITY OF ST. LOUIS, MISSOURI
Notes to Schedule of Expenditures of Federal Awards, continued
Year ended June 30, 2012
CFDA No. Expenditures
17.258 $ 476,811 17.259 992,408 17.269 1,072,001 17.278 341,834 17.805 242,145 93.243 372,709 93.558 407,909 93.569 5,250 93.914 5,988,703 93.917 494,707 93.944 152,568
$ 34,662,207

CITY OF ST. LOUIS, MISSOURI
Schedule of Findings and Questioned Costs
Year ended June 30, 2012
30
(1) Summary of Auditors’ Results:
(a) The type of report issued on the basic financial statements:
City of St. Louis, Missouri – Unqualified Opinions on the governmental activities, the business-type activities, the aggregate discretely presented component units, each major fund, and the aggregate remaining fund information
Lambert – St. Louis International Airport, an enterprise fund of the City of St. Louis, Missouri – Unqualified Opinion
Metropolitan Police Department of the City of St. Louis, Missouri, a discretely presented component unit of the City of St. Louis, Missouri – Unqualified Opinions on the governmental activities, each major fund, and the aggregate remaining fund information
(b) Significant deficiencies in internal control were disclosed by the audit of the basic financial statements:
City of St. Louis, Missouri – Yes
Lambert – St. Louis International Airport, an enterprise fund of the City of St. Louis, Missouri – No
Metropolitan Police Department of the City of St. Louis, Missouri, a discretely presented component unit of the City of St. Louis, Missouri – Yes
Material weaknesses:
City of St. Louis, Missouri – No
Lambert – St. Louis International Airport, an enterprise fund of the City of St. Louis, Missouri – No
Metropolitan Police Department of the City of St. Louis, Missouri, a discretely presented component unit of the City of St. Louis, Missouri – No
(c) Noncompliance which is material to the basic financial statements: No (d) Significant deficiencies in internal control over major programs: Yes Material weaknesses: Yes

CITY OF ST. LOUIS, MISSOURI
Schedule of Findings and Questioned Costs, continued
Year ended June 30, 2012
31
(e) The type of report issued on compliance for major programs:
U.S. Department of Housing and Urban Development – Community Development Block Grants – Entitlement Grants Cluster – Unqualified Opinion
CFDA #14.218 – Community Development Block Grants/Entitlement Grants CFDA #14.253 – Community Development Block Grant ARRA Entitlement Grants (CDBG-R) – (Recovery Act Funded)
U.S. Department of Housing and Urban Development – Community Development Block Grants – State-Administered CDBG Cluster – Unqualified Opinion
CFDA #14.228 – Community Development Block Grants/State’s Program and Non-Entitlement Grants in Hawaii
CFDA #14.235 – U.S. Department of Housing and Urban Development – Supportive
Housing Program – Unqualified Opinion
CFDA #14.239 – U.S. Department of Housing and Urban Development – HOME Investment Partnership Program – Unqualified Opinion
CFDA #16.000 – U.S. Department of Justice – Shared Federally Forfeited Property
Program – Unqualified Opinion
U.S. Department of Labor – passed through the Missouri Department of Economic Development – Workforce Investment Act (WIA) Cluster – Unqualified Opinion
CFDA #17.258 – WIA Adult Program CFDA #17.259 – WIA Youth Activities CFDA #17.260 – WIA Dislocated Workers (Recovery Act Funded) CDFA #17.277 – WIA National Emergency Grants CFDA #17.278 – WIA Dislocated Workers
U.S. Department of Transportation – Highway Planning and Construction Cluster – Unqualified Opinion
CFDA #20.205 – Highway Planning and Construction
CFDA #93.914 – U.S. Department of Health and Human Services – Human Immunodeficiency Virus (HIV) Emergency Relief Project Grants – Unqualified Opinion
(f) Any audit findings which are required to be reported under section .510(a) of OMB Circular
A-133: Yes

CITY OF ST. LOUIS, MISSOURI
Schedule of Findings and Questioned Costs, continued
Year ended June 30, 2012
32
(g) Major Programs:
U.S. Department of Housing and Urban Development – Community Development Block Grants – Entitlement Grants Cluster
CFDA #14.218 – Community Development Block Grants/Entitlement Grants CFDA #14.253 – Community Development Block Grant ARRA Entitlement Grants (CDBG-R) – (Recovery Act Funded)
U.S. Department of Housing and Urban Development – Community Development Block Grants – State-Administered CDBG Cluster
CFDA #14.228 – Community Development Block Grants/State’s Program and Non-Entitlement Grants in Hawaii
CFDA #14.235 – U.S. Department of Housing and Urban Development – Supportive
Housing Program
CFDA #14.239 – U.S. Department of Housing and Urban Development – HOME Investment Partnership Program
CFDA #16.000 – U.S. Department of Justice – Shared Federally Forfeited Property
Program
U.S. Department of Labor – passed through the Missouri Department of Economic Development – Workforce Investment Act (WIA) Cluster
CFDA #17.258 – WIA Adult Program CFDA #17.259 – WIA Youth Activities CFDA #17.260 – WIA Dislocated Workers (Recovery Act Funded) CDFA #17.277 – WIA National Emergency Grants CFDA #17.278 – WIA Dislocated Workers
U.S. Department of Transportation – Highway Planning and Construction Cluster CFDA #20.205 – Highway Planning and Construction
CFDA #93.914 – U.S. Department of Health and Human Services – Human Immunodeficiency Virus (HIV) Emergency Relief Project Grants
(h) Dollar threshold used to distinguish between Type A and Type B programs: $3,000,000 (i) Auditee qualified as a low-risk auditee under section. 530 of OMB Circular A-133: No

CITY OF ST. LOUIS, MISSOURI
Schedule of Findings and Questioned Costs, continued
Year ended June 30, 2012
33
(2) Findings Relating to the Basic Financial Statements Reported in Accordance with Government Auditing Standards:
FINDING 2012-01 – INTERNAL CONTROL OVER CAPITAL ASSETS – SIGNIFICANT DEFICIENCY Comment and Recommendation: The preparation of the basic financial statements requires the City to assess and evaluate the adequacy of the presentation and disclosure of the financial activity in conformity with U.S. generally accepted accounting principles (GAAP). While performing procedures related to the presentation and disclosure of capital asset information in conformity with U.S. GAAP, we noted the following matters:
• Certain substantially completed or completed capital projects had not been transferred from construction work in progress to a depreciable capital asset classification, which results in a risk that depreciation expense will be understated within the basic financial statements.
• FAMS has the ability to calculate depreciation on a straight-line basis over the estimated useful life of a
capital asset. However, we noted that if the City makes subsequent improvements to the asset, FAMS will depreciate those improvements over the remaining useful life of the original asset instead of over the life of the improvement. Additionally, FAMS does not have the capability to retain a history of transactions. As a result, there is a risk that depreciation expense will not be accurately stated within the basic financial statements.
• We noted certain capital asset additions and adjustments that were not properly accounted for within
the City’s capital asset records.
• We noted a capital asset that was disposed of during fiscal year 2011 that was not recorded until fiscal year 2012.
• The City has a capitalization policy which documents a threshold at which to capitalize assets. While
performing our test work, we noted the City was inconsistent in applying the policy and capitalized items that were less in value than the documented policy.
• The City incorrectly classified certain capital assets within asset categories. In order to mitigate the risk of errors related to capital assets and the related depreciation expense, we recommend the City enhance its internal controls over capital assets. Specifically, we recommend the City perform a review of construction work in progress capital project account balances in order to determine completed projects that should be reclassified to a depreciable capital asset classification, evaluate the feasibility of implementing a capital asset system with the ability to depreciate subsequent improvements separately from the original capital asset and to retain a transaction history, and enhance the independent

CITY OF ST. LOUIS, MISSOURI
Schedule of Findings and Questioned Costs, continued
Year ended June 30, 2012
34
review process over the accounting and recording of capital asset transactions within the City’s capital asset records system.
View of Responsible Official: The City is in the process of implementing a new accounting system which will enhance the capital asset tracking capabilities. The new system is expected to be viable within fiscal year 2015. In the meantime, the City will take a more active role to review the accounting of capital assets. FINDING 2012-02 – ACCESS TO INFORMATION TECHNOLOGY SYSTEMS – SIGNIFICANT DEFICIENCY Comment and Recommendation: Information systems and the related information technology general controls have a pervasive impact throughout the City. As a result of the reliance upon the integrity of system-generated information during the performance of the City’s operations, it is imperative that the City establish appropriate information technology general controls, including controls over access to programs. Entities should establish controls over access to programs and data in order to mitigate the risk of unauthorized or inappropriate access to an organization’s financial reporting applications and data. While performing inquiries related to the City’s information technology general controls, we noted that the City does not maintain documentation to support an on-going review and monitoring of appropriate access rights for AIMS. In addition, the City does not maintain documentation to support the monitoring of access for terminated users. As a result, the City has not evidenced that access rights have been determined to be appropriate on an on-going basis. While manual mitigating controls may be in place to prevent or detect material misstatements, due to the pervasive impact of information systems and information technology general controls, we recommend the City enhance its internal control activities and maintain documentation supporting the enhanced control activities related to information technology access controls. View of Responsible Official: The City is in the process of implementing a new accounting system. During the implementation and conversion, all aspects of internal control will be reviewed and enhanced. FINDING 2012-03 – INTERNAL CONTROL OVER FINANCIAL REPORTING – SIGNIFICANT DEFICIENCY Comment and Recommendation: The preparation of the basic financial statements and required supplementary information requires the Metropolitan Police Department of the City of St. Louis, Missouri (Department) to assess and evaluate the

CITY OF ST. LOUIS, MISSOURI
Schedule of Findings and Questioned Costs, continued
Year ended June 30, 2012
35
adequacy of the presentation and disclosure of the financial activity in conformity with U.S. generally accepted accounting principles (GAAP). While performing procedures related to the presentation and disclosure of information in conformity with U.S. GAAP, we identified the Department did not have adequate internal controls that effectively assessed and evaluated the adequacy of the presentation and disclosure of the financial activity in conformance with U.S. GAAP, which resulted in the identification of the following matters:
• Audit adjustments and disclosure enhancements related to the completeness, accuracy, and presentation of various assets, liabilities, revenues, expenditures/expenses, and disclosures in accordance with U.S. GAAP were identified.
• The Department recorded certain revenues during fiscal year 2012, in which the activity should have
been accounted for in previous fiscal years.
• The financial statements did not accurately reflect overhead reimbursements related to a certain grant, which impacted the accuracy of grant revenue.
• The financial statements did not initially accurately reflect the impact of write-offs related to grant
receivables.
• The Department recorded a capital asset during fiscal year 2012 that was received by the Department during fiscal year 2011.
In order to mitigate the risk of not presenting information in accordance with U.S. GAAP, we recommend the Department enhance its process and procedures related to the assessment and evaluation of the adequacy of the presentation and disclosure of the financial activity in conformity with U.S. GAAP. In addition, the Department utilizes the City of St. Louis Accounting Management Information System (AIMS) to record cash basis revenue and expense transactions. However, the Department maintains no separate general ledger that provides a comprehensive tracking mechanism for all Department activity. As a result, management is required to manually accumulate information to be included within the financial statements. In order to mitigate the risk of not accumulating all information required to be included within the financial statements, we recommend the Department enhance its processes and procedures related to accumulating all information to ensure the financial statements are complete and accurate. Additionally, we recommend the Department formally document its financial policies and procedures, and identify and train a backup individual to assist with the preparation of the basic financial statements and footnotes. We also recommend a formal review of the draft financial statements occur by someone other than the preparer. The review should occur by someone with sufficient knowledge of all Department activities, who can ensure that all activities of the Department, including non-routine transactions, have been accounted for completely and accurately.

CITY OF ST. LOUIS, MISSOURI
Schedule of Findings and Questioned Costs, continued
Year ended June 30, 2012
36
View of Responsible Official: The Department will continue to improve implementation of policies and procedures to enhance the process of the presentation and disclosure of financial activity to conform to U.S. GAAP. The Department will not have funds available to fund the purchase of a new general ledger system but will continue to enhance procedures to ensure the accuracy and completeness of the financial statements. The City of St. Louis is implementing a new general ledger system which the Department will utilize once completed. The Department persists in training the backup for the individual who currently prepares the basic financial statements and footnotes. The Department has instituted procedures to improve the policy of reviewing draft financial statements for completeness and accuracy and will continue to develop this process. (3) Findings and Questioned Costs relating to Federal Awards: FINDING 2012-04
Federal Program Title – Community Development Block Grants – Entitlement Grants Cluster CFDA Nos. – 14.218 and 14.253 Federal Agency – U.S. Department of Housing and Urban Development – Direct Program (including
ARRA expenditures) Federal Award Numbers – B-11-MC-29-0006 and B-09-MY-29-0006 Grant Award Periods – January 1, 2011 – December 31, 2011 August 10, 2009 – September 30, 2012 Compliance Requirement – Reporting Criteria – 24 Code of Federal Regulations (CFR) Part 570 requires that CDBG grantees complete the Consolidated Annual Performance and Evaluation Report (CAPER) within 90 days of the grantee’s program year. Grantees may utilize the Integrated Disbursement & Information System (IDIS) to gather and track some of the financial and other program information required to be completed as part of the CAPER. Section 1512 of the American Recovery and Reinvestment Act (Recovery Act) of 2009 states that not later than 10 days after the end of each calendar quarter, each recipient that received recovery funds from a Federal agency shall submit a report to that agency. Conditions Found – The City did not have an effective system of internal control in place to ensure compliance with the reporting compliance requirement. The City submitted the CAPER for the 2011 program year (January 1, 2011 – December 31, 2011), which included the Financial Summary Report. Within the Financial Summary Report for the 2011 program year, the City overstated total expenditures by $2,727,577 as result of omitting the impact of 2010 program year accruals. Additionally, while performing test work related to reporting required in accordance with Section 1512 of the Recovery Act, it was identified that three of four quarterly Recovery Act reports selected for test work

CITY OF ST. LOUIS, MISSOURI
Schedule of Findings and Questioned Costs, continued
Year ended June 30, 2012
37
for ARRA funded portion (CFDA #14.253) of the CDBG Cluster were not accurately prepared. Specifically, within the Recovery Act reports, the City did not report any Sub Award payments on the September or December Recovery Act reports or Vender payments on the September, December, or March Recovery Act reports as follows:
Questioned Costs – There are no questioned costs. Context – The condition found impacts the accuracy of the 2011 program year Financial Summary Report completed within IDIS. Total amounts reported in the CAPER for the calendar year ended December 31, 2011 were $20,320,984, resulting in an overstatement of expenses by $2,727,577. The condition found related to the Section 1512 Recovery Act reporting impacts three of the four required Recovery Act reports for the fiscal year ended June 30, 2012. Cause and Effect – The City did not have an effective system of internal control in place to validate the accuracy of the information reported within the CAPER and Section 1512 Recovery Act reports. Recommendations – The City needs to establish an effective system of internal control to ensure compliance with the reporting compliance requirement. We recommend the City establish processes and controls to ensure the accuracy of the information reported within the CAPER and Section 1512 Recovery Act reports. View of Responsible Official and Corrective Action Plan – The Community Development Administration concurs with the condition found. In reference to the Financial Summary Report, CDA staff addressed the deficiency prior to the commencement of the audit. Upon discovery of the error, staff contacted HUD, who advised CDA to make the necessary corrections using an Excel format. Per HUD’s guidance, CDA maintains the corrected report as a part of its permanent files for use in subsequent reporting. CDA has already taken steps to ensure proper Section 1512 reporting, including (1) reporting subaward and vendor information in the June 30 and September 30 reports, (2) coordinating financial reporting with the Fiscal Department, (3) requiring that both the Fiscal Manager and Executive Director review and approve
Subaward Payments Per
Cumulative General Ledger
Information
Subaward Payments Reported
Vender Payments Per
Cumulative General Ledger
Information
Vender Payments Reported
September 30, 2011 950,047$ -$ 2,441,243$ -$ December 31, 2011 1,044,614$ -$ 3,023,254$ -$ March 31, 2012 1,223,377$ 1,223,377$ 3,190,048$ -$

CITY OF ST. LOUIS, MISSOURI
Schedule of Findings and Questioned Costs, continued
Year ended June 30, 2012
38
each report, and (4) coordinating with the HUD Field Office to request changes to prior reporting periods. The requested changes were submitted to the Field Office in December 2012. Contact Name: John Zakibe, Deputy Comptroller Contact Telephone Number: (314) 622-4912 FINDING 2012-05
Federal Program Title – Supportive Housing Program CFDA No. – 14.235 Federal Agency – U.S. Department of Housing and Urban Development – Direct Program Federal Award Numbers – MO36B501001, MO0006B7E010800, MO0014B7E010802,
MO0010B7E010802, MO0020B7E010802, MO0015B7E010802, MO0021B7E010802, MO0019B7E010802, MO0115B7E010901, MO0011B7E010802, MO0111B7E010901, MO0112B7E010901, MO0113B7E010901, MO0109B7E010901, MO0107B7E010901, MO0108B7E010901, MO0110B7E010901, MO0012B7E010802, MO0126B7E010900, MO0014B7E011003, MO0010B7E011003, MO0020B7E011003, MO0015B7E011003, MO0021B7E011003, MO0019B7E011003, MO0115B7E011002, MO0013B7E011003, MO0011B7E011003, MO0111B7E011002, MO0112B7E011002, MO0113B7E011002, MO0109B7E011002, MO0107B7E011002, MO0136B7E011001, MO0108B7E011002, MO0135B7E011001, MO0110B7E011002, MO0114B7E011002, MO0012B7E011003
Grant Award Periods – Various Compliance Requirement – Reporting Criteria – As set forth in 24 CFR Part 583 and OMB Approval No. 2506-0145, the City is required to prepare and submit Annual Progress Reports (HUD 40118) for each Supportive Housing Program grant received within 90 days after the end of the grant’s operating year-end. Such Annual Progress Reports track program progress and accomplishments and contain both program-specific and financial data. Additionally, in accordance with the Federal Funding Accountability and Transparency Act (Transparency Act), a grant recipient must report each first-tier subcontract with a value of $25,000 or more in Federal funds and any modification to that amount made on or after October 1, 2010. In addition, the action must be reported no later than the last day of the month following the month in which the subaward obligation was made. Conditions Found – The City did not have an effective system of internal control in place to ensure compliance with the reporting compliance requirement. Each subrecipient is required to prepare and submit an Annual Progress Report to the City, which in turn submits the Annual Progress Report to the U.S. Department of Housing and Urban Development. Twenty Annual Progress Reports related to fiscal year 2012 were required to be submitted, all of which were selected for test work. Of the twenty Annual Progress Reports selected for test work, four were submitted to the City from subrecipients after the date due to the U.S. Department of Housing and Urban Development.

CITY OF ST. LOUIS, MISSOURI
Schedule of Findings and Questioned Costs, continued
Year ended June 30, 2012
39
Additionally, the City did not have an effective system of internal control in place to ensure compliance with the Transparency Act reporting requirements. The City awarded 18 first-tier subcontracts with a value of $25,000 or more in Federal funds and did not report one of those subcontracts in accordance with the Transparency Act. In addition, the remaining 17 first-tier subcontracts were not reported within the time frames required by the Transparency Act. Questioned Cost – There were no questioned costs. Context – Of the twenty Annual Progress Reports selected for test work, four were submitted to the City by subrecipients, after the date due to the U.S. Department of Housing and Urban Development. The following was noted:
Dayssubmitted
late toDate due HUD by
Subrecipient to HUD the City
St. Patrick Center - Rosati House December 31, 2011 10 St. Patrick Center - Project Protect December 31, 2011 11 Community Alternatives December 31, 2011 33 MRDD September 30, 2012 2
The City did not report one of 18 subcontracts (MO0021B7E011003 – Catholic Charities) that fell under the Transparency Act reporting requirements during the fiscal year ended June 30, 2012 and there was no documentation of a good faith effort. In addition, the remaining 17 subcontracts were not reported within the required time frames as follows:

CITY OF ST. LOUIS, MISSOURI
Schedule of Findings and Questioned Costs, continued
Year ended June 30, 2012
40
Cause and Effect – Four subrecipients for the Supportive Housing Program did not submit an Annual Progress Report to the City until after the date due to the U.S. Department of Housing and Urban Development. To the extent the City does not receive Annual Progress Reports from its subrecipients within required timeframes, the City is unable to submit timely Annual Progress Reports to the U.S. Department of Housing and Urban Development, which may result in the suspension of draw downs by the U.S. Department of Housing and Urban Development. Additionally, one of 18 subcontracts was not reported under the Transparency Act requirements; and the remaining 17 were not reported within the time frames required by the Transparency Act. Recommendations – The City needs to establish an effective system of internal control to ensure compliance with the reporting compliance requirement. The City needs to hold its subrecipients accountable for preparing and submitting the Annual Progress Reports in accordance with 24 CFR Part 583. Additionally, the City needs to establish a process to identify and report the first-tier subcontracts that qualify under the Transparency Act for reporting and ensure such reports are submitted within the time frames required by the Transparency Act. View of Responsible Official and Corrective Action Plan – The City agrees with the condition found. The City has made efforts to reduce the number of late Annual Progress Reports and will continue to work with its subrecipients to receive reports on a timely basis. In addition, the City will continue to enhance processes related to Transparency Act reporting requirements to ensure reports are submitted within the required time frame.
Federal Award Identifier Number Subawardee Name
Obligation Date
Report Date
1 MO0126B7E010900 Gateway Homeless Services, Inc. September 26, 2011 April 20122 MO0014B7E011003 Humanitri July 20, 2011 March 20123 MO0010B7E011003 Peter & Paul Community Services September 29, 2011 March 20124 MO0020B7E011003 St. Patrick Center - Shamrock Club July 20, 2011 March 20125 MO0015B7E011003 Shalom House - Metro Homeless Center October 26, 2011 March 20126 MO0019B7E011003 St. Louis Transitional Hope House September 29, 2011 March 20127 MO0115B7E011002 YWCA of Metropolitan St. Louis September 12, 2011 March 20128 MO0011B7E011003 Interfaith Residence - Doorways September 29, 2011 March 20129 MO0111B7E011002 Interfaith Residence - Doorways September 29, 2011 March 2012
10 MO0112B7E011002 Interfaith Residence - Doorways September 29, 2011 April 201211 MO0113B7E011002 St. Patrick Center - Shamrock Club September 29, 2011 April 201212 MO0109B7E011002 St. Louis Office for Developmental Disability Resources July 20, 2011 April 201213 MO0107B7E011002 Community Alternatives September 29, 2011 April 201214 MO0108B7E011002 Covenant House Missouri July 20, 2011 April 201215 MO0135B7E011001 St. Patrick Center - Shamrock Club October 26, 2011 April 201216 MO0110B7E011002 St. Louis Office for Developmental Disability Resources July 20, 2011 April 201217 MO0012B7E011003 Employment Connection October 26, 2011 March 2012

CITY OF ST. LOUIS, MISSOURI
Schedule of Findings and Questioned Costs, continued
Year ended June 30, 2012
41
Contact Name: John Zakibe, Deputy Comptroller Contact Telephone Number: (314) 622-4912 FINDING 2012-06
Federal Program Title – HOME Investment Partnerships Program CFDA No. – 14.239 Federal Agency – U.S. Department of Housing and Urban Development – Direct Program Federal Award Numbers –M-08-MC-29-0500, M-09-MC-29-0500,
M-10-MC-29-0500, M-11-MC-29-0500, M-12-MC-29-0500 Grant Award Periods – July 1, 2007 through June 30, 2008, July 1, 2008 through June 30, 2009, July 1,
2009 through June 30, 2010, July 1, 2010 through June 30, 2011, and July 1, 2011 through June 30, 2012, respectively
Compliance Requirement – Special Tests and Provisions – Housing Quality Standards Criteria – During the period of affordability for HOME assisted rental housing, the participating jurisdiction must perform on-site inspections to determine compliance with property standards and verify the information submitted by the owners no less than: (a) every three years for projects containing 1 to 4 units, (b) every two years for projects containing 5 to 25 units, and (c) every year for projects containing 26 or more units. The participating jurisdiction must perform on-site inspections of rental housing occupied by tenants receiving HOME-assisted tenant-based rental assistance to determine compliance with housing quality standards (24 CFR sections 92.251, 92.252 and 92.504(b)). Conditions Found – The City did not have an effective system of internal control in place to ensure compliance with the special tests and provisions – housing quality standards compliance requirement, specifically as it relates to maintaining documentation that any needed repairs are completed timely. While performing test work related to the special tests and provisions requirement, it was identified that four of 26 projects included in our sample did not have documentation that needed repairs were completed timely. Additionally, during our testwork, one project (that contained 40 units) of 26 projects selected for testwork did not have an inspection completed as required during the year ended June 30, 2012. Questioned Costs – There are no questioned costs. Context – The condition found regarding maintaining documentation that any needed repairs are completed timely impacts four of 26 projects selected for test work. The condition found regarding the missing inspection impacts one of 26 projects selected for testwork. The total population of rental housing subject to housing quality standards in fiscal year 2012 was 42. Cause and Effect – The City did not have an effective system of internal control in place to ensure that all projects had a housing inspection completed and that the documentation was maintained to evidence the needed repairs were completed and/or completed timely. Recommendations – The City needs to enhance internal controls to ensure compliance with the special tests and provisions – housing quality standards compliance requirement.

CITY OF ST. LOUIS, MISSOURI
Schedule of Findings and Questioned Costs, continued
Year ended June 30, 2012
42
View of Responsible Official and Corrective Action Plan – The City concurs with the finding. Effective immediately, when housing quality inspections are performed on CDA projects by other partnering entities and needed repairs are noted, the City will implement a system to track the status and/or completion of the required repairs. Staff will also review the property inspection schedule and process and make required adjustments to ensure all inspections are completed in a timely manner.
Contact Name: John Zakibe, Deputy Comptroller Contact Telephone Number: (314) 622-4912 FINDING 2012-07
Federal Program Title – Shared Federally Forfeited Property Program CFDA No. – 16.000 Federal Agency – U.S. Department of Justice – Direct Program Federal Award Numbers – MOSPD0024 Grant Award Periods – July 1, 2011 through June 30, 2012 Compliance Requirement – Equipment and Real Property Management and Reporting Criteria – According to the U.S. Department of Justice publications, A Guide to Equitable Sharing for State and Local Law Enforcement Agencies – April 2009, “proceeds from the sale of shared property, facilities, equipment, and other items acquired with shared funds must be deposited into the agency’s equitable sharing revenue account and are subject to the same permissible use restrictions and reporting requirements as shared cash or proceeds, in accordance with the provisions of this Guide.” Conditions Found – The City did not have an effective system of internal control in place to ensure compliance with the equipment and real property management and reporting compliance requirements. While performing test work over the City’s compliance with the equipment and real property management compliance requirement, it was identified that the City sold five assets that were acquired from shared funds and received approximately $2,300 in proceeds. The City did not appropriately deposit the proceeds of the sales in to the equitable sharing revenue account. As a result, the proceeds were not subject to the same permissible use restrictions and reporting requirements in accordance with the provisions of A Guide to Equitable Sharing for State and Local Law Enforcement Agencies. In addition, the proceeds were not reported as other income on the Equitable Sharing Agreement and Certification in accordance with A Guide to Equitable Sharing for State and Local Law Enforcement Agencies.
Questioned Costs – Known questioned costs are approximately $2,300 which represents the proceeds from the sale of assets that were acquired from shared funds. Context – The condition found impacts all assets sold during the fiscal year that had been acquired with shared funds. The City sold five assets for approximately $2,300 in proceeds. Additionally, if the City does not accurately report proceeds from the sale of assets acquired from shared funds, the City may not be able to ensure that all amounts are expended in accordance with A Guide to Equitable Sharing for State and Local Law Enforcement Agencies.

CITY OF ST. LOUIS, MISSOURI
Schedule of Findings and Questioned Costs, continued
Year ended June 30, 2012
43
Cause and Effect – The City did not have a mechanism in place, as prescribed above, for compliance with the equipment and real property management and reporting compliance requirements for asset disposals. Recommendations – The City needs to establish an effective system of internal control to ensure compliance with the equipment and real property and reporting compliance requirements. We recommend the City establish processes and controls to ensure proceeds from the sales of shared property are properly deposited into the City’s equitable sharing revenue account, and subsequently reported as other income on the Equitable Sharing Agreement and Certification. View of Responsible Official and Corrective Action Plan – The City agrees with the condition found. Effective immediately, procedures and controls have been established to ensure proceeds from the sales of shared property are deposited correctly into the City’s equitable sharing revenue account and shall be reported as other income on the Equitable Sharing Agreement and Certification. Contact Name: John Zakibe, Deputy Comptroller Contact Telephone Number: (314) 622-4912 FINDING 2012-08
Federal Program Title – Shared Federally Forfeited Property Program CFDA No. – 16.000 Federal Agency – U.S. Department of Justice – Direct Program Federal Award Numbers – MOSPD0024 Grant Award Periods – July 1, 2011 through June 30, 2012 Compliance Requirement – Procurement and Suspension and Debarment Criteria – 2 Code of Federal Regulations (CFR) Part 180 states that non-Federal entities are prohibited from contracting with or making subawards under covered transactions to parties that are suspended or debarred or whose principals are suspended or debarred. Covered transactions include those procurement contracts for goods and services awarded under a nonprocurement transaction that are expected to equal or exceed $25,000 or meet certain other specified criteria, as defined within 2 CFR Part 180. Specifically, when entering into a covered transaction, the City must verify that the other party is not excluded or disqualified by (a) checking the Excluded Party List System (EPLS), (b) collecting a certification from the entity, if allowed by the Federal agency responsible for the transaction, or (c) by adding a clause or condition to the covered transaction with the entity. Conditions Found – The City did not have an effective system of internal control in place to ensure compliance with the procurement and suspension and debarment compliance requirement. While performing test work over the City’s compliance with the procurement and suspension and debarment compliance requirement, it was identified that 3 of 4 vendors who had covered transactions selected for test work were not substantiated with documentation evidencing the City’s verification that the other entities were not suspended or debarred, as required by 2 CFR Part 180.

CITY OF ST. LOUIS, MISSOURI
Schedule of Findings and Questioned Costs, continued
Year ended June 30, 2012
44
Questioned Costs – There are no questioned costs as the entities the City had covered transactions with were not suspended or debarred as identified by checking the EPLS website subsequent to the sample being selected for test work. Context – The condition found impacts 3 of 4 venders who had covered transactions for the Shared Federally Forfeited Property program during the year ended June 30, 2012. Covered transactions relative to procurement activities for the period ended June 30, 2012 were estimated to be $333,000. We subsequently tested all covered transactions during the year June 30, 2012 by verifying whether or not any of the entities were suspended or debarred as identified by checking the EPLS website. None of the covered transactions selected for test work were suspended or debarred upon review of the EPLS. Cause and Effect – The City did not have a mechanism in place, as prescribed above, for compliance with the procurement and suspension and debarment compliance requirement for covered transactions. Recommendations – The City needs to establish an effective system of internal control to ensure compliance with the procurement and suspension and debarment compliance requirement. We recommend the City maintain documentation to evidence compliance in accordance with 2 CFR Part 180. View of Responsible Official and Corrective Action Plan – The City agrees with the condition found. The City’s Purchasing Division will continue to enhance the established system to create file copies of the results of checking proposed vendors on the Excluded Party List System (EPLS) website and including them within the Asset Forfeiture records. The procedure and controls will ensure the City’s compliance with the procurement, suspension and debarment requirement and will be fully implemented by June 30, 2013. Contact Name: John Zakibe, Deputy Comptroller Contact Telephone Number: (314) 622-4912 FINDING 2012-09
Federal Program Title – Workforce Investment Act (WIA) Cluster CFDA Nos. – 17.258; 17.259; 17.260; 17.277; and 17.278 Federal Agency – U.S. Department of Labor – passed through the Missouri Department of Economic
Development – Division of Workforce Development (including ARRA expenditures) Federal Award Numbers – 10-06-06-12, 99-06-06-12, and 75-06-06-09 Grant Award Periods – April 1, 2011 through June 30, 2012, July 1, 2011 through June 30, 2012, and
February 17, 2009 through June 30, 2012, respectively Compliance Requirements – Allowable Costs/Cost Principles and Cash Management Criteria – OMB Circular A-87 outlines basic guidelines related to the allowability of costs, including that such costs must be necessary and reasonable for proper and efficient performance and administration of Federal awards and be adequately documented. Additionally, the City’s WIA Cluster is funded on a reimbursement basis as set forth in the award with the Division of Workforce Development to prevent the

CITY OF ST. LOUIS, MISSOURI
Schedule of Findings and Questioned Costs, continued
Year ended June 30, 2012
45
accumulation of excess cash. As set forth in 45 CFR Part 92.21 and Treasury regulations 31 CFR Part 205, the City is required to pay program costs for the WIA Cluster before requesting reimbursement. Conditions Found – The City did not have an effective system of internal control in place during all of fiscal year 2012 to ensure compliance with the allowable costs/cost principles and cash management compliance requirements. While performing test work on cash management drawdowns, the City returned $41,361 at the direction of the Missouri Department of Economic Development – Division of Workforce Development (DWD); since, the City was unable to provide authorized expenditure detail for the $41,361 that had been drawn down. Questioned Costs – Known questioned costs and most likely questioned costs are $41,361, which represents the drawdowns returned by the City to the DWD. Context – Total drawdowns for the WIA Cluster for the year ended June 30, 2012 were $4,136,494 for non-ARRA expenditures and $36,747 for ARRA expenditures. Cause and Effect – The City did not have an effective system of internal control to ensure that supporting documentation for cash drawdowns made for the WIA Cluster were adequately maintained. Recommendations – The City needs to establish an effective system of internal control to ensure compliance with the allowable costs/cost principles and cash management compliance requirements. The City must maintain supporting documents and all other records pertinent to an award to support the draw down and the expenditure. View of Responsible Official and Corrective Action Plan – The City agrees with the finding. We are working with the State of Missouri at this time to find a solution. Although the expenditure is not in question, there is a question as to the appropriate funding stream (by year) that it applies. Contact Name: John Zakibe, Deputy Comptroller Contact Telephone Number: (314) 622-4912 FINDING 2012-10
Federal Program Title – Highway Planning and Construction Cluster CFDA No. – 20.205 Federal Agency – U.S. Department of Transportation – passed through the Missouri Department of Transportation (including ARRA expenditures) Federal Award Numbers – Various Grant Award Periods – Various Compliance Requirement – Cash Management and Matching, Level of Effort, and Earmarking Criteria – The City’s Highway Planning and Construction Cluster is passed through the Missouri Department of Transportation. Grant agreement STP-5422(612), entered into between the City and the Missouri Department of Transportation, required that the City provide 20% as matching funds.
CITY OF ST. LOUIS, MISSOURI
Schedule of Findings and Questioned Costs, continued
Year ended June 30, 2012
46
Conditions Found – The City did not have an effective system of internal control in place to ensure compliance with the cash management and matching, level of effort, and earmarking compliance requirements. As identified within the criteria above, the City is required to match 20% of costs related to grant agreement STP-5422(612). While performing test work it was identified that one of 25 expenditures selected for test work included amounts that did not comply with the matching compliance requirements. Specifically, an expenditure in the amount of $158,051 was drawn down at 100% for the Highway Planning and Construction Cluster that should have only been drawn at 80%, causing an overdraw in the amount of $31,620 and resulting in the City not matching the required 20%. Questioned Costs – Known questioned costs are $31,620, which represents the amount identified during test work that were drawn down in excess of the allowable federal percentage. Most likely questioned costs are $186,441, which represents the total amount the City drew down in excess of the allowable federal percentage for grant agreement STP-5422(612). Context – Based upon the test work performed, the conditions found related to total draw down expenditures in the amount of $932,209, which represents the total amount of the cash draw for grant agreement STP-5422(612). The City’s records indicate that a total of $186,441 was erroneously drawn down in excess of the allowable federal share ($932,209*80%=$745,767, $932,209-$745,767=$186,441). Cause and Effect – The City did not have an effective system of internal control in place to ensure that costs were reimbursed in accordance with matching requirements, which resulted in costs being drawn down in excess of the allowable federal share for grant agreement STP-5422(612). Recommendations – The City needs to establish an effective system of internal control to ensure compliance with the cash management and matching, level of effort, and earmarking compliance requirements related to the Highway Planning and Construction Cluster. View of Responsible Official and Corrective Action Plan – The City agrees with the condition found. The City will institute a process that will ensure that reimbursements are requested in accordance with the terms of the grant agreements with the Missouri Department of Transportation and the Federal Highway Commission. Contact Name: John Zakibe, Deputy Comptroller Contact Telephone Number: (314) 622-4912
FINDING 2012-11
Federal Program Title – Human Immunodeficiency Virus (HIV) Emergency Relief Project Grants CFDA No. – 93.914 Federal Agency –Department of Health and Human Services – Direct Program Federal Award Numbers – H89HA00033-18-05 and H89HA00033-19-08 Grant Award Periods – March 1, 2011 through February 29, 2012 and March 1, 2012 through
February 28, 2013, respectively

CITY OF ST. LOUIS, MISSOURI
Schedule of Findings and Questioned Costs, continued
Year ended June 30, 2012
47
Compliance Requirement – Allowable Costs/Cost Principles Criteria – OMB Circular A-87 outlines basic guidelines related to the allowability of costs, including that such costs must be necessary and reasonable for proper and efficient performance and administration of Federal awards and be adequately documented. Additionally, OMB Circular A-87 requires that where employees are expected to work solely on a single Federal award or cost objective, charges for their salaries and wages be supported by periodic certifications that the employees worked solely on that program for the period covered by the certification. Conditions Found – The City did not have an effective system of internal control in place during fiscal year 2012 to ensure compliance with the allowable costs/cost principles compliance requirement. While performing test work on salary and benefit expenditures, the City was unable to provide the required authorized time sheets (which contained A-87 language) for one of 50 payroll expenditures selected for test work. Additionally, while performing test work over the periodic certifications for employees who work solely on a single Federal award, it was identified that for three, which related to one employee, of 50 payroll expenditures selected for test work, the OMB Circular A-87 certification for the period July 1, 2011 through September 2, 2011 could not be provided (September 2, 2011 was the employee’s separation date). In addition, while performing test work on salary and benefit expenditures, it was identified that for one of 50 payroll expenditures selected for test work, the City did not accurately record the allocation of salary expenditures onto the general ledger, which resulted in an over charge of salary and benefits expense to the HIV Emergency Relief Project Grants (HIV program) of $246. Questioned Costs – Known questioned costs for the missing authorized time sheet are $2,189, which represents the salary and benefits expense drawn for the HIV program for the year ended June 30, 2012. Additionally, known questioned costs for the periodic certification are $15,805, which represents the salary and benefits expense charged to the HIV program for the period July 1, 2011 through September 2, 2011. In addition, known questioned costs related to the payroll over charge were $246, which represents the salary and benefits expense charged to the HIV program, for the year ended June 30, 2012. Most likely questioned costs cannot be determined. Context – Total cash-basis salaries and benefits charged to the HIV program for the year ended June 30, 2012 were $523,999. Cause and Effect – The City did not have an effective system of internal control to ensure that supporting documentation for salary and benefit expenses charged to the HIV program was adequately maintained for all required employees. The City believes that clerical errors were the cause of the conditions found.

CITY OF ST. LOUIS, MISSOURI
Schedule of Findings and Questioned Costs, continued
Year ended June 30, 2012
48
Recommendations – The City needs to establish an effective system of internal control to ensure compliance with the allowable costs/cost principles compliance requirement. The City must maintain supporting documents and all other records pertinent to an award to support the draw down and the expenditure. In addition, the City should require all employees who work solely on the HIV program to complete an accurate periodic certification as required by OMB A-87 and enhance their training efforts to reduce the risk that employees inaccurately certify their time. In addition, the City should include completion of A-87 certifications on the exit checklist for employees who resign during a certification period. View of Responsible Official and Corrective Action Plan – The City agrees with the condition found. Additional procedures will be implemented to ensure that all A-87 certifications and time documentation forms are completed and submitted in a timely manner and maintained; and applicable payroll adjusting entries are completed and submitted in a timely manner. Contact Name: John Zakibe, Deputy Comptroller Contact Telephone Number: (314) 622-4912

OMB Circular A-133 Single Audits For The Year Ended
June 30, 2012
SUMMARY SCHEDULE OF PRIOR AUDIT FINDINGS
FINDING 2010-09 Federal Program: Community Development Block Grants/Entitlement Grants (CDBG) CFDA Nos.: 14.218 and 14.253 Federal Grantor: U.S. Department of Housing and Urban Development – Direct
Program (including ARRA expenditures) Compliance Requirement: Allowable Cost/Cost Principles and Cash Management Contact Person: Jill Claybour, Acting Executive Director, Community
Development Administration Contact Telephone: (314) 657-3835 Status as previously reported: Community Development Administration A-133 Audit
Response December 2011 Time sheets from the City Department cited will be reviewed by
the Program Monitor during their site visit to ensure supporting documentation is maintained. All A-87 certifications will be reviewed for accuracy and initialed by the Program Monitor upon receipt from City departments. These procedures will be fully implemented by June 30, 2011.
Internal Audit Section Review February 2012 Not Corrected: CDA indicated that this finding involved Federal
Grant Section's CDBG time sheets and payroll registers. CDA requested a site visit with the Federal Grant Section (FGS) by their Community Development Intern, who was to review a sample of documents for accuracy. Several attempts to schedule a visit with FGS were unsuccessful and the Community Development Intern has since left the Agency. CDA has requested to review FGS’ CDBG bi-weekly timesheets, for the audit period July 1, 2010 to June 30, 2011.
OFFICE OF THE COMPTROLLER CITY OF ST. LOUIS
212 City Hall (314) 622-3588 FAX 622-4026
DARLENE GREEN Comptroller

OMB Circular A-133 Single Audit For The Year Ended
June 30, 2012
SUMMARY SCHEDULE OF PRIOR AUDIT FINDINGS
2
Updated status: Internal Audit Section Review June 2012 Corrected: CDA has provided to IAS a Programmatic Monitor
Checklist, signed by a program monitor, certifying that the timesheets are reviewed.
FINDING 2010-11 FINDING 2011-07 Federal Program: Community Development Block Grants/Entitlement Grants
(CDBG) CFDA Nos.: 14.218 and 14.253 Federal Grantor: U.S. Department of Housing and Urban Development – Direct
Program (including ARRA expenditures) Compliance Requirement: Program Income and Reporting Contact Person: Jill Claybour, Acting Executive Director, Community
Development Administration Contact Telephone: (314) 657-3835 Status as previously reported: Community Development Administration A-133 Audit
Response December 2011 CDA will ensure that reports, required by 24 CFR Part 570, are
accurate and complete. A correcting adjustment will be included in the report to the grantor for the period ending March 31, 2011.
Internal Audit Section Review February 2012 Partially Corrected: The Agency indicates that this was an FGS
issue, where adjustments were not being entered into the general ledger in a timely manner. For this reason, amounts reported on Form 272 differed from general ledger amounts. Form 272 for the period from January 1, 2011 to March 31, 2011 was reviewed. A correcting adjustment, in the amount of $300,298.21, was included on the form. The explanation in the remarks section indicated that the adjustment of prior periods represents program income posted on the General Ledger, but not included in the 272 Report.
Updated status: Internal Audit Section Review June 2012 Corrected: CDA provided a copy of the latest Form 272 report to
IAS. The remark section says that the amounts are from the City's general Ledger for the Quarterly Reporting Period. The form is signed by the Director of CDA.

OMB Circular A-133 Single Audit For The Year Ended
June 30, 2012
SUMMARY SCHEDULE OF PRIOR AUDIT FINDINGS
3
FINDING 2007-21 FINDING 2008-17 FINDING 2009-10 FINDING 2010-12 FINDING 2011-08 Federal Program: Community Development Block Grants/Entitlement Grants
(CDBG) CFDA Nos.: 14.218 and 14.253 Federal Grantor: U.S. Department of Housing and Urban Development – Direct
Program (including ARRA expenditures) Compliance Requirement: Reporting Contact Person: Jill Claybour, Acting Executive Director, Community
Development Administration Contact Telephone: (314) 657-3835 Status as previously reported: Internal Audit Section Review December 2011
Partially Corrected: The 2009 FSR was reviewed. Line 1 (Unexpended CDBG Funds at End of Previous Program Year) of the 2009 FSR matched Line 16 (Unexpended Balance) of the 2008 FSR. The total expenditures on Line 15 of the 2009 FSR matched the general ledger amounts for the reconciled expenditures.
Community Development Administration A-133 Audit Response December 2011
Internal control processes will have been instituted to ensure the accuracy of information reported in the CAPER and on the Recovery Act reporting website by June 30, 2011.
Internal Audit Section Review February 2012
Partially Corrected: CDA stated that this was an FGS issue, where FGS did the reconciliation and provided CDA with the numbers to put into the CAPER. CDA indicated that the inaccurate information was due to clerical error and has been corrected. An amended 2009 CAPER was sent to HUD on December 28, 2010.
Updated Status: Internal Audit Section Review June 2012 Not Corrected: CDA has provided a copy of the general ledger with the adjusting entry for prior periods. However, similar reporting errors were noted for the current year.
FINDING 2002-04

OMB Circular A-133 Single Audit For The Year Ended
June 30, 2012
SUMMARY SCHEDULE OF PRIOR AUDIT FINDINGS
4
FINDING 2003-06 FINDING 2004-03 FINDING 2005-02 FINDING 2006-07 FINDING 2007-25 FINDING 2008-21 FINDING 2009-14 FINDING 2010-14 FINDING 2011-10 Federal Program: Supportive Housing Program CFDA No.: 14.235 Federal Grantor: U.S. Department of Housing and Urban Development – Direct
Program Compliance Requirement: Reporting Contact Person: Antoinette Triplett, Program Manager II, Department of Human Services Contact Number: (314) 657-1702 Status as previously reported: Internal Audit Section Review December 2010
Not Corrected: DHS provided IAS with an APR tracking spreadsheet for the operating year from July 1, 2010 to June 30, 2011. Since the 2011 fiscal year has not yet ended, the columns on the APR spreadsheet that tracks APR reminders and submissions was blank. IAS was not able to determine whether this document is effective in ensuring 24 CFR, Section 583 deadline compliance is being met. IAS requested an APR tracking sheet for the operating year July 1, 2009 to June 30, 2010, but none was provided by DHS.
Department of Human Services A-133 Audit Response - December 2011 The City agrees with the condition found. The Homeless Services Division has made tremendous strides in reducing the number of late APR’s to U.S. Department of Housing and Urban Development from 19 APR’s in the past to 4 APR’s. All subject APR’s, except Hope House, were submitted to the Homeless Services Division on the required due date. The delays occurred after the Homeless Services Manager returned the documents to the Agencies for corrections and awaiting approvals of the paper format. Homeless Services has developed and implemented policies and procedures to reduce the late APR’s. APR’s are now

OMB Circular A-133 Single Audit For The Year Ended
June 30, 2012
SUMMARY SCHEDULE OF PRIOR AUDIT FINDINGS
5
submitted to DHS and to HUD electronically. The Homeless Services Manager is reviewing and submitting the APR’s to HUD within 5 business days. The electronic submissions also allow all participants to complete their portions of the APR even when away from the office. It also reduces the time required to mail or deliver the paper format. These procedures will be fully implemented by March 31, 2011.
Internal Audit Section Review February 2012
Not Corrected: IAS requested for DHS to submit their APR tracking spreadsheet for review. However, DHS has not submitted the requested documentation or any supporting documentation that would be evidence that the issue has been resolved.
Updated Status: Internal Audit Section Review June 2012 Not Corrected: The Agency produced a copy of their APR procedures since their APR is completed electronically. The procedures were updated on June 2012. However; similar errors were noted in the current year.
FINDING 2009-15 FINDING 2010-15 FINDING 2011-17 Federal Program: Shared Federally Forfeited Property Program CFDA No.: 16.000 Federal Grantor: U.S. Department of Justice – Direct Program Compliance Requirement: Procurement, Suspension, and Debarment Contact Person: David Daniels, Director of Budget and Finance, SLMPD Contact Telephone: (314) 444-5518 Status as previously reported: Internal Audit Section Review December 2010 Partially Corrected: A written procurement policy has been
added to the Purchasing Manual. However, the Director of Budget and Finance has indicated that there has been non-compliance with the written procedures.
SLMPD Budget and Finance Division A-133 Audit Response December 2011
The Department agrees with the condition found. The Police Department’s Purchasing Division will begin creating file copies of the results of checking proposed vendors on the Excluded Party

OMB Circular A-133 Single Audit For The Year Ended
June 30, 2012
SUMMARY SCHEDULE OF PRIOR AUDIT FINDINGS
6
List System (EPLS) website and including them within the Asset Forfeiture records. This procedure will verify the Department’s compliance with the procurement, suspension and debarment requirement, which will be fully implemented by March 31, 2011.
Internal Audit Section Review February 2012 Partially Corrected: The Department has put into place a
procedure requiring the Purchasing Division to perform an EPLS check on vendors, for every purchase, which is in compliance with the procurement, suspension and debarment requirement. However, there is no evidence that the procedure has been formally documented as part of the Department’s financial policies and procedures, and formally communicated to the Purchasing Division.
Updated Status: Internal Audit Section Review June 2012 Not Corrected: The Agency has provided documentation that the vendor has not been disbarred from receiving federal funds. However; similar errors were noted in the current year.
FINDING 2004-07 FINDING 2005-06 FINDING 2007-37 FINDING 2008-25 FINDING 2009-17 FINDING 2010-17 FINDING 2011-18 Federal Program: Workforce Investment Act (WIA) Cluster CFDA Nos.: 17.258; 17.259; 17.260; and 17.278 Federal Grantor: U.S. Department of Labor – passed through the Missouri
Department of Economic Development Compliance Requirement: Cash Management Contact Person: Michael Holmes, Executive Director, SLATE Contact Telephone: (314) 657-3575 Status as previously reported: Internal Audit Section Review December 2010
Not Corrected. SLATE currently stands by their 2009 Corrective Action Plan, where it is looking into getting new accounting software and implementing reconciliation procedures. No evidence has been presented by SLATE to indicate that

OMB Circular A-133 Single Audit For The Year Ended
June 30, 2012
SUMMARY SCHEDULE OF PRIOR AUDIT FINDINGS
7
reconciliation procedures and accounting software has been, or is in the process of being implemented. St. Louis Agency on Training and Employment A-133 Audit Response December 2011 We concur with the finding. The State of Missouri mandates that SLATE draw down on a weekly basis which would not allow for reconciliation of the general ledger before draw down. However, we do use the Accounting Information Management System (AIMS) to complete the draws, and have implemented new procedures to ensure that the end of the month draw includes any adjustments that have taken place during the month. This includes reconciling to the trial balance on a monthly basis. This corrective action will be fully implemented as of March 31, 2011.
Internal Audit Section Review February 2012 Not Corrected: The new procedures for the draw downs have been documented by the Accountant-in-charge. However, for selected periodic draw downs tested, the amount of funds requested and received from the State did not agreed with the City G/L balances for the expenditures paid and posted. The Accountant-in-charge attributed the discrepancies to the timing of draws down. She explained that the funds request and draw down, for the period ended July 11, 2011, included some June 2011 paid expenditures not drawn down before the end of the month. The period was, also the end of the fiscal year for the City. Other factors attributing to the differences were the closing entry postings for the prior month’s expenditures.
Updated Status: Internal Audit Section Review June 2012 Not Corrected: The Agency has provided an entry detailing a draw down for the State of Missouri. In addition, documentation was provided to demonstrate that the entry was recorded in the Comptroller's general ledger system. However; similar errors were noted in the current year.
FINDING 2010-19 FINDING 2011-19 Federal Program: Workforce Investment Act (WIA) Cluster CFDA Nos.: 17.258; 17.259; 17.260; and 17.278

OMB Circular A-133 Single Audit For The Year Ended
June 30, 2012
SUMMARY SCHEDULE OF PRIOR AUDIT FINDINGS
8
Federal Grantor: U.S. Department of Labor – passed through the Missouri Department of Economic Development – Division of Workforce Development (including ARRA expenditures)
Compliance Requirement: Reporting Contact Person: Michael Holmes, Executive Director, SLATE Contact Telephone: (314) 657-3575 Status as previously reported: Saint Louis Agency on Training and Employment A-133 Audit
Response - December 2011 We agree with the finding and as of March 31, 2011 the SLATE
fiscal department will have implemented procedures to prevent this from occurring in the future, which includes reconciliation of the general ledger, draw downs, and reporting (CPR).
Internal Audit Section Review February 2012 Not Corrected: The procedures for preparing the CPR report
have been documented by the Accountant-in-charge. The CPR report is generated monthly using the newly acquired accounting software program. However, the City reported expenditures, including accruals, as submitted to the Missouri Division of Workforce Development, for the month of November 2011 selected for testing, did not agree to the City's financial records (G/Ls). Some of the expenditures, $5,921.97, and $10,056.33, reported to the State were classified as ACCESS and SPYC, respectively, but could not be identified in the City financial records (G/Ls) with the description (described as November 2011 Accruals).
Updated Status: Internal Audit Section Review February 2012 Corrected: The expenditures reported to the state has been
identified in City records. The Agency has provided a copy of the General Ledger showing the description “WIA YTH SPYC” and “WIA 15% AD ACCESS”.
FINGING 2006-15 FINDING 2007-39 FINDING 2008-27 FINDING 2010-20 FINDING 2011-20 Federal Program: Workforce Investment Act (WIA) Cluster CFDA Nos.: 17.258; 17.259; 17.260; and 17.278

OMB Circular A-133 Single Audit For The Year Ended
June 30, 2012
SUMMARY SCHEDULE OF PRIOR AUDIT FINDINGS
9
Federal Grantor: U.S. Department of Labor – passed through the Missouri Department of Economic Development – Division of Workforce Development (including ARRA expenditures)
Compliance Requirement: Subrecipient Monitoring Contact Person: Kenneth M. Stone, Internal Audit Executive, Internal Audit
Section Contact Telephone: (314) 657-3459 Status as previously reported: Internal Audit Section A-133 Audit Response - December 2011 The City agrees with the condition found. The two subrecipients
noted, that did not have a site visit in fiscal year 2010, had their contracts extended into fiscal 2010. The funding agency did not inform the Internal Audit Section (IAS) of the contract extensions. These two subrecipients were not on IAS’ listing of reviews to be conducted in fiscal year 2010. IAS had conducted fiscal monitoring review of the two noted subrecipients in fiscal year 2009. The majority of program expenditures occurred in fiscal year 2009.
Ms. Lolita Versey, Auditor II, IAS’ contact person with the
funding agency, has already met with and discussed the need for the funding agency to keep us informed of any changes in contract terms and/or extensions with subrecipients. The enhanced communication policies will be fully implemented by March 31, 2011.
Updated Status: Internal Audit Section Review June 2012 Corrected: All of the Agency's projects have been placed in IAS
project status report for fiscal year 2013. It appears that the monitoring track sheet is complete.
FINDING 2011-09 Federal Program: Community Development Block Grants/Entitlement Grants
(CDBG) CFDA Nos.: 14.218 and 14.253 Federal Grantor: U.S. Department of Housing and Urban Development – Direct
Program (including ARRA expenditures) Compliance Requirement: Special Tests and Provisions – Environmental Reviews Contact Person: Jill Claybour, Acting Executive Director, Community
Development Administration

OMB Circular A-133 Single Audit For The Year Ended
June 30, 2012
SUMMARY SCHEDULE OF PRIOR AUDIT FINDINGS
10
Contact Telephone: (314) 657-3835 Status as previously reported: Community Development Administration A-133 Audit
Response June 2011 The City concurs with the conditions found. The project noted in the report was categorically exempt. All future project lists will be provided by the Executive Director staff to CDA for environmental reviews to ensure all projects are included.
Updated Status: Internal Audit Section Review June 2012
Corrected: CDA has given the Auditor regulation 24 CFR 58.34 (a) (4) and (9). This regulation states that the Equal Housing Opportunity Council project was exempt from completing an environmental review on the audited projects.
FINDING 2011-11 Federal Program: Home Investment Partnerships Program CFDA No: 14.239 Federal Grantor: U.S. Department of Housing and Urban Development – Direct
Program Compliance Requirement: Eligibility Contact Person: Jill Claybour, Acting Executive Director, Community
Development Administration Contact Telephone: (314) 657-3835 Status as previously reported: Community Development Administration A-133 Audit
Response June 2011 The City concurs with the conditions found. Due to the sensitivity of income documentation, the City prefers not to maintain tenant income documentation in our office files. Processes and review certifications are being developed to evidence the review of the source documentation that is maintained by the property owners.
Updated Status: Internal Audit Section Review June 2012
Corrected: CDA provided documentation of the programmatic monitor certifying that they reviewed the income documentation and that the documentation was adequate.

OMB Circular A-133 Single Audit For The Year Ended
June 30, 2012
SUMMARY SCHEDULE OF PRIOR AUDIT FINDINGS
11
FINDING 2011-12 Federal Program: Home Investment Partnerships Program CFDA No: 14.239 Federal Grantor: U.S. Department of Housing and Urban Development – Direct
Program Compliance Requirement: Reporting Contact Person: Jill Claybour, Acting Executive Director, Community
Development Administration Contact Telephone: (314) 657-3835 Status as previously reported: Community Development Administration A-133 Audit
Response June 2011 The City concurs with the conditions found. A Section 3 year end report was requested from the developer in January 2011 with follow up emails, phone calls, and letters to meet the Section 3 March 31, 2011 reporting deadline. A report was not received from the developer for 2010 activities until January 2012. In the future, developers subject to Section 3 reporting requirements will be made aware of funding sanctions to be imposed by CDA if reports are not submitted by federal due dates.
Updated Status: Internal Audit Section Review June 2012
Corrected: CDA provided correspondence indicating that the Agency complied with Section 3 compliance.
FINDING 2011-13 Federal Program: Home Investment Partnerships Program CFDA No: 14.239 Federal Grantor: U.S. Department of Housing and Urban Development – Direct
Program Compliance Requirement: Subrecipient Monitoring Contact Person: Jill Claybour, Acting Executive Director, Community
Development Administration Contact Telephone: (314) 657-3835 Status as previously reported: Community Development Administration A-133 Audit
Response June 2011 The City concurs with the conditions found. The annual tracking sheet prepared and maintained by Internal Audit will be reviewed by CDA staff to ensure all federal and state grant funding sources

OMB Circular A-133 Single Audit For The Year Ended
June 30, 2012
SUMMARY SCHEDULE OF PRIOR AUDIT FINDINGS
12
for each Agency are included. All contracts will be reviewed by the CDA Fiscal Section prior to routing for execution to ensure CFDA numbers for all grant funding sources are included.
Updated Status: Internal Audit Section Review June 2012
Corrected: CDA provided a copy of the A-133 report showing that the CFDA number is documented in the home grants.
FINDING 2011-14 Federal Program: Home Investment Partnerships Program CFDA No: 14.239 Federal Grantor: U.S. Department of Housing and Urban Development – Direct
Program Compliance Requirement: Special Tests and Provisions – Housing Quality Standards Contact Person: Jill Claybour, Acting Executive Director, Community
Development Administration Contact Telephone: (314) 657-3835 Status as previously reported: Community Development Administration A-133 Audit
Response June 2011 The City concurs with the conditions found. Due to a vacancy in our asset manager position, a review of the inspections completed and follow up on any needed repairs were not documented. Responsibility for these duties has been assigned to other staff members to ensure compliance with Home regulations.
Updated Status: Internal Audit Section Review June 2012
Not Corrected: CDA provided a copy of the A-133 report showing that the CFDA number is documented in the home grants. However; similar errors were noted in the current year.
FINDING 2011-15 Federal Program: Homelessness Prevention and Rapid Re-Housing Program (HPRP) CFDA No.: 14.257 Federal Grantor: U.S. Department of Housing and Urban Development – Direct
Program Compliance Requirement: Reporting Contact Person: Antoinette Triplett, Program Manager II, Department of Human Services

OMB Circular A-133 Single Audit For The Year Ended
June 30, 2012
SUMMARY SCHEDULE OF PRIOR AUDIT FINDINGS
13
Contact Number: (314) 657-1702 Status as previously reported: Department of Human Services A-133 Audit
Response June 2011 The City concurs with the conditions found. The City will ensure that the total expenditures reported to Federalreporting.gov agree with the City’s general ledger. Additionally, the City will report via the 1512 Reports, all Sub Award payments, separately. Currently, the City reports the total expenditures for all sub-awardees.
Updated Status: Internal Audit Section Review June 2012
Partially Corrected: A journal entry has been made to reconcile the final 1512 Report to the City’s general ledger. The City has not entered into any additional HPRP contracts since fiscal year 2010; therefore there were no additional sub awards made during the current fiscal year.
FINDING 2011-16 Federal Program: Homelessness Prevention and Rapid Re-Housing Program (HPRP) CFDA No.: 14.257 Federal Grantor: U.S. Department of Housing and Urban Development – Direct
Program Compliance Requirement: Subrecipient Monitoring Contact Person: Antoinette Triplett, Program Manager II, Department of Human Services Contact Number: (314) 657-1702 Status as previously reported: Department of Human Services A-133 Audit
Response June 2011 The City concurs with the conditions found. In the future, if there are additional subrecipient contracts, the city will ensure all required information is included within subrecipient contracts.
Updated Status: Internal Audit Section Review June 2012
Not Corrected: The City has not entered into any additional HPRP contracts since fiscal year 2010; therefore there is no change in the finding.


CITY OF ST. LOUIS, MISSOURI Comprehensive Annual Financial Report Table of Contents June 30, 2012 INTRODUCTORY SECTION Page(s)
Letter of Transmittal I-V
Certificate of Achievement for Excellence in Financial Reporting VI
Elected Officials VII
Organization Charts VIII-IX
FINANCIAL SECTION
Independent Auditors’ Report 1-2
Management’s Discussion and Analysis – Required Supplementary Information 3-18
Basic Financial Statements:
Government-wide Financial Statements:
Statement of Net Assets 19
Statement of Activities 20
Fund Financial Statements:
Balance Sheet – Governmental Funds 21
Reconciliation of the Balance Sheet of Governmental Funds to the Statement of Net Assets 22
Statement of Revenues, Expenditures, and Changes in Fund Balances – Governmental Funds 23
Reconciliation of the Statement of Revenues, Expenditures, and Changes in Fund Balances of Governmental Funds to the Statement of Activities 24
Statement of Fund Net Assets – Proprietary Funds 25
Statement of Revenues, Expenses, and Changes in Fund Net Assets – Proprietary Funds 26
Statement of Cash Flows – Proprietary Funds 27
Statement of Fiduciary Net Assets – Fiduciary Funds 28
Statement of Changes in Fiduciary Net Assets – Fiduciary Funds 29
Notes to Basic Financial Statements 30-122
Schedule Page(s) Budgetary Comparison Information – Required Supplementary Information:
Schedule of Revenues, Expenditures, and Changes in Fund Balances – Budget and Actual – General Fund 1 123-126
Notes to Schedule of Revenues, Expenditures, and Changes in Fund Balances – Budget and Actual – General Fund 2 127-128
Retirement Systems and Other Postemployment Benefit Plans – Required Supplementary Information 3 129-130

CITY OF ST. LOUIS, MISSOURI Comprehensive Annual Financial Report June 30, 2012 Table of Contents
Schedule Page(s) Combining and Individual Fund Financial Statements and Schedules – Additional Supplementary Information:
Combining Balance Sheet – Nonmajor Governmental Funds 4 131-132
Combining Statement of Revenues, Expenditures, and Changes in Fund Balances – Nonmajor Governmental Funds 5 133-134
Schedules of Revenues, Expenditures, and Changes in Fund Balances – Budget and Actual:
Special Revenue Funds – Nonmajor:
Use Tax Fund 6 137
Transportation Fund 7 138
Convention and Tourism Fund 8 139
Licensed Gaming Program Fund 9 140
Assessor’s Office Fund 10 141
Lateral Sewer Program Fund 11 142
Tax Increment Financing Fund 12 143
Public Safety Trust Fund 13 144
Public Safety Sales Tax Fund 14 145
Parks and Recreation Fund 15 146
Other Budgeted Special Revenue Fund 16 147
Debt Service Fund – Nonmajor 17 148
Capital Projects Fund – Major 18 149
Schedule of Reconciling Items Between Change in Fund Balances – Budget Basis and Change in Fund Balances – GAAP Basis – 19 150
Combining Statement of Net Assets – Internal Service Funds 20 152
Combining Statement of Revenues, Expenses, and Changes in Fund Net Assets – Internal Service Funds 21 153
Combining Statement of Cash Flows – Internal Service Funds 22 154
Combining Statement of Fiduciary Net Assets – Pension Trust Funds 23 156
Combining Statement of Changes in Fiduciary Net Assets – Pension Trust Funds 24 157
Combining Statement of Fiduciary Net Assets – Agency Funds 25 159
Combining Statement of Changes in Assets and Liabilities – Agency Funds 26 160-161
Discretely Presented Component Unit – Solid Waste Management and Development Corporation:
Statement of Revenues, Expenses, and Changes in Net Assets 27 163
Statement of Cash Flows 28 164

CITY OF ST. LOUIS, MISSOURI Comprehensive Annual Financial Report Table of Contents June 30, 2012 STATISTICAL SECTION Table Page(s)
Government-wide Information:
Net Assets by Component 1 166
Changes in Net Assets 2 167-170
Fund Information:
Fund Balances, Governmental Funds 3 171
Changes in Fund Balances, Governmental Funds 4 172-173
Assessed Value and Actual Value of Taxable Property 5 174
Property Tax Rates Per $100 Assessed Value – Direct and Overlapping Governments 6 175
Principal Property Taxpayers Identified by Industry Classification 7 176
General and Debt Service Funds – Property Tax Levies and Collections 8 177
Earnings and Payroll Tax 9 178
Principal Earnings and Payroll Taxpayers 10 179
Ratio of Outstanding Debt by Type 11 180
Ratio of Net General Obligation Debt Outstanding 12 181
Direct and Overlapping Governmental Activities Debt 13 182
Legal Debt Margin Calculation 14 183
Pledged Revenue Coverage 15 184-192
Demographic and Economic Statistics 16 193
Principal Employers 17 194
Full-time Equivalent City Government Employees by Function/Program 18 195
Operating Indicators by Function/Program 19 196-197
Capital Asset Statistics by Function/Program 20 198
St. Louis MSA Population Trends 21 199
St. Louis MSA Civilian Labor Force 22 200
Selected Major Employers in the St. Louis Region 23 201
Scheduled Air Carriers Serving the Airport 24 202
O&D and Connecting Enplanements 25 203
Domestic and International Enplanements 26 204
Airline Market Share 27 205
Historical Air Cargo (in Pounds) 28 206
Ai Traffic Forecast 29 207-210


KPMG LLP Suite 900 10 South Broadway St. Louis, MO 63102-1761
KPMG LLP is a Delaware limited liability partnership, the U.S. member firm of KPMG International Cooperative (“KPMG International”), a Swiss entity.
Independent Auditors’ Report
Honorable Mayor and Members of the Board of Aldermen of the City of St. Louis, Missouri:
We have audited the accompanying financial statements of the governmental activities, the business-type activities, the aggregate discretely presented component units, each major fund, and the aggregate remaining fund information of the City of St. Louis, Missouri, as of and for the year ended June 30, 2012, which collectively comprise the City of St. Louis, Missouri’s basic financial statements as listed in the table of contents. These financial statements are the responsibility of the City of St. Louis, Missouri’s management. Our responsibility is to express opinions on these financial statements based on our audit. We did not audit the financial statements of the pension trust funds and the St. Louis Development Corporation discretely presented component unit. The assets and revenues (additions) of the pension trust funds represent 89% and 28% of the assets and revenues (additions), respectively, of the aggregate remaining fund information. The assets and revenues of the St. Louis Development Corporation represent 56% and 16% of the assets and revenues, respectively, of the aggregate discretely presented component units. The financial statements of the pension trust funds and the St. Louis Development Corporation were audited by other auditors whose reports thereon have been furnished to us, and our opinion, insofar as it relates to the amounts included for those funds and discretely presented component unit, is based solely on the reports of the other auditors.
We conducted our audit in accordance with auditing standards generally accepted in the United States of America and the standards applicable to financial audits contained in Government Auditing Standards, issued by the Comptroller General of the United States. Those standards require that we plan and perform the audit to obtain reasonable assurance about whether the financial statements are free of material misstatement. The financial statements of the pension trust funds were not audited in accordance with Government Auditing Standards. An audit includes consideration of internal control over financial reporting as a basis for designing audit procedures that are appropriate in the circumstances, but not for the purpose of expressing an opinion on the effectiveness of the City of St. Louis, Missouri’s internal control over financial reporting. Accordingly, we express no such opinion. An audit also includes examining, on a test basis, evidence supporting the amounts and disclosures in the financial statements, assessing the accounting principles used and significant estimates made by management, as well as evaluating the overall financial statement presentation. We believe that our audit and the reports of other auditors provide a reasonable basis for our opinions.
In our opinion, based upon our audit and the reports of other auditors, the financial statements referred to above present fairly, in all material respects, the respective financial position of the governmental activities, the business-type activities, the aggregate discretely presented component units, each major fund, and the aggregate remaining fund information of the City of St. Louis, Missouri, as of June 30, 2012, and the respective changes in financial position, and where applicable, cash flows thereof for the year then ended in conformity with U.S. generally accepted accounting principles.

2
In accordance with Government Auditing Standards, we have also issued our report dated December 26, 2012, on our consideration of the City of St. Louis, Missouri’s internal control over financial reporting and on our tests of its compliance with certain provisions of laws, regulations, contracts, and grant agreements and other matters. The purpose of that report is to describe the scope of our testing of internal control over financial reporting and compliance and the results of that testing, and not to provide an opinion on the internal control over financial reporting or on compliance. That report is an integral part of an audit performed in accordance with Government Auditing Standards and should be considered in assessing the results of our audit.
U.S. generally accepted accounting principles require that the Management’s Discussion and Analysis on pages 3 through 18, the Budgetary Comparison Information on pages 123 through 128, and the Retirement Systems and Other Postemployment Benefit Plan Information on pages 129 through 130 be presented to supplement the basic financial statements. Such information, although not a part of the basic financial statements, is required by the Governmental Accounting Standards Board who considers it to be an essential part of financial reporting for placing the basic financial statements in an appropriate operational, economic, or historical context. We and the other auditors have applied certain limited procedures to the required supplementary information in accordance with auditing standards generally accepted in the United States of America, which consisted of inquiries of management about the methods of preparing the information and comparing the information for consistency with management’s responses to our inquiries, the basic financial statements, and other knowledge we obtained during our audit of the basic financial statements. We do not express an opinion or provide any assurance on the information because the limited procedures do not provide us with sufficient evidence to express an opinion or provide any assurance.
Our audit was conducted for the purpose of forming opinions on the financial statements that collectively comprise the City of St. Louis, Missouri’s basic financial statements. The Combining and Individual Fund Financial Statements and Schedules – Additional Supplementary Information are presented for purposes of additional analysis and are not a required part of the basic financial statements. Such information is the responsibility of management and was derived from and relates directly to the underlying accounting and other records used to prepare the basic financial statements. The additional supplementary information has been subjected to the auditing procedures applied by us and the other auditors in the audit of the basic financial statements and certain additional procedures, including comparing and reconciling such information directly to the underlying accounting and other records used to prepare the basic financial statements or to the financial statements themselves, and other additional procedures in accordance with auditing standards generally accepted in the United States of America. In our opinion, based on our audit and the reports of other auditors, the additional supplementary information is fairly stated in all material respects in relation to the basic financial statements as a whole. The Introductory Section and Statistical Section are presented for the purposes of additional analysis and are not a required part of the basic financial statements. Such information has not been subjected to the auditing procedures applied in the audit of the basic financial statements, and accordingly, we do not express an opinion or provide any assurance on them.
St. Louis, Missouri December 26, 2012

3
CITY OF ST. LOUIS MANAGEMENT’S DISCUSSION AND ANALYSIS – UNAUDITED
JUNE 30, 2012 As management of City of St. Louis, Missouri (the City), we offer readers of the City’s Comprehensive Annual Financial Report this narrative overview and analysis of the City for the fiscal year ended June 30, 2012. The information presented here should be read in conjunction with our letter of transmittal and the City’s financial statements including footnotes. All amounts, unless otherwise indicated, are expressed in thousands of dollars. FINANCIAL HIGHLIGHTS (excluding discretely presented component units)
• On a government-wide basis the City’s total assets exceeded its liabilities for the current fiscal year by $1.4 billion.
• Governmental activities and business-type activities had net assets of $84.2 million and $1.3 billion,
respectively.
• The cost of services for the City’s governmental activities was $719.5 million in fiscal year 2012 (excluding interest and fiscal charges).
• As of June 30, 2012, the City’s governmental funds reported combined ending fund balances of
$171.7 million. Of this amount, $9.4 million is unassigned fund balance.
• The unassigned fund balance for the general fund was $29.5 million or 6.4% of total general fund expenditures.
• In fiscal year 2012, the City issued $151.5 million in long-term debt to finance projects and refund
debt. There was a net decrease of $25.9 million in debt during the current fiscal year.
• Net pension obligations/assets changed by $0.7 million due to the difference between the actuarial determined pension contributions to the three pension funds and the amounts actually contributed.
• Tax increment financing (TIF) debt increased liabilities in the amount of $45.3 million. There is no
related asset for TIF debt, so net increases in TIF debt reduce unrestricted net assets by an equal amount.

CITY OF ST. LOUIS MANAGEMENT’S DISCUSSION AND ANALYSIS – UNAUDITED
JUNE 30, 2012
4
OVERVIEW OF THE FINANCIAL STATEMENTS This discussion and analysis is intended to serve as an introduction to the City’s basic financial statements. The City’s basic financial statements include three components: 1) government-wide financial statements, 2) fund financial statements, and 3) notes to the financial statements. This report also contains other supplementary information in addition to the basic financial statements. Government-wide Financial Statements The government-wide financial statements are designed to provide readers with a broad overview of the City’s finances using accounting methods similar to those used by private sector business. The Statement of Net Assets presents information on all of the City’s assets and liabilities, with the difference between the two reported as net assets. Increases and decreases in net assets may serve as a useful indicator of whether or not the financial position of the City is improving or deteriorating. The Statement of Activities presents information showing how the City’s net assets changed during the most recent fiscal year. All changes in net assets are reported as soon as the underlying event giving rise to the change occurs, regardless of the timing of the related cash flows. Thus revenues and expenses reported in this statement for some items will only result in cash flows in future fiscal periods (for example, uncollected taxes and earned but unused vacation leave). The government-wide financial statements distinguish functions of the City that are principally supported by taxes and inter-governmental revenues (governmental activities) from other functions that are intended to recover all or a significant portion of their costs through user fees or charges (business-type activities). The governmental activities of the City include general government, convention and tourism, parks and recreation, judicial, streets, public safety (fire, police, other), health and welfare, public service, and community development as well as interest and fiscal charges. The business-type activities of the City include an airport, water division, and parking division. The government-wide financial statements include not only the City itself (known as the primary government), but also a legally separate redevelopment agency, a legally separate police department for which the City is financially accountable and a legally separate corporation that owns and leases the downtown steam loop. Financial information for these component units is reported separately from the financial information presented for the primary government. Included in the financial statements are the operations of the Public Facilities Protection Corporation (PFPC), St. Louis Municipal Finance Corporation, St. Louis Parking Commission Finance Corporation, and Grand Center Municipal Parking Finance Corporation as blended component units. Fund Financial Statements A fund is a grouping of related accounts that is used to maintain control over resources that have been segregated for specific activities or objectives. The City, like other state and local governments, uses fund accounting to ensure and demonstrate compliance with finance-related legal requirements. The funds of the City can be divided into three categories: governmental funds, proprietary funds and fiduciary funds.
1. Governmental Funds. Governmental funds are used to account for essentially the same functions reported as governmental activities in the government-wide financial statements. However, unlike the government-wide financial statements, governmental fund financial statements focus on near-term inflows and outflows of spendable resources, as well as on balances of spendable resources available at the end of a fiscal year. Such information may be useful in evaluating a government’s near-term financing requirements.

CITY OF ST. LOUIS MANAGEMENT’S DISCUSSION AND ANALYSIS – UNAUDITED
JUNE 30, 2012
5
Because the focus of governmental funds is narrower than that of the government-wide financial statements, it is useful to compare the information presented for governmental funds with similar information presented for governmental activities in the government-wide financial statements. By doing so, readers may better understand the long-term impact of the government’s near-term financing decisions. Both the governmental fund balance sheet and the governmental fund statement of revenues, expenditures, and changes in fund balances provide a reconciliation to facilitate the comparison between governmental funds and governmental activities.
The City maintains several individual governmental funds according to their type (general, special revenue, debt service, and capital projects). Information is presented separately in the governmental fund balance sheet and in the governmental fund statement of revenues, expenditures, and changes in fund balances for the general fund, capital projects fund, and grants fund, which are considered to be major funds. Individual fund data for each of the non-major governmental funds is provided in the form of combining statements.
2. Proprietary Funds. Proprietary funds offer short-term and long-term financial information about
services for which the City charges customers, both external customers and internal departments of the City. The City maintains the following two types of proprietary funds:
• Enterprise Funds are used to report information similar to business-type activities in the
government-wide financial statements. The City uses the enterprise funds to account for the operations of the Lambert-St. Louis International Airport (Airport), Water Division, and the Parking Division.
• Internal Service Funds are used to report activities that provide supplies and services for
certain City programs and activities. The City uses internal service funds to account for its mail handling services, for payment of workers’ compensation and various other claims, and health insurance.
3. Fiduciary Funds. Fiduciary funds are used to account for resources held for the benefit of
individuals or units outside of the City. The City is the trustee or fiduciary responsible for assets that can be used only for the trust beneficiaries per trust arrangements. The City is responsible for ensuring that the assets reported in these funds are used for their intended purposes. All of the City’s fiduciary activities are reported in a separate statement of fiduciary net assets and a statement of changes in fiduciary net assets. The City’s pension trust funds and agency funds are reported under the fiduciary funds. Since the resources of these funds are not available to support the City’s own programs, they are not reflected in the government-wide financial statements.
Notes to the Financial Statements The notes to the financial statements provide additional information that is essential to a full understanding of the data provided in the government-wide and fund financial statements. Required Supplementary Information In addition to the basic financial statements and notes to the financial statements, this report presents required supplementary information concerning the City’s budgetary comparisons for the general fund and required supplementary information pertaining to the Firemen’s Retirement System of St. Louis, the Police Retirement System of St. Louis and the Employees’ Retirement System of the City of St. Louis pension trust funds and other post-employment benefits of the Police Department.
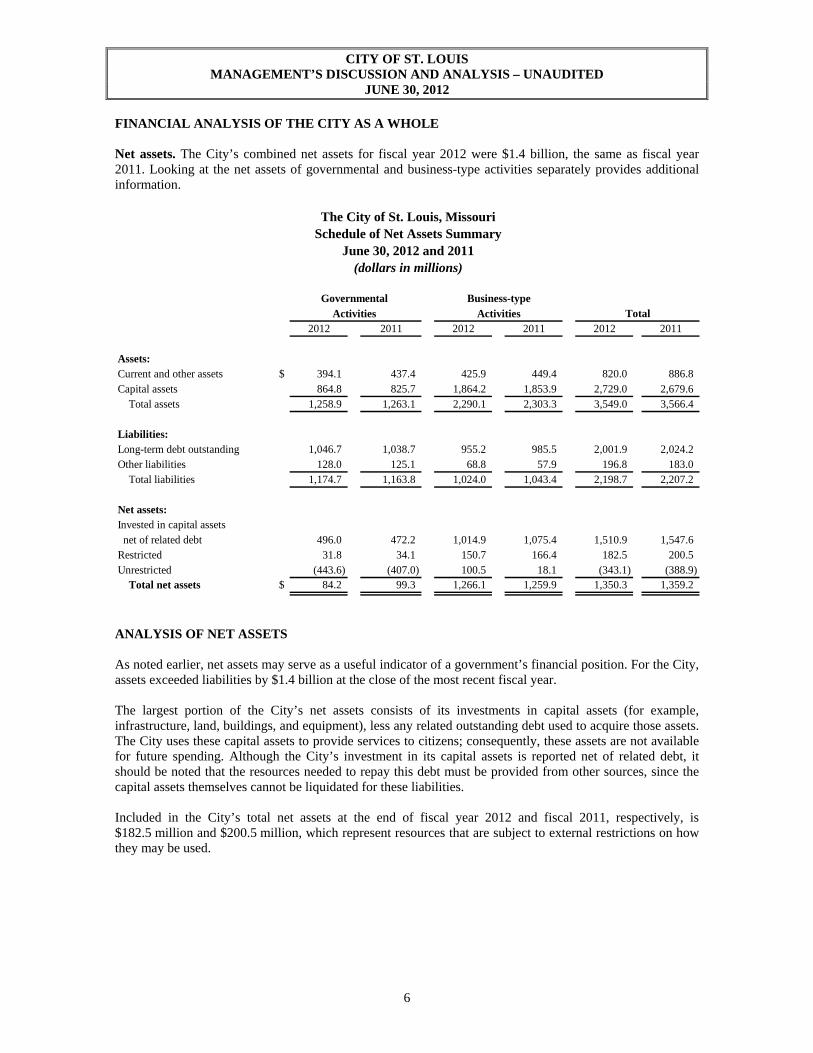
CITY OF ST. LOUIS MANAGEMENT’S DISCUSSION AND ANALYSIS – UNAUDITED
JUNE 30, 2012
6
FINANCIAL ANALYSIS OF THE CITY AS A WHOLE Net assets. The City’s combined net assets for fiscal year 2012 were $1.4 billion, the same as fiscal year 2011. Looking at the net assets of governmental and business-type activities separately provides additional information.
The City of St. Louis, Missouri Schedule of Net Assets Summary
June 30, 2012 and 2011 (dollars in millions)
Governmental Business-type
Activities Activities Total2012 2011 2012 2011 2012 2011
Assets:Current and other assets $ 394.1 437.4 425.9 449.4 820.0 886.8Capital assets 864.8 825.7 1,864.2 1,853.9 2,729.0 2,679.6 Total assets 1,258.9 1,263.1 2,290.1 2,303.3 3,549.0 3,566.4
Liabilities:Long-term debt outstanding 1,046.7 1,038.7 955.2 985.5 2,001.9 2,024.2Other liabilities 128.0 125.1 68.8 57.9 196.8 183.0 Total liabilities 1,174.7 1,163.8 1,024.0 1,043.4 2,198.7 2,207.2
Net assets:Invested in capital assets net of related debt 496.0 472.2 1,014.9 1,075.4 1,510.9 1,547.6Restricted 31.8 34.1 150.7 166.4 182.5 200.5Unrestricted (443.6) (407.0) 100.5 18.1 (343.1) (388.9) Total net assets $ 84.2 99.3 1,266.1 1,259.9 1,350.3 1,359.2
ANALYSIS OF NET ASSETS As noted earlier, net assets may serve as a useful indicator of a government’s financial position. For the City, assets exceeded liabilities by $1.4 billion at the close of the most recent fiscal year. The largest portion of the City’s net assets consists of its investments in capital assets (for example, infrastructure, land, buildings, and equipment), less any related outstanding debt used to acquire those assets. The City uses these capital assets to provide services to citizens; consequently, these assets are not available for future spending. Although the City’s investment in its capital assets is reported net of related debt, it should be noted that the resources needed to repay this debt must be provided from other sources, since the capital assets themselves cannot be liquidated for these liabilities. Included in the City’s total net assets at the end of fiscal year 2012 and fiscal 2011, respectively, is $182.5 million and $200.5 million, which represent resources that are subject to external restrictions on how they may be used.

CITY OF ST. LOUIS MANAGEMENT’S DISCUSSION AND ANALYSIS – UNAUDITED
JUNE 30, 2012
7
Total unrestricted net assets increased by $45.9 million for the year ended June 30, 2012. Unrestricted governmental activities net assets showed a $443.6 million deficit at the end of 2012 as compared with a $407.0 million deficit in 2011. This deficit does not mean that the City does not have resources available to pay its bills next year. Rather, it is the result of having long-term commitments that are greater than currently available resources. For example, the City’s policy and practice is to budget for certain long-term expenses as they come due. Specifically, the City did not include in past annual budgets the full amounts needed to finance future liabilities arising from property and casualty claims and amounts to pay for unused employee vacation and sick days. The City will continue to include these amounts in future year’s budgets as they come due. In addition, five particular features of the City’s recent financial activity affected the deficit in unrestricted governmental net assets. These activities over the past several years reflect debt to provide development stimulus for which the City received no offsetting asset. They include the following:
Section 108 loan agreements, $43.3 million Joint venture financing agreement for the expansion of the convention center, $46.2 million Obligations with component unit for the convention center hotel, $37.9 million Obligations with component units for downtown development, $16.8 million Tax increment financing debt for economic development projects in the amount of $246.1 million
Although the net assets of the business-type activities account for 93.8% of overall net assets, these resources cannot be used to make up for the unrestricted net asset deficit in governmental activities. The City generally can only use these net assets to finance the continuing operations of the Airport, Water Division, and the Parking Division.

CITY OF ST. LOUIS MANAGEMENT’S DISCUSSION AND ANALYSIS – UNAUDITED
JUNE 30, 2012
8
Governmental Business-typeActivities Activities Total
2012 2011 2012 2011 2012 2011
Revenues:Program revenues:Charges for services $ 129.6 129.5 230.8 219.3 360.4 348.8Operating grants and contributions 71.5 75.3 1.1 1.5 72.6 76.8Capital grants and contributions 31.6 33.7 10.1 8.3 41.7 42.0General revenues: Taxes 522.8 510.0 — — 522.8 510.0 Investment income 0.5 1.0 2.0 2.9 2.5 3.9 Total revenues 756.0 749.5 244.0 232.0 1,000.0 981.5
Expenses:General government 72.0 79.9 — — 72.0 79.9Convention and tourism 5.0 4.6 — — 5.0 4.6Parks and recreation 28.5 29.4 — — 28.5 29.4Judicial 51.0 52.3 — — 51.0 52.3Streets 70.4 67.0 — — 70.4 67.0Public safety: Fire 69.1 66.6 — — 69.1 66.6 Police - Payment to the Police 140.8 139.0 — — 140.8 139.0 Police Pension 19.8 17.9 — — 19.8 17.9 Other 59.1 52.2 — — 59.1 52.2Health and welfare 52.1 50.5 — — 52.1 50.5Public service 71.5 65.9 — — 71.5 65.9Community development 80.1 68.1 — — 80.1 68.1Interest and fiscal charges 59.8 58.6 — — 59.8 58.6Airport — — 171.6 187.5 171.6 187.5Water Division — — 43.6 44.5 43.6 44.5Parking Division — — 13.2 13.1 13.2 13.1 Total expenses 779.2 752.0 228.4 245.1 1,007.6 997.1
Excess (deficiency) before extraordinary item and transfer (23.2) (2.5) 15.6 (13.1) (7.6) (15.6)
Gain (loss) on sale of capital assets (1.1) 2.5 — — (1.1) 2.5Extraordinary item - natural disaster — — — 23.1 0.0 23.1Transfers 9.4 8.8 (9.4) (8.8) 0.0 0.0Change in net assets (14.9) 8.8 6.2 1.2 (8.7) 10.0
Net assets-beginning 99.3 90.5 1,259.9 1,258.7 1,359.2 1,349.2Net assets-ending $ 84.4 99.3 1,266.1 1,259.9 1,350.5 1,359.2
Changes in Net AssetsFor the Fiscal Years ended June 30, 2012 and 2011
(dollars in millions)
The City of St. Louis, Missouri

CITY OF ST. LOUIS MANAGEMENT’S DISCUSSION AND ANALYSIS – UNAUDITED
JUNE 30, 2012
9
Changes in net assets. The City’s total revenue on a government-wide basis was $1 billion, an increase of $18.5 million over the previous year. Taxes represent 52.3% of the City’s revenue as compared with 52.0% last year. Additionally, 36.0% comes from fees charged for services, as compared to 35.5% of the previous year’s revenue. The remainder is state and federal aid, interest earnings, and miscellaneous revenues. The total cost of all programs and services was $1,007.6 million, an increase from $997.1 million last fiscal year. The City’s expenses cover a range of typical City/county services. The largest program was the Airport. The program with the largest burden on general revenues was public safety. Governmental activities. As a result of this year’s operations, the net assets of governmental activities decreased by $15.1 million or 15.2%. The net asset decrease is primarily related to the anticipated level of spending over the expected growth in revenues. Revenues increased by $6.5 million or 0.8%. Total expenses increased by $27.2 million or 3.6%. Pension expenses increased by $3.6 million and community development expenses funded by tax increment financing increases by $12 million. The following chart reflects the revenues by type as a percentage of total revenues for governmental activities for fiscal year 2012.
Charges for Services
17%
Taxes69%
Operating Grantsand Contributions
10%
Capital Grantsand Contributions
4%
Investment Income0%
Taxes
Operating Grants
Capital Grants
Charges for Services
Investment Income

CITY OF ST. LOUIS MANAGEMENT’S DISCUSSION AND ANALYSIS – UNAUDITED
JUNE 30, 2012
10
The following chart illustrates the City’s governmental activities expenses by program. Total cost of governmental activities was $779.2 million, an increase of $27.2 million or 3.6% over the prior year. As shown, public safety is the largest function in expense (37.1%). The majority of the spending was the result of funding the Police Department $140.8 million and the Fire Department $69.1 million.
The following chart is a comparison of expense of governmental activities for fiscal years ended 2012, 2011, and 2010.
0255075
100125150175200225250275300
General Government
Covention & Tourism
Parks & Recre
ation
Judicial
Streets
Public Safety
Health & Welfare
Public Service
Community Development
Interest and Fiscal Charges
Governmental Activities Program Expense
2012
2011
2010
Public Safety 288.9
Health & Welfare 52.1
Public Service 71.5
Community Development
80.1
Interest andfiscal charges
59.8
Convention & Tourism 5.0
Parks & Recreation 28.5
Judicial 51.0
Streets 70.4
General Government 72.0
General Government
Convention & Tourism
Parks & Recreation
Judicial
Streets
Public Safety
Health & Welfare
Public Service
Community Development
Interest and Fiscal Charges

CITY OF ST. LOUIS MANAGEMENT’S DISCUSSION AND ANALYSIS – UNAUDITED
JUNE 30, 2012
11
The following chart depicts the total expenses and total program revenues of the City’s governmental functions for the year ended June 30, 2012.
Governmental Program Revenues and Expenses
0.025.050.075.0
100.0125.0150.0175.0200.0225.0250.0
General G
overnment
Convention &
Tourism
Parks &
Recre
ation
Judicial
Streets
Public S
afety
Health &
Welfa
re
Public S
ervice
Community D
evelopment
Program Revenues Program Expenses
The City of St. Louis, Missouri Governmental Activities
(dollars in millions) Total Cost of Services Net Costs of Services2012 2011 2012 2011
General government $ 72.0 79.9 34.2 33.5Convention and tourism 5.0 4.6 5.0 4.5Parks and recreation 28.5 29.4 20.6 25.0Judicial 51.0 52.3 29.9 26.6Streets 70.4 67.0 42.3 31.7Public Safety: Fire 69.1 66.6 60.9 58.6 Police-Payment to Police 140.8 139.0 140.8 139.0 Police pension 19.8 17.9 19.8 17.9 Other 59.1 52.2 33.8 32.8Health and welfare 52.1 50.5 20.2 12.3Public service 71.5 65.9 49.5 55.3Community development 80.1 68.1 29.8 17.6 Totals $ 719.4 693.4 486.8 454.8
The preceding charts represent the cost of governmental activities this year excluding interest and fiscal charges. The cost this year was $719.4 million compared with $693.4 million last year. However, as shown in the statement of activities, the amount that our taxpayers ultimately financed for these activities through City taxes was $486.8 million. The primary difference of $232.6 million comprises charges for services ($129.6 million), operating grants and contributions ($71.5 million), and capital grants and contributions ($31.6 million).

CITY OF ST. LOUIS MANAGEMENT’S DISCUSSION AND ANALYSIS – UNAUDITED
JUNE 30, 2012
12
Business-Type activities. Business-type activities reflect an increase in net assets of $6.1 million or 0.49%. Lambert – St. Louis International Airport. The net assets of the Airport decreased by $7.7 million or 0.71%. The operating income was $1.8 million this year versus an operating loss of $14.5 million in 2011. Total operating revenues for 2012 was $131.5 million. Of this amount, major sources of operating revenue included aviation revenue (67.3%), concession revenue (16.4%), parking (12.9%), and lease revenue (3.4%). A significant non-operating revenue is passenger facility charges which accounts for $25.5 million. At June 30, 2012, the capital assets balance was $1,636.0 million. This amount includes buildings and structures (net of accumulated depreciation) with $198.3 million, pavings with $601.0 million, and equipment with $23.3 million, all net of accumulated depreciation. Land is $751.4 million, construction in progress is $58.5 million, and easements is $3.5 million. At June 30, 2012, the Airport had bonded debt of $834.0 million. Water Division. The net assets of the Water Division increased by $11.7 million or 7.6%. Operating income was $15.0 million this year versus an operating income of $12.0 million in 2011. Total operating revenues for 2012 was $57.9 million. Of this amount, major sources of operating revenue included metered revenue (41.7%) and flat rate revenue (43.7%). At June 30, 2012, the capital assets balance was $149.3 million. This amount includes buildings and structures (net of accumulated depreciation) with $17.1 million, reservoirs and water mains, lines and accessories with $91.4 million, equipment with $35.7 million, land with $1.2 million, and construction-in-progress with $3.9 million. At June 30, 2012, the Water Division had bonded debt of $11.5 million. Parking Division. The net assets of the Parking Division increased by $2.1 million or 7.5%. Operating income was $5.3 million in fiscal year 2012 and $4.3 in fiscal year 2011. Total operating revenues for 2012 was $15.0 million. Of this amount, major sources of operating revenue included parking meter revenue (14.8%), parking violations notices revenue (30.0%), and parking facilities revenue (52.0%). At June 30, 2012, the capital assets balance was $79.0 million. This amount includes buildings and parking garages (net of accumulated depreciation) with $53.0 million, parking meters and lot equipment with $1.3 million, equipment with $0.6 million, land with $22.1 million, and construction-in-progress with 2.0. At June 30, 2012, the Parking Division had bonded debt of $72.8 million.

CITY OF ST. LOUIS MANAGEMENT’S DISCUSSION AND ANALYSIS – UNAUDITED
JUNE 30, 2012
13
The City of St. Louis, Missouri Balance Sheet
Governmental Funds June 20, 2012
(dollars in millions)
2012 20112012 vs. 2011
$ Change2012 vs. 2011
% Change
Total assets $ 353.8 392.5 (38.7) -9.9%
Total liabilities 182.1 180.9 1.2 0.7%Fund balance:
Restricted 96.3 147.8 — Committed 62.6 61.6 — Assigned 3.3 4.3 — Unassigned 9.5 (2.1) —
Total fund balance 171.7 211.6 (39.9)
Total liabilities and fund balance $ 353.8 392.5 (38.7) -9.9%
FINANCIAL ANALYSIS OF THE CITY’S FUNDS Governmental Funds The focus of the City’s governmental funds is to provide information on inflows, outflows and balances of current financial resources that are available for spending. At the end of the current fiscal year, the unassigned fund balance of the general fund was $29.5 million. As a measure of the general fund’s liquidity, it may be useful to compare both unassigned fund balance and total fund balance to total fund expenditures and transfers out. Unassigned fund balance of $29.5 million represents 6.4% of total general fund expenditures and transfers out of $470.2 million. The total fund balance in the City’s general fund increased by $6.5 million or 13.2% in the current fiscal year. The City’s general fund decreased by $4.1 million or 8.2% in the prior fiscal year. The total fund balance in the City’s capital projects fund decreased by $55.0 million or 61.7% in the current fiscal year. The City’s capital projects fund decreased by $35.0 million or 28.2% in the prior fiscal year. The grants fund received $71.5 million in intergovernmental revenues that funded community development in the amount of $29.0 million, or 40%, and health and welfare in the amount of $32.4 million, or 45%. The total fund balance in the City’s other governmental funds increased by $8.6 million or 11.7 % in the current fiscal year. The City’s other governmental funds increased by $11.0 million or 17.7% in the prior fiscal year.

CITY OF ST. LOUIS MANAGEMENT’S DISCUSSION AND ANALYSIS – UNAUDITED
JUNE 30, 2012
14
Proprietary Funds The City’s proprietary funds provide the same type of information found in the government-wide financial statements, but in more detail. At the end of the fiscal year, the unrestricted net assets for the Airport were $72.7 million, the Water Division were $22.2 million, and the Parking Division were $5.6 million, as compared with $3.4 million, $8.2 million, and $6.6 million, respectively in 2011. The total increase in net assets for the enterprise funds was $6.1 million in the current year an increase of $4.9 million from the previous year. Fiduciary Funds The City maintains fiduciary funds for the assets of the pension trust funds for the Firemen’s Retirement System, the Police Retirement System, and the Employee’s Retirement System. As of the end of the current fiscal year, the net assets of the pension funds totaled $1.6 billion the same as the previous year. The City is the custodian of the agency funds and the most common use of agency funds is for pass-through activity. Since, by definition, all assets of the agency funds are held for the benefit of other entities, there are no net assets to discuss. As of the end of the current fiscal year, the combined gross assets of the agency funds totaled $59.0 million. This amount comprises activity from the collector of revenue, property tax escrow, general insurance, bail bonds, license collector, and circuit clerk, and other miscellaneous agency activities. General Fund Budgetary Highlights The final budget for the City’s general fund represents the original budget plus any previously appropriated funds set aside for the purpose of honoring legally incurred obligations (prior year encumbrances and commitments) plus any additional supplemental appropriations that may occur during the fiscal year. The general fund budget includes appropriations for the Police Department that is a component unit of the City. This discussion presents the budget information on the budgetary basis as the Board of Alderman approves the budget. In the fiscal year, $7.9 million had been set aside for prior year encumbrances and commitments, and there was a supplemental appropriation of $3.6 million. The original general fund budget including transfers in, totaled $450.0 million. Actual results for the fiscal year had revenues and transfers in were above the original estimates by $7.9 million, totaling $457.7 million. Actual expenditures and transfers out totaled $452.8 million. This includes expenditures of $5.8 million from prior year encumbrances and commitments. The encumbrances and commitments carried over into the next fiscal year in regard to the fiscal year 2012 budget total $7.9 million. A transfer out of $0.6 million was made to a 27th Pay Reserve. The general fund ended the fiscal year with a budget-basis-operating surplus of $4.9 million. As of June 30, 2012, the unreserved fund balance of the general fund was $10.9 million on a cash basis.

CITY OF ST. LOUIS MANAGEMENT’S DISCUSSION AND ANALYSIS – UNAUDITED
JUNE 30, 2012
15
CAPITAL ASSETS AND DEBT ADMINISTRATION Capital Assets The City had invested $2.7 billion in a broad range of capital assets, including fire equipment, park facilities, roads, bridges, runways and water systems.
The City of St. Louis, Missouri Schedule of Changes in Capital Assets
Net of Accumulated Depreciation (dollars in millions)
2012 2011 2012 2011 2012 2011
Land $ 78.1 78.8 774.6 773.7 852.7 852.5Construction in progress 27.8 69.2 64.4 28.1 92.2 97.3Equipment in progress 13.6 11.7 — — 13.6 11.7Intangibles 0.5 0.5 3.5 3.5 4.0 4.0Works of art 3.5 3.4 — — 3.5 3.4Buildings and improvements 446.8 395.5 268.5 266.4 715.3 661.9Equipment 41.9 45.3 60.9 61.8 102.8 107.1Infrastructure 252.5 221.3 — — 252.5 221.3Pavings — — 601.0 628.8 601.0 628.8Reservoirs — — 23.9 24.5 23.9 24.5Water mains, lines, accessories — — 67.5 67.1 67.5 67.1
Total $ 864.7 825.7 1,864.3 1,853.9 2,729.0 2,679.6
Governmental Activities
Business-type Activities Total

CITY OF ST. LOUIS MANAGEMENT’S DISCUSSION AND ANALYSIS – UNAUDITED
JUNE 30, 2012
16
0.0
100.0
200.0
300.0
400.0
500.0
600.0
700.0
800.0
900.0
Land CIP EIP
Intan
gibles
Works o
f Art
Buildin
gs
Equipm
ent
Infras
tructu
re
Paving
s
Reserv
oirs
Water M
ains
Capital Assets
20122011
For government-wide financial presentation, all depreciable capital assets were depreciated from acquisition date to the end of the current fiscal year. Governmental fund financial statements record capital asset purchases as expenditures. For additional information on capital assets, refer to note 7 in the notes to the basic financial statements.

CITY OF ST. LOUIS MANAGEMENT’S DISCUSSION AND ANALYSIS – UNAUDITED
JUNE 30, 2012
17
Long-Term Debt At the end of fiscal year 2012, the City had outstanding long-term debt obligations for governmental activities in the amount of $964.6 million compared with $963.0 million in fiscal year 2011. Of this amount, $39.0 million are general obligation bonds and $246.1 million are tax increment financing bonds. Leasehold revenue obligations outstanding totaled $502.4 million.
The City of St. Louis, Missouri Outstanding Long-term Debt Obligations-Governmental Activities
(dollars in millions) Fiscal Year
Fiscal Year
2012 2011 $ change % change
General obligation bonds payable $ 39.0 42.7 (3.7) -8.7%Section 108 Loan Guarantee Assistance Programs 43.3 46.8 (3.5) -7.5%Firemen's Retirement EAN Note 5.3 0.0 5.3 100.0%Tax increment financing bonds and notes payable 246.1 200.8 45.3 22.6%Master note purchase agreement 0.0 0.1 (0.1) -100.0%Loan agreement with Missouri Department of Natural Resources 0.1 0.1 0.0 0.0%Loan agreement with Missouri Transportation 2.9 3.4 (0.5) -14.7% Finance CorporationCapital lease—rolling stock 17.3 19.0 (1.7) -8.9%Certificates of participation 7.3 8.0 (0.7) -8.8%Obligations with component units 54.7 57.0 (2.3) -4.0%Leasehold revenue improvement and refunding bonds 502.4 535.0 (32.6) -6.1%Joint venture financing agreement 46.2 50.1 (3.9) -7.8%
Total $ 964.6 963.0 1.6 0.2%
State statutes limit the amount of general obligation debt a governmental entity may issue to 10% of its total assessed valuation. The City’s authorized debt limit for calendar year 2012 was $420,253 million. The City’s effective legal debt margin as of June 30, 2012 was $389,435 million. For additional information on long-term debt, refer to the notes 13 to 16 to the basic financial statements. The City’s underlying general obligation credit ratings remained unchanged for fiscal year 2012. The City ratings on uninsured general obligation bonds as of June 30, 2012 were:
Moody’s Investor’s Service, Inc. A3 Standard and Poor’s Corporation A+ Fitch IBCA, Inc. Ratings A

CITY OF ST. LOUIS MANAGEMENT’S DISCUSSION AND ANALYSIS – UNAUDITED
JUNE 30, 2012
18
The City of St. Louis, Missouri Revenue Bonds Outstanding
Long-Term Debt Obligations-Business Type Activities (dollars in millions)
Fiscal Year Fiscal Year
2012 2011 $ change % change
Airport $ 834.0 855.0 (21.0) -2.46%Water Division 11.5 16.0 (4.5) -28.13%Parking Division 72.7 74.9 (2.2) -2.94%
Total $ 918.2 945.9 (27.7) -2.93%
Outstanding revenue bonds of the business-type activities of the City as of June 30, 2012 and 2011 were $918.2 million and $945.9 million, respectively. The amount reflects a decrease of $27.7 million, or 29.0%. This amount includes Airport bonds of $834.0 million, Water Division bonds of $11.5 million, and Parking Division bonds of $72.7 million. For additional information on revenue bonds of the business-type activities, refer to notes 13 and 17 of the basic financial statements. Economic Factors and Next Year’s Budget
• The fiscal year 2013 annual operating budget allocates $966.7 million among all budgeted funds, consistent with the previous year’s budget.
• The fiscal year 2013 general fund budget is $464.8 million compared with $450.0 million in the
prior year. This amount reflects a decrease of $14.8 million, or 3.3%.
• Total positions for fiscal year 2013 are 6,703, a decrease of 135 positions mainly in the public safety division and airport.
Requests for Information This financial report is designed to provide our citizens, taxpayers, customers, investors, and creditors with a general overview of the City’s finances and to demonstrate the City’s accountability for the money it receives. If you have any questions about this report or need additional information, please contact the Office of the Comptroller of the City of St. Louis, 1200 Market Street, Room 311, Saint Louis, Missouri 63103.

19
City of St. Louis, MissouriStatement of Net Assets
June 30, 2012(dollars in thousands)
Primary GovernmentGovernmental Business-type
Activities Activities Total SLDC SLPD SWMDC
ASSETS
Cash and cash equivalents $ 61,779 77,018 138,797 9,710 6 2,320 Investments 10,828 62,889 73,717 — — 500 Receivables, net 171,675 25,242 196,917 21,011 1,538 — Inventories — 4,576 4,576 — 1,270 — Restricted assets 78,556 248,144 326,700 2,012 2,948 — Deferred charges 15,902 15,811 31,713 — — — Internal balances 10,290 (10,290) — — — — Other assets 160 2,460 2,620 548 1,834 — Receivable from primary government — — — 1,381 8,122 — Receivable from component unit 1,201 — 1,201 — — — Net pension asset 43,657 — 43,657 — — — Property held for development, net — — — 15,929 — — Capital assets, net:
Non-depreciable 123,451 842,526 965,977 4,914 5,842 — Depreciable 741,395 1,021,710 1,763,105 18,286 26,567 6,428
Total assets 1,258,894 2,290,086 3,548,980 73,791 48,127 9,248
LIABILITIES
Accounts payable and accrued liabilities 21,108 32,007 53,115 3,647 1,046 — Accrued salaries and other benefits 10,490 10,662 21,152 — 5,618 — Accrued interest payable 82,674 21,415 104,089 237 — — Unearned revenue 2,715 4,642 7,357 — 20 — Other liabilities 1,485 — 1,485 — — — Payable to primary government — — — — 1,201 — Payable to component units 9,503 — 9,503 — — — Payable to other government agencies 9 63 72 — — — Long-term liabilities:
Due within one year 82,766 36,736 119,502 14,215 18,280 — Due in more than one year 963,897 918,478 1,882,375 32,641 121,198 —
Total liabilities 1,174,647 1,024,003 2,198,650 50,740 147,363 —
NET ASSETS
Invested in capital assets, net ofrelated debt 495,977 1,014,901 1,510,878 12,965 32,409 6,428
Restricted:Debt service 1,343 117,288 118,631 2,012 — — Capital projects — 9,152 9,152 — — — Passenger facility charges — 24,221 24,221 — — — Statutory restrictions 30,479 — 30,479 — 2,922 —
Unrestricted (deficit) (443,552) 100,521 (343,031) 8,074 (134,567) 2,820 Total net assets $ 84,247 1,266,083 1,350,330 23,051 (99,236) 9,248
See accompanying notes to basic financial statements.
Component Units

20
City of St. Louis, MissouriStatement of Activities
Year ended June 30, 2012(dollars in thousands)
Program RevenuesOperating Capital Primary Government
Charges for Grants and Grants and Governmental Business-typeFunctions/Programs Expenses Services Contributions Contributions Activities Activities Total SLDC SLPD SWMDC
Primary Government:Governmental activities:
General government $ 72,063 36,697 1,121 — (34,245) — (34,245) — — — Convention and tourism 4,979 8 — — (4,971) — (4,971) — — — Parks and recreation 28,529 7,314 613 — (20,602) — (20,602) — — — Judicial 50,931 18,996 2,055 — (29,880) — (29,880) — — — Streets 70,420 27,514 — 630 (42,276) — (42,276) — — — Public safety:
Fire 69,062 8,181 — — (60,881) — (60,881) — — — Police— payment to SLPD 140,815 — — — (140,815) — (140,815) — — — Police pension 19,854 — — — (19,854) — (19,854) — — — Other 59,068 19,218 6,073 — (33,777) — (33,777) — — —
Health and welfare 52,092 992 30,888 — (20,212) — (20,212) — — — Public service 71,458 5,265 — 16,717 (49,476) — (49,476) — — — Community development 80,184 5,367 30,763 14,276 (29,778) — (29,778) — — — Interest and fiscal charges 59,750 — — — (59,750) — (59,750) — — —
Total governmental activities 779,205 129,552 71,513 31,623 (546,517) — (546,517) — — —
Business-type activities:Airport 171,574 157,154 1,069 10,050 — (3,301) (3,301) — — — Water Division 43,637 58,631 — — — 14,994 14,994 — — — Parking Division 13,229 14,999 — — — 1,770 1,770 — — —
Total business-type activities 228,440 230,784 1,069 10,050 — 13,463 13,463 — — — Total primary government $ 1,007,645 360,336 72,582 41,673 (546,517) 13,463 (533,054) — — —
Component Units:SLDC $ 26,453 10,575 23,077 — — — — 7,199 — — SLPD 199,717 5,065 26,021 1,923 — — — — (166,708) — SWMDC 398 249 — 465 — — — — — 316
Total component units $ 226,568 15,889 49,098 2,388 — — — 7,199 (166,708) 316
General revenues: Taxes: Property taxes, levied for general purpose $ 68,531 — 68,531 — — — Property taxes, levied for debt service 5,909 — 5,909 — — — Sales taxes 164,174 — 164,174 — — — Earnings/payroll taxes 186,068 — 186,068 — — — Gross receipts taxes (includes franchise tax) 93,587 — 93,587 — — — Miscellaneous taxes 4,504 — 4,504 — — — Unrestricted investment earnings 470 2,049 2,519 176 — 2 Support provided by City of St. Louis, Missouri — — — — 140,815 — Loss on disposal of capital assets (1,142) — (1,142) — — — Transfers 9,366 (9,366) — — — — Total general revenues and transfers 531,467 (7,317) 524,150 176 140,815 2 Change in net assets (15,050) 6,146 (8,904) 7,375 (25,893) 318 Net assets—beginning of year 99,297 1,259,937 1,359,234 15,676 (73,343) 8,930 Net assets—end of year $ 84,247 1,266,083 1,350,330 23,051 (99,236) 9,248
See accompanying notes to basic financial statements.
Net (Expense) Revenue and Changes in Net AssetsComponent Units

21
City of St. Louis, MissouriBalance Sheet
Governmental FundsJune 30, 2012
(dollars in thousands)
NonmajorMajor Funds Funds
Capital Other TotalGeneral Projects Grants Governmental Governmental
Fund Fund Fund Funds Funds
ASSETS
Cash and cash equivalents $ 18,681 15,769 — 55,188 89,638 Investments 12,947 33,010 2,886 9,913 58,756 Receivables, net of allowances:
Taxes 89,673 3,020 — 42,686 135,379 Licenses and permits 2,422 — — 175 2,597 Intergovernmental 3,420 7,636 14,578 726 26,360 Charges for services 4,815 41 — 1,404 6,260 Notes and loans — — — 46 46 Other 441 4 — 45 490
Other assets — — — 108 108 Due from component units 1,201 — — — 1,201 Due from other funds 29,270 — — 3,718 32,988
Total assets $ 162,870 59,480 17,464 114,009 353,823
LIABILITIES AND FUND BALANCES
Liabilities:Accounts payable and accrued liabilities $ 3,270 8,324 7,784 1,326 20,704 Accrued salaries and other benefits 8,755 127 648 960 10,490 Due to component units 8,122 — — 1,103 9,225 Due to other funds 2,636 14,749 9,094 1,913 28,392 Due to other governmental agencies 9 — — — 9 Advance to other funds 18,296 — — — 18,296 Deferred revenue:
Property taxes 59,017 — — 21,863 80,880 Other taxes 1,845 — — 245 2,090 Other revenue 3,938 2,103 — 1,477 7,518
Unearned revenue 134 — — 2,581 2,715 Other liabilities 978 — — 785 1,763
Total liabilities 107,000 25,303 17,526 32,253 182,082
Fund balances:Nonspendable — — — 11 11 Restricted 16,755 33,666 — 45,907 96,328 Committed 8,063 24,950 — 29,603 62,616 Assigned 1,509 — — 1,837 3,346 Unassigned 29,543 (24,439) (62) 4,398 9,440
Total fund balances 55,870 34,177 (62) 81,756 171,741 Total liabilities and fund balances $ 162,870 59,480 17,464 114,009 353,823
See accompanying notes to basic financial statements.

22
City of St. Louis, MissouriReconciliation of the Balance Sheet of Governmental Funds
to the Statement of Net AssetsJune 30, 2012
(dollars in thousands)
Total fund balances—governmental funds—balance sheet $ 171,741
Amounts reported for governmental activities in the statement of net assets are different because:
Capital assets and certain other assets used in governmental activities, which exceed capitalization threshold amounts (excluding internal service fund capital assets), are not financial resources and, therefore, are not reported in the fund financial statements. 864,808
The City reports a net pension asset on the statement of net assets to the extent actual contributions to the City’s retirement plans exceed the annual actuarial required contribution. This asset is not reported in the fund financial statements. 43,657
Various taxes related to fiscal year 2012 will be collected beyond the 60-day period used to recordrevenue in the fund financial statements. Revenue for this amount is recognized in thegovernment-wide financial statements. 9,608
Property taxes are assessed by the City on January 1st of each calendar year, but are not due untilDecember 31st. Taxes assessed on January 1, 2012 and payable on December 31, 2012 aredeferred within the fund financial statements. However, revenue for this amount is recognized in thegovernment-wide financial statements. 80,880
Internal service funds are used by management to charge the cost of risk management and mailroomservices to the individual funds, generally on a cost reimbursement basis. The assets and liabilitiesof internal service funds are included in governmental activities in the statement of net assets. 2,155
Bond issuance costs are reported in the governmental funds financial statements as expenditures whendebt is issued, whereas the amounts are deferred and amortized over the life of the debt on thegovernment-wide financial statements. 15,902
Long-term liabilities applicable to the City’s governmental activities are not due and payable in the currentperiod and, accordingly, are not reported as liabilities within the fund financial statements. Interest onlong-term debt is not accrued in governmental funds, but rather is recognized as an expenditure whendue. All liabilities—both current and long-term—are reported on the government-wide statement ofnet assets. Also, during the year, the City issued new debt and refunded some of its existing debt.Discounts, premiums, and deferred amounts on refunding are reported in the governmental fundfinancial statements when the debt was issued, whereas these amounts are deferred and amortizedover the life of the debt on the government-wide financial statements.
Balances as of June 30, 2012 are:
Accrued vacation and sick leave (25,047) Net pension obligation (33,608) Accrued interest payable (82,674) Joint venture financing agreement (46,165) Certificates of participation (7,355) Obligations with component unit (54,739) Capital leases-rolling stock (17,272) Leasehold improvement and refunding revenue bonds (502,428) TIF bonds and notes payable (246,079) General obligation bonds (38,955) Section 108 Loan Guarantee - Assistance Programs (43,250) Fireman's Retirement EAN Note (5,278) Other long-term debt (3,011) Unamortized discounts 4,503 Unamortized premiums (9,682) Unamortized deferred amounts on refunding 6,536
Total net assets—governmental activities—statement of net assets $ 84,247
See accompanying notes to basic financial statements.

23
City of St. Louis, MissouriStatement of Revenues, Expenditures, and Changes in Fund Balances
Governmental FundsYear ended June 30, 2012
(dollars in thousands)
NonmajorMajor Funds Funds
Capital Other TotalGeneral Projects Grants Governmental Governmental
Fund Fund Fund Funds Funds
REVENUESTaxes $ 339,818 19,723 — 160,311 519,852 Licenses and permits 16,769 — — 4,490 21,259 Intergovernmental 21,988 31,623 71,513 4,955 130,079 Charges for services, net 29,632 291 — 16,243 46,166 Court fines and forfeitures 12,103 — — — 12,103 Investment income 138 279 — 53 470 Interfund services provided 4,293 — — — 4,293 Miscellaneous 5,472 485 — 11,694 17,651
Total revenues 430,213 52,401 71,513 197,746 751,873
EXPENDITURESCurrent:
General government 41,845 — 951 18,146 60,942 Convention and tourism 123 — — 27 150 Parks and recreation 18,059 1,084 576 4,166 23,885 Judicial 45,916 — 1,992 2,913 50,821 Streets 33,185 5,883 107 1,597 40,772 Public Safety:
Fire 69,129 — — 758 69,887 Police 126,988 — — 13,827 140,815 Police-pension 17,446 — — 2,273 19,719 Other 46,580 — 5,034 7,127 58,741
Health and welfare 3,005 — 32,404 16,446 51,855 Public services 24,942 5,586 334 39,978 70,840 Community development — — 28,983 51,201 80,184
Capital outlay — 89,918 — 147 90,065 Debt service:
Principal 19,404 18,511 940 16,097 54,952 Interest and fiscal charges 13,521 6,385 490 26,860 47,256
Total expenditures 460,143 127,367 71,811 201,563 860,884 Deficiency of revenues over expenditures (29,930) (74,966) (298) (3,817) (109,011)
OTHER FINANCING SOURCES (USES)Sale of capital assets — 345 — — 345 Issuance of revenue refunding bonds 49,825 — — — 49,825 Bond premium on debt issuances 4,038 — — — 4,038 Issuance of capital lease-Rolling Stock — 2,384 — — 2,384 Issuance of tax increment financing notes — — — 51,101 51,101 Payment to refunded escrow agent-leasehold revenue bonds (53,172) — — — (53,172) Firemen's Retirement EAN note proceeds 5,278 — — — 5,278 Transfers in 40,573 18,518 307 3,522 62,920 Transfers out (10,090) (1,234) (9) (42,221) (53,554)
Total other financing sources (uses), net 36,452 20,013 298 12,402 69,165 Net change in fund balances 6,522 (54,953) — 8,585 (39,846) Fund balances:
Beginning of year 49,348 89,130 (62) 73,171 211,587 End of year $ 55,870 34,177 (62) 81,756 171,741
See accompanying notes to basic financial statements.

24
City of St. Louis, MissouriReconciliation of the Statement of Revenues, Expenditures,
and Changes in Fund Balances of Governmental Fundsto the Statement of Activities
Year ended June 30, 2012(dollars in thousands)
Net change in fund balances—governmental funds—statement of revenues, expenditures, and changes in fund balances $ (39,846)
Amounts reported for governmental activities in the statement of activities are different because:
Governmental funds report capital outlays as expenditures. However, in the statement of activities, the cost of thoseassets, meeting the capitalization threshold, is allocated over their estimated useful lives and recorded as depreciation expense. Additionally, contributions of capital assets to the City are recorded as capital contributions on the statement of activities. This is the amount by which capital outlays and capital contributions, meeting the capitalization threshold, exceeded depreciation expense in the current year. Details of the reported amounts are as follows:
Capital outlay 90,065 Capital contribution 433 Loss on disposal of capital assets (1,487) Depreciation expense (49,923)
39,088
Revenues in the statement of activities that do not provide current financial resources are not reported as revenues inthe fund financial statements. These amounts represent the extent to which revenues not providing current financial resources in the current fiscal year exceeded revenues not providing current financial resources in theprior fiscal year (which are recognized in the fund financial statements in the current year). Such amounts are attributable to the following factors:
Change in revenues received after the 60-day accrual period 1,093 Property taxes due in the fiscal year following the fiscal year in which they were assessed 2,532
3,625
Internal service funds are used by management to charge the cost of risk management and mailroom services to theindividual funds. The net income of internal service funds attributable to governmental activities is reported on thestatement of activities. (1,824)
The City reports a net pension obligation/asset on the statement of net assets to the extent actual contributions to the City’s retirement plans fall below/exceed the annual required contribution. This obligation/asset is not reported in the fund financial statements. Fluctuations in net pension obligations/assets are reported in the statement of activities. (749)
Bond proceeds are reported as financing sources in governmental funds financial statements and thus contribute to the net change in fund balance. In the statement of net assets, however, issuing debt increases long-term liabilitiesand does not affect the statement of activities. Similarly, repayments of principal is an expenditure in the governmental funds financial statements, but reduces the liability in the statement of net assets.
Debt issued during the current year:Leasehold revenue bonds - Series 2011 Justice Center Revenue Refunding Bonds (49,825) Rolling stock capital lease (2,384) Tax increment financing bonds and notes payable (51,101) Firemen's Retirement EAN note (5,278)
Repayments during the current year:Advance refunding of Series 2001A Justice Center Leasehold Revenue Bonds 51,860 Annual principal on leasehold revenue bonds 30,467 Annual principal payments on bonds and notes payable 15,814 Annual principal payments on joint venture financing agreement 3,927 Annual principal payments on capital leases 4,145 Annual principal payments on SLMFC Lease Certificates of Participation 595
(1,780)
Under the modified accrual basis of accounting used in the governmental funds financial statements, expenditures arenot recognized for transactions that are not normally paid with expendable available financial resources. In the statement of activities, however, which is presented on the accrual basis of accounting, expenses and liabilitiesare reported regardless of when financial resources are available. In addition, interest on long-term debt is not recognized under the modified accrual basis of accounting until due, rather than as it accrues.
This adjustment combines the net changes of the following:Accrued vacation and sick leave 1,652 Accrued interest payable (9,971) Unamortized discounts (457) Unamortized premiums (930) Deferred bond issuance costs, net of amortization (1,690) Unamortized deferred amounts on refunding (2,168)
(13,564) Change in net assets—governmental activities—statement of activities $ (15,050)
See accompanying notes to basic financial statements.

25
City of St. Louis, MissouriStatement of Fund Net Assets
Proprietary FundsJune 30, 2012
(dollars in thousands)
Major Funds—Enterprise FundsLambert—St. Louis Total Internal
International Water Parking Enterprise ServiceAirport Division Division Funds Funds
ASSETS
Current assets:Cash and cash equivalents:
Restricted cash and cash equivalents $ 16,308 4,546 7,087 27,941 — Unrestricted cash and cash equivalents 37,737 18,361 11,503 67,601 2,769
Investments:Restricted investments 35,817 — — 35,817 — Unrestricted investments — — — — 165
Receivables, net of allowances:Intergovernmental 5,442 — — 5,442 543 Charges for services 2,972 10,044 120 13,136 — Insurance recovery 3,000 — — 3,000 — Passenger facility charges 3,524 — — 3,524 — Accrued interest 140 — — 140 —
Prepaid assets — — — — 52 Due from other funds — — — — 5,772 Advance from other funds — — — — 18,296 Inventories 2,435 2,141 — 4,576 — Other current assets 751 — 20 771 —
Total current assets 108,126 35,092 18,730 161,948 27,597 Noncurrent assets:
Cash and cash equivalentsRestricted cash and cash equivalents 19,826 2,516 — 22,342 — Unrestricted cash and cash equivalents — 9,417 — 9,417 —
Investments – unrestricted 62,889 — — 62,889 — Investments – restricted 157,170 — 4,874 162,044 — Capital assets:
Property, plant, and equipment 1,570,821 280,807 81,014 1,932,642 108 Less accumulated depreciation (748,229) (136,593) (26,110) (910,932) (70)
822,592 144,214 54,904 1,021,710 38
Land and easements 754,862 1,238 22,053 778,153 — Construction-in-progress 58,496 3,864 2,013 64,373 —
Capital assets, net 1,635,950 149,316 78,970 1,864,236 38 Deferred charges and other assets, net 14,086 167 1,558 15,811 —
Other assets 1,689 — — 1,689 — Total noncurrent assets 1,891,610 161,416 85,402 2,138,428 38 Total assets 1,999,736 196,508 104,132 2,300,376 27,635
LIABILITIES
Current liabilities:Accounts payable and accrued liabilities 9,883 1,053 380 11,316 404 Accrued salaries and other benefits 1,823 3,477 187 5,487 — Accrued vacation and compensatory time benefits 3,302 1,711 162 5,175 — Contracts and retainage payable 20,691 — — 20,691 — Accrued interest payable 21,158 132 125 21,415 — Current portion of revenue bonds 30,655 3,895 2,186 36,736 — Due to other funds 4,869 3,552 1,869 10,290 78 Due to other government agencies — — 63 63 — Claims payable — — — — 24,833 Deferred revenue 481 2,331 1,830 4,642 —
Total current liabilities 92,862 16,151 6,802 115,815 25,315
Noncurrent liabilities:Revenue bonds payable, net 820,138 7,585 65,642 893,365 — Customer deposits — 1,778 — 1,778 — Other liabilities 15,435 6,198 1,702 23,335 —
Total noncurrent liabilities 835,573 15,561 67,344 918,478 — Total liabilities 928,435 31,712 74,146 1,034,293 25,315
NET ASSETS
Invested in capital assets, net of related debt 864,680 137,836 12,385 1,014,901 38 Restricted:
Debt service 100,568 4,759 11,961 117,288 — Capital projects 9,152 — — 9,152 — Airport improvement program — — — — — Passenger facility charges 24,221 — — 24,221 —
Unrestricted 72,680 22,201 5,640 100,521 2,117 Total net assets $ 1,071,301 164,796 29,986 1,266,083 2,155
See accompanying notes to basic financial statements.

26
City of St. Louis, MissouriStatement of Revenues, Expenses, and
Changes in Fund Net AssetsProprietary Funds
Year ended June 30, 2012(dollars in thousands)
Major Funds—Enterprise FundsLambert—
St. Louis Total InternalInternational Water Parking Enterprise Service
Airport Division Division Funds Funds
OPERATING REVENUES
Aviation revenues $ 88,530 — — 88,530 — Concessions 21,610 — — 21,610 — Water sales — 53,701 — 53,701 — Lease revenue 4,442 — — 4,442 — Parking, net 16,940 — 14,502 31,442 — Charges for services — — — — 18,006 Intergovernmental revenue — — — — 231 Miscellaneous — 4,169 484 4,653 —
Total operating revenues 131,522 57,870 14,986 204,378 18,237
OPERATING EXPENSES
Claims incurred — — — — 18,077 Premiums — — — — 1,454 Personal services 39,168 14,762 4,877 58,807 261 Material and supplies 4,516 9,188 242 13,946 283 Purchased power — 2,850 — 2,850 — Contractual services 35,191 5,756 1,084 42,031 — Miscellaneous 101 2,841 714 3,656 — Depreciation and amortization 47,815 5,002 2,652 55,469 7 Interfund services used 2,896 2,481 138 5,515 —
Total operating expenses 129,687 42,880 9,707 182,274 20,082 Operating income 1,835 14,990 5,279 22,104 (1,845)
NONOPERATING REVENUES (EXPENSES)
Intergovernmental revenue 1,069 — — 1,069 — Investment income 1,747 11 291 2,049 — Interest expense (40,125) (509) (3,515) (44,149) — Passenger facility charges 25,544 — — 25,544 — Amortization of bond issue costs (1,762) (102) — (1,864) — Loss on disposal of capital assets — (146) (7) (153) — Miscellaneous, net 88 761 13 862 —
Total nonoperating revenues (expenses), net (13,439) 15 (3,218) (16,642) — Income (loss) before transfers and capital
contributions (11,604) 15,005 2,061 5,462 (1,845)
Transfers in — — 828 828 — Transfers out (6,097) (3,297) (800) (10,194) — Capital contributions 10,050 — — 10,050 21
Change in net assets (7,651) 11,708 2,089 6,146 (1,824) Total net assets—beginning of year 1,078,952 153,088 27,897 1,259,937 3,979 Total net assets—end of year $ 1,071,301 164,796 29,986 1,266,083 2,155
See accompanying notes to basic financial statements.

27
City of St. Louis, MissouriStatement of Cash Flows
Proprietary FundsYear ended June 30, 2012
(dollars in thousands)
Major Funds—Enterprise FundsLambert—St. Louis Total Internal
International Water Parking Enterprise ServiceAirport Division Division Funds Funds
CASH FLOWS FROM OPERATING ACTIVITIESReceipts from customers and users $ 132,531 55,582 14,910 203,023 18,471 Other operating cash receipts — — 55 55 — Payments to suppliers of goods and services (38,307) (18,870) (1,284) (58,461) (19,982) Payments to employees (38,859) (14,699) (4,843) (58,401) (260) Payments for interfund services used (2,013) (3,000) — (5,013) —
Net cash provided by (used in) operating activities 53,352 19,013 8,838 81,203 (1,771)
CASH FLOWS FROM NONCAPITAL FINANCING ACTIVITIESInterest paid on share of bond pension liability — (307) — (307) — Transfers from the State of Missouri — — 13 13 — Transfers from other funds — — 828 828 — Transfers to other funds (6,097) (3,299) (800) (10,196) —
Net cash provided by (used in) noncapital financing activities (6,097) (3,606) 41 (9,662) —
CASH FLOWS FROM CAPITAL AND RELATED FINANCING ACTIVITIESCash collections from passenger facility charges 24,937 — — 24,937 — Receipts from federal financing assistance 7,334 — — 7,334 — Acquisition and construction of capital assets (50,570) (2,764) (3,224) (56,558) — Insurance recoveries 7,000 — — 7,000 — Proceeds from sale of surplus property 171 — — 171 — Cash paid for bond refunding (35,302) — — (35,302) — Proceeds from issuance of bond 32,741 11,480 — 44,221 — Principal paid on revenue bond maturities (19,985) (16,000) (2,129) (38,114) — Cash paid for interest (41,653) (202) (3,211) (45,066) — Other capital and financing activities — 214 — 214 —
Net cash used in capital and related financing activities (75,327) (7,272) (8,564) (91,163) —
CASH FLOWS FROM INVESTING ACTIVITIESPurchase of investments (400,880) (2,027) (9,518) (412,425) (165) Proceeds from sales and maturities of investments 406,341 4,055 11,440 421,836 — Investment income 2,405 11 291 2,707 —
Net cash provided by (used in) investing activities 7,866 2,039 2,213 12,118 (165)
Net (decrease) increase in cash and cash equivalents (20,206) 10,174 2,528 (7,504) (1,936)
Cash and cash equivalents:Beginning of year:
Unrestricted 38,733 15,790 11,511 66,034 4,540 Restricted 55,344 8,876 4,552 68,772 —
94,077 24,666 16,063 134,806 4,540
End of year:Unrestricted 37,737 27,778 11,503 77,018 2,604 Restricted 36,134 7,062 7,087 50,283 —
$ 73,871 34,840 18,590 127,301 2,604
Reconciliation of operating income (loss) to net cash provided by (used in)operating activities:
Operating income (loss) $ 1,835 14,990 5,279 22,104 (1,845) Adjustments to reconcile operating income (loss) to net cash provided by (used in)
operating activities:Depreciation and amortization 47,815 5,002 2,652 55,469 7 Changes in assets and liabilities:
Receivables, net 1,965 (1,411) (12) 542 534 Inventories (313) (345) — (658) — Other assets, net 47 — 20 67 (6) Accounts payable, accrued liabilities, accrued salaries, and other benefits 2,081 782 215 3,078 (368) Claims payable — — — — 44 Deferred revenue (574) (86) (9) (669) — Due to/from other funds 967 108 709 1,784 (866) Advance to other funds — — — — 729 Customer deposits — 33 — 33 — Other long term liabilities (471) (60) (16) (547) —
Total adjustments 51,517 4,023 3,559 59,099 74 Net cash provided by (used in) operating activities $ 53,352 19,013 8,838 81,203 (1,771)
Supplemental disclosure for noncash activities:Contributed capital $ — $ — $ — $ — $ 21 Unrealized (loss) gain on investments (414) (146) 116 (444) —
See accompanying notes to basic financial statements.

28
City of St. Louis, MissouriStatement of Fiduciary Net Assets
Fiduciary FundsJune 30, 2012
(dollars in thousands)
Pension AgencyTrust Funds Funds
ASSETS
Cash and cash equivalents $ 26,213 29,573 Pension trust investments
Bonds 256,856 — Domestic bond funds 57,717 — Stocks 460,396 — Mortgage-backed securities 22,032 — Collective investment funds 324,398 — Guaranteed fixed income securities 527 — Real estate equities and investment trust 124,301 — Investment property 1,444 — Hedge funds 67,234 — Money market mutual funds and other short-term investments 60,161 — Managed international equity funds 165,282 —
Total investments 1,540,348 — Securities lending collateral 11,678 — Receivables, net of allowances:
Taxes — 28,104 Contributions 6,409 — Accrued interest 2,139 — Other 5,032 1,312
Capital assets, net 1,164 — Total assets 1,592,983 58,989
LIABILITIES
Accounts payable and accrued liabilities 2,051 1,903 Deposits held for others 796 22,632 Due to other governmental agencies — 34,454 Securities lending collateral liability 11,678 — Other liabilities 4,444 —
Total liabilities 18,969 58,989
NET ASSETS
Net assets held in trust for pension benefits $ 1,574,014 —
See accompanying notes to basic financial statements.

29
City of St. Louis, MissouriStatement of Changes in Fiduciary Net Assets
Fiduciary FundsYear ended June 30, 2012
(dollars in thousands)
PensionTrust Funds
ADDITIONS
Contributions:Members $ 7,006 Employers 72,672
Investment income:Interest and dividends 25,409 Net depreciation in fair value of investments (13,396) Investment income 12,013
Less investment expense (7,441) Net investment loss 4,572 Total additions 84,250
DEDUCTIONS
Benefits 134,923 Refunds of contributions 3,514 Administrative expense 3,239
Total deductions 141,676 Net decrease (57,426)
Net assets held in trust for pension benefits:Beginning of year 1,631,440 End of year $ 1,574,014
See accompanying notes to basic financial statements.

City of St. Louis, Missouri Notes to Basic Financial Statements
June 30, 2012 (dollars in thousands)
30
1. SUMMARY OF SIGNIFICANT ACCOUNTING POLICIES
The City of St. Louis, Missouri (the City) is a constitutional charter city not a part of any county, which is organized and exists under and pursuant to the constitution and laws of the State of Missouri (the State). The City’s current form of government is provided for in its charter, which first became effective in 1914 and has been subsequently amended by City voters. The City provides a wide range of municipal services as follows: fire and other public safety; parks and recreation; forestry; health, welfare, and other social services; street maintenance; refuse collection; public services; community and economic development; convention and tourism; and general administrative services. The City also owns and operates a water utility, parking facilities, and an international airport as self-supporting enterprises.
The accounting policies and financial reporting practices of the City conform to U.S. generally accepted accounting principles applicable to governmental entities. The following is a summary of the more significant policies:
Reporting Entity
The City’s financial reporting entity has been determined in accordance with governmental standards for defining the reporting entity and identifying entities to be included in its basic financial statements. The City’s financial reporting entity consists of the City of St. Louis (the primary government) and its component units.
1) Blended Component Units
The component units discussed below are included in the City’s reporting entity due to the significance of their operational or financial relationships with the City.
Public Facilities Protection Corporation (PFPC)
The PFPC is an internal service fund governed by a five-member board of persons in designated City positions. The PFPC is reported as if it were part of the primary government because its sole purpose is to provide the City with a defined and funded self-insurance program for claims, judgments, and other related legal matters including workers’ compensation.
St. Louis Municipal Finance Corporation (SLMFC)
The SLMFC, established in 1991, is governed by a five-member board, consisting of persons in designated City positions. The SLMFC is reported as if it were part of the primary government because its sole purpose is to lessen the burden on the City by financing, acquiring, leasing, or subleasing real property, and improvement thereon, and personal property to the City.
St. Louis Parking Commission Finance Corporation (SLPCFC)
The SLPCFC, established in 2003, is governed by a five-member board as appointed by the Parking Commission. The SLPCFC finances the purchase of and owns, leases and sells certain real property on behalf of the Parking Commission. SLPCFC is considered to be a component unit of the City because the Parking Division of the City of St. Louis (the Parking Division) is financially accountable for SLPCFC, as it appoints all of SLPCFC’s directors and is able to

City of St. Louis, Missouri Notes to Basic Financial Statements
June 30, 2012 (dollars in thousands)
31
impose its will on SLPCFC. The SLPCFC provides services entirely to the Parking Division and is reported as if it were part of the Parking Division because its sole purpose is to lessen the burden on the Parking Division by coordinating real property transactions.
Grand Center Municipal Parking Finance Corporation (MPFC)
The MPFC was established during the year ended June 30, 2009. The MPFC is a legally separate not-for-profit public benefit corporation with the Parking Commission as the sole member of the MPFC. Because the Parking Division appoints all of MPFC’s directors and is able to impose its will on the MPFC, it is considered to be a component unit of the Parking Division. The MPFC’s goal is to employ innovative public parking programs, services, technology, and products to strengthen the economic vitality and competitiveness of arts and entertainment venues and supporting enterprises operating in the Grand Center area. An additional goal is to improve the coordination of public parking regulations and enforcement, along with the quality marketability, availability, and accessibility of public parking spaces in the Grand Center area.
2) Discretely Presented Component Units
The component unit columns in the statement of net assets and statement of activities include the financial data of the City’s three discretely presented component units. These are reported individually to emphasize that they are legally separate from the City.
St. Louis Development Corporation (SLDC)
The SLDC was organized in 1988 to improve the efficiency and effectiveness of the economic development activities of the City. SLDC combines the administrative staffs of six independent development agencies for the purpose of coordinating administrative services for all six agencies. The agencies that are considered component units of SLDC are the Land Reutilization Authority, the Land Clearance for Redevelopment Authority (LCRA), the St. Louis Industrial Development Authority, the Planned Industrial Expansion Authority, the Local Development Company, and the St. Louis Port Authority. SLDC is included as a component unit of the City because the City is financially accountable for SLDC, as SLDC is fiscally dependent upon the City. SLDC is considered to be fiscally dependent on the City because SLDC may not legally issue bonded debt or implement a budget for its redevelopment activities until the City’s Board of Alderman has approved the redevelopment project and declared the redevelopment area blighted.
The Metropolitan Police Department of the City of St. Louis, Missouri (SLPD)
The SLPD, established by state statute, is administered by a five-member board of commissioners, the mayor, and four members appointed by the governor. The City is obligated to provide a minimum level of funding for the operations of the SLPD. SLPD’s operating budget is prepared and submitted to the City for approval. SLPD has no authority to levy a tax or issue debt in its name, and therefore, is fiscally dependent on the City for substantially all of its funding.

City of St. Louis, Missouri Notes to Basic Financial Statements
June 30, 2012 (dollars in thousands)
32
Solid Waste Management and Development Corporation (SWMDC)
The SWMDC owns a system of underground pressurized steam transport pipe in the downtown St. Louis area commonly known as the “steam loop.” The steam loop is leased on a long-term basis to a steam-generating private entity unrelated to the City. The steam loop serves City Hall and other municipal buildings, and is the only non-private source of steam in downtown St. Louis. The City appoints a voting majority of SWMDC’s board of directors. The board of directors consists of representatives of the president of the Board of Public Service (Chairperson), deputy mayor/chief of staff, and director of the Street Department. Separate financial statements are not prepared for SWMDC. SWMDC is directed by employees of the City, and therefore, the City is able to impose its will on SWMDC.
Complete financial statements of the discretely presented component units other than SWMDC may be obtained from their administrative offices as follows:
St. Louis Development Corporation The Metropolitan Police Department of the City1520 Market Street Ste 2000 of St. Louis, MissouriSt. Louis, Missouri 63103 1200 Clark Avenue
St. Louis, Missouri 63103
3) Related Organizations
The City’s officials are also responsible for appointing the voting majority of board members for other organizations, but the City’s accountability for these organizations do not extend beyond making the appointments. Thus, no financial data for these organizations are included in the City’s basic financial statements. These related organizations include the Mental Health Board, the St. Louis Housing Authority, the St. Louis Office for Mental Retardation & Developmental Disability Resources, and the St. Louis Public Library.
4) Joint Venture
St. Louis Regional Convention and Sports Complex Authority (Authority)
The Authority, established in 1990 as a separate legal entity by an Act of the Missouri State legislature, is governed by an 11-member board of commissioners. The mayor of the City and the county executive of St. Louis County, Missouri (the County) each appoint three members and the governor of the State appoints the remaining five commissioners. The Authority is considered a joint venture of the City, the County, and the State because the three governments have entered into a contractual agreement with the Authority to sponsor the issuance of convention facility bonds, to repay the facility bonds through rental payments to the Authority, and to make annual preservation payments for facility maintenance and renovations, all of which create an ongoing financial responsibility of the City. The Authority is subject to joint control of the City, the County, and the State. Complete financial statements for the Authority can be obtained from the Authority’s administrative offices at 901 North Broadway, St. Louis, Missouri 63101.

City of St. Louis, Missouri Notes to Basic Financial Statements
June 30, 2012 (dollars in thousands)
33
5) Pension Trust Funds
Financial information for the pension trust funds has been included within the accompanying financial statements as of September 30, 2011, which is the fiscal year end of the retirement plans, which falls within the City’s current fiscal year end.
Government-wide and Fund Financial Statements
The government-wide financial statements (that is, the statement of net assets and the statement of activities) report information on all of the non-fiduciary activities of the City and its component units. The effect of interfund activity has been removed from these statements. Governmental activities, which normally are supported by taxes and intergovernmental revenues, are reported separately from business-type activities, which rely to a significant extent on charges for services. Likewise, the City is reported separately from certain legally separate component units for which the City is financially accountable.
The statement of activities demonstrates the degree to which the direct expenses of a given function or segment are offset by program revenues. Direct expenses are those that are clearly identifiable with a specific function. Program revenues include: 1) charges for services to customers or applicants who purchase, use, or directly benefit from goods, services, or privileges provided by a given function, and 2) grants and contributions that are restricted to meeting the operational or capital requirements of a particular function. Taxes, unrestricted interest earnings, gains, and other miscellaneous revenues not properly included among program revenues are reported instead as general revenues.
Following the government-wide financial statements are separate financial statements for governmental funds, proprietary funds, and fiduciary funds. Fiduciary funds are excluded from the government-wide financial statements. Major individual governmental funds and major individual enterprise funds are reported as separate columns in the fund financial statements. The City has determined that the general fund, the capital projects fund, and the grants fund are major governmental funds. All other governmental funds are reported in one column labeled “Other Governmental Funds”. The total fund balances for all governmental funds is reconciled to total net assets for governmental activities as shown on the statement of net assets. The net change in fund balance for all governmental funds is reconciled to the total change in net assets as shown on the statement of activities in the government-wide statements. The City has three enterprise funds (business-type activities): Lambert-St. Louis International Airport (the Airport), the Water Division of the City of St. Louis (the Water Division), and the Parking Division. Each of these enterprise funds is a major fund within the fund financial statements. Additionally, the City has three internal service funds (governmental activities): PFPC, mailroom services, and health. All internal service fund activity is combined into a single column on the proprietary fund statements, since major fund reporting requirements do not apply to internal service funds.
The fund financial statements of the City are organized on the basis of funds, each of which is considered a separate accounting entity with self-balancing accounts that comprise its assets, liabilities, fund balances/net assets, revenues and expenditures, or expenses. Governmental resources are allocated to and accounted for in individual funds based upon the purposes for which they are to

City of St. Louis, Missouri Notes to Basic Financial Statements
June 30, 2012 (dollars in thousands)
34
be spent and the means by which spending activities are controlled. The various funds are summarized by type in the basic financial statements. The following fund types are used by the City:
1) Governmental Fund Types
Governmental funds are those through which most governmental functions are financed. The acquisition, uses, and balances of the City’s expendable financial resources and the related liabilities (except those accounted for in proprietary funds) are accounted for through governmental funds. The measurement focus is upon determination of and changes in financial position rather than upon net income.
The following are the City’s governmental major funds:
General Fund—The general fund is the general operating fund of the City. It is used to account for all financial resources except those required to be accounted for in another fund.
Capital Projects Fund—The capital projects fund is used to account for financial resources to be used for the acquisition or construction of major capital facilities, other than those financed by proprietary funds. This fund accounts for acquisition or construction of capital improvements, renovations, remodeling, and replacement for the City’s major capital projects.
Grants Fund—The grants fund is a special revenue fund that is used to account for the proceeds of specific revenue sources (other than major capital projects) that are legally restricted to expenditures for specific purposes. The grants fund accounts for the majority of the City’s federal grant programs received from the U.S. Department of Health and Human Services, U.S. Department of Housing and Urban Development, U.S. Department of Justice, U.S. Department of Labor, U.S. Department of Transportation, and various other federal agencies.
The other governmental funds of the City are considered nonmajor. They are special revenue funds, which account for the proceeds of specific revenue sources that are legally restricted to expenditures for specific purposes, and a debt service fund, which accounts for the accumulation of resources for, and repayment of, general obligation long-term debt principal, interest, and related costs.
2) Proprietary Fund Types
Proprietary funds are used to account for activities that are similar to those found in the private sector. The measurement focus is on the determination of net income and capital maintenance.
The following are the City’s proprietary fund types:
Enterprise—Enterprise funds are used to account for operations that are financed and operated in a manner similar to private business enterprises—where the intent of the governing body is that the costs (including depreciation) of operations are financed primarily through user charges. Enterprise funds have been established for the Airport, the Water

City of St. Louis, Missouri Notes to Basic Financial Statements
June 30, 2012 (dollars in thousands)
35
Division, and the Parking Division. The Airport is used to account for the activities of the Airport. The principal services provided are financed primarily through landing fees and terminal concession revenues. The Water Division is used to account for sale of water to the general public and the operation of the water delivery system. The Parking Division is used to account for the operation of public parking facilities and parking meters. Each of the enterprise funds is a major fund in the fund financial statements.
Internal Service—Internal service funds are used to account for the financing of goods or services provided by one department or agency to other departments or agencies of a government, or to other governments, on a cost-reimbursement basis. An internal service fund has been established for PFPC, mailroom services, and health. The PFPC fund is used to account for payment of workers’ compensation and various other claims against legal actions on behalf of other funds. The mailroom services fund is used to account for mail-handling services provided to other funds. The health fund is used to account for payment of health insurance claims for participants.
In the government-wide and proprietary fund financial statements, the City applies all applicable Governmental Accounting Standards Board (GASB) pronouncements, as well as the following private-sector pronouncements issued on or before November 30, 1989, unless these pronouncements conflict with or contradict GASB pronouncements: Financial Accounting Standards Board (FASB) Statements and Interpretations, Accounting Principles Board (APB) Opinions, and Accounting Research Bulletins (ARBs) of the Committee on Accounting Procedure. Governments also have the option of following subsequent private-sector guidance for their business-type activities and enterprise funds, subject to this same limitation. The City has elected not to follow subsequent private-sector guidance.
3) Fiduciary Fund Types
Trust and Agency—Trust and agency funds are used to account for assets held by the City in a trustee capacity or as an agent for individuals, private organizations, or other governmental units. These include pension trust funds and agency funds. Pension trust funds are accounted for and reported similar to proprietary funds. The pension trust funds account for the Firemen’s Retirement System of St. Louis, Police Retirement System of St. Louis, and the Employees’ Retirement System of the City of St. Louis pension benefits. Agency funds are accounted for using the accrual basis of accounting. Agency funds are custodial in nature (assets equal liabilities) and do not involve the measurement of results of operations. These funds account for activities of the collector of revenue, property tax escrow, general insurance, bail bonds, license collector, circuit clerk, and other agency operations.
Measurement Focus and Basis of Accounting
Basis of accounting refers to when revenues and expenditures or expenses are recognized in the accounts and reported in the basic financial statements. Basis of accounting relates to the timing of the measurements made, regardless of the measurement focus applied.
The government-wide financial statements are reported using the economic resources measurement focus and accrual basis of accounting, as are the proprietary fund, pension trust fund, and discretely

City of St. Louis, Missouri Notes to Basic Financial Statements
June 30, 2012 (dollars in thousands)
36
presented component unit financial statements. Agency funds adhere to the accrual basis of accounting, and do not have a measurement focus. Revenues are recorded when earned and expenses are recorded when a liability is incurred, regardless of the timing of the related cash flows. Property taxes are recognized as revenues in the year for which they are levied. Grants and similar items are recognized as revenue as soon as all eligibility requirements have been met.
Governmental fund financial statements are reported using the current financial resources measurement focus and the modified accrual basis of accounting. At year-end, entries are recorded for financial reporting purposes to reflect the modified accrual basis of accounting for governmental fund types, and the accrual basis of accounting for the proprietary fund types, pension trust funds, and agency funds.
Under the modified accrual basis of accounting, revenues are recorded when both measurable and available. The term “available” is defined as collectible within the current period or soon enough thereafter to be used to pay the liabilities of the current period. For the City, available is defined as expected to be received within 60 days of fiscal year-end, except for government grants, which is within 120 days of fiscal year-end. Expenditures generally are recorded when a liability is incurred, as under accrual accounting. However, debt service expenditures, as well as expenditures related to compensated absences and claims and judgments, are recorded only when payment is due (that is, matured).
GASB Statement No. 33, Accounting and Financial Reporting for Nonexchange Transactions, groups nonexchange transactions into the following four classes, based upon their principal characteristics: derived tax revenues, imposed nonexchange revenues, government mandated nonexchange transactions, and voluntary nonexchange transactions.
The City recognizes assets from derived tax revenue transactions (such as city earnings and payroll taxes, sales and utilities gross receipt taxes) in the period when the underlying exchange transaction on which the tax is imposed occurs or when the assets are received, whichever occurs first. Revenues are recognized, net of estimated refunds and estimated uncollectible amounts, in the same period that the assets are recognized, provided that the underlying exchange transaction has occurred. Resources received in advance are reported as deferred revenues until the period of the exchange.
The City recognizes assets from imposed nonexchange revenue transactions in the period when an enforceable legal claim to the assets arises or when the resources are received, whichever occurs first. Revenues are recognized in the period when the resources are required to be used for the first period that use is permitted. The City recognizes revenues from property taxes, net of estimated refunds and estimated uncollectible amounts, in the period for which the taxes are levied. Imposed nonexchange revenues also include permits, court fines, and forfeitures.
Intergovernmental revenues, representing grants and assistance received from other governmental units, are generally recognized as revenues in the period when all eligibility requirements, as defined by GASB Statement No. 33, have been met. Any resources received before eligibility requirements are met are reported as deferred revenues.

City of St. Louis, Missouri Notes to Basic Financial Statements
June 30, 2012 (dollars in thousands)
37
Charges for services in the governmental funds, which are exchange transactions and are, therefore, not subject to the provisions of GASB Statement No. 33, are recognized as revenues when received in cash because they are generally not measurable until actually received.
Under the accrual basis of accounting used by the proprietary fund types and pension trust funds, revenues are recognized when earned and expenses are recognized when incurred. Unbilled service revenues are accrued by the Airport and the Water Division based on estimated billings for services provided through the end of the current fiscal year.
Proprietary funds distinguish operating revenues and expenses from nonoperating items. Operating revenues and expenses generally result from providing services and producing and delivering goods in connection with a proprietary fund’s principal ongoing operations. The principal operating revenues of the Airport enterprise fund are revenues from airlines, concessions, and parking. Transactions that are capital-, financing-, or investing-related are reported as nonoperating revenues. The principal operating revenues of the Water Division enterprise fund, the Parking Division enterprise fund, and internal service funds are charges to customers for sales and services. All expenses related to operating the Airport enterprise fund are reported as operating expenses. Interest expense, financing costs, and miscellaneous expenses are reported as nonoperating expenses. Operating expenses for the Water Division enterprise fund, the Parking Division enterprise fund, and internal service funds include the cost of sales and services, administrative expenses, and depreciation and amortization. All revenues and expenses not meeting this definition are reported as nonoperating revenues and expenses.
When both restricted and unrestricted resources are available for use, it is the City’s policy to use restricted resources first and then unrestricted resources as they are needed.
For the pension trust funds, under the accrual basis of accounting, contributions are recognized in the period in which the contributions are due and benefits are recognized when they become due and payable.
Property Taxes
Taxes are levied annually in November based on the assessed valuation of all real and personal property located in the City as of the previous January 1. The City tax rate levied in November 2011 was $1.4691 per $100 (in dollars) of assessed valuation of which $1.3547 (in dollars) is for the general fund and $0.1144 (in dollars) is for the debt service fund. Taxes are billed in November and are due and collectible on December 31. All unpaid taxes become delinquent on January 1 of the following year and attach as an enforceable lien on the related property at that date.
Cash and Investments
The City Treasurer maintains a cash and investment pool that is available for use by all funds including certain component units, except pension trust funds. In accordance with the City’s budget ordinance the majority of investment income is considered earned by the general fund except for earnings otherwise legally restricted for a specific purpose. Income from investments associated with one fund is not assigned to another fund for other than legal or contractual reasons. In addition, cash

City of St. Louis, Missouri Notes to Basic Financial Statements
June 30, 2012 (dollars in thousands)
38
and investments are separately maintained by other City officials, several of the City’s departments and third-party trustee and fiscal agents.
Investments are recorded at fair value. Fair values for investments are determined by closing market prices at year-end as reported by the investment custodian. Mortgages are valued on the basis of future principal and interest payments and are discounted at prevailing interest rates for similar instruments.
The City invests in various investments. Investments are exposed to various risks such as interest rate, market, and credit risks. Due to the level of risk associated with certain investments, it is at least reasonably possible that changes in the fair values of investments will occur in the near term and that such changes could materially affect the amounts reported in the accompanying financial statements.
Inventories
Purchase of materials and supplies in the governmental fund types are charged to expenditures as incurred. Amounts of inventories in such funds are immaterial. For the enterprise fund type, inventories are recorded at cost using a method that approximates the first-in, first-out method or the moving average cost method, and the expense is recognized when inventories are consumed in operations.
Capital Assets
1) Governmental Activities Capital Assets
Capital assets, which include buildings, improvements, equipment, and infrastructure assets (for example, roads, bridges, docks, promenade, traffic signals, and similar items), are reported in the governmental activities column in the government-wide financial statements, net of accumulated depreciation. Capital assets are defined by the City as assets with an estimated useful life in excess of one year with an initial, individual cost of $5 or more, infrastructure with a cost of $500 or more, building improvements with a cost of $100 or more, and all land, land improvements, and buildings.
Purchased or constructed capital assets are reported at cost or estimated historical cost. Donated capital assets are recorded at their estimated fair market value at the date of donation. General infrastructure assets acquired prior to July 1, 2001 consist of the road network and other infrastructure assets that were acquired or that received substantial improvements subsequent to June 30, 1980 and are reported at estimated historical cost using deflated replacement cost. The costs of normal maintenance and repairs that do not add to the value of the asset or materially extend the assets’ lives are not capitalized.
The City has determined that all works of art and historical treasures other than the City’s statues, monuments, and fountains meet the definition of a collection, and accordingly, has not capitalized these assets. A collection is defined as:
• Held for public exhibition and education • Protected, cared for, and preserved
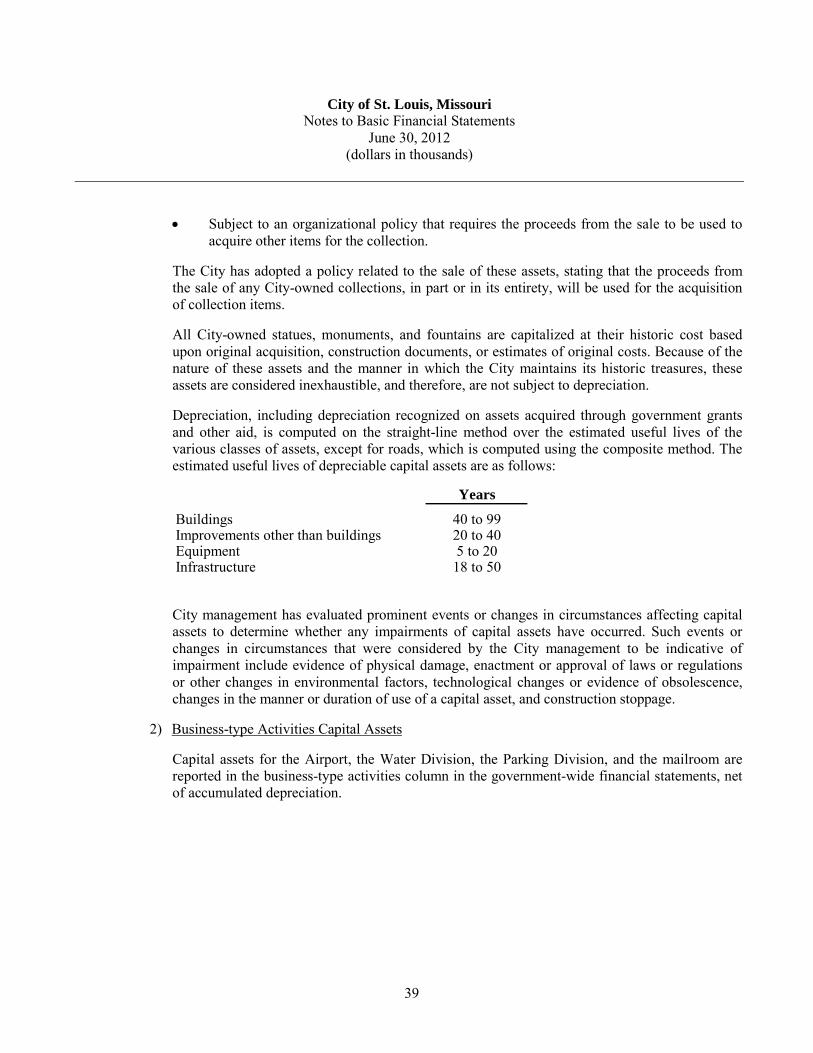
City of St. Louis, Missouri Notes to Basic Financial Statements
June 30, 2012 (dollars in thousands)
39
• Subject to an organizational policy that requires the proceeds from the sale to be used to acquire other items for the collection.
The City has adopted a policy related to the sale of these assets, stating that the proceeds from the sale of any City-owned collections, in part or in its entirety, will be used for the acquisition of collection items.
All City-owned statues, monuments, and fountains are capitalized at their historic cost based upon original acquisition, construction documents, or estimates of original costs. Because of the nature of these assets and the manner in which the City maintains its historic treasures, these assets are considered inexhaustible, and therefore, are not subject to depreciation.
Depreciation, including depreciation recognized on assets acquired through government grants and other aid, is computed on the straight-line method over the estimated useful lives of the various classes of assets, except for roads, which is computed using the composite method. The estimated useful lives of depreciable capital assets are as follows:
Years
Buildings 40 to 99Improvements other than buildings 20 to 40Equipment 5 to 20Infrastructure 18 to 50
City management has evaluated prominent events or changes in circumstances affecting capital assets to determine whether any impairments of capital assets have occurred. Such events or changes in circumstances that were considered by the City management to be indicative of impairment include evidence of physical damage, enactment or approval of laws or regulations or other changes in environmental factors, technological changes or evidence of obsolescence, changes in the manner or duration of use of a capital asset, and construction stoppage.
2) Business-type Activities Capital Assets
Capital assets for the Airport, the Water Division, the Parking Division, and the mailroom are reported in the business-type activities column in the government-wide financial statements, net of accumulated depreciation.

City of St. Louis, Missouri Notes to Basic Financial Statements
June 30, 2012 (dollars in thousands)
40
3) Airport
Capital assets are recorded at cost. Depreciation, including depreciation recognized on assets acquired through government grants and other aid, is computed on the straight-line method over the estimated useful lives of the various classes of assets. Land is recorded at cost which, in addition to the purchase price, includes appraisal and legal fees, demolition, and homeowner relocation costs. Net interest costs on funds borrowed to finance the construction of capital assets are capitalized and amortized over the life of the related asset. The estimated useful lives of depreciable capital assets are as follows:
Years
Pavings 5 to 30Buildings and facilities 5 to 30Equipment 3 to 20
4) Water Division
Capital assets were originally recorded in the accounts in 1958 and were based on an engineering study of the historical cost of properties constructed by employees of the Water Division. Accumulated depreciation at the date the assets were recorded was established after a review by a consulting firm.
Additions to capital assets subsequent to 1958 are recorded at historical cost. Provisions for depreciation of capital assets are computed on a straight-line basis over the estimated useful lives of the assets and are charged to operating expenses. The estimated useful lives of depreciable capital assets are as follows:
Years
Buildings and structures 44 to 55Pumping equipment 28 to 44Hydrants, transmission mains, and lines 50 to 100Meters 33 Other equipment 5 to 25
Net interest costs on funds borrowed to finance the construction are capitalized and depreciated over the life of the related asset.

City of St. Louis, Missouri Notes to Basic Financial Statements
June 30, 2012 (dollars in thousands)
41
5) Parking Division
Capital assets are recorded at historical cost, including applicable interest incurred during the construction period. Donated capital assets are recorded at estimated fair market value at the date of donation. The contributions are reflected as capital contributions. Depreciation is computed using the straight-line method over the estimated useful lives of the various classes of assets. The estimated useful lives of depreciable capital assets are as follows:
YearsBuildings, land improvements, and
parking garages 5 to 40Equipment 5 to 15Parking meters and lot equipment 5 to 10
6) Mailroom
Capital assets are recorded at historical cost. Depreciation is computed using the straight-line method over the estimated useful lives of the various classes of assets. The estimated useful life of equipment, other than computer equipment, is 10 years. The estimated useful life of computer equipment is five years.
7) Component Unit—SLDC
SLDC’s property, plant, equipment, and infrastructure with useful lives of more than one year are stated at historical cost. Historically, SLDC maintained infrastructure asset records consistent with all other capital assets. SLDC generally capitalizes assets with costs of $2,500 (in dollars) or more as purchase and construction outlays occur. The costs of normal maintenance and repairs that do not add to the asset value or materially extend useful lives are not capitalized. Capital assets are depreciated using the straight-line method. When capital assets are disposed, the cost and applicable accumulated depreciation are removed from the respective accounts, and the resulting gain or loss is recorded in operations. Estimated useful lives, in years, for depreciable assets are as follows:
YearsBuildings and structures 40 Improvements other than buildings
(includes infrastructure) 3 to 25Furniture, fixtures, and equipment 3 to 10
8) Component Unit—SLPD
Capital assets are capitalized at cost or estimated historical cost. Donated capital assets are recorded at estimated fair market value as of the date received. Major outlays for capital assets and improvements are capitalized when projects are operational or useful. All capital assets over the capitalization levels are depreciated. SLPD’s capitalization threshold is $5.

City of St. Louis, Missouri Notes to Basic Financial Statements
June 30, 2012 (dollars in thousands)
42
Depreciation is computed using the straight-line method (with the 1/2-year convention election applied in the first and last year) over the following estimated useful lives:
Years
Buildings 50 – 100 Building improvements 5 – 25 Furniture and fixtures and other
equipment 3 – 10 Automotive equipment 3 – 15 Communication equipment 5 – 8 Computer and software 3 – 5 Internally generated computer software 3 – 8
9) Component Unit—SWMDC
Capital assets are capitalized at cost. Depreciation is computed using the straight-line method over the estimated useful lives to the depreciable capital assets. The estimated useful lives of infrastructure is 30 to 40 years.
Long-term Liabilities
In the government-wide financial statements and proprietary fund types in the fund financial statements, long-term debt and other long-term obligations are reported as liabilities in the applicable governmental activities, business-type activities, or proprietary fund type statement of net assets/statement of fund net assets.
Passenger Facility Charges (PFCs)
The Airport collects a $4.50 (in dollars) facility charge per enplaned passenger to fund approved Federal Aviation Administration (FAA) projects. The PFC is withheld by the respective airlines for each ticket purchased and passenger transfer made in St. Louis and remitted to the Airport one month after the month of receipt, less an $0.11 (in dollars) per ticket operating fee retained by the airlines. PFCs represent an exchange-like transaction and are recognized as nonoperating revenue based upon passenger enplanements.
Capital Contributions
Capital contributions to the proprietary fund type represent government grants and other aid used to fund capital projects. Capital contributions are recognized as revenue when the expenditure is made and amounts become subject to claim for reimbursement. Amounts received from other governments by the proprietary fund type, which are not restricted for capital purposes, are reflected as nonoperating intergovernmental revenue.

City of St. Louis, Missouri Notes to Basic Financial Statements
June 30, 2012 (dollars in thousands)
43
Capitalization of Interest
Net interest costs on funds borrowed to finance the construction of capital assets are capitalized and depreciated over the life of the related asset for business-type activities and proprietary fund types. Interest is not capitalized for governmental activities or governmental fund types.
Bond Premiums, Discounts, and Issuance Costs
In government-wide financial statements and the proprietary fund types in the fund financial statements, bond discounts are recorded as a reduction of the debt obligation, bond premiums are recorded as an addition to the debt obligation, and bond issuance costs are recorded as a deferred charge. Such amounts are amortized using the interest method or bonds-outstanding method over the term of the related revenue bonds. The deferred amount on refunding is amortized as a component of interest expense over the remaining life of the bonds using the bonds-outstanding method.
In the fund financial statements, governmental fund types recognize bond premiums and discounts, as well as bond issuance costs, during the current period. The face amount of debt issued is reported as other financing sources. Premiums received on debt issuances are reported as other financing sources, while discounts on debt issuances are reported as other financing uses. Issuance costs, whether or not withheld from the actual debt proceeds received, are reported as debt service expenditures.
Vacation and Sick Leave
The City grants vacation to full-time and part-time employees who work 50% of full-time or more based on years of continuous service. The entire accrued benefit liability related to the City’s vacation and sick leave has been recorded in the government-wide financial statements and in the proprietary funds in the fund financial statements. Amounts have been recorded in the governmental fund financial statements as part of accrued salaries and other benefits, since such amounts came due (that is, matured) during the fiscal year ended June 30, 2012.
Non-uniformed employees retiring after June 30, 2001 who have an unused sick leave balance may, at retirement, elect to receive payment for one-half of the sick leave balance. As an estimate of the portion of sick leave that will result in termination payments, a liability has been recorded on the government-wide financial statements and the proprietary funds in the fund financial statements representing one-half of the accumulated sick leave balance for those employees who will be eligible to retire within five years.
Component Unit—SLPD
Vacation and designated holiday pay is granted to full-time employees based on years of continuous service and will be paid to employees upon resignation, retirement, or death.
Both commissioned and civilian employees accumulate sick leave hours and will be paid a minimum of 25% of their unused sick leave upon termination of employment. The liability for accrued sick leave pay has been calculated using the vesting method. Commissioned and civilian employees retiring from SLPD with 1600+ hours of sick leave accrued and 20+ years of service will be paid 25% of their unused sick leave plus one additional month’s salary. Commissioned employees retiring

City of St. Louis, Missouri Notes to Basic Financial Statements
June 30, 2012 (dollars in thousands)
44
from SLPD with 2200+ hours of sick leave accrued and 30+ years of service will be paid 50% of their unused sick leave. Civilian employees retiring from SLPD with 2200+ hours of sick leave accrued and 85 points (years of service plus age) or age 65 will be paid 50% of their unused sick leave.
Effective June 30, 2011, at point of termination, all benefit payouts greater than $3,000 are paid in thirds as follows: first third is paid immediately, second third is paid twelve months from first payment and the third and final payment is paid twelve months from the second payment.
Interfund Transactions
In the fund financial statements, the City has the following types of transactions among funds:
1) Transfers
Legally authorized transfers are reported when incurred as transfers in by the recipient fund and as transfers out by the disbursing fund.
2) Interfund Services Provided/Used
Charges or collections for services rendered by one fund for another are recognized as revenues (interfund services provided) of the recipient fund and expenditures or expenses (interfund services used) of the disbursing fund. These transactions are recorded as interfund services because they would be treated as revenues and expenditures or expenses if they involved organizations external to the City.
Within the accompanying activity from the statement of activities, interfund services provided and used are not eliminated from the various functional categories. Transfers are eliminated from the various functional categories.
Certain internal payments are treated as program revenues, such as internal services provided and used. Certain internal payments are treated as a reduction of expense, such as reimbursements.
Fund Balance Designation
In the governmental fund financial statements the City maintains nonspendable, restricted, committed, assigned and unassigned fund balances.
Within the fund financial statements, the fund balance is reported as follows:
• Nonspendable: This consists of resources not in spendable form or are legally or contractually required to remain intact.
• Restricted: This consists of amounts that can be spent only for the specific purpose stipulated by constitution, external parties (e.g., grantors, creditors, or other governments), or enabling legislation.

City of St. Louis, Missouri Notes to Basic Financial Statements
June 30, 2012 (dollars in thousands)
45
• Committed: This consists of amounts that can only be used for specific purposes pursuant to formal action of the government’s highest level of decision-making authority. Committed amounts cannot be used for any other purpose unless the government removes or changes the specified use by taking the same type of action it employed to previously commit these amounts. Committed balances are classified as such as a result of the City of St. Louis Board of Aldermen taking formal action and adopting an ordinance which can only be modified or rescinded by a subsequent formal action.
• Assigned: This consists of amounts constrained by the government’s intent to be used for specific purposes, but are neither restricted nor committed. Per City policy, assigned balances are a result of the Board of Estimate and Apportionment approval and authorization of projects or actions prior to July 1, 2012.
• Unassigned: This consists of residual fund balances that do not meet the criteria of nonspendable, restricted, committed, or assigned.
The City’s policy is to apply expenditures to restricted resources first, then committed, then assigned, and unassigned, respectively, as applicable.
Net Assets
In the government-wide and proprietary fund financial statements, equity is displayed in three components as follows:
1) Invested in Capital Assets, Net of Related Debt
This consists of capital assets, net of accumulated depreciation, less the outstanding balances of any bonds, notes, or other borrowings that are attributable to the acquisition and construction of those assets.
2) Restricted
This consists of net assets that are legally restricted by outside parties or by law through constitutional provisions or enabling legislation. Net assets restricted by statutory restrictions represent tax and other revenue sources that are required by statute to be expended only for a specific purpose or purposes.
3) Unrestricted
This consists of net assets that do not meet the definition of “restricted” or “invested in capital assets, net of related debt.”
Statement of Cash Flows
For the purpose of the statement of cash flows, cash and cash equivalents are defined as all highly liquid investments (including restricted assets) with a maturity of three months or less at the date of purchase.

City of St. Louis, Missouri Notes to Basic Financial Statements
June 30, 2012 (dollars in thousands)
46
Use of Estimates
The preparation of the basic financial statements in conformity with U.S. generally accepted accounting principles requires management to make estimates and assumptions that affect the reported amounts of assets and liabilities and disclosure of contingent assets and liabilities at the date of the basic financial statements, and the reported amounts of revenue, expenses, and expenditures during the reporting period. Actual results could differ from those estimates.
Individual Fund Deficit
At June 30, 2012, the grants fund has a deficit fund balance of $(62). This amount will be offset by future commissions. The other budgeted special revenue fund has deficit fund balance of $(1,581). This amount will be offset by license and permit revenues in future years as well as charges to services to vendors.
Reclassifications
Certain 2011 amounts within the accompanying footnotes have been reclassified to conform with the fiscal year 2012 presentation.
2. DEPOSITS AND INVESTMENTS
a. Primary Government
The following is a reconciliation of the City’s deposit and investment balances as of June 30, 2012:
As the investment strategies and associated risks for the Firemen’s Retirement System of St. Louis (Firemen’s System), Police Retirement System of St. Louis (Police System), and Employees’ Retirement System of the City of St. Louis (Employees’ System) are substantially different than those of the remainder of the primary government, the deposit and investment disclosures for the Firemen’s System, Police System, and Employees’ System are presented separately from those of the remainder of the primary government.

City of St. Louis, Missouri Notes to Basic Financial Statements
June 30, 2012 (dollars in thousands)
47
Cash andCash and Restricted
Equivalents Investments Assets Total
Government-widestatement of net assets $ 138,797 73,717 326,700 539,214
Fiduciary statement offiduciary net assets—agency funds 24,677 — 4,896 29,573
Total primary governmentexcluding pension trustfunds 163,474 73,717 331,596 568,787
Fiduciary statement offiduciary net assets—pension trust funds:
Firemen's System 18,658 368,148 — 386,806 Police System 7,388 589,082 — 596,470 Employees' System 167 583,118 — 583,285
Total pension trust funds 26,213 1,540,348 — 1,566,561 Total primary government $ 189,687 1,614,065 331,596 2,135,348
1) Primary Government Excluding Pension Trust Funds
Investments are recorded at fair value. Fair value for investments is determined by closing market prices at year-end, as reported by the respective investment custodian.
Certificates of deposit are defined as investments for statement of net assets/balance sheet/statement of fund net assets classification and cash flow purposes; for custodial risk disclosure; however, they are described below as cash deposits. In addition, money market mutual funds are classified as cash on the statement of net assets/balance sheet/statement of fund net assets, but as investments for custodial risk disclosure.
As of June 30, 2012, the primary government (excluding the pension trust funds) had the following cash deposits and investments:

City of St. Louis, Missouri Notes to Basic Financial Statements
June 30, 2012 (dollars in thousands)
48
$ 58,826 57,541
112,138 11,491
Federal National Mortgage Pool 27,632 Federal Agricultural Mortgage Corp. 2,239
45,166 1,018
59,340 14,455
178,941 $ 568,787
Other Cash Deposits
Government Backed Trusts
Federal National Mortgage AssociationFederal Home Loan Mortgage Corp.Federal Home Loan BankFederal Farm Credit Discount Note
United States Treasuries
Money Market Mutual FundsCertificates of Deposit
State statutes and City investment policies authorize the deposit of funds in financial institutions and trust companies. Investments may be made in obligations of the U.S. Government or any agency or instrumentality thereof; bonds of the State, the City, or any city within the state with a population of 400,000 inhabitants or more; or time certificates of deposit; provided, however, that no such investment shall be purchased at a price in excess of par. In addition, the City may enter into repurchase agreements maturing and becoming payable within 90 days secured by U.S. Treasury obligations or obligations of the U.S. Government agencies or instrumentalities of any maturity as provided by law. City funds in the form of cash on deposit or time certificates of deposit are required to be insured or collateralized by authorized investments held in the City’s name.
Additionally, the City’s indentures with its bond trustees also permit City bond proceeds to be invested in commercial paper having an original maturity of 270 days or less and rated “A-l” or better by Standard & Poor’s Corporation and “P-l” by Moody’s Investors Service, money market funds rated “AAAM” or “AAAM-G” by Standard & Poor’s Corporation, and other obligations fully and unconditionally guaranteed by the U.S. Government. These investments, while permitted by the indentures with the bond trustees, are not permitted by the Investment Policy for the City of St. Louis, Missouri (Investment Policy).
Interest Rate Risk
Interest rate risk is the risk that the fair value of investments will be adversely affected by a change in interest rates. The City seeks to minimize its exposure to fair value losses arising from changes in interest rates by selecting investments in adherence to the Investment Policy for the City of St. Louis, Missouri (Investment Policy). The Investment Policy provides that, to the extent possible, the City shall attempt to match its investments with anticipated cash flow requirements. Unless matched to a specific cash flow, the City will not directly invest in securities or make a time deposit with a stated maturity or more than five years from the date of purchase. The average maturity for collateral provided to the City for deposits in connection with a repurchase agreement shall not exceed five years without the written approval of the Treasurer. In connection with any outstanding bond issue, debt service reserve funds may be invested to a maximum maturity of 15 years, and up to 30 years with the approval of the Treasurer.

City of St. Louis, Missouri Notes to Basic Financial Statements
June 30, 2012 (dollars in thousands)
49
The investments of the primary government (excluding the pension trust funds) had the following maturities on June 30, 2012:
Investment Maturities (in years)Fair Value Less Than 1 1-5 6-10 More Than 10
Federal NationalMortgage Association $ 58,826 10,282 45,634 2,910 —
Federal Home LoanMortgage Corp. 57,541 38,477 19,064 — —
Federal Home Loan Bank 112,138 109,667 2,471 — — Federal Farm Discount
Notes 11,491 11,491 — — — Federal National Mortgage
Pool 27,632 27,632 — — — Federal Agricultural
Mortgage Corp. 2,239 2,239 — — — United States Treasuries 45,166 25,117 20,049 — — Government Backed
Trusts 1,018 — 1,018 — — Money Market Mutual
Funds 59,340 59,340 — —
$ 375,391 284,245 88,236 2,910 —
Credit Risk
Credit risk is the risk that an issuer or other counterparty to an investment will not fulfill its obligations. The Investment Policy provides that investments of the City be rated in one of the three highest ratings categories by Moody’s Investors Service, Standard & Poor’s Corporation, or Fitch’s Ratings Service.

City of St. Louis, Missouri Notes to Basic Financial Statements
June 30, 2012 (dollars in thousands)
50
The investments of the primary government (excluding the pension trust funds) were rated as follows by Moody’s Investors Service, Standard & Poor’s Corporation, or Fitch’s Ratings Service as of June 30, 2012:
Fair Value AAA A-1+ AA+ A Not Rated
Federal NationalMortgage Association $ 58,826 — 5,295 51,512 2,008 11
Federal Home LoanMortgage Corp. 57,541 — 34,741 22,638 — 162
Federal Home Loan Bank 112,138 1,567 29,104 57,187 — 24,280 Federal Farm
Discount Notes 11,491 — — 11,491 — — Federal National Mortgage
Pool 27,632 — — — — 27,632 Federal Agricultural
Mortgage Corp. 2,239 — — — — 2,239 United States Treasuries* 45,166 — — — — 45,166 Government Backed
Trusts 1,018 — — 1,018 — — Money Market Mutual
Funds 59,340 59,340 — — —
$ 375,391 60,907 69,140 143,846 2,008 99,490
*The City's investments in United States Treasuries are explicitly guaranteed by the United States government and therefore do not require a rating.
Custodial Credit Risk
Custodial credit risk is the risk that, in the event of the failure of a counterparty, the City will not be able to recover the value of the investments, collateral securities, or deposits that are in the possession of the counterparty. Custodial credit risk is the risk that, in the event of the failure of a counterparty, the City will not be able to recover the value of the investments or collateral securities that are in the possession of the counterparty.
The Investment Policy requires that all cash deposits, time certificates of deposit, deposits with listed institutions, and repurchase agreements be covered by adequate pledged collateral. Acceptable collateral includes U.S. Treasury obligations, other interest-bearing securities guaranteed as to principal and interest by the United States or an agency or instrumentality of the United States, bonds of the State or bonds of the City. The market value of the principal and accrued interest of the collateral must equal 103% of the deposits secured, less any amount subject to federal deposit insurance. At June 30, 2012, the City had two cash compensation accounts at JP Morgan Chase that were uncollateralized. The total amount that was uncollateralized and exposed to custodial credit risk was $4,557. All City securities and securities pledged as collateral must be held in a segregated account on behalf of the City by an independent third party with whom the City has a current custodial agreement and has been designated by the Treasurer and Funds Committee as eligible to serve in such a capacity.
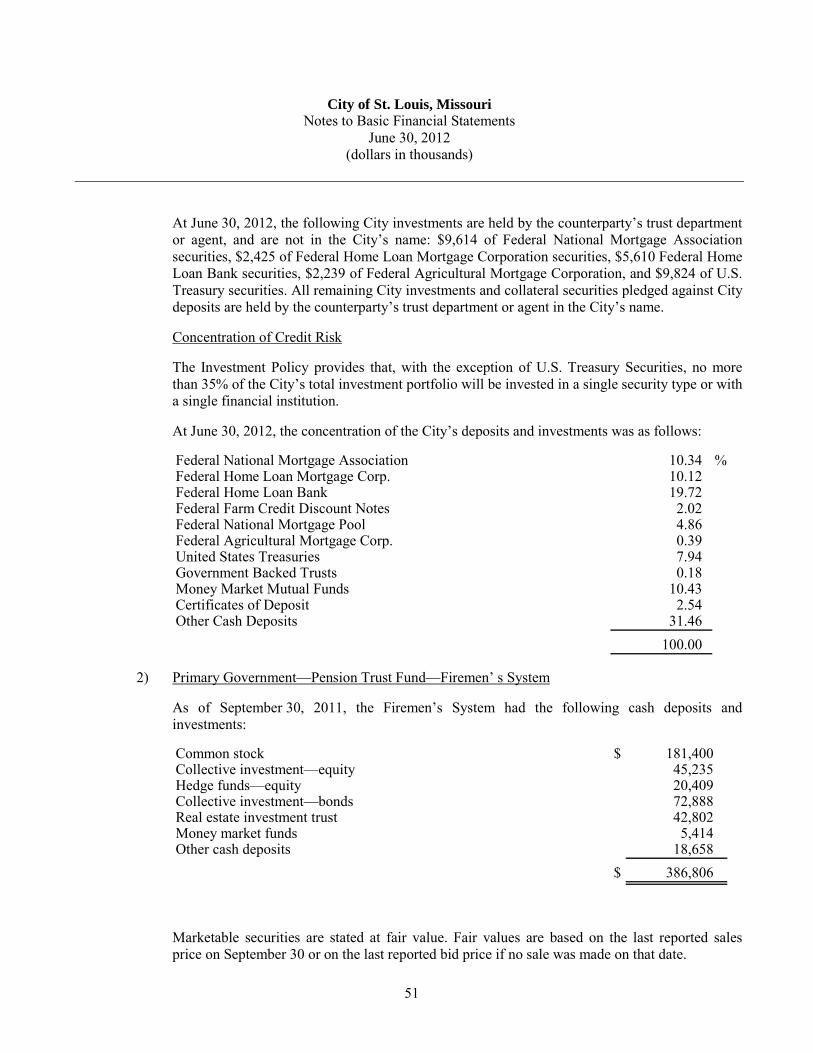
City of St. Louis, Missouri Notes to Basic Financial Statements
June 30, 2012 (dollars in thousands)
51
At June 30, 2012, the following City investments are held by the counterparty’s trust department or agent, and are not in the City’s name: $9,614 of Federal National Mortgage Association securities, $2,425 of Federal Home Loan Mortgage Corporation securities, $5,610 Federal Home Loan Bank securities, $2,239 of Federal Agricultural Mortgage Corporation, and $9,824 of U.S. Treasury securities. All remaining City investments and collateral securities pledged against City deposits are held by the counterparty’s trust department or agent in the City’s name.
Concentration of Credit Risk
The Investment Policy provides that, with the exception of U.S. Treasury Securities, no more than 35% of the City’s total investment portfolio will be invested in a single security type or with a single financial institution.
At June 30, 2012, the concentration of the City’s deposits and investments was as follows:
10.34 %10.12 19.72
2.02 Federal National Mortgage Pool 4.86 Federal Agricultural Mortgage Corp. 0.39
7.94 0.18
10.43 2.54
31.46 100.00
Government Backed Trusts
Federal National Mortgage AssociationFederal Home Loan Mortgage Corp.Federal Home Loan BankFederal Farm Credit Discount Notes
United States Treasuries
Money Market Mutual FundsCertificates of DepositOther Cash Deposits
2) Primary Government—Pension Trust Fund—Firemen’ s System
As of September 30, 2011, the Firemen’s System had the following cash deposits and investments:
Common stock $ 181,400 Collective investment—equity 45,235 Hedge funds—equity 20,409 Collective investment—bonds 72,888 Real estate investment trust 42,802 Money market funds 5,414 Other cash deposits 18,658
$ 386,806
Marketable securities are stated at fair value. Fair values are based on the last reported sales price on September 30 or on the last reported bid price if no sale was made on that date.

City of St. Louis, Missouri Notes to Basic Financial Statements
June 30, 2012 (dollars in thousands)
52
The Firemen’s System’s investments are continuously exposed to various types of inherent risks. These risks are mitigated by the Firemen’s System’s development and continual monitoring of sound investment policies. The investment maturities, credit rating by investment, and foreign currency exposures by asset class schedules are presented to provide an illustration of the Firemen’s System’s current level of exposure to various risks.
The following schedule provides a summary of the investment maturities by investment type, which helps demonstrate the current level of interest rate risk assumed by the Firemen’s System as of September 30, 2011:
Investment maturities (in years)Fair No Less than More than
Value Maturity 1 1-5 6-10 10 Common stock $ 181,400 181,400 — — — — Collective investment - equity 45,235 45,235 — — — — Hedge fund - equity 20,409 20,409 — — — — Collective investment- bonds 72,888 — 250 37,604 22,796 12,238 Real estate investment trust 42,802 42,802 — — — — Money market funds 5,414 5,414 — — — —
$ 368,148 295,260 250 37,604 22,796 12,238
The Firemen’s System’s current level of exposure to credit risk, or the risk that an issuer or other counterparty to an investment will not fulfill its obligations, is demonstrated by the following table as of September 30, 2011:
Credit Common Collective Hedge Real Estate MoneyRating Level Stock Investment Fund Investment MarketAAA $ — 41,230 — — — AA — 9,550 — — — A — 7,967 — — — BBB — 10,619 — — — BB — 824 B — 178 N/A 181,400 — — — — Not Rated — 47,755 20,409 42,802 5,414
$ 181,400 118,123 20,409 42,802 5,414

City of St. Louis, Missouri Notes to Basic Financial Statements
June 30, 2012 (dollars in thousands)
53
Foreign currency risk is the risk that changes in exchange rates will adversely impact the fair value of an investment. The Firemen’s System’s policy is to allow the individual investment managers to decide what action to take regarding their respective portfolio’s foreign currency exposure. The following table demonstrates the Firemen’s System’s current level of foreign currency exposure as of September 30, 2011:
Real EstateMoney Fixed Hedge InvestmentMarket Equities Income Fund Trust Total
Australian Dollar $ — 2,026 — — — 2,026 British Pound Sterling — 7,079 — — — 7,079 Canadian Dollar — 2,559 — — — 2,559 Danish Krone — 832 — — — 832 Euro — 17,384 — — — 17,384 Hong Kong Dollar — 258 — — — 258 Japanese Yen — 7,022 — — — 7,022 Mexican Peso — 465 — — — 465 Norwegian Krone — 682 — — — 682 Singapore Dollar — 868 — — — 868 South Korean Won — 633 — — — 633 Swedish Krona — 1,469 — — — 1,469 Swiss Franc — 4,656 — — — 4,656
Total Foreign Currency — 45,933 — — — 45,933
U.S. Dollar 5,414 180,702 72,888 20,409 42,802 322,215
Total $ 5,414 226,635 72,888 20,409 42,802 368,148
Custodial credit risk is the risk that an issuer or other counterparty to an investment will not fulfill its obligations. The Firemen’s System’s minimum credit quality rating for each issue shall be “BBB” (or its equivalent) at the time of purchase. In the event of a split-rating, the higher rating shall apply. The fixed income portfolio should have an average quality rating of at least “A” (or its equivalent). Commercial paper issues must be rated at least “Al” (or its equivalent) at the time of purchase. In the event of a split-rating, the higher rating shall apply. In the event of a downgrade below investment grade by any rating agency, the investment manager is required to notify the Board and investment consultant as soon as possible and to refrain from any further investment in the downgraded issue.
Interest rate risk is the risk that changes in interest rates will adversely affect the fair value of an investment. Investments held for longer periods are subject to increased risk of adverse interest rate changes. The effective duration of any fixed income portfolio shall not exceed 120% of the effective duration of the investment manager’s broad market benchmark.

City of St. Louis, Missouri Notes to Basic Financial Statements
June 30, 2012 (dollars in thousands)
54
Concentration of credit risk is the risk of loss attributed to the magnitude of the Firemen’s System’s investment in a single issuer. The Firemen’s System’s policy does not allow the concentration per issuer to exceed 5% of the portfolio’s market value at cost, with the exception of cash, cash equivalents, U.S. Treasury, or U.S. Agency securities. Furthermore, the investment manager may not hold more than 5% of the outstanding shares of any single issuer with exception of U.S. Treasuries or Agencies. Investment in any single fund of hedge funds shall not exceed 10% of the fund’s market value. It is the Firemen’s System’s policy to invest in each asset class ranging between a minimum and maximum as shown below:
Asset Class as a Percent of Total Assets
Asset Class Minimum Target Mix Maximum
Domestic Equity:Large Cap 14% 19% 24%Small Cap — 9 19
Domestic Fixed Income 15 20 25International Equities 22 27 32Real estate trust 10 15 20Hedge fund 5 10 15
Liquidity risk is the risk that redemption notice periods are required and longer periods may be imposed before payment of redemption proceeds are settled for the following investments:
EnTrust Capital Diversified Fund QP, Ltd. (Hedge Fund)Select Investment Institutional Multi-Strategy Ltd. Series R 0409 Fund (Hedge Fund)The Principle U.S. Property Account (REIT)
Investments that exceed 5% or more of net assets held in trust for pension benefits for the Firemen’s System at September 30, 2011 are as follows:
Aberdeen Core Plus Fixed Income Portfolio $ 55,481 The Principal US Property Account 42,802 Artisan International Stock Fund 31,664
The Firemen’s System participates in securities lending programs in order to enhance investment yield. In a securities lending transaction, the Firemen’s System transfers possession—but not title—of the security to the borrower. Borrowers shall be rated AA, A, or higher by Moody’s or Standard & Poor’s. Collateral consisting of cash, letter of credit, U.S. government or agency securities, or floating rate notes of U.S. issuers is received and held by a financial institution. The collateral maintained is at least 102% of loan value for domestic securities and 105% of loan value for international securities of the market value of the securities lent. The Firemen’s System maintains all the rights in the collateral of a secured lender under the Uniform Commercial Code. The Firemen’s System continues to earn income on the loaned security. In addition, the Firemen’s System receives 60% of the net lending fees generated by each loan of securities. The
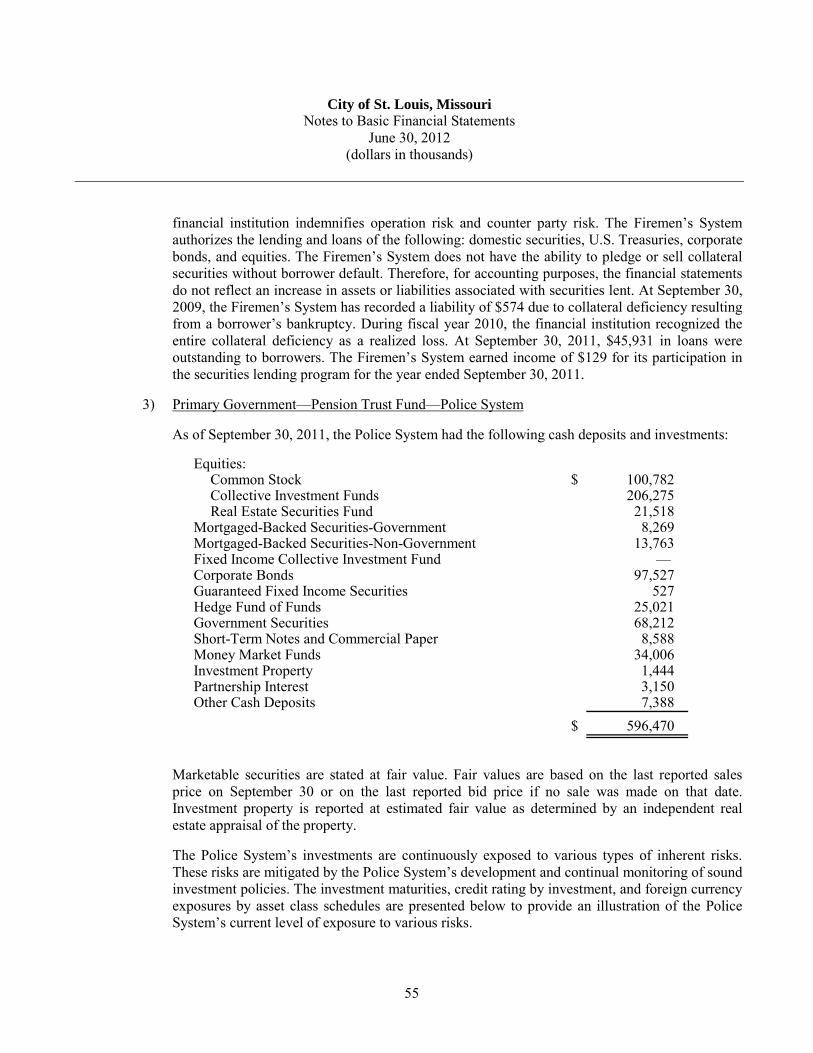
City of St. Louis, Missouri Notes to Basic Financial Statements
June 30, 2012 (dollars in thousands)
55
financial institution indemnifies operation risk and counter party risk. The Firemen’s System authorizes the lending and loans of the following: domestic securities, U.S. Treasuries, corporate bonds, and equities. The Firemen’s System does not have the ability to pledge or sell collateral securities without borrower default. Therefore, for accounting purposes, the financial statements do not reflect an increase in assets or liabilities associated with securities lent. At September 30, 2009, the Firemen’s System has recorded a liability of $574 due to collateral deficiency resulting from a borrower’s bankruptcy. During fiscal year 2010, the financial institution recognized the entire collateral deficiency as a realized loss. At September 30, 2011, $45,931 in loans were outstanding to borrowers. The Firemen’s System earned income of $129 for its participation in the securities lending program for the year ended September 30, 2011.
3) Primary Government—Pension Trust Fund—Police System
As of September 30, 2011, the Police System had the following cash deposits and investments:
Equities:Common Stock $ 100,782 Collective Investment Funds 206,275 Real Estate Securities Fund 21,518
Mortgaged-Backed Securities-Government 8,269 Mortgaged-Backed Securities-Non-Government 13,763 Fixed Income Collective Investment Fund — Corporate Bonds 97,527 Guaranteed Fixed Income Securities 527 Hedge Fund of Funds 25,021 Government Securities 68,212 Short-Term Notes and Commercial Paper 8,588 Money Market Funds 34,006 Investment Property 1,444 Partnership Interest 3,150 Other Cash Deposits 7,388
$ 596,470
Marketable securities are stated at fair value. Fair values are based on the last reported sales price on September 30 or on the last reported bid price if no sale was made on that date. Investment property is reported at estimated fair value as determined by an independent real estate appraisal of the property.
The Police System’s investments are continuously exposed to various types of inherent risks. These risks are mitigated by the Police System’s development and continual monitoring of sound investment policies. The investment maturities, credit rating by investment, and foreign currency exposures by asset class schedules are presented below to provide an illustration of the Police System’s current level of exposure to various risks.

City of St. Louis, Missouri Notes to Basic Financial Statements
June 30, 2012 (dollars in thousands)
56
The following schedule provides a summary of the investment maturities by investment type, which helps demonstrate the current level of interest rate risk assumed by the Police System as of September 30, 2011:
Investment maturities (in years)Fair No Less than More
Value Maturity 1 1 – 5 6 – 10 than 10
Equities $ 328,575 328,575 — — — — Mortgaged-Backed
Securities—Government 8,269 — — 86 1,290 6,893
Mortgaged-BackedSecurities—Nongovernment 13,763 — — 5,054 2,142 6,567
Corporate Bonds 97,527 — 58,632 25,093 13,802 — Guaranteed Fixed Income
Securities 527 — 527 — — — Hedge Fund of Funds 25,021 25,021 Government Securities 68,212 — 35,233 11,860 20,973 146 Short-Term Notes
and Commercial Paper 8,588 — 8,588 — — — Money Market
Funds 34,006 34,006 — — — — Partnership 3,150 3,150 Investment
Property 1,444 1,444 — — — —
$ 589,082 392,196 102,980 42,093 38,207 13,606
The Police System’s current level of exposure to credit risk, or the risk that an issuer or other counterparty to an investment will not fulfill its obligations, is demonstrated by the following table as of September 30, 2011:
Government Nongovernment Guaranteed Short-term Investment Credit Mortgage- Mortgage- Fixed Hedge Notes and Money Property Rating Backed Backed Corporate Income Government Fund of Commercial Market AndLevel Equities Securities Securities Bonds Securities Securities Funds Paper Fund Partnership
AAA $ — 8,269 7,379 — — 48,602 — 8,588 — — AA — — 146 3,656 527 17,973 — — — — A — — 367 28,548 — 440 — — — — BBB — — — 7,228 — — — — — — BB — — 414 308 — — — — — — B — — 347 — — — — — — — CCC — — 573 — — — — — — — N/A 328,575 — — — — — — — — 4,594 Not Rated — — 4,537 57,787 — 1,197 25,021 — 34,006 —
$ 328,575 8,269 13,763 97,527 527 68,212 25,021 8,588 34,006 4,594

City of St. Louis, Missouri Notes to Basic Financial Statements
June 30, 2012 (dollars in thousands)
57
Foreign currency risk is the risk that changes in exchange rates will adversely impact the fair value of an investment. The Police System’s policy is to allow the individual investment managers to decide what action to take regarding their respective portfolio’s foreign currency exposure. The following table demonstrates the Police System’s current level of foreign currency exposure as of September 30, 2011:
Money InvestmentMoney Market/ Property Hedge
Commercial And Fixed Fund ofPaper Partnership Equities Income Funds Total
Australian Dollar $ — — — 1,491 — 1,491 British Pound Sterling — — 2,302 822 — 3,124 Canadian Dollar — — 786 233 — 1,019 Chilean Peso — — 128 — — 128 Euro — — 526 1,754 — 2,280 Indian Rupee — — 393 — — 393 Israeli Shekel — — 961 — — 961 Swiss Franc — — 956 181 — 1,137
Total ForeignCurrency — — 6,052 4,481 — 10,533
U.S. Dollar 42,594 4,594 322,523 183,817 25,021 578,549
Total $ 42,594 4,594 328,575 188,298 25,021 589,082
Custodial credit risk is the risk that an issuer or other counterparty to an investment will not fulfill its obligations. The Fixed Income Portfolio must have an average rating of “A” or better in the aggregate as measured by at least one credit rating service. In cases where the yield spread adequately compensates for additional risk, securities rated lower than “A” may be purchased, provided overall fixed income quality is maintained. All issues will be of investment grade quality (BBB or Baa rated) or higher at the time of purchase. Up to 15% of the total market value of fixed income securities may be invested in BBB or Baa rated securities. In cases where credit rating agencies assign different quality ratings to a security, the lower rating will be used. Should the rating of a fixed income security fall below minimum investment grade, the investment manager may continue to hold the security if they believe the security will be upgraded in the future, there is low risk of default, and buyers will continue to be available throughout the anticipated holding period. The investment manager has the responsibility of notifying the Board of Trustees through their designee whenever an issue falls below investment grade.

City of St. Louis, Missouri Notes to Basic Financial Statements
June 30, 2012 (dollars in thousands)
58
Interest rate risk is the risk that changes in interest rates will adversely affect the fair value of an investment. Investments held for longer periods are subject to increased risk of adverse interest rate changes. The average effective duration of the aggregate portfolio, reflecting all instruments including Collateralized Mortgage Obligations and Asset-Backed Securities, must be maintained at plus or minus one year of the duration of the respective investment manager’s benchmark index.
Concentration of credit risk is the risk of loss attributed to the magnitude of the Police System’s investment in a single issuer. It is the Police System’s policy to invest in each asset class ranging between a minimum and maximum as shown below:
Asset Class as a Percent of Total Assets
Asset Class Minimum Target Mix Maximum
Fixed Income 25% 28% 31%Real Estate Equity 3 4 5Large Cap Domestic Equities 17 21 25Small Cap Domestic Equities 4 5 6Foreign Equities:
Non-U.S. Developing Markets 20 26 32Emerging Markets 4 7 10
Non-Directional Hedge Fundsof Funds 3 4 5
Private Equity — 4 8Other — 1 5
Liquidity risk is the risk that redemption notice periods are required and longer periods may be imposed before payment of redemption proceeds are settled for the following investments:
EnTrust Capital Diversified Fund QP, Ltd.GAM US Institutional Diversity, Inc.Falcon E&P Opportunities Fund, L.P.Bank of New York Mellon EB Global Real Estate Securities Funds
Investments which exceed 5% or more of net assets held in trust for pension benefits for the Police System are as follows:
Collective Funds:International Group Trust I 65,092 J.P. Morgan CB Emerging Market Equity
Focused Fund 36,460 TBC Index & Blue Chip 65,982 MFB Daily S&P 500 Equity Index Fund 38,741
MFO PIMCO Funds PAC Investment Management Service 34,644

City of St. Louis, Missouri Notes to Basic Financial Statements
June 30, 2012 (dollars in thousands)
59
The Police System participates in securities lending programs in order to enhance investment yield. In a securities lending transaction, the Police System transfers possession—but not title—of the security to the borrower. Collateral consisting of cash, letter of credit, or government securities is received and held by a financial institution. The broker/dealer collateralizes their borrowing (usually in cash) to 102% of the security value plus accrued interest, and this collateral is adjusted daily to maintain the 102% level. The Police System maintains all the rights in the collateral of a secured lender under the Uniform Commercial Code. The Police System continues to earn income on the loaned security. In addition, the Police System receives 60% of the net lending fees generated by each loan of securities. The financial institution receives the remaining 40% of the net lending fees as compensation for its services provided in the securities lending program. The financial institution indemnifies operational risk and counterparty risk. The Police System authorizes the lending of domestic securities, U.S. Treasuries, corporate bonds, and equities. The Police System does not have the ability to pledge or sell collateral securities without borrower default. Therefore, for accounting purposes, the financial statements do not reflect an increase in assets or liabilities associated with securities lent. At September 30, 2009, the Police System has recorded a liability of $1,330 due to collateral deficiency resulting from a borrower’s bankruptcy. During fiscal year 2010, the financial institution recognized the entire collateral deficiency as a realized loss. Outstanding loans to borrowers at September 30, 2011 were $60,939. The Police System earned income of $123 for its participation in the securities lending program for the year ended September 30, 2011.
4) Primary Government—Pension Trust Fund—Employees’ System
As of September 30, 2011, the Employees’ System had the following cash deposits and investments:
Common Stocks $ 178,214 Managed International Equity Funds 165,282 Bonds 91,117 Domestic Bond Funds 57,717 Real Estate Funds 59,981 Temporary Cash Investments 9,003 Managed Hedge Fund of Funds 21,804 Other Cash Deposits 167
$ 583,285
Investments are reported at fair market value. Securities traded on a national or international exchange funds are valued at the unit value quoted by the investee entity. Security transactions and any resulting realized gains or losses are accounted for on a completed transaction basis. Commingled funds are valued at the unit value quoted by the investee entity based on the underlying asset values. Real estate funds and other managed funds are valued based on valuations of underlying investments as reported by fund managers.

City of St. Louis, Missouri Notes to Basic Financial Statements
June 30, 2012 (dollars in thousands)
60
Foreign Currency Risk
The Employees’ System does not have a formal policy to limit foreign currency risk. Risk of loss arises from changes in currency exchange rates. The Employees’ System’s exposure to foreign currency risk is presented on the following table:
Short-Term Debt Total
Polish Zloty — 142 142 British Pound 23 1,587 1,610 Brazilian Real — 375 375 Canadian Dollar 13 894 907 Euros 65 8,281 8,346 Mexican Peso — 160 160 Japanese Yen 38 4,301 4,339 Swedish Krona — 781 781
Total $ 139 16,521 16,660
Credit Risk of Debt Securities
Credit risk is the risk that an issuer or other counter party to an investment will not fulfill its obligation to the Employees’ Retirement System. Below is a list of fixed income credit quality ratings:
Quality RatingAaa/U.S. Governments $ 98,625 Aa 13,035 A 24,074 Baa 11,822 Below Baa 4,328
Total $ 151,884
All temporary cash investments held by the Employees’ Retirement System at September 30, 2011 were unrated.
Interest Rate Risk
The Employees’ System does not have a formal policy to limit interest rate risk. Interest rate risk is the risk that changes in interest rates will adversely affect the fair values of an investment. Duration is a measure of debt instrument’s exposure to a change in interest rate and the related sensitivity of market price to parallel shifts in the yield curve. It uses the present value of cash flows, weighted for those cash flows as a percentage of the instrument’s full price.

City of St. Louis, Missouri Notes to Basic Financial Statements
June 30, 2012 (dollars in thousands)
61
Fair EffectiveInvestment Value Duration
Payden and Rygel $ 33,296 5.43 yearsAllegiant 60,872 5.92 yearsSSGA 30,653 4.90 yearsVanguard 27,064 5.45 years
$ 151,885
The Employees’ System participates in a securities lending program administered by a financial institution. Brokers who borrow the securities provide collateral, usually in the form of cash valued at 102% for domestic securities loaned, resulting in no credit risk for the system. During 2009, the Board of Trustees decided to reduce the amount of securities that can be loaned at one time. At September 30, 2011, the term to maturity of the securities on loan is matched with the term to maturity of the investment of the cash collateral. These loans can be terminated on demand by either the lender or borrower. The Employees’ System cannot pledge or sell non-cash collateral unless the borrower defaults. As of September 30, 2011, the Employees’ System has lending arrangements outstanding with a market value for securities lent of $11,216.

City of St. Louis, Missouri Notes to Basic Financial Statements
June 30, 2012 (dollars in thousands)
62
Concentration of Credit Risk
At September 30, 2011, the Employees’ System has the following concentrations, defined as investments (other than those issued or guaranteed by the U.S. Government) in any one organization, that represent five percent or more of total investments to the Employees’ System:
Acadian Asset ManagementEmerging Market Fund $ 38,879
CastleArk ManagementU.S. Large Cap Growth Equity $ 35,825
INTECH Investment ManagementU.S. Large Cap Core Equity $ 70,499
LSV Asset ManagementU.S. Large Cap Value Equity $ 33,642
Payden & Rygel Investment ManagementGlobal Hedged Fixed Income $ 33,296
PNC Capital AdvisorsU.S. Broad Market Core Fixed Income $ 60,872
Principal Global InvestorsReal Estate Group Annuity Contract $ 59,981
Silchester International AdvisorsInternational Value Equity Group Trust $ 65,707
State Street Global AdvisorsPassive Bond Market Index Fund $ 30,653
Walter Scott & PartnersInternational Growth Equity Group Trust $ 44,136
b. Component Unit—SLDC
State statutes and SLDC investment policies are the same as for the primary government. SLDC funds, in the form of cash on deposit or certificates of deposit, are required to be insured or collateralized by authorized investments held in SLDC’s name. At June 30, 2012, all of SLDC’s cash deposits were covered by federal depository insurance or collateral held by the pledging institution’s trust department or agent in SLDC’s name. At June 30, 2012, the market value of investments approximates the carrying value of $89.
c. Component Unit—SLPD
Investments are recorded at fair value, which is determined by closing market prices at year-end as reported by the investment custodian.
As of June 30, 2012, the SLPD had the following cash and cash equivalents:

City of St. Louis, Missouri Notes to Basic Financial Statements
June 30, 2012 (dollars in thousands)
63
Certificates of deposit 2,663$ Other cash deposits 4,288
6,951$
State statutes and SLPD investment policies are the same as for the primary government. SLPD funds in the form of cash on deposit or time certificates of deposit are required to be insured or collateralized by authorized investments held in the City’s name. Actual investment decisions are made by the director of budget and finance, the Board of Police Commissioners, and SLPD’s fiscal agents.
Interest Rate Risk
The SLPD seeks to minimize its exposure to fair value losses arising from changes in interest rates by selecting investments in adherence to the Board of Police Commissioner’s (Investment Policy). The Investment Policy provides that, to the extent possible, the SLPD shall attempt to match its investments with anticipated cash flow requirements. Unless matched to a specific cash flow, the SLPD will not directly invest in securities or make a time deposit with a stated maturity or more than five years from the date of purchase. The average maturity for collateral provided to the SLPD for deposits in connection with a repurchase agreement shall not exceed five years without the written approval of the Treasurer. In connection with any outstanding bond issue, debt service reserve funds may be invested to a maximum maturity of 15 years, and up to 30 years with the approval of the Treasurer.
The SLPD’s investments in Certificates of Deposit all have a maturity date of less than one year as of as of June 30, 2012.
Credit Risk
The Investment Policy provides that investments of the SLPD be rated in one of the three highest ratings categories by Moody’s Investors Service, Standard & Poor’s Corporation, or Fitch’s Ratings Service.
The SLPD’s sole investments were in Certificates of Deposit which are not rated as of June 30, 2012.
Custodial Credit Risk
Custodial credit risk is the risk that, in the event of the failure of counterparty, the SLPD will not be able to recover the value of the investments or collateral securities that are in the possession of the counterparty.
The Investment Policy requires that all cash deposits, time certificates of deposit, deposits with listed institutions, and repurchase agreements be covered by adequate pledged collateral. Acceptable collateral includes United States Treasury obligations, other interest-bearing securities guaranteed as to principal and interest by the United States or an agency or instrumentality of the United States,

City of St. Louis, Missouri Notes to Basic Financial Statements
June 30, 2012 (dollars in thousands)
64
bonds of the State, or bonds of the City. The market value of the principal and accrued interest of the collateral must equal 103% of the deposits secured, less any amount subject to federal deposit insurance. All SLPD securities and securities pledged as collateral must be held in a segregated account on behalf of the SLPD by an independent third-party with whom the SLPD has a current custodial agreement and has been designated by the Board of Police Commissioners to serve in such capacity.
At June 30, 2012, all department investments and all collateral securities pledged against SLPD deposits are held by the counterparty’s trust department or agent in the SLPD’s name.
Concentration of Credit Risk
The SLPD has no investment policy related to the concentration of credit risk but utilizes the policy established by the City of St. Louis. At June 30, 2012, 100% of the SLPD’s investments (excluding other cash deposits) were in Certificates of Deposit.
d. Component Unit—SWMDC
At June 30, 2012, all of SWMDC’s cash deposits were covered by federal depository insurance or collateral held by the pledging institution’s trust department or agent in the City’s name. SWMDC’s investments of $500 at year-end consisted entirely of Federal Home Loan Mortgage Corporation Notes with less than one year to maturity and rated A-1+ by Standard & Poor’s Corporation.
3. RECEIVABLES, NET
Intergovern- Charges for Notes and Insurance TotalTaxes mental Services Loans Recovery Other Receivables
Governmental activities:General fund $ 89,673 3,420 4,815 — — 2,863 100,771 Cap ital projects fund 3,020 7,636 41 — — 4 10,701 Grants fund — 14,578 — — — — 14,578 Other governmental funds 42,686 726 1,404 46 — 220 45,082 Internal service funds — 543 — — — — 543
Total governmental activities $ 135,379 26,903 6,260 46 — 3,087 171,675
Business-type activities:Airport $ — 5,442 2,972 — 3,000 3,664 15,078 Water Division — — 10,044 — — — 10,044 Parking Division — — 120 — — — 120
Total business-type activit ies $ — 5,442 13,136 — 3,000 3,664 25,242
All amounts are scheduled for collection during the subsequent fiscal year.

City of St. Louis, Missouri Notes to Basic Financial Statements
June 30, 2012 (dollars in thousands)
65
4. ALLOWANCE FOR UNCOLLECTIBLE ACCOUNTS
The allowance for uncollectible accounts, which has been deducted from the related receivable in the government-wide statement of net assets and fund financial statements, consists of the following balances:
Governmental activities:Taxes receivable—general fund $ 1,173 Taxes receivable—other governmental funds 128 License and permits receivable—general fund 25 Charges for services receivable—general fund 128 Charges for services receivable—other governmental funds 333
Business-type activities:Charges for services receivable—Airport 94 Charges for services receivable—Water Division 2,700
$ 4,581
5. COMPONENT UNIT—SLDC RECEIVABLES
SLDC receivables consist principally of small business commercial loans to facilitate business growth. The commercial loans were financed utilizing funds provided by the Community Development Agency (CDA) of the City, the Economic Development Administration, Environmental Protection Agency, and the State. The proceeds from any repayment of these loans are payable back to the funding source or re-loaned in accordance with the lending program. Thus, a corresponding liability has been recorded.
6. RESTRICTED ASSETS
a. Airport
Cash and investments, restricted in accordance with bond provisions, are as follows at June 30, 2012:
Airport bond fund:Debt service account $ 52,125 Debt service reserve account 48,303
Airport renewal and replacement fund 3,500 Passenger facility charge fund 20,697 Airport debt service stabilization fund 38,211 Airport construction fund 63,946 Drug enforcement agency funds 2,339
$ 229,121

City of St. Louis, Missouri Notes to Basic Financial Statements
June 30, 2012 (dollars in thousands)
66
Bond provisions require that revenues derived from the operation of the Airport be deposited into the unrestricted Airport Revenue Fund. From this fund, the following allocations are made (as soon as practicable in each month after the deposit of revenues, but no later than five business days before the end of each month) in the following order of priority, and as applicable:
1) Unrestricted Airport Operation and Maintenance Fund: an amount sufficient to pay the estimated operation and maintenance expenses during the next month.
2) Airport Bond Fund: for credit to the Debt Service Account, if and to the extent required, so that the balance in said account shall equal the accrued aggregate debt service on the bonds, to the last day of the then current calendar month. This account shall be used only for payment of bond principal and interest as the same shall become due.
3) Airport Bond Fund: for credit to the Debt Service Reserve Account: an amount sufficient to maintain a balance in such account equal to the debt service reserve requirement (an amount equal to the greatest amount of principal and interest due in any future fiscal year). This account shall be available for deficiencies in the Debt Service Account on the last business day of any month, and the balance shall be transferred to the Debt Service Account whenever the balance in the Debt Service Account (before the transfer) is not sufficient to fully pay all outstanding bonds.
4) Arbitrage Rebate Fund: an amount necessary to fund the Arbitrage Rebate in order to pay the Rebate Amount when due and payable.
5) Subordinated Indebtedness: an amount sufficient to pay Subordinated Indebtedness in accordance with the authorizing and implementing documents for such Subordinated Indebtedness.
6) Airport Renewal and Replacement Fund: an amount equal to $57, provided that no deposit shall be required to be made into said fund whenever and as long as uncommitted moneys in said fund are equal to or greater than $3,500 or such larger amount as the City shall determine is necessary for purposes of said fund; and provided further that, if any such monthly allocation to said fund shall be less than the required amounts, the amount of the next succeeding monthly payments shall be increased by the amount of such deficiency. This fund shall be used for paying costs of renewal or replacement of capital items used in connection with the operation of the Airport.
7) A sub-account in the Airport Revenue Fund: an amount determined from time-to-time by the City, such that if deposits were made in amounts equal to such amount in each succeeding month during each Airport fiscal year, the balance in such sub-account shall equal the amounts payable to the City with respect to such Airport fiscal year for the payment of 5% of gross receipts from operations of the Airport. A maximum of 80% of the monthly transfer to this sub-account may be paid to the City during the Airport’s fiscal year. The final installment may only be paid to the City upon delivery of the Airport’s audited financial statements to the Airport Bond Fund Trustee.
8) Airport Debt Service Stabilization Fund and the Airport Development Fund: various amounts for Airport fiscal years 2006 through 2012, achieved a balance of $38,211 at the end of fiscal year 2012.
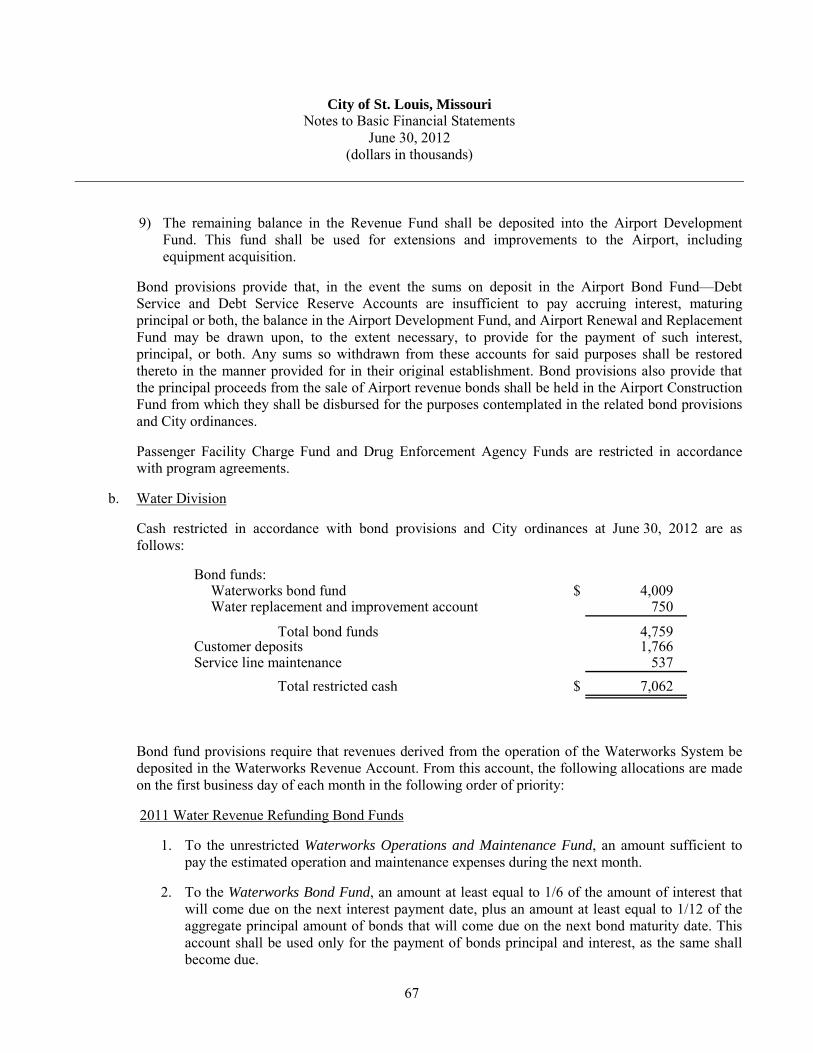
City of St. Louis, Missouri Notes to Basic Financial Statements
June 30, 2012 (dollars in thousands)
67
9) The remaining balance in the Revenue Fund shall be deposited into the Airport Development Fund. This fund shall be used for extensions and improvements to the Airport, including equipment acquisition.
Bond provisions provide that, in the event the sums on deposit in the Airport Bond Fund—Debt Service and Debt Service Reserve Accounts are insufficient to pay accruing interest, maturing principal or both, the balance in the Airport Development Fund, and Airport Renewal and Replacement Fund may be drawn upon, to the extent necessary, to provide for the payment of such interest, principal, or both. Any sums so withdrawn from these accounts for said purposes shall be restored thereto in the manner provided for in their original establishment. Bond provisions also provide that the principal proceeds from the sale of Airport revenue bonds shall be held in the Airport Construction Fund from which they shall be disbursed for the purposes contemplated in the related bond provisions and City ordinances.
Passenger Facility Charge Fund and Drug Enforcement Agency Funds are restricted in accordance with program agreements.
b. Water Division
Cash restricted in accordance with bond provisions and City ordinances at June 30, 2012 are as follows:
Bond funds:Waterworks bond fund $ 4,009 Water replacement and improvement account 750
Total bond funds 4,759 Customer deposits 1,766 Service line maintenance 537
Total restricted cash $ 7,062
Bond fund provisions require that revenues derived from the operation of the Waterworks System be deposited in the Waterworks Revenue Account. From this account, the following allocations are made on the first business day of each month in the following order of priority:
2011 Water Revenue Refunding Bond Funds
1. To the unrestricted Waterworks Operations and Maintenance Fund, an amount sufficient to pay the estimated operation and maintenance expenses during the next month.
2. To the Waterworks Bond Fund, an amount at least equal to 1/6 of the amount of interest that will come due on the next interest payment date, plus an amount at least equal to 1/12 of the aggregate principal amount of bonds that will come due on the next bond maturity date. This account shall be used only for the payment of bonds principal and interest, as the same shall become due.

City of St. Louis, Missouri Notes to Basic Financial Statements
June 30, 2012 (dollars in thousands)
68
3. To the Water Revenue Debt Service Reserve Account, a sum equal to the Debt Service Reserve Fund Requirement or a debt service reserve fund policy or a surety bond shall be provided by a Bond Insurer in such amount or a letter of credit shall be provided by a bank acceptable to the City in such amount. All amounts paid and credited to this account shall be used solely to prevent any default in the payment of the principal of and interest on the Bonds.
4. To the Water Replacement and Improvement Fund, an amount equal to $25 per month until the account balance aggregates $750. This account shall be used for making replacements, extensions, and improvements to the Waterworks System, and for the purpose of meeting unforeseen contingencies and emergencies arising in the operation of the Waterworks System of the City.
5. The remaining balance in the Waterworks Revenue Fund is to be deposited into the unrestricted Water Contingent Fund. This account shall be used for paying the cost of the operation, maintenance, and repair of the Waterworks System; paying the cost of extending, improving, or making replacements to the Waterworks System; preventing default in, anticipating payments into, or increasing the amounts in the other accounts; paying any gross receipts tax now or hereafter levied by the City; paying the principal or the interest on any subordinate or junior lien bonds; paying any redemption premium due on the bonds; or any other lawful purpose for use by the Waterworks System.
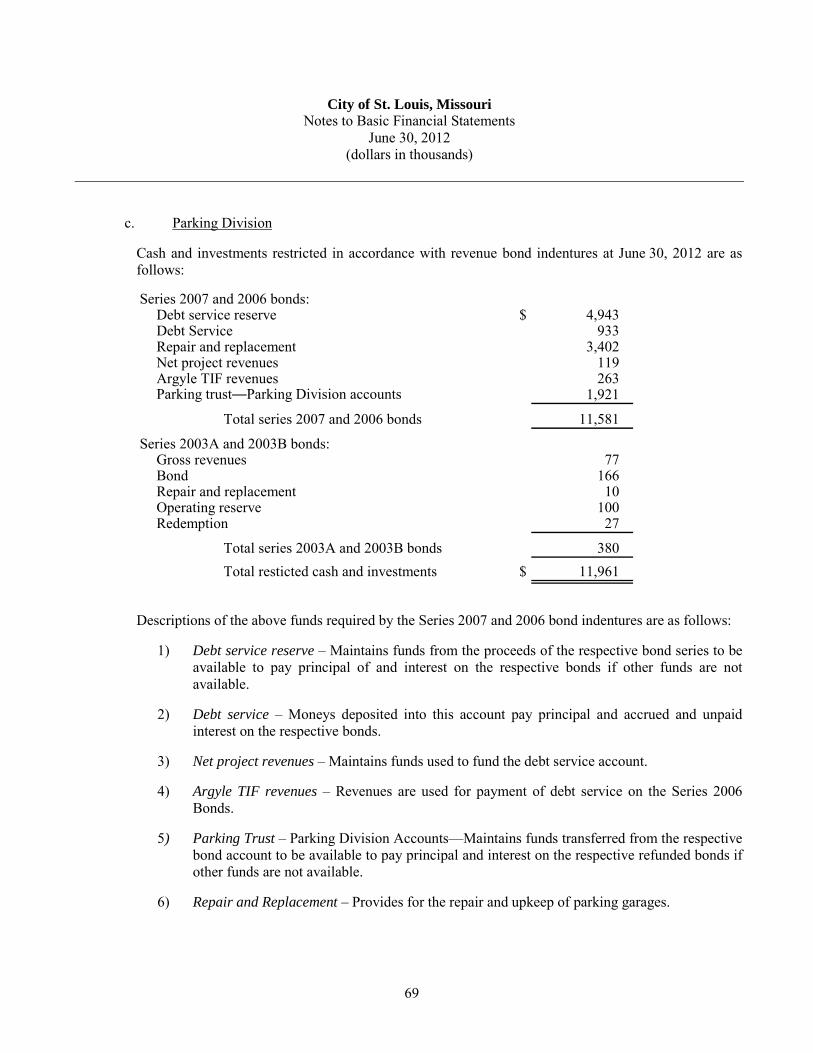
City of St. Louis, Missouri Notes to Basic Financial Statements
June 30, 2012 (dollars in thousands)
69
c. Parking Division
Cash and investments restricted in accordance with revenue bond indentures at June 30, 2012 are as follows:
Series 2007 and 2006 bonds:Debt service reserve $ 4,943 Debt Service 933 Repair and replacement 3,402 Net project revenues 119 Argyle TIF revenues 263 Parking trust—Parking Division accounts 1,921
Total series 2007 and 2006 bonds 11,581
Series 2003A and 2003B bonds:Gross revenues 77 Bond 166 Repair and replacement 10 Operating reserve 100 Redemption 27
Total series 2003A and 2003B bonds 380 Total resticted cash and investments $ 11,961
Descriptions of the above funds required by the Series 2007 and 2006 bond indentures are as follows:
1) Debt service reserve – Maintains funds from the proceeds of the respective bond series to be available to pay principal of and interest on the respective bonds if other funds are not available.
2) Debt service – Moneys deposited into this account pay principal and accrued and unpaid interest on the respective bonds.
3) Net project revenues – Maintains funds used to fund the debt service account.
4) Argyle TIF revenues – Revenues are used for payment of debt service on the Series 2006 Bonds.
5) Parking Trust – Parking Division Accounts—Maintains funds transferred from the respective bond account to be available to pay principal and interest on the respective refunded bonds if other funds are not available.
6) Repair and Replacement – Provides for the repair and upkeep of parking garages.

City of St. Louis, Missouri Notes to Basic Financial Statements
June 30, 2012 (dollars in thousands)
70
Descriptions of the funds required by the Series 2003A and 2003B bond indenture are as follows:
1) Gross Revenues – Maintains revenues resulting from the operations of the Cupples Garage and uses these to pay the operating and debt service costs associated with the Cupples Garage.
2) Bonds – Moneys deposited into this account pay principal and accrued and unpaid interest on the Series 2003A and 2003B Bonds.
3) Repair and Replacement – Provides for the repair and upkeep of the Cupples Garage.
4) Operating Reserve – Maintains operating reserve as required by the Bond indenture.
5) Redemption – Maintains funds set aside for the future redemption of the Series 2003A and 2003 Bonds.
d. Component Unit—SLDC
Restricted cash and investments at June 30, 2012 are as follows:
Bond funds $ 2,012
Cash and investments are restricted in accordance with the SLDC Parking Facilities Revenue Refunding Bonds, Series 1999, Bond Indenture. The revenue bond indenture requires that gross operating revenues be paid to the bond trustee for deposit in the parking facility fund. From this fund, the revenues are to be applied by the trustee to various reserve accounts including principal and interest, repair and replacement, and operating reserve up to specified limits. Amounts received above the required limits are remitted by the Trustee to SLDC.
e. Component Unit—SLPD
Restricted cash at June 30, 2012 consists of cash and legally restricted by outside parties through the provisions of grant programs or contractual agreements.

City of St. Louis, Missouri Notes to Basic Financial Statements
June 30, 2012 (dollars in thousands)
71
7. CAPITAL ASSETS
a. Primary Government
The following is a summary of changes in capital assets—governmental activities for the year ended June 30, 2012:
Balance BalanceJune 30, June 30,
2011 Additions Retirements Transfers 2012
Governmental activities:Capital assets not being depreciated:
Land $ 78,829 73 (816) — 78,086 Construction in progress 69,237 57,420 — (98,873) 27,784 Equipment in progress 11,670 1,925 — — 13,595 Intangibles 514 5 — — 519 Works of art 3,351 — — 116 3,467
Total capital assets not being depreciated 163,601 59,423 (816) (98,757) 123,451
Capital assets being depreciated:Buildings 504,847 16,806 — 48,039 569,692 Improvements other than buildings 83,455 1,661 — 277 85,393 Equipment 111,535 4,780 (4,134) — 112,181 Infrastructure 551,544 7,567 — 50,441 609,552 Intangibles — 275 — — 275
Total capital assets being depreciated 1,251,381 31,089 (4,134) 98,757 1,377,093
Less accumulated depreciation for:Buildings 165,689 13,629 — — 179,318 Improvements other than buildings 27,125 1,824 — — 28,949 Equipment 66,197 7,552 (3,463) — 70,286 Infrastructure 330,227 26,863 — — 357,090 Intangibles — 55 — — 55
Total accumulated depreciation 589,238 49,923 (3,463) — 635,698
Total capital assets being depreciated, net 662,143 (18,834) (671) 98,757 741,395 Governmental activities capital assets, net $ 825,744 40,589 (1,487) — 864,846
Construction in progress consists primarily of convention center renovations and street and bridge projects. Equipment in progress consists of communication equipment being prepared for its intended use.

City of St. Louis, Missouri Notes to Basic Financial Statements
June 30, 2012 (dollars in thousands)
72
The following is a summary of changes in capital assets – business-type activities for the year ended June 30, 2012. Business-type activities for the City include the Airport, Water Division, and Parking Division.
Balance BalanceJune 30, June 30,
2011 Additions Retirements Transfers 2012
Business-type activities:Combined:Capital assets not being depreciated:
Land $ 773,681 966 — — 774,647 Construction-in-progress 28,094 62,635 (3,911) (22,445) 64,373 Intangibles 3,506 — — — 3,506
Total capital assets not being depreciated 805,281 63,601 (3,911) (22,445) 842,526
Capital assets being depreciated:Buildings and structures 615,884 313 — 18,999 635,196 Equipment 90,996 2,669 (1,271) 1,058 93,452 Pavings 973,382 173 — 1,806 975,361 Parking meters and lot equipment 6,532 839 — — 7,371 Reservoirs 34,513 — — — 34,513 Boiler plant equipment 661 — — — 661 Pumping equipment 10,382 — — 468 10,850 Purification basins and equipment 42,761 — — 114 42,875 Water mains, lines, and accessories 122,165 2,117 (299) — 123,983 Motor vehicle equipment 8,540 233 (393) — 8,380
Total capital assets being depreciated 1,905,816 6,344 (1,963) 22,445 1,932,642
Less accumulated depreciation for:Buildings and structures 349,448 17,222 — — 366,670 Equipment 61,971 4,257 (1,142) — 65,086 Pavings 344,561 29,850 — — 374,411 Parking meters and lot equipment 5,628 475 — — 6,103 Reservoirs 9,969 665 — — 10,634 Boiler plant equipment 635 3 — — 638 Pumping equipment 8,532 197 — — 8,729 Purification basins and equipment 14,853 839 — — 15,692 Water mains, lines, and accessories 55,093 1,554 (152) — 56,495 Motor vehicle equipment 6,499 343 (368) — 6,474
Total accumulated depreciation 857,189 55,405 (1,662) — 910,932
Total capital assets being depreciated, net 1,048,627 (49,061) (301) 22,445 1,021,710 Business-type activities capital assets, net $ 1,853,908 14,540 (4,212) — 1,864,236
Construction-in-progress consists primarily of various improvements at the Airport to the airfield and terminal buildings, as well as property purchased on which the Airport’s expansion facilities will be constructed, and various improvements to the waterworks system.

City of St. Louis, Missouri Notes to Basic Financial Statements
June 30, 2012 (dollars in thousands)
73
Within the statement of activities, depreciation expense is charged to functions of the primary government as follows:
Governmental activities:General government $ 6,318 Convention and tourism 4,829 Parks and recreation 4,824 Judicial 218 Streets 29,866 Public safety:
Fire 2,252 Other 741
Health and welfare 352 Public service 523
Total depreciation expense, governmental activities $ 49,923
Business-type activities:Airport $ 47,815 Water Division 5,002 Parking Division 2,588
Total depreciation expense, business-type activities $ 55,405

City of St. Louis, Missouri Notes to Basic Financial Statements
June 30, 2012 (dollars in thousands)
74
b. Component Unit—SLDC
The following is a summary of changes in SLDC capital assets for the year ended June 30, 2012:
Balance BalanceJune 30, June 30,
2011 Additions Retirements 2012Capital assets not being depreciated:
Land $ 4,914 — — 4,914 Construction in Progress 2,103 9,332 — 11,435
Total capital assets not being depreciated 7,017 9,332 — 16,349 Capital assets being depreciated:
Leasehold improvements 3,037 — (37) 3,000 Equipment 664 49 — 713 Parking facilities 18,990 — — 18,990
Total capital assets being depreciated 22,691 49 (37) 22,703 Less accumulated depreciation for:
Leasehold improvements 2,100 200 — 2,300 Equipment 663 — — 663 Parking facilities 12,280 609 — 12,889
Total accumulated depreciation 15,043 809 — 15,852 Total capital assets being depreciated, net 7,648 (760) (37) 6,851
SLDC capital assets, net $ 14,665 8,572 (37) 23,200

City of St. Louis, Missouri Notes to Basic Financial Statements
June 30, 2012 (dollars in thousands)
75
c. Component Unit—SLPD
The following represents a summary in SLPD’s capital assets for the year ended June 30, 2012:
Balance BalanceJune 30, June 30,
2011 Additions Retirements Transfers 2012Capital assets not being depreciated:
Land $ 2,074 — — — 2,074 Construction in progress 2,826 624 — (11) 3,439 Software in progress 31 298 — — 329
Total capital assets not being depreciated 4,931 922 — (11) 5,842 Capital assets being depreciated:
Buildings and improvements 41,383 146 — 11 41,540 Furniture, fixtures, and other equipment 6,049 570 (35) — 6,584 Automotive equipment 12,545 1,917 (757) — 13,705 Communications equipment 6,083 6 — — 6,089 Computers and software 4,439 603 — — 5,042 Internally generated computer software 342 28 — — 370
Total capital assets being depreciated 70,841 3,270 (792) 11 73,330 Less accumulated depreciation for:
Buildings and improvements (20,181) (861) — — (21,042) Furniture, fixtures, and other equipment (4,841) (541) 35 — (5,347) Automotive equipment (10,354) (1,456) 699 — (11,111) Communications equipment (4,489) (337) — — (4,826) Computers and software (3,880) (417) — — (4,297) Internally generated computer software (62) (78) — — (140)
Total accumulated depreciation (43,807) (3,690) 734 — (46,763) Total capital assets being depreciated, net 27,034 (420) (58) 11 26,567
SLPD capital assets, net $ 31,965 502 (58) — 32,409

City of St. Louis, Missouri Notes to Basic Financial Statements
June 30, 2012 (dollars in thousands)
76
d. Component Unit—SWMDC
The following represents a summary in SWMDC’s capital assets for the year ended June 30, 2012:
Balance BalanceJune 30, June 30,
2011 Additions Retirements 2012
Capital assets being depreciated:Infrastructure $ 10,204 700 — 10,904
Total capital assets being depreciated 10,204 700 — 10,904
Less accumulated depreciation for:Infrastructure 4,127 349 — 4,476
Total accumulated depreciation 4,127 349 — 4,476 SWMDC capital assets, net $ 6,077 351 — 6,428
8. COMPONENT UNIT—SLDC PROPERTY HELD FOR DEVELOPMENT
SLDC property held for development consists primarily of land and property held for sale or other development purposes. This land and property is reported in SLDC’s financial statements based on management’s intent of ultimate disposition of the property. Proceeds received upon the sale of most of these properties will revert back to the funding source. At June 30, 2012, SLDC has established a reserve for impairment of $8,580 on its properties held for development.
9. ACCOUNTS PAYABLE AND ACCRUED LIABILITIES
Contracts andretainage
Vendors payable Total
Governmental activities:General fund $ 3,270 — 3,270 Capital projects fund 5,625 2,699 8,324 Grants fund 7,784 — 7,784 Other governmental funds 1,316 10 1,326 Internal service 404 — 404
Total governmental activities $ 18,399 2,709 21,108 Business-type activities:
Airport $ 9,883 20,691 30,574 Water Division 1,053 — 1,053 Parking Division 380 — 380
Total business-type activities $ 11,316 20,691 32,007

City of St. Louis, Missouri Notes to Basic Financial Statements
June 30, 2012 (dollars in thousands)
77
10. RETIREMENT PLANS
The City contributes to three defined benefit retirement plans. The Firemen’s Retirement System of St. Louis (Firemen’s System) and the Police Retirement System of St. Louis (Police System) are single –employer plans. The Employees’ Retirement System of the City of St. Louis (Employees’ System) is a cost-sharing multiple-employer plan. However, due to the City’s participation in the Employees’ System being approximately 90% of the total participation of all employers, the disclosures provided for the Employees’ System are those for a single-employer plan. Each system is administered by a separate board of trustees, who are partially appointed by City officials, plan participants, and the governor of the State (Police System only). For financial reporting purposes, these retirement systems are included as fiduciary pension trust funds of the City. Financial information taken directly from the financial statements, that were audited by other auditors and whose reports have been furnished to us, for these funds has been included within the accompanying basic financial statements as of each System’s fiscal year-end, which falls within the City’s current fiscal year-end as follows:
System System Fiscal Year-endFiremen’s September 30, 2011Police September 30, 2011Employees’ September 30, 2011
a. Firemen’s Retirement System of St. Louis
1) System Description
All firefighters qualify as members of the Firemen’s System and are thereby eligible to participate from their date of hire.
The Firemen’s System issues a publicly available financial report that includes financial statements and supplementary information. That information may be obtained by writing to the Firemen’s Retirement System of St. Louis, 1601 South Broadway, St. Louis, Missouri, 63104.
The Firemen’s System provides retirement benefits as well as death and disability benefits. Members can voluntarily retire after a minimum of 20 years of service. The monthly allowance consists of 40% of the final two-year average monthly compensation at 20 years of service, plus 2% of such final average compensation for each of the next five years of service, plus 5% of final average compensation for each additional year of service over 25 years with a maximum pension of 75%. Unused accrued sick pay may increase the maximum pension beyond the 75% limitation. Such benefits are authorized by State statutes and adopted by City ordinance.
The Firemen’s System, in accordance with Ordinance 62994 of the City, initiated during the Firemen’s System’s fiscal year ended August 31, 1994, the Deferred Retirement Option Plan (DROP). The DROP option is available to members of the Firemen’s System who have achieved at least 20 years of creditable service and have achieved eligibility for retirement. Those members who elect to participate will continue active employment, will have a service retirement allowance credited monthly into the DROP account of the member, and the member’s contribution will be reduced to 1% from the normal 8%. During participation in the DROP, the

City of St. Louis, Missouri Notes to Basic Financial Statements
June 30, 2012 (dollars in thousands)
78
member will not receive credit for City contributions or credit for service. A member may participate in the DROP only once for any period up to five years. At retirement, the funds in the member’s DROP account plus interest and accrued sick leave, if elected, is available to the member in a lump sum or in installments.
2) Funding Policy
Covered members contribute 8% of their salary to the Firemen’s System, as mandated per the State statute and adopted by City ordinance. The City is required to contribute the remaining amounts necessary to fund the Firemen’s System. Members of the Firemen’s System are entitled to a lump-sum distribution of the entire amount of their contribution without interest upon service retirement. Members whose employment terminates prior to retirement are entitled to a lump-sum distribution of their contribution, plus interest thereon.
3) Funded Status
The funded status of the Firemen’s System as of October 1, 2011, the most recent actuarial valuation date is a follows:
Actuarial UAAL As AActuarial Accrued Unfunded Annual Percentage
Value Liability AAL Funded Covered of Coveredof Assets (AAL) (UAAL) Ratio Payroll Payroll
$ 404,101 $ 430,755 $ 26,654 93.8% $ 37,157 71.7%
Date
October 1, 2011
ActuarialValuation
The schedule of funding progress, presented as required supplementary information following the notes to the basic financial statements, presents multiyear trend information about whether the actuarial value of plan assets is increasing or decreasing over time relative to the actuarial accrued liability for benefits.
4) Annual Pension Cost and Net Pension Asset
The City’s annual pension cost and net pension asset to the Firemen’s System for the year ended June 30, 2012 are as follows:
Annual required contribution $ (19,159) Interest on net pension asset 2,861 Adjustment to annual required contribution (3,216)
Annual pension cost (19,514) Contributions made 23,072
Increase in net pension asset 3,558 Net pension asset, beginning of year 37,521 Net pension asset, end of year $ 41,079

City of St. Louis, Missouri Notes to Basic Financial Statements
June 30, 2012 (dollars in thousands)
79
The net pension asset of $41,079 as of June 30, 2012 is reflected as a net pension asset within governmental activities in the government-wide financial statements.
Historical trend information about the City’s participation in the Firemen’s System is presented below to help readers assess the Firemen’s System’s funding status on a going-concern basis and assess progress being made in accumulating assets to pay benefits when due.
Annual NetFiscal Pension PensionYear Cost (APC) Asset
2012 $ 19,514 118% $ 41,079 2011 13,927 128 37,521 2010 8,949 136 33,593
Percentageof APC
Contributed
Significant actuarial assumptions used in the valuation of the Firemen’s System are as follows:
Date of actuarial valuation October 1, 2011Actuarial cost method Entry age-frozen liability methodAmortization method 30 year closed period from
establishmentRemaining amortization period VariousAsset valuation method 3-year smoothed marketInflation rate 3.0%, per yearInvestment rate of return 7.625%, compounded annuallyProjected salary increases 3.35%, per year to retirement ageProjected postretirement benefit increases:
Under age 60:20-24 service years 1.5%, per year25-29 service years 2.25%, per year30 or more service years 3.0%, per yearOver age 60 3% with a maximum of 25%
in increases after age 60
b. Police Retirement System of St. Louis
1) System Description
All persons who become police officers and all police officers that enter or reenter SLPD after October 1, 1957 become members of the Police System and are thereby eligible to participate from their date of hire. The Police System issues a publicly available financial report that includes financial statements and supplementary information. That information may be obtained by writing to the Police Retirement System of St. Louis; 2020 Market Street, St. Louis, Missouri 63103.
The Police System provides retirement benefits as well as death and disability benefits. Members can voluntarily retire after a minimum of 20 years of service or attaining age 55. The monthly

City of St. Louis, Missouri Notes to Basic Financial Statements
June 30, 2012 (dollars in thousands)
80
allowance consists of 40% of the two-year average final compensation for the first 20 years of services, plus 2% of such final average compensation for each of the next five years of service, plus 4% of average final compensation for each additional year of service after 25 years up to a maximum of 30 years. The monthly allowance of members who have in excess of 30 years of service is increased by 5%. The maximum pension is 75% of average final compensation. Such benefits are established by the State statute.
The Police System implemented a DROP feature during the Police System’s fiscal year ended September 30, 1996. The DROP option is available to members of the Police System who have at least 20 years of creditable service and have achieved eligibility for retirement. Those members who elect to participate will continue active employment, will have a service retirement allowance credited monthly in the DROP account, and will no longer make contributions to the Police System. During participation in the DROP, the member will not receive credit for service and the member shall not share in any benefit improvement that is enacted or becomes effective while such member is participating in the DROP. A member may participate in the DROP only once for any period up to five years, at which point the member may reenter the Police System. At retirement, the funds in the member’s DROP account plus interest are available to the member in a lump sum or in installments.
2) Funding Policy
Police officers are required to contribute 7% of their compensation to the Police System per State statute. The City is required to contribute the remaining amounts necessary to fund the Police System, determined in accordance with City ordinances. Upon leaving employment due to service retirement, death, or disability due to an accident in the actual performance of duty, the member’s contributions are refunded. Members whose employment terminates prior to retirement are entitled to a lump-sum distribution of their contribution plus interest thereon.
3) Funding Status
The funded status of the Police System as of October 1, 2011, the most recent actuarial valuation date is a follows:
Actuarial UAAL As AActuarial Accrued Unfunded Annual Percentage
Value Liability AAL Funded Covered of Coveredof Assets (AAL) (UAAL) Ratio Payroll Payroll
$ 695,422 $ 855,618 $ 160,196 81.3% $ 67,594 237.0%
Date
October 1, 2011
ActuarialValuation

City of St. Louis, Missouri Notes to Basic Financial Statements
June 30, 2012 (dollars in thousands)
81
The aggregate actuarial cost method is used to determine the annual required contribution of the employer (ARC) for the Police System. Because the method does not identify or separately amortize unfunded actuarial liabilities, information about funded status is prepared using the entry age actuarial cost method and is intended to serve as a surrogate for the funded status of the plan.
The schedule of funding progress, presented as required supplementary information following the notes to the basic financial statements, presents multiyear trend information about whether the actuarial value of plan assets is increasing or decreasing over time relative to the actuarial accrued liability for benefits.
4) Annual Pension Cost and Net Pension Asset
The City’s annual pension cost and net pension asset to the Police System for the year ended June 30, 2012 are as follows:
Annual required contribution $ (20,037) Interest on net pension asset 210 Adjustment to annual required contribution (345)
Annual pension cost (20,172) Contributions made 20,037
Decrease in net pension asset (135) Net pension asset, beginning of year 2,713 Net pension asset, end of year $ 2,578
The net pension asset of $2,578 is reflected as a net pension asset within governmental activities in the government-wide financial statements.
Historical trend information about the City’s participation in the Police System is presented below.
Annual PercentagePension of APC Net
Cost (APC) Contributed Pension Asset
$ 20,172 99% $ 2,578 17,590 99 2,713 14,437 99 2,827
20112010
FiscalYear
2012

City of St. Louis, Missouri Notes to Basic Financial Statements
June 30, 2012 (dollars in thousands)
82
Significant actuarial assumptions used in the valuation of the Police System are as follows:
Date of actuarial valuation October 1, 2011Actuarial cost method Aggregate cost method (this method does not
identify or separately amortize unfunded actuarial accrued liabilities)
Asset valuation method 5-year smoothed average of market valueInflation rate 2.5%, per yearInvestment rate of return 7.75%, per yearProjected salary increases 3.0% – 6.5%, varying by ageProjected postretirement benefit increases 2.5% maximum per year, cumulative 30% cap
c. Employees Retirement System of the City of St. Louis
1) System Description
All non-uniformed employees of the City and certain other public entities funded by or providing services to residents of the City become members of the Employees Retirement System upon employment with the exception of employees hired after attaining age 60.
The Employees System issues a publicly available financial report that includes financial statements and supplementary information. That report may be obtained by writing to the Employees’ Retirement System of the City of St. Louis; 1114 Market Street, Suite 900; St. Louis, Missouri 63101.
The Employees System provides for defined benefit payments for retirement, death, or disability to eligible employees or their beneficiaries based upon creditable service, final average compensation, and a benefit compensation base. Benefits vest with employees covered by the Employees System after the employee has attained five years of creditable service. Employees retire with full retirement benefits after the age of 65 or if the employee’s age and creditable service combined equal or exceed 85. Employees may retire and receive a reduced benefit after age 60 with five years of creditable service; age 55 with at least 20 years of creditable service; or at any age with 30 years of creditable service. The monthly pension benefits of all retirees or their beneficiaries are adjusted accordingly to the changes in the Consumer Price Index of the U.S. Department of Labor. Increases are limited each year, with total increases to retirees or their beneficiaries limited to 25%.
On June 8, 2000, the Mayor of the City approved an ordinance passed by the Board of Aldermen, authorizing a Deferred Retirement Option Plan (DROP), which became effective January 1, 2001. This plan states that when members reach retirement age, they are allowed to work for five additional years and defer receipt of their retirement allowance. The calculation of average salary for retirement benefits will not include the additional years of service after normal retirement age. The amount that would have been received as retirement benefit is put in a special DROP account monthly. The DROP account will not be adjusted for cost of living increases as the normal retirement benefits are. The DROP account earns interest at the actuarial valuation rate of return and at the 10 year U.S. Treasury Bond yield as of September 30, for

City of St. Louis, Missouri Notes to Basic Financial Statements
June 30, 2012 (dollars in thousands)
83
DROP participants enrolling February 1, 2003 and thereafter. After the member completely terminates employment, the member can withdraw amounts from the DROP account in a lump sum or according to a deferred retirement payment plan.
2) Funding Policy
The Employees System’s funding policy provides for periodic employer contributions at actuarially determined rates that, expressed as percentages of annual covered payroll, are sufficient to accumulate assets to pay benefits due. If contributions are necessary, level percentage of payroll employer contribution rates are determined using the projected unit credit actuarial cost method. Employer contribution rates are established annually by the Board of Trustees of the Employees’ System based on an actuarial study. Deductions from plan assets are financed from plan additions. The Board of Trustees established the required employer contributions rate based on active member payroll of 12.69% effective July 1, 2011, and 11.85% of active member payroll effective July 1, 2010.
Employees who became members of the Employees System prior to October 14, 1977, and continued to make contributions, may make voluntary contributions to the Employees System equal to 3% of their compensation until the employee’s compensation equals the maximum annual taxable earnings under the Federal Social Security Act. Thereafter, employees may contribute 6% of their compensation for the remainder of the calendar year.
3) Funded Status
The funded status of the Employees System for the actuarial valuation as of September 30, 2011 is as follows:
Actuarial UAAL As AActuarial Accrued Unfunded Annual Percentage
Value Liability AAL Funded Covered of Coveredof Assets (AAL) (UAAL) Ratio Payroll Payroll
$ 661,932 $ 841,763 $ 179,831 78.6% $ 223,061 80.6%
Date
September 30, 2011
ActuarialValuation

City of St. Louis, Missouri Notes to Basic Financial Statements
June 30, 2012 (dollars in thousands)
84
The schedule of funding progress, presented as required supplementary information following the notes to the basic financial statements, presents multiyear trend information about whether the actuarial value of plan assets is increasing or decreasing over time relative to the actuarial accrued liability for benefits.
4) Annual Pension Cost and Net Pension Obligation
The City’s annual pension cost and net pension obligation to the Employees System for the year ended June 30, 2012 are as follows:
Annual required contribution $ (29,498) Interest on net pension obligation (2,917) Adjustment to annual required contribution 3,239 Annual pension cost (29,176) Contributions made 25,026 Increase in net pension obligation (4,150) Net pension obligation, beginning of year (36,461) Net pension obligation, end of year $ (40,611)
The net pension obligation of $(40,611) is reflected as a long-term liability within the accompanying basic financial statements as follows:
Governmental activities $ (33,608) Business-type activities (3,883) Component unit—SLPD (3,120)
$ (40,611)
Historical trend information about the City’s participation in the Employees System is presented below.
Annual Percentage NetFiscal Pension of APC PensionYear Cost (APC) Contributed Obligation
2012 $ 29,176 86% $ (40,611) 2011 28,214 85 (36,461) 2010 25,813 89 (32,264)

City of St. Louis, Missouri Notes to Basic Financial Statements
June 30, 2012 (dollars in thousands)
85
Significant actuarial assumptions used in the valuation of the Employees’ System are as follows:
Date of actuarial valuation October 1, 2011Actuarial cost method Projected unit credit actuarial cost methodAmortization method Level dollar open amortization periodRemaining amortization period 30 yearsAsset valuation method 5-year smoothed marketInflation 3.125%Investment rate of return 8.00%Projected salary increases varies by age, ranging from 3.50% to 7.017%Cost of living adjustments 3.125% simple with a 25% lifetime cap
d. Component Unit—SLDC
The SLDC Employees Retirement Plan and Trust (SLDC plan) is a defined contribution plan and became effective January 1, 1989. Required year-ended June 30, 2012 contributions of $308, which amount to 9% of current covered payroll, were made by SLDC. For the year ended June 30, 2012, SLDC’s current covered payroll was $3,423 and total payroll amounted to $3,488. Employees are not required to contribute to the SLDC Plan; however, they can contribute up to 5 ½ % of their monthly compensation if they so elect. In order to be eligible under the SLDC Plan, the participant must be a full-time employee, have attained the age of 18, and have completed at least six months of active service. The employees vest at a rate of 33% per annum with full vesting occurring after the end of their third year of service. The SLDC Plan does not hold any employer or related-party securities. All plan investments are self-directed by the respective plan participants, within the limitations of the plan.
11. COMPONENT UNIT—SLPD OTHER POSTEMPLOYMENT BENEFITS PLAN
Plan Description
The SLPD is obligated under Chapter 84.160 RSMo to provide medical and life insurance benefits for former civilian and commissioned employees who retire subsequent to 1969. The SLPD provides these other postemployment benefits (OPEB) under a single-employer, defined benefit postemployment plan. The SLPD’s OPEB plan does not issue a separate financial report. Commissioned employees may retire and receive benefits under the SLPD’s OPEB plan after 20 years of creditable service, regardless of age. Civilian employees may retire and receive benefits under the SLPD’s OPEB plan after attaining age 55 with 20 years of service, or after attaining age 60 with five years of service. The disability eligibility for officers for a service disability has no minimum age or service requirements and for an ordinary disability is 10 years of service. The disability eligibility for civilians is 5 years of service.
For eligible retired employees and disabled employees under age 65, the SLPD pays the full cost of a base healthcare plan. Retirees may elect to pay costs associated with a buy-up healthcare plan, which provides coverage in excess of the base healthcare plan. For eligible retired employees and disabled employees over

City of St. Louis, Missouri Notes to Basic Financial Statements
June 30, 2012 (dollars in thousands)
86
65, the SLPD pays the costs of a Medicare Supplement Plan. Retirees pay the full cost of spouse healthcare coverage. Additionally, the SLPD provides a postretirement death benefit of $3.
The SLPD has elected to have an actuarial valuation performed biennially, unless significant changes occur that affect the results of the most recent valuation. At July 1, 2011, the date of the latest actuarial valuation, plan membership consisted of the following:
1,518
receiving benefits 91 Active members 1,865 Total plan members 3,474
Retirees and beneficiaries receiving benefitsTerminated plan members entitled to, but not yet
Funding Policy
Contributions made to the SLPD’s OPEB plan are established and may be amended by Board of Police Commissioners. For the year ended June 30, 2012, the SLPD contributed $9,361, which was based upon pay-as-you-go financing requirements.
Annual Other Postemployment Benefit Cost and Net Other Postemployment Benefit Obligation
The SLPD’s annual OPEB cost (expense) is calculated based on the annual required contribution (ARC) of the employer, and amount actuarially determined in accordance with the parameters of GASB Statement No. 45, Accounting and Financial Reporting by Employers for Postemployment Benefits Other than Pensions. The annual required contribution represents a level of funding that, if paid on an on-going basis, is projected to cover normal costs each year and amortize any unfunded actuarial liabilities (or funding excess) over a period not to exceed 30 years.
The following table shows the components of the SLPD’s annual OPEB cost for the year, the amount actually contributed to plan, and changes in the SLPD’s net OPEB obligation:
Annual required contribution $ (39,636) Interest on net OPEB obligation (1,859) Adjustment to annual required contribution 3,162
Annual OPEB cost (38,333)
Contribution made 9,361
Increase in net OPEB obligation (28,972) Net OPEB obligation, beginning of year (61,978) Net OPEB obligation, end of year $ (90,950)
Historical trend information about the SLPD’s participation in the OPEB Plan is as follows:

City of St. Louis, Missouri Notes to Basic Financial Statements
June 30, 2012 (dollars in thousands)
87
Annual Percentage NetOPEB of AOC OPEB
Fiscal year cost (AOC) contributed obligation$ 38,333 24.4% $ 90,950
25,914 36.8 61,978 22,385 40.1 45,609
20112010
2012
Funding Status and Funding Progress
As of July 1, 2011, the most recent actuarial valuation date, the plan was 0% funded. The July 1, 2011 actuarial valuation stated the actuarial accrual liability for benefits was $443,392, and the actuarial value of assets was $0. The covered payroll (annual payroll of active employees covered by the plan) was $93,289, and the ratio of the unfunded actuarial accrued liability to the covered payroll was 475.3%.
Actuarial valuations of an ongoing plan involve estimates for the value of reported amounts and assumptions about the probability of occurrence of events far into the future. Examples include assumptions about future employment, mortality, and the healthcare trend. Amounts determined regarding the funded status of the plan and annual required contributions of the employer are subject to continual revision as actual results are compared with past expectations and new estimates are made throughout the future.
The schedule of funding progress, presented as required supplementary information following the notes to the financial statements, presents multiyear trend information about whether the actuarial value of plan assets is increasing or decreasing over time relative to the actuarial accrued liabilities for benefits.
Actuarial Methods and Assumptions
The projection of future benefit payments for financial reporting purposes are based on the substantive plan (the plan as understood by the employer and the plan members) and includes the types of benefits provided at the time of each valuation, as amended for significant changes to the plan that would impact the valuation. The actuarial methods and assumptions used include techniques that are designed to reduce the effects of short-term volatility in actuarial accrued liabilities and the actuarial value of assets, consistent with the long-term perspective of the calculations.
In the July 1, 2011 actuarial valuation, the projected unit credit cost method was used. The actuarial assumptions include a 3% discount rate and an annual healthcare cost trend rate of 9.00% initially, reduced by decrements to an ultimate rate of 5% after eight years. The unfunded actuarial accrued liability is being amortized as a level dollar amount on an open basis over a 30-year amortization period.
12. DEFERRED COMPENSATION PLAN
The City offers its employees a deferred compensation plan created in accordance with Internal Revenue Code Section 457. The plan, available to all City and SLPD employees, permits them to defer a portion of their salary until future years. The deferred compensation is not available to employees until termination, retirement, death, or unforeseeable emergency.

City of St. Louis, Missouri Notes to Basic Financial Statements
June 30, 2012 (dollars in thousands)
88
All amounts of compensation deferred under the plan, all property and rights purchased with those amounts, and all income attributable to those amounts, property, or rights are (until paid or made available to the employees or other beneficiary) held in trust for the exclusive benefit of the employees. As such, the trust account and related liability are not included in the basic financial statements.
13. LONG-TERM LIABILITIES
a. Changes in Long-Term Liabilities
Following is a summary of the changes in long-term liabilities for the year ended June 30, 2012:
Balance Balance DueJune 30, June 30, Within
2011 Additions Reductions 2012 One Year
Governmental activities:General obligation bonds payable $ 42,685 — (3,730) 38,955 3,905 Section 108 Loan Guarantee
Assistance Programs 46,750 — (3,500) 43,250 3,720 Tax increment financing bonds
and notes payable 200,754 51,101 (5,776) 246,079 9,617 Master note purchase agreement 33 — (33) — — Loan agreement with Missouri
Department of Natural Resources 195 — (128) 67 67 Loan agreement with MTFC 3,370 — (426) 2,944 444 Capital lease—rolling stock 19,033 2,384 (4,145) 17,272 3,574 Certificates of participation 7,950 — (595) 7,355 615 Obligations with component unit 56,960 — (2,221) 54,739 1,534 Firemen's Retirement EAN Note — 5,278 — 5,278 906 Leasehold revenue improvement and
refunding bonds 534,930 49,825 (82,327) 502,428 29,025 Joint venture financing agreement 50,092 — (3,927) 46,165 4,080 Unamortized discounts (4,960) — 457 (4,503) — Unamortized premiums 8,752 4,038 (3,108) 9,682 — Unamortized deferred amounts
on refunding (8,704) (1,312) 3,480 (6,536) — Net pension obligation 29,436 4,172 — 33,608 — Accrued vacation
and sick leave 26,699 12,092 (13,744) 25,047 12,894 Claims and judgments payable 24,789 17,570 (17,526) 24,833 12,385
Governmental activities long-termliabilities $ 1,038,764 145,148 (137,249) 1,046,663 82,766
Internal service funds predominantly serve the governmental funds. Accordingly, long-term liabilities for them are included as part of the above totals for governmental activities. Also, for the governmental

City of St. Louis, Missouri Notes to Basic Financial Statements
June 30, 2012 (dollars in thousands)
89
activities claims and judgments payable, accrued vacation and sick leave benefits, net pension obligations, and landfill closure costs are generally liquidated by the general fund.
Balance Balance DueJune 30, June 30, Within
2011 Additions Reductions 2012 One Year
Business-type activities:Airport:
Revenue bonds payable $ 855,060 31,395 (52,495) 833,960 30,655 Net pension obligation 1,775 — (16) 1,759 — Pension funding project 5,427 — (82) 5,345 91 Other 523 — (62) 461 — Accrued vacation
and sick time benefits 5,904 3,706 (3,974) 5,636 3,706 Unamortized discounts, premiums, and
deferred amounts on refunding 18,978 1,346 (3,491) 16,833 — Deferred lease revenue 6,312 — (281) 6,031 —
Total Airport 893,979 36,447 (60,401) 870,025 34,452
Water Division:Revenue bonds payable 16,000 11,480 (16,000) 11,480 3,895 Customer deposits 1,745 33 — 1,778 — Net pension obligation 1,450 1,727 (1,733) 1,444 — Pension funding project 3,171 — (54) 3,117 — Other 106 — (106) — — Accrued vacation
and sick time benefits 3,340 8 — 3,348 1,711 Unamortized discounts and
deferrals (13) — 13 — —
Total Water Division 25,799 13,248 (17,880) 21,167 5,606
Parking Division:Revenue bonds payable 74,892 — (2,129) 72,763 2,186 Net pension obligation 673 7 — 680 — Pension funding project 874 — (14) 860 — Other 242 63 (80) 225 63 Accrued vacation
and sick time benefits 139 162 (139) 162 162 Unamortized discounts, premiums, and
deferred amounts on refunding (5,242) — 307 (4,935) —
Total Parking Division 71,578 232 (2,055) 69,755 2,411
Business-type activities long-termliabilities $ 991,356 49,927 (80,336) 960,947 42,469
Less amounts recorded in:Accrued salaries and other benefits (5,579) (5,579) Due to other governmental agencies (63) (63) Accounts payable and accrued liabilities (91) (91)
$ 955,214 36,736

City of St. Louis, Missouri Notes to Basic Financial Statements
June 30, 2012 (dollars in thousands)
90
b. General Obligation Bonds
Principal and interest requirements are as follows:
Principal Interest TotalYear ending June 30:
2013 $ 3,905 1,779 5,684 2014 4,090 1,590 5,680 2015 4,275 1,413 5,688 2016 4,485 1,210 5,695 2017 4,720 993 5,713 2018 – 2022 13,050 2,098 15,148 2023 – 2026 4,430 475 4,905
$ 38,955 9,558 48,513
c. Section 108 Loan Guarantee Assistance Programs
In July 2011 the HUD Section 108 notes were defeased in order to take advantage of a call on the notes. HUD offered a new Section 108 financing, allowing the City to secure a lower fixed rate. The offering took place in November 2011 and the City was able to secure a low, fixed rate through the life of the note. The HUD notes will mature on August 1, 2020 and bear interest rates ranging from 0.35% to 2.45%. Principal and interest requirements for the combined Section 108 program notes are as follows:
Principal Interest TotalYear ending June 30:
2013 $ 3,720 588 4,308 2014 3,950 574 4,524 2015 4,210 551 4,761 2016 4,460 516 4,976 2017 4,750 467 5,217 2018 – 2021 22,160 992 23,152
$ 43,250 3,688 46,938
d. Tax Increment Financing Bond and Notes Payable
The City issued $51,101 in TIF bonds and notes payable during fiscal year 2012.

City of St. Louis, Missouri Notes to Basic Financial Statements
June 30, 2012 (dollars in thousands)
91
Principal and interest requirements for the tax increment financing debt issues are as follows:
Principal Interest Total
Year ending June 30:2013 $ 9,617 16,121 25,7382014 10,236 15,502 25,7382015 10,896 14,843 25,7392016 11,599 14,140 25,7392017 12,349 13,390 25,7392018 – 2022 74,849 53,843 128,6922023 – 2027 83,224 27,634 110,8582028 – 2032 31,882 5,556 37,438 2033 1,427 111 1,538
$ 246,079 161,140 407,219
TIF Bonds and Notes
e. Loan Agreement with Missouri Department of Natural Resources (DNR)
During Fiscal Year 2013, the final payment will be $68 in principal and $1 in interest.
f. Loan Agreement With Missouri Transportation Finance Corporation (MTFC)
Principal and interest requirements under the loan agreement with the MTFC are as follows:
Principal Interest TotalYear ending June 30:
2013 $ 444 124 568 2014 463 105 568 2015 482 85 567 2016 502 65 567 2017 523 44 567 2018 530 22 552
$ 2,944 445 3,389
g. Capital Lease—Rolling Stock
In February 2012, the City amended its lease agreement with JPMorgan Chase Bank, N.A. resulting in new debt of $2,384. The proceeds of the debt were used to buy rolling stock for the Refuse Division.
The following is a schedule of future minimum lease payments as of June 30, 2012.

City of St. Louis, Missouri Notes to Basic Financial Statements
June 30, 2012 (dollars in thousands)
92
Year ending June 30:2013 $ 4,145 2014 3,452 2015 2,907 2016 2,313 2017 1,862 2017 – 2020 4,650
Total future minimum lease payments 19,329 Amount representing interest (2,059)
Present value of net minimum lease payments $ 17,270
h. Certificates of Participation
The City has a master lease agreement with SLDC, whereby the City has leased Stadium East Redevelopment Project and related property and portions of the City Block 210 (the Kiel Premises) to SLDC.
The following is a schedule, by years, of the future minimum payments together with the present value of the net minimum payments for the obligation, which supports the Kiel Premises, as of June 30, 2012.
Year ending June 30:2013 $ 897 2014 891 2015 894 2016 895 2017 894 2018 – 2022 4,533
Total future minimum obligation payments 9,004 Amount representing interest (1,649)
Present value of net minimum obligation payments $ 7,355
No capital assets are recorded by the City on its statement of net assets in conjunction with this obligation due to the proceeds being used for demolition and site preparation.
i. Obligation with Component Unit
1) Convention Center – SLDC Series 2000 Bonds
In 2000, SLDC issued Series 2000 Compound Interest Leasehold Revenue Bonds (Series 2000 Bonds) in the amount of $40,000 for the purpose of providing funding for the construction of a convention center hotel within the vicinity of the Convention Center. Under the Agreement, SLMFC has assigned its rights under the lease relative to the Series 2000 Bonds to SLDC. The City is required, beginning on

City of St. Louis, Missouri Notes to Basic Financial Statements
June 30, 2012 (dollars in thousands)
93
July 15, 2011, to make lease payments to SLDC to fund the annual debt service payments for the Series 2000 Bonds.
The following is a schedule, by years, of the future minimum payments together with the present value of the net minimum payments for the obligation as of June 30, 2012.
Year ending June 30:2013 $ 2,700 2014 2,285 2015 — 2016 15,295 2017 15,295 2018 - 2021 61,180
Total future minimum obligation payments 96,755
Amount representing interest (58,811) Present value of net minimum obligation payments $ 37,944
No capital assets are recorded by the City on its statement of net assets in conjunction with this obligation due to the proceeds of this obligation being used for construction of a convention center hotel that is not owned by the City.
2) 600 Washington Project – SLDC Series 2010 Bonds
On March 5, 2010, The Land Clearance for Redevelopment Authority (LCRA) issued $16,960 Recovery Zone Facility Special Obligation Redevelopment Bonds Series 2010 (LCRA Series 2010 bonds) for the 600 Washington Project, a contractual obligation of the City.
The following is a schedule, by years, of the future minimum payments together with the present value of the net minimum payments for the obligation as of June 30, 2012.

City of St. Louis, Missouri Notes to Basic Financial Statements
June 30, 2012 (dollars in thousands)
94
Year ending June 30:2013 $ 936 2014 940 2015 959 2016 987 2017 1,008 2018 – 2022 5,407 2023 – 2027 6,133 2028 – 2032 7,073 2033 – 2037 7,974 2038 – 2040 4,700
Total future minimum obligation payments 36,117 Amount representing interest (19,322)
Present value of net minimum obligation payments $ 16,795
j. Firemen’s Retirement EAN Note
The Firemen’s System and the City entered into an Agreement of Understanding if legislation at the state level changing the actuarial method to entry age normal (EAN) did not pass, the City would have the option to issue a note amortizing the unpaid amount to make up the shortfall of the contribution required in fiscal year 2012. The state failed to pass the bill causing the issuance of the note in the amount of $5,278.
Principal and interest requirements under the loan agreement with the Firemen’s System are as follows:
Principal Interest TotalYear ending June 30:
2013 $ 906 503 1,409 2014 976 333 1,309 2015 1,050 259 1,309 2016 1,130 179 1,309 2017 1,216 93 1,309
$ 5,278 1,367 6,645
14. LEASEHOLD REVENUE IMPROVEMENT AND REFUNDING BONDS
a. Justice Center
On December 8, 2011, the SLMFC issued $49,825 in City Justice Center Leasehold Revenue Refunding Bonds, Series 2011 with an average interest rate of 3.95% to advance refund $51,860 of Series 2001A Bonds with an average interest rate of 4.93%. The net proceeds of $53,172 (after the addition of a $4,039 premium less a payment of $692 in issuance costs were deposited with the escrow agent under the escrow deposit agreement and, together with interest earnings thereon, were applied to

City of St. Louis, Missouri Notes to Basic Financial Statements
June 30, 2012 (dollars in thousands)
95
the payment of principal and interest on the Series 2001A Bonds.The current and advance refunding decreased the total debt service payment of the Series 2011 payment by $3,670 and results in an economic gain (difference between present value of old and new debt service payments) of $3,478. As a result, the Series 2001A Bonds are considered to be defeased, and the liability for those bonds have been removed from the financial statements.
b. Pension Funding Project 2007
The long-term liability for the Employees’ System portion of the Pension Funding Project Series 2007 debt is reflected as a long-term liability within the accompanying basic financial statements as follows as of June 30, 2012:
Governmental activities $ 31,631 Business-type activities 9,376 Component unit—SLPD 4,232
$ 45,239
c. Principal and Interest Requirements Principal and interest requirements for the Leasehold Revenue Improvement and Refunding Bonds are as follows:
Civil Courts Convention CenterPrincipal Interest Principal Interest
Year ending June 30:2013 $ 2,580 246 $ 11,310 3,700 2014 2,685 138 12,325 3,100 2015 2,690 47 16,038 3,771 2016 — — — 2,417 2017 — — — 2,417 2018 – 2022 — — 9,390 17,990 2023 – 2027 — — 37,701 50,854 2028 – 2032 — — 31,975 56,577 2033 – 2037 — — 17,967 70,582 2037 — — 25,568 12,314
$ 7,955 431 $ 162,274 223,722

City of St. Louis, Missouri Notes to Basic Financial Statements
June 30, 2012 (dollars in thousands)
96
Justice Center Forest ParkPrincipal Interest Principal Interest
Year ending June 30:2013 $ 7,190 2,653 $ 895 473 2014 8,265 2,352 930 443 2015 8,615 2,008 965 403 2016 9,030 1,587 1,010 360 2017 9,485 1,135 1,050 322 2018 – 2022 15,340 987 6,045 803
$ 57,925 10,722 $ 10,895 2,804
Abram BuildingCarnahan Courthouse (1520 Market Street)
Principal Interest Principal Interest
Year ending June 30:2013 $ 175 960 $ 1,301 339 2014 1,235 954 1,294 297 2015 1,280 904 1,337 254 2016 1,330 853 1,381 209 2017 1,385 800 1,483 146 2018 – 2022 7,790 3,123 4,331 304 2023 – 2027 10,185 1,386 — —
$ 23,380 8,980 $ 11,127 1,549
Police Capital
Recreation Sales Tax Improvement Sales TaxPrincipal Interest Principal Interest
Year ending June 30:2013 $ 1,025 2,212 $ 300 1,008 2014 1,065 2,172 315 996 2015 1,110 2,129 325 983 2016 1,155 2,084 340 970 2017 1,185 2,036 350 958 2018 – 2022 6,980 9,328 2,790 4,554 2023 – 2027 8,820 7,512 4,850 3,696 2028 – 2032 11,090 5,244 6,015 2,528 2033 – 2037 14,150 2,191 7,505 1,043
$ 46,580 34,908 $ 22,790 16,736

City of St. Louis, Missouri Notes to Basic Financial Statements
June 30, 2012 (dollars in thousands)
97
Public Safety Sales TaxPension Funding Project 2008 Juvenile Detention Center
Principal Interest Principal Interest
Year ending June 30:2013 $ 1,655 774 $ 520 1,026 2014 1,735 692 540 1,006 2015 1,825 600 565 984 2016 1,930 494 585 961 2017 2,045 380 610 938 2018 – 2022 4,455 395 3,430 4,303 2023 – 2027 — — 4,195 3,538 2028 – 2032 — — 5,215 2,519 2033 – 2037 — — 6,495 1,235 2038 — — 1,480 67
$ 13,645 3,335 $ 23,635 16,577
Pension Funding ProjectPrincipal Interest
Year ending June 30:2013 $ 2,305 8,829 2014 2,455 8,680 2015 2,615 8,520 2016 2,785 8,349 2017 2,970 8,168 2018 – 2022 17,995 37,685 2023 – 2027 24,650 31,026 2028 – 2032 33,775 21,903 2033 – 2037 46,280 9,403
$ 135,830 142,563
15. JOINT VENTURE FINANCING AGREEMENT
In April 1990, the St. Louis Regional Convention and Sports Complex Authority (Authority) was established as a separate legal entity by an act of the Missouri State legislature to acquire, purchase, or lease, and construct, operate, and maintain convention centers, sports stadiums, field houses, indoor and outdoor convention, recreational, and entertainment facilities, and to do all things incidental or necessary to facilitate these purposes.
The Authority entered into a Project Financing Construction and Operation Agreement (Financing Agreement) dated August 1, 1991 with the City, State, and County (collectively, the Sponsors) providing for the application of the proceeds of Project Bonds, for the repayment of the Project Bonds, and for the operation and maintenance of the Project. On August 1 and February 1 of each year, the

City of St. Louis, Missouri Notes to Basic Financial Statements
June 30, 2012 (dollars in thousands)
98
City is obligated (subject to appropriations) to make rental payments of $2,500 and preservation payments of $500 regardless of the principal and interest payments due.
At June 30, 2012, the City’s obligation for the Series C Bonds and net preservation payments (after deposits to the bond fund) payable from the general fund under the Financing Agreement is as follows:
PreservationPrincipal Interest Payments Total
Year ending June 30:2013 $ 2,990 1,920 1,090 6,000 2014 3,145 1,759 1,096 6,000 2015 3,315 1,590 1,095 6,000 2016 3,490 1,411 1,099 6,000 2017 3,670 1,223 1,107 6,000 2018 – 2022 21,460 2,931 2,609 27,000
$ 38,070 10,834 8,096 57,000
16. COMPONENT UNIT—LONG-TERM LIABILITIES
a. Component Unit – SLDC Long-Term Liabilities
The following is a summary of changes in long-term liabilities for SLDC for the year ended June 30, 2012:
Balance Balance DueJune 30, June 30, Within
2011 Additions Reductions 2012 One Year
Due to other governmentalagencies $ 9,472 1,830 (2,435) 8,867 2,000
Notes payable 18,742 12,121 (10,120) 20,743 10,052 Other liabilities 6,822 2,646 (2,457) 7,011 1,678 Revenue bonds 10,690 — (455) 10,235 485
$ 45,726 16,597 (15,467) 46,856 14,215

City of St. Louis, Missouri Notes to Basic Financial Statements
June 30, 2012 (dollars in thousands)
99
Maturities on notes payable are as follows:
Principal Interest TotalYear ending June 30:
2013 $ 10,052 446 10,498 2014 5,691 195 5,886 2015 — 106 106 2016 — 106 106 2017 — 106 106 2018-2020 5,000 263 5,263
$ 20,743 1,222 21,965
Revenue bonds outstanding at June 30, 2012 consist of SLDC Parking Facility Revenue Refunding Bonds Series 1999B (Series 1999B bonds), and Parking Facility Revenue Refunding and Improvement Bonds Series 1999C (Series 1999C bonds) (Bonds). Collectively, the Bonds are dated October 21, 1999.
The Series 1999B bonds with an original issue amount of $8,300 are due at intervals until September 1, 2019, and are payable solely from, and secured by, a pledge of gross revenues from the operation of SLDC Parking Facilities’ St. Louis Centre East Parking Garage. The bonds may be redeemed prior to maturity at the option of SLDC and are subject to special mandatory redemption prior to maturity following the occurrence of a determination of taxability as defined in the bond indenture. These bonds carry rates of interest ranging from 6.5% to 7.0%.
The Series 1999C bonds with an original issue amount of $3,040 are due September 1, 2024. Bond proceeds were to repay an SLDC note payable and construct a parking lot on property in the St. Louis Centre Development Area. The bonds may be redeemed prior to maturity at the option of LCRA and are subject to special mandatory redemption prior to maturity following the occurrence of a determination of taxability as defined in the bond indenture. These bonds carry a rate of interest of 7.05%.

City of St. Louis, Missouri Notes to Basic Financial Statements
June 30, 2012 (dollars in thousands)
100
Debt service requirements to maturity for SLDC revenue bonds are as follows:
Series 1999B Series 1999CPrincipal Interest Principal Interest
Year endingJune 30:
2013 $ 485 481 — 214 2014 515 448 — 214 2015 545 412 — 214 2016 580 375 — 214 2017 620 333 — 215 2018-2022 4,450 636 615 1,050 2023-2025 — — 2,425 285
$ 7,195 2,685 3,040 2,406
b. Component Unit— SLPD Long-Term Liabilities
The following is a summary of changes in long-term liabilities for SLPD for the year ended June 30, 2012:
Balance Balance DueJune 30, June 30, within
2011 Additions Reductions 2012 One Year
Accrued vacation and sick leave pay $ 24,725 16,271 (15,526) 25,470 6,016
Worker's compensation 16,883 1,507 (2,811) 15,579 2,893 Net pension obligation 3,147 2,819 (2,847) 3,119 — Pension obligation payable 4,299 — (67) 4,232 72 Claims payable 271 128 (271) 128 128 Net OPEB obligation 61,978 38,333 (9,361) 90,950 9,171
$ 111,303 59,058 (30,883) 139,478 18,280

City of St. Louis, Missouri Notes to Basic Financial Statements
June 30, 2012 (dollars in thousands)
101
17. REVENUE BONDS PAYABLE
a. Airport
Bonds outstanding at June 30, 2012 are summarized as follows:
Bond Series 1997 B, interest rate of 6%, payable in varying amounts through 2015 $ 16,825
Bond Series 2002, interest rates ranging from4.00% to 5.25%, payable in varying amounts through 2014 3,435
Bond Series 2003A, interest rates ranging from 3.75% to 5.25%,payable in varying amounts through 2019 45,825
Bond Series 2005, interest rate ranging from 4.00% to 5.50%, payable in varying amounts through 2032 263,695
Bond Series 2007A, interest rate ranging from 4.00% to 5.25%, payable in varying amounts through 2033 231,275
Bond Series 2007B, interest rate ranging of 5.00%, payable in varying amounts through 2028 104,735
Bond Series 2009A, interest rate ranging from 5.125% to 6.63%,payable in varying amounts through 2035 107,240
Bond Series 2011AB, interest rate ranging from 3.00% to 5.00%,payable in varying amounts through 2016 29,535
Bond Series 2012, interest rate ranging from 3.00% to 5.00%,payable in varying amounts through 2033 31,395
833,960
Less:Current maturities (30,655) Unamortized discounts and premiums 41,116 Deferred amounts on refunding (24,283)
$ 820,138
On June 30, 2012, the Airport issued $31,395 in Series 2012 Revenue Refunding Bonds payable in varying amounts from 2013 through 2032 with interest rates ranging from 3.00% to 5.00%. The Series 2012 Bonds, along with other sources of funding totaling $4,082 were used to advance refund the remaining outstanding bonds from the 2002 B Series Revenue Refunding bonds totaling $27,685 and the 2002 C Series Revenue bonds totaling $4,825. The net proceeds of $32,564 (after the addition of a net issue premium of $1,346 and payment of $177 in issuance costs) as well as the $4,082 of other sources of the funding were deposited into the irrevocable trust with an escrow agent to provide for the refunded debt service payments. At June 30, 2012, $27,685 of 2002 B Series Revenue Refunding bonds and $4,825 of 2002 C Series Revenue bonds are considered defeased. Accordingly, the trust account assets and the liability for the defeased bonds are not included in the Airport’s financial statements.

City of St. Louis, Missouri Notes to Basic Financial Statements
June 30, 2012 (dollars in thousands)
102
The Airport completed the advance refunding to reduce its total debt service payments over the next 20 years by $1,407 and to obtain an economic gain (difference between the present value of the old and new debt services payments) of $958.
The deferred amounts on refunding of $24,283 at June 30, 2012 are included in revenue bonds payable within the accompanying balance sheet. The deferred amounts on refunding are amortized as a component of interest expense using the bonds outstanding method over the life of the new bonds or the old bonds, whichever is less.
As of June 30, 2012, the Airport’s aggregate debt service requirements for the next five years and in five-year increments thereafter are as follows:
Principal Interest Total
Year(s) ending June 30:2013 $ 30,655 43,001 73,656 2014 36,405 41,628 78,033 2015 37,955 39,713 77,668 2016 40,270 37,730 78,000 2017 38,980 35,648 74,628 2018 – 2022 198,665 146,611 345,276 2023 – 2027 205,615 95,442 301,057 2028 – 2032 211,095 39,705 250,800 2033 – 2035 34,320 2,838 37,158
$ 833,960 482,316 1,316,276
In prior years, the Airport advance refunded various Airport Revenue Bonds by placing funds in an irrevocable trust to provide for all future debt service payments on these bonds. Accordingly, the trust account assets and the liability for the defeased bonds are not included in the financial statements. At June 30, 2012, $529,075 of outstanding revenue bonds are considered defeased.
b. Water Division
Water revenue bonds outstanding at June 30, 2012 are payable solely from and secured by, a pledge of net revenues from the operation of the Water Division and are summarized as follows:
Series 2011 Water Revenue Refunding Bonds, 1.50%Payable in varying amounts through July 1, 2014 $ 11,480
Less:Current maturities (3,895)
$ 7,585
In September 2011, the Water Division issued $11,480 in Water Revenue Refunding Bonds (Series 2011 Bonds) with an interest rate of 1.50% to advance refund $12,260 of the outstanding Series 1998 Bonds, maturing on July 1, 2014. The net proceeds of $11,273 (after the subtraction of payment of

City of St. Louis, Missouri Notes to Basic Financial Statements
June 30, 2012 (dollars in thousands)
103
$207 in issuance costs) were deposited in an irrevocable trust with an escrow agent. The net proceeds and the balance of $1,207 from the Series 1998 Debt Service Reserve Fund, totaling $12,480, provided payment on the $12,260 principal of the Series 1998 Bonds. As a result, Series 1998 Bonds were considered to be defeased and the liability for those bonds has been removed from the basic financial statements. At June 30, 2012, no defeased Series 1998 Bonds remain outstanding.
Debt service requirements to maturity for the Series 2011 Bonds are as follows:
Principal Interest Total
Year ending June 30:2013 3,895 143 4,038 2014 3,765 85 3,850 2015 3,820 29 3,849
$ 11,480 257 11,737
c. Parking Division
Revenue bonds outstanding at June 30, 2012 are as follows:
SLPCFC Series 2003A tax-exempt revenue bonds interest ratesvariable not to exceed 12% payable in varying amountsthrough 2028 $ 3,445
SLPCFC Series 2003B taxable revenue bonds interest ratesvariable not to exceed 5% payable in varying amountsthrough 2038 6,238
Series 2006 revenue bonds interest ranging from 3.75% to5.14% payable in varying amounts through 2032 51,175
Series 2007 revenue bonds interest ranging from 4.125% to6.00% payable in varying amounts through 2034 11,905
72,763
Less:Current maturities (2,186) Unamortized discount, premium and deferred loss on refunding (4,935)
$ 65,642

City of St. Louis, Missouri Notes to Basic Financial Statements
June 30, 2012 (dollars in thousands)
104
Debt service requirements for the Parking Division revenue bonds are as follows:
Principal Interest Total
Year ending June 30:2013 $ 2,186 3,334 5,520 2014 2,298 3,223 5,521 2015 2,419 3,104 5,523 2016 2,584 2,990 5,574 2017 2,689 2,883 5,572 2018 – 2022 15,428 12,465 27,893 2023 – 2027 18,073 8,645 26,718 2028 – 2032 22,904 3,934 26,838 2033 – 2037 3,774 500 4,274 2038 408 20 428
$ 72,763 41,098 113,861
18. PLEDGED REVENUES
The City has pledged specific revenue streams to secure the repayment of certain outstanding debt issues. The following narratives list those revenues by source along with the general purpose of the debt, the amount of the pledge remaining, the term of the pledge commitment, the amount of pledged revenue collected during the current fiscal year, and the approximate percentage of the revenue stream that has been committed, if estimable:
a. Governmental activities
The City has pledged an ad valorem tax levied upon all taxable, tangible property, real and personal (property tax revenue) related to various general obligation revenue bonds. The general purpose of the various general obligation revenue bonds is the purpose of refunding renovation of fire and police buildings and demolition of unsafe or condemned buildings and communications equipment for fire police and EMS and police infrastructure improvements. The bonds are payable, in part, from a tax rate that is set annually based on revenue required to pay debt. The term of commitments related to such pledged revenues vary by issuances and extend to fiscal year 2026. Annual principal and interest payments on the bonds are expected to require 100% of estimated related net revenues. As of June 30, 2012, the total principal and interest remaining to be paid on the debt is $48,513. Principal and interest paid was $5,670 for the year ended June 30, 2012. The pledged net revenue recognized for the year ended June 30, 2012 was $5,682. During fiscal year 2012, the proportion of pledged revenues needed for debt service to revenues collected was 99.8%.
The City has pledged all payments in lieu of taxes (PILOTs) and fifty per cent of the economic activity taxes (EATS) captured in specified TIF districts to pay debt outstanding. The general purpose of the TIFS is to assist in development of blighted properties. The debt outstanding is payable from the related pledged revenues through year 2033. Annual principal and interest outstanding on the various TIF bonds and notes outstanding is paid based on the amount of revenue captured in each particular district. It has also been pledged to pay debt on the Section 108 Loan for the Convention Center Hotel

City of St. Louis, Missouri Notes to Basic Financial Statements
June 30, 2012 (dollars in thousands)
105
and the 600 Washington obligation with component unit. Annual principal and interest payments on the bonds are expected to require 100% of estimated related net revenues. As of June 30, 2012, the total principal and interest remaining is $477,731. Principal and interest paid was $23,570 for the year ended June 30, 2012. The pledged net revenue recognized for the year ended June 30, 2012 was $25,375. During fiscal year 2012, the proportion of pledged revenues needed to revenues collected was 92.9%.
A $45 (in dollars) surcharge on civil cases in the circuit court is imposed by state statute to be used for courthouse restoration. A city ordinance also imposes a $5 (in dollars) court cost on all municipal ordinance violation cases to be used for courthouse restoration. The funds are used as pledges for the Civil Court and Carnahan Courthouse Leasehold Revenue Refunding Bond Series, with purposes of financing renovations at the Civil Courts building and the Carnahan Courthouse, respectively. The term of commitment related to such pledged revenues extend to fiscal year 2027. Annual principal and interest payments on the bonds are expected to require 100% of estimated related net revenues. As of June 30, 2012, the total principal and interest remaining on these financings is $40,746. Principal and interest paid was $3,967 for the year ended June 30, 2012. The pledged net revenue recognized for the year ended June 30, 2012 was $1,492. During fiscal year 2012, the proportion of pledged revenues needed to revenues collected was 100%.
The City has pledged State per diem prisoner reimbursements for boarding of State prisoners to Justice Center debt issuances. The purpose of the financings was to construct a new Justice Center. The term of commitment related to such pledged revenues extend to fiscal year 2020. Annual principal and interest payments on the bonds are expected to require 100% of estimated related net revenues. As of June 30, 2012, total principal and interest remaining on the debt is $68,647. Principal and interest paid was $13,520 for the year ended June 30, 2012. The pledged net revenue recognized for the year ended June 30, 2012 was $5,298. During fiscal year 2012, the proportion of pledged revenues needed to revenues collected was 100%.
The City has pledged a portion of the one half cent capital improvement sales tax to fund the Forest Park Leasehold Revenue Refunding Bonds, whose purpose was to finance improvements to Forest Park. As legally committed by ordinance, 10.4% of the revenue collected from this sales tax is allocated for Forest Park. The annual debt payment is appropriated from this source of funds. The term of commitment related to such pledged revenues extend to fiscal year 2022. Annual principal and interest payments on the bonds are expected to require less than 80% of estimated related net revenues. As of June 30, 2012, total principal and interest remaining on the debt is $13,699. Principal and interest paid was $1,373 for the year ended June 30, 2012. The pledged net revenue recognized for the year ended June 30, 2012 was $1,905. During fiscal year 2012, the proportion of pledged revenues needed to revenues collected was 72.1%.
The City has pledged the one eighth cent parks and recreation sales tax to fund the Recreation Sales Tax Leasehold Revenue Bonds Revenue Bonds whose purpose was the construction of two new recreation centers. The annual debt payment is appropriated from this source of funds. The term of commitment related to such pledged revenues extend to fiscal year 2037. Annual principal and interest payments on the bonds are expected to require less than 80% of estimated related net revenues. As of June 30, 2012, total principal and interest remaining on the debt is $81,488. Principal and interest paid was $3,237 for the year ended June 30, 2012. The pledged net revenue recognized for the year ended

City of St. Louis, Missouri Notes to Basic Financial Statements
June 30, 2012 (dollars in thousands)
106
June 30, 2011 was $4,520. During fiscal year 2012, the proportion of pledged revenues needed to revenues collected was 71.6%.
The City has pledged a portion of the one half cent capital improvement sales tax to fund the Police Capital Improvements Sales Tax Leasehold Revenue Bonds Series 2007, whose purpose was capital improvements to police buildings and certain interoperable communications equipment to be used by the police, fire and EMS. As legally committed by ordinance, 10% of the revenue collected from this sales tax is allocated for police capital improvements. The annual debt payment is appropriated from this source of funds. The term of commitment related to such pledged revenues extend to fiscal year 2037. Annual principal and interest payments on the bonds are expected to require less than 90% of estimated related net revenues. As of June 30, 2012, total principal and interest remaining on the debt is $39,526. Principal and interest paid was $1,309 for the year ended June 30, 2012. The pledged net revenue recognized for the year ended June 30, 2012 was $1,830. During fiscal year 2012, the proportion of pledged revenues needed to revenues collected was 71.5%.
The 3.5% sales tax imposed on the amount of sales or charges for all rooms paid by the transient guests of hotels and motels is pledged by the City to fund the Convention and Sports Facility Refunding Bonds Series C 2007, whose purpose was to construct a multipurpose convention and indoor sports facility. The term of commitment related to such pledged revenues extend to fiscal year 2022. Annual principal and interest payments on the bonds are expected to require less than 100% of estimated related net revenues. As of June 30, 2012, total principal and interest remaining on the debt is $57,000. Principal and interest paid was $6,000 for the year ended June 30, 2012. The pledged net revenue recognized for the year ended June 30, 2012 was $7,365. During fiscal year 2012, the proportion of pledged revenues needed to revenues collected was 81.5%.
The City has pledged all payments in lieu of taxes (PILOTs) and fifty per cent of the economic activity taxes (EATS) captured in the Argyle TIF district to pay debt outstanding on a portion of the Parking Revenue Bonds Series 2006 associated with the Argyle parking garage construction. The term of commitment related to such pledged revenues extend to fiscal year 2022. Annual principal and interest payments on the bonds are expected to require less than 100% of estimated related net revenues. As of June 30, 2012, total principal and interest outstanding on this portion of the debt is $9,612. The pledged net revenue recognized for the year ended June 30, 2012 related to the collection of PILOTs and EATs was $1,216. During fiscal year 2012, the proportion of pledged revenues needed to revenues collected was 100%.
The City has pledged all payments in lieu of taxes (PILOTs) and fifty per cent of the economic activity taxes (EATS) captured in the Euclid-Buckingham TIF district to pay debt outstanding on a portion of the Parking Revenue Bonds Series 2006 associated with the Euclid-Buckingham parking garage construction. The term of commitment related to such pledged revenues extend to fiscal year 2022. Annual principal and interest payments on the bonds are expected to require less than 100% of estimated related net revenues. As of June 30, 2012, total principal and interest outstanding on this portion of the debt is $9,304. The pledged net revenue recognized for the year ended June 30, 2012 related to the collection of PILOTs and EATs was $294. During fiscal year 2012, the proportion of pledged revenues needed to revenues collected was 100%.

City of St. Louis, Missouri Notes to Basic Financial Statements
June 30, 2012 (dollars in thousands)
107
The City has pledged general fund police parking ticket revenues to the Parking Revenue Bonds Series 2006 and Series 2007 in parity with the Parking Division to make up any shortfall of other committed sources. The term of commitment related to such pledged revenues extend to fiscal year 2038. As of June 30, 2012, total principal and interest remaining on the debt is $46,998. During fiscal year 2012, revenue from the police parking ticket revenues totaled $1,223. During fiscal year 2012, $0 of general fund revenues were used to meet the debt service requirements and the Parking Division has a payable to the City for this payment. See footnote 18b.
b. Business-type activities
Airport
The Airport has pledged future specific revenue streams, net of specified operating expenses, to secure the repayment of $833,960 in various long-term debt issuances, as outlined in note 17. The general purpose of the various long-term debt issuances is for land acquisition and construction of the capital assets at the Airport. The bonds are payable from Airport net revenues and are payable through 2034. Annual principal and interest payments on the bonds are expected to require less than 80% of estimated Airport net revenues. As of June 30, 2012, the total principal and interest remaining to be paid on the bonds is $1,316,276. Principal and interest paid was $61,486 for the year ended June 30, 2012. The pledged net revenue recognized for the year ended June 30, 2012 was $79,646.
Water
The Water Division has pledged specific revenue streams to secure repayment of the Water Revenue Refunding Bonds (Series 2011 Bonds). The bonds were issued for the purpose of funding various Water Division infrastructures. As of June 30, 2012, the remaining principal and interest requirement is $11,737, payable through July 2014 (fiscal year 2015). Fiscal year 2012 net revenues were $57,870 so the proportion of pledged revenue to revenue collected is estimated at 8.8% at June 30, 2012.
Parking
The Parking Division has pledged net Parking Division project revenues and net Parking Division revenues to secure the repayment the City of St. Louis Parking Revenue Bonds, Series 2006 and 2007. The general purpose of the bonds is to build parking facilities in the City. As of June 30, 2012, the remaining principal and interest requirement is $93,997, payable through fiscal year 2034. Fiscal year 2012 net revenues were $6,170 so that the proportion of pledged revenues needed to revenues collected was 100% for fiscal year 2012.
19. SHORT-TERM DEBT
a. City
The City issued $70,000 of general fund Tax and Revenue Anticipation notes dated July 5, 2011 and redeemed June 29, 2012. The purpose of the notes is to improve cash flow to allow more prompt vendor payments and encourage additional vendors to bid on City business.
Short-term debt activity for the year ended June 30, 2012 was as follows:

City of St. Louis, Missouri Notes to Basic Financial Statements
June 30, 2012 (dollars in thousands)
108
Balance BalanceJune 30, June 30,
2011 Issued Redeemed 2012
Tax revenue anticipation notes $ — 70,000 (70,000) — $ — 70,000 (70,000) —
20. OPERATING LEASES
a. At June 30, 2012, the City was committed under miscellaneous operating leases for office space and equipment. Future minimum base rental payments under terms of the operating leases are as follows:
Year ending June 30:2013 $ 589 2014 501 2015 428 2016 350 2017 307 2018 – 2022 604 2023 – 2027 250 2028 – 2029 17
$ 3,046
Rental and lease expenditures for the fiscal year 2012 totaled $3,493.
b. Airport – Use Agreements and Leases with Signatory Air Carriers
Effective July 1, 2011, the Airport entered into new long-term use and lease agreements with signatory air carriers that will expire on June 30, 2016. Under the terms of the use agreements and leases, the air carriers have agreed to pay airfield landing fees; terminal and concourse rentals; hangar, cargo, and maintenance facility rentals; and certain miscellaneous charges in consideration for use of the Airport. The use and lease agreements also require the Airport to make certain capital improvements and to provide maintenance of certain Airport facilities. Payments by the air carriers are determined as follows:
• Landing fees are calculated based on estimated operating and maintenance expenses of the airfield, and allocated to the air carriers on the basis of landing weights. Landing fee revenues are adjusted each year by retroactive rate adjustment, which is calculated as the difference between estimated and actual costs incurred and estimated and actual landing weights. These revenues are included in aviation revenue—airfield.
• Rentals are calculated based on estimated operating and maintenance expenses of the terminal and concourse areas and hangars, cargo, and maintenance facilities, and allocated to the air carriers on

City of St. Louis, Missouri Notes to Basic Financial Statements
June 30, 2012 (dollars in thousands)
109
the basis of square footage utilized. Rental revenue is adjusted each year by retroactive rate adjustment, which is calculated as the difference between estimated and actual costs incurred. These revenues are included in aviation revenues.
• Miscellaneous income is derived from the air carriers for their use of sanitary disposal facilities and airline service buildings.
During fiscal year 2012, revenues from signatory air carriers accounted for 55% of total Airport operating revenues.
Minimum future rentals for each year in the next five years and in the aggregate are not determinable given the method of calculation.
The following is a summary of aviation revenue by category and source from signatory and non-signatory air carriers for the year ended June 30, 2012:
Non-Signatory signatory Total
Airfield $ 51,669 12,561 64,230 Terminal and concourses 19,644 2,819 22,463 Hangars and other buildings 271 610 881 Cargo buildings 590 366 956
$ 72,174 16,356 88,530
No assurance can be given as to the levels of aviation activity that will be achieved at the Airport in future fiscal years. Future traffic at the Airport is sensitive to a variety of factors including: (1) the growth in the population and the economy of the area served by the Airport (2) national and international political and economic conditions, including the effects of any past or future terrorist attacks; (3) air carrier economics and air fares; (4) the availability and price of aviation fuel; (5) air carrier service and route networks; (6) the capacity of the air traffic control system; and (7) the capacity of the Airport/airways system.
The level of aviation activity at the Airport can have a material impact on the amount of total revenues generated at the Airport. However, Airport management believes the risk of significant variance in Airport revenues is mitigated by the Airport Use Agreements, concession agreements, and other leases, which contain minimum annual revenue guarantees.

City of St. Louis, Missouri Notes to Basic Financial Statements
June 30, 2012 (dollars in thousands)
110
The Airport also leases facilities and land with varying renewal privileges to various non-signatory air carriers, concessionaires, and others. These leases, for periods ranging from 1 to 50 years, require the payment of minimum annual rentals. The following is a schedule by year of minimum future rentals on non-cancelable operating leases, other than leases with signatory airlines, pursuant to long-term use agreements:
Year(s) ending June 30:2013 $ 19,533 2014 17,715 2015 11,626 2016 4,900 2017 4,629 2018 – 2022 16,674 2023 – 2027 4,961 2028 – 2032 4,961 2033 – 2037 1,601
Total minimum future rentals $ 86,600
The above amounts do not include contingent rentals that may be received under certain leases. Such contingent rentals amounted to $3,912 for the year ended June 30, 2012.
Deferred lease revenue included in Airport long-term liabilities in the amount of $6,031 represent the up front lease revenues received by the Airport for the lease of certain land.
The Airport leases computer and other equipment and has service agreements under non-cancelable arrangements that expire at various dates through 2014. Expenses for operating leases and service agreements were $114 for the year ended June 30, 2012. Future minimum payments are as follows:
Year ending June 30:2013 $ 43 2014 31 2015 21 2016 12
Total minimum future rentals $ 107
c. Component Unit—SLDC
During the year ended June 30, 2011, SLDC signed a sub-lease agreement with the City that commenced March 1, 2012 until June 30, 2031 with rental payments of $620 per year for the first 10 years and variable amounts for the remaining 10 years.

City of St. Louis, Missouri Notes to Basic Financial Statements
June 30, 2012 (dollars in thousands)
111
Future minimum base rents under the terms of the lease agreements, net of sublease rents anticipated from CDA and PDA, are as follows:
Year ending June 30:2013 $ 620 2014 620 2015 620 2016 620 2017 620 2018 – 2021 2,480
$ 5,580
Additionally, at June 30, 2012, SLDC was committed through February 2012 under an original 25-year operating lease with the City, which requires annual rental payments of $1 (in dollars) for certain property. Under the lease agreement, SLDC shall make improvements to the leased premises and award subleases for all or a portion of the leased premises. Sublease revenue is retained by SLDC for use at the site.

City of St. Louis, Missouri Notes to Basic Financial Statements
June 30, 2012 (dollars in thousands)
112
21. INTERFUND BALANCES
Individual fund interfund receivable and payable balances as of June 30, 2012 are as follows:
Receivable Fund Payable Fund Amount
General fund Capital projects fund $ 14,410 Special revenue—Grants fund 9,094 Other governmental nonmajor funds 870 Enterprise: Airport 1,985 Water Division 1,233 Parking Division 1,600 Internal service funds 78
29,270 Other governmental
nonmajor funds General fund 2,348 Capital projects fund 339 Other governmental nonmajor funds 1,031
3,718
Internal service funds General fund 288 Other governmental nonmajor funds 12 Enterprise: Airport 2,884 Water Division 2,319 Parking Division 269
5,772 $ 38,760
All of these interfund balances are due to either timing differences or due to the elimination of negative cash balances within the various funds. All interfund balances are expected to be repaid during the fiscal year ending June 30, 2012.
Advances to/from other funds as of June 30, 2012 are as follows:
Advance from Advance to AmountGeneral fund Internal Service Fund $ 18,296

City of St. Louis, Missouri Notes to Basic Financial Statements
June 30, 2012 (dollars in thousands)
113
22. INTERFUND TRANSFERS
Interfund transfers for the year ended June 30, 2012 consisted of the following:
Transfer ToOther
Capital Govern-General Projects mental Parking Grants
Fund Fund Funds Division Fund TotalGeneral fund $ — 7,776 2,314 — — 10,090 Grants fund 9 — — — — 9 Capital Projects fund 927 — — — 307 1,234 Other Governmental
Transfer Funds 29,443 10,742 1,208 828 — 42,221 From
Parking 800 — — — — 800 Airport 6,097 — — — — 6,097 Water Division 3,297 — — — — 3,297
$ 40,573 18,518 3,522 828 307 63,748
Interfund transfers were used to: (1) move revenues from the fund that ordinance or budget requires to collect them to the fund that ordinance or budget requires to expend them, (2) use unrestricted revenues collected in the general fund to finance capital improvements and other funds in accordance with budgetary authorization, or (3) move revenues in excess of current year expenditures to other funds. Additionally, gross receipt payments from the Airport and the Water Division are handled as transfers from each respective enterprise fund to the general fund.
23. COMMITMENTS AND CONTINGENCIES
a. Grants
In connection with various federal, state, and local grant programs, the City is obligated to administer related programs and spend the grant moneys in accordance with regulatory restrictions and is subject to audit by the grantor agencies. In cases of noncompliance, the agencies involved may require the City to refund program moneys. Through June 30, 2012, claims have been made on the City to make refunds under certain programs and other programs are still open as to compliance determination by the respective agencies. In the opinion of City officials, settlement of these matters will not result in a material liability to the City.
b. Commitments
At June 30, 2012, the City had outstanding commitments amounting to approximately $58,565, resulting primarily from service agreements.
Additionally, at June 30, 2012, the Airport had outstanding commitments amounting to approximately $76,623 resulting primarily from contracts for construction projects.

City of St. Louis, Missouri Notes to Basic Financial Statements
June 30, 2012 (dollars in thousands)
114
c. Encumbrances
Encumbrances are commitments related to unperformed contracts for goods or services. Encumbrances outstanding at year end are not accounted for as expenditures and liabilities, but are included in fund balance. As of June 30, 2012 encumbrances of $1,509 were reported in the general fund, $21,408 in the capital projects services fund and $4,623 in the other governmental funds.
d. American Airlines and Southwest Airlines
American Airlines (American) and Southwest Airlines (Southwest) represent the major air carriers providing air passenger service at the Airport.
American provided 13% of the Airport’s total operating revenues and 24% of total revenues from signatory air carriers for the fiscal year ended June 30, 2012. Accounts receivable at June 30, 2012 contained of $1,361 relating to amounts owed to the Airport by American. These amounts include $463 of unbilled aviation revenues at June 30, 2012.
Southwest provided 26% of the Airport’s total operating revenues and 47% of total revenues from signatory air carriers for the fiscal year ended June 30, 2012. Accounts receivable at June 30, 2012 contained of $(386) relating to amounts owed to the Airport by Southwest. These amounts include $1,609 of unbilled aviation revenues at June 30, 2012.
e. Asbestos Removal
The Water Division has identified certain of its structures as having asbestos in place. As part of its continuing process of upgrading facilities, the costs for removal of the asbestos material and restoration or replacement of the affected areas are being included in budgets for capital projects. No mandatory time requirement is in effect. The removal plan would be accelerated by changes in plans for remodeling, if any.
f. Parking Capital Commitments and Subsequent Events
The Parking Commission, on May 3, 2011, authorized $1.5 million for improvements to the Kiel Garage, Upper City Hall Lot, and other miscellaneous parking-related improvements. These improvements are being made to ensure the parking facilities are ready to accommodate patrons for the Peabody Opera House. The Peabody Opera House (formerly, Kiel Opera House) had their opening night gala on October 1, 2011. As of June 30, 2012, the Parking Division has included $1,007 in construction work in progress relating to these capital improvements while $92 remains in construction commitments. Work was completed and opened to the public on July 27, 2012.
On February 24, 2012, the Parking Division entered into a retail lease agreement with SJS, LLC d/b/a Maurizio’s Pizza to lease a portion of the retail space on the first floor of the Justice Garage. Under the terms of that lease, as Landlord, the Parking Division agreed to make certain improvements to the space. As of June 30, 2012, the Parking Division had incurred $1,006 in costs under this agreement. These costs are included in the construction work in progress at June 30, 2012. The restaurant opened for business on July 30, 2012. Maurizio’s had the first right of refusal on the remaining retail space in the Justice Garage. On August 3, 2012, they signed an amendment to their lease for the remaining

City of St. Louis, Missouri Notes to Basic Financial Statements
June 30, 2012 (dollars in thousands)
115
space. The Parking Divisions cost to bring the space up to the standard “white box” condition has yet been determined.
On June 10, 2010, several employees who were part of an outsourcing of the meter collections, filed suit against the Parking Division. On August 24, 2012, the Court found the Parking Division liable by outsourcing the duties of employees. The damage portion remains to be tried and the Parking Division intends to vigorously defend itself.
g. Component Unit—SLDC
In the normal course of its operations, certain lawsuits and legal action are pending against SLDC. In the opinion of SLDC officials and legal counsel, these items are not expected to have a material effect, individually or in the aggregate, upon the financial position or the results of operations of SLDC. In addition, certain properties held for development may be subject to future environmental remediation costs. In the opinion of SLDC officials, these costs would not have a material adverse effect upon the financial position or the results of operations of SLDC.
SLDC has entered into various cooperative agreements with the City as a subrecipient/administrator of the Community Development Block Grant Programs. The purpose of these grants and contracts is to provide support for economic development in the City. Revenues from these contracts amounted to $5,639 during the year ended June 30, 2012.
SLDC has received five allocation awards of New Market Tax Credit (NMTC) investment authority pursuant to Section 45D of the internal Revenue Code: a Round 2, $52 million (in dollars) allocation received in 2005, a Round 6, $45 million allocation in October 2008, and a Round 7, $65 million allocation received in October 2009, a Round 8, $21 million allocation in February 2011, and a Round 9, $50 million allocation received in February 2012 from the Department of the Treasury’s Community Development Financial Institutions Fund (CDFI). The NMTC program allows individuals and corporate taxpayers to receive a credit against federal income taxes in exchange for making a qualified entity investment in a qualified active low-income community business (QALICB). In order to qualify for the credits various federal requirements must be complied with. SLDC was required to create Community Development Entities (CDE) so as to demonstrate its mission of serving low-income residents and its accountability to the low income community. The NMTC program requires the credits to be transferred to the QALICB’s by for-profit partnerships or corporations for federal tax purposes. To comply with this provision, SLDC created 40 subsidiary CDEs – St. Louis Market Tax Credit Fund, LLCI through XL with the intent that each NMTC to be allocated would be assigned its own CDE. The entire Round 2 and Round 6 allocations have been sub-allocated to projects as of June 30, 2012. Six of the Round 7 transactions have closed leaving just $13.5 million in remaining credits from that allocation. None of the Round 8 ($21 million) or Round 9 ($50 million) allocations have closed, although the remaining $84.5 million in credits either are in underwriting or are committed to high impact projects in the City.
h. Component Units—SLDC and SLPD
SLDC and SLPD receive financial assistance from several federal, state, and local government agencies in the form of grants and contracts. The disbursements of funds received under these programs generally require compliance with terms and conditions specified in the contract and grant

City of St. Louis, Missouri Notes to Basic Financial Statements
June 30, 2012 (dollars in thousands)
116
agreements and are subject to audit by the granting agencies. Any disallowed claims resulting from such audits could become an SLDC or SLPD liability. However, in the opinion of their respective management, any such disallowed claims will not have a material effect on the financial statements of SLDC or SLPD at June 30, 2012.
24. RISK MANAGEMENT
a. Primary Government
The City is exposed to various risks of loss related to torts; theft of, damage to, and destruction of assets; errors and omissions; injuries to employees; and natural disasters. The City is self-insured with respect to its obligation to provide workers’ compensation, general liability, unemployment benefits, and prescription drug coverage. Effective February 1, 2003, the City became self-insured for property damage caused by garbage and refuse trucks. The City has sovereign tort immunity from liability and suit for compensatory damages for negligent acts or omissions, except in the case of injuries arising out of the operation of City motor vehicles or caused by the condition of City property. The maximum claim settlement established by state statute for such claims is $300 per person and $2,000 per occurrence. Various claims and legal actions involving the City are presently pending. Additionally, a number of legal suits against SLPD are presently pending for alleged wrongful personal injuries, civil rights violations, and negligence in the line of duty. The City’s policy is to record these claims in its government-wide financial statements when it is probable that a liability has been incurred and the amount can be reasonably estimated.
For workers’ compensation and general liability, the estimated liability for payment of incurred (both reported and unreported) but unpaid claims and claim adjustment expenditures of $24,277 at June 30, 2012, relating to these matters is recorded in the self-insurance internal service fund—PFPC. The City obtains periodic funding valuations from a claims-servicing company managing the appropriate level of estimated claims liability. Enterprise funds reimburse PFPC on a cost-reimbursement basis.
The City is self-insured for the prescription drug coverage provided to employees and retirees. The estimated liability for payment of incurred but unpaid claims and claim adjustment expenditures of $556 at June 30, 2012 relating to such matters is recorded in the self-insurance internal service fund—health.
Additionally, as of June 30, 2012, the following claims were recorded/accrued within the noted funds because the claims are not accounted for within the PFPC internal service fund; Water in the amount of $34 and General fund in the amount of $307.
The City maintains a blanket surety bond covering all City employees through PFPC. In addition, the City purchases commercial insurance for property damage for large City buildings and some contents. Damage and liability coverage is applicable to the Airport. There were no significant changes in coverage for the year ended June 30, 2012 and, for the years ended June 30, 2012 and 2011 settlements did not exceed coverage.

City of St. Louis, Missouri Notes to Basic Financial Statements
June 30, 2012 (dollars in thousands)
117
Changes in the self-insurance claims liability for the years ended June 30, 2012 and 2011 are as follows:
CurrentYear Claims
Beginning and Changes Claim EndingBalance in Estimates Payments Balance
2012 $ 24,789 17,570 (17,526) 24,833 2011 $ 22,636 17,683 (15,530) 24,789
Additionally, there is an estimate of general liability claims outstanding of $10,107 - $17,498 which the City Counselor’s office has determined there is a reasonable possibility that a loss contingency may be incurred but no accrual has been made within the government-wide financial statements or fund financial statements because the loss is not both probable and estimateable.
b. Component Unit—SLPD
SLPD is exposed to various risks of loss related to torts; theft of, damage to, and destruction of assets; errors and omissions; injuries to employees; and natural disasters. A number of legal suits against SLPD are presently pending for alleged wrongful personal injuries, civil rights violations, and negligence in the line of duty.
During fiscal year 2005, the Court of Appeals for the State of Missouri affirmed that under Missouri State Statutes, Chapter 84, the SLPD is an agency of the state. As an agency of the state, the SLPD was covered by the State of Missouri’s legal expense fund for most general liability and various other claims and legal actions occurring prior to August 28, 2005. On August 28, 2005, Missouri legislations became effective modifying the coverage provided to the SLPD by the State of Missouri for general liability and various other claims and legal actions. State of Missouri Bill No. 420 provides that the State of Missouri is liable annually for funding general liability claims on an equal share basis per claim with the Public Facilities Protection Corporation (PFPC), an internal service fund of the City, up to a maximum of $1,000. The SLPD is covered by PFPC for most self-insured risks, including general liability and various other claims and legal actions, exceeding the limitations set forth by the enacted legislation. Accounting for and funding of these self-insured risks is generally covered by the City. At June 30, 2012, $3,223 to $3,323 of claims with a reasonable possibility of adverse outcome was not covered by PFPC. No amounts have been accrued within the accompanying financial statements for these claims.
SLPD has established a risk management program and retains the risk related to workers’ compensation. At June 30, 2012, these liabilities amounted to $15,579 for workers’ compensation. Of SLPD’s total worker’s compensation liability, $4,654 has been accrued for benefits to be paid for long-term medical care for an officer seriously injured in the line of duty. Benefit payments for this case amounted to approximately $515 for the year ended June 30, 2012.

City of St. Louis, Missouri Notes to Basic Financial Statements
June 30, 2012 (dollars in thousands)
118
Changes in the balances of claims payable and workers’ compensation claims liabilities during fiscal years ended June 30, 2012 and 2011 were as follows:
Incurredclaims and
Beginning changes in Claimof year estimates payments End of year
Claims payable:2012 $ 271 128 (271) 128 2011 — 271 — 271
Worker's compensation claims:2012 $ 16,883 1,507 (2,811) 15,579 2011 17,018 3,048 (3,183) 16,883
The SLPD obtains periodic funding valuations from a third-party administrator who manages workers’ compensation claims to maintain the appropriate level of estimated claims liability. The SLPD also purchases excess liability coverage for workers’ compensation claims.
25. GRANT LOAN PROGRAMS
The City’s general fund and grants fund include the activities of the CDA that, among other activities, makes loans to developers under the Housing Implementation Program. This program, which is administered for the City by certain financial institutions, provides funds to rehabilitate housing units for low- and moderate-income families. These loans typically are noninterest bearing, due in 25 years, and secured by a second deed of trust. CDA also made loans under the Urban Development Action Grant (UDAG) program to assist organizations with development projects within the City. These loans typically have a lower-than-market interest rate and payback periods ranging from 10 to 40 years after completion of the projects.
Any funds received from the repayments of these loans are to be spent by the City in accordance with Community Development Block Grant program regulations. Since repayment of the loans is dependent on the success of projects that involve considerable risk, collectability is not assured, and accordingly, the City reflects these loans as an expenditure of the grants fund in the year the loans are made. Any loan repayments are reflected as intergovernmental revenue (or deferred revenue if moneys have not been spent) in the year of receipt.
26. COMPONENT UNIT—SLDC CONDUIT DEBT
SLDC facilitates the issuance of tax-exempt bonds for various private enterprises and government agencies. After the bonds are sold, the proceeds are typically used to purchase real estate or fund capital improvements for the respective organization. These organizations enter into lease agreements with SLDC that are, in substance, sales of the related properties or improvements. SLDC assigns these leases to various trusts that collect the lease payments to satisfy the debt service requirements. After SLDC assigns the leases

City of St. Louis, Missouri Notes to Basic Financial Statements
June 30, 2012 (dollars in thousands)
119
to the trusts, the properties are no longer under their control and they have no liability for the bonds. Therefore, transactions related to the leases and the bond liability are not presented in SLDC’s financial statements. The amount of tax-exempt bonds outstanding at June 30, 2011 could not be determined; however, the original issue amounts totaled approximately $2.5 billion (in dollars).
27. FUND BALANCE
The following table displays the breakdown of fund balance by purpose in accordance with GASB Statement No. 54:
Capital Other General Projects Grant Governmental
Fund Fund Funds Fund TotalNonspendable:
Health and welfare $ — — — 10 10 Parks and recreation — — — 1 1
Total Nonspendable — — — 11 11 Restricted:
Redevelopment — — — 27,361 27,361 Streets and bridges — 3,413 — 44 3,457 Public safety — 8,798 — 1,076 9,874 Parks and recreation — 4,262 — 3,855 8,117 Convention and tourism — 8,362 — — 8,362 Transportation — — — 5,225 5,225 Debt service 16,755 1,373 — 8,187 26,315 Other — 7,458 — 159 7,617
Total Restricted 16,755 33,666 — 45,907 96,328 Committed:
Health and welfare — — — 12,616 12,616 Streets and bridges — 3,246 — 1,913 5,159 Public safety — 973 — 6,156 7,129 Parks and recreation — 6,452 — 2,447 8,899 Convention and tourism — — — 4,180 4,180 Debt service 1,711 — — — 1,711 Payroll reserve 6,352 — — — 6,352 Other — 14,279 — 2,291 16,570
Total Committed 8,063 24,950 — 29,603 62,616 Assigned:
Redevelopment — — — 1,432 1,432 Health and welfare — — — 106 106 Streets and bridges — — — 25 25 Public safety — — — 120 120 Parks and recreation — — — 107 107 Convention and tourism — — — 18 18 Other 1,509 — — 29 1,538
Total Assigned 1,509 — — 1,837 3,346 Unassigned 29,543 (24,439) (62) 4,398 9,440 Total Fund Balance $ 55,870 34,177 (62) 81,756 171,741

City of St. Louis, Missouri Notes to Basic Financial Statements
June 30, 2012 (dollars in thousands)
120
28. FUTURE ACCOUNTING PRONOUNCEMENTS
In November 2010, the GASB issued Statement No. 60, Accounting and Financial Reporting for Service Concession Arrangements. This Statement addresses service concession arrangements, which are a type of public-private partnership. The City is required to implement this Statement beginning with the year ending June 30, 2013.
In November 2010, the GASB issued Statement No. 61, The Financial Reporting Entity Omnibus, an amendment of GASB Statements No. 14 and No. 34. This Statement modifies existing requirements for the assessment of potential component units in determining what should be included in the financial report entity display and disclosure requirements. The City is required to implement this Statement beginning with the year ending June 30, 2013.
In December 2010, the GASB issued Statement No. 62, Codification of Accounting and Financials Reporting Guidance Contained in Pre-November 30, 1989 FASB and AICPA Pronouncements. The objective of this Statement is to incorporate into the GASB's authoritative literature certain accounting and financial reporting guidance that is included in the following pronouncements issued on or before November 30, 1989, which does not conflict with or contradict GASB pronouncements: Financial Accounting Standards Board (FASB) Statements and Interpretations, Accounting Principles Board Opinions, and Accounting Research Bulletins of the American Institute of Certified Public Accountants' (AICPA) Committee on Accounting Procedure. The City is required to implement this Statement beginning with the year ending June 30, 2013.
In June 2011, the GASB issued Statement No. 63, Financial Reporting of Deferred Outflows of Resources, Deferred Inflows of Resources, and Net Position. The objective of this Statement is to provide guidance for reporting deferred outflows of resources, deferred inflows of resources, and net position in a statement of financial position and related disclosures. The City is required to implement this Statement beginning with the year ending June 30, 2013.
In March 2012, the GASB issued Statement No. 65, Items Previously Report as Assets and Liabilities. This Statement establishes accounting and financial reporting standards that reclassify, as deferred outflows of resources or deferred inflows of resources, certain items that were previously reported as assets and liabilities and recognizes, as outflows of resources or inflows of resources, certain items that were previously reported as assets and liabilities. This Statement also provides other financial reporting guidance related to the impact of the financial statement elements deferred outflows of resources and deferred inflows of resources, such as changes in the determination of the major fund calculations and limiting the use of the term deferred in financial statement presentations. The City is required to implement this Statement beginning with the year ending June 30, 2014.
In March 2012, the GASB issued Statement No. 66, Technical Corrections – 2012. The objective of this Statement is to improve accounting and financial reporting for a governmental financial reporting entity by resolving conflicting guidance that resulted from the issuance of two pronouncements, Statements No. 54, Fund Balance Reporting and Governmental Fund Type Definitions, and No. 62, Codification of Accounting and Financial Reporting Guidance Contained in Pre-November 30, 1989 FASB and AICPA Pronouncements. The City is required to implement this Statement beginning with the year ending June 30, 2014.

City of St. Louis, Missouri Notes to Basic Financial Statements
June 30, 2012 (dollars in thousands)
121
In June 2012, the GASB issued Statement No. 67, Financial Reporting for Pension Plans. The objective of this Statement is to improve financial reporting by state and local governmental pension plans. The City is required to implement this Statement beginning with the year ending June 30, 2014.
In June 2012, the GASB issued Statement No. 68, Accounting and Financial Reporting for Pensions. The primary objective of this Statement is to improve accounting and financial reporting by state and local governments for pensions. It also improves information provided by state and local governmental employers about financial support for pensions that is provided by other entities. The City is required to implement this Statement beginning with the year ending June 30, 2015.
29. SUBSEQUENT EVENTS
a. Tax and Revenue Anticipation Notes
The City issues tax and revenue anticipation notes in advance of property tax collections, depositing the proceeds in its general fund. On July 12, 2012, the City issued $65,000 in Tax and Revenue Anticipation Notes payable from the general fund. The notes mature on May 30, 2013 and bear interest at a rate of 2.00% per year.
b. Tax Increment Revenue Notes
Subsequent to June 30, 2012, the City issued tax increment revenue notes totaling $28,516 with interest rates ranging from 6.01% to 6.37%.
c. American Airlines Bankruptcy
AMR Corporation and certain of its affiliates, including American Airlines, Inc. (AA), filed for Chapter 11 Bankruptcy on November 29, 2011. Since AA is now in bankruptcy, they can reject their existing leases with the Airport. Through negotiations with the Airport, AA could also amend or modify these leases as well as other contractual-type agreements. The Airport did not want AA to reject these leases and agreements because this would have meant the other airlines doing business at the Airport would have to make up this lost revenue. Therefore, the Airport requested that we enter into negotiations to amend and/or modify the existing leases and agreements. AA agreed and, after several months, a Settlement Agreement has been drafted as well as other necessary lease amendments. The Airport is taking this Settlement Agreement through the legislative process for approval. AA will take it to the Bankruptcy Court for approval, after AA provides notice of the Settlement Agreement and opportunity to object to their creditors.
d. SLPD Local Control
A local control measure, Proposition A, was passed by the voters at the November 2012 general election. This proposition will pass local control of the SLPD to the City on July 1, 2013.
Before the City establishes it’s own municipal police force, the City must adopt an ordinance accepting responsibility, ownership, and liability as successor-in-interest for contractual obligations, indebteness, and other lawful obligations of the Board of Police Commissioners (Board).

City of St. Louis, Missouri Notes to Basic Financial Statements
June 30, 2012 (dollars in thousands)
122
Upon the establishment of a municipal police force by the City, the Board shall convey, assign, and otherwise transfer to the City title and ownership of all indebteness and assets, including, but not limited to, all funds and real and personal property held in the name of or controlled by the Board. The Board shall execute all documents reasonably required to accomplish such transfer of ownership and obligations.
The City shall employ, without a reduction in rank, salary, or benefits, all commissioned and civilian personnel of the Board that were employed prior to the date the municipal police force was established. Such commissioned personnel who previously were employed by the Board may only be involuntarily terminated by the City for cause. The City shall also recognize all accrued years of service that such commissioned and civilian personnel had with the Board. Such personnel shall be entitled to the same holidays, vacation, and sick leave they were entitled to as employees of the Board.
Commissioned and civilian personnel who were previously employed by the Board shall continue to be subject, throughout their employment with the City, to a residency rule no more restrictive than a requirement of retaining a primary residency in the City for a total of seven years and then allowing them to maintain a primary residence outside the City so as long as the residence is located within a one-hour response time.
The City shall provide or contact for life insurance coverage and for insurance benefits providing health, medical, and disability coverage for commissioned and civilian personnel of the municipal police force to the same extent as provided by the Board.
The city shall provide or contract for medical and life insurance coverage for any commissioned or civilian personnel who retire from the City to the same extent such medical and life insurance coverage was provided by the Board.
The City shall make available medical and life insurance coverage for purchase to the spouses or dependents of commissioned and civilian personnel who retire from service with the Board or the City and deceased commissioned and civilian personnel who receive pension benefits under section RSMO 86.200 to 86.366 at the rate that such dependent’s or spouse’s coverage would cost under the appropriate plan if the deceased were living.

123
Variance withFinal Final Budget
Original Revised PositiveBudget Budget Actual (Negative)
REVENUESTaxes:
Gross receipts $ 6,417 6,417 7,075 658 City earnings 141,199 141,199 151,006 9,807 Franchise 50,614 50,614 50,126 (488) Sales 46,474 46,474 50,366 3,892 Property 54,570 54,570 52,178 (2,392) Payroll 33,934 33,934 34,429 495 Motor vehicle 2,933 2,933 2,790 (143) Other 437 437 815 378
Total taxes 336,578 336,578 348,785 12,207
Licenses and permits:Graduated business 6,721 6,721 6,724 3 Cigarette 1,391 1,391 1,484 93 Building division 6,096 6,096 4,498 (1,598) Communication transmission 1,395 1,395 1,421 26 Liquor 458 458 476 18 Other 641 641 775 134 Motor vehicle 1,387 1,387 1,409 22
Total licenses and permits 18,089 18,089 16,787 (1,302)
Intergovernmental:Motor fuel tax allocation 9,800 9,800 8,854 (946) Juvenile detention center 2,136 2,136 2,080 (56) Public safety 6,330 6,330 5,525 (805) Other intergovernmental 417 417 442 25
Total intergovernmental 18,683 18,683 16,901 (1,782)
Charges for services:Parks and recreation 301 301 376 75 Streets 15,639 15,639 17,145 1,506 Public safety 6,162 6,162 5,522 (640) Health 1,169 1,169 771 (398) Fee offices 4,209 4,209 4,403 194 Other 23 23 15 (8) Services provided to other funds 3,944 3,944 3,903 (41)
Total charges for services 31,447 31,447 32,135 688
Court fines and forfeitures 7,741 7,741 5,518 (2,223)
Interest 152 152 9 (143)
Miscellaneous 3,693 3,693 4,128 435
Total revenues 416,383 416,383 424,263 7,880 EXPENDITURES 314,995 320,167 318,620 1,547
Excess of revenues over expenditures 101,388 96,216 105,643 9,427 Other financing sources (uses):
Transfers in 33,625 33,625 33,409 (216) Transfers to component units (133,260) (133,260) (125,535) 7,725 Transfers out (8,734) (7,412) (8,601) (1,189) Total other financing sources (uses), net (108,369) (107,047) (100,727) 6,320 Excess (deficiency) of revenues and
other financing sources overexpenditures and other financing uses $ (6,981) (10,831) 4,916 15,747
See accompanying independent auditors' report.
City of St. Louis, MissouriSchedule of Revenues, Expenditures, and Changes in Fund Balances -
For the year ended June 30, 2012(dollars in thousands)
Budget and Actual - General FundUNAUDITED

124
Variance withFinal Actual Final Budget
Original Revised Personal Other Total PositiveBudget Budget Services Expenditures Expenditures (Negative)
General government:110 Board of Alderman $ 2,748 2,765 2,561 183 2,744 21 120 Mayor's Office 1,718 1,728 1,486 160 1,646 82 123 Department of Personnel 2,744 2,887 2,558 194 2,752 135 124 Registrar 167 172 163 7 170 2 126 Civil Rights Enforcement Agency 297 297 269 11 280 17 127 Information Technology Service Agency 5,317 5,067 3,099 1,987 5,086 (19) 137 Division of the Budget 417 420 383 4 387 33 139 City Counselor 5,037 5,237 2,679 2,812 5,491 (254) 141 Planning and Urban Design 113 114 114 - 114 - 160 Comptroller 7,381 8,301 4,222 3,362 7,584 717 162 Municipal Garage 293 301 286 19 305 (4) 163 Microfilm Section 319 319 255 43 298 21 170 Supply Commissioner 647 670 657 12 669 1 171 Multigraph Section 816 816 504 239 743 73 330 Tax Equalization Board 12 12 6 - 6 6 333 Recorder of Deeds 2,612 2,612 2,285 168 2,453 159 334 Election and Registration 2,483 2,483 1,665 554 2,219 264 340 Treasurer 698 698 638 19 657 41
Prior year encumbrance 741 741 - - - 741 Sub total general government 34,560 35,640 23,830 9,774 33,604 2,036
190 City-Wide Accounts 7,045 7,345 7,229 2,289 9,518 (2,173) Total general government 41,605 42,985 31,059 12,063 43,122 (137)
Convention and tourism:930 Soldier's Memorial Building 140 140 121 1 122 18
Total convention and tourism 140 140 121 1 122 18 Parks and recreation:
210 Director of Parks, Recreation and Forestry 481 502 462 39 501 1 213 Division of Recreation 1,473 1,506 1,346 125 1,471 35 214 Division of Forestry 7,175 7,266 6,689 501 7,190 76 220 Division of Parks 7,866 7,866 7,642 399 8,041 (175) 225 Soulard Market 226 219 106 82 188 31 250 Tower Grove Park 684 684 - 684 684 -
Total parks and recreation 17,905 18,043 16,245 1,830 18,075 (32) (continued)
(dollars in thousands)
City of St. Louis, MissouriSchedule of Expenditures -
Budget and Actual - General Fund
For the year ended June 30, 2012UNAUDITED

125
Variance withFinal Actual Final Budget
Original Revised Personal Other Total PositiveBudget Budget Services Expenditures Expenditures (Negative)
(dollars in thousands)
City of St. Louis, MissouriSchedule of Expenditures -
Budget and Actual - General Fund
For the year ended June 30, 2012UNAUDITED
Judicial:310 Circuit Court (Circuit Judges) $ 911 911 146 718 864 47 311 Circuit Court (General) 7,141 7,141 4,156 2,657 6,813 328 312 Circuit Attorney 6,618 6,738 6,263 455 6,718 20 313 Board of Jury Supervisors 1,381 1,381 475 900 1,375 6 314 Probate Court 48 48 - 34 34 14 315 Sheriff 8,729 8,729 8,362 311 8,673 56 316 City Courts 2,551 2,551 1,890 337 2,227 324 317 City Marshal 1,349 1,349 1,222 38 1,260 89 320 Probation Department and Juvenile
Detention Center 16,244 16,244 14,260 1,453 15,713 531 321 Drug Court 211 211 - 33 33 178
Prior year encumbrance 71 71 - 65 65 6 Total judicial 45,254 45,374 36,774 7,001 43,775 1,599
Streets:510 Director of Streets 937 939 917 17 934 5 511 Transportation and Traffic Division 8,161 8,405 4,728 3,936 8,664 (259) 513 Auto Towing and Storage 1,516 1,609 1,379 215 1,594 15 514 Street Division 6,717 6,624 4,567 1,647 6,214 410 516 Refuse Division 16,453 15,957 7,423 8,471 15,894 63
Prior year encumbrance 113 113 - 113 113 - Total streets 33,897 33,647 19,014 14,399 33,413 234
Public safety - fire:611 Fire Department Operations 48,280 48,610 46,963 1,903 48,866 (256) 612 Firemen's Retirement System 16,634 15,434 15,203 - 15,203 231
Total public safety - fire 64,914 64,044 62,166 1,903 64,069 (25) Public safety - other:
610 Director of Public Safety 644 664 648 12 660 4 614 Office of Special Events 164 170 170 - 170 - 616 Excise Commissioner 404 411 397 16 413 (2) 620 Building Commissioner 7,056 7,911 7,330 567 7,897 14 622 Neighborhood Stabilization 2,464 2,543 2,415 124 2,539 4 625 City Emergency Management Agency 273 319 296 16 312 7
(continued)

126
Variance withFinal Actual Final Budget
Original Revised Personal Other Total PositiveBudget Budget Services Expenditures Expenditures (Negative)
(dollars in thousands)
City of St. Louis, MissouriSchedule of Expenditures -
Budget and Actual - General Fund
For the year ended June 30, 2012UNAUDITED
632 Medium Security Institution $ 14,831 15,705 10,057 5,607 15,664 41 633 City Jail 17,899 18,731 13,364 6,187 19,551 (820) 651 Police Retirement System 17,492 17,492 17,446 - 17,446 46
Total public safety-other 61,227 63,946 52,123 12,529 64,652 (706) Health and welfare:
335 Medical Examiner 1,835 1,835 803 980 1,783 52 800 Director of Human Services 1,255 1,272 1,140 100 1,240 32
Total health and welfare 3,090 3,107 1,943 1,080 3,023 84 Public services:
900 President's Office, Board of Public Services 2,404 2,451 2,029 160 2,189 262 903 Building Operations 9,982 9,632 2,394 6,617 9,011 621 910 Equipment Services Division 12,621 12,621 3,796 9,454 13,250 (629)
Total public services 25,007 24,704 8,219 16,231 24,450 254 Debt service:
Principal 16,662 16,863 - 16,662 16,662 201 Interest and fiscal charges 5,294 7,314 - 7,257 7,257 57
Total debt service 21,956 24,177 - 23,919 23,919 258 Total expenditures $ 314,995 320,167 227,664 90,956 318,620 1,547
See accompanying independent auditors' report.

Schedule 2 City of St. Louis, Missouri
Notes to Schedule of Revenues, Expenditures, and Changes in Fund Balances Budget and Actual – General Fund – UNAUDITED
For the Year ended June 30, 2012 (Dollars in thousands)
127 (continued)
1. EXPLANATION OF BUDGETARY PROCESS
The City prepares annual budgets for the general fund, the debt service fund, the capital projects fund, and the following nonmajor special revenue funds: use tax fund, transportation fund, convention and tourism fund, licensed gaming program fund, assessor’s office fund, lateral sewer program fund, tax increment financing fund, communications division fund, public safety trust fund, public safety sales tax fund, parks and recreation and other budgeted special revenue fund. An annual budget is not prepared for the grants major special revenue fund.
The City follows the procedures outlined below in establishing the budgetary data:
1) On or before 60 days prior to the start of each fiscal year, the Budget Director submits to the Board of Estimate and Apportionment (E&A), which consists of the Mayor, the Comptroller, and the President of the Board of Aldermen, for approval and submission to the Board of Aldermen (Board), a proposed annual operating budget for the fiscal year commencing the following July 1. The operating budgets include proposed expenditures and the means of financing them at the sub-fund level. A public hearing is held by E&A in order to afford citizens an opportunity to be heard on the proposed budget. The Board may reduce any item, except amounts fixed by state statute or for the payment of principal or interest of the City debt or for meeting any ordinance obligations, but may not increase such amount nor insert new items. Expenditures may not legally exceed appropriations at the fund level; however, supplemental appropriations may be made by the Board.
2) The annual operating budgets are adopted by the affirmative vote of a majority of the members of the Board and approval by the Mayor on or before the last day of the preceding budget year. In the event the Board has not acted upon the proposed budget ordinance by this time, the budgets, as recommended by E&A or in its absence, the submission by the Budget Director, shall be considered to be adopted and approved by the Board.
3) During the year, with the approval of E&A, the City may transfer part or all of any encumbered appropriation balance among programs within a department, office, or agency, without approval of the Board. Legislative action is required by the Board when the budget for an entire fund is to be increased. The amount of such transfers during the year was not significant.
4) If it is determined that there are revenues in excess of those estimated in the budget that are available for appropriation, the Board may, by ordinance, make supplemental appropriations for the year up to the amount of such excess.
5) At the end of each budget period, all unencumbered appropriated balances lapse, with the exception of appropriations for capital improvements that lapse upon completion of the related capital improvement project.

Schedule 2, Continued City of St. Louis, Missouri
Notes to Schedule of Revenues, Expenditures, and Changes in Fund Balances Budget and Actual – General Fund – UNAUDITED (continued)
For the year ended June 30, 2012 (Dollars in thousands)
128
2. EXPLANATION OF THE DIFFERENCES BETWEEN THE EXCESS/(DEFICIENCY) OF REVENUES AND OTHER FINANCING SOURCES OVER EXPENDITURES AND OTHER FINANCING USES— BUDGET BASIS AND NET CHANGE IN FUND BALANCE—GAAP BASIS
The City’s budgetary process is based upon accounting for certain transactions on a basis other than accounting principles generally accepted for governmental entities in the United States of America (GAAP). To provide a meaningful comparison of actual results with the budget, the actual results of operations are presented in the Schedule of Revenues, Expenditures, and Changes in Fund Balances—Budget and Actual—General Fund in accordance with the budget basis of accounting.
The major differences between the budget and GAAP bases of accounting are:
1) Revenues are recorded when received in cash (budget), as opposed to when they are measurable and available (GAAP).
2) Expenditures are recorded when paid (budget), as opposed to when the obligation is incurred (GAAP).
3) Certain activities and funds of the general, special revenue, and capital projects fund types are not included in the annual operating budgets adopted by the Board.
Adjustments necessary to reconcile the excess (deficiency) of revenues and other financing sources over expenditures and other financing uses from the GAAP basis to the budget basis of accounting are as follows:
Budget basis $ 4,916 Increase (decrease) due to:
Revenue accruals 5,012 Expenditure accruals (4,925) Unbudgeted activities and funds 1,519
GAAP basis $ 6,522
See accompanying independent auditors’ report.

Schedule 3 City of St. Louis, Missouri
Retirement Systems and Other Postemployment Benefit Plans Required Supplementary Information –
UNAUDITED June 30, 2012
(dollars in thousands)
129
Firemen’s Retirement System of St. Louis
The following required supplementary information relates to the Firemen’s Retirement System of St. Louis defined benefit pension plan:
UAALUnfunded as a
Actuarial Actuarial PercentageValue of Actuarial Accrued Annual of
Actuarial System Accrued Liability Funded Covered CoveredValuation Assets Liability (UAAL) Ratio Payroll Payroll
Date (a) (b) (b-a) (a/b) (c) (b-a/c)10/1/11 404,101$ 430,755$ 26,654$ 93.8% 37,157$ 71.7%10/1/10 407,028 439,352 32,324 92.6 40,789 79.2%10/1/09 449,655 487,313 37,657 92.3 42,052 89.5%
Police’s Retirement System of St. Louis
The following required supplementary information relates to the Police’s Retirement System of St. Louis defined benefit pension plan:
UAALUnfunded as a
Actuarial Actuarial PercentageValue of Actuarial Accrued Annual of
Actuarial System Accrued Liability Funded Covered CoveredValuation Assets Liability (UAAL) Ratio Payroll Payroll
Date (a) (b) (b-a) (a/b) (c) (b-a/c)10/1/11 695,422$ 855,618$ 160,196$ 81.3% 67,594$ 237.0%10/1/10 718,137 814,927 96,790 88.1 71,095 136.1%10/1/09 727,139 799,587 72,448 90.9 68,573 105.7%
Note: The actuarial required contribution for the Police’s Retirement System is calculated using the aggregate actuarial cost method. Information in this schedule is calculated using the entry age actuarial cost method as a surrogate for the funding progress of the plan.

Schedule 3, Continued City of St. Louis, Missouri
Retirement Systems and Other Postemployment Benefit Plans Required Supplementary Information –
UNAUDITED June 30, 2012
(dollars in thousands)
130
Employees’ Retirement System of the City of St. Louis
The following required supplementary information relates to the Employees’ Retirement System of the City of St. Louis defined benefit pension plan:
UAALUnfunded as a
Actuarial Actuarial PercentageValue of Actuarial Accrued Annual of
Actuarial System Accrued Liability Funded Covered CoveredValuation Assets Liability (UAAL) Ratio Payroll Payroll
Date (a) (b) (b-a) (a/b) (c) (b-a/c)10/1/11 661,932$ 841,763$ 179,831$ 78.6% 223,061$ 80.6%10/1/10 671,609 820,670 149,061 81.8 232,452 64.1%10/1/09 667,667 794,686 127,019 84.0 240,409 52.8%
SLPD – Other Postemployment Benefits Plan
The following required supplementary information relates to SLPDs postemployment benefits plan.
UAALUnfunded as a
Actuarial Actuarial PercentageValue of Actuarial Accrued Annual of
Actuarial System Accrued Liability Funded Covered CoveredValuation Assets Liability (UAAL) Ratio Payroll Payroll
Date (a) (b) (b-a) (a/b) (c) (b-a/c)7/1/11 - 443,392$ 443,392$ 0.0% 93,289$ 475.3%7/1/09 - 243,709 243,709 0.0 95,706 254.6%
See accompanying independent auditors’ report.

City of St. Louis, MissouriCombining Balance Sheet
Nonmajor Governmental FundsJune 30, 2012
(dollars in thousands)
131
Convention Licensed Lateral Collector Tax Other Demolitionand Gaming Assessor’s Sewer of Increment Redevelopment License and
Use Tax Transportation Tourism Program Office Program Revenue Financing Projects Collector Board-up
ASSETSCash and cash equivalents $ 11,557 — 1,342 1,701 291 1,315 785 23,271 34 1,634 1,815 Investments 841 — 97 123 21 693 — 1,266 1 — 133 Receivables, net of allowances:
Taxes 5,492 5,531 3,072 788 — — — 15,909 — — — Licenses and permits — — — — — — — — — — — Intergovernmental — — — — 417 — — 79 45 — — Charges for services — — — — — 770 — — — — — Notes and loans — — — — — — — — — — — Other — — — — — — — — — — 39
Other assets — — — — — — — — — — — Due from component units — — — — — — — — — — — Due from other funds — — — — — — — 3,516 202 — —
Total assets $ 17,890 5,531 4,511 2,612 729 2,778 785 44,041 282 1,634 1,987
LIABILITIES AND FUND BALANCESLiabilities:
Accounts payable and accrued liabilities $ 672 — — — 3 104 — 2 50 — 22 Accrued salaries and other benefits 396 — — — 153 17 — 16 — — — Due to component units — — — — — — — — — — — Due to other funds 10 306 347 — 2 — — — — — — Deferred revenue:
Property taxes — — — — — — — 15,462 — — — Other taxes — — — — — — — — — — — Other revenue — — — — 417 661 — — — — —
Unearned revenue — — — — — — — — — — 39 Other liabilities — — — — — — 785 — — — — Total liabilities 1,078 306 347 — 575 782 785 15,480 50 — 61
Fund balances:Nonspendable — — — — — — — — — — — Restricted — 5,225 — — 154 — — 28,561 232 1,634 — Committed — — 4,164 — — 1,996 — — — — 1,926 Assigned — — — — — — — — — — — Unassigned 16,812 — — 2,612 — — — — — — —
Total fund balances 16,812 5,225 4,164 2,612 154 1,996 — 28,561 232 1,634 1,926 Total liabilities and fund balances $ 17,890 5,531 4,511 2,612 729 2,778 785 44,041 282 1,634 1,987
See accompanying independent auditors’ report.
Continued
Special Revenue

City of St. Louis, MissouriCombining Balance Sheet
Nonmajor Governmental FundsJune 30, 2012
(dollars in thousands)
132
ASSETSCash and cash equivalents $InvestmentsReceivables, net of allowances:
TaxesLicenses and permitsIntergovernmentalCharges for servicesNotes and loansOther
Other assetsDue from component unitsDue from other funds
Total assets $
LIABILITIES AND FUND BALANCESLiabilities:
Accounts payable and accrued liabilities $Accrued salaries and other benefitsDue to component unitsDue to other fundsDeferred revenue:
Property taxesOther taxesOther revenue
Unearned revenueOther liabilitiesTotal liabilities
Fund balances:NonspendableRestrictedCommittedAssignedUnassigned
Total fund balancesTotal liabilities and fund balances $
See accompanying independent auditors’ report.
Other Other TotalPublic Public Parks Budgeted Nonbudgeted Total Debt OtherSafety Safety and Special Special Special Service GovernmentalFund Sales Tax Recreation Revenue Revenue Revenue Fund Fund
298 2,590 4,638 — 1,429 52,700 2,488 55,188 22 189 97 — 849 4,332 5,581 9,913
— 2,763 691 1,726 — 35,972 6,714 42,686 175 — — — — 175 — 175 — — — 146 39 726 — 726 — — — 629 5 1,404 — 1,404 — — — — 46 46 — 46 — — — 5 1 45 — 45 — — — 108 — 108 — 108 — — — — — — — — — — — — — 3,718 — 3,718
495 5,542 5,426 2,614 2,369 99,226 14,783 114,009
1 115 109 215 33 1,326 — 1,326 26 — 128 224 — 960 — 960 — — — — 1,103 1,103 — 1,103 — 301 77 870 — 1,913 — 1,913
— — — — — 15,462 6,401 21,863 — — — — — — 245 245 55 — — 344 — 1,477 — 1,477 — — — 2,542 — 2,581 — 2,581 — — — — — 785 — 785 82 416 314 4,195 1,136 25,607 6,646 32,253
— — — — — — — — — — 5,112 — — 40,918 8,137 49,055
413 5,126 — — — 13,625 — 13,625 — — — — — — — — — — — (1,581) 1,233 19,076 — 19,076
413 5,126 5,112 (1,581) 1,233 73,619 8,137 81,756 495 5,542 5,426 2,614 2,369 99,226 14,783 114,009
Special Revenue

City of St. Louis, MissouriCombining Statements of Revenues, Expenditures, and Changes in Fund Balances
Nonmajor Governmental FundsYear ended June 30, 2012
(dollars in thousands)
133
Convention Licensed Lateral Collector Tax Other Demolitionand Gaming Assessor’s Sewer of Increment Redevelopment License and
Use Tax Transportation Tourism Program Office Program Revenue Financing Projects Collector Board-up
REVENUESTaxes $ 30,081 36,982 12,871 9,407 2,018 — — 21,811 711 — — Licenses and permits — — — — — — — — — — — Intergovernmental — — — — — — — 2,169 173 — — Charges for services, net — — — — 8 2,533 7,672 — — 1,853 10 Investment income 13 — — — — 3 23 1 — — — Miscellaneous 16 — — 1,000 — — 225 3,012 — — 1,314
Total 30,110 36,982 12,871 10,407 2,026 2,536 7,920 26,993 884 1,853 1,324
EXPENDITURESGeneral government 125 — 135 — 3,908 53 7,835 1,067 7 1,795 — Convention and tourism — — — — — — — — — — — Parks and recreation — — — — — — — — — — 49 Judicial — — — — — — — — — — — Streets 600 — — 600 — — — — — — — Public safety:
Fire — — — 8 — — — — — — — Police 3,500 — — 4,350 — — — — — — — Police-Pension — — — — — — — — — — — Other 3,467 — — — — — — — — — 635
Health and welfare 15,876 — — — — — — — — — — Public services — 37,352 — — — 2,531 — — — — — Community development — — — — — — — 50,646 555 — — Capital outlay — — — — — — — — — — — Debt service:
Principal — — — 175 — — — 8,336 165 — — Interest and fiscal charges — — — — — — — 15,013 895 — —
Total expenditures 23,568 37,352 135 5,133 3,908 2,584 7,835 75,062 1,622 1,795 684 Excess (deficiency) of revenues over expenditures 6,542 (370) 12,736 5,274 (1,882) (48) 85 (48,069) (738) 58 640
OTHER FINANCING SOURCES (USES)Issuance of tax increment revenue notes — — — — — — — 51,101 — — — Issuance of contractual obligation with component unit — — — — — — — — — — — Payment to redeem tax increment financing note — — — — — — — — — — — Transfers in — — — — 1,448 — — 106 1,063 — 30 Transfers out (165) — (11,207) (5,915) (58) (7) (85) (5,857) (106) (22) — Total other financing sources (users), net (165) — (11,207) (5,915) 1,390 (7) (85) 45,350 957 (22) 30 Net change in fund balances 6,377 (370) 1,529 (641) (492) (55) — (2,719) 219 36 670 Fund balances:
Beginning of year 10,435 5,595 2,635 3,253 646 2,051 — 31,280 13 1,598 1,256 End of year $ 16,812 5,225 4,164 2,612 154 1,996 — 28,561 232 1,634 1,926
See accompanying independent auditors’ report.Continued
Special Revenue

City of St. Louis, MissouriCombining Statements of Revenues, Expenditures, and Changes in Fund Balances
Nonmajor Governmental FundsYear ended June 30, 2012
(dollars in thousands)
134
REVENUESTaxes $Licenses and permitsIntergovernmentalCharges for services, netInvestment incomeMiscellaneous
Total
EXPENDITURESGeneral governmentConvention and tourismParks and recreationJudicialStreetsPublic safety:
FirePolicePolice-PensionOther
Health and welfarePublic servicesCommunity developmentCapital outlayDebt service:
PrincipalInterest and fiscal charges
Total expendituresExcess (deficiency) of revenues over expenditures
OTHER FINANCING SOURCES (USES)Issuance of tax increment revenue notesIssuance of contractual obligation with component unitPayment to redeem tax increment financing noteTransfers inTransfers outTotal other financing sources (users), netNet change in fund balancesFund balances:
Beginning of yearEnd of year $
See accompanying independent auditors’ report.
Other Other TotalPublic Public Parks Budgeted Nonbudgeted Total Debt OtherSafety Safety and Special Special Special Service GovernmentalFund Sales Tax Recreation Revenue Revenue Revenue Fund Fund
— 18,003 4,486 18,260 — 154,630 5,681 160,311 3,031 — — 1,459 — 4,490 — 4,490
— — — 2,230 383 4,955 — 4,955 — — — 3,084 1,083 16,243 — 16,243 — — — — 9 49 4 53 — 646 4,000 891 590 11,694 — 11,694
3,031 18,649 8,486 25,924 2,065 192,061 5,685 197,746
458 — — 1,509 1,254 18,146 — 18,146 — — — — 27 27 — 27 — — 2,547 1,349 221 4,166 — 4,166
463 — — 2,310 140 2,913 — 2,913 — — — 160 237 1,597 — 1,597
— 750 — — — 758 — 758 2,100 3,590 — 287 — 13,827 — 13,827
— 2,273 — — — 2,273 — 2,273 — 580 — 2,231 214 7,127 — 7,127 — — — 282 288 16,446 — 16,446 — — — — 95 39,978 — 39,978 — — — — — 51,201 — 51,201 — — 35 112 — 147 — 147
— — 2,671 985 — 35 12,367 3,730 16,097 — 6,701 2,306 — 4 24,919 1,941 26,860
3,021 16,565 5,873 8,240 2,515 195,892 5,671 201,563 10 2,084 2,613 17,684 (450) (3,831) 14 (3,817)
— — — — — 51,101 — 51,101 — — — — — — — — — — — — — — — — — — 400 470 — 3,517 5 3,522 (15) (200) (21) (18,413) (150) (42,221) — (42,221) (15) (200) 379 (17,943) (150) 12,397 5 12,402 (5) 1,884 2,992 (259) (600) 8,566 19 8,585
418 3,242 2,120 (1,322) 1,833 65,053 8,118 73,171 413 5,126 5,112 (1,581) 1,233 73,619 8,137 81,756
Special Revenue

Nonmajor Governmental Funds
135
Special Revenue Funds Special revenue funds are used to account for specific revenues that are legally restricted to expenditure for particular purposes.
Use Tax – Used to record revenue received from the local use tax and expenditures made to promote health and welfare activities.
Transportation – Used to record sales tax revenue and expenditures for transportation purposes.
Convention and Tourism – Used to record revenue received from the one-cent restaurant tax, 3½% hotel tax, and football admission gross receipts and expenditures made to promote convention and tourism activities.
Licensed Gaming Program – Used to record revenue received from adjusted gross receipts and admissions taxes imposed on riverboat gaming excursion boats.
Assessor’s Office – Used to account for financial assistance received from the State of Missouri, commissions received from the collection of property taxes, and expenditures made to operate the Assessor’s office.
Lateral Sewer Program – Used to account for revenue received from charges on specific residential support within the boundaries of the City of St. Louis and expenditures made to repair lateral sewer service lines leading from the residential properties to any sewer main that is maintained by the Metropolitan St. Louis Sewer District.
Collector of Revenue – Used to account for operating receipts and disbursements of the Collector of Revenue’s office.
Tax Increment Financing – Used to account for the revenues, expenditures, and other activities relating to the tax increment financing districts.
Other Redevelopment Projects – Used to record the activity relating to funding associated with redevelopment projects other than Tax Increment Financing including the proceeds of the one-cent transportation sales tax collected on behalf of and remitted to the transportation development districts.
License Collector – Used to account for the operating receipts and disbursements of the License Collector’s office.
Demolition and Board-up – Used to record revenue received from the City’s insurance recovery program relative to its building demolition activities.
Public Safety Trust Fund – Used to account for revenues derived from an increase in the graduated business license to be used for enhanced public safety.
Public Safety Sales Tax – Used to account for revenues received from an increase of sales tax to be used for public safety.
Parks and Recreation – Used to account for revenues designated for parks and recreation.
Other Budgeted Special Revenue – Used to account for the activities of other less significant special revenue sources for which annual budgets are adopted.

Nonmajor Governmental Funds
136
Other Nonbudgeted Special Revenue – Used to account for the activities of other less significant special revenue sources for which annual budgets are not adopted.
Debt Service Fund The debt service fund is used to account for the accumulation of resources for, and the payment of, long-term debt principal, interest, and related costs.

137
Variance withFinal Final Budget
Original Revised PositiveBudget Budget Actual (Negative)
Revenues:Taxes $ 27,200 27,200 30,285 3,085Licenses and permits — — — — Intergovernmental — — — — Charges for service, net — — — — Court fines and forfeitures — — — — Investment income 22 22 13 (9) Miscellaneous 13 13 16 3
Total revenues 27,235 27,235 30,314 3,079
Expenditures:Current:
General government 118 118 121 (3) Convention and tourism — — — — Parks and recreation — — — — Judicial — — — — Streets 662 662 628 34 Public safety:
Fire — — — — Police 3,500 3,500 3,500 — Other 3,609 3,609 3,315 294
Health and welfare 24,983 24,983 17,156 7,827 Public service — — — —
Capital outlay — — — — Debt service — — — —
Total expenditures 32,872 32,872 24,720 8,152 Excess (deficiency) of revenues
over (under) expenditures (5,637) (5,637) 5,594 11,231Other financing sources (uses):
Transfers in — — — — Transfers out (30) (30) (30) —
(30) (30) (30) —
Net change in fund balances $ (5,667) (5,667) 5,564 11,231
See accompanying independent auditors' report.
(dollars in thousands)For the year ended June 30, 2012
City of St. Louis, MissouriUse Tax Special Revenue Fund - Nonmajor Fund
Schedule of Revenues, Expenditures, and Changes in Fund Balances -Budget and Actual
UNAUDITED

138
Variance withFinal Final Budget
Original Revised PositiveBudget Budget Actual (Negative)
Revenues:Taxes $ 39,177 39,177 37,354 (1,823)Licenses and permits — — — — Intergovernmental — — — — Charges for service, net — — — — Court fines and forfeitures — — — — Investment income 20 20 — (20) Miscellaneous — — — —
Total revenues 39,197 39,197 37,354 (1,843)
Expenditures:Current:
General government — — — — Convention and tourism — — — — Parks and recreation — — — — Judicial — — — — Streets — — — — Public safety:
Fire — — — — Police — — — — Other — — — —
Health and welfare — — — — Public service 39,177 39,177 37,352 1,825
Capital outlay — — — — Debt service — — — —
Total expenditures 39,177 39,177 37,352 1,825Excess (deficiency) of revenues
over (under) expenditures 20 20 2 (18)Other financing sources (uses):
Transfers in — — — — Transfers out (20) (20) — 20
(20) (20) — 20
Net change in fund balances $ — — 2 2
See accompanying independent auditors' report.
(dollars in thousands)For the year ended June 30, 2012
City of St. Louis, MissouriTransportation Special Revenue Fund - Nonmajor Fund
Schedule of Revenues, Expenditures, and Changes in Fund Balances -Budget and Actual
UNAUDITED

139
Variance withFinal Final Budget
Original Revised PositiveBudget Budget Actual (Negative)
Revenues:Taxes $ 11,342 11,342 12,421 1,079Licenses and permits — — — — Intergovernmental — — — — Charges for service, net — — — — Court fines and forfeitures — — — — Investment income — — — — Miscellaneous — — — —
Total revenues 11,342 11,342 12,421 1,079
Expenditures:Current:
General government 135 135 135 — Convention and tourism — — — — Parks and recreation — — — — Judicial — — — — Streets — — — — Public safety:
Fire — — — — Police — — — — Other — — — —
Health and welfare — — — — Public service — — — —
Capital outlay — — — — Debt service — — — —
Total expenditures 135 135 135 — Excess (deficiency) of revenues
over (under) expenditures 11,207 11,207 12,286 1,079Other financing sources (uses):
Transfers in — — — — Transfers out (11,207) (11,207) (11,207) —
(11,207) (11,207) (11,207) —
Net change in fund balances $ — — 1,079 1,079
See accompanying independent auditors' report.
(dollars in thousands)For the year ended June 30, 2012
City of St. Louis, MissouriConvention and Tourism Special Revenue Fund - Nonmajor Fund
Schedule of Revenues, Expenditures, and Changes in Fund Balances -Budget and Actual
UNAUDITED

140
Variance withFinal Final Budget
Original Revised PositiveBudget Budget Actual (Negative)
Revenues:Taxes $ 10,100 10,100 9,637 (463)Licenses and permits — — — — Intergovernmental — — — — Charges for service, net — — — — Court fines and forfeitures — — — — Investment income 1 1 — (1)Miscellaneous 1,000 1,000 1,000 —
Total revenues 11,101 11,101 10,637 (464)
Expenditures:Current:
General government — — — — Convention and tourism — — — — Parks and recreation — — — — Judicial — — — — Streets — — — — Public safety:
Fire 25 25 10 15 Police 4,350 4,350 4,350 — Other — — — —
Health and welfare — — — — Public service — — — —
Capital outlay — — — — Debt service 175 175 175 —
Total expenditures 4,550 4,550 4,535 15Excess (deficiency) of revenues
over (under) expenditures 6,551 6,551 6,102 (449)Other financing sources (uses):
Transfers in — — — — Transfers out (6,515) (6,515) (6,515) —
(6,515) (6,515) (6,515) —
Net change in fund balances $ 36 36 (413) (449)
See accompanying independent auditors' report.
(dollars in thousands)For the year ended June 30, 2012
City of St. Louis, MissouriLicensed Gaming Program Special Revenue Fund - Nonmajor Fund
Schedule of Revenues, Expenditures, and Changes in Fund Balances -Budget and Actual
UNAUDITED

141
Variance withFinal Final Budget
Original Revised PositiveBudget Budget Actual (Negative)
Revenues:Taxes $ 1,868 1,868 2,018 150Licenses and permits — — — — Intergovernmental 551 551 474 (77) Charges for service, net 10 10 8 (2)Court fines and forfeitures — — — — Investment income — — — — Miscellaneous — — — —
Total revenues 2,429 2,429 2,500 71
Expenditures:Current:
General government 3,932 3,932 3,930 2Convention and tourism — — — — Parks and recreation — — — — Judicial — — — — Streets — — — — Public safety:
Fire — — — — Police — — — — Other — — — —
Health and welfare — — — — Public service — — — —
Capital outlay — — — — Debt service — — — —
Total expenditures 3,932 3,932 3,930 2Excess (deficiency) of revenues
over (under) expenditures (1,503) (1,503) (1,430) 73Other financing sources (uses):
Transfers in 1,600 1,448 1,448 — Transfers out - - - —
1,600 1,448 1,448 —
Net change in fund balances $ 97 (55) 18 73
See accompanying independent auditors' report.
(dollars in thousands)For the year ended June 30, 2012
City of St. Louis, MissouriAssessor's Office Special Revenue Fund - Nonmajor Fund
Schedule of Revenues, Expenditures, and Changes in Fund Balances -Budget and Actual
UNAUDITED

142
Variance withFinal Final Budget
Original Revised PositiveBudget Budget Actual (Negative)
Revenues:Taxes $ — — — — Licenses and permits — — — — Intergovernmental — — — — Charges for service, net 2,521 2,521 2,520 (1)Court fines and forfeitures — — — — Investment income 5 5 3 (2)Miscellaneous — — — —
Total revenues 2,526 2,526 2,523 (3)
Expenditures:Current:
General government 57 57 58 (1) Convention and tourism — — — — Parks and recreation — — — — Judicial — — — — Streets — — — — Public safety:
Fire — — — — Police — — — — Other — — — —
Health and welfare — — — — Public service 2,806 2,806 2,607 199
Capital outlay — — — — Debt service — — — —
Total expenditures 2,863 2,863 2,665 198Excess (deficiency) of revenues
over (under) expenditures (337) (337) (142) 195Other financing sources (uses):
Transfers in — — — — Transfers out — — — —
— — — —
Net change in fund balances $ (337) (337) (142) 195
See accompanying independent auditors' report.
(dollars in thousands)For the year ended June 30, 2012
City of St. Louis, MissouriLateral Sewer Program Special Revenue Fund - Nonmajor Fund
Schedule of Revenues, Expenditures, and Changes in Fund Balances -Budget and Actual
UNAUDITED

143
Variance withFinal Final Budget
Original Revised PositiveBudget Budget Actual (Negative)
Revenues:Taxes 21,753 21,753 21,753 — Licenses and permits — — — — Intergovernmental 2,118 2,118 2,118 — Charges for service, net — — — — Court fines and forfeitures — — — — Investment income 1 1 1 — Miscellaneous 3,012 3,012 3,012 —
Total revenues 26,884 26,884 26,884 —
Expenditures:Current:
General government 1,828 1,828 1,828 — Convention and tourism — — — — Parks and recreation — — — — Judicial — — — — Streets — — — — Public safety:
Fire — — — — Police — — — — Other — — — —
Health and welfare — — — — Public service — — — — Community Development 53,489 53,489 53,489 —
Capital outlay — — — — Debt service 23,607 23,607 23,607 —
Total expenditures 78,924 78,924 78,924 — Excess (deficiency) of revenues
over (under) expenditures (52,040) (52,040) (52,040) — Other financing sources (uses):
Proceeds net of refunding 51,653 51,653 51,653 — Transfers in 1,169 1,169 1,169 — Transfers out (5,880) (5,880) (5,880) —
46,942 46,942 46,942 —
Net change in fund balances $ (5,098) (5,098) (5,098) —
See accompanying independent auditors' report.
(dollars in thousands)For the year ended June 30, 2012
City of St. Louis, MissouriTax Increment Financing Special Revenue Fund - Nonmajor Fund
Schedule of Revenues, Expenditures, and Changes in Fund Balances -Budget and Actual
UNAUDITED

144
Variance withFinal Final Budget
Original Revised PositiveBudget Budget Actual (Negative)
Revenues:Taxes $ — — — — Licenses and permits 3,041 3,041 3,058 17 Intergovernmental — — — — Charges for service, net — — — — Court fines and forfeitures — — — — Investment income — — — — Miscellaneous — — — —
Total revenues 3,041 3,041 3,058 17
Expenditures:Current:
General government 540 540 458 82 Convention and tourism — — — — Parks and recreation — — — — Judicial 541 541 477 64 Streets — — — — Public safety:
Fire — — — — Police 2,100 2,100 2,100 — Other — — — —
Health and welfare — — — — Public service — — — —
Capital outlay — — — — Debt service — — — —
Total expenditures 3,181 3,181 3,035 146Excess (deficiency) of revenues
over (under) expenditures (140) (140) 23 163Other financing sources (uses):
Transfers in — — — — Transfers out — — — —
— — — —
Net change in fund balances $ (140) (140) 23 163
See accompanying independent auditors' report.
(dollars in thousands)For the year ended June 30, 2012
City of St. Louis, MissouriPublic Safety Special Revenue Fund - Nonmajor Fund
Schedule of Revenues, Expenditures, and Changes in Fund Balances -Budget and Actual
UNAUDITED

145
Variance withFinal Final Budget
Original Revised PositiveBudget Budget Actual (Negative)
Revenues:Taxes $ 16,900 16,900 18,171 1,271Licenses and permits — — — — Intergovernmental — — — — Charges for service, net — — — — Court fines and forfeitures — — — — Investment income — — — — Miscellaneous — — — —
Total revenues 16,900 16,900 18,171 1,271
Expenditures:Current:
General government — — — — Convention and tourism — — — — Parks and recreation — — — — Judicial — — — — Streets — — — — Public safety:
Fire 750 750 750 — Police 5,863 5,863 5,863 — Other 800 800 531 269
Health and welfare — — — — Public service — — — —
Capital outlay — — — — Debt service 8,726 8,726 8,726 —
Total expenditures 16,139 16,139 15,870 269Excess (deficiency) of revenues
over (under) expenditures 761 761 2,301 1,540Other financing sources (uses):
Transfers in — — — — Transfers out (200) (200) (200) —
(200) (200) (200) —
Net change in fund balances $ 561 561 2,101 1,540
See accompanying independent auditors' report.
(dollars in thousands)For the year ended June 30, 2012
City of St. Louis, MissouriCity Public Safety Sales Tax Special Revenue Fund - Nonmajor FundSchedule of Revenues, Expenditures, and Changes in Fund Balances -
Budget and ActualUNAUDITED

146
Variance withFinal Final Budget
Original Revised PositiveBudget Budget Actual (Negative)
Revenues:Taxes $ 4,135 4,135 4,520 385Licenses and permits — — — — Intergovernmental — — — — Charges for service, net — — — — Court fines and forfeitures — — — — Investment income 1 1 — (1) Miscellaneous 2,000 2,000 4,000 2,000
Total revenues 6,136 6,136 8,520 2,384
Expenditures:Current:
General government — — — — Convention and tourism — — — — Parks and recreation 4,301 4,301 2,940 1,361 Judicial — — — — Streets — — — — Public safety:
Fire — — — — Police — — — — Other — — — —
Health and welfare — — — — Public service — — — —
Capital outlay 968 968 35 933 Debt service 3,276 3,276 3,276 —
Total expenditures 8,545 8,545 6,251 2,294Excess (deficiency) of revenues
over (under) expenditures (2,409) (2,409) 2,269 4,678Other financing sources (uses):
Transfers in 400 400 400 — Transfers out — — — —
400 400 400 —
Net change in fund balances $ (2,009) (2,009) 2,669 4,678
See accompanying independent auditors' report.
(dollars in thousands)For the year ended June 30, 2012
City of St. Louis, MissouriParks & Recreation Special Revenue Fund - Nonmajor Fund
Schedule of Revenues, Expenditures, and Changes in Fund Balances -Budget and Actual
UNAUDITED

147
Variance withFinal Final Budget
Original Revised PositiveBudget Budget Actual (Negative)
Revenues:Taxes $ 17,970 17,970 18,384 414Licenses and permits 2,383 2,383 1,440 (943)Intergovernmental 2,276 2,276 2,207 (69)Charges for service, net 5,349 5,349 4,402 (947)Court fines and forfeitures — — — — Investment income 6 6 — (6)Miscellaneous 963 963 886 (77)
Total revenues 28,947 28,947 27,319 (1,628)
Expenditures:Current:
General government 1,564 1,564 1,514 50Convention and tourism — — — — Parks and recreation 1,526 1,541 1,451 90Judicial 2,676 2,676 2,301 375Streets 209 209 165 44Public safety:
Fire — — — — Police 542 542 287 255Other 2,622 2,622 2,331 291
Health and welfare 707 707 255 452Public service 712 712 — 712
Capital outlay 155 140 139 1 Debt service — — — —
Total expenditures 10,713 10,713 8,443 2,270Excess (deficiency) of revenues
over (under) expenditures 18,234 18,234 18,876 642Other financing sources (uses):
Transfers in 272 272 470 198Transfers out (19,719) (19,719) (19,820) (101)
(19,447) (19,447) (19,350) 97
Net change in fund balances $ (1,213) (1,213) (474) 739
See accompanying independent auditors' report.
(dollars in thousands)For the year ended June 30, 2012
City of St. Louis, MissouriOther Budgeted Special Revenue Fund - Nonmajor Fund
Schedule of Revenues, Expenditures, and Changes in Fund Balances -Budget and Actual
UNAUDITED

148
Variance withFinal Final Budget
Original Revised PositiveBudget Budget Actual (Negative)
Revenues:Taxes $ 6,120 6,120 5,676 (444)Licenses and permits — — — — Intergovernmental — — — — Charges for service, net — — — — Court fines and forfeitures — — — — Investment income 10 10 6 (4)Miscellaneous — — — —
Total revenues 6,130 6,130 5,682 (448)
Expenditures:Current:
General government — — — — Convention and tourism — — — — Parks and recreation — — — — Judicial — — — — Streets — — — — Public safety:
Fire — — — — Police — — — — Other — — — —
Health and welfare — — — — Public service — — — —
Capital outlay — — — — Debt service 5,690 5,690 5,671 19
Total expenditures 5,690 5,690 5,671 19Excess (deficiency) of revenues
over (under) expenditures 440 440 11 (429)Other financing sources (uses):
Transfers in — — 5 5 Transfers out — — — —
— — 5 5
Net change in fund balances $ 440 440 16 (424)
See accompanying independent auditors' report.
(dollars in thousands)
Budget and Actual
City of St. Louis, MissouriDebt Service Fund – Nonmajor Fund
Schedule of Revenues, Expenditures, and Changes in Fund Balances –
Year ended June 30, 2012

149
Variance withFinal Final Budget
Original Revised PositiveBudget Budget Actual (Negative)
Revenues:Taxes $ 18,144 18,144 19,963 1,819Licenses and permits — — — — Intergovernmental 630 630 630 — Charges for service, net — — — — Court fines and forfeitures — — — — Investment income — — — — Miscellaneous 100 100 283 183
Total revenues 18,874 18,874 20,876 2,002
Expenditures:Current:
General government 1,045 661 — 661Convention and tourism — — — — Parks and recreation 4,306 3,844 1,587 2,257Judicial — — — — Streets 6,889 7,747 5,353 2,394Public safety:
Fire — — — — Police — — — — Other — — — —
Health and welfare — — — — Public service 11,830 11,338 4,940 6,398
Capital outlay 13,841 15,487 6,999 8,488Debt service 26,068 24,902 24,848 54
Total expenditures 63,979 63,979 43,727 20,252Excess (deficiency) of revenues
over (under) expenditures (45,105) (45,105) (22,851) 22,254Other financing sources (uses):
Sale of general fixed assets 250 250 345 95Transfers in 17,401 17,415 17,505 90Transfers out — — — —
17,651 17,665 17,850 185
Net change in fund balances $ (27,454) (27,440) (5,001) 22,439
See accompanying independent auditors' report.
(dollars in thousands)
City of St. Louis, MissouriCapital Projects Fund – Major Fund
Schedule of Revenues, Expenditures, and Changes in Fund Balances –
Year ended June 30, 2012Budget and Actual

150
City of St. Louis, MissouriSchedule of Reconciling Items Between Change in Fund Balances—Budget Basis and Change in Fund Balances—GAAP Basis
Year ended June 30, 2012(dollars in thousands)
Licensed Lateral Tax Public Other Budgeted Debt CapitalConvention Gaming Assessor’s Sewer Increment Public Safety Parks and Special Service Projects
Use Tax Transportation and Tourism Program Office Program Financing Safety Sales Tax Recreation Revenue Fund Fund
Net change in fund balances—budget basis $ 5,564 2 1,079 (413) 18 (142) (5,098) 23 2,101 2,669 (474) 16 (5,001)
Differences—budge t to GAAP:
Revenues are recorded whenreceived in cash on a budget basis.However, revenues are recorded whenmeasurable and available ona GAAP basis. (204) (372) 450 (230) (474) 13 1,197 (27) (168) (34) (79) 2 (238)
Expenditures are recorded whenpaid in cash on a budget basis.However, expenditures are recordedwhen the obligation is incurredon a GAAP basis. 1,017 — — 2 (36) 74 1,182 (1) (49) 357 294 — (106)
Certain activities and accounts,which are included within thefunds on a GAAP basis, are notincluded within the annualoperating budgets adoptedby the Board of Alderman. — — — — — — — — — — — 1 (49,608)
Net change in fund balances—GAAP basis $ 6,377 (370) 1,529 (641) (492) (55) (2,719) (5) 1,884 2,992 (259) 19 (54,953)
See accompanying independent auditors’ report.

Internal Service Funds
151
Internal service funds are used to account for the financing of goods or services provided by one department or agency to other departments or agencies of a government, or to other governments, on a cost-reimbursement basis.
Public Facilities Protection Corporation – Used to account for payment of workers’ compensation and various other claims against legal actions on behalf of other funds.
Mailroom Services – Used to account for mail handling services provided to other funds.
Health – Used to account for payment of prescription drug claims for participants.

152
City of St. Louis, MissouriCombining Statement of Net Assets
Internal Service FundsJune 30, 2012
(dollars in thousands)
Public FacilitiesProtection Mailroom
Corporation Services Health Total
ASSETSCurrent assets:
Cash and cash equivalents—unrestricted $ 341 — 2,263 2,604 Investments—unrestricted — — 165 165 Receivable, net of allowances:
Intergovernmental 543 — — 543 Prepaid assets — 52 — 52 Due from other funds 5,467 120 185 5,772 Due from component unit — — — — Advance from other funds 18,296 — — 18,296
Total current assets 24,647 172 2,613 27,432
Noncurrent assets:Capital assets — 108 — 108
Less accumulated depreciation — (70) — (70) Total capital assets (net of
accumulated depreciation) — 38 — 38 Total assets 24,647 210 2,613 27,470
LIABILITIESCurrent liabilities:
Accounts payable and accrued liabilities 370 34 — 404 Due to other funds — 78 — 78 Claims payable 24,277 — 556 24,833
Total current liabilities 24,647 112 556 25,315 Total liabilities 24,647 112 556 25,315
NET ASSETSInvested in capital assets — 38 — 38 Unrestricted — 60 2,057 2,117 Total net assets $ — 98 2,057 2,155
See accompanying independent auditors’ report.

153
City of St. Louis, MissouriCombining Statement of Revenues, Expenses, and Changes in Fund Net Assets
Internal Service FundsYear ended June 30, 2012
(dollars in thousands)
Public FacilitiesProtection Mailroom
Corporation Services Health Total
OPERATING REVENUESCharges for services $ 12,845 595 4,566 18,006 Intergovernmental 231 — — 231
Total operating revenues 13,076 595 4,566 18,237
OPERATING EXPENSESClaims incurred 11,622 — 6,455 18,077 Premiums 1,454 — — 1,454 Personal services — 261 — 261 Material and supplies — 283 — 283 Depreciation and amortization — 7 — 7
Total operating expenses 13,076 551 6,455 20,082 Operating income (loss) — 44 (1,889) (1,845)
NONOPERATING REVENUES (EXPENSES)Capital contributions — 21 — 21
Total nonoperating revenues (expenses), net — 21 — 21
Change in net assets — 65 (1,889) (1,824) Total net assets—beginning of year — 33 3,946 3,979 Total net assets—end of year $ — 98 2,057 2,155
See accompanying independent auditors’ report.

154
City of St. Louis, MissouriCombining Statement of Cash Flows
Internal Service FundsYear ended June 30, 2011
(dollars in thousands)
Public FacilitiesProtection Mailroom
Corporation Services Health Total
CASH FLOWS FROM OPERATING ACTIVITIESReceipts from interfund services provided $ 13,500 443 4,528 18,471 Payments to suppliers of goods and services (13,370) (183) (6,429) (19,982) Payments to employees — (260) — (260)
Net cash provided by (used in) operating activities 130 — (1,901) (1,771)
CASH FLOWS FROM INVESTING ACTIVITIES
Purchase of investments — — (165) (165)
Net cash used in investing activities — — (165) (165)
Net increase (decrease) in cash and cash equivalents 130 — (2,066) (1,936)
Cash and cash equivalents beginning of year 211 — 4,329 4,540 Cash and cash equivalents end of year $ 341 — 2,263 2,604
Reconciliation of operating income (loss) to net cashprovided by (used in) operating activities:
Operating income (loss) $ — 44 (1,889) (1,845) Adjustment to reconcile operating income (loss) to net cash
provided by (used in) operating activities:Depreciation — 7 — 7 Change in assets and liabilities:
Receivables, net 534 — — 534 Due to/from other funds (839) 11 (38) (866) Advance to other funds 729 — — 729 Prepaid assets — (6) — (6) Accounts payable and accrued liabilities (312) (56) — (368) Claims payable 18 — 26 44
Total adjustments 130 (44) (12) 74 Net cash provided by (used in) operating activities $ 130 — (1,901) (1,771)
Supplemental disclosure of non cash activities:Contributed capital $ — 21 — 21
See accompanying independent auditors’ report.

Pension Trust Funds
155
Pension trust funds are used to account for the activity of the three public employee retirement systems for which the City acts as a trustee.
Firemen’s System – A single employer public employee retirement system fund used to account for the accumulation of resources to be used for the pension and other benefit payments for City firefighters.
Police System – A single employer public employee retirement system fund used to account for the accumulation of resources to be used for pension and other benefit payments for City police officers.
Employees’ System – A multi-employer public employee retirement system used to account for the accumulation of resources to be used for pension and other benefit payments for employees of the City (excluding firefighters and police officers) and other anticipating governmental agencies. City employees account for greater than 99% of total plan participants.

156
City of St. Louis, MissouriCombining Statement of Fiduciary Net Assets
Pension Trust FundsJune 30, 2012
(dollars in thousands)
Firemen’s Police Employees’System System System Total
ASSETSCurrent assets:
Cash and cash equivalents—unrestricted $ 18,658 7,388 167 26,213 Investments—unrestricted:
Bonds — 165,739 91,117 256,856 Domestic bond funds — — 57,717 57,717 Stocks 181,400 100,782 178,214 460,396 Mortgage-backed securities — 22,032 — 22,032 Collective investment funds 118,123 206,275 — 324,398 Guaranteed fixed income securities — 527 — 527 Real estate equities and investment trust 42,802 21,518 59,981 124,301 Investment property — 1,444 — 1,444 Hedge funds 20,409 25,021 21,804 67,234 Money market mutual funds and other short
term investments 5,414 45,744 9,003 60,161 Managed international equity funds — — 165,282 165,282
Total investments 368,148 589,082 583,118 1,540,348
Securities lending collateral — — 11,678 11,678 Receivables:
Contributions 5,278 — 1,131 6,409 Accrued interest 236 964 939 2,139 Other 3,520 752 760 5,032
Capital assets, net 635 529 — 1,164 Total assets 396,475 598,715 597,793 1,592,983
LIABILITIESAccounts payable and accrued liabilities 591 932 528 2,051 Deposits held for others — 796 — 796 Securities lending collateral liability — — 11,678 11,678 Other liabilities 3,782 662 — 4,444
Total liabilities 4,373 2,390 12,206 18,969
NET ASSETSNet assets held in trust for pension benefits $ 392,102 596,325 585,587 1,574,014
See accompanying independent auditors’ report.
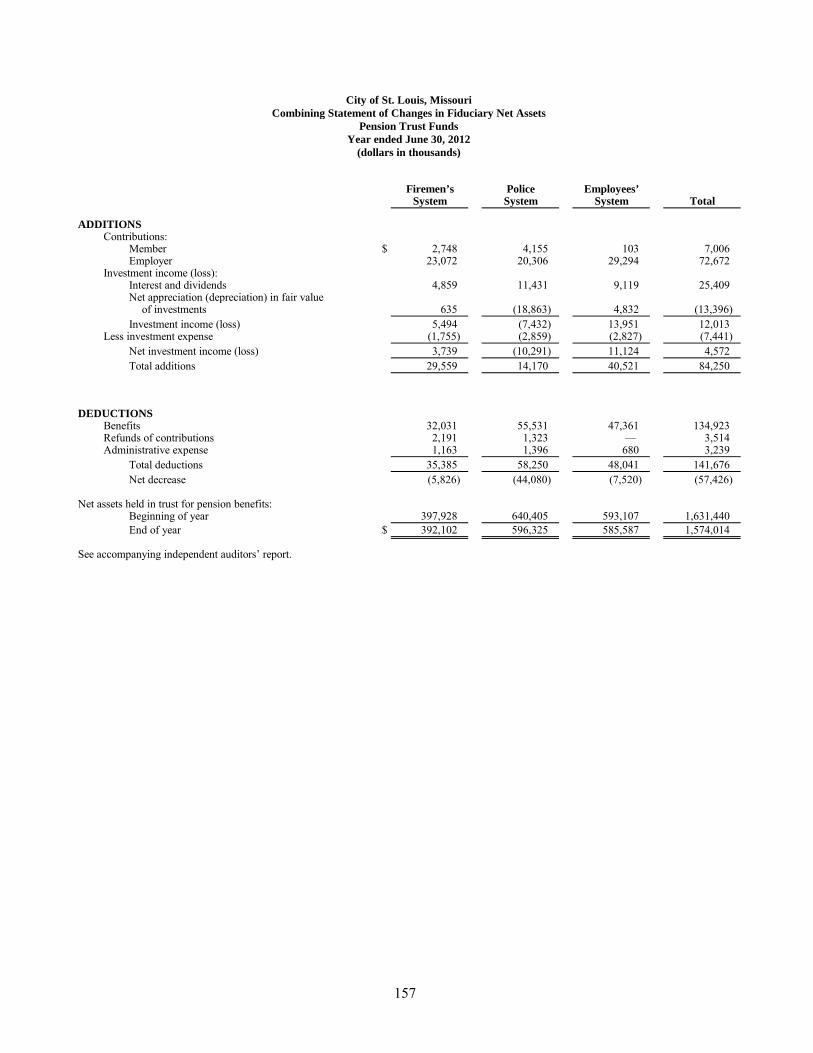
157
City of St. Louis, MissouriCombining Statement of Changes in Fiduciary Net Assets
Pension Trust FundsYear ended June 30, 2012
(dollars in thousands)
Firemen’s Police Employees’System System System Total
ADDITIONSContributions:
Member $ 2,748 4,155 103 7,006 Employer 23,072 20,306 29,294 72,672
Investment income (loss):Interest and dividends 4,859 11,431 9,119 25,409 Net appreciation (depreciation) in fair value
of investments 635 (18,863) 4,832 (13,396) Investment income (loss) 5,494 (7,432) 13,951 12,013
Less investment expense (1,755) (2,859) (2,827) (7,441) Net investment income (loss) 3,739 (10,291) 11,124 4,572 Total additions 29,559 14,170 40,521 84,250
DEDUCTIONSBenefits 32,031 55,531 47,361 134,923 Refunds of contributions 2,191 1,323 — 3,514 Administrative expense 1,163 1,396 680 3,239
Total deductions 35,385 58,250 48,041 141,676 Net decrease (5,826) (44,080) (7,520) (57,426)
Net assets held in trust for pension benefits:Beginning of year 397,928 640,405 593,107 1,631,440 End of year $ 392,102 596,325 585,587 1,574,014
See accompanying independent auditors’ report.

Agency Funds
158
Agency funds are used to account for assets which the City holds on behalf of other entities. Agency funds are custodial in nature (assets equal liabilities) and do not involve the measurement of results of operations.
Collector of Revenue – Used to account for the receipt and disbursement of various taxes and other charges that are collected by the Collector of Revenue and remitted to various City funds and other governmental agencies that levy taxes on residents of the City and on corporations located within the City limits and the employees.
Property Tax Escrow – Used to account for property taxes paid under protest whose disposition is still pending and duplicate payments of property taxes which have not been claimed.
General Insurance – Used to control funds for payroll withholdings and other City deposits to be used for the payment of insurance premiums due from employees and the City.
Bail Bonds – Used to account for bail bonds deposited by court defendants. The bonds are held until court orders are issued to refund the bonds to the defendants or others.
License Collector – Used to account for the receipt and disbursement of municipal manufacturer’s and hotel taxes that are collected by the License Collector and remitted to various City funds and other governmental agencies.
Circuit Clerk – Used to account for funds held in a fiduciary capacity by the Circuit Clerk’s Office. These funds include various litigation fees, garnishments, and bail bonds, in addition to funds related to the parent locator program.
Other Agency – Used to account for contracts and other deposits, union dues, land auction sales, circuit attorney and probate court funds.

159
City of St. Louis, MissouriCombining Statement of Fiduciary Net Assets
Agency FundsJune 30, 2012
(dollars in thousands)
Collector Propertyof Tax General Bail License Circuit Other
Revenue Escrow Insurance Bonds Collector Clerk Agency Total
ASSETS
Cash and cash equivalents $ 2,116 2,402 — 1,377 5,309 13,681 4,688 29,573 Receivables, net of allowances:
Taxes 28,104 — — — — — — 28,104 Other — — 1,312 — — — — 1,312
Total assets 30,220 2,402 1,312 1,377 5,309 13,681 4,688 58,989
LIABILITIESAccounts payable and accrued liabilities — — 1,312 — — — 591 1,903 Deposits held for others — 2,402 — 1,377 4,409 11,276 3,168 22,632 Due to other governmental agencies 30,220 — — — 900 2,405 929 34,454
Total liabilities 30,220 2,402 1,312 1,377 5,309 13,681 4,688 58,989
NET ASSETS $ — — — — — — — —
See accompanying independent auditors’ report.

160
City of St. Louis, MissouriCombining Statement of Changes in
Assets and Liabilities—Agency FundsFor the Year ended June 30, 2012
(dollars in thousands)
Balance BalanceJune 30, June 30,
2011 Additions Deductions 2012
Collector of Revenue
Assets:Cash and cash equivalents $ 2,206 357,080 (357,170) 2,116 Receivables, net of allowances—taxes 27,777 11,220 (10,893) 28,104
Total assets $ 29,983 368,300 (368,063) 30,220
Liabilities—due to other governmental agencies $ 29,983 368,300 (368,063) 30,220 Total liabilities $ 29,983 368,300 (368,063) 30,220
Property Tax Escrow
Assets—cash and cash equivalents $ 2,399 2,869 (2,866) 2,402
Liabilities—deposits held for others $ 2,399 2,869 (2,866) 2,402
General Insurance
Assets:Cash and cash equivalents $ - 32,419 (32,419) - Receivables, net of allowances—other 1,067 1,312 (1,067) 1,312
Total assets $ 1,067 33,731 (33,486) 1,312
Liabilities—accounts payable and accrued liabilities $ 1,067 33,731 (33,486) 1,312
Bail Bonds
Assets—cash and cash equivalents $ 1,395 1,184 (1,202) 1,377
Liabilities—deposits held for others $ 1,395 1,184 (1,202) 1,377
License Collector
Assets—cash and cash equivalents $ 5,335 20,151 (20,177) 5,309
Liabilities:Deposits held for others $ 4,603 3,028 (3,222) 4,409 Due to other governmental agencies 732 17,123 (16,955) 900
Total liabilities $ 5,335 20,151 (20,177) 5,309

161
City of St. Louis, MissouriCombining Statement of Changes in
Assets and Liabilities—Agency FundsFor the Year ended June 30, 2012
(dollars in thousands)
Balance BalanceJune 30, June 30,
2011 Additions Deductions 2012Circuit Clerk
Assets—cash and cash equivalents $ 12,790 22,109 (21,218) 13,681
Liabilities:Deposits held for others $ 10,533 18,439 (17,696) 11,276 Due to other governmental agencies 2,257 3,670 (3,522) 2,405
Total liabilities $ 12,790 22,109 (21,218) 13,681
Other Agency
Assets—cash and cash equivalents $ 3,390 39,860 (38,562) 4,688
Liabilities:Accounts payable and accrued liabilities $ (492) 3,291 (2,208) 591 Deposits held for others 3,245 7,032 (7,109) 3,168 Due to other governmental agencies 637 29,536 (29,244) 929
Total liabilities $ 3,390 39,859 (38,561) 4,688
Total—All Agency Funds
Assets:Cash and cash equivalents $ 27,515 475,672 (473,614) 29,573 Receivables, net of allowances:
Taxes 27,777 11,220 (10,893) 28,104 Other 1,067 1,312 (1,067) 1,312
Total assets $ 56,359 488,204 (485,574) 58,989
Liabilities:Accounts payable and accrued liabilities $ 575 37,022 (35,694) 1,903 Deposits held for others 22,175 32,552 (32,095) 22,632 Due to other governmental agencies 33,609 418,629 (417,784) 34,454
Total liabilities $ 56,359 488,203 (485,573) 58,989 See accompanying independent auditors’ report.

Solid Waste Management Development Corporation— Discretely Presented Component Unit
162
Solid Waste Management Development Corporation (SWMDC) owns a system of underground pressurized steam transport pipe in the downtown area commonly known as the steam loop. The steam loop is leased on a long term basis to a steam generating private entity unrelated to the City.
Separate financial statements are not prepared for SWMDC. Accordingly, a statement of revenues, expenses, changes in net assets, and a statement of cash flows for SWMDC have been included within the City’s comprehensive annual financial report.

163
City of St. Louis, MissouriStatement of Revenues, Expenses, and Changes in Net Assets
Solid Waste Management Development Corporation (SWMDC)Year ended June 30, 2012
(dollars in thousands)
OPERATING REVENUESLease revenue $ 249
Total operating revenues 249
OPERATING EXPENSESDepreciation 349 Professional fees and other operating expenses 49
Total operating expenses 398 Operating loss (149)
NONOPERATING REVENUESInvestment income 2 Total nonoperating revenues 2
Net loss before capital contributions (147)
Capital contributions 465 Change in net assets 318 Total net assets—beginning of year 8,930 Total net assets—end of year $ 9,248
See accompanying independent auditors’ report.

164
City of St. Louis, MissouriStatement of Cash Flows
Solid Waste Management Development Corporation (SWMDC)Year ended June 30, 2012
(dollars in thousands)
CASH FLOWS FROM OPERATING ACTIVITIESReceipts from customers and users $ 249 Payments to service providers (49)
Net cash provided by operating activities 200
CASH FLOWS FROM CAPITAL AND RELATEDFINANCING ACTIVITIESConstruction of capital assets (234)
Net cash used in capital and related financing activities (234)
CASH FLOWS FROM INVESTING ACTIVITIESPurchases of investments (1,000) Proceeds from maturities of investments 1,999 Investment income 2
Net cash provided by investing activities 1,001
Net increase in cash and cash equivalents 967
Cash and cash equivalents beginning of year 1,353 Cash and cash equivalents end of year $ 2,320
Reconciliation of operating loss to net cashprovided by operating activities:
Operating loss $ (149) Adjustment to reconcile operating loss to net cash
provided by operating activities:Depreciation expense 349
Net cash provided by operating activities $ 200
Supplemental disclosure of non cash activities:Contributed capital $ 465
See accompanying independent auditors’ report.

165
STATISTICAL SECTION This part of the City of St. Louis’ (the City’s) comprehensive annual financial report presents detailed information as a context for understanding what the information in the financial statements, note disclosures, and required supplementary information says about The City’s overall financial health. Contents Table Numbers Primary Government: Financial Trends 1-4 These tables contain trend information to help the reader understand
how the City’s financial performance and well-being have changed over time.
Revenue Capacity 5-10 These tables contain information to help the reader assess the City’s
most significant local revenue sources. Debt Capacity 11-15 These tables present information to help the reader assess the
affordability of the City’s current levels of outstanding debt and the City’s ability to issue additional debt in the future.
Demographic and Economic Information 16 These tables offer demographic and economic indicators to help the
reader understand the environment with which the City’s financial activities take place.
Operating Information 17-20 These tables contain service and infrastructure data to help the reader
understand how the information in the City’s financial report relates to the services the government provides and the activities it performs.
Additional Data-Lambert-St. Louis International Airport: Demographic and Economic Information 21-23 These tables offer regional demographic and economic data of the
metropolitan area served by the Lambert-St. Louis International Airport. Operating Information 24-28 These tables contain information and data pertaining to airline
operations at Lambert-St. Louis International Airport. Sources: Unless otherwise noted, the information in these schedules is derived from the comprehensive annual financial reports for the relevant year.

166
Table 1CITY OF ST. LOUIS, MISSOURINet Assets by ComponentLast Seven Fiscal Years(dollars in thousands)(accrual basis of accounting)
2012 2011 2010 2009 2008 2007 2006`
Primary Government:Governmental activities
Invested in capital assets, net of related debt $ 495,977 $ 472,165 $ 453,220 $ 510,743 $ 496,341 $ 410,429 $ 402,317 Restricted 31,822 34,179 29,390 32,784 29,855 103,898 108,919 Unrestricted (443,552) (407,047) (392,115) (366,224) (312,367) (253,168) (205,941)
Total governmental activities net assets 84,247 99,297 90,495 177,303 213,829 261,159 305,295
Business-type activitiesInvested in capital assets, net of related debt 1,014,901 1,075,403 1,071,899 1,094,296 1,058,030 1,072,894 1,120,715 Restricted 150,661 166,462 163,449 137,995 142,619 135,993 145,319 Unrestricted 100,521 18,072 23,375 10,456 23,349 31,001 19,394
Total business-type activities net assets 1,266,083 1,259,937 1,258,723 1,242,747 1,223,998 1,239,888 1,285,428
Primary governmentInvested in capital assets, net of related debt 1,510,878 1,547,568 1,525,119 1,605,039 1,554,371 1,483,323 1,523,032 Restricted 182,483 200,641 192,839 170,779 172,474 239,891 254,238 Unrestricted (343,031) (388,975) (368,740) (355,768) (289,018) (222,167) (186,547)
Total primary government net assets 1,350,330 1,359,234 1,349,218 1,420,050 1,437,827 1,501,047 1,590,723
Component Unit-SLPDInvested in capital assets, net of related debt - - - - 32,375 30,208 26,630Restricted - - - - 34 704 690Unrestricted - - - - (63,155) (69,404) (68,649)
Total SLPD net assets * - - - - (30,746) (38,492) (41,329)
*Fiscal year 2009 through 2012 SLPD net assets information is not required as the St. Louis Police Department (SLPD) debt was retired in Fiscal year 2008.
Source: Basic financial statements.

167
Table 2CITY OF ST. LOUIS, MISSOURIChanges in Net AssetsLast Seven Fiscal Years(dollars in thousands)
(accrual basis of accounting)2012 2011 2010 2009 2008 2007 2006
Expenses: Governmental activities:
General government $ 72,063 $ 79,871 $ 84,330 $ 85,680 $ 74,166 $ 91,822 $ 93,572 Convention and tourism 4,979 4,563 4,507 4,504 4,468 4,352 4,594 Parks and recreation 28,529 29,416 32,778 33,431 31,335 28,130 25,366
Judicial 50,931 52,362 54,880 56,159 50,684 46,990 46,566 Streets 70,420 66,952 66,263 63,646 62,566 58,606 59,109 Public Safety: Fire 69,062 66,637 67,334 70,572 69,668 56,405 54,625 Police-Payment to SLPD 140,815 139,010 141,805 146,955 143,452 138,871 134,631 Police Pension * 19,854 17,949 14,902 8,196 12,914 — — Other 59,068 52,182 55,980 60,020 63,687 59,984 55,750 Health and welfare 52,092 50,468 51,552 54,223 45,732 45,630 46,070 Public service 71,458 65,898 59,980 59,218 70,007 73,145 67,544 Community development 80,184 68,123 76,264 61,859 60,611 78,788 66,286 Interest and fiscal charges 59,750 58,612 57,933 54,684 49,963 36,024 33,731
Total governmental activities expenses 779,205 752,043 768,508 759,147 739,253 718,747 687,844
Business-type activities: Airport 171,574 187,449 181,775 175,758 215,691 178,110 156,824 Water Division 43,637 44,530 43,479 47,500 45,157 42,395 40,505 Parking Division 13,229 13,141 13,514 14,352 14,560 12,423 14,056
Total business-type activities expenses 228,440 245,120 238,768 237,610 275,408 232,928 211,385 Total primary government expenses $ 1,007,645 $ 997,163 $ 1,007,276 $ 996,757 $ 1,014,661 $ 951,675 $ 899,229

168
Table 2CITY OF ST. LOUIS, MISSOURIChanges in Net AssetsLast Seven Fiscal Years(dollars in thousands)
(accrual basis of accounting)2012 2011 2010 2009 2008 2007 2006
Program RevenuesGovernmental activities:
Charges for services: General government $ 36,697 $ 37,767 $ 39,340 $ 37,706 $ 35,060 $ 39,757 $ 37,617 Convention and tourism 8 19 18 19 16 20 Parks and recreation 7,314 4,378 4,419 4,516 2,662 9,126 2,248
Judicial 18,996 20,524 20,791 18,952 18,894 14,855 12,525 Streets 27,514 34,842 17,644 17,734 15,621 17,184 15,984 Public Safety: Fire 8,181 8,088 7,677 7,669 6,718 7,416 6,562 Police-Payment to SLPD — — — — — — — Other 19,218 17,527 19,022 19,632 18,635 22,797 25,744 Health and welfare 992 1,255 591 494 944 418 511 Public service 5,265 309 1,487 253 6,320 5,530 5,301 Community development ** 5,367 4,819 4,528 5,524 5,273 Operating grants and contributions 71,513 75,281 98,270 73,563 72,860 75,994 80,214 Capital grants and contributions 31,623 33,666 7,548 12,726 14,306 14,232 13,760
Total governmental activities program revenues 232,688 238,475 221,335 198,788 197,293 207,325 200,486
Business-type activities: Charges for services: Airport 157,154 149,438 160,378 159,061 163,460 155,295 149,169 Water Division 58,631 56,039 50,983 48,709 45,635 44,130 45,464 Parking Division 14,999 13,813 12,428 13,897 15,890 14,155 14,849 Operating grants and contributions 1,069 1,513 1,615 2,683 4,348 2,643 6,673 Capital grants and contributions 10,050 8,267 31,815 35,122 28,123 44,633 38,301
Total business-type activities program revenues 241,903 229,070 257,219 259,472 257,456 260,856 254,456Total primary government program revenues $ 474,591 $ 467,545 $ 478,554 $ 458,260 $ 454,749 $ 468,181 $ 454,942

169
Table 2CITY OF ST. LOUIS, MISSOURIChanges in Net AssetsLast Seven Fiscal Years(dollars in thousands)
(accrual basis of accounting)2012 2011 2010 2009 2008 2007 2006
Net Program (Expense) RevenueGovernmental activities $ (546,517) $ (513,568) $ (547,173) $ (560,359) $ (541,960) $ (511,422) $ (487,358)Business-type activities 13,463 (16,050) 18,451 21,862 (17,952) 27,928 43,071Total primary government net expense $ (533,054) $ (529,618) $ (528,722) $ (538,497) $ (559,912) $ (483,494) $ (444,287)
General Revenues and Other Changes in Net AssetsGovernmental activities: Taxes Property taxes, levied for general purpose $ 68,531 $ 66,767 $ 67,291 $ 67,562 $ 62,424 $ 62,333 $ 53,536 Property taxes, levied for debt service 5,909 7,669 6,463 4,810 6,285 6,197 5,750 Sales tax 164,174 155,708 142,295 143,972 134,476 127,664 121,449 Earnings/payroll taxes 186,068 178,571 172,450 181,214 181,812 169,822 170,934 Gross receipt taxes (includes franchise tax) 93,587 97,327 90,291 108,178 84,652 75,378 81,162 Miscellaneous taxes 4,504 4,080 3,902 3,712 4,035 6,237 2,684 Unrestricted investment earnings 470 953 886 6,001 12,159 12,094 9,492 Gain/loss on sale of capital assets (1,142) 2,528 62 83 47 (324) 6 Special item-recovery of legal judgment — — — — — — — Transfers 9,366 8,767 7,317 8,301 8,740 7,885 7,401Total governmental activities 531,467 522,370 490,957 523,833 494,630 467,286 452,414
Business-type activities: Unrestricted investment earnings 2,049 2,941 3,878 5,188 10,776 12,522 11,794
Gain/loss on sale of capital assets — 4 553 — 26 (78,105) — Extraordinary item - Natural disaster — 23,086 — — — — — Transfers (9,366) (8,767) (6,906) (8,301) (8,740) (7,885) (7,401)Total business-type activities (7,317) 17,264 (2,475) (3,113) 2,062 (73,468) 4,393Total primary government $ 524,150 $ 539,634 $ 488,482 $ 520,720 $ 496,692 $ 393,818 $ 456,807

170
Table 2CITY OF ST. LOUIS, MISSOURIChanges in Net AssetsLast Seven Fiscal Years(dollars in thousands)
(accrual basis of accounting)2012 2011 2010 2009 2008 2007 2006
Change in Net AssetsGovernmental activities $ (15,050) $ 8,802 $ (56,216) $ (36,526) $ (47,330) $ (44,136) $ (34,944)Business-type activities 6,146 1,214 15,976 18,749 (15,890) (45,540) 47,464Total primary government $ (8,904) $ 10,016 $ (40,240) $ (17,777) $ (63,220) $ (89,676) $ 12,520
*Police pension expenses under Governmental activities for fiscal years 2008 and 2009 were reclassified. In prior fiscal years, this expense was included in Public Safety-Other. See accompanying notes to basic financial statements.** Fiscal years 2008 and 2009 Community development revenues reflect TIF revenues previously reported under General government in prior fiscal years.
Source: Basic financial statements.

171
Table 3
(modified accrual basis of accounting)
2012 2011 2010 2009 2008 2007 2006 2005 2004 2003
General Fund Nonspendable $ — $ — $ * $ * $ * $ * $ * $ * $ * $ * Restricted 16,755 16,723 * * * * * * * * Committed 8,063 6,895 * * * * * * * * Assigned 1,509 1,055 * * * * * * * * Unassigned 29,543 24,675 * * * * * * * *
Reserved — — 31,284 26,484 21,150 21,079 23,139 25,185 25,127 24,635 Unreserved — — 22,132 35,570 33,721 53,649 57,155 47,612 44,779 52,079
Total general fund $ 55,870 $ 49,348 $ 53,416 $ 62,054 $ 54,871 $ 74,728 $ 80,294 $ 72,797 $ 69,906 $ 76,714
All Other Governmental Funds Nonspendable $ 11 $ 11 $ * $ * $ * $ * $ * $ * $ * $ * Restricted 79,573 131,102 * * * * * * * * Committed 54,553 54,678 * * * * * * * * Assigned 1,837 3,200 * * * * * * * * Unassigned (20,103) (26,752) * * * * * * * *
Reserved — — 181,410 173,407 191,062 76,378 82,979 76,485 95,101 106,036 Unreserved, reported in: Special revenue funds — — 19,342 30,104 42,304 56,508 49,041 43,128 43,422 41,531 Capital projects funds — — (13,961) (10,689) (9,253) 12,724 (7,204) 27,623 (2,735) 10,123
Total all other governmental funds $ 115,871 $ 162,239 $ 186,791 $ 192,822 $ 224,113 $ 145,610 $ 124,816 $ 147,236 $ 135,788 $ 157,690
CITY OF ST. LOUIS, MISSOURI
* Effective July 1, 2011 the City adopted GASB Statement No. 54, Fund Balance Reporting and Governmental Fund Type Definitions , to enhance the usefulness of fund balanceinformation by providing clearer fund balance classifications that can be more consistently applied and by clarifying the existing governmental fund type definitions. Thisstatement establishes fund balance classifications that comprise a hierarchy based primarily on the extent to which a government is bound to observe constraints imposed uponthe use of the resources reported in governmental funds.
Fund Balances, Governmental FundsLast Ten Fiscal Years(dollars in thousands)

172
Table 4CITY OF ST. LOUIS, MISSOURIChanges In Fund Balances, Governmental FundsLast Ten Fiscal Years(dollars in thousands)
2012 2011 2010 2009 2008 2007 2006 2005 2004 2003
Revenues
Taxes 519,852$ 510,150$ 480,082$ 506,228$ 473,646$ 439,436$ 432,139$ 412,670$ 396,266$ 413,289$ Licenses, fees and permits 21,259 21,716 24,214 22,238 22,208 24,395 23,708 21,754 19,585 17,735 Intergovernmental 130,079 138,141 117,084 116,693 119,197 123,119 122,332 113,237 139,637 115,181 Charges for services, net 46,166 44,659 30,906 28,316 28,752 29,592 28,373 28,200 29,211 24,908 Court fines and forfeitures 12,103 10,848 11,558 11,127 10,000 8,434 8,927 9,047 9,307 8,923 Investment income 470 953 886 6,001 12,159 12,094 9,492 3,112 2,693 3,941 Interfund services provided 4,293 4,631 3,043 6,354 3,868 4,094 4,009 4,519 3,921 4,476 Miscellaneous 17,651 15,845 15,987 12,865 13,902 14,303 11,148 13,174 10,486 14,688
Total revenues 751,873 746,943 683,760 709,822 683,732 655,467 640,128 605,713 611,106 603,141
Expenditures
General government 60,942 67,400 77,906 80,226 101,622 53,066 69,011 58,273 61,848 59,869Convention and tourism 150 189 176 198 201 154 362 2,010 286 2,344Parks and recreation 23,885 25,153 27,357 29,827 27,966 25,129 23,191 22,597 20,877 18,659Judicial 50,821 52,498 53,985 55,222 50,806 46,633 46,837 47,486 47,249 49,117 Streets 40,772 39,498 37,356 37,500 38,086 35,320 37,415 35,218 33,976 30,588 Public Safety:
Fire 69,887 68,518 66,590 62,010 115,605 53,547 53,959 49,204 49,394 50,988 Police 140,815 139,010 141,805 146,955 143,452 138,871 134,631 130,584 131,490 126,497 Police-Pension * 19,719 17,949 14,783 8,072 43,618 Other 58,741 51,899 54,653 57,443 62,743 59,253 55,804 51,771 54,338 47,436
Health and welfare 51,855 50,127 51,230 53,441 45,379 45,067 45,905 40,275 36,592 37,495Public service 70,840 65,916 59,315 58,594 70,095 72,991 67,600 62,415 72,885 66,140Community development 80,184 68,123 76,264 63,220 60,710 79,351 66,555 57,291 55,149 43,622Interfund services used — — — — — — — — — — Capital outlay 90,065 94,653 51,175 67,615 51,103 43,591 35,290 37,383 44,840 67,466Debt Service: Principal 54,952 58,091 46,721 41,759 46,484 39,008 30,933 35,240 23,146 25,592
Interest and fiscal charges 47,256 46,283 54,555 47,350 44,741 29,865 28,288 29,181 28,738 37,964Cost of issuance — — — 1,290 — — - — — — Advance refunding escrow — — 1,178 — — — — 1,359 — —
Total expenditures 860,884 845,307 815,049 810,722 902,611 721,846 695,781 660,287 660,808 663,777
Excess (deficiency) of revenues over expenditures (109,011) (98,364) (131,289) (100,900) (218,879) (66,379) (55,653) (54,574) (49,702) (60,636)

173
Table 4CITY OF ST. LOUIS, MISSOURIChanges In Fund Balances, Governmental FundsLast Ten Fiscal Years(dollars in thousands)
2012 2011 2010 2009 2008 2007 2006 2005 2004 2003
Other Financing Sources (Uses)Sale of capital assets 345$ 3,216$ 62$ 83$ 47$ 175$ 514$ 937$ 1,869$ 180$ Issuance of note payable - - - 9,068 - - - - - - Issuance of SLMFC Certificates of Participation - - - 9,100 - - - Issuance of refunding bonds- revenue refunding bonds 49,825 2,690 - - - - - - - - Issuance of refunding bonds-leasehold revenue bonds - 9,250 74,191 21,850 247,967 23,725 15,485 - - 141,975 Issuance of contractual obligation with component unit 16,960 Premium on leasehold revenue bonds 4,038 145 396 653 4,178 504 - - 11,251 Discount on leasehold revenue bonds - - (384) (525) (3,965) (467) - - - - Issuance of Section 108 loan guarantee assist - - - - - - - - - - Proceeds of general obligation bonds and revenue bonds - - - - - 13,000 - 98,953 - - Premium on general obligation bonds and revenue bonds - - - - - - - 3,073 - - Discount on general obligation bonds - - - - - - - (29) - - Issuance of capital lease 2,384 11,150 704 5,600 1,478 10,014 1,990 851 7,326 Issuance of tax increment revenue notes 51,101 46,503 28,352 32,669 37,737 55,158 30,043 12,964 14,766 - Issuance of tax increment revenue bonds - 4,580 - - - - - - - - Proceeds from master note purchase agreement - - - - - - - - - - Discount on tax increment revenue bonds - - - - - - - - (40) - Issuance of loan agreement - - - - 4,500 - 782 1,000 - - Issuance of joint venture financing agreement - - - - - 49,585 - - - - Payment to refunded escrow agent-joint venture - - - - - (51,316) - - - - Payment to refunded escrow agent-leasehold revenue bonds (53,172) (2,416) (12,391) - (8,632) (22,830) (15,421) (55,962) (7,747) (149,808) Payment to refunded escrow agent-obligation with component unit - - - (9,354) - - - - - - Payment of refunded escrow agent-capital lease - (11,931) (341) - - - - - - - Fireman's Retirement EAN note proceeds 5,278 - - - - - - - - - Advance refunding on TIF bonds and notes payable - - (16,961) - (11,000) (7,500) - - - - Recovery of legal judgment - - - - - - - - 2,972 - Receipt of redevelopment lease proceeds from component unit - - 18,006 - - - - - - - Transfers in 62,920 53,467 58,575 50,849 40,569 41,613 29,909 31,507 37,856 49,887 Transfers out (53,554) (46,910) (50,549) (42,548) (31,829) (33,728) (22,508) (24,381) (30,637) (42,376)
Total other financing sources (uses), net 69,165 69,744 116,620 76,792 277,525 81,607 41,298 68,913 19,039 18,435
Net change in fund balances (39,846)$ (28,620)$ (14,669)$ (24,108)$ 58,646$ 15,228$ (14,355)$ 14,339$ (30,663)$ (42,201)$
Debt service as a percentage of noncapital expenditures 13.3% 13.9% 13.3% 12.0% 10.7% 10.2% 9.0% 10.3% 8.4% 10.7%
Debt service expenditures 102,208 104,374 101,276 89,109 91,225 68,873 59,221 64,421 51,884 63,556Non-capital expenditures 770,819 750,654 763,874 743,107 851,508 678,255 660,491 622,904 615,968 596,311
*Police pension expenses under Governmental activities were reclassified in fiscal years 2008 and 2009. In prior fiscal years, this expense was included in Public Safety-Other. See accompanying notes to basic financial statements.

174
Table 5
Taxable AssessedManufacturer's Less: Total Taxable Estimated Total Value to
Fiscal Real Estate Personal Machinery, Tools Tax-Exempt Assessed Actual Taxable Direct Estimated ActualYear Residential Commercial Property & Equipment Property Value Value Tax Rate Taxable Value
2012 2,197,419$ 2,499,166$ 705,441$ 238,661$ 1,282,753$ 4,357,935$ 17,543,141$ 1.4691 24.8%2011 2,281,376 2,542,399 723,739 221,519 1,281,865 4,487,158 18,126,314 1.4224 24.8%2010 2,206,698 2,688,333 781,557 254,873 1,381,310 4,550,151 18,144,398 1.3601 25.1%2009 2,256,467 2,440,325 861,837 287,366 1,162,841 4,683,154 18,841,886 1.3225 24.9%2008 2,195,159 2,548,206 805,298 292,371 1,283,851 4,557,183 18,401,969 1.3451 24.8%2007 1,798,234 2,318,384 767,274 286,014 1,277,160 3,892,746 15,486,668 1.4590 25.1%2006 1,700,324 2,199,992 789,536 290,523 1,097,633 3,882,742 15,370,507 1.4402 25.3%2005 1,242,646 1,998,611 770,104 285,353 930,989 3,365,725 12,910,940 1.5908 26.1%2004 1,229,358 1,931,802 789,866 296,768 884,059 3,363,735 12,875,125 1.5623 26.1%2003 1,079,619 1,811,204 811,286 305,360 831,316 3,176,153 11,053,189 1.6087 28.7%
Source: City of St. Louis Assessor's Office
NOTE:Residential real property is assessed at 19% of estimated value, commercial at 32%, and agricultural at 12%; personal property and manufacturer's machinery, tools and equipment assessed at 33-1/3%.A complete reassessment is made on personal property by the Assessor every year and every odd year for real property.
CITY OF ST. LOUIS, MISSOURIAssessed Value and Actual Value of Taxable Property Last Ten Fiscal Years(dollars in thousands)

175
Table 6
2012 2011 2010 2009 2008 2007 2006 2005 2004 2003City of St. Louis:
Municipal purposes 0.9002 0.8639 0.8500 0.8161 0.8059 0.8811 0.8687 0.9559 0.9368 0.9674 County purposes 0.3247 0.3113 0.3064 0.2940 0.2903 0.3179 0.3134 0.3455 0.3386 0.3500 Hospital purposes 0.0926 0.0888 0.0874 0.0839 0.0829 0.0908 0.0895 0.0987 0.0968 0.1000 Public health purposes 0.0186 0.0178 0.0175 0.0168 0.0166 0.0182 0.0179 0.0197 0.0194 0.0200 Recreation purposes 0.0186 0.0178 0.0175 0.0168 0.0166 0.0182 0.0179 0.0197 0.0194 0.0200 Interest and public debt 0.1144 0.1228 0.0813 0.0949 0.1328 0.1328 0.1328 0.1513 0.1513 0.1513
Total City of St. Louis 1.4691 1.4224 1.3601 1.3225 1.3451 1.4590 1.4402 1.5908 1.5623 1.6087
Overlapping governments:State Blind Pension Fund 0.0300 0.0300 0.0300 0.0300 0.0300 0.0300 0.0300 0.0300 0.0300 0.0300Board of Education of the City of St. Louis 4.1743 3.9865 3.8943 3.8028 3.7533 4.0193 3.9720 4.3040 4.1900 4.3000St. Louis Community College 0.2200 0.2179 0.2136 0.2013 0.2003 0.2233 0.2231 0.2368 0.2312 0.2320Metropolitan St. Louis Sewer District 0.0818 0.0790 0.0000 0.0000 0.0667 0.0687 0.0686 0.0690 0.0690 0.0690Sheltered Workshop District 0.1445 0.1372 0.1346 0.1295 0.1278 0.1386 0.1368 0.1490 0.1459 0.1500St. Louis Public Library 0.5435 0.5208 0.5019 0.4938 0.4768 0.5171 0.5104 0.5561 0.5446 0.5600Community Mental Health 0.0867 0.0823 0.0800 0.0777 0.0767 0.0832 0.0821 0.0894 0.0875 0.0900Community Children's Service Fund 0.1900 0.1880 0.1827 0.1775 0.1752 0.1900 0.1900 - - - Metropolitan Zoological Park and Museum District:
Zoological Subdistrict 0.0764 0.0727 0.0714 0.0671 0.0667 0.0746 0.0763 0.0787 0.0620 0.0610Art Museum Subdistrict 0.0764 0.0727 0.0714 0.0671 0.0667 0.0746 0.0763 0.0787 0.0620 0.0610Museum of Science and Natural History Subdistrict 0.0381 0.0364 0.0355 0.0334 0.0332 0.0373 0.0376 0.0394 0.0320 0.0310Botanical Garden Subdistrict 0.0381 0.0364 0.0355 0.0334 0.0332 0.0373 0.0376 0.0394 0.0320 0.0310Missouri History Museum Subdistrict 0.0381 0.0364 0.0355 0.0334 0.0332 0.0373 0.0376 0.0394 0.0380 0.0380
Total overlapping governments 5.7379 5.4963 5.2864 5.1470 5.1398 5.5313 5.4784 5.7099 5.5242 5.6530
Total City of St. Louis and overlapping governments 7.2070$ 6.9187$ 6.6465$ 6.4695$ 6.4849$ 6.9903$ 6.9186$ 7.3007$ 7.0865$ 7.2617$
Source: City Assessor's Office.
CITY OF ST. LOUIS, MISSOURIProperty Tax Rates Per $100 Assessed Value - Direct and Overlapping GovernmentsLast Ten Fiscal Years

176
Table 7
Calendar Year Calendar Year 2011 2002
Percentage Percentageof Total City of Total City
Taxable Taxable Taxable TaxableTax Payer by Industry Assessed Assessed Assessed Assessed
Classification (1) Valuation Rank Valuation Valuation Rank Valuation
Utilities 95,134$ 1 2.31% 70,468$ 4 2.63%Gaming 79,524 2 1.93% - - Manufacturing 66,781 3 1.62% 73,652 3 2.75%
Telecommunications 63,451 4 1.54% 110,874 1 4.13%Property Management 61,347 5 1.49% - - Financial Services 38,590 6 0.94% 38,302 5 1.43%Healthcare 34,947 7 0.85% 27,034 6 1.01%Utilities 29,241 8 0.71% 74,014 2 2.76%Property Management 28,666 9 0.70% - - Property Management 25,380 10 0.62% - - Healthcare - - NP 9 - Educational Institution - - NP 10 - Manufacturing - - 15,806 7 0.59%Retail - - 11,014 8 0.41%
523,061$ 12.71% 421,164$ 15.71%
Source: City Assessor's Office and Collector of Revenue
Note: (1) Taxpayer confidentiality prevents the disclosure of amounts by company name. The above information is individual taxpayers within the noted industry categories.
CITY OF ST. LOUIS, MISSOURIPrincipal Property Tax Payers Identified by Industry ClassificationCurrent Calendar Year and Nine Years Ago(dollars in thousands)

177
Table 8
(1)Fiscal Collected within the Fiscal Year Year Taxes Levied Fiscal Year of the Levy Collections Total Collections to Date
Ended for the (2) Percentage Related to PercentageJune 30 Fiscal Year Amount of Levy Prior Year Levies Amount of Levy
2012 57,723$ 52,191$ 90.4% -$ 52,191 90.4%2011 57,990 52,223 90.1% 2,776 54,999 94.8%2010 56,169 49,634 88.4% 4,712 54,346 96.8%2009 56,104 49,487 88.2% 5,862 55,349 98.7%2008 * 57,734 48,627 84.2% 8,380 57,007 98.7%2007 51,446 46,475 90.3% 4,683 51,158 99.4%2006 50,929 43,833 86.1% 6,476 50,309 98.8%2005 48,307 43,828 90.7% 4,177 48,005 99.4%2004 46,391 42,941 92.6% 4,327 47,268 101.9%2003 46,104 41,739 90.5% 4,213 45,952 99.7%
NOTES:(1) Figures are based on the Collector of Revenue's fiscal year which begins the first Monday of March.(2) Includes monies collected that were paid to the state for reassessment.* Total collections does not reflect protest monies held in escrow of approximately $4,100.
Source: Collector of Revenue, City of St. Louis.
CITY OF ST. LOUIS, MISSOURIGeneral and Debt Service Funds - Property Tax Levies And Collections Last Ten Fiscal Years(dollars in thousands)

178
Table 9
PayrollFiscal Revenue Base 1% Tax Total (1) Revenue (1)Year Business Individual Business Individual Earnings Tax Base 0.5% Tax
2012 3,354,200$ 12,482,700$ 33,542$ 124,827$ 158,369$ 7,021,600$ 35,108 2011 3,025,300 12,082,700 30,253 120,827 151,080 7,048,400 35,242 2010 2,557,500 12,171,600 25,575 121,716 147,291 7,513,600 37,568 2009 2,221,000 12,166,800 22,210 121,668 143,878 7,186,200 35,931 2008 2,671,400 12,046,700 26,714 120,467 147,181 7,451,200 37,256 2007 2,461,000 11,666,000 24,610 116,660 141,270 7,059,200 35,296 2006 2,178,200 11,383,800 21,782 113,838 135,620 7,295,000 36,4752005 1,892,500 10,858,900 18,925 108,589 127,514 6,365,600 31,8282004 1,884,200 10,620,500 18,842 106,205 125,047 6,334,600 31,6732003 1,877,500 10,709,800 18,775 107,098 125,873 6,413,800 32,069
Source: City of St. Louis Collector of Revenue
Note:Data calculated on a cash basis. (1) Tax totals include Collector of Revenue commissions
Earnings
CITY OF ST. LOUIS, MISSOURIEarnings and Payroll TaxLast Ten Fiscal Years(dollars in thousands)

179
Table 10
By Industry Classification
Fiscal Year Fiscal Year2012 (1) 2003 (1)
Percentage PercentageTotal of Total Total of Total
Top Ten Companies by Earnings & Earnings & Earnings & Earnings &Industry Classification (2) Payroll Tax Rank Payroll Tax Payroll Tax Rank Payroll Tax
Manufacturing 7,459$ 1 3.86% $ 7,252 1 4.59%Education 6,905 2 3.57% 4,060 5 2.57%Healthcare 4,691 3 2.42% 4,325 3 2.74%Financial Services 4,025 4 2.08% 4,307 4 2.73%
Government 3,880 5 2.01% - - Telecommunications 3,452 6 1.78% 5,965 2 3.78%Education 3,227 7 1.67% 2,405 9 1.52%Government 3,124 8 1.61% 3,151 6 2.00%Utilities 1,955 9 1.01% 2,391 10 1.51%Financial Services 1,812 10 0.94% - - Retailer - - 2,521 7 1.60%
Healthcare - - 2,428 8 1.54%40,530$ 20.95% 38,805$ 24.57%
Source: Collector of Revenue
Note:(1) The percentages are calculated using total taxes from Table 9.
(2) Taxpayer confidentiality prevents the disclosure of amounts by company name. The above information is individual taxpayers within the noted industry categories.
CITY OF ST. LOUIS, MISSOURIPrincipal Earnings and Payroll Tax PayersTop Ten Companies’ Current Fiscal Year and Nine Years Ago
(dollars in thousands)

180
Table 11
(1)General Tax Increment Lease (2) Joint Venture Water Airport Parking Total Percentage (1)
Fiscal Obligation Revenue Revenue Capital Financing Federal Other Revenue Revenue Revenue Primary of Personal PerYear Bonds Bonds Bonds Leases Agreement Section 108 Obligations Bonds Bonds Bonds Government Income Capita
2012 38,955$ 246,079$ 502,428$ 72,009$ 46,165$ 43,250$ 10,366$ 11,480$ 833,960$ 72,763$ 1,877,455 16.41% 5,8852011 42,685 200,202 548,958 75,993 50,092 46,750 11,353 16,000 869,980 74,892 1,936,905 16.93% 6,0662010 46,300 167,436 567,292 67,779 53,873 50,050 13,191 19,585 905,405 76,925 1,967,836 17.20% 5,5192009 49,790 163,554 531,615 53,131 57,516 53,160 14,373 23,025 797,105 78,854 1,822,123 15.65% 5,1082008 50,875 136,987 534,223 59,531 61,028 56,080 6,159 26,325 818,830 81,350 1,831,388 15.73% 5,1342007 54,820 114,251 308,824 61,050 65,116 58,820 2,204 29,175 843,920 70,120 1,608,300 15.21% 4,5082006 45,220 69,786 323,469 57,801 67,323 63,670 3,723 31,820 861,085 64,527 1,588,424 15.77% 4,4532005 48,465 41,678 340,899 56,985 68,376 68,220 3,359 34,320 894,735 66,264 1,623,301 16.77% 4,5512004 51,720 30,692 311,526 60,521 73,542 72,500 2,784 36,685 930,510 68,134 1,638,614 14.08% 4,5932003 54,685 25,826 319,737 22,964 76,493 76,570 1,184 38,920 961,520 62,515 1,640,414 14.09% 4,598
Source: Notes to Basic Financial Statements
Note:(1) See Table 16 for personal income and population data. These ratios are calculated using personal income and population for the prior calendar year.(2) Capital Leases include rolling stock and obligations with component units.
Governmental Activities Business -Type Activities
CITY OF ST. LOUIS, MISSOURIRatios of Outstanding Debt by TypeLast Ten Fiscal Years(dollars in thousands)

181
Table 12
General Bonded Debt Outstanding(1) (2)
General Less Debt Total Net Percentage of PerFiscal Obligation Service Bonded Actual Taxable Value of CapitaYear Bonds Fund Debt Property (in dollars)
2012 38,955$ 8,137$ 30,818 0.18% 97$ 2011 42,685 8,118 34,567 0.19% 108 2010 46,300 7,331 38,969 0.21% 109 2009 49,790 8,216 41,574 0.22% 117 2008 50,875 9,008 41,867 0.22% 118 2007 54,820 8,045 46,775 0.25% 132 2006 45,220 7,239 37,981 0.25% 107 2005 48,465 6,271 42,194 0.27% 120 2004 51,720 6,528 45,192 0.35% 129 2003 54,685 6,312 48,373 0.38% 139
Source: City Assessor's Office and Comptroller's Office
Note:(1) See Table 5 for property value data.(2) Population data can be found in Table 16
CITY OF ST. LOUIS, MISSOURIRatio of Net General Obligation Debt OutstandingLast Ten Fiscal Years(dollars in thousands except per capita)

182
Table 13
EstimatedEstimated Share of
Debt Percentage OverlappingOutstanding Applicable Debt
Governmental Unit
Debt repaid with property taxes
Board of Education of the City of St. Louis (1): General Obligation Debt 489,714$ 100.00% 489,714$
Other debt
Board of Education of the City of St. Louis - 100.00% * -
Metropolitan St. Louis Sewer District (2) 658,396 10.11% * 66,570
St. Louis Public Library (3) 56,960 10.11% * 5,759
Junior College District of St. Louis (4) 36,667 16.46% * 6,034
Subtotal, overlapping debt 1,241,737 568,077
City of St. Louis direct debt (5) 960,836
Total direct and overlapping debt 1,528,913$
Source:(1) Board of Education City of St. Louis.(2) Metropolitan St. Louis Sewer District(3) St. Louis Public Library(4) Junior College District of St. Louis(5) Notes to basic financial statements
Note: * Based on assessed property value
(dollars in thousands)
CITY OF ST. LOUIS, MISSOURIDirect and Overlapping Governmental Activities DebtAs of June 30, 2012

183
Table 14CITY OF ST. LOUIS, MISSOURILegal Debt Margin Calculation Last Ten Fiscal Years(dollars in thousands) Legal Debt Margin Calculation for Fiscal Year Ended June 30, 2012
Assessed ValueDebt limit (10% of assessed value)Debt applicable to limit:
General obligation bondsLess: Amount set aside for repayment .
of general obligation debt.Total net debt applicable to limitLegal Debt Margin
Fiscal Year Ended June 302012 2011 2010 2009 2008 2007 2006 2005 2004 2003
Debt limit 420,253$ 426,565$ 455,015$ 468,315$ 455,718$ 389,274$ 388,274$ 336,573$ 336,374$ 317,615$
Total net debt applicable to limit 30,818 34,567 38,969 41,574 41,867 46,775 37,981 42,194 45,192 48,373
Legal debt margin 389,435$ 391,998$ 416,046$ 426,741$ 413,851$ 342,499$ 350,293$ 294,379$ 291,182$ 269,242$
Total net debt applicable to the limitas a percentage of debt limit 7.33% 8.10% 8.56% 8.88% 9.19% 12.02% 9.78% 12.54% 13.44% 15.23%
389,435$
4,202,533$ 420,253
38,955
30,818 (8,137)

Table 15CITY OF ST. LOUIS, MISSOURIPledged-Revenue Coverage,Last Ten Fiscal Years(dollars in thousands)
184
Water Revenue Bonds (1) Airport Revenue Bonds (1) Less: Net Less: Net
Fiscal Water Operating Available Debt Service Aviation Operating Available Debt ServiceYear Revenue Expenses Revenue Principal Interest Coverage Revenue Expenses Revenue Principal Interest Coverage
2012 58,631$ 38,126$ 20,505$ 3,740$ 650$ 4.67 161,518$ 81,872$ 79,646$ 19,985$ 41,501$ 1.302011 56,044 38,535 17,509 3,585 809 3.98 165,405 91,993 73,412 29,970 46,942 0.952010 51,295 37,549 13,746 2,440 959 4.04 170,429 87,385 83,044 21,670 44,157 1.262009 49,173 41,425 7,748 3,300 1,100 1.76 169,961 86,054 83,907 21,725 40,575 1.352008 46,709 39,414 7,295 2,850 1,469 1.69 178,960 93,600 85,360 25,090 39,664 1.322007 45,697 36,816 8,881 2,645 1,286 2.26 157,918 89,023 68,895 13,960 47,118 1.132006 46,266 34,405 11,861 2,500 1,444 3.01 126,037 76,833 49,204 34,090 34,949 0.712005 44,264 32,491 11,773 2,365 1,590 2.98 138,882 74,185 64,697 29,135 53,625 0.782004 42,061 33,119 8,942 2,235 1,727 2.26 145,433 73,622 71,811 31,030 30,552 1.172003 41,435 34,216 7,219 2,090 1,854 1.83 171,874 83,814 88,060 39,485 42,749 1.07
(1) Coverage ratio as defined by the various bond covenants may be different than that presented here.(2) Coverage ratio for Tax Increment Financings and for Leasehold Revenue Bonds combines several issues.

Table 15CITY OF ST. LOUIS, MISSOURIPledged-Revenue Coverage,Last Ten Fiscal Years(dollars in thousands)
185
Parking Revenue Bonds (1) Tax Increment Financing Bonds (1) (2)Parking/ Less: Net Tax Less: Net Project Operating Available Debt Service Increment Operating Available Debt Service
Revenues Expenses Revenue Principal Interest Coverage Revenue Expenses Revenue Principal Interest Coverage
14,146$ 6,855$ 7,291$ 1,765$ 3,005$ 1.53 17,914$ 697$ 17,217 5,776$ 12,800$ 0.9313,007 6,657 6,350 1,675 3,093 1.33 14,115 631 13,484 5,853 10,189 0.8411,537 7,061 4,476 1,595 3,176 0.94 15,444 477 14,967 7,509 10,434 0.8312,893 8,691 4,202 1,275 3,246 0.93 12,327 401 11,926 5,384 8,793 0.8413,318 8,331 4,987 1,475 3,756 0.95 9,449 324 9,125 4,000 7,409 0.8013,195 7,472 5,723 257 2,308 2.23 7,459 201 7,258 2,593 3,946 1.1113,418 7,586 5,832 1,727 3,400 1.14 5,632 126 5,506 3,705 4,138 0.7011,781 7,431 4,350 1,870 3,436 0.82 5,106 44 5,062 3,615 3,201 0.7412,243 7,116 5,127 993 3,360 1.18 5,490 42 5,448 2,150 2,229 1.2411,548 6,166 5,382 935 2,321 1.65 2,979 26 2,953 831 1,854 1.10
(1) Coverage ratio as defined by the various bond covenants may be different than that presented here.(2) Coverage ratio for Tax Increment Financings and for Leasehold Revenue Bonds combines several issues.

Table 15CITY OF ST. LOUIS, MISSOURIPledged-Revenue Coverage,Last Ten Fiscal Years(dollars in thousands)
186
Section 108 Downtown ConventionHeadquarters Hotel Project
Tax Less: NetIncrement Operating Available Debt ServiceRevenue Expenses Revenue Principal Interest Coverage
4,629$ 360$ 4,269$ 2,560$ 1,381$ 1.084,576 260 4,316 2,410 2,387 0.903,701 270 3,431 2,270 2,523 0.725,403 280 5,123 2,130 2,645 1.075,219 286 4,933 2,000 2,756 1.046,092 296 5,796 1,890 2,859 1.224,655 303 4,352 1,770 2,952 0.924,226 309 3,917 1,670 3,034 0.832,699 158 2,541 1,610 3,029 0.55
265 1 264 - 2,988 0.09
(1) Coverage ratio as defined by the various bond covenants may be different than that presented here.(2) Coverage ratio for Tax Increment Financings and for Leasehold Revenue Bonds combines several issues.

Table 15CITY OF ST. LOUIS, MISSOURIPledged-Revenue Coverage,Last Ten Fiscal Years(dollars in thousands)
187
Justice Center Leasehold Revenue Bonds (1) (2)Prisoner Less: NetHousing Operating Available Debt Service
Reimbursement Expenses Revenue Principal Interest Coverage
5,298$ - 5,298$ 11,020$ 2,500$ 0.39 4,494 - 4,494 7,465 3,659 0.40 6,919 - 6,919 5,680 4,238 0.70 6,535 - 6,535 6,620 4,507 0.59 6,375 - 6,375 6,285 4,836 0.57 7,857 - 7,857 5,980 5,144 0.71 6,725 - 6,725 5,339 4,927 0.66 5,756 - 5,756 5,155 5,797 0.53 5,594 - 5,594 4,700 6,032 0.52 4,485 - 4,485 4,480 6,252 0.42
(1) Coverage ratio as defined by the various bond covenants may be different than that presented here.(2) Coverage ratio for Tax Increment Financings and for Leasehold Revenue Bonds combines several issues.

Table 15CITY OF ST. LOUIS, MISSOURIPledged-Revenue Coverage,Last Ten Fiscal Years(dollars in thousands)
188
Civil Courts/Carnahan Courthouse Leasehold Revenue Bonds (1) (2)
Less: NetCourt Operating Available Debt ServiceFees Expenses Revenue Principal Interest Coverage
1,492$ -$ 1,492$ 2,635$ 1,332$ 0.4 1,368 - 1,368 160 1,349 0.9 1,419 - 1,419 2,255 493 0.5 1,499 - 1,499 2,155 1,563 0.4 1,496 - 1,496 2,075 1,651 0.4 1,354 - 1,354 1,985 1,908 0.3 1,406 - 1,406 1,905 1,992 0.4 1,355 - 1,355 1,850 2,050 0.3 1,417 - 1,417 1,540 2,365 0.4 1,311 - 1,311 1,465 2,297 0.3
(1) Coverage ratio as defined by the various bond covenants may be different than that presented here.(2) Coverage ratio for Tax Increment Financings and for Leasehold Revenue Bonds combines several issues.

Table 15CITY OF ST. LOUIS, MISSOURIPledged-Revenue Coverage,Last Ten Fiscal Years(dollars in thousands)
189
Convention and Sports FacilityProject Revenue Bonds
Less: Net3.5% hotel Operating Available Debt Servicesales Tax Expenses Revenue Principal Interest Coverage
7,365$ -$ 7,365$ 3,927$ 2,073$ 1.23 6,417 - 6,417 3,781 2,219 1.07 6,255 - 6,255 3,643 2,357 1.04 6,513 - 6,513 3,512 2,488 1.09 5,616 - 5,616 4,088 1,912 0.94 5,767 - 5,767 3,261 2,739 0.96 5,388 - 5,388 3,158 2,842 0.90 5,278 - 5,278 3,061 2,939 0.88 5,104 - 5,104 2,951 3,049 0.85 5,208 - 5,208 2,831 3,169 0.87
(1) Coverage ratio as defined by the various bond covenants may be different than that presented here.(2) Coverage ratio for Tax Increment Financings and for Leasehold Revenue Bonds combines several issues.

Table 15CITY OF ST. LOUIS, MISSOURIPledged-Revenue Coverage,Last Ten Fiscal Years(dollars in thousands)
190
Forest Park Leasehold Revenue Bonds
10.4% of the Less: Net1/2c capital Operating Available Debt Servicesales Tax Expenses Revenue Principal Interest Coverage
1,905$ -$ 1,905$ 865$ 508$ 1.39 1,740 - 1,740 835 533 1.27 1,722 - 1,722 805 563 1.26 1,814 - 1,814 785 587 1.32 1,849 - 1,849 760 610 1.35 1,839 - 1,839 740 632 1.34 1,789 - 1,789 715 653 1.31 1,741 - 1,741 515 865 1.26 1,701 - 1,701 490 887 1.24 1,749 - 1,749 470 908 1.27
(1) Coverage ratio as defined by the various bond covenants may be different than that presented here.(2) Coverage ratio for Tax Increment Financings and for Leasehold Revenue Bonds combines several issues.

Table 15CITY OF ST. LOUIS, MISSOURIPledged-Revenue Coverage,Last Ten Fiscal Years(dollars in thousands)
191
Recreation Sales Tax Leasehold Revenue Bonds (1) (2)
Parks and Less: NetRecreation Operating Available Debt ServiceSales Tax Expenses Revenue Principal Interest Coverage
4,520$ -$ 4,520$ 985$ 2,252$ 1.40 4,152 - 4,152 950 2,290 1.28 4,055 - 4,055 910 2,326 1.25 4,280 - 4,280 875 2,361 1.32 4,425 - 4,425 1,665 1,442 1.42
- - - - - - - - - - - - - - - - - - - - - - - - - - - - - -
(1) Coverage ratio as defined by the various bond covenants may be different than that presented here.(2) Coverage ratio for Tax Increment Financings and for Leasehold Revenue Bonds combines several issues.
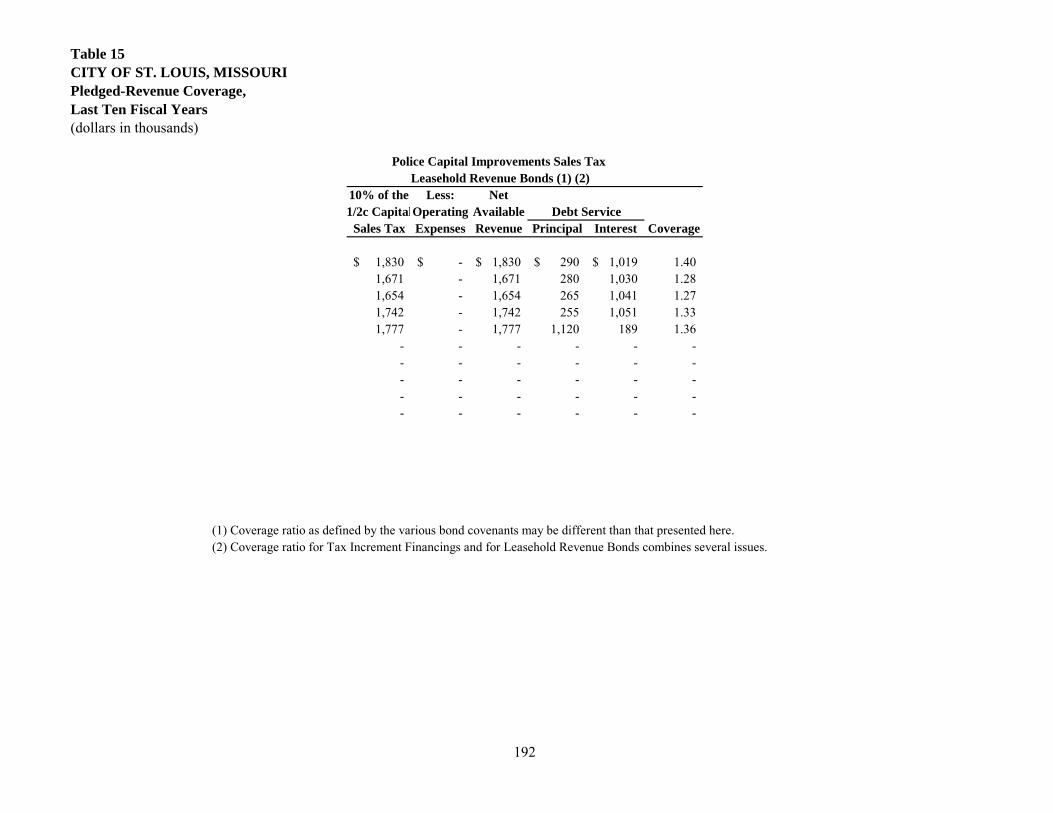
Table 15CITY OF ST. LOUIS, MISSOURIPledged-Revenue Coverage,Last Ten Fiscal Years(dollars in thousands)
192
Police Capital Improvements Sales Tax Leasehold Revenue Bonds (1) (2)
10% of the Less: Net1/2c CapitalOperating Available Debt Service
Sales Tax Expenses Revenue Principal Interest Coverage
1,830$ -$ 1,830$ 290$ 1,019$ 1.40 1,671 - 1,671 280 1,030 1.28 1,654 - 1,654 265 1,041 1.27 1,742 - 1,742 255 1,051 1.33 1,777 - 1,777 1,120 189 1.36
- - - - - - - - - - - - - - - - - - - - - - - - - - - - - -
(1) Coverage ratio as defined by the various bond covenants may be different than that presented here.(2) Coverage ratio for Tax Increment Financings and for Leasehold Revenue Bonds combines several issues.

193
Table 16
(4) (4)PersonalIncome Per Capita (1) (2) (3)
Calendar (1) (thousands Personal Median Public School Unemployment Year Population of dollars) Income Age Enrollment Rate
2011 319,008 $ 11,440,058 $ 35,861 33.9 23,576 7.8%2010 319,294 11,031,613 34,599 34.6 25,046 8.7%2009 356,587 11,453,476 36,022 35.4 26,108 11.7%2008 356,730 10,925,710 34,362 36.3 27,574 7.8%2007 355,663 10,491,667 32,773 36.3 32,135 7.0%2006 353,837 9,854,572 30,327 35.6 35,361 6.9%2005 352,572 9,590,266 28,975 35.4 35,251 7.9%2004 * 350,705 9,285,829 26,478 35.7 36,954 8.7%2003 * 348,039 9,128,411 26,228 34.4 39,974 8.4%2002 * 347,252 9,162,420 26,162 33.8 39,524 7.8%
NOTES:
(2) Data provided by the Missouri Dept. of Elementary and Secondary Education(3) Data provided by the U. S. Bureau of Labor Statistics.(4) Source: U.S. Bureau of Economic Analysis-Calendar Year 2011 figures are estimates; actual statistics for this period are released in November 2012. Calendar Years 2005-2010 have been updated to reflect actual statistics released as of April 2012.
CITY OF ST. LOUIS, MISSOURIDemographic and Economic Statistics Last Ten Calendar Years
Years 2002, 2003, and 2004.
(1) Source: Census Bureau -Population estimates since 2000 have been slightly inconsistent because the Census Bureau has used an Administrative Records methodology whereas the City has used a Housing Unit methodology.* Statistics reflect the City's successful challenge of the Bureau's methodology for Calendar

194
Table 17
Calendar Year Calendar Year2011 2002
Percentage Percentageof Total City of Total City
Employer Employees Rank Employment Employees Rank Employment
Washington University 14,422 1 3.37% 11,662 2 2.30%BJC Healthcare 12,696 2 2.97% 15,017 1 2.96%St. Louis University 10,140 3 2.37% 8,977 5 1.77%City of St. Louis 8,099 4 1.89% 9,955 3 1.96%Defense Finance & Acct Services 6,320 5 1.48% - - Wells Fargo 5,524 6 1.29% 5,490 10 1.08%St. Louis Board of Education 4,948 7 1.16% 8,996 4 1.77%AT&T Services 4,358 8 1.02% 7,155 6 1.41%State of Missouri 4,182 9 0.98% 6,178 9 1.22%Anheuser Busch, Inc. 3,701 10 0.86% - - US Postal Service - - 6,889 7 1.36%Tenet Health Systems - - 6,297 8 1.24%
74,390 17.38% 86,616 17.08%
Source: City Collector of Revenue
CITY OF ST. LOUIS, MISSOURIPrincipal Employers,Current Calendar Year and Nine Years Ago

195
Table 18CITY OF ST. LOUIS, MISSOURIFull-time Equivalent City Government Employees by Function/ProgramLast Ten Fiscal Years
2012 2011 2010 2009 2008 2007 2006 2005 2004 2003
Function/Program
Primary Government Employees:General government 498 509 528 539 535 525 518 514 525 550Convention and tourism 3 2 2 3 3 3 3 3 3 3Parks and recreation 313 309 322 328 331 324 328 331 336 334Judicial 706 714 709 721 717 705 717 726 731 733Streets 455 455 464 463 458 452 454 456 466 472Fire 813 829 830 830 830 831 831 830 829 829Police 1,940 1,943 1,937 1,992 1,938 1,919 1,916 1,899 2,051 2,075Other 709 716 774 814 804 753 756 762 812 844Health and welfare 220 219 257 278 274 274 255 287 314 375Public service 222 224 251 258 256 245 240 259 301 339Community development 65 65 65 65 66 62 65 64 71 88
Business-Type Employees:Airport 555 580 583 637 637 634 623 582 589 781Water Division 341 361 380 380 376 380 382 384 389 391Parking Division 89 103 86 90 142 135 162 158 157 139
Total Employees 6,929 7,029 7,188 7,398 7,367 7,242 7,250 7,255 7,574 7,953
Full-time Equivalent Employees as of June 30

196
Table 19CITY OF ST. LOUIS, MISSOURIOperating Indicators by Function/ProgramLast Ten Fiscal Years
Fiscal Year2012 2011 2010 2009 2008 2007 2006 2005 2004 2003
General Government Payroll checks issued 185,338 191,837 201,642 202,802 269,186 250,945 200,939 194,477 202,244 205,108 Invoices processed 96,571 95,375 98,772 103,352 108,703 107,796 107,943 109,385 109,346 111,372 Deeds recorded 58,991 61,841 66,351 65,740 81,692 107,042 101,638 97,069 96,827 98,704 Birth and death certificate copies issued 55,773 57,898 61,836 65,874 69,107 73,205 76,618 61,677 65,530 Marriage licenses processed 2,318 2,548 2,570 2,523 2,453 2,739 2,566 2,592 2,695 2,694 Real property parcels 145,166 145,572 145,858 145,507 145,930 142,168 142,351 140,979 139,927 138,742 Personal property accounts 109,439 108,257 108,427 110,285 106,176 105,571 109,342 114,442 113,737 106,955 Problem properties cases heard* 8,942 8,981 8,491 7,932 9,793 6,050 7,954 11,593 8,429 2,745 Citizen Service Bureau (CSB) calls answered 124,637 122,470 102,964 119,531 175,339 223,776 230,541 239,610 236,582 152,021 CSB service requests issued 109,596 119,109 107,116 90,177 107,431 104,909 97,050 96,134 98,589 99,006
Parks and Recreation and Forestry Park use permits issued 3,066 3,170 3,727 3,283 3,434 3,251 2,999 2,714 1,410 1,168 Vacant lot grass cuttings 51,845 52,110 51,015 52,929 95,191 68,904 71,578 80,949 77,363 56,817 Vacant building grass cuttings 24,870 24,124 23,520 22,332 51,663 33,320 31,927 41,320 36,691 24,451 CSB service requests received 24,009 25,660 23,007 26,655 47,408 24,665 23,745 22,524 23,635 24,795
Judicial Juvenile cases-referrals * 3,031 3,444 3,540 4,282 4,840 5,450 6,686 5,870 6,749 7,048 Jurors summoned 59,650 58,230 65,805 71,187 74,450 74,850 71,300 66,400 64,750 71,800 Jurors who served 23,186 20,019 21,582 26,030 23,874 21,059 22,131 21,628 22,286 24,437
Streets Tons of waste placed in landfills 164,134 173,812 185,848 199,725 186,132 195,958 220,085 246,613 213,591 213,228 Tons of waste recycled 12,830 4,842 3,851 4,900 4,855 4,141 1,848 1,784 1,368 1,368 Vehicles towed 8,470 9,850 9,765 11,523 8,829 10,489 11,793 11,508 13,505 14,130
Public Safety Fire Suppression calls 48,159 59,683 51,464 45,855 45,137 44,751 41,513 41,603 40,021 39,847 EMS calls 61,401 74,929 73,771 60,062 59,241 59,209 58,112 57,960 58,205 57,746
Police Directed calls for service* 300,921 309,696 321,015 325,958 348,648 320,499 333,351 343,149 347,630 374,045 Felony arrests* 15,309 13,424 13,284 14,186 14,930 15,162 13,837 13,084 14,213 14,422 Misdemeanor arrests* 8,574 6,986 7,948 8,569 10,048 10,440 10,323 10,820 10,244 11,768 Police reports written* 72,057 76,204 83,339 86,316 94,539 106,086 100,007 99,699 111,893 112,633

197
Public Service Contracts executed 108 81 298 252 205 164 189 170 158 205 Bridges inspected 40 44 33 36 37 36 35 34 33 42
Airport Major airlines 10 10 10 10 9 10 9 10 9 8 Commuter airlines 19 19 19 20 22 22 13 12 12 12 Air cargo carriers 3 3 3 3 4 5 6 6 6 6 Passengers 12,681,341 12,399,226 12,514,653 13,271,170 15,220,080 15,136,182 16,655,185 14,072,947 16,064,247 23,675,012 Aircraft operations 191,653 186,908 195,409 226,052 255,800 260,151 304,631 254,399 293,474 414,787
Water Division Bills issued - metered 52,000 52,128 52,432 53,208 53,324 53,388 56,452 54,008 54,452 54,904 Bills issued - flat rate 316,000 316,596 321,720 325,420 327,804 330,420 330,012 328,572 330,936 334,460 Millions of gallons of water purified 46,597 43,345 44,015 46,223 47,479 48,137 48,923 49,724 49,883 49,098
* Information based on calendar year

198
Table 20CITY OF ST. LOUIS, MISSOURICapital Asset Statistics by Function/ProgramLast Ten Fiscal Years
Fiscal Year2012 2011 2010 2009 2008 2007 2006 2005 2004 2003
Parks and Recreation Park acreage 3,248 3,243 2,960 2,722 2,717 2,717 2,717 2,717 2,717 2,717 Miles of bicycle paths 36 36 36 36 36 35 28 27 27 17 Athletic fields 153 152 152 152 152 152 188 188 188 188 Recreation centers 9 7 9 8 9 9 9 9 9 9 Neighborhood centers - - - 1 1 1 1 1 1 1 Swimming pools 12 7 9 8 8 8 8 8 8 8 Golf courses 4 3 3 2 2 2 2 2 3 3
Judicial Court houses 3 3 3 3 3 3 3 3 3 3
Streets Alley containers 26,507 27,724 27,724 27,724 27,814 28,282 28,669 28,669 28,669 29,334 Rollout carts 39,952 34,770 21,202 21,202 19,899 20,379 Recycling containers 5,744 3,434 125 136 130 135 116 116 116 81 Streets - paved (miles) 16 18 21 21 30 21 16 16 23 32 Streets - (miles) 1,100 1,100 1,100 1,100 1,100 1,100 1,100 1,100 1,100 1,100 Alleys (miles) 450 450 450 450 450 450 400 400 400 400 Street, alley and easement lights 70,000 70,000 70,000 70,059 69,919 69,839 69,800 69,800 69,800 69,800
Public Safety Fire Fire stations 30 30 30 30 30 30 30 30 30 30 Fire department vehicles 122 122 114 114 144 144 178 178 177 177
Police Police stations 3 3 3 3 3 3 4 4 4 4 Police vehicles 757 694 710 703 703 700 651 601 642 645
Public Service Bridges structurally deficient 14 15 17 5 16 16 13 6 11 12 Bridges functionally obsolete 27 30 22 20 22 22 26 29 34 34 Total bridges 73 72 71 72 69 71 73 71 76 75
Water Division Miles of water mains 1,400 1,400 1,400 1,400 1,400 1,400 1,400 1,400 1,400 1,400 Water storage capacity (gallons) 128,000,000 128,000,000 128,000,000 128,000,000 128,000,000 128,000,000 128,000,000 128,000,000 128,000,000 128,000,000 Treatment Plants 2 2 2 2 2 2 2 2 2 2

TABLE III-1ST. LOUIS MSA POPULATION TRENDS
2000 - 2011
Population Estimate Avg. Annual
County/Area 7/1/2000 7/1/2010 7/1/2011 Growth Rate
St. Louis, MO-IL MSA1
Franklin, MO 94,050 101,543 101,938 0.8%Jefferson, MO 198,937 219,056 219,480 1.0%Lincoln, MO 39,196 52,686 53,076 3.1%St. Charles, MO 286,218 361,725 365,151 2.5%St. Louis, MO 1,016,178 998,772 998,692 -0.2%St. Louis City, MO 347,144 319,008 318,069 -0.9%Warren, MO 24,745 32,557 32,515 2.8%Washington, MO 23,395 25,191 25,076 0.7%Bond, IL 17,735 17,777 17,727 0.0%Calhoun, IL 5,086 5,093 5,048 -0.1%Clinton, IL 35,565 37,838 37,956 0.7%Jersey, IL 21,642 22,963 22,916 0.6%Macoupin, IL 48,972 47,791 47,687 -0.3%Madison, IL 259,204 269,314 268,459 0.4%Monroe, IL 27,764 33,009 33,306 1.8%St. Clair, IL 256,462 270,399 270,259 0.5%Total MSA 2,702,293 2,814,722 2,817,355 0.4%
Missouri 5,607,285 5,995,715 6,010,688 0.7%Illinois 12,434,161 12,841,980 12,869,257 0.3%United States 282,162,411 309,330,219 311,591,917 1.0%1 MSA includes Sullivan City in Crawford County but population count is notincluded in MSA totals from Census.Source: U.S. Census Bureau.

TABLE III-2ST. LOUIS MSA CIVILIAN LABOR FORCE
1999 - 2012YTD
Labor Force UnemploymentYear Total Employed Unemployed Rate
1999 1,387,517 1,339,093 48,424 3.5%2000 1,423,746 1,373,227 50,519 3.5%2001 1,432,648 1,367,082 65,566 4.6%2002 1,434,464 1,357,248 77,216 5.4%2003 1,425,463 1,342,568 82,895 5.8%2004 1,424,186 1,338,527 85,659 6.0%2005 1,436,528 1,356,121 80,407 5.6%2006 1,448,341 1,374,750 73,591 5.1%2007 1,452,539 1,375,038 77,501 5.3%2008 1,450,392 1,357,347 93,045 6.4%2009 1,448,782 1,304,570 144,212 10.0%2010 1,448,329 1,306,076 142,253 9.8%2011 1,449,770 1,320,729 129,041 8.9%
Jan-Oct 2011 1,454,286 1,329,428 124,858 8.6%Jan-Oct 2012 1,439,625 1,336,236 103,389 7.2%
Average Annual Growth RateJan-Oct 2012 -1.0% 0.5% -17.2%
1999-2011 0.4% -0.1% 8.5%Source: U.S. Bureau of Labor Statistics.

TABLE III-3SELECTED MAJOR EMPLOYERS IN THE ST. LOUIS REGION
2011
Firms by Employment Size
More than 10,000 EmployeesBJC HealthCare* SchnucksBoeing Defense, Space & Security* Wal-Mart Stores Inc.Scott Air Force Base* Washington University in St. Louis*SSM Health Care*5,000 — 9,999 Employees
AT&T Communications, Inc. St. Louis Community College District*City of St. Louis* St. Louis Public Schools*McDonald's Special School District of St. Louis County*Mercy Health Tenet Healthsystem Medical Inc.National Geospace-Intelligence Agency U.S. Postal ServiceSaint Louis University* Wells Fargo Advisors*2,500 — 4,999 Employees
Ameren Corporation* Lowe'sAnheuser-Busch InBev Mastercard WorldwideArchdiocese of St. Louis* Monsanto Co.Bank of America Panera Bread Company*Citimortgage* Parkway School District*Covidien Rockwood School District*Delmar Gardens Enterprises* St. Anthony's Medical Center*Dierbergs Markets* St. Louis County Government*Edward Jones* Supervalu Inc.Emerson Electric Company Target Corp.Enterprise Holdings* U.S. BancorpExpress Scripts Inc.* United Parcel Service Inc.Fort Zumwalt School District* University of Missouri - St. LouisHome Depot USA WalgreensImo's PizzaSources: St Louis Regional Chamber & Growth Association based on "Book of Lists 2011" St. LouisBusiness Journal; "Hoovers" Dun & Bradstreet; "Sorkins Directory" Sorkins; "ReferenceUSA"

TABLE IV-1LAMBERT-ST. LOUIS INTERNATIONAL AIRPORT
SCHEDULED AIR CARRIERS SERVING THE AIRPORTAs of December 2012
Scheduled Mainline Regional All-CargoAir Tran1 Air Choice One4 Air Transport Int'l.3
Alaska1 Air Wisconsin2 (US Airways) Capital Cargo International3
American1 American Eagle2 (American) Federal Express1
Delta1 Atlantic Southeast2 (Delta) United Parcel Service1
Frontier1 Chautauqua2 (Delta, Frontier, United)Southwest1 Comair2 (Delta)United1 Compass Airlines2 (Delta)US Airways1 ExpressJet2 (United)
Go Jet2 (Delta, United)Hyannis Air Service, Inc., d/b/a Cape Air1
Jazz Aviation LP, d/b/a Air Canada Jazz3
Mesa2 (US Airways)Mesaba2 (Delta)MN Airlines, LLC d/b/a Sun Country3
Pinnacle2 (Delta)PSA2 (US Airways)Republic2 (US Airways)Shuttle America2 (Delta, United)Skywest2 (Delta, United)Trans States2 (United, US Airways)
1 Signatory Airline (holds an Airport Use and Lease Agreement)2 Non-Signatory Airline that is a Designated Affiliate of a Signatory Airline (The related Signatory Airline is parenthetically noted.)3 Non-Signatory Airline that is not a Designated Affiliate.4 Air Choice One has scheduled service (Essential Air Service Routes), but does not have an agreement with the Airport.Source: Airport management records.

TABLE IV-3LAMBERT-ST. LOUIS INTERNATIONAL AIRPORT
O&D AND CONNECTING ENPLANEMENTS1999 - OCTOBER 2012
O&D Connecting TotalYear Actual Share Actual Share Enplanements
CY 1999 7,127,141 47.2% 7,965,840 52.8% 15,092,9812000 7,253,816 47.4% 8,060,308 52.6% 15,314,1242001 6,323,229 47.3% 7,042,280 52.7% 13,365,5092002 5,750,948 44.8% 7,095,086 55.2% 12,846,0342003 5,229,015 51.3% 4,967,507 48.7% 10,196,5222004 5,263,363 78.5% 1,444,357 21.5% 6,707,7202005 5,616,263 76.3% 1,746,655 23.7% 7,362,9182006 5,749,638 75.6% 1,855,260 24.4% 7,604,8982007 5,854,885 75.9% 1,860,449 24.1% 7,715,3342008 5,663,666 78.6% 1,544,224 21.4% 7,207,8902009 5,271,309 81.8% 1,175,638 18.2% 6,446,9472010 5,295,008 85.7% 883,811 14.3% 6,178,8192011 5,397,840 85.9% 885,079 14.1% 6,282,919
Jan.-Oct. 2011 4,530,153 86.1% 731,046 13.9% 5,261,199Jan.-Oct. 2012 4,530,608 85.1% 795,208 14.9% 5,325,816
2000 7,193,492 47.1% 8,065,665 52.9% 15,259,1572001 7,057,885 47.0% 7,949,293 53.0% 15,007,1782002 5,779,692 45.8% 6,839,748 54.2% 12,619,4402003 5,510,858 46.6% 6,317,177 53.4% 11,828,0352004 5,159,761 64.4% 2,857,858 35.6% 8,017,6192005 5,518,897 78.3% 1,529,462 21.7% 7,048,3592006 5,724,298 75.1% 1,898,886 24.9% 7,623,1842007 5,740,674 76.1% 1,802,595 23.9% 7,543,2692008 5,848,852 76.8% 1,762,267 23.2% 7,611,1192009 5,361,078 80.2% 1,322,649 19.8% 6,683,7272010 5,260,429 83.8% 1,016,283 16.2% 6,276,7122011 5,341,132 86.0% 870,163 14.0% 6,211,2952012 5,430,403 85.5% 923,188 14.5% 6,353,591
Average Annual Growth RateCY 1999-2011 -2.3% - -16.7% - -7.0%Jan.-Oct. 2012 0.0% 8.8% 1.2%FY 2000-2012 -2.3% - -16.5% - -7.0%
Source: Airport Records

TABLE IV-4LAMBERT-ST. LOUIS INTERNATIONAL AIRPORT
DOMESTIC AND INTERNATIONAL ENPLANEMENTS1999 - OCTOBER 2012
Domestic International TotalYear Actual Share Actual Share Enplanements
CY 1999 14,907,791 98.8% 185,190 1.2% 15,092,9812000 15,116,224 98.7% 197,900 1.3% 15,314,1242001 13,105,360 98.1% 260,149 1.9% 13,365,5092002 12,561,382 97.8% 284,652 2.2% 12,846,0342003 9,989,785 98.0% 206,737 2.0% 10,196,5222004 6,583,603 98.1% 124,117 1.9% 6,707,7202005 7,241,915 98.4% 121,003 1.6% 7,362,9182006 7,484,214 98.4% 120,684 1.6% 7,604,8982007 7,590,128 98.4% 125,206 1.6% 7,715,3342008 7,111,945 98.7% 95,945 1.3% 7,207,8902009 6,369,937 98.8% 77,010 1.2% 6,446,9472010 6,092,355 98.6% 86,464 1.4% 6,178,8192011 6,196,137 98.6% 86,782 1.4% 6,282,919
Jan.-Oct. 2011 5,183,142 98.5% 78,057 1.5% 5,261,199Jan.-Oct. 2012 5,246,815 98.5% 79,001 1.5% 5,325,816
FY 2000 15,080,187 98.8% 178,970 1.2% 15,259,1572001 14,769,779 98.4% 237,399 1.6% 15,007,1782002 12,339,479 97.8% 279,961 2.2% 12,619,4402003 11,580,770 97.9% 247,265 2.1% 11,828,0352004 7,849,427 97.9% 168,192 2.1% 8,017,6192005 6,924,320 98.2% 124,039 1.8% 7,048,3592006 7,508,864 98.5% 114,320 1.5% 7,623,1842007 7,417,586 98.3% 125,683 1.7% 7,543,2692008 7,504,901 98.6% 106,218 1.4% 7,611,1192009 6,603,819 98.8% 79,908 1.2% 6,683,7272010 6,189,254 98.6% 87,458 1.4% 6,276,7122011 6,123,806 98.6% 87,489 1.4% 6,211,2952012 6,268,613 98.7% 84,978 1.3% 6,353,591
Average Annual Growth RateCY 1999-2011 -7.1% - -6.1% - -7.0%Jan.-Oct. 2011 1.2% 1.2% 1.2%FY 2000-2012 -7.1% - -6.0% - -7.0%
Source: Airport records.

TABLE IV-5LAMBERT-ST. LOUIS INTERNATIONAL AIRPORT
AIRLINE MARKET SHARECY 2005 - OCTOBER 2012
Airline 2005 2006 2007 2008 2009 2010 2011 Jan.-Oct. 2011 Jan.-Oct. 2012 2005 2006 2007 2008 2009 2010 2011 Jan.-Oct. 2011 Jan.-Oct. 2012
Mainline air carrier Alaska 14,212 49,017 40,496 41,947 0.2% 0.8% 0.8% 0.8% America West 113,227 118,418 89,271 1.5% 1.6% 1.2% American 2,536,041 2,656,712 2,636,223 2,241,182 1,804,639 1,248,804 1,068,397 891,059 818,855 34.4% 34.9% 34.2% 31.1% 28.0% 20.2% 17.0% 16.9% 15.4% AirTran 98,688 131,221 145,044 128,654 123,001 103,647 94,551 1.3% 1.8% 2.2% 2.1% 2.0% 2.0% 1.8% Continental 399 56 940 446 17,942 15,648 117 0.0% 0.0% 0.0% 0.0% 0.3% 0.3% 0.0% Delta 169,932 154,900 171,081 159,721 137,419 513,688 547,760 456,752 450,342 2.3% 2.0% 2.2% 2.2% 2.1% 8.3% 8.7% 8.7% 8.5% Frontier 99,314 110,658 133,266 117,686 114,940 116,868 132,193 113,558 186,763 1.3% 1.5% 1.7% 1.6% 1.8% 1.9% 2.1% 2.2% 3.5% Northwest 279,275 237,420 243,208 225,213 154,881 9,044 - - - 3.8% 3.1% 3.2% 3.1% 2.4% 0.1% 0.0% 0.0% - Southwest 1,688,940 1,886,811 1,960,941 2,104,372 2,170,283 2,625,623 2,834,365 2,363,285 2,488,125 22.9% 24.8% 25.4% 29.2% 33.7% 42.5% 45.1% 44.9% 46.7% United 130,270 93,751 102,609 66,710 26,681 31,011 34,939 29,159 28,274 1.8% 1.2% 1.3% 0.9% 0.4% 0.5% 0.6% 0.6% 0.5% US Airways 64,542 430 56,409 148,197 123,379 181,128 225,825 180,480 179,525 0.9% 0.0% 0.7% 2.1% 1.9% 2.9% 3.6% 3.4% 3.4% USA 3000 74,495 79,811 86,299 86,941 83,888 57,346 61,619 55,135 2,650 1.0% 1.0% 1.1% 1.2% 1.3% 0.9% 1.0% 1.0% 0.0%Subtotal-Mainline 5,156,435 5,338,911 5,577,995 5,281,299 4,762,094 4,926,824 5,095,058 4,249,219 4,291,149 70.0% 70.2% 72.3% 73.3% 73.9% 79.7% 81.1% 80.8% 80.6%
Regional air carrier Air Canada 19,885 6,407 0.3% 0.1% Air Choice One 948 2,442 4,228 3,354 7,499 0.0% 0.0% 0.1% 0.1% 0.1% AirTran Connection/Skywest 3,102 40,790 17,695 17,695 - 0.0% 0.7% 0.3% 0.3% 0.0% AA Connection/American Eagle 65,234 44,700 31,314 21,795 106,990 17,121 10,014 9,440 39,182 0.9% 0.6% 0.4% 0.3% 1.7% 0.3% 0.2% 0.2% 0.7% AA Connection/Chautauqua 420,598 475,580 469,301 445,215 451,411 96,735 0 5.7% 6.3% 6.1% 6.2% 7.0% 1.6% 0.0% AA Connection/RegionsAir 68,728 67,493 10,220 0.9% 0.9% 0.1% AA Connection/Trans States 717,520 674,784 646,763 445,330 38,734 9.7% 8.9% 8.4% 6.2% 0.6% Cape Air 2,112 21,557 37,436 30,340 35,874 0.0% 0.3% 0.6% 0.6% 0.7% Continental Express/Chautauqua 64,541 83,786 61,928 54,696 17,957 17,957 0 0.8% 1.2% 1.0% 0.9% 0.3% 0.3% 0.0% Continental Express/Expressjet 190,223 196,899 130,644 102,896 114,649 119,543 118,427 103,918 95,326 2.6% 2.6% 1.7% 1.4% 1.8% 1.9% 1.9% 2.0% 1.8% Continental Express/Skywest 11,943 9,349 1,579 0.2% 0.2% 0.0% Continental Express/Trans States 24,250 10,482 80,705 0.4% 0.2% 1.5% Delta Connection/Atlantic Coast Delta Connection/ASA 93,610 69,686 31,160 59,425 55,861 35,171 56,211 49,495 25,889 1.3% 0.9% 0.4% 0.8% 0.9% 0.6% 0.9% 0.9% 0.5% Delta Connection/Chautauqua 22,913 58,712 68,731 26,781 11,371 3,771 1,535 5,949 0.3% 0.8% 1.0% 0.4% 0.2% 0.1% 0.0% 0.1% Delta Connection/Comair 124,487 68,594 44,042 26,693 46,027 62,743 112,929 98,419 32,426 1.7% 0.9% 0.6% 0.4% 0.7% 1.0% 1.8% 1.9% 0.6% Delta Connection/Compass 41,236 24,302 20,196 34,450 0.7% 0.4% 0.4% 0.6% Delta Connection/Freedom 1,267 8,869 6,128 0 0 0 0.0% 0.1% 0.1% 0.0% 0.0% 0 Delta Connection/Mesaba 2,625 62,742 82,592 72,199 468 0.0% 1.0% 1.3% 1.4% 0.0% Delta Connection/Pinnacle 1,086 27,016 37,093 24,620 19,539 82,114 0.0% 0.4% 0.6% 0.4% 0.4% 1.5% Delta Connection/Shuttle America 3,315 7,190 12,167 7,015 19,863 11,944 12,503 0.0% 0.1% 0.2% 0.1% 0.3% 0.2% 0.2% Delta Connection/Skywest 11,615 40,262 45,364 60,583 26,042 53,398 44,896 55,847 0.2% 0.5% 0.6% 0.9% 0.4% 0.8% 0.9% 1.0% Delta Connection/Go Jet - - 0 0 0 0 0 0 61,343 0.0% 0.0% 0.0% 0.0% 1.2% Frontier Connection/Chautauqua 15,348 19,771 19,771 0 0.2% 0.3% 0.4% 0.0% Great Lakes 1,788 10,816 7,277 13 0 0 0 0.0% 0.2% 0.1% 0.0% 0.0% 0.0% 0.0% Jazz Air 13,854 20,959 17,089 13,926 16,518 15,622 13,426 14,441 0.2% 0.3% 0.2% 0.2% 0.3% 0.2% 0.3% 0.3% Midwest Connection/Skyway 8,708 10,389 13,106 1,874 0.1% 0.1% 0.2% 0.0% Midwest Connection/Skywest 7,332 0.1% Northwest Airlink/Comair 63 93 0.0% 0.0% Northwest Airlink/Compass 23,937 4,384 0.4% 0.1% Northwest Airlink/Mesaba 42,096 25,522 7,863 42,009 69,799 3,030 0.6% 0.3% 0.1% 0.6% 1.1% 0.0% Northwest Airlink/Pinnacle 44,695 67,656 71,891 57,884 56,345 3,704 0.6% 0.9% 0.9% 0.8% 0.9% 0.1% United Express/Air Wisc. 11,389 0.2% United Express/Go Jet 18,395 119,952 125,645 116,892 142,904 189,156 170,585 143,388 135,107 0.2% 1.6% 1.6% 1.6% 2.2% 3.1% 2.7% 2.7% 2.5% United Express/Shuttle America 63 28,105 21,858 30,852 0.0% 0.4% 0.4% 0.6% United Express/Skywest 41,844 12,119 17 19,343 17,073 27,494 0.6% 0.2% 0.0% 0.3% 0.3% 0.5% United Express/Trans States 109,647 96,645 101,028 144,848 140,542 141,950 114,887 100,258 74,781 1.5% 1.3% 1.3% 2.0% 2.2% 2.3% 1.8% 1.9% 1.4% United Express/Mesa 15,065 60 0.2% 0.0% United Express/Air Midwest 1,186 2,401 0.0% 0.0% US Airways Express/Air Wisc. 6,857 44,278 26,035 21,690 41,067 19,167 20,065 17,582 24,981 0.1% 0.6% 0.3% 0.3% 0.6% 0.3% 0.3% 0.3% 0.5% US Airways Express/Chautauqua 1,167 1,687 1,398 0 0.0% 0.0% 0.0% US Airways Express/Mesa 52,952 81,743 60,432 53,594 41,908 53,019 44,824 43,448 50,352 0.7% 1.1% 0.8% 0.7% 0.7% 0.9% 0.7% 0.8% 0.9% US Airways Express/PSA 25,455 22,501 20,326 21,072 12,742 13,454 6,648 6,119 10,332 0.3% 0.3% 0.3% 0.3% 0.2% 0.2% 0.1% 0.1% 0.2% US Airways Express/Republic 7,273 43,799 67,761 81,371 99,247 78,703 64,524 51,995 0.1% 0.6% 0.9% 1.3% 1.6% 1.3% 1.2% 1.0% US Airways Express/Trans States 38,804 38,298 39,553 27,389 26,223 29,835 30,006 25,390 26,518 0.5% 0.5% 0.5% 0.4% 0.4% 0.5% 0.5% 0.5% 0.5% Vision Air 2,948 2,820 461 0.0% 0.1% 0.0%Subtotal-Regional 2,117,359 2,181,774 2,066,367 1,897,761 1,677,970 1,232,758 1,171,203 996,415 1,018,468 28.8% 28.7% 26.8% 26.3% 26.0% 20.0% 18.6% 18.9% 19.1%Subtotal-Charter 89,124 84,213 70,972 28,830 6,883 19,237 16,658 15,565 16,199 1.2% 1.1% 0.9% 0.4% 0.1% 0.3% 0.3% 0.3% 0.3%Total Enplanements 7,362,918 7,604,898 7,715,334 7,207,890 6,446,947 6,178,819 6,282,919 5,261,199 5,325,816 100.0% 100.0% 100.0% 100.0% 100.0% 100.0% 100.0% 100.0% 100.0%
Source: Airport records.

TABLE IV-10LAMBERT-ST. LOUIS INTERNATIONAL AIRPORT
HISTORICAL AIR CARGO (In Pounds)1
1999 - OCTOBER 2012
Freight MailYear Pounds Share Pounds Share Total
CY1999 211,601,498 73.2% 77,378,841 26.8% 288,980,3392000 214,749,669 74.8% 72,268,005 25.2% 287,017,6742001 212,177,374 78.8% 57,195,229 21.2% 269,372,6032002 191,472,804 67.3% 93,223,627 32.7% 284,696,4312003 178,056,476 69.9% 76,754,433 30.1% 254,810,9092004 169,255,722 73.4% 61,269,380 26.6% 230,525,1022005 168,362,101 75.5% 54,767,037 24.5% 223,129,1382006 142,445,586 72.7% 53,541,462 27.3% 195,987,0482007 133,695,393 72.8% 49,872,616 27.2% 183,568,0092008 131,750,989 73.7% 47,029,325 26.3% 178,780,3142009 122,500,361 74.9% 41,014,980 25.1% 163,515,3412010 114,693,688 75.7% 36,742,544 24.3% 151,436,232
2011 2 148,465,066 96.8% 4,924,811 3.2% 153,389,877
Jan.-Oct. 2011 123,711,982 96.7% 4,244,567 3.3% 127,956,549Jan.-Oct. 2012 122,962,312 97.2% 3,523,733 2.8% 126,486,045
FY 2000 215,766,693 74.0% 75,701,181 26.0% 291,467,8742001 215,879,453 75.9% 68,558,946 24.1% 284,438,3992002 192,103,187 72.5% 72,785,886 27.5% 264,889,0732003 194,538,626 69.5% 85,243,106 30.5% 279,781,7322004 168,677,926 71.9% 65,884,143 28.1% 234,562,0692005 179,472,307 72.8% 67,021,781 27.2% 246,494,0882006 158,158,030 74.3% 54,641,662 25.7% 212,799,6922007 135,622,875 72.0% 52,833,925 28.0% 188,456,8002008 136,522,284 74.0% 48,065,509 26.0% 184,587,7932009 126,031,707 74.7% 42,623,636 25.3% 168,655,3432010 116,188,205 74.8% 39,045,333 25.2% 155,233,5382011 132,512,594 77.2% 39,045,333 22.8% 171,557,9272012 147,856,584 97.3% 4,121,108 2.7% 151,977,692
Average Annual Growth RateCY 1999-2011 -2.9% -20.5% -5.1%Jan.-Oct. 2012 -0.6% -17.0% -1.1%FY 2000-2012 -3.1% -21.5% -5.3%
1 Includes enplaned and deplaned cargo.2 Increase in cargo freight pounds in CY 2011 due to reclassification of the cargo mailto cargo freight by the carrier.Source: Airport records.

Total Market 2004 2005 2006 2007 2008 2009 2010 2011 2012 1st Half 2013
Domestic
Number of Nonstop Destinations 82 85 81 75 72 69 64 57 59 59
Average Scheduled Daily Departures 340 353 339 317 307 261 225 229 228 228
Scheduled Departure Seats (000) 10,106 10,509 10,572 10,622 10,285 8,886 8,313 8,610 8,501 4,287
International
Number of Nonstop Destinations 3 7 4 6 5 5 5 6 5 5
Average Scheduled Daily Departures 2 2 3 4 3 3 3 3 3 3
Scheduled Departure Seats (000) 50 71 88 128 85 92 96 97 79 58
Total
Number of Nonstop Destinations 85 92 85 81 77 74 69 63 64 64
Average Scheduled Daily Departures 342 355 342 321 310 263 228 232 231 231
Scheduled Departure Seats (000) 10,157 10,580 10,660 10,750 10,354 8,978 8,409 8,707 8,580 4,344
American Airlines 2004 2005 2006 2007 2008 2009 2010 2011 2012 1st Half 2013
Domestic
Number of Nonstop Destinations 67 72 67 58 48 40 30 7 6 6
Average Scheduled Daily Departures 198 202 188 156 134 95 43 30 28 27
Scheduled Departure Seats (000) 4,828 5,084 5,027 4,693 4,144 3,113 1,881 1,608 1,464 708
International
Number of Nonstop Destinations 1 1 1 1 0 0 0 0 0 0
Average Scheduled Daily Departures 0.2 0.2 0.03 0.04 0 0 0 0 0 0
Scheduled Seats (000) 15 13 2 2 0 0 0 0 0 0
Total
Number of Nonstop Destinations 68 73 68 59 48 40 30 7 6 6
Average Scheduled Daily Departures 198 203 188 156 134 95 43 30 28 27
Scheduled Departure Seats (000) 4,843 5,097 5,028 4,695 4,144 3,113 1,881 1,608 1,464 708
Southwest Airlines 2004 2005 2006 2007 2008 2009 2010 2011 2012 1st Half 2013
Total - All Domestic
Number of Nonstop Destinations 21 22 22 22 25 24 31 33 36 36
Average Scheduled Daily Departures 57 60 65 68 72 68 74 80 84 86
Scheduled Departure Seats (000) 2,801 2,977 3,208 3,366 3,585 3,377 3,747 4,052 4,275 2,229
Delta Airlines 2004 2005 2006 2007 2008 2009 2010 2011 2012 1st Half 2013
Total - All Domestic
Number of Nonstop Destinations 4 4 4 4 4 4 10 10 10 8
Average Scheduled Daily Departures 18 20 15 16 17 16 29 36 32 29
Scheduled Departure Seats (000) 533 559 457 470 473 463 1,051 1,250 1,140 542
Source: OAG Schedules Database.
TABLE 1
TRENDS IN AIR SERVICE AT STL
CY 2004 - 2013 YTD

TABLE 2
BASE FORECAST ENPLANEMENTS
FY 2012 - 2016
Actual Forecast AAGR
Activity 2012 2013 2014 2015 2016 2012-2016
Mainline Air Carrier
American 1,043,000 1,023,000 1,041,000 1,066,000 1,094,000 1.2%
Delta 539,000 525,000 534,000 547,000 562,000 1.1%
Southwest 2,906,000 2,894,000 2,945,000 3,017,000 3,096,000 1.6%
Others 657,000 622,000 633,000 648,000 665,000 0.3%
Subtotal-Mainline 5,145,000 5,064,000 5,153,000 5,278,000 5,417,000 1.3%
Regional Air Carrier
American Connection 27,000 28,000 28,000 29,000 29,000 1.8%
Delta Regional 385,000 365,000 371,000 380,000 390,000 0.3%
Others 778,000 786,000 800,000 819,000 841,000 2.0%
Subtotal-Regional 1,191,000 1,178,000 1,199,000 1,228,000 1,260,000 1.4%
Charter 18,000 18,000 18,000 18,000 19,000 1.4%
Total-Enplanements 6,354,000 6,263,000 6,373,000 6,528,000 6,700,000 1.3%
Annual Growth Rate 2.3% -1.4% 1.8% 2.4% 2.6%
O&D 5,430,000 5,355,000 5,450,000 5,582,000 5,729,000 1.3%
Connecting 923,000 907,000 923,000 946,000 971,000 1.3%
Note: AAGR - Average Annual Growth Rate Figures Rounded to the nearest (000)
Forecasts rounded to the nearest (000); details may not add to totals as a result.
All forecasts are subject to uncertainty. The above forecast, published in the Series 2012 City of St. Louis, Missouri
Airport Revenue Refunding Bond document on June 14, 2012, is based on information that is available as of that date.
Various factors, other than those included in the forecast model, can influence the future demand for air travel.
Unexpected events may occur, and some of the underlying forecast assumptions may not materialize. Therefore actual
performance may differ from the forecast, and the difference may be significant.

TABLE 3
BASE FORECAST AIRCRAFT DEPARTURES (ARRIVALS)
FY 2012 - 2016
Actual Forecast AAGR
Activity 2012 2013 2014 2015 2016 2012-2016
Mainline Air Carrier
American 9,900 10,200 10,300 10,500 10,700 2.0%
Delta 4,700 4,500 4,600 4,700 4,800 0.5%
Southwest 29,700 29,200 29,600 30,200 30,900 1.0%
Others 5,900 5,600 5,600 5,800 5,900 0.0%
Subtotal-Mainline 50,300 49,500 50,100 51,100 52,300 1.0%
Regional Air Carrier
American Connection 500 500 500 500 500 0.0%
Delta Regional 7,600 5,900 5,900 6,000 6,100 -5.3%
Others 26,500 27,200 27,500 28,000 28,600 1.9%
Subtotal-Regional 34,600 33,500 33,900 34,500 35,300 0.5%
Charter 300 100 200 200 200 -9.6%
Subtotal-Passenger 85,200 83,100 84,200 85,800 87,700 0.7%
All-Cargo 1,400 1,300 1,300 1,300 1,300 -1.8%
Total -Departures 86,600 84,500 85,500 87,200 89,100 0.7%
Annual Growth Rate 2.7% -2.4% 1.2% 2.0% 2.2%
AAGR - Average Annual Growth Rate
Forecasts rounded to the nearest (00); details may not add to totals as a result.
All forecasts are subject to uncertainty. The above forecast, published in the Series 2012 City of St. Louis, Missouri
Airport Revenue Refunding Bond document on June 14, 2012, is based on information that is available as of that date.
Various factors, other than those included in the forecast model, can influence the future demand for air travel.
Unexpected events may occur, and some of the underlying forecast assumptions may not materialize. Therefore actual

TABLE 4
BASE FORECAST AIRCRAFT LANDED WEIGHT
FY 2012 - 2016
Actual Forecast AAGR
Activity 2012 2013 2014 2015 2016 2012-2016
Mainline Air Carrier
American 1,366,000 1,365,000 1,383,000 1,412,000 1,445,000 1.4%
Delta 666,000 619,000 628,000 642,000 657,000 -0.3%
Southwest 3,612,000 3,529,000 3,576,000 3,653,000 3,738,000 0.9%
Others 774,000 720,000 731,000 748,000 766,000 -0.3%
Subtotal-Mainline 6,418,000 6,233,000 6,318,000 6,454,000 6,607,000 0.7%
Regional Air Carrier
American Connection 33,000 40,000 41,000 42,000 43,000 6.8%
Delta Regional 496,000 386,000 345,000 353,000 362,000 -7.6%
Others 909,000 954,000 971,000 995,000 1,021,000 2.9%
Subtotal-Regional 1,438,000 1,380,000 1,357,000 1,389,000 1,427,000 -0.2%
Charter 43,000 13,000 13,000 14,000 14,000 -24.5%
Subtotal-Passenger 7,899,000 7,627,000 7,688,000 7,857,000 8,047,000 0.5%
All-Cargo 374,000 361,000 361,000 361,000 361,000 -0.9%
Total -Landed Weight 8,273,000 7,987,000 8,049,000 8,218,000 8,408,000 0.4%
Annual Growth Rate 1.6% -3.5% 0.8% 2.1% 2.3%
AAGR - Average Annual Growth Rate
Forecasts rounded to the nearest (000); details may not add to totals as a result.
All forecasts are subject to uncertainty. The above forecast, published in the Series 2012 City of St. Louis, Missouri
Airport Revenue Refunding Bond document on June 14, 2012, is based on information that is available as of that date.
Various factors, other than those included in the forecast model, can influence the future demand for air travel.
Unexpected events may occur, and some of the underlying forecast assumptions may not materialize. Therefore actual
