olsztyn economic journal - uwm.edu.pl · program board zbigniew bochniarz ... shamina – metoda...
TRANSCRIPT

WydawnictwoUniwersytetu Warmińsko-Mazurskiego w Olsztynie
PL ISSN 1897-2721
OlsztynEconomicJournal
• • • • • • • • • • • 13(4/2018) •
••••
••••
••••
••••
••••
••••
•

Program BoardZbigniew Bochniarz (University of Washington), David Coleman (University of Oxford),
Ivano Dileo (University of Bari), Fernando Fita Ortega (University of Valencia),George Ionescu (Romanian-American University of Bucharest),
Eugeniusz Kwiatkowski (University of Lodz), Francesco Losurdo (University of Bari),Christopher Pyke (University of Central Lancashire), Jerzy Wilkin (University of Warsaw)
Editorial CommitteeEditor-in-Chief
Anna Organiściak-Krzykowska (University of Warmia and Mazury in Olsztyn)Secretary
Joanna Machnis-Walasek (University of Warmia and Mazury in Olsztyn)Wioletta Wierzbicka (University of Warmia and Mazury in Olsztyn)
Vilija Aleknevičienė (Aleksandras Stulginskis University), Janusz Heller (University of Warmia and Mazury in Olsztyn), Roman Kisiel (University of Warmia and Mazury in Olsztyn),
Rytis Krušinskas (Kaunas University of Technology), Boguslawa Sardinha (Polytechnic Institute of Setubal)
Features EditorsSzczepan Figiel (University of Warmia and Mazury in Olsztyn),
Eugeniusz Niedzielski (University of Warmia and Mazury in Olsztyn), Bogdan Włodarczyk (University of Warmia and Mazury in Olsztyn)
Statistical EditorPaweł Drozda (University of Warmia and Mazury in Olsztyn)
Language EditorMichael Thoene (University of Warmia and Mazury in Olsztyn)
Polish ReviewersLeszek Bohdanowicz, Beata Zofia Filipiak, Janusz Gołaszewski, Krystyna Iglicka-Okólska,
Anna Janiszewska, Dagmara Lewicka, Bogdan Nogalski, Irena OzimekForeign Reviewers
Jonathan Baker, Vera Viktorovna Borisova, Aleksander Borodin, Alberto Burchi, David Coleman, Cláudia S. Costa, Katharina Gapp, Srećko Goić, George Ionescu, Valeriy Nikiforenko, Anastasija Novikova, Dymitrios Syrrakos, Iryna Tanasiuk
Executive EditorMariola Jezierska
Cover DesignMaria Fafińska
Olsztyn Economic Journal is indexed and abstracted in:BazEcon, BazHum, Central and Eastern European Online Library (CEEOL),
Index Copernicus Journal Master List, POL-index, RePEc,The Central European Journal of Social Sciences and Humanities (CEJSH)
The Journal is also available in electronic form on the websiteshttp://www.uwm.edu.pl/wne/olsztyn-economic-journalhttp://wydawnictwo.uwm.edu.pl (subpage Czytelnia)
The print edition is the primary version of the Journal
PL ISSN 1897-2721
© Copyright by Wydawnictwo Uniwersytetu Warmińsko-Mazurskiego w OlsztynieOlsztyn 2018
Wydawnictwo UWMul. Jana Heweliusza 14, 10-718 Olsztynphone: 89 523 36 61, fax 89 523 34 38
www.uwm.edu.pl/wydawnictwo/e-mail: [email protected]
Publishing sheets 11,2; printing sheets 9,5; edition copies 95Print – Zakład Poligraficzny UWM w Olsztynie, order number 586
TABLE OF CONTENTS
M. AdAMowicz – Long-Term Financial Forecasting as a Part of Strategic Planning in Local Government Units ....................................................................................................
w. BilczAk, M. BilczAk – Core Aspects of Typological Classification of Border Regions and Coastal Regions ................................................................................................................
A. Borodin, V. ShAMin, i. ShAMinA – A Method for Calculating the Real Value of Equity by Identifying Toxic Assets in the Reports of Professional Participants of the Securities Market .....................................................................................................................................
M. WitkoWska-DąbroWska – Evaluation of the Attainment of Environmental Goals in Sustainable Growth Regarding Gas Emission and Energy Consumption, as Defined for Poland in the Europe 2020 Strategy ................................................................................
E. wAlEndzik, M. wojArSkA, Q. jEtt – Small Cities in the Development Policy of Warmin-sko-Mazurskie Voivodeship ....................................................................................................
s. kubiciel-loDzińska, b. ruszczak – The Attractiveness of Poland for Economic Migrants. Assessment by Employers: Results of Empirical Studies ....................................
d. SoBol – International Activities of Young Technology Companies Located in Science and Technology Parks ....................................................................................................................
j.l. SAntoS, j. kASzowSkA – Systemic Risk: Cause or Effect of the Financial Crisis in the Euro Area? The Case of Spanish Banking System Bailouts ................................................
j. dynowSkA, S.j. cErEolA – Expectations Related to the Implementation of Performance Budget in Municipalities ........................................................................................................
A. rudzEwicz – Trust Measurement in an Enterprise. A Conceptual Approach ....................
SPIS TREŚCI
M. AdAMowicz – Wieloletnia prognoza finansowa jako element planowania strategicznego w jednostkach samorządu terytorialnego .............................................................................
w. BilczAk, M BilczAk – Podstawowe aspekty typologizacji regionów przygranicznych i nadmorskich .........................................................................................................................
A. Borodin, V. ShAMin, i. ShAMinA – Metoda obliczania rzeczywistej wartości kapitału własnego przez identyfikację aktywów toksycznych w raportach profesjonalnych uczestni-ków rynku papierów wartościowych ......................................................................................
M. WitkoWska-DąbroWska–Ocena realizacji celów środowiskowych zrównoważonego roz-woju w zakresie emisji gazów i wykorzystania energii podjętych dla Polski w Strategii Europa 2020 ...........................................................................................................................
E. wAlEndzik, M. wojArSkA, Q. jEtt – Małe miasta w polityce rozwoju województwa war-mińsko-mazurskiego ..............................................................................................................
s. kubiciel-loDzińska,b.ruszczak– Atrakcyjność Polski dla imigrantów zarobkowych. Ocena pracodawców – wyniki badań empirycznych .............................................................
d. SoBol – Aktywność zagraniczna młodych firm technologicznych zlokalizowanych w par-kach naukowo-technologicznych ...........................................................................................
j.l. SAntoS, j. kASzowSkA – Ryzyko systemowe – przyczyna czy konsekwencja kryzysu finan-sowego w strefie euro? Przykład pomocy publicznej dla hiszpańskiego systemu finanso-wego .........................................................................................................................................
j. dynowSkA, S.j. cErEolA – Oczekiwania związane z wdrożeniem budżetu zadaniowego w gminach ...............................................................................................................................
A. rudzEwicz – Pomiar zaufania w przedsiębiorstwie. Podejście koncepcyjne ......................
357
375
387
397
411
425
441
457
475487
357
375
387
397
411
425
441
457
475487

OLSZTYN ECONOMIC JOURNAL2018, 13(4), 357–374
LONG-TERM FINANCIAL FORECASTING AS A PART OF STRATEGIC PLANNING
IN LOCAL GOVERNMENT UNITS
Mieczysław AdamowiczFaculty of Economics and Management
Pope John Paul II State School of Higher Education in Biała Podlaskae-mail: [email protected]
ORCID 0000–0002–1164–4966
K e y w o r d s: local government units, financial forecasting, strategic planning, Karczew muni-cipality.
A b s t r a c t
The aim of this paper is to present, on the example of Karczew municipality, long term financial forecasting as a component of strategic planning and to evaluate it as a tool for managing the socio-economic development in a local self-government unit. The paper has two main parts. In the first part, a theoretical background for strategic and financial management and forecasting is presented and in the second part, a case study of financial forecasting for the Karczew munic-ipality is described. The main conclusion of the paper is that financial forecasting and strategic planning are important tools for the management of the municipal units if these are linked within local present budgeting and are implemented in an integrated way. Analysis of the municipality of Karczew shows that the current integrated strategies create a useful foundation for the effective functioning of the municipal unit.
WIELOLETNIA PROGNOZA FINANSOWA JAKO ELEMENT PLANOWANIA STRATEGICZNEGO W JEDNOSTKACH SAMORZĄDU TERYTORIALNEGO
Mieczysław AdamowiczWydział Nauk Ekonomicznych i Technicznych
Państwowa Szkoła Wyższa im. Papieża Jana Pawła II w Białej Podlaskiej
S ł o w a k l u c z o w e: lokalne jednostki samorządu, prognozowanie finansowe, planowanie stra-tegiczne, gmina Karczew.

358 Mieczysław Adamowicz
A b s t r a k t
Celem pracy jest przedstawienie wieloletniej prognozy finansowej jako elementu planowania strategicznego i dokonanie jej oceny jako narzędzia do zarządzania podstawową jednostką tery-torialną, na przykładzie gminy Karczew. Artykuł jest podzielony na dwie główne części. W pierw-szej przedstawiono podstawy teoretyczne długofalowego planowania strategicznego i powiązanego z nim planowania finansowego. W części drugiej przedstawiono analizę przypadku gminy Karczew. Główną konkluzją jest stwierdzenie, że długofalowe prognozowanie finansowe jest skutecznym narzędziem zarządzania gminą, jeśli jest zintegrowane z jej strategią rozwoju społeczno-gospodar-czego. Przykład gminy Karczew pokazuje, że zintegrowane strategie stanowią użyteczną podstawę efektywnego funkcjonowania tej jednostki samorządowej.
Introduction
The municipality as the primary unit of local government fulfils many func-tions important for both the local community and the region in which it oper-ates. Development directions and investment activities are subject to planning and are incorporated into local strategies and development policies. The scar-city of resources imposes the necessity of establishing one’s own, unique way of hierarchizing the social needs in terms of the importance and urgency of their fulfilment. Formulating a development strategy should serve this purpose which, through an insightful analysis of the past and present situation of the community and the potential for using the available factors, defines the course and sources of its development in the future. The development strategy of the municipality includes the mission and vision of the unit, defines strategic directions and areas of development as well as realisation tasks. All these activities determine the general shape of the municipality in a long-term perspective, which can be made real by formulating a long-term financial perspective. The formulation of a long-term financial perspective must be accompanied by an in-depth understanding of the conditions, resources and factors, which allows for a rational definition of development perspectives. The aim of this paper is to present, on a concrete example from the Karczew municipality, the long-term financial forecasting as a component of strategic planning and to evaluate it as a tool for managing a basic territorial unit. Data collected in survey form from the Karczew municipality constitutes the main empirical material of the study (MArczAk 2016).
Strategic management and financial management of the municipality
Managing a basic local government unit (LGU), that is a municipality, is a complex issue due to a number of dependencies and links between the ac-tivities of the decision-making and executive bodies, between the municipality

Long-Term Financial Forecasting as a Part of Strategic Planning in Local… 359
and its immediate neighbours, between incomes and spending, etc. It is then worthwhile in the municipality to clearly state the objectives, plan how they will be achieved and think about the benefits resulting from the established objectives. All these elements constitute a development strategy, which in turn may become a document, on the basis of which the long-term financial forecasts will be created (ziółkoWski 2000, p. 60, 61).
In connection with an increase in the demand for public goods, new methods to acquire funds for LGU to deliver them began to arise. However, the munici-pality, as the basic unit, is not able to satisfy all the needs that are reported by its inhabitants. For this purpose, both decision-making and executive bodies in the municipality seek objective methods to hierarchize their reported needs in terms of their importance and urgency. This allows them to determine which of them must be treated as priority issues. The limitation of resources means that the authorities are able to address only the most urgent needs during the budgetary year, while the remaining ones are planned for the next periods, retaining the predefined hierarchy. Consequently, the allocation of financial resources was no longer sufficient and the management of local government units began to play an increasing role (Wyrębek 2010, p. 143). An important component of the management process is strategic management and financial management. The strategic management area of local government units is related to the search for optimal usage of resources and opportunities for a dynamic socio-economic development. Financial management is mainly directed at the rational and efficient usage of available financial resources.
Efficient municipality management depends on adopting a good development strategy, good organisation and efficient operation of the municipality office, good internal and external communication and on the interest and positive involvement of the entities and municipality inhabitants (zAwicki et al. 2004, p. 14–22). The model of municipality management is associated with the scope of territorial and functional decentralisation of the country. Within territori-al decentralisation, it is possible to distinguish the financial field consisting in distinguishing proprietary budgets and income generated from taxes, fees, income from municipality budget units, income from the estates owned and others (Ustawa z 13 listopada 2003 r. o dochodach jednostek samorządu tery-torialnego, Journal of Laws of 2003, no 203, item 1966). Functional decentral-isation, also known as budget or asset decentralisation consists in delegating to lower ranks of territorial units the management of specific types of affairs and to allocate funds from the central or regional budget for these purposes. The possibility of raising funds to finance the budget deficit (lubińskaet al. 2015, p. 317, 318) also plays an important role. In this area, it is crucial to ensure the greatest possible accounting liquidity and flexibility in financial management. The flexibility of the financial management of the municipality consists of three groups of activities: long-term planning, usage of task budgets and civic budgets (Postuła,Perczyński 2010, p. 31, 32).

360 Mieczysław Adamowicz
Poland’s membership in the European Union, and in particular the possi-bility of applying for European funds, has contributed to the popularisation of long-term planning. Long-term planning allows for establishing forecasts of the financial result thanks to which a given territorial unit can demonstrate the rationality of application and management of public funds. This planning also provides the opportunity to assess the effectiveness of the selected socio-economic, financial and fiscal policy. The task budget is a relatively new tool for managing public finances, which focuses on results possible to obtain if accompanied by a specific level of available resources. A participatory budget allows the resi-dents of a given territory to express their opinion on the distribution of the part of budget funds. That fact might have an impact on improving the management of available public funds.
In order to avoid acting randomly, a municipality introduces procedure based on planning and strategic management, which generally proceeds through three stages: strategic analysis, strategy planning and implementation of the strat-egy (wErEwSkA et al. 2012, p. 87–89). Strategic management, however, is not intrinsically sufficient. In order for an entity to fund the realization of the objectives in a chosen strategy, it must also focus on obtaining proper funds (SiErAk 2013, p. 92). This can be ensured by financial management, which includes the following activities: determining the scope of long-term financing possibilities; setting up tasks for funding and measuring any costs necessary for their realization; specifying annual and multiannual plans seen as specific tasks; defining the links between objectives and means intended for the imple-mentation of those objectives; data collection performed in order to monitor and control the development and evaluate the level of their implementation (zAwicki et al. 2004, p. 11).
The essence, preparation and implementation of a multiannual financial forecast
Introduction of multiannual development planning and the use of modern financial management forms have become the basis for adopting the policy of obligatory enactment of multiannual financial forecasts. The possibility of applying for European funds and certain commitments arising from the proceedings linked with applying for and using these funds have contributed significantly to this situation. Although the development of a financial forecast generates costs and is not an easy task, benefits arising from the development of such forecasts are acknowledged.
A fundamental condition for developing a good financial forecast is its integral link with a given unit’s long-term development strategy. Long-term planning is the process of aligning financial potential and long-term development goals

Long-Term Financial Forecasting as a Part of Strategic Planning in Local… 361
of a given national region and the entire European community. The time-span of a multiannual financial forecast may vary. In Poland, as well as in some Scandinavian countries, financial forecasts are drawn up for a period of at least one fiscal year and for three consecutive calendar years. In Belgium and in Portugal, the financial forecast covers the entire term of a given unit’s council, whereas in New Zealand financial planning covers an entire decade (kAczurAk-kozAk 2013). A multiannual financial forecast is formed on the one hand by a municipality’s development strategy and on the other hand by the actual budget of a given unit for the initial year. Initially, the components of a multiannual financial forecast were defined on the basis of Public Finance – Act PFA (Ustawa z 27 sierpnia 2009 r. o finansach publicznych, Journal of Laws of 2009, no 157, item 1240). Pursuant to this Act, a multiannual financial forecast of LGU should be realistic and should specify at least the following components for each year covered by the forecast: the revenue and expenditure for the cur-rent budget of a given unit, asset-related income, budget outcome, the sources applied in order to cover the deficit or objectives the surplus will be allocated to, income and expenditure of the local government budget, including current and planned debts, the size of the debt, as well as the sources of its financing, and the amount of current expenditure and assets.
The above figures must be accompanied by detailed explanations confirming a verifiable situational picture of the given unit. In the case of forecasting debt, it is indispensable to include the full repayment period as well as all planned debts (wAlczAk 2014, p. 3–5). Under the PFA, also the inclusion of the infor-mation on ventures undertaken in multiannual financial forecasts, i.e. name and purpose, organizational unit responsible for execution, execution time, total costs incurred, expenditure limits with regard to time periods, and the limit of incurred liabilities, is required. All of these components are obligatorily re-quired and any failure to adhere to them might cause a multiannual financial forecast affected by a local government unit to be considered non-compliant with applicable requirements, and thus a given forecast will not be considered lawful. Currently, while drafting a multi-annual financial forecast, a model adopted by the Minister of Finance by means of a regulation is obligatorily applied (Rozporządzenie Ministra Finansów z 10 stycznia 2013 r.). Long-term financial forecasts should be created carefully and in a rolling manner, which means that the analysis of its implementation should be carried out annually. The forecast should be realistic and yet flexible and should display sensitivity towards forthcoming changes. This is the only way to obtain a reliable illustra-tion of the financial situation in the local government unit and its most realistic reflection in the future. By reliably construing a realistic picture of the future situation in a unit, one may prevent many failures.
In the PFA, we can find information about the requirement of truthfulness, which is to be met by the drafted forecast. Since the obligation to create a fore-cast by a territorial self-government unit was introduced, controversies amongst

362 Mieczysław Adamowicz
its authors have arisen, being caused by the fact that the obligations incurred by a unit or launched investments force them to prepare forecasts for over a decade. The realism of the forecast consists in the fact that it will be possi-ble to verify its authenticity, by means of checking out a variety of documen-tation, including the adopted strategy. The Ministry of Finance establishes guidelines for the fulfilment of macroeconomic assumptions by means of basic indicators. Failure of a forecast to comply with universally applicable indica-tors requires a given unit to provide detailed explanations (Wskaźniki do oceny sytuacji finansowej 2014). However, there are also indications that make the execution of multi-annual financial forecasts in a realistic manner questionable. This is due to the fact that the figures included in them are often estimated on the basis of macroeconomic (budgetary) indicators, rather than on the basis of a bottom-up approach. Despite the difficulties arising from the realism im-posed on the enacted forecast, it is one of the most important features of this document, without which the forecast would lose credibility.
According to some authors (ArMStrong 2001, p. 2–40) a forecast should contain the following elements, also serving as the stages of its creation: estab-lishment of objectives, formulation of issues, identification of sources, collection and preparation of data, selection of a development method, implementation of the method, application of quantitative and qualitative methods, integration of qualitative and quantitative forecasts, analysis of the method’s effectiveness, sensitivity assessment, and the presentation of the forecast. Developing a mul-ti-annual financial forecast must be preceded by an appropriate resolution, serving as an act of will and a normative act, which regulates relations between local government units, national institutions and other bodies of public life.
The legal bases of a financial forecast are defined in the Public Finance Act (Ustawa z 27 sierpnia 2009 r. o finansach publicznych, Journal of Laws of 2009, no 157, item 1240), which indicates the need to assess appropriate elements of the resolution, a minimum period taken into consideration, authorities enacting the resolution, relations between the budget and multi-annual financial forecast, methods and deadlines of implementation and the manner of supervision. The Act is supplemented by the Regulation of the Minister of Finance (Rozporządzenie Ministra Finansów z 10 stycznia 2013), which specifies the model of the forecast, the form and deadlines for passing the resolutions and the results of the opinions on the forecast submitted to the Regional Accounting Chamber – RACh. Some elements of the forecast overlap with the unit’s budget, but in some aspects it goes beyond the range of the planned budget, making it a more complete and credible document.
Enactment of the municipality’s multi-annual financial forecast rests main-ly with the legislative body, that is the municipal council, whereas composing the draft resolution falls into duties of the implementing body – the mayor of a municipality, town or a city. The executive body decides whether to only implement changes in the forecast enacted before, or to draft a new project

Long-Term Financial Forecasting as a Part of Strategic Planning in Local… 363
in the consecutive year. The forecast project is submitted, similarly to the budget project, on November 15 of the year preceding the financial year. By taking into account the planned amount of debt, capability of financing the deficit and an acceptable gauge of liability coverage, the RACh issues an opinion serving as a basis for adopting or implementing amendments to the project.
The budget and the multi-annual financial forecast are interrelated in a special way. Often the changes to one of the documents force one to implement changes in the other one as well. It is often the budget that prompts changes to the multi-annual financial forecast, for example due to the failure to execute the budget or the reimbursement of funds from the European Union, which in turn causes a change in the previously forecast amounts. Therefore, it can be said that the current budget is the foundation of a multi-annual financial forecast, since any change in the budget causes a change in the forecast, but not every change in the forecast stipulates a mandatory change in the enacted budget. Compliance with regard to the interrelation between the budget and the forecast should be manifested in two areas. The first one is the compatibility of the adopted data with the budget in relation to the data predicted in the multi-annual financial forecast for a given financial year; the second one is the consistency of the effects and consequences resulting from the adopted budget and the financial forecast (wAlczAk 2014, p. 15). It should be noted that the budgetary inconsistency represents a lesser threat to the territorial entity than the inconsistency in the multi-annual financial forecast, which has long-term economic, social and image implications for the local authorities and communities.
Income and expenditures in the Karczew municipality
Karczew is a municipality situated in Otwock County in the central part of the Masovian Province, in close proximity to Warsaw. The municipality is in-habited by almost 16 thousand people, with around 10 thousand living in the city and 6 thousand in the rural areas surrounding it, forming 16 rural settlements.
Total revenue of the municipality budget per capita in 2015 was 2,728 PLN and total expenditures 2,735 PLN. Karczew has mixed sources of revenue: its own income, general subventions and designated subsidies from the state budget. Proprietary income comes from tax revenues, non-tax revenues and other sources. The level and structure of the municipality income during 2011–2014 is presented in Table 1.
The data contained in the table shows a strong current income ratio (95.8% on average) and steady growth of income, especially for the current income. Asset-related income is declining both in terms of volume and share of the total income (from 6.36% in 2011 to 4.16 in 2014). The level and structure of expenditures in Karczew municipality in 2011–2014 is presented in the Table 2.

364 Mieczysław Adamowicz
Table 1 The income structure of Karczew municipality during 2011–2014 in thousand PLN
SpecificationYear
2011 2012 2013 2014Total revenue 39,534 40,428 41,995 43,606Asset-related income 2,516 1,331 1,298 1,696Subsidies and funds for investments 1,485 1,065 874 591Income from the sale of property 1,000 237 372 1,075Income from the conversion of perpetual usufruct rights in ownership rights 31 29 52 29
Current income 37,018 39,097 40,697 41,910General subsidy 7,331 7,736 7,808 8,114Cmplement to the general subsidy x 43 x xDesignated subsidies 4,893 5,057 5,498 5,497Revenues from taxes and fees 11,793 11,595 12,533 12,902Shares of taxes constituting the revenue to the state budget 10,582 11,440 12,551 14,147Income from property 522 630 542 541Other current revenues 1,897 2,597 1,765 709
Source: author’s own elaboration based on: Karczew municipality financial statements for 2011, 2012, 2013, 2014.
In the structure of expenditures, the current expenditure also dominates, although the share of asset expenditure in the total sum of expenditures is higher than the share of asset-related income in the total amount of income. A particularly high level of asset expenditure was noted in 2012, when substan-tial funds were invested in road network repair and development. The current expenditure is relatively stable with a slight upward trend. More than half of the current expenditure consists of salaries and remuneration derivatives in the public sector.
An important element in the municipality’s finances is the state of receivables and liabilities. A significant part of the municipality’s receivables are deposits in bank accounts, cash in hand, receivables due, term deposits, receivables on the basis of guarantees provided and other receivables. On the liabilities side, the most common component is personnel remuneration and additional annual remuneration, insurance premiums, contributions to the labour fund, purchase of energy, materials and services, and investment expenditure. The liabilities of the municipality during the years 2011–2014 increased more than fourfold. It stems in particular from implementing investments and purchase of energy.

Long-Term Financial Forecasting as a Part of Strategic Planning in Local… 365
Table 2 The structure of expenditures of Karczew municipality in 2011–2014 in thousand PLN
SpecificationYear
2011 2012 2013 2014Total expenditure 39,047 47,148 45,832 43,704Asset expenditure 4,273 9,502 7,749 5,664Agriculture and hunting 226 458 x xProduction and provision of electricity, gas and water 15 355 97 6
Transport and communications 455 6,063 331 256Tourism x x x 719Housing management 123 122 407 11Public administration 571 913 616 201Public safety and fire protection 479 87 161 xEducation and upbringing 725 153 3,632 1,643Health care 4 102 1,703 1,982Municipal services management and environmen-tal protection 529 820 784 694
Culture and protection of national heritage x 12 x 7, 13Physical culture 1,147 416 19 152Current expenditure 34,774 37,647 38,082 38,041Expenditure on debt servicing and payments due to the provision of guarantees 661 620 1,016 870
Other expenses 34,113 37,027 37,066 37,170
Source: author’s own elaboration based on: the financial statements of Karczew municipality for years: 2011, 2012, 2013, 2014.
The development strategy of Karczew municipality as the basis of the multi-annual financial forecast
The overall picture of the development strategy of Karczew municipality consists of socioeconomic diagnosis, SWOT analysis, mission, vision, strategic goals and tasks, as well as the monitoring system and evaluation of the strategy. The socio-economic diagnosis includes basic information about the municipality, it shows the socio-economic, environmental and organizational and institutional profile. The whole picture is an approximation of the conditions of the munici-pality on its various levels, which is the basis for the further formulation of the strategy. In the later stage, the mission, vision, objectives, strategic areas and implementation tasks were defined to direct the activities of the municipality. At the final stage, the unit systematically checks to what extent the actions

366 Mieczysław Adamowicz
taken are cost effective and whether the same effects can be achieved with a lower input of human and financial resources.
The basic assumption when developing the development strategy is to base it on the concept of sustainable development and considerations for the close vicinity of the capital city of Warsaw. Of key importance is also the location of the municipality in the Vistula river valley and highlighting the Warsaw-Ot-wock forest, the urbanised Otwock zone and agricultural production areas in its spatial structure. The municipality is dominated by agricultural lands, whose share in the area reaches 90%. Forests constitute 6% and the remaining ter-rain types cover 4% of the area. There were 1,576 economic entities registered in the municipality, of which 12 can be classified as large ones and represent pharmaceutical, meat and packaging industries. Among the population of the municipality numbering 16 thousand, women hold a slight numerical advantage.
While determining the organisational and institutional profile, attention should be paid to the diversity of the municipality area with separate consid-erations for towns and rural areas. Table 3 shows the functions assigned to the town and rural areas; this division takes account of retaining hierarchy of functions from the most important to the least important. Some features apply to both urban and rural areas.
Table 3 Functions of the town and rural areas of Karczew
Town Rural areasProduction function agricultural functionHousing function housing functionService function service functionTechnical support function the function that includes other aspects of the service activitiesAgricultural function recreational and tourist function
Source: author’s own elaboration based on: Strategia…, online, p. 32, 33.
In the town, production functions have the greatest importance, covering the range of local industry and small-scale production, as do the housing and service functions in the field of services for residents and manufacturers and the technical support of densely populated areas. A small role in the city is also played by the agricultural function. In the case of rural areas, the following functions were distinguished: agricultural, the most important one in view of the favourable natural conditions, housing and service of a similar extent as in the city. Less important is the function covering other aspects of the ser-vice activities linked for example with agritourism and tourism and recreation.
Karczew municipality takes into account the following tasks in its mission (Strategy…, online, p. 35–49): establishing a local economic development centre;

Long-Term Financial Forecasting as a Part of Strategic Planning in Local… 367
development of entrepreneurship; development of tourism; development of ed-ucation; the maximum use of geographic potential; as well as the development of social and economic opportunities. The above elements contribute to the mu-nicipality’s launch of long-term ventures, which serve as the basis for economic and social activities of local authorities, as well as actions promoting the mu-nicipality in Poland and abroad. The formulation of the mission is supposed to lead the municipality to acquire the expected image in which the municipality of Karczew distinguishes such features as security, modernity, investment pro-motion, local culture promotion, recreational attractiveness, serving residents in everyday life. The achievement of these features by the municipality is ex-pected to bring about an influx of inhabitants and investors and foster further dynamic development, allowing Karczew municipality to adapt the local pace and way of life and development to the requirements posed by its location in the vicinity of Warsaw.
Karczew municipality, formulating the mission and vision, has set the di-rection of development in four strategic areas, including specific goals that the municipality will strive to attain in the near future, and which in fact will lead to the realisation of a specific vision (Fig. 1).
Fig. 1. Strategic areas of Karczew municipalitySource: author’s own elaboration based on: Strategia…, online, p. 49, 50.
Each of these areas contains a specific set of features. Economic develop-ment: creating favourable conditions for investments and expanding local en-trepreneurship, attracting new investors, working with local communities for the sake of economic development, maximising the potential of the location and the environment. Technical infrastructure: development of communication in the local range and beyond the municipality borders, establishment of infor-mation society, development of the environment, improvement of waste man-agement and water and sewage management. Social infrastructure: improving the living standard of the local population, improving the local labour market, reducing the migration of its inhabitants, boosting economic aspirations of res-idents, revitalising the housing situation. Tourism and culture: revitalisation of the tourism sector and development of infrastructure, turning the municipality

368 Mieczysław Adamowicz
into a kind of leisure centre, which would attract weekend visitors from Warsaw and from the vicinity, development of gastronomy and accommodation as well as sport and leisure facilities, and cultural development.
The next step in building a strategy for sustainable development in the municipality of Karczew consists of assigning, to each strategic area, imple-mentation tasks, which are a list of key tasks for the implementation of the development strategy (Tab. 4).
Summing up all the tasks selected by the municipality, the main goals are: improving the living conditions of the inhabitants, attracting new investors, creating favourable living conditions for the disabled, taking care of the natural
Table 4Implementation tasks of the municipality of Karczew
Economic development Technical infrastructure Social infrastructure Tourism and culture
Creating a development plan
improving the condi-tion of local roads
building strategies of social problem solving
improving hotel and gastronomy facilities
Creating the planning documentation
creation of public transport between the municipality and Warsaw
supporting non-govern-ment organisations for public welfare
purification and adaptation of water reservoirs
Providing utility infrastructure
improving the condi-tion of bicycle paths
building new nurs-ery schools and kindergartens
using the potential of the local vegetation
Consolidation of dis-persed land ownership
creating broadband Internet access
providing better educa-tion and development for the inhabitants
building new pave-ments and bicycle paths
Construction of conven-ient means of transport between Karczew and Warsaw
improving the munic-ipal waste disposal system
supporting childcare facilities
adaptation of fishing sites
Implementing provi-sions of tax relief for entrepreneurs
developing the water and sewage system
creating new social economy entities
improving the pro-gramme of cultural and promotional events
Popularisation of farming
improving the flood control system
renovating the sport leisure and cultural facilities
implementation of the Monument Care Programme
Using the renewable energy sources
– improving the cultural offer of the municipality
building a conference centre
Attracting the green business investors
– improving housing construction
creating a tourist information point
Creating logistics infrastructure
– support for the disabled and handicapped persons
–
Source: author’s own elaboration based on: Strategia…, online, p. 49–60.

Long-Term Financial Forecasting as a Part of Strategic Planning in Local… 369
environment, and opening up to the development of tourism. The directions of activities in the municipality are a result of specifying all the tasks with considerations for each area of activity. They are the main point of the strategy indicating the path that the municipality is supposed to follow in the near future.
Assessment of the municipality’s financial situation
The assessment of the municipality’s financial situation can be carried out based on the following rates: share of operating surplus in the total income, share of asset-related expenditure in total expenditure, share of operating surplus in asset-related expenditure, operating surplus per capita, share of liabilities in the total income, and total debt ratio (Wskaźniki do oceny sytuacji finansowej 2014, p. 6, 7).
The share of operating surplus in total income in the years 2012–2014 increased from 3.6% in 2012, through 6.2% in 2013, to 8.9% in 2014. Such an upward trend is promising for industry and investment. Nevertheless, the asset-related expenditure rate in total expenditure shows a downward trend. In the years 2012–2014, these rates decreased from 20.2% to 13.0%. This means that the municipality is allocating a decreasing share of its expenditure to in-vestments. The operating surplus per capita steadily increased from 90.4 PLN in 2012 to 163.2 PLN in 2013 and 242.7 PLN in 2014. This demonstrates a rational and successful development of the unit. Despite a considerable debt growth, which reached 17.8% of total revenue in 2014, the share of liabilities is many times lower than the maximum allowable debt, set at 60% of the income (rates for 2014 assessments). In the years 2012–2013, the share of liabilities in total income did not exceed 4%. The total debt ratio was 1.5% in 2012, 2.4% in 2013 and 2.0% in 2014. Therefore, the debt service was not a significant financial burden for the municipal budget.
Forecast and the actual financial situation of the municipality
The long-term financial forecast in the municipality of Karczew, due to its financial commitments, spreads over a period of 15 years from 2012 to 2026. The extrapolation method of statistical series linked with the long-term devel-opment strategy was used. This is a result of the requirement that imposes on units the obligation to spread the forecast over a period necessary to repay public debt. The analysis of the discrepancy between the forecast and the actu-al situation will be based on its selected elements: total income, asset-related income, current income, total expenditure, asset-related expenditure, current

370 Mieczysław Adamowicz
expenditure, operating surplus, amount of debt, and debt service expenditure. These discrepancies are often a result of unexpected external factors related to the changes at the national level and to the influence of the immediate envi-ronment on the municipality.
The long-term financial forecast conducted by the municipality of Karczew contains detailed analyses of given elements that take into account anticipated changes resulting from complex draft resolutions, a change of the economic situation in the country, economic outlook and its impact on the situation of the municipality. The community forecasts current revenues by adding tax revenues as part of the state budget, revenues from budgetary units, general subventions, targeted state subventions, operating programs, and taxes and fees. In turn, the forecast of asset-related income is income from the sale of property and other asset-related income.
Figure 2, representing the forecasted total revenue and total expenditure, at the beginning of the forecast period shows a significant preponderance of revenue over expenditure. This difference is due to the significant invest-ments in infrastructure. Between 2014–2016 revenue and expenditure reaches similar values of approximately 43–45 million. In the years to come, there is a noticeable upward tendency for both parameters while preserving the overall income advantage over total expenditure.
The forecasted operating surplus stems from the advantage of planned reve-nues over current expenditure and indicates systematic growth. The debt service of the municipality is paid from the operating surplus, and the forecast includes a time necessary to repay the debt. Over time, it may turn out that there will be an increase in debt repayment in the municipality, thus the projected surplus may be lower. Table 5 shows the ratio of forecasts to actual figures for income and expenditure.
Fig. 2. Forecast of total income and total expenditure for 2012–2026 in mln PLNSource: author’s own elaboration based on: Multi-annual Financial Forecast of the Karczew community for years 2012–2026.

Long-Term Financial Forecasting as a Part of Strategic Planning in Local… 371
Both in the case of asset-related income and asset-related expenditures, the forecast turns out to be of little accuracy. The real value in relation to the forecasted value in the case of asset-related income is only 17.4%, and in the case of property expenditure is 55.2%. Thus, there has been a considerable overestimation of the forecast. The other categories turn out to be much better. The average share of the real state to be projected in total income is 91.3% and in total expenditure 89.7%. The average share of this indicator for current income is 110.2% and for current expenses 105.2%. Definitely the largest divergence
Fig. 3. Forecast of operating surplus for the period 2012–2026Source: author’s own elaboration based on: Multi-annual Financial Forecast of the Karczew municipality for years 2012–2026.
Table 5Forecasted and real levels of incomes and expenditures in thousand PLN
Revenues and expenditures
2012 2013 2014forecast real forecast real forecast real
Total revenue 47,442 40,428 48,061 41,995 43,022 43,606Asset-related income 11,020 1,331 11,015 1,298 6,016 1,696
Current income 36,422 39,097 37,045 40,697 37,006 41,910Total expenditure 53,734 47,148 56,800 45,832 43,439 43,712Asset-related expenditures 17,312 9,501 20,741 7,749 7,748 5,671
Current expenditure 36,422 37,647 36,059 38,082 35,691 38,041
Operating surplus 0.00 1,451 986 2,615 1,315 3,869
Source: author’s own elaboration based on: Long-term financial forecast for the Karczew municipality for the years 2012–2026 from 28 December 2011 and Financial Statements for 2012, 2013 and 2014.

372 Mieczysław Adamowicz
between the actual and predicted values was observed for operating surplus, which was underestimated by almost 280%. By balancing values for total reve-nue and expenditure, it can be said that the forecast is most reflected in reality.
The municipality is planning to pay off the current debt by 2026, with the repayment of a larger portion planned for 2012–2019. WIBOR, which reached a value of 4.75 at the beginning of 2011, is of great importance for debt servicing, and its further development is related to a boom that is expected to improve. The forecasted debt amounts to a maximum of more than 25 million PLN in 2013 and will fluctuate around that amount until 2016. In the coming years, a continuous decrease in this amount is planned. On the other hand, the cost of servicing public debt reached its highest value in 2014.
Table 6Statement of the debt forecast with real state 2012–2014, thousand PLN
Debt2012 2013 2014
forecast real forecast real forecast realTotal debt 17,186 19,73 25,553 22,448 25,543 21,830Public debt service 707 620 99 1,016 1,290 870Percentage of debt repaid [%] 3.95 3.01 3.72 4.33 4.81 3.83
Source: author’s own elaboration based on: Long-term financial forecast of Karczew municipality for the years 2012–2026 from 28 December 2011 and Financial Statements of 2012, 2013 and 2014.
The data in table 6 shows that the reality is rather different than the forecast. That is why there is a need to verify the correctness of the forecast. Observations of the extent of the forecast is reflected in reality during the three years: 2012, 2013 and 2014. It turned out that in each of the analysed years the forecasts were revalued – by 81%, 99% and 30%, respectively. A rather large error in the first two years of forecasts was due to the significant revaluation of asset-re-lated income. The municipality planned to sell part of the property, but did not find the right investor. It can be expected that in the following years the forecast done in Karczew municipality will be closer to real values.
To determine whether the annual financial forecast made by the municipality is reliable and useful in three financial years 2012–2014, the relationship between the current income and current expenditures permits the reduction of the debt.
Comparing the current income level together with proceeds from the sale of assets for the years 2012–2014 with current expenditure in these years, shows the growing surplus from 2,526 ths PLN in 2012 to 4,106 ths PLN in 2014. The surplus can be used for repayment of the debt. The coefficient resulted from comparing this surplus with total revenue over a three year period was 0.076, and it increased from 0.062 in 2012 to 0.094 in 2014.
Long-Term Financial Forecasting as a Part of Strategic Planning in Local… 373
A comparison of this indicator to the indicator calculated from the ratio between the expenses associated with public debt and budgetary revenues, confirms, the soundness of the forecasting process.
The dependence of calculated indicators testifies to the correctness of the forecast and to the fact that if the municipality of Karczew in subsequent years obtains indicators similar to those covered by the calculation, in proportion to the period which will be subject to the calculation of the maximum amount of instalments per year, to repay the financial year in question, in accordance with the rules of the Act on public finances, the municipality should not have future problems with the budget and the debt repayment in subsequent years. This indicates the rationality of credits and liabilities taken in the munici-pality and to its solvency. To make this actually happen, the measures taken by the municipality must be characterised by effectiveness, efficiency, utility and sustainability. Therefore, the implementation of the development strategy of the municipality should be confronted with financial forecasts through the use of periodic evaluation. The currently implemented strategy is valid only from 2012 and only three years have been evaluated. Therefore, the implemen-tation of both the development strategy and the financial forecast should be monitored and confronted constantly.
Conclusions
Forecasting and strategic management is a useful tool to shape the devel-opment of the local government units. Accuracy and effectiveness of strategic management can be enhanced by developing, in addition to a long-term devel-opment strategy, a multi-year financial forecast. In this way, you can assemble and link the long-term development goals to the territorial together with its financial potential. This combination of the two types of strategic planning with the realistic budget of the unit from the initial year provides the opportunity for greater effectiveness of forecasting. Realistic financial forecasting linked to macroeconomic indicators by means of periodic evaluation and updating of long-term development programming can become a useful tool in the discretion of local government and the Board of Directors of each municipality.
On the basis of the analysis of the indicators of the financial situation of the municipality of Karczew, it can be concluded that the current strategy is the foundation for the effective functioning of the unit. The municipality devel-ops dynamically while maintaining a financial balance. The initially formu-lated multi-annual financial forecast was significantly overestimated because of the mismatched revenue from the sale of assets, but over time, the forecast has become credible. The required relation between the obtained relationship in terms of the amount of the debt, the interest and the income budget for

374 Mieczysław Adamowicz
the next three years, fared successfully. One can therefore conclude that at the maximum usage of resources and capabilities, a municipality can implement a development strategy successfully.
Proofreading by Michael ThoeneAccepted for print 5.11.2018
References
ArMStrong j.S. 2001. Standards and Practices for Forecasting. Norwell, MA, Kluwer Academic Publishers.
kAczurAk-kozAk M. 2013. Charakter i zakres prognozy finansowej jednostki samorządu teryto-rialnego. PWSZ IPiA, Tom IX, Sulechów.
lubińskat.,bęDzieszakM.,Marska-DziobaN. 2015. Zarządzanie finansami publicznymi a efektywność. Wydawnictwo Difin, Warszawa.
MArczAk k. 2016. Wieloletnia prognoza finansowa jako element strategii rozwoju w jednostkach samorządu terytorialnego na przykładzie gminy Karczew. SGGW, Warszawa.
PostułaM.,PerczyńskiP. 2010. Budżet zadaniowy w administracji publicznej. Wydanie II (poprawione). Ministerstwo Finansów, Warszawa.
Rozporządzenie Ministra Finansów z 10 stycznia 2013 r. w sprawie wieloletniej prognozy finan-sowej jednostki samorządu terytorialnego. Dz.U. z 2013 r., poz. 86.
SiErAk j. 2013. Zarządzanie strategiczne w jednostkach samorządu terytorialnego. Myśl Ekono-miczna i Polityczna, 4(43): 188–220.
Sprawozdania roczne z wykonania budżetu gminy Karczew z lat 2011–2014. http://karczew.biu-letyn.net/archiwum/www.bip.karczew.pl/public/index1cbd.html?id=123883.
Statystyczne Vademecum Samorządowca, Gminy powiatu otwockiego. 2015. Urząd Statystyczny w Warszawie.
Strategia zrównoważonego rozwoju gminy Karczew. Aktualizacja 2012–2022. 2012. http://karczew.pl/asp/pliki/2013_Wiadomosci/aktualizacja_strategii_gminy_karczew_2012-2022.pdf.
Ustawa z 13 listopada 2003 r. o dochodach jednostek samorządu terytorialnego. Dz.U. z 2003 r., nr 203, poz. 1966.
Ustawa z 27 sierpnia 2009 r. o finansach publicznych. Dz.U. z 2009 r., nr 157, poz. 1240.wAlczAk P. 2014. Wieloletnia prognoza finansowa jako instrument zarządzania finansami lokal-
nymi. Wydanie 3. Beck InfoBiznes, Warszawa. wErEwkA j., lEwickA d., zAkrzEwSkA-BiElAwSkA A. 2012. Zarządzanie projektami w przedsię-
biorstwie informatycznym. T. 1. Metodologia i strategia zarządzania. Wydawnictwo AGH, Kraków. Wieloletnia prognoza finansowa gminy Karczew na lata 2012–2026. 2011. Urząd Gminy, Karczew.Wskaźniki do oceny sytuacji finansowej jednostek samorządu terytorialnego na lata 2011–2013.
2014. Ministerstwo Finansów, Warszawa.WyrębekH. 2010. Zarządzanie finansami jednostek samorządu terytorialnego na przykładzie
gminy. Polityki Europejskie, Finanse i Marketing, 4(53).zAwicki M., MAzur S., BoBEr j. 2004. Zarządzanie w samorządzie terytorialnym. Najlepsze
praktyki. MSAP Akademii Ekonomicznej, Kraków. ziółkoWskiM. 2000. Proces formułowania strategii rozwoju gminy. Instytut Przedsiębiorczości
i Samorządności, Warszawa.

OLSZTYN ECONOMIC JOURNAL2018, 13(4), 375–385
CORE ASPECTS OF TYPOLOGICAL CLASSIFICATION OF BORDER REGIONS AND COASTAL REGIONS
Wasyl Bilczak1, Michał Bilczak2 1Department of Microeconomics
Faculty of Economics University of Warmia and Mazury in Olsztyn
e-mail: [email protected] 0000-0002-8112-2389
2Department of Organisation and ManagementFaculty of Economics
University of Warmia and Mazury in Olsztyn e-mail: [email protected]
ORCID 0000-0001-7008-5132
K e y w o r d s: border regions, coastal regions, limology, typology, classification of regions.
A b s t r a c t
This article discusses the theoretical aspects of regional economic systems. Particular attention was paid to the nature of the development of border regions and coastal regions under new geopolitical circumstances. The special aspects of the functioning of those territorial units in the Russian Federation and the Commonwealth of Independent States (CIS) were illustrated.
The author has highlighted the role of the border effect which is closely related to border infrastructure (border crossings, border inspection and customs posts, communication, service, and logistics) as well as the possibility of exploiting the potential resources (land, forest, wa-ter, and leisure) extensively on both sides of the border. Great emphasis was put on the forms of international cooperation between inhabitants of border regions, institutions and organisations.
PODSTAWOWE ASPEKTY TYPOLOGIZACJI REGIONÓW PRZYGRANICZNYCH I NADMORSKICH
Wasyl Bilczak1, Michał Bilczak2
1Katedra MikroekonomiiWydział Nauk Ekonomicznych
Uniwersytet Warmińsko-Mazurski w Olsztynie2Katedra Organizacji i Zarządzania
Wydział Nauk EkonomicznychUniwersytet Warmińsko-Mazurski w Olsztynie
S ł o w a k l u c z o w e: regiony przygraniczne, regiony nadmorskie, limologia, typologia, klasyfi-kacja regionów.

376 Wasyl Bilczak, Michał Bilczak
A b s t r a k t
W artykule omówiono teoretyczne aspekty regionalnych systemów ekonomicznych. Szczególną uwagę zwrócono na specyfikę i warunki rozwoju regionów przygranicznych i nadmorskich w nowych warunkach geopolitycznych. Przedstawiono szczególne aspekty funkcjonowania tych jednostek terytorialnych w Federacji Rosyjskiej i Wspólnocie Państw Niepodległych (WNP).
Podkreślono rolę efektu przygraniczności ściśle związanego z takimi elementami, jak: przejścia graniczne, posterunki kontroli granicznej i celnej, łączność, serwis i logistyka. Zwrócono także uwagę na możliwości wykorzystania zasobów gruntowych, leśnych, wodnych i rekreacyjnych po obu stronach granicy. Szczególną uwagę poświęcono formom współpracy międzynarodowej mieszkańców terenów przygranicznych oraz instytucji i organizacji tam działających.
Theoretical aspects of the classification of regions
The development of border regions is closely linked to limology. Limology (from limes which in Latin means a border) is a science that studies social phenomena integrally related to border processes; it literally translates as “border studies”. Limology not only analyses state borders, but also studies map delimitation and demarcation for all the existing national boundaries.
The development of coastal border regions entails the participation of the Russian Federation’s economy in the global economy where of utmost importance is an international division of labour. Globalisation, integration of the Russian market with the global market, and the accession of Russia to the World Trade Organisation make economic operators ponder their competitiveness and “sur-vivability” due to the development of an innovative economy, the introduction of the finest goods and services to the market and ensuring the economic security of a country in the face of economic crises and turmoil. Under such circumstances, the significance of coastal border regions is on the increase. New challenges and changes in the development of the economy render it necessary to think of a new way of perceiving circumstances for the development of coastal border regions.
There are various methods of classifying, including topological classifica-tion, regions in the literature on the subject. Similar papers have been written about border regions as well. Despite this, rules and criteria for highlighting border regions, especially coastal border regions, have not been adequately set forth yet. Geographers, for instance, study border areas – and it is completely the right thing to do – taking into account their own criteria as they identify, e.g. border areas with a distance up to 100 km or a time between 1.5 h and 2 h to the border of a state. Those areas as natural objects have their own natural characteristics, distinctive features and landscape; thus they may be studied.
Economists find such an approach to that quite problematic. According to most economists, a region is an area characterised by specific methods of management and governance, correlations between individual industries and companies with close internal relations, and having its own local state authority. This is usually

Core Aspects of Typological Classification of Border Regions and Coastal Regions 377
a district, a country, or a republic. Obviously, in this case, it is not possible to apply the criterion of a distance up to 100 km to the border. In other words, a border region would need to be divided into parts. Therefore, in the literature of economics, border regions are areas within the administrative boundaries of the Russian Federation. Naturally, there are economists who prefer different methods and different approaches, but usually they employ their own original set of formulas and determinants of regional development. Thus, a “border region” means a region within the boundaries of the Russian Federation.
There are over 100 ways to define the concept of “region” which are similar in terms of meaning, but also in terms of methodology and research methods used to establish what it denotes in a more or less reasonable and logical manner. However, there are significant discrepancies in the typology and classification of border regions as to how to identify border regions and cross-border regions.
Therefore, a border region is an area located in the immediate vicinity of the state border and characterised by distinctive additional potential in terms of development and international cooperation; it is an area affected by its bound-aries and the border effect.
A border effect consists of the following: geographical location of a border region; developed border infrastructure (border crossings; border inspection and customs posts; communications, logistics, services and other infrastructure); the possibility to extensively exploit the potential resources (land, forest, water, and leisure) on either side of the border; the possibility to engage a large group of inhabitants of a given region and various institutions and organisations oper-ating there in international cooperation; development of international business cooperation; the active exchange of goods and services among territorial units which are situated at the border, etc (BilchAk et al. 2018).
What is particularly important is that border regions include areas of stra-tegic and defensive significance for the country. Such areas may be specifically restricted as far as the flow of people and goods is concerned as well as when it comes to land ownership. For example, in Resolution No. 26 dated 9 January 2001, the President of the Russian Federation approved a list of 380 admin-istrative units where foreign nationals may not own land (Resolution… 2011). Evidently, in this case the border effect is limited. However, it is an exception to the rule. Normally, border regions can use the experience, potential and resources available on both sides of the border.
Development of border regions under new geopolitical circumstances
Coastal border regions are understood as a relatively self-dependent part of a greater area characterised by a complete cycle of reproduction, special forms of manifestation of reproduction stages, characteristic social and economic

378 Wasyl Bilczak, Michał Bilczak
processes, as well as by a special manner of achieving national objectives, the performance of tasks at the sea-coast, on internal waters, on the territorial sea, in the exclusive economic zone and on the continental shelf of the Russian Federation. The literature on the subject offers various interpretations of the concept of “border region”. For instance, border regions are regions adjacent to the land border, border waters or territorial waters, across which runs the line marking the territory of a country; a border region also includes a fragment of the border zone.
A border region is a potential region with its own distinct geography, history, ecology, ethnic groups and economic opportunities which is developed as an area functioning under bilateral economic and social relations.
Border regions are defined in the context of various determinants that de-scribe the nature of their development. They are “regions adjacent to the land border, border waters or territorial waters, across which runs the line marking the territory of a country; a border region includes also a fragment of a bor-der zone” (wArdoMSki et al. 2002). One of the most important determinants of borders is the identification of their type. Thus, scholars distinguish two types of borders – old and new. Old borders are associated with border regions that bordered nations before the breakup of the Soviet Union.
New borders were established after the breakup of the Soviet Union and they are borders that previously had functioned as internal administrative boundaries among the Republics of the Soviet Union. It should be especially noted that with the advent of new boundaries, Russia needed to make a tremen-dous organisational and legal effort to ensure infrastructure at those borders. Currently, Russia has a uniform system of state border infrastructure man-agement. Such a system consists of border inspection, customs, immigration, sanitation, quarantine, veterinary, phytosanitation and quarantine of plants.
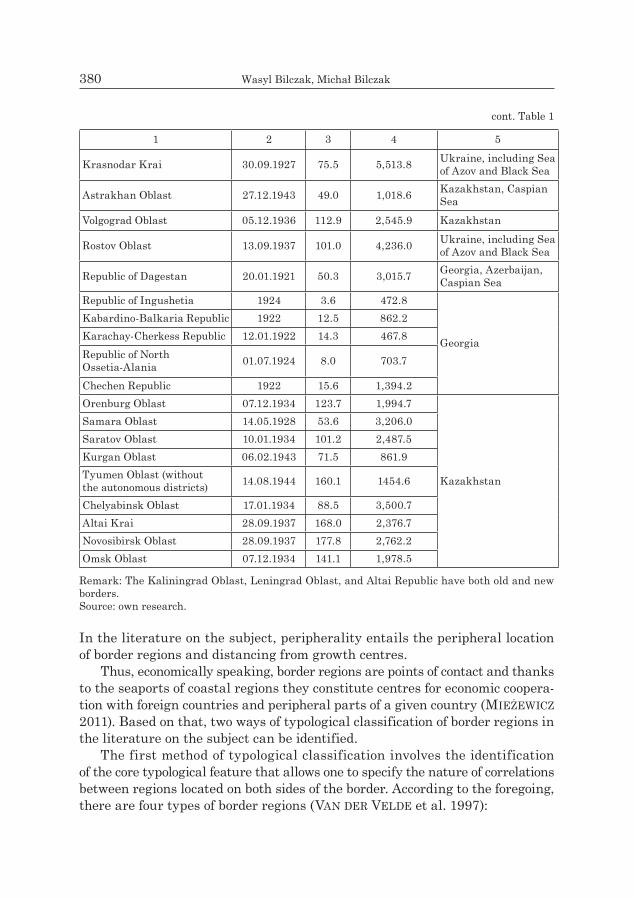
In addition, other authorities are also present at border crossings and en-sure the safety and the efficient functioning of crossings. Table 1 is a general description of border regions with new borders.
Additionally, in certain publications there prevails a strictly academic ap-proach to the notion of “border”. In accordance with the foregoing, the following types are identified: geometric, or more precisely, morphometric; physical and geographical; economic and geographical; anthropogenic; genetic; and evolu-tionary. In the contemporary typological classification of border regions, each of these types is used as a separate criterion or as related to border effects. Therefore, most methods provide for two approaches: the first approach involves the border effect and the second approach involves the peripheral nature of all the border regions.
The border effect is said to include features of an individual border, where a border is considered to be a barrier, a contact, and a diffusion entity. In this case, a functional feature is the openness or restrictiveness of a border and the effects include cooperation and integration or isolation and lack of contact.

Core Aspects of Typological Classification of Border Regions and Coastal Regions 379
Table 1Characteristics of border regions with their old and new borders
Specification Year of establishment
Area [km2]
Population (thousand)
(as at 1 January 2016)
Neighbouring country, aquatory
1 2 3 4 5Border regions with old borders
Republic of Karelia 08.06.1920 180.5 629.9 FinlandArkhangelsk Oblast (without the autonomous district) 23.09.1937 413.1 1,130.2 Arctic Ocean
Kaliningrad Oblast 07.04.1946 15.1 976.4 Poland, LithuaniaLeningrad Oblast 01.08.1927 83.9 1,778.8 Finland, EstoniaMurmansk Oblast 28.05.1938 144.9 762.2 Norway, FinlandYamalo-Nenets Autonomous Okrug 10.12.1930 769.3 534.1 Arctic Ocean
Altai Republic 01.06.1922 92.9 215.2 Kazakhstan, China, Mongolia
Republic of Buryatia 30.05.1923 351.3 982.3MongoliaTyva Republic 11.10.1944 168.6 315.6
Zabaykalsky Krai 01.03.2008 431.9 1,083.0Krasnoyarsk Krai 07.12.1934 2,366.8 2,866.5
Arctic OceanSakha (Yakutia) Republic 27.04.1922 3,083.5 959.7Kamchatka Krai 20.10.1932 464.3 316.1
Japan (sea borders), Pacific Ocean
Primorsky Krai 20.10.1938 164.7 1,929.0Khabarovsk Krai 20.10.1938 787.6 1,334.5Magadan Oblast 03.12.1953 462.5 146.4Sakhalin Oblast 20.10.1932 87.1 487.3Amur Oblast 20.10.1930 361.9 805.7
ChinaJewish Autonomous Oblast 07.05.1934 36.3 166.1
Chukotka Autonomous Okrug 10.12.1930 721.5 50.2
USA (sea borders), Pacific Ocean, Arctic Ocean
Border regions with new bordersBryansk Oblast 05.07.1944 34.9 1,225.8 Belarus, UkraineBelgorod Oblast 06.01.1954 27.1 1,550.1
UkraineVoronezh Oblast 13.06.1934 52.2 2,333.5Kursk Oblast 13.06.1934 30.0 1,120.0Smolensk Oblast 27.09.1937 49.8 958.6 Belarus
Pskov Oblast 23.08.1944 55.4 646.4 Estonia, Latvia
Republic of Kalmykia 04.11.1920 74.7 278.8 Caspian Sea
380 Wasyl Bilczak, Michał Bilczak
In the literature on the subject, peripherality entails the peripheral location of border regions and distancing from growth centres.
Thus, economically speaking, border regions are points of contact and thanks to the seaports of coastal regions they constitute centres for economic coopera-tion with foreign countries and peripheral parts of a given country (MieżeWicz 2011). Based on that, two ways of typological classification of border regions in the literature on the subject can be identified.
The first method of typological classification involves the identification of the core typological feature that allows one to specify the nature of correlations between regions located on both sides of the border. According to the foregoing, there are four types of border regions (VAn dEr VEldE et al. 1997):
1 2 3 4 5
Krasnodar Krai 30.09.1927 75.5 5,513.8 Ukraine, including Sea of Azov and Black Sea
Astrakhan Oblast 27.12.1943 49.0 1,018.6 Kazakhstan, Caspian Sea
Volgograd Oblast 05.12.1936 112.9 2,545.9 Kazakhstan
Rostov Oblast 13.09.1937 101.0 4,236.0 Ukraine, including Sea of Azov and Black Sea
Republic of Dagestan 20.01.1921 50.3 3,015.7 Georgia, Azerbaijan, Caspian Sea
Republic of Ingushetia 1924 3.6 472.8
Georgia
Kabardino-Balkaria Republic 1922 12.5 862.2Karachay-Cherkess Republic 12.01.1922 14.3 467.8Republic of North Ossetia-Alania 01.07.1924 8.0 703.7
Chechen Republic 1922 15.6 1,394.2Orenburg Oblast 07.12.1934 123.7 1,994.7
Kazakhstan
Samara Oblast 14.05.1928 53.6 3,206.0Saratov Oblast 10.01.1934 101.2 2,487.5Kurgan Oblast 06.02.1943 71.5 861.9Tyumen Oblast (without the autonomous districts) 14.08.1944 160.1 1454.6
Chelyabinsk Oblast 17.01.1934 88.5 3,500.7Altai Krai 28.09.1937 168.0 2,376.7Novosibirsk Oblast 28.09.1937 177.8 2,762.2Omsk Oblast 07.12.1934 141.1 1,978.5
Remark: The Kaliningrad Oblast, Leningrad Oblast, and Altai Republic have both old and new borders.Source: own research.
cont. Table 1

Core Aspects of Typological Classification of Border Regions and Coastal Regions 381
– isolated border regions – lack of border contact caused by warfare, political disputes, strong nationalist trends, ideological or religious hostility, cultural differences or ethnic competition;
– co-existing border regions – there is some economic and cultural cooperation;– interrelated border regions – economic, cultural and social cooperation is
as developed as possible for existing borders;– integrated border regions – integration to a maximum possible extent,
free flow of people, commodities, funds and ideas. Border regions evolve from isolated regions to integrated regions, which is important for their socio-economic development.
The second approach involves the combined application of two criteria: type of state border and the characteristics of regions located at that border.
The following types of state borders are identified: isolating borders, trans-lucent borders, connecting borders, and integrating borders. The core features of regions located at the state border include: political relations between states; the economic situation in border regions; the cultural situation in border regions; and the internal policy on border regions (koloSoV et al. 2005).
Characteristics and features of the development of coastal regions
When discussing border regions, one should particularly distinguish coastal regions due to their nature and aspects of development. Coastal regions are closely related to the national maritime policy implemented using coastal and marine resources of the state and society, constituting the marine potential of Russia. At the root of that potential there are: sea transport; Navy; fishing fleet; R&D and specialist infrastructure, including facilities and resources for searching for and prospecting fuel, energy, and mineral deposits; the shipbuilding industry; and infrastructure required for the operation and development of the above-mentioned facilities (Tab. 2).
Obviously, besides being involved in economic and social policies, coastal regions are often engaged in the creation and implementation of the national maritime policy through local governments, business environments, social organisations, and other associations as per the Constitution and legislation of the Russian Federation.
Pursuant to the laws and regulations of Russia, border authorities are respon-sible for coastal land and sea boundaries which are divided into the following types: internal water boundaries, territorial sea boundaries, exclusive economic zone boundaries, continental shelf boundaries and natural resource area bound-aries. The aforementioned types of boundaries have their own characteristics and features; that is why they are described in detail below.
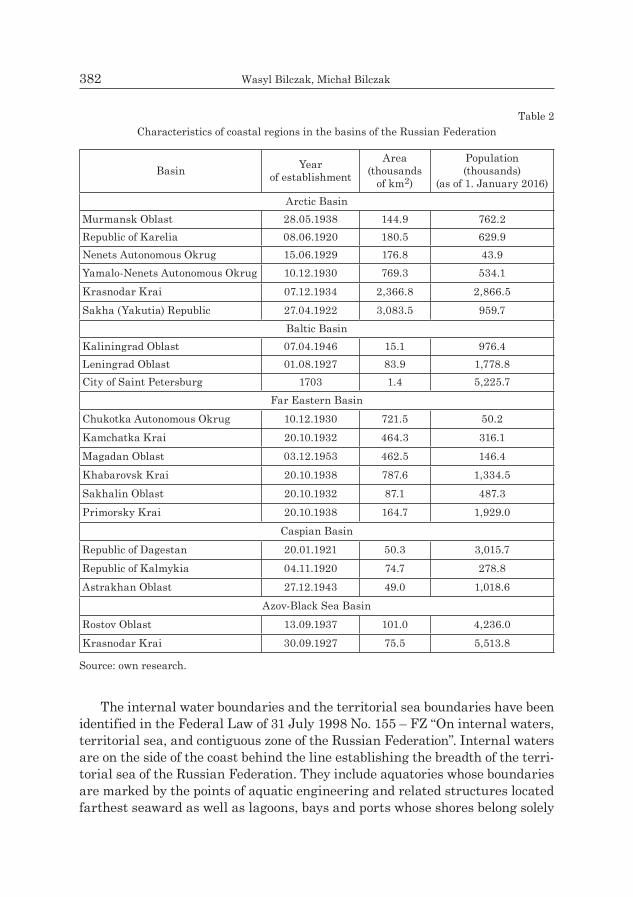
382 Wasyl Bilczak, Michał Bilczak
Table 2Characteristics of coastal regions in the basins of the Russian Federation
Basin Year of establishment
Area (thousands
of km2)
Population (thousands)
(as of 1. January 2016)Arctic Basin
Murmansk Oblast 28.05.1938 144.9 762.2Republic of Karelia 08.06.1920 180.5 629.9Nenets Autonomous Okrug 15.06.1929 176.8 43.9Yamalo-Nenets Autonomous Okrug 10.12.1930 769.3 534.1Krasnodar Krai 07.12.1934 2,366.8 2,866.5Sakha (Yakutia) Republic 27.04.1922 3,083.5 959.7
Baltic BasinKaliningrad Oblast 07.04.1946 15.1 976.4Leningrad Oblast 01.08.1927 83.9 1,778.8City of Saint Petersburg 1703 1.4 5,225.7
Far Eastern BasinChukotka Autonomous Okrug 10.12.1930 721.5 50.2Kamchatka Krai 20.10.1932 464.3 316.1Magadan Oblast 03.12.1953 462.5 146.4Khabarovsk Krai 20.10.1938 787.6 1,334.5Sakhalin Oblast 20.10.1932 87.1 487.3Primorsky Krai 20.10.1938 164.7 1,929.0
Caspian BasinRepublic of Dagestan 20.01.1921 50.3 3,015.7Republic of Kalmykia 04.11.1920 74.7 278.8Astrakhan Oblast 27.12.1943 49.0 1,018.6
Azov-Black Sea BasinRostov Oblast 13.09.1937 101.0 4,236.0Krasnodar Krai 30.09.1927 75.5 5,513.8
Source: own research.
The internal water boundaries and the territorial sea boundaries have been identified in the Federal Law of 31 July 1998 No. 155 – FZ “On internal waters, territorial sea, and contiguous zone of the Russian Federation”. Internal waters are on the side of the coast behind the line establishing the breadth of the terri-torial sea of the Russian Federation. They include aquatories whose boundaries are marked by the points of aquatic engineering and related structures located farthest seaward as well as lagoons, bays and ports whose shores belong solely

Core Aspects of Typological Classification of Border Regions and Coastal Regions 383
to the Russian Federation, up to the straight line running from shore to shore in the place of the maximum low tide, where from the sea side for the first time one or a few passages appear if the width of each of them does not exceed 24 nautical miles. In this case, the territorial sea of the Russian Federation adjacent to the land or the internal waters is a 12 nautical mile wide strip of sea measured from the baseline.
There are five types of baselines from which the breadth of the territorial sea is measured.
The first type is a line of the maximum low tide along the shore marked on the official, published nautical maps.
The second type is a straight baseline connecting the points of islands, reefs, and rocks located farthest seaward in places where the shoreline is especially wavy or where along and in close proximity to the shore there is a chain of islands.
The third type is a straight line drawn across a river estuary, between the points on the river banks farthest seaward at the maximum low tide.
The fourth type is a straight line not exceeding 24 nautical miles, connecting the points of the maximum low tide, the points of the outlet of a lagoon or a bay between islands or between an island and a continent, whose shores belong to the Russian Federation.
The fifth type is an arrangement of straight (more than 24 nautical miles long) baselines that connect the points of the outlet of a lagoon or a bay between islands or between an island and land historically belonging to the Russian Federation (Federal Law On internal waters, territorial sea and contiguous zone of the Russian Federation).
Of particular interest appears to be the typology of boundaries within the Russian exclusive economic zone. The exclusive economic zone is a sea area located outside the territorial sea and adjacent thereto, with a special legal status defined by the Russian Federation, pursuant to the international agree-ments signed by Russia, and in compliance with the norms of international law. The exclusive economic zone has inner and outer boundaries. The inner boundary is the territorial sea boundary and the outer boundary is a distance of 200 nautical miles from the baseline from which the breadth of the territorial sea is measured as long as the international agreements signed by Russia do not provide otherwise.
Exclusive economic zones are of great importance for the development of economic operators in coastal and other regions due to deposits of natural resources covering the bottom of the sea and lying underneath it. Aquatic bio-logical resources, including fish, aquatic mammals, seaweed and other aquatic fauna and flora account for the potential resources of a coastal region. Of consid-erable significance are also inanimate resources of an exclusive economic zone. These are mineral resources at the bottom of the sea, including chemical elements and their compounds in the seawater; energy from tides, currents, and wind;

384 Wasyl Bilczak, Michał Bilczak
as well as other types of inanimate resources (Federal Law On the exclusive economic zone of the Russian Federation).
It should also be emphasised that coastal regions have the right to operate a business in an exclusive economic zone. This and related rights are defined in the federal case-law, for instance, in the Federal Laws On deposits, On fisheries and conservation of aquatic biodiversity resources, and others.
In addition, apart from the foregoing typologies of internal water boundaries, territorial sea boundaries and exclusive economic zone boundaries, of relevance is the typology of the Russian continental shelf boundaries. By definition, conti-nental shelf boundaries include the sea bottom and underwater deposits beyond the boundaries of the territorial sea for the entire length of the natural continu-ation of its land up to the outer boundary of underwater edges of the continent. The underwater edge of the continent is a further portion of the continental massif covering the area and deposits of the continental shelf.
The inner boundary of the continental shelf is the outer boundary of the territorial sea, and the outer boundary is located at a distance of 200 nautical miles from the baselines from which the breadth of the territorial sea is meas-ured, provided that the outer boundary of the underwater edge of the continent is not situated at a distance exceeding 200 nautical miles. In particular, it needs to be noted that the identification of continental shelf boundaries is of strategic importance both for the entire state and unquestionably for coastal regions.
Presently, the continental shelf is rich in strategically important natural resources, including natural hydrocarbons, and perhaps that is why the identi-fication of inner and outer boundaries is particularly important for every nation with access to the sea.
The typology of inner boundaries of sea waters, the territorial sea, exclusive economic zones, and the continental shelf is of the utmost importance for coastal regions from the perspective of a national economy. The next chapter contains a scientific analysis in order to classify the aspects of the socio-economic devel-opment of the coastal regions of Russia.
Conclusions
Typology has a special place in research projects. This is because the Russian Federation has numerous models of regional development where the character-istics of individual regions, as well as geopolitical circumstances, are taken into consideration. Russia is the only country in which there is such a great variety of geographic, economic, cultural and political determinants influencing territorial units, which means that often enough there are material differences observed between them, also resulting from the vast sizes and large distances between Russian territorial units. Thus, typological classification of regions is not only

Core Aspects of Typological Classification of Border Regions and Coastal Regions 385
of great relevance, but it also provides for the classification of regions into separate groups, taking into account the similarities of features and the socio-economic development (inhabitants’ standard of living, resources and potential, invest-ments and innovations). Generally, relations between groups of regions with similar features are defined based on a statistical analysis (cluster analysis).
The research results suggest that the level of socio-economic development of coastal regions and border regions is ascribed not only to internal charac-teristics and development aspects, but also to particular links to analogous determinants and the characteristics of neighbouring regions and nations. For example, stable cross-border relations foster a high level of development of border areas, whereas tensions and unstable relations lead to a low level of development.
In the Russian Federation, this is particularly manifested, e.g. in the develop-ment of regions bordering with Kazakhstan and Belarus characterised by active cross-border exchange and a strong border effect. On the other hand, long-term domestic and international instability in the Caucasus hinders development and results in leaving such border areas poorly developed.
Unfortunately, scholars have yet to agree on a uniform system of typological classification of regions. Simultaneously, there are noteworthy research results for individual regional development trends which have already been sufficiently classified. Therefore, with regard to the foregoing, it is imperative to carry out further detailed, even interdisciplinary research on this subject.
Translated by Biuro Tłumaczeń OSCARProofreading by Michael Thoene
Accepted for print 5.11.2018
References
Bezpieczeństwo i współpraca międzynarodowa w pasie nowych granic z Rosją. 2002. Eds. L.B. Wardomski, S.W. Golunow. Wydawnictwo NOFMO, Moscow, Volgograd, p. 572.
BilchAk V., BilchAk M. 2018. Border regions: classification, diagnostics, innovations. Creative Economy, Moscow, p. 324.
Decree of the President of the Russian Federation No. 26 of 9 January 2011 On approving the list of border territories where foreign citizens, stateless persons, and foreign legal entities cannot own land.
Federal Law of 17 December 1998 No. 191–FZ On the exclusive economic zone of the Russian Federation, as amended.
Federal Law of 31 July 1998 No. 155–FZ On internal waters, territorial sea, and contiguous zone of the Russian Federation, as amended.
koloSoV V.A., MironEnko N.S. 2005 Geopolityka i geografia polityczna. Wydawnictwo Aspekt Press, Moscow, p. 479.
MieżeWiczN.M. 2011. Przygraniczna współpraca: teoria i rosyjska praktyka regionalna. Połu-dnioworosyjskie Forum, Rostów nad Donem, 1: 24–33.
VaNDerVelDeВ.,MartiNr.1997. So Many Regions, so Many Borders. A Behavioural Approach in the Analysis of Border Effects. Paper prepared for the 37th European Congress of the European Regional Science Association. 26–29 August 1997. Rome.


OLSZTYN ECONOMIC JOURNAL2018, 13(4), 387–396
A METHOD FOR CALCULATING THE REAL VALUE OF EQUITY BY IDENTIFYING TOXIC ASSETS
IN THE REPORTS OF PROFESSIONAL PARTICIPANTS OF THE SECURITIES MARKET
Alexander Borodin, Vadim Shamin, Irina ShaminaDepartment of Financial Management
Faculty of FinancePlekhanov Russian University of Economics in Moscow
e-mail: [email protected]
K e y w o r d s: toxic assets, reports of professional participants of the securities market, the real value of equity, supervision of the Bank of Russia.
A b s t r a c t
This article is devoted to a comprehensive study of toxic assets, which are on the balance sheets of professional securities market participants, in order to calculate the real value of capital. The authors have developed a method similar to a formalized algorithm for identifying toxic assets of liquidating or liquidated companies and assets in credit institutions with a revoked license, for subsequently adjusting the value of equity (net assets), and analyzing for compliance with the Bank of Russia supervisory requirements. The method is described by the authors in accordance with BPMN notation. The authors determined the information base of the method, which includes only mandatory reporting and open information resources, which makes it simple and transparent for users. Prospective users of the method may be the Bank of Russia, current and future coun-terparties of professional participants in the securities market, DBMS developers and scientific employees of economic specialties. The method was tested by the authors on the basis of a real-life brokerage company.
388 Alexander Borodin, Vadim Shamin, Irina Shamina
METODA OBLICZANIA RZECZYWISTEJ WARTOŚCI KAPITAŁU WŁASNEGO PRZEZ IDENTYFIKACJĘ AKTYWÓW TOKSYCZNYCH W RAPORTACH
PROFESJONALNYCH UCZESTNIKÓW RYNKU PAPIERÓW WARTOŚCIOWYCH
Alexander Borodin, Vadim Shamin, Irina ShaminaKatedra Zarządzania Finansami
Wydział FinansówRosyjski Uniwersytet Ekonomiczny im. G.W. Plechanowa w Moskwie
S ł o w a k l u c z o w e: aktywa toksyczne (destrukcyjne), raporty profesjonalnych uczestników rynku papierów wartościowych, realna wartość kapitału własnego, nad-zór nad Centralnym Bankiem Rosji.
A b s t r a k t
Publikacja jest poświęcona kompleksowej analizie toksycznych aktywów znajdujących się w bilansach profesjonalnych uczestników rynku papierów wartościowych. Celem było obliczenie rzeczywistej wartości kapitału. Autorzy opracowali metodę w postaci sformalizowanego algorytmu identyfikującego toksyczne aktywa likwidujących się lub likwidowanych spółek i aktywa w instytu-cjach kredytowych z cofniętą licencją, do późniejszej korekty wartości kapitału własnego (aktywów netto) i analizowania zgodności z wymaganiami pod nadzorem Centralnego Banku Rosji. Metoda ta jest opisana przez autorów zgodnie z notacją BPMN. Autorzy określili podstawę informacyjną metody, która obejmuje tylko obowiązkowe raportowanie i otwarte zasoby informacyjne, co czyni ją prostą i przejrzystą dla użytkowników. Potencjalnymi jej użytkownikami może być Centralny Bank Rosji, a także obecni i przyszli kontrahenci profesjonalnych uczestników rynku papierów wartościowych, deweloperzy DBMS oraz pracownicy naukowi o specjalnościach ekonomicznych. Metodę autorzy przetestowali na podstawie danych z istniejącej firmy brokerskiej.
Introduction
Currently the number of bankruptcies of companies in the Russian economy has reached a maximum historical value. According to the results of the third quarter of 2017, their number amounted to 1,127 bankrupt companies (ryBAlkA et al. 2017, p. 2–4). In addition, due to the ongoing policy of the Bank of Rus-sia the mass recall of bank licenses from unscrupulous or ineffective banks is continuing, the results of the third quarter of 2017 showed that 15 licenses of credit institutions have been revoked. Accordingly, the subject of this research is relevant at the moment, because liquidated or liquidating companies, as well as credit institutions with a revoked license may be counterparties to operating companies, which forms toxic assets on the latters’ balance sheets (bad accounts receivable, impaired securities, sunken financial resources on bank accounts). However, operating companies do not create provisions for these toxic assets in order to prevent a decline in financial performance, to maintain its attractive-ness, and to prevent violations of regulatory standards.

A Method for Calculating the Real Value of Equity by Identifying Toxic Assets… 389
This problem, first of all, relates to non-credit financial organizations, which is explained on the one hand by the peculiarities of their activities, according to which the largest part of used money is borrowed (from individuals and com-panies) and the main share of the balance comes from financial investments. On the other hand, it is explained by the regulation and supervision of the Bank of Russia, which, unlike credit organizations, are obsolete in terms of volume and quality of the gathered information, and their methods; as well as the ad hoc and spontaneous character of processing it, which do not comply with modern requirements.
The solution to this problem on the basis of the current mandatory reporting is proposed to be considered by the example of the professional securities market participants (hereinafter abbreviated to PSMP) and is presented as a method. In accordance with the Federal Law of the Russian Federation No. 39-FZ of April 22, 1996 On the Securities Market a PSMP is:
– brokerage activity;– dealer activity, including a forex dealer;– securities management;– depositary activity;– activities to maintain the register;– organization of transactions in the securities market. The method, which is proposed in the article, includes, in general terms, the
search for assets of liquidated or liquidating companies and for assets, which are held in credit institutions with revoked licenses, the adjustment of equity (net assets) and the analysis of compliance with supervisory requirements, which is established by the Bank of Russia (for PSMP, it is the fulfillment of the con-ditions imposed on capital).
Within the framework of the developed method, it is advised to use two sourc-es of information on the activities of the PSMP and its counterparties, which include borrowers and debtors of the PSMP, companies, whose securities were acquired as property, and companies, whose promissory notes were discounted by the PSMP, etc.
Research methodology
Indicators of certain forms of PSMP reports, which were prepared in ac-cordance with the Instructive Regulation of the Bank of Russia No. 3533-U of January 15, 2015 On the Terms and Procedure for Compiling and Submitting Reporting Forms by Professional Securities Market Participants to the Central Bank of the Russian Federation (Instructive Regulation of the Bank of Russia of January 15, 2015 No. 3533-U On the Terms and Procedure for Compiling and Submitting Reporting Forms by Professional Securities Market Participants to the Central Bank of the Russian Federation).

390 Alexander Borodin, Vadim Shamin, Irina Shamina
Data of information resources SPARK or Kontur and the Federal Tax Service of Russia, on the basis of which the user conducts:
– a search for liquidated or liquidating companies among counterparties of the PSMP (using the Unified State Register of Legal Entities);
– an analysis of the PSMP counterparties with signs of “one-day” firms, such as the address of a company’s registration being the address of a mass registra-tion; the chief executive officer, chief accountant officer and founder are one and the same person; the absence of the organization at the place of registration etc.
The proposed method for identifying toxic assets in the reporting of the PSMP includes 5 stages:
Phase 1: Determination of the book value of the PSMP equity, which is based on the form 0420413 Calculation of the amount of equity, the value of the minimum amount of equity and the capital-adequacy ratio in accordance with the Instructive Regulation of the Bank of Russia No. 4373-U of 11 May, 2017 About requirements to equity of professional participants of the security market (Instructive Regulation of the Bank of Russia of 11 May, 2017 No. 4373-U About requirements to equity of professional participants of the security market) by the equation: MAE = X · AC (1)where:
MAE – minimum amount of equity,X – a constant value, which equals 2 million rubles (excluding depositories),AC – additional coefficient, which is set by point 3 of the Instructive Reg-
ulation No. 4373-U (Instructive Regulation of the Bank of Russia of 11 May, 2017 No. 4373-U About requirements to equity of profes-sional participants of the security market).
For depositories, the value of X is calculated in accordance with the equation and requirements reflected in the Instructive Regulation No. 4373-U.
Phase 2: Identification of liquidated or liquidating companies and companies with signs of being “one-day” firms among PSMP counterparties. The analysis of counterparties is undertaken on the basis of the forms: 0420412 Information on the largest debtors and creditors; 0420414 Information on loans and credits; 0420415 Report of a professional participant of the securities market. The next test includes a check of all counterparties for the presence of the above charac-teristics in the Federal Tax Service of Russia or information resources, such as SPARK and Kontur. The presence of such companies among the counterparties of the PSMP, in our opinion, may indicate toxic assets on the balance sheets. More-over, it is important to note that these assets are characterized by a long period of stay on the balance sheet within the same amount for different reporting dates.
Phase 3: Identification of credit institutions, whose licenses have been re-voked, among counterparties of the PSMP. Analysis of the PSMP accounts in credit institutions is implemented on the basis of the form 0420409 Information

A Method for Calculating the Real Value of Equity by Identifying Toxic Assets… 391
on bank accounts. Detection of monetary funds that have been placed in a credit institution with a revoked license is evidence that this type of asset has a problematic nature.
Phase 4: The assessment of the size of toxic assets and created provisions for toxic assets. In identifying such toxic assets in reports of the PSMP and in the absence of created provisions for these assets (for each of these counterparties), it is necessary to calculate the additional size of the PSMP provisions. For assets of liquidated or liquidating counterpart companies and assets of companies with signs of being “one-day” firms, the amount of the additional provision needs to be 100% because of the low probability of the counterparty’s performance of its liabilities and of the inability to collect these assets. For assets (monetary funds) in credit institutions with revoked licenses, the amount of the addition-al provision equals the difference between the maximum provision value and the average satisfaction value of claims of creditor companies at the beginning of the reporting year. In accordance with the Methodology for establishing cred-itors’ claims and keeping a registry of claims of creditors of a liquidated credit institution, which was approved by the decision of the Board of the state cor-poration Deposit Insurance Agency dated on 07.09.2006 and documented by No. 54, when a credit organization is liquidated, a turn of creditors is formed, in which companies are creditors of the third (last) turn (The methodology of the state corporation Deposit Insurance Agency of September 07, 2006 Es-tablishment of creditors’ claims and maintenance of the register of claims of creditors of the liquidated credit organization). At the beginning of 2017, the average percentage of satisfaction of creditor claims of the third line of credit organizations was 7.5% (Central Bank of the Russian Federation 2017).
Phase 5: Analysis of PSMP compliance with the supervisory requirements, which is established by the Bank of Russia. Based on the results of the assess-ment of the amount of toxic assets in the reports of the PSMP and on the calcu-lation of additional provisions for these types of assets, the value of its equity (net assets) needs to be adjusted, after which the obtained value is compared with the supervisory requirement, namely, with the minimum amount of equity in accordance with the Instructive Regulation of the Bank of Russia of 11 May, 2017 No. 4373-U. If the adjusted capital is below the minimum amount of equity, the Bank of Russia should send a request to the PSMP for adding provisions for problematic debts and for increasing its equity.
A detailed description of the method for identifying toxic assets in the re-porting of the PSMP and for assessing compliance with the requirements of the Bank of Russia is presented in Figure 1.
The proposed method can be expanded in terms of increasing the num-ber of sources of analyzed information in the identification of toxic assets of the PSMP, in particular additional data of the Federal Tax Service of Rus-sia, such as Companies that have not submitted tax reports for more than a year, Companies, which are in collection of tax debts by the bailiffs and other

392 Alexander Borodin, Vadim Shamin, Irina Shamina
Fig. 1. Algorithm for searching the toxic assets of professional participants of the securities market (not credit institutions) using the reporting and data of the Federal Tax Service of Russia
Source: own elaboration.
information. In addition, it should be noted that this method can be automated both by the Bank of Russia and by other companies (credit organizations, soft-ware developers and others), because it is a formalized algorithm.
Analyze the reporting of the PSMP, which carries out brokerage, fiduciary management and financial consulting, in accordance with the proposed method for identifying toxic assets.

A Method for Calculating the Real Value of Equity by Identifying Toxic Assets… 393
At the first stage, the value of the minimum amount of equity was calculated as the multiplication of the value of X (2 million rubles) and the capital-adequa-cy ratio (17.5), which corresponded to the Instructive Regulation of the Bank of Russia of 11 May, 2017 No. 4373-U. The value of this indicator is 35 million rubles. Furthermore, the value of the equity of the PSMP was determined as the difference between the total amount of assets and liabilities, which amount-ed to 136.05 million rubles. Accordingly, the PSMP fulfilled the supervisory requirements of the Bank of Russia in terms of the minimum amount of equity. The calculation of the value of PSMP equity is presented in Table 1.
Table 1Equity calculation of a professional participant of the securities market
Indicator Cost, thous. RUR
Assets
Real estate, vehicles and computer facilities 38,834.78
Computer programs and the cost of their acquisition 195.62
Accounts receivable 30,244.60
Securities and financial contracts 456,586.81
Monetary funds 211,768.57
Total value of assets 737,630.39
Liabilities
Short-term credit and loans 466.44
Accounts payable (including overdue) 598,989.87
Provisions for future expenses and payments and provisions for doubtful debts 2,121.79
Total value of liabilities 601,578.11
Total value of equity 136,052.28
Source: own elaboration.
At the second stage, after checking the PSMP counterparties on the website of the Federal Tax Service of Russia, both liquidated and liquidating companies were identified. On the basis of the form 0420412, large PSMP debtors having debts over 90 days, which amounted to 18.08 million rubles, were found and are reflected in Table 2. The provisions for these debts were not created.
On the basis of section 1 subsection 1.4 of the form 0420415, ordinary shares of the liquidated company were found on the balance sheet of the PSMP. The total amount of investments is 3.74 million rubles, which is reflected in Table 3. The provisions for these securities were not created.

394 Alexander Borodin, Vadim Shamin, Irina Shamina
Table 2Liquidated or liquidating large debtors of a professional participant of the securities market
Name TIN Company’s status in the USRLE by TIN
The amount of debt up to
90 days
The amount of debt over
90 days, thous. RUR
Total amount of
debt, thous. RUR
LLC “Mitprof” 7721756029 excluded from the usrle on the basis of p. 2 art.
21.1 of the federal law of 08.08.2001 No.
129-FZ
0 13,665.14 13,665,14
RLLC “Agrostroy-Service”
7714706450 in the stage of liquidation
0 4,411.42 4,411.42
Source: own elaboration.
Table 3The securities book value of liquidated or liquidating companies which belongs to a professional
participant of the securities market on the basis of ownership and taken to accounting as financial investments
Name of the issuer TIN
Issuer’s status in the USRLE
by TIN
Country code
of the issuer
Security type code
The volume of investments in
securities, thous. RURSVYAZSTROY-5 7451003871 liquidated for
bankruptcy643 SHS3 3,739.00
Source: own elaboration.
At the third stage, the analysis of accounts of the PSMP in credit institutions with the subsequent verification of them was made on the basis of the form 0420409 and on the basis of the websites of the Federal Tax Service of Russia and the Bank of Russia. As a result, monetary funds, which were located in a credit institution with a revoked license, were found. The amount of monetary funds on the account at the end of the reporting period in the PJSC Bank Yugra was 27.5 million rubles. It is reflected in Table 4. The provisions for these placed monetary funds were not created.
At the fourth stage, the value of toxic assets was estimated and amounted to 49,315.56 thousand rubles (13,665.14 thousand rubles + 4,411.42 thousand rubles + 3,739.00 thousand rubles + 27,500.00 thousand rubles). At the same time, there were no provisions for the devaluation of these analyzed assets. In accordance with the proposed method, the value of the additional provisions should be 100% for assets in liquidated or liquidating counterparty companies and should be as a difference between the value of maximum provision and the average satisfaction value of the claims of creditors at the beginning of the

A Method for Calculating the Real Value of Equity by Identifying Toxic Assets… 395
reporting year for assets (monetary funds) in credit institutions with revoked licenses. Therefore, the amount of additional provisions will be 47,253.06 thou-sand rubles [13,665.14 thousand rubles + 4,411.42 thousand rubles + 3,739.00 thousand rubles + (27,500.00 thousand rubles – 27,500.00 thousand rubles × 7.5% ꞉ 100)].
At the fifth stage, the real value of equity (net assets) was calculated and amounted to 88,799.22 thousand rubles (136,052.28 thousand rubles – 47,253.06 thousand rubles), which indicated an overestimation of the real value of PSMP equity at 53.2%.
Therefore, the PSMP needs to complete the provisions for the toxic as-sets, but doesn’t need to increase its equity, because the real size of the PSMP equity is higher than the supervisory requirement of the Bank of Russia (35,000 thousand rubles).
Summary
The presented method for identifying toxic assets of the PSMP on the ba-sis of mandatory reporting has shown its efficiency in the example of the real PSMP and can be applied both by the Bank of Russia for supervisory functions and by the counterparties of PSMP for assessing their real financial condition. It should be noted that this method can be extended and applied to other partic-ipants in the financial market (insurance companies, management companies of investment funds, mutual funds and non-state pension funds).
The following results, which have scientific novelty, have been obtained in the article. This new method for identifying the toxic assets of PSMP on the basis of mandatory reporting has been developed and it does not have any current practical analogues. The advantage of this method is its implementation on the basis of current PSMP mandatory reporting, the simplicity and transparency of analysis and calculations, and the possibility of automation with subsequent
Table 4Information on bank accounts of a professional participant of the securities market in liquidated
or liquidating credit institutions or in credit institutions with a revoked license
Abbreviated name of the credit
organizationTIN
Bank’s status in the USRLE by
TINAccount
currency code
The amount of monetary funds on the account at the end of the reporting
period, thous. RURPJSC Bank Yugra 8605000586 not excluded, the
bank of russia disclaimed a
license
643 27,500.00
Source: own elaboration.

396 Alexander Borodin, Vadim Shamin, Irina Shamina
implementation in the DBMS, since this method is a formalized algorithm. Moreover, the proposed method has the potential for further development, such as an increase in the number of resources of analyzing information and an expansion in the number of analyzing participants in the financial market and their counterparties, thereby making further in-depth cross-sectoral analysis.
Translated by AuthorsProofreading by Michael Thoene
Accepted for print 5.11.2018
References
About requirements to equity of professional participants of the security market. 2017. Instructive Regulation of the Bank of Russia of 11 May, No. 4373-U.
Establishment of creditors’ claims and maintenance of the register of claims of creditors of the liquidated credit organization the methodology of the state corporation “Deposit Insurance Agency” of September 07, 2006 (as amended on March 24, 2016) (approved by the Board of Directors, protocol No. 54).
Liquidation of credit institutions. 2017. Central Bank of the Russian Federation (Bank of Russia), https://www.cbr.ru/credit/likvidbase/information_01012017.pdf (access: 13.12.2017).
On the securities market. 1996. Federal Law of the Russian Federation of April 22, No. 39-FZ (as amended on November 25, 2017).
On the Terms and Procedure for Compiling and Submitting Reporting Forms by Professional Se-curities Market Participants to the Central Bank of the Russian Federation. 2015. Instructive Regulation of the Bank of Russia of January 15, No. 3533-U (as amended on June 21, 2017).
ryBAlkA A., SAlnikoV V. 2017. Bankruptcies of legal entities in Russia: main trends. Center for Macroeconomic Analysis and Short-Term Forecasting, http://www.forecast.ru/_ARCHIVE/Analitics/PROM/2017/Bnkrpc-3-17.pdf (access: 7.11.2017).

OLSZTYN ECONOMIC JOURNAL2018, 13(4), 397–409
EVALUATION OF THE ATTAINMENT OF ENVIRONMENTAL GOALS IN SUSTAINABLE
GROWTH REGARDING GAS EMISSION AND ENERGY CONSUMPTION, AS DEFINED
FOR POLAND IN THE EUROPE 2020 STRATEGY
Mirosława Witkowska-DąbrowskaDepartament of Environmental Economics Real Estate and Agribusines
Faculty of Economic SciencesUniversity of Warmia and Mazury in Olsztyn
e-mail: [email protected] ORCID 0000-0003-1162-7362
K e y w o r d s: reduction of greenhouse gas emission, renewable energy, guidelines for Poland.
A b s t r a c t
In March 2010, the European Commission announced a 10-year strategic plan called ‘Europe 2020 – A strategy for smart, sustainable and inclusive growth’. At the same time, the Polish author-ities approved several strategic documents connected with the Lisbon Agenda and the new Europe 2020 Strategy, intended to support the development of RER and the reduction of emissions, mainly of greenhouse gases. The objective of this study has been to assess the indicators of sustainable growth for Poland against the backdrop of these indicators for the European Union. The analysis included indicators related to gas emission and energy consumption in the years 2004, 2010 and 2015. For each indicator, a so-called demonstration assessment value was calculated, which shows by what percentage the value of a given indicator achieved in Poland is better or worse than the average value of this indicator for the European Union member states The study showed positive changes in the individual indicators in 2004–2015.
OCENA REALIZACJI CELÓW ŚRODOWISKOWYCH ZRÓWNOWAŻONEGO ROZWOJU W ZAKRESIE EMISJI GAZÓW I WYKORZYSTANIA ENERGII PODJĘTYCH
DLA POLSKI W STRATEGII EUROPA 2020
Mirosława Witkowska-DąbrowskaKatedra Ekonomii Środowiska, Nieruchomości i Agrobiznesu
Wydział Nauk EkonomicznychUniwersytet Warmińsko-Mazurski w Olsztynie
S ł o w a k l u c z o w e: redukcja gazów cieplarnianych, energia ze źródeł odnawialnych, zużycie energii, założenia dla Polski.

398 Mirosława Witkowska-Dąbrowska
A b s t r a k t
W marcu 2010 r. Komisja Europejska ogłosiła dziesięcioletni plan strategiczny zatytułowany Europa 2020. Strategia na rzecz inteligentnego i zrównoważonego rozwoju sprzyjającego włączeniu społecznemu. W tym czasie w Polsce zatwierdzono wiele dokumentów strategicznych dotyczących strategii lizbońskiej i nowej strategii Europa 2020, które wspierają rozwój OZE i redukcję emisji gazów, głównie cieplarnianych. Celem badań była ocena wskaźników zrównoważonego rozwoju Polski na tle wskaźników dla Unii Europejskiej. Analizą objęto wskaźniki emisji gazów i zużycia energii w latach 2004, 2010 i 2015. Dla każdego wskaźnika obliczono tzw. ocenę demonstracyjną, która pokazuje, o jaki procent wartość danego wskaźnika dla Polski jest lepsza lub gorsza od jego średniej wartości dla krajów Unii Europejskiej. Przedstawione wyniki badania wykazały pozytywne zmiany w poziomach poszczególnych wskaźników w latach 2004–2015.
Introduction
The world’s economic growth has been achieved at the expense of the natural environment, including shared resources (wElzEr, wiEgAndt 2011, p. 71). In 1969, the U’Thant’s Report demonstrated cause-and-effect relationships in the then current state of the Earth’s environment, and predicted the fate of humanity in the event of lacking prevention measures, thus changing the awareness of the international community and politicians. In the ensuing dis-cussions and events, over the following decade or so, the concept of sustaina-ble growth was developed and firmly rooted. Rapidly changing needs, driven by economic, social and political changes, have enforced certain alterations in the approach to sustainable development. Thus, the development of the idea of sustainable growth did not terminate at the stage of producing numerous definitions and principles, but has continued rather dynamically until now. According to BoryS (2014, p. 1–19), the overriding idea of sustainable devel-opment, which proclaims the right to satisfy the developmental aspirations of the present generation without compromising the rights of future generations to satisfy theirs, has become excessively general in the context of the current paradigm of development (sustainable, durable, self-sustaining eco-development). What is required of us today is to possess specific indicators which should be measured and the goals to be achieved at specific levels of management. This approach calls for the monitoring and assessment of sustainable development over time, which is best to be done with measurable and comparable indicators. More on the achievements in the research methodology in this domain can be found in BoryS (2005, p. 9–22).
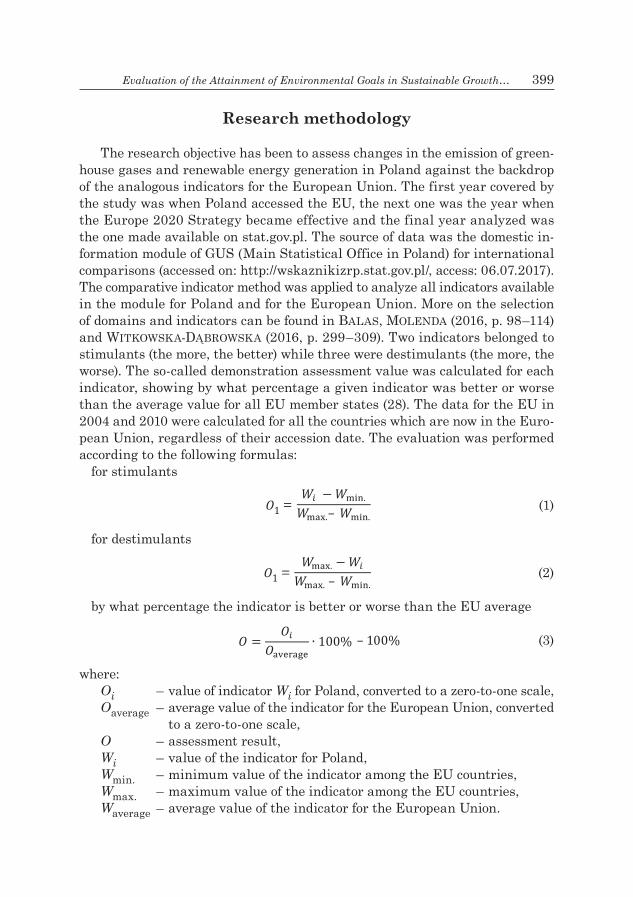
Evaluation of the Attainment of Environmental Goals in Sustainable Growth… 399
Research methodology
The research objective has been to assess changes in the emission of green-house gases and renewable energy generation in Poland against the backdrop of the analogous indicators for the European Union. The first year covered by the study was when Poland accessed the EU, the next one was the year when the Europe 2020 Strategy became effective and the final year analyzed was the one made available on stat.gov.pl. The source of data was the domestic in-formation module of GUS (Main Statistical Office in Poland) for international comparisons (accessed on: http://wskaznikizrp.stat.gov.pl/, access: 06.07.2017). The comparative indicator method was applied to analyze all indicators available in the module for Poland and for the European Union. More on the selection of domains and indicators can be found in BAlAS, MolEndA (2016, p. 98–114) and WitkoWska-DąbroWska (2016, p. 299–309). Two indicators belonged to stimulants (the more, the better) while three were destimulants (the more, the worse). The so-called demonstration assessment value was calculated for each indicator, showing by what percentage a given indicator was better or worse than the average value for all EU member states (28). The data for the EU in 2004 and 2010 were calculated for all the countries which are now in the Euro-pean Union, regardless of their accession date. The evaluation was performed according to the following formulas:• for stimulants
O1 = 𝑊𝑊𝑖𝑖 − 𝑊𝑊min.
𝑊𝑊max.– 𝑊𝑊min. (1)
• for destimulants
O1 = 𝑊𝑊max. − 𝑊𝑊𝑖𝑖
𝑊𝑊max. – 𝑊𝑊min. (2)
• by what percentage the indicator is better or worse than the EU average
𝑂𝑂 = 𝑂𝑂𝑖𝑖𝑂𝑂average
∙ 100% – 100% (3)
where:Oi – value of indicator Wi for Poland, converted to a zero-to-one scale, Oaverage – average value of the indicator for the European Union, converted
to a zero-to-one scale, O – assessment result, Wi – value of the indicator for Poland, Wmin. – minimum value of the indicator among the EU countries, Wmax. – maximum value of the indicator among the EU countries, Waverage – average value of the indicator for the European Union.
400 Mirosława Witkowska-Dąbrowska
Consequently, an assessment was made for each indicator, showing by what percentage it was better or worse in Poland compared to the EU average (ro-gAlA 2005, p. 237–246). The research results were discussed and presented graphically in a table.
Results and Discussion
The article focuses on indicators connected with the environmental goals in the scope of climate and energy. The importance of these issues cannot be overes-timated. The unavoidable consequences of climate change are discussed broadly and in great depth by BlEwitt (2014, p. 394) and MulligAn (2014, p. 330). Both authors present the historical and political background, simultaneously providing evidence that the public opinion, and especially business and political elites, may not be persuaded to recognize the problem unless confronted with the economic consequences of climate change. What matters is to ensure that deci-sion-makers realize that the changing climate causes negative economic effects. Also, the Paris Agreement underlines the necessity of warning people against the consequences of global warming and the resulting losses. Internationally, it is the European Union that excels in the implementation of measures to protect the climate. The EU was one of the first leading economies which presented its planned contribution to climate protection. The plan is to reduce emissions by at least 40% by the year 2030. Pursuant to the Paris Agreement, a consensus has been reached regarding the long-term goal such as to keep the increase of the global average temperature at no more than 1.5°C above the level prior to the industrial era. This would create a chance to reduce the human impact on climate change and its consequences (olkuSki et al. 2017, p. 91–102). This is a more ambitious target than the one agreed on earlier in Copenhagen, where nearly 200 countries declared their intention to reduce global warming to 2°C relative to the pre-industrial era (kArAczun, SoBolEwSki 2010, p. 1–9). Reach-ing a goal such as reducing the rise in temperature by 2°C would involve a net emission reduction down to zero around the year 2050, whereas limiting the temperature rise down to 1.5°C would mean that net emission should be decreased to zero by the year 2030. Meanwhile, it is important to reach the maximum level of emission globally as soon as possible. It needs to be underlined that developing countries1 will need more time than developed ones to achieve the level that will be followed only by the reduction of emission. The aim is to obtain a balance between the emission from anthropogenic sources and the absorption of green-house gases by the mid-21st century. The developed countries have declared to provide developing countries with financial support by transferring 100 billion
1 Countries outside Annex 1 of the Kyoto Protocol.

Evaluation of the Attainment of Environmental Goals in Sustainable Growth… 401
US dollars annually to finance investment projects which would reduce emission (PiWoWarczyk-Ściebura,olkuski2016, p. 93–108).
The documents passed under the Paris Agreement assume that over half of the greenhouse gas emission reductions will be achieved by the European Union Emission Trading Scheme, known as the EU ETS. Another consequence of the above agreement was to intensify changes in the implementation of tech-nologies that use black or brown coal as energy carriers. According to olkuSki et al. (2017, p. 91–102), the greatest challenge was to persuade China and the USA to sign the agreement, as these two countries are responsible for nearly 44.5% of the world’s emission of CO2. Despite the success, less than 1.5 years after the ratification of the Paris Agreement by the then US president Barack Obama, the next American president, Donald Trump, declared that the USA would withdraw from the agreement.
One of the causes of GHG emission is the high consumption of coal by the power generation industry. Unfortunately, there are very large disproportions in the production of coal among the EU member states as well as other coun-tries. While some states have decreased coal production over recent years and have declared that they will completely cease the use of coal over the next 10 to 15 years (e.g. the UK, Finland, France), others are either constructing or plan-ning to construct new coal power plants (e.g. Greece, Poland) (rochA et al. 2017, p. 10–34). Meanwhile, the actual role of coal in unfavourable climate changes is being debated, and there are many proposals to reduce the contribution of coal in energy production. A solution could be to raise the coal prices so as to diminish its competitiveness relative to other energy sources which generate fewer emis-sions (knoPf, EdEnhofEr 2014, p. 1–5). Furthermore, rogAl (2010) claims that the energy policy needs reforming. Special attention should be drawn to an analysis of underlying causes of the excessive exploitation of natural resources and possible preventive measures. Management of the demand side and more efficient use of renewable energy resources, such as water power or biogas, create a large potential to achieve an equilibrium in energy consumption. In the EU, legal documents are being implemented which envisage the reduction of GHG emissions in the long-term perspective, for example A Road Map for Moving to a Competitive Low Carbon Economy in 2050, which the European Commission resolved to accept in 2011, foresees that the emission of greenhouse gases in the European Union should decrease by 80–95% by the year 2050. According to lorEk (2016, p. 162–171), the pursuit of this aim will be futile unless an agreement is achieved with the biggest global players in the power market, i.e. with China and the USA. After the US President declared a change in his country’s standpoint, the demand for coal, and consequently coal mining, will increase (olkuSki et al. 2017, p. 91–102).
In March 2010, the European Commission announced a 10-year strategic plan called Europe 2020. A strategy for smart, sustainable and inclusive growth, which somehow superseded the Lisbon Strategy. The new strategy was preceded

402 Mirosława Witkowska-Dąbrowska
by numerous consultation documents2 produced by the European Commission, where models of the EU development were proposed.
The Europe 2020 Strategy posed a question as to ‘where we want Europe to be’ in the year 2020. Referring to this question, the Commission suggested sev-eral overriding, measurable goals to be achieved in the EU. Due to the different starting points in individual member states, different achievement levels were established. The goals included environmental ones, such as 20/20/20 (Europe 2020. A strategy… 2010) regarding climate and energy (including the reduction of carbon dioxide by as much as 30% if the conditions are right), and the target for Poland is to reduce consumption of primary energy down to about 96 Mtoe3, to increase the use of renewable energy sources, and to reduce emission of CO2. Both the Lisbon Strategy and the Europe 2020 Strategy were developed on the grounds of sustainable development. An in-depth discussion regarding mutual relationships between the Lisbon Strategy and sustainable development (SD) is provided by StEurEr and BErgEr (2010, p. 1–22), who point to the problems arising from the lack of cohesion on the international level between the strategic documents and applied indicators. The reasons why these strategies seem to fail, ranging from excessive goals to exorbitant costs, are identified by żMuDa (2011, p. 200–210).
The outcome of the implementation of the above resolutions should be real and monitorable changes. Five sustainable growth indicators in the domain of environmental order (Tab. 1) have been chosen to assess the current state relative to the evaluation made at the stage of Poland’s accessing the EU and at the moment the Europe 2020 Strategy was adopted. These indicators are connected with the targets set in the Europe 2020 Strategy.
Generally, the growth in the use of renewable energy sources across the EU has decelerated in the last few years (Policy paper… 2013, p. 18). As a result, and contrary to global trends, investments into renewable energy sources in the EU decreased from over 120 billion USD in 2011 to over 50 billion USD in 2015. Europe has lost the position of being the global leader in clean ener-gy generation, which is now occupied by China (PrAndEcki 2014, p. 52–66). China has recognized the important role of advertising campaigns and educa-tion in attaining better low-emission awareness of the society (wEn et al. 2015, p. 2261–2267). Conversely, an imperfect mechanism of support for photovoltaics in some countries (the Czech Republic, Spain) has led to a crisis. The initially
2 Consultation of European Regions and Cities on New Strategy for Sustainable Growth. A new Lisbon Strategy after 2010. Final Report, Committee of the Region, The EU’s Assembly of Regional and Local Representatives, 2010. Consultation on the Future „EU 2020” Strate-gy, Commission Working Document, Commission of the European Communities, Brussels, COM(2009)647 final, 2009. Europe 2020, The New Lisbon Strategy, Social and Economic Coun-cil, Hague, July 2009.
3 Tonne of oil equivalent (toe) is an energy equivalent of one metric tonne of crude oil having a net calorific value of 10,000 kcal/kg. It is mainly used in the power industry to express large amounts of energy. 1 Mtoe = 1,000,000 toe.

Evaluation of the Attainment of Environmental Goals in Sustainable Growth… 403
Table 1 Evaluation of sustainable growth indicators in the domain of environmental order
No
of in
dica
tor
Nat
ure
of th
e in
dica
tor
Name of the indicator of sustainable
growthYear
Indicator Size for the EU-28
Rating above /
below the average in the
European Union
Poland max. min. European Union [%]
1 s
share of energy from renewable sources in final gross energy consumption [%]
2004 6.90 38.70(Sweden)
0.10(Malta) 8.30 –17.00
2010 9.30 47.20(Sweden)
1.00(Malta) 12.90 –26.00
2015 11.80 53.90(Sweden)
5.00(Malta) 16.7 –39.00
2 s
share of energy from renew-able sources in transport fuel consumption [%]
2004 0.70 3.80(Sweden)
0.00(Cyprus. Ireland) Malta)
1.00 –30.00
2010 6.60 10.90(Sweden)
0.00(Cyprus) 5.20 8.00
2015 6.40 24.00(Sweden)
0.40 (Estonia) 6.70 –7.40
3 d
greenhouse gas emission in tonne of oil equivalent [%]1988=100%*
2004 70.70 146.65(Spain)
42.85(Latvia) 94.85 49.00
2010 72.23 123.12(Spain)
42.06(Lithuania) 83.04 26.00
2015 68.48 115.84(Portugal)
43.69(Lithuania) 71.35 8.00
4 d
greenhouse gas emission per unit of con-sumed energy [%]
2004 98.40 106.30(Luxemburg)
86.40(Czech
Republic)96.60 –19.00
2010 98.00 117.60(Lithuania)
83.80(Czech
Republic)92.80 –27.00
2015 91.50 112.00(Bulgaria)
74.20(Finland) 89.10 –10.00
5 denergy consump-tion by economy [kgoe/1000 euro]
2004 329.70 630.60(Bulgaria)
85.80(Denamark) 151.60 –35.00
2010 278.30 464.90(Bulgaria)
82.40(Denamark) 137.70 –44.00
2015 227.30 448.50(Bulgaria)
62.00(Ireland) 121.60 –33.00
*without Cyprus and Malta. Source: the authors, based on http://wskaznikizrp.stat.gov.pl/, Eurostat.

404 Mirosława Witkowska-Dąbrowska
high financial support stimulated an intensive development of solar farms, which has encouraged some other countries to reverse the changes implemented in their support mechanism and moratoriums on the development of renewable energy sources. The high rise in RER in Spain was a result of the widespread promotion of this source of energy, dependent on the so-called guaranteed prices, i.e. Feed-In-Tariff – FIT (krzykowSki 2015, p. 24–32, after MontoyA et al. 2014, p. 526). krzykowSki (2015, p. 24–32) underlines the fact that despite the undisputable success of renewable energy generation in Spain noted over the past twenty years, the economic effects of the FIT scheme ultimately proved to be destructive. Among a number of factors involved, the researcher identified two key ones; they are the tariff deficit and the amount of subsidies to RER which do not correspond to the market conditions. The economic problems connected with the use of renewable energy resources are also highlighted by Pindór and PrEiSnEr (2009, p. 145–153).
Regarding climate and energy, the Europe 2020 Strategy envisages the reduc-tion of carbon dioxide emissions by as much as 30%. This target is to be achieved through a greater use of energy from renewable sources. One of the indicators analysed in this study was the share of energy from renewable sources in the final gross energy consumption. According to norwiSz et al. (2006, p. 10–20), each of the newly passed legal documents, acts and resolutions, constructs its own definition of RER, paying little attention to its compliance with the Polish legislation or with the European Union law. The definitions used in this article are consistent with the ones applied by the Polish Central Statistical Office GUS (stat. gov. pl)4.
Energy from renewable sources means energy originating from natural, reproducible processes in nature. The final gross energy consumption means the energy carriers supplied for energy purposes to industries, the transport sector, households, and services; including public services, agriculture, forestry and fisheries. This also includes the consumption of electric power and heat by the power generating industry to produce electricity and heat, together with electric power and heat energy losses during energy transfer and distribution. This indicator informs us about the contribution of RER energy to the final en-ergy consumption countrywide, and allows us to monitor the effects of actions undertaken to promote production and consumption of renewable energy in all sectors. The use of this indicator is justified by the challenges that Poland is facing with regards to the reduction of energy consumption by the country’s economy in the medium- and long-term time period.
In the years analysed, the indicator of the RER energy share in the final gross energy consumption in Poland increased but was less than the EU aver-age. At this point, it is worth making a reference to the structure of consumed energy derived from renewable resources in particular sectors of the economy.
4 All indicators presented in this study originate from the database of GUS, Eurostat.

Evaluation of the Attainment of Environmental Goals in Sustainable Growth… 405
The report presented by SchnEll (2016, p. 5–10) contained an analysis of the chances of reaching the goal set in the Directive5. It is assumed that the 15% share of RER expected from Poland should be contributed as 54% RER energy generated in the heating and cooling sector, 25% by the electricity industry and 21% by transport. In the heating and cooling sector, the energy from renewable resources is mostly generated by co-combustion of solid fuels (biomass). In the electricity sector, the record-high years 2012 (co-combustion) and 2015 (wind power plants) were followed by a period of stagnation induced by the new system of subsidies and an investment funding gap. However, the worst situation is noted in transport. Since 2011, the share of ‘green fuel’ used in transport has been declining steadily, mainly because Poland has failed to undertake any action to develop the sector of second generation biofuels (from waste products). Consequently, despite the growth of energy production from RER, the value of this indicator as an average for the whole of the EU has increased at a faster rate. Between 2004 and 2010, the comparative assessment for Poland decreased by 8.9 percentage points, and in the consecutive years the decline was even more rapid, and accounted for another 13 percentage points until 2015. Among all the EU states, the highest value of this indicator in all the years analysed appeared in Sweden, while the lowest value was persistently noted in Malta.
The second indicator examined is the share of energy from renewable sources in transport. By analogy to the previous indicator, worth noting is the low CO2 emission caused by the use of biofuels, which is of particular importance as the number of vehicles on roads is continually increasing. The indicator is calculated as the share of energy from renewable sources in all types of transport in the final consumption of energy in transport.
This indicator also scored the highest values in Sweden, while being the lowest in Cyprus, Ireland and Malta (in 2004), only in Cyprus in 2010 and in Estonia in 2015. In Poland, a large increase in the indicator’s value was noted between 2004 and 2010, although it then fell slightly in 2015. This was reflected in the evaluation results. In 2004, the indicator’s value was 30% less than the EU’s average, in 2010 it was 8% higher in Poland than in the EU on average, and in 2015 it was just 7.4% below the EU’s average again. Such fluctuations indicate that Poland is finding it difficult to keep pace with the other EU countries.
The third indictor submitted to our analysis is a destimulant, namely the emission of greenhouse gases expressed in CO2 equivalent terms, i.e. expressed in the universal greenhouse gas emission unit, which reflects the diverse values of the global warming coefficient. For Poland, the base year for reporting the fulfillment of the obligations arising from the United Nations Framework Con-vention on Climate Change (UNFCCC) and the Kyoto Protocol is the year 1988.
5 Directive of 2009/28/EC of the European Parliament and of the Council of 23 April 2009 on the promotion of the use of energy from renewable sources and amending and subsequently repealing Directives 2001/77/EC and 2003/30/EC (the Directive) defined the shared framework for the promotion of energy from renewable resources.

406 Mirosława Witkowska-Dąbrowska
For industrial gases (HFCs, PFCs, SF6), the base year for Poland is 1995. The adopted equivalent of carbon dioxide is one megagram (1 Mg) of carbon dioxide or an amount of any other greenhouse gas which is the equivalent of 1 Mg of carbon dioxide calculated with the help of global warming coefficients. A global warming coefficient is the indicator which compares the impact of a greenhouse gas on climate warming to the impact produced by carbon dioxide; it is calculated on the basis of effects of an impact of one kilogram of a given gas on climate warming over 100 years compared to the impact pro-duced by 1 kg of CO2.
The lowest values of this indicator were found in Latvia, followed by Lith-uania, while the highest ones were achieved in Spain, except in 2015, when Portugal scored higher. The value of this indicator in Poland varied between the three analysed years. In 2004, it declined by over 2 percentage points, which is desirable. Noteworthy, the values of this indicator in Poland were above the EU average in all the years analysed. However, this apparent ‘success’ in reducing the emission relative to the base year (1988) was mainly due to a change of the political system and the subsequent economic transformation (locking down heavy industry plants). The initially high reduction was followed by increas-ingly smaller values, i.e. first a reduction by over 21 percentage points, and subsequently by over 15 percentage points. The recent economic crisis has not contributed largely to a higher reduction in emission. Should the same tendency continue, the value of this indicator assessed for Poland in 2020 would be less than the EU average, and Poland would no longer be the ‘leader’ in reducing emission. The same tendency is confirmed by PAjEwSki (2016, p. 2014–2018), who analysed the emission of greenhouse gases in agriculture. The direct emission of greenhouse gases associated with agricultural production constitutes about 1/7 of the global emission of gases to the atmosphere. The EU countries have decreased such emission owing to some updated technologies, e.g. integrated agriculture, decreased consumption of artificial fertilisers, or a smaller number of livestock. In Poland, however, there are numerous barriers to the implementation of significant changes. These include fragmentation of farmland, deeply rooted habits among farmers, and – regarding reclamation of soils – uneasy logistics due to the flooding of organic soils. Moreover, brzezińskiand BukowSki (2011, p. 17–47) claim that simple reduction reserves have been exhausted in Poland and, as the country’s economic growth continues, we should expect an increase in the volume of consumed energy as well as emitted greenhouse gases.
The fourth analysed indicator, likewise a destimulant, refers to the emis-sion of greenhouse gases per unit of consumed energy. This indicator shows the connection between the domestic consumption of energy and the emission of greenhouse gases (i.e. the impact of the power sector on the environment). The consumption of fossil fuels is the main source of emission of carbon dioxide (CO2). Due to the demand for energy, this is the driving force of greenhouse gas emission.

Evaluation of the Attainment of Environmental Goals in Sustainable Growth… 407
The lowest emission was detected in the Czech Republic and Finland, while the highest occurred in Luxemburg, Lithuania, Latvia and Bulgaria. Unfor-tunately, the emission of greenhouse gases in Poland was quite high (although it fell by 6.9 percentage points between 2004 and 2015), and the evaluation relative to the EU average per unit of consumed energy was low. In 2004, it was about 18.56% below the EU average, and in 2010 it fell to 21% below the average. However, some improvement was noted in 2015, and the assessed value was 10% below the EU average.
The fifth analysed indicator was the energy consumption by economy, ex-pressed in Kgoe/1000 euro. It is the ratio of the domestic gross energy con-sumption to the gross domestic product value (in constant prices of 2010, con-verted to the euro according to the currency exchange rate in 2010). Over the years studied, this indicator decreased in value in Poland, which is a favourable trend considering that this is a destimulant. The value of this indicator in all the years was the highest in Bulgaria and the lowest in Denmark. In Poland, it reached a value below the EU average in all the three years analysed, ranging from 33% to 44% below it. This can be attributed to large, positive changes that have occurred in Poland compared to the other EU countries. The Europe 2020 Strategy assumes that the total primary energy consumption in Poland should decrease to about 96 Mtoe. Based on the achieved values of this indicator, it is only possible to indicate a decreasing tendency, both in Poland and with respect to the EU’s average.
Summary
The research reported above reveals certain changes in the levels of particular indicators between 2004 and 2015. In Poland, they were nearly always positive changes. Some important conclusions from the present study are:
A decrease in the emission to air expressed by the CO2 equivalent was noted. Likewise, the emission of greenhouse gases expressed per unit of used energy decreased.
The European Union member states are to decrease their emission of CO2 by as much as 30% compared to the level noted in 1990, to increase the contribu-tion of energy from renewable sources into the total energy basket of the EU by 20%, and to improve the energy efficiency by 20%. As regards GHG emissions, including the emission of CO2, and energy consumption by economy, some im-provement can be seen in the entire EU and in Poland. In the EU, a decrease by 16% since 2011 was noted (data not published by the GUS), and the said indicator tended to decrease in value. Should this tendency continue, there is a chance that the set goal will be approached gradually, but this would probably require additional measures to obtain the expected reduction.

408 Mirosława Witkowska-Dąbrowska
Poland’s targets are to increase the share of RER power in energy balance, and to decrease GHG emissions. In 2004, the share of energy from renewable re-sources in final energy was 6.9%, increasing to 11.8% in 2015, and the respective percentages in energy used for transport were 0.7% in 2004 and 6.4% in 2015.
Translated by Jolanta IdźkowskaProofreading by Michael Thoene
Accepted for print 5.11.2018
References
BAlAS A., MolEndA A. 2016. A concept for the selection of sustainable growth indicators in Po-land, and a tool for making them accessible and for their demonstration. Optimum. Studia Ekonomiczne, 2(80).
BlEwitt j. 2014. Understanding Sustainable Development. Routledge, New York. BoryS t. 2005. Introduction to research on sustainable growth indicators. In: Indicators of Susta-
inable Growth. Ed. T. Borys. Wyd. Ekonomia i Środowisko, Białystok.BoryS t. 2014. Selected problems in the methodology of measuring the new growth paradigm –
experiences from Poland. Optimum. Studia i Rozprawy, 3: 1–19.brzezińskik.,bukoWskiM.2011. Low emission dilemmas. How to reduce emission of green-
house gases and what does it mean for the Polish economy? Polski Klub Ekologiczny, Okręg Mazowiecki, Warszawa.
Europe 2020. A strategy for smart, sustainable and inclusive growth. 2010. European Commission, Brussels, 3.3., Com (2010) 2020.
kArAczun z.M., SoBolEwSki M. 2010. Negotiating the climate issues – a COP15 conference and the Copenhagen Agreement. Analizy BAS, 12(37): 1–9.
knoPf B., EdEnhofEr o. 2014. Save the EU Emissions Trading Scheme: set a price band. Energy Post, p. 1–5, http://energypost.eu/eu-emissionstrading-scheme-can-saved-price-band/ (access: 29.08.2017).
krzykowSki M. 2015. The support system for renewable energy sources in Spain. Kwartalnik Antymonopolowy i Regulacyjny, 3(4).
loreke.2016.Development of low-emission economy in Poland – the theory and practice. Studia Ekonomiczne. Zeszyty Naukowe Uniwersytetu Ekonomicznego w Katowicach, 270.
MEndES c., SoArES i. 2014. Renewable energies impacting the optimal generation mix: The case of the Iberian Electricity Market. Energy, 69.
MontoyA f.g., AguilErA M.j., MAnzAno-AgugliAro f. 2014. Renewable energy production in Spain: A review. Renewable and Sustainable Energy Reviews, 33.
MulligAn M. 2014. An Introduction to Sustainability: Environmental, Social and Personal Per-spectives. Routledge, New York.
NorWiszJ.,Musielakt.,boryczkob.2006.Renewable energy resources – the Polish definitions and standards. Rynek Energii, 1.
olkuskit.,PiWoWarczyk-Ścieburak.,brożeka.2017.Effect of the Paris Agreement and the EU ETS scheme on the coal market. Zeszyty Naukowe Instytutu Gospodarki Surowcami Mineralnymi i Energią PAN, 98.
PaJeWskit.2016.Changes in levels of greenhouse gas emission in agricultural production. Rocz-niki Naukowe SERiA, XVIII(1).
Pindór t., PrEiSnEr l. 2009. Technical, environmental and economic aspects of using energy from reneable sources. In: Economic problems related to the use of renewable natural resources for energy production. Ed. A. Graczyk. Prace Naukowe Uniwersytetu Ekonomicznego we Wro-cławiu, 83: 145–153.
Evaluation of the Attainment of Environmental Goals in Sustainable Growth… 409
PiWoWarczyk-Ścieburak.,olkuskit.2016.Implementation of the climate and energy policy in the company TAURON POLSKA ENERGIA S.A. Polityka Energetyczna – Energy Policy Journal, 19(2): 93–108.
Policy paper on retrospective changes to RES legislations and national moratoria. 2013. EREF. http://www.keepontrack.eu/contents/publicationsbiannualnationalpolicyupdatesversions/kot-pol-icy-paper-on-retrospective-changes-to ressupport.pdf (access: 28.08.2017).
PrAndEcki k. 2014. Changes in China’s energy policy under the influence of environmental factors. Vistula University Working Papers, 34: 52–66.
Reaching the RER 2020 target. Analysis of the current state and a forecast. 2016.Ed. ch. Schnell. Warszawa.
rochA M., roMing n., PArrA P. y., AncygiEr A., SfErrA f., urAl u., SchAEffEr M., hArE B. 2017. Stress test for coal in Europe under the Paris agreement scientific goalposts for a coordi-nated phase-out and divestment. http://climateanalytics.org/files/eu_coal_stress_test_report (access: 29.08.2017).
rogAlA P. 2005. The indicator module in the local auditing of sustainable development. In: Indi-cators of Sustainable Growth Ed. T. Borys. Wyd. Ekonomia i Środowisko, Białystok.
rogAll h. 2010. Sustainable Development Economy. Wyd. Zysk i S-ka, Poznań.StEurEr r., BErgEr g. 2010. The Lisbon Strategy and sustainable development strategies across
Europe: How different governance arrangements shape the European coherence of policy docu-ments. Universität für Bodenkultur Wien Department für Wirtschafts-und Sozialwissenschafte. http://ssrn.com/abstract=2342118 (access: 27.08.2017).
wElzEr h., wiEgAndt k. 2011. Perspektiven einer nachhaltiger Entwicklung. Fischer, Frankfurt am Main.
wEn l., cAo y., wEng j. 2015. Factor decomposition analysis of China’s energy-related CO2 emissions using extended STIRPAT model. Polish Journal of Environmental Studies, 24(5).
WitkoWska-DąbroWska M. 2016. Indicators of Sustainable Development of the Province of Warmia and Mazury in the Environmental Aspect. Olsztyn Economic Journal, 11(3).
żMuDaM.2011. The Europe 2020 Strategy as a plan for socio-economic developmet of the European Union. Ekonomia, 4(16).

OLSZTYN ECONOMIC JOURNAL2018, 13(4), 411–424
SMALL CITIES IN THE DEVELOPMENT POLICY OF WARMINSKO-MAZURSKIE VOIVODESHIP
Emil Walendzik1, Magdalena Wojarska2, Quintus Jett31Department of Economic and Regional Policy
Faculty of EconomicsUniversity of Warmia and Mazury in Olsztyn
[email protected] Department of Economic and Regional Policy
Faculty of EconomicsUniversity of Warmia and Mazury in Olsztyn
3Rutgers Business School’s Center for Urban Entrepreneurship and Economic Development (CUEED)
K e y w o r d s: regional policy, territorial dimension, cities, urban policy.
A b s t r a c t
The article focuses on indicating the interpenetration of the development policy of the Warm-insko-Mazurskie voivodeship and the development policy of small cities situated in the region. It aims to identify the development opportunities of small cities, within the context of voivodship development policy, and to assess the use of opportunities from this regional level of governance and administration. The study was based on the results of a survey conducted among representatives of urban gminas and urban-rural gminas as well as analysis of strategic and operational documents developed at the regional level. Development problems of small cities in the Warminsko-Mazurskie Voivodeship, identified from the local and regional levels, are very similar. However the differences are visible in terms of the effects of the expected intervention. In the regional documents – both strategic and operational ones, there is no special recognition of issues related to the development of small cities, but they can be found indirectly in some preferences that small towns have in applying for funds from the Regional Operational Program. Unfortunately, not all cities benefit from the opportunities offered by this Program.

412 Emil Walendzik, Magdalena Wojarska, Quintus Jett
MAŁE MIASTA W POLITYCE ROZWOJU WOJEWÓDZTWA WARMIŃSKO-MAZURSKIEGO
Emil Walendzik1, Magdalena Wojarska2, Quintus Jett3
1Katedra Polityki Gospodarczej i RegionalnejWydział Nauk Ekonomicznych
Uniwersytet Warmińsko-Mazurski w Olsztynie2Katedra Polityki Gospodarczej i Regionalnej
Wydział Nauk EkonomicznyUniwersytet Warmińsko-Mazurski w Olsztynie
3Rutgers Business School’s Center for Urban Entrepreneurship and Economic Development (CUEED)
S ł o w a k l u c z o w e: polityka regionalna, wymiar terytorialny, miasta, polityka miejska.
A b s t r a k t
W artykule skoncentrowano się na wskazaniu wzajemnego przenikania się polityki rozwoju województwa warmińsko-mazurskiego i polityki rozwoju małych miast usytuowanych na jego obszarze. Skonfrontowano obraz małych miast, tj. ich problemów i możliwości rozwojowych, wi-dziany zarówno z ich poziomu, jak i samorządu województwa. W artykule dokonano próby iden-tyfikacji możliwości rozwojowych małych miast jakie daje im polityka rozwoju województwa oraz oceny wykorzystania tych możliwości. Opracowanie powstało na podstawie wyników badania ankietowego przeprowadzonego wśród przedstawicieli urzędów gmin miejskich i miejsko-wiej-skich oraz analizy dokumentów strategicznych i operacyjnych opracowanych na poziomie regional-nym. Problemy rozwojowe małych miast z województwa warmińsko-mazurskiego identyfikowane z poziomu lokalnego i regionalnego są podobne. Różnice natomiast są widoczne w zakresie efektów oczekiwanej interwencji. W dokumentach strategicznych i operacyjnych na poziomie regionalnym brakuje szczególnego ujęcia kwestii związanych z rozwojem małych miast, pośrednio można jed-nak je znaleźć w pewnych preferencjach, które małe miasta mają w zakresie aplikowania o środki regionalnego programu operacyjnego. Niestety nie wszystkie miasta korzystają z możliwości jakie daje im ten program.
Introduction
Evolution in thinking about development policy, observed in recent years both in Europe and in Poland, has resulted in a reformulation of directions and approaches to programming of public intervention. The essence of these changes is the growing importance of the territorial dimensions of development policy. Territory goes beyond the administratively designated boundaries, and the identification of common potentials and challenges as well as the exchange of experiences between entities participating in the process of planning projects in a given area becomes a key factor (Strategie ponadregionalne 2015, p. 3). In this context, an integrated approach to development (integration of the socio-economic dimension with the territorial dimensions) is very important and is a sine qua non condition for the development of Europe and Poland. It may enable harmonious development in a manner consistent with the assumed

Small Cities in the Development Policy of Warminsko-Mazurskie Voivodeship 413
long-term goals, and thus avoid the civilization drift. An integrated approach to development is to increase the effectiveness of public actions in toto. This means, above all, the departure from the limitations brought by the sectoral or domain approaches to development towards a horizontal approach, combining multiple policy dimensions (including the territorial dimension) for more effective public interventions. Directions of intervention are determined by territorial specificities and functional arrangements of the EU-country, country-region, city-village, and also in the context of global challenges of the EU – other megap spaces1 (Rozwój regionalny, polityka… 2011, p. 113).
In the context of the growing importance of the territorial dimension in development policy, the urban dimension is also gaining in importance. Increasing percentages of the global human population live in urban areas. This density of human population in a major city can result in the negative effects of crowding, such as traffic congestion, pollution, and poverty. At the same time, the results can beneficial, including increased business and cultural activity that serve neighboring cities in the region (lEVEr 1997, p. 230). Therefore, the development of cities has significant regional importance, which may explain why regional authorities intermediating between national and municipal forms of government, such as voivodships, produce development policies that offer guidance and support to cities in their territories.
For example, in the United States, states and county administration divi-sions operating below the federal government may produce a Comprehensive Economic Development Strategy (CEDS), which provides a regional development policy while also providing default guidance and standards for cities that seek to produce their own local development strategies. Meanwhile, in European Union (EU) cohesion policy, development of the cities has emerged as a key element. In the 1990s, it was noticed that both the main problems and potential develop-ment opportunities of the European Union are located in cities (Rozwój regio-nalny w Polsce 2010, p. 261). In Poland, urban policy is also gaining importance in the system of managing national and regional development. In the Strategy for Responsible Development, a critical document for Poland development as a nation, the subject of urban policy is now included.
Due to the growing importance of the territorial dimension in development policy (including urban policy) the article focuses on identifying the interpen-etration of the policy for the development of small cities with the voivodeship development policy. In the literature, you can successfully find articles on the interrelation of urban policy with national or European policy. But there are not too many that confront the situation of small cities, with their prob-lems and development opportunities, as seen from the level of these cities and the voivodship level. This article addresses this gap with a study of development policies among the small cities of the Warminsko-Mazurskie Voivodeship.
1 A concept taken from original thought of kukliński (2006).

414 Emil Walendzik, Magdalena Wojarska, Quintus Jett
Methodical assumptions of research
There are many definitions of ‘small cities’ in the literature. For the pur-pose of the article, one of the most popular ways of dividing cities was adopted. It based on the number of inhabitants. A popular three-stage approach has been applied (for example sekuła 2012, p. 163–175, BArtoSiEwicz 2016, p. 234–244, giBAS 2017, p. 114–126), according to which small cities live up to 20,000 people, in average cities the number ranges from 20,000 to 100,000, while in large ones it exceeds 100,000.
The main source of information was the primary data collected during the survey (postal-internet survey) conducted among representatives of cities and gminas offices in Warminsko-Mazurskie Voivodship. The research was car-ried out in January 2018 in a group of 38 gminas (including: 5 urban and 33 urban-rural) meeting the adopted size criteria. Completed questionnaires sent back 17 respondents, which gave a return rate of 44.74%. The results of the survey made it possible to identify problems and development opportunities that are noticed by the small towns of the Warminsko-Mazurskie Voivodeship.
The analysis of primary data was supplemented with a desk research analysis of strategic and operational documents of the Warminsko-Mazurskie Voivodship, as well as secondary data from the Marshal’s Office of the Warminsko-Ma-zurskie Voivodship in Olsztyn on the current state of implementation of the Regional Operational Program of the Warminsko-Mazurskie Voivodship for 2014–2020. The results of the desk research analysis provided information on the problems and development opportunities of small towns identified by the voivodship self-government.
Small cities in the Strategy of socio-economic development of the Warminsko-Mazurskie Voivodeship
As part of work on the Strategy of socio-economic development of the War-minsko-Mazurskie Voivodship until 2025, a problem diagnosis under the name Competitiveness of Warmia and Mazury was developed. This diagnosis was the stage of building a strategy consisting in obtaining information about the region, analyzing this information and drawing conclusions helpful in formu-lating goals. Diagnosing the regions and cities is one of the most difficult stages of planning their socio-economic development. It requires extensive and compre-hensive economic, social, environmental and technical knowledge. At the same time, it should be remembered that every diagnosis is a political ‘commodity’. Accurate and useful diagnosis of development areas goes beyond the sphere of exclusive science competence (dutkowSki 2004, p. 11).

Small Cities in the Development Policy of Warminsko-Mazurskie Voivodeship 415
According to the adopted assumptions, the spatial scope of the diagnosis must give the basis for the purpose of territorialisation, which is why analytical activities were carried out at the level of gminas (not subregions or poviats) for which the development potential was estimated. With the help of the developed synthetic index2, the gminas of the Warminsko-Mazurskie Voivodship were grouped into three sets – gminas with high, average and low development poten-tial (DziEMiAnowicz, SzlAchtA 2012, p. 52). In the group with high development potential, there were 14 small cities in the Warminsko-Mazurskie Voivodship, moderate – 19 cities and 5 in the group with low potential.
As part of the work on the diagnosis, 9 areas of strategic intervention (ASIs)3, were identified, according to the regional policy philosophy presented in the National Strategy of Regional Development 2010–2020: regions, cities, rural areas (NSRD) (DziEMiAnowicz, SzlAchtA 2012, p. 9). They have been includ-ed in the Strategy of socio-economic development of the Warminsko-Mazurskie Voivodship by 2025 and they are ASIs: Warminsko-Mazurski Tiger4, Olsztyn and its functional area as the main pole of growth, Subregional centers, Modern Village, Areas of social periphery economic, Areas with poor access to public services, Border areas, Areas requiring restructuring and revitalization, Areas with extremely low communication accessibility. These areas overlap, hence one city may belong to several ASIs.
In ASI – Warminsko-Mazurski Tiger, there were 17 small cities from the Warminsko-Mazurskie Voivodship (45%). The criterion of choosing gminas for this ASI was the location of the gmina center within a maximum of 15 km from national road No. 7 and 16. According to the provisions of the Strategy, the expected effects of intervention for this area are primarily the dynamization of economic processes, development of network cooperation – including in the field of innovation, increase of investment attractiveness, increase of quality of life, increase of domestic and international cooperation (Strategia rozwoju… 2013, p. 50).
2 To construct the synthetic index, a number of indicators were used, which were divided into three thematic areas: the level of affluence, the level of modernity and the level of competitive-ness. The development potential of the communes of the Warminsko-Mazurskie Voivodeship was calculated as the sum of three areas. The analyzes used the method of distance from the standard, which was used both to calculate the position of the commune in each dimension, and to calculate the synthetic index.
3 According to the NSRD, these are areas in which (a) government intervention is required, due to the burden that the region alone can not cope with, and (b) areas which, for social, economic or environmental reasons, exert or are likely to exercise in the future. significant impact on the country’s development.
4 In the course of work on the Strategy, members of the teams involved (the Team for the update of the Social and Economic Development Strategy of the Warminsko-Mazurskie Voivodship by 2020 and the Task Team for Strategic Planning at the Marshal’s Office of the Warminsko-Ma-zurskie Voivodship in Olsztyn) established a name for this area strategic intervention. The name comes from the shape of the axis, which resembles a tiger.

416 Emil Walendzik, Magdalena Wojarska, Quintus Jett
To ASI – Modern Village has been included 35 small cities from the Warmin-sko-Mazurskie Voivodship (92%). The criterion for selecting units for this ASI, was valorisation of the voivodship’s area due to the directions of agricultural development made by the Warminsko-Mazurskie Office of Spatial Planning in Olsztyn. This valorisation takes into account both the possibilities of multifunc-tional development of agriculture (including the ecological one) and the direction of intensive development of agriculture coinciding with the best parameters of the agricultural production space. The expected effects of intervention in this area include an increase in the specialization in the production of high quality food based on regional natural resources, supporting the income of the region’s inhabitants, increase of business cooperation, as well as promotional and trade activities, growth of entrepreneurship (Strategia rozwoju… 2013, p. 53).
In ASI – Areas with poor access to public services, there were 21 small cities from the Warminsko-Mazurskie Voivodship (55%). To delimit this ASI, a statis-tical criterion was used, based on 11 indicators characterizing public services. The expected effects of interventions in this area are the increase in access to public services, social activation, improvement of transport connections with local growth centers, increase in entrepreneurship (Strategia rozwoju… 2013, p. 55).
To ASI – Areas requiring restructuring and revitalization were qualified 20 small cities from the Warminsko-Mazurskie Voivodship (53%). The delim-itation of this area was carried out on the basis of the administrative and sta-tistical criterion (municipalities and cities in urban and rural communes with more than 5,000 inhabitants). The expected effects of intervention in this area include the increase of social capital, improvement of education quality, increase of entrepreneurship, urban revitalization, increase of quality of life, increase of inter-municipal cooperation, improvement of communication connections with the environment (labor markets), specialization of cities and towns and increasing investment attractiveness of the area (Strategia rozwoju… 2013, p. 57).
In ASI – Border areas were included 17 small cities from the Warminsko--Mazurskie Voivodship (45%). The delimitation of this area was based on the solution proposed in the NSRD (National… 2010, p. 103), based on the network of poviats and taking into account the distance of the capital of this unit from the state border (up to 50 km). The expected effects of interventions in this area are the intensification of international cooperation, the use of opportunities re-sulting from local border traffic, the growth of entrepreneurship, improvement of communication links in the border zone, creation and promotion of tourism products (Strategia rozwoju… 2013, p. 56).
The small cities of the Warminsko-Mazurskie Voivodship, due to the multi-tude and diversity of development problems, belong to different ASI. The largest number (six) is entered Pasłęk, while the smallest one (one) – Mikołajki, Pasym and Ruciane Nida.
Voivodship development strategy indicate that the consequence of the deter-mination of ASI is, among others, territorial approach to operational programs

Small Cities in the Development Policy of Warminsko-Mazurskie Voivodeship 417
co-financed by European Union funds, implemented by the Regional Government. As a rule, the fact of including certain units in ASI favors them in the scope of implementing activities assigned to a given ASI (eg in the Regional Opera-tional Program) (Strategia rozwoju… 2013, p. 49).
Problems and development opportunities of small cities in the Warminsko-Mazurskie Voivodship
The research shows that the vast majority of small towns in the Warminsko--Mazurskie Voivodship (94%) have a development strategy or another document in which development directions are described. Therefore, it can be concluded that the authorities of these cities have diagnosed development problems and planned actions to enable their elimination. This is confirmed by the adopted strategy development model. Surveys indicate that the vast majority of strategic documents were prepared by city office employees (88% of responses), together with representatives of residents (70% of responses), with the support of external experts, representatives of entrepreneurs and non-governmental organizations (over 64% of responses). This means that strategies for the development of small cities have been prepared with the participation of people who know their speci-ficity and development problems best. In the few small towns of the voivodship, the preparation of the strategic document was outsourced to specialists from outside the city office (17% of responses). By creating development strategies for all small cities in the Warminsko-Mazurskie Voivodship, the provisions of the development strategy were taken into account.
According to respondents of the survey, the strategy of development takes into account the issues concerning small cities mostly in the area of protection of environment and nature and water management (70% of responses), waterworks and water supply, removal and treatment of urban waste water, maintenance of cleanliness and order and sanitation (52%), tourism (47%), social assistance (41%), infrastructure (roads, squares) (41%). Promotion of gminas, attracting of investors, building of partnerships, and stimulation of cooperation were found in further places. Despite the fact that the respondents indicated the above mentioned areas as those in which the regional development strategy takes small cities into account in the best way, similar areas were indicated as those in which the Voivodeship development policy should address small cities in a special way. Respondents pointed communal roads, streets, squares, bridges and road traffic organization (58% of responses), waterworks and water supply (52%), promotion of the gminas (47%), attracting of investors (47%), spatial order and real estate management (45%), protection of environment and nature (45%), water management (45%) and culture (41%).

418 Emil Walendzik, Magdalena Wojarska, Quintus Jett
The vast majority of small cities in the Warminsko-Mazurskie Voivodeship (64%) struggle with many developmental problems, while 6% of cities do not identify such problems at all.
Representatives of small cities inform the institutions responsible for the development policy of the Warminsko-Mazurskie Voivodeship about existing problems, but they do so in various ways.
Most of them use their informal contacts with regional administration (60% of responses) and they take part in public consultations of various strategic documents (11%)
Moreover, city representatives are members of formal bodies set up by the voivodeship self-government (eg. the Panel on the updating of the Development Strategy, etc.). During the discussion on these kind of groups they also have the opportunity to report problematic issues or development problems (11%).
The authorities of small cities undertake a number of actions aimed at elim-inating the identified barriers. The vast majority of them (70% of responses) implement projects financed from the external funds and this is the main way to tackle development problems.
Furthermore, cities take part in bottom-up initiatives, associations, formal groups etc. (eg Association of Polish Cittaslow Cities) (64% of responses), imple-ment investments financed with own resources (58%) and establish cooperation with partner cities and use their experiences (41%).
In the respondents’ opinion, a significant part of projects (over 71% of re-sponses) was implemented with quite positive effects. Some issues have been solved, but in many cases the problems are large and there is a need of time and substantial financial resources for further improvement.
According to the survey, the most important investment needs indicated by the respondents are related to the expansion/modernization of the basic in-frastructure (roads, sewers, waterworks), enhancing of entrepreneurship and economic development of the city (eg creating economic zones, counteracting problems on the labor market and activating the local community (eg actions for young people, anti-exclusion, etc.).
The use of ROP WM funds by small cities in Warminsko-Mazurskie Voivodship
According to the collected empirical evidence, small cities tackling devel-opment problems, first of all implement projects financed from EU funds. For more than half of the small cities of the Warminsko-Mazurskie Voivodship, the main financial source for European projects is Regional Operational Program. The Program’s provisions include preferences for Areas of Strategic Intervention (ASIs).

Small Cities in the Development Policy of Warminsko-Mazurskie Voivodeship 419
The program includes thematic objectives and corresponding investment pri-orities selected by the voivodeship and agreed with the European Commission. It covers 10 thematic objectives and 32 investment priorities. In 10 investment priorities (about one third of all priorities), preferences for areas of strategic intervention have been identified. One priority can be implemented only on the ASIs listed in the Program. These priorities include:
– increase of commercialization of R&D results;– increase of the availability and quality of pre-school education;– increase of the use of advanced information and communication technologies;– preservation, protection, promotion and development of natural and cultural
heritage;– increase of regional mobility;– increase of railway accessibility;– support for physical, economic and social revitalization of poor communities
in urban and rural areas;– improving of the quality and effectiveness of health and social services;– development of education and training infrastructure;– access to labour market.It is worth emphasizing that preferences in ROP WM do not concern only
one ASI identified in the voivodship’s development strategy, ie rural areas. This is due to specificity of the Program, which is not addressed in a particular way to rural areas. Preferences for other ASIs have been specified in the Program with varying frequency. Mostly they apply to ASI – Areas with low access to public services (preferences in 7 out of 10 investment priorities in which ASI is indicated) and ASI – Areas of social and economic peripherisation (6 out of 10). It means that the in the ROP WM in particular included ASI delimitated ac-cording to criteria of negative socio-economic phenomena.
The preferences for particular ASIs included in the Regional Operational Program give eligible entities the opportunity to intensify the use of EU funds to eliminate identified development barriers. However, the activity and effectiveness of entities (including small cities) in applying for these funds is a different issue.
The analysis was based mainly on the activity of gminas of the Warmin-sko-Mazurskie Voivodeship in calls, the effectiveness of their applications and the value of contracts signed by small cities under the ROP WM. Among small cities in the voivodeship, only one city, ie Tolkmicko, did not submit any appli-cation under the regional program. As to the other small cities, their activity in applying for funds is various. They have submitted applications from 1 to even 20 (Lidzbark Warmiński) for co-financing. The average was about 8 projects per one small city in the region. This result is close to the average of all local authorities. Figure 1 shows the activity of local government units in applying for funds under the ROP WM.

420 Emil Walendzik, Magdalena Wojarska, Quintus Jett
Fig.
1. T
he a
ctiv
ity o
f loc
al a
utho
ritie
s in
app
lyin
g fo
r fu
nds
unde
r th
e R
egio
nal O
pera
tiona
l Pro
gram
of t
he W
arm
insk
o-M
azur
skie
Voi
vode
ship
fo
r 201
4–20
20 (t
he p
erce
ntag
e of
qua
ntity
and
val
ue o
f sub
mitt
ed a
pplic
atio
ns fo
r co-
finan
cing
) as
at 1
9.02
.201
8.So
urce
: aut
hors
’ ow
n an
alys
is b
ased
on
figur
es p
ublis
hed
by W
arm
insk
o-M
azur
skie
Mar
shal
l Off
ice.

Small Cities in the Development Policy of Warminsko-Mazurskie Voivodeship 421
Fig.
2. T
he p
erce
ntag
e of
qua
ntity
and
val
ue o
f con
trac
ts si
gned
und
er th
e R
OP
WM
201
4–20
20 b
y lo
cal g
over
nmen
t uni
ts in
War
min
sko-
Maz
ursk
ie
voiv
odsh
ip a
s at
19/
02/2
018.
Sour
ce: a
utho
rs’ o
wn
anal
ysis
bas
ed o
n fig
ures
pub
lishe
d by
War
min
sko-
Maz
ursk
ie M
arsh
all O
ffic
e.

422 Emil Walendzik, Magdalena Wojarska, Quintus Jett
Beside the activity in applying for funds under the ROP WM, efficiency is also important. The average effectiveness of small cities is around 39% and is close to the average efficiency of all local authorities in Warminsko-Mazurskie Voivodeship. Three small cities in the region (Jeziorany, Lubawa, and Pasym) have achieved the effectiveness above 70% and that was the highest result. So far, four small cities have not yet signed any contract for the implementa-tion of the project under the Program. As to the other small cities, the number of implemented projects ranges from 1 to 10, with an average of 4 projects per 1 city. This differ in the negative way from the average for all local author-ities. Figure 2 shows the territorial distribution of the quantity and value of contracts signed under the ROP WM.
When analyzing the value of contracts signed by small cities of the Warm-insko-Mazurskie Voivodeship, significant differences can be noticed. The total value of contracts signed under the ROP WM for one small city is between PLN 400 thousand to over PLN 39 million, with the average value for one project about PLN 1.7 million. Therefore significant discrepancies can be noticed both in the activity of small cities in getting funds under the ROP WM, but also in the amount of funds received.
Summary and conclusions
The small cities of the Warminsko-Mazurskie Voivodeship set their develop-ment goals in strategic documents. When creating strategic documents, they take into account the regional development strategy. This is an example of interaction between development plans at the local and regional level and at the same time a confrontation of the image of small cities (ie their problems and development opportunities) seen from the level of these cities and the voivodeship. The study confirmed that the picture is very similar.. On the stage of diagnosing develop-ment problems, both small cities and regional self-government identify similar development problems of small cities. Discrepancies can be seen in identifying development opportunities. Small cities implement mainly infrastructure in-vestments. However, the regional self-government in the development strategy indicates a wider range of effects of intervention in individual ASI. Although small cities identify a number of social problems, they focus on the projects aimed at reducing problems at the economic and spatial-environmental interface. This was confirmed during the meeting organized by Marshall Office on July 13, 2017. The aim of the meeting was discussion on the possibility of intensifying applying for funds from the Regional Operational Program. It must be noticed that large and expensive infrastructural projects (roads, water and sewage network) involve significant funds for own contribution. Thus, there is less the possibility of generating own contribution for the other projects (eg ‘soft projects’).

Small Cities in the Development Policy of Warminsko-Mazurskie Voivodeship 423
Small cities try to tackle identified development problems, mainly through the implementation of projects co-financed with EU funds. Every second small city indicates ROP WM as a source of funding for these projects. The preferenc-es for ASIs in this Program strengthen its territorial dimension. At the same time it gives preferences to stimulate local development of areas that are part of a ASI, including small cities. This is an example of identifying and indicating the development opportunities of small towns that have been considered strategic by the voivodship authorities. This can be also considered as an indirect impact of regional policy for urban development. Both in the regional development strategy and the operational program there are no explicit indications or the inclusion of urban development policy in a special way.
It should be noticed that unfortunately, not every small city in the Warm-insko-Mazurskie voivodship use the chances given in the ROP WM with the preferences for the ASIs in which they are located. While the activity of small cities in applying for funds from the program is similar to the average activity of all local authorities, the number and value of projects per one small city is lower than the average. One small city has not applied for funds under ROP WM so far, and three cities have not yet signed any financing agreements.
In conclusion, this article provides further evidence and examples of how the development policy of a voivodeship and the development policy of small cit-ies interpenetrate. This study of the Warminsko-Mazurskie voivodeship shows that regional development policy is often recognized as relevant by small cities in the territory, but small cities will vary about if and where they will make use of advantages which voivodeship development policy offers. At the same time, the expense and wide territorial scope of some development efforts (large infrastructure projects) are beyond the means of small cities to address, thus pointing to where regional development policy is most critical to the survival or progression of smaller cities within the voivodeship.
Translated by Emil WalendzikProofreading by Quintus Jett
Accepted for print 5.11.2018
References
BArtoSiEwicz B. 2016. Obszary funkcjonalne małych i średnich miast w Polsce – koncepcja ba-dawcza. Studia Ekonomiczne. Zeszyty Naukowe Uniwersytetu Ekonomicznego w Katowicach, 279: 234–324.
DutkowSki M. 2004. Problemy diagnozowania obszarów rozwoju regionalnego i lokalnego w Polsce. Wydawnictwo Naukowe Uniwersytetu Szczecińskiego, Szczecin.
DziEMiAnowicz W., SzlAchtA J. 2012. Konkurencyjność Warmii i Mazur – diagnoza problemowa. Zarząd Województwa Warmińsko-Mazurskiego, Olsztyn.

424 Emil Walendzik, Magdalena Wojarska, Quintus Jett
GiBAS P. 2017. Potencjał demograficzny małych miast województwa śląskiego w świetle wyników analizy przesunięć udziałów (shift share analysis). Studia Ekonomiczne. Zeszyty Naukowe Uni-wersytetu Ekonomicznego w Katowicach, 327: 114–126.
Krajowa strategia rozwoju regionalnego. 2010. Ministerstwo Infrastruktury i Rozwoju, Warszawa.kukliński A. 2006. Megaprzestrzenie XXI wieku. In: Przyszłość Europy. Wyzwania globalne.
Wybory strategiczne. Eds. A. Kukliński, K. Pawłowski. Oficyna Wydawnicza „Rewasz”, Wyższa Szkoła Biznesu, Nowy Sącz.
lEVEr w.f. 1997. Delinking urban economies: The European Experience. Journal of Urban Affairs, 19(2): 227–238.
Regionalny program operacyjny województwa warmińsko-mazurskiego na lata 2014-2020. 2015. Urząd Marszałkowski Województwa Warmińsko-Mazurskiego w Olsztynie, Olsztyn.
Rozwój regionalny w Polsce w świetle wyzwań XXI w. 2010. Eds. T. Kudłacz. Polska Akademia Nauk, Komitet Przestrzennego Zagospodarowania Kraju, Warszawa.
Rozwój regionalny, polityka regionalna, studia regionalne – nowe interpretacje. 2011. Eds. P. Artymowska, A. Kukliński, P. Żuber. Ministerstwo Rozwoju Regionalnego, Forum Rozwoju Regionalnego i Polityki Regionalnej RegioForum, Warszawa.
Sekuła A. 2012. Rozwój małych miast w świetle wydatków inwestycyjnych – na przykładzie gmin miejskich województwa pomorskiego. Ewolucja funkcji małych miast w Polsce. Zeszyty Naukowe Uniwersytetu Ekonomicznego w Katowicach, 92/(12): 163–175.
Strategia na rzecz odpowiedzialnego rozwoju do roku 2020 (z perspektywą do roku 2030). 2017. Uchwała Rady Ministrów, 14.02.2017 r., Warszawa.
Strategia rozwoju społeczno-gospodarczego województwa warmińsko-mazurskiego do roku 2025. 2013. Urząd Marszałkowski Województwa Warmińsko-Mazurskiego w Olsztynie, Olsztyn.
Strategie ponadregionalne – wymiar terytorialny. 2015. Ministerstwo Rozwoju, Warszawa.

OLSZTYN ECONOMIC JOURNAL2018, 13(4), 425–440
THE ATTRACTIVENESS OF POLAND FOR ECONOMIC MIGRANTS. ASSESSMENT BY EMPLOYERS:
RESULTS OF EMPIRICAL STUDIES
Sabina Kubiciel-Lodzińska1, Bogdan Ruszczak21Department of Regional Policy
Faculty of Economy and ManagementOpole University of Technology2Institute of Computer Science
Faculty of Electrical Engineering, Automatic Control and InformaticsOpole University of Technology
e-mail: [email protected]; [email protected]
K e y w o r d s: immigration, Poland, enterprises, foreigners, region.
A b s t r a c t
This paper discusses selected results of studies carried out among employers from the Opolskie Voivodeship: a region with an exceptional scale of labour emigration in Poland that is struggling with an increasingly palpable shortage of workers. The study included 263 employers and was carried out in late 2014 and in early 2015. It involved managers, i.e. owners, directors, managers or people responsible for personnel policy in enterprise. The CAWI and PAPI methods were used. The research used a structured interview schedule. The aim was to show how the enterprises evaluated Poland in respect to its attractiveness to foreign workers and specified the main issues that were decisive to the influx of foreigners taking up employment in Poland. More than 46% of representatives of the enterprises involved in the study claimed that Poland is attractive to for-eigners interested in taking up work. Respondents were convinced that the main factor attracting foreign workers to Poland was the relative proximity of their country of origin and the related easy access.
ATRAKCYJNOŚĆ POLSKI DLA IMIGRANTÓW ZAROBKOWYCH. OCENA PRACODAWCÓW – WYNIKI BADAŃ EMPIRYCZNYCH
Sabina Kubiciel-Lodzińska1, Bogdan Ruszczak2
1Katedra Polityki RegionalnejWydział Ekonomii i Zarządzania
Politechnika Opolska2Instytut Informatyki
Wydział Elektrotechniki, Automatyki i InformatykiPolitechnika Opolska
S ł o w a k l u c z o w e: imigracja, Polska, przedsiębiorstwa, obcokrajowcy, region.

426 Sabina Kubiciel-Lodzińska, Bogdan Ruszczak
A b s t r a k t
W pracy omówiono wybrane wyniki badań przeprowadzonych wśród pracodawców z województwa opolskiego – regionu charakteryzującego się wyjątkową skalą emigracji zarobkowej w Polsce, który zmaga się z coraz wyraźniejszym niedoborem pracowników. Badanie zrealizowano pod koniec 2014 r. i na początku 2015 r., wzięło w nim udział 263 pracodawców. Uczestniczyli w nim właściciele, dyrektorzy, menedżerowie lub osoby odpowiedzialne za politykę personalną w przedsiębiorstwie. Wykorzystano metodę CAWI i PAPI, narzędziem badawczym był kwestionariusz wywiadu. Celem badań było m.in. uzyskanie wiedzy w zakresie oceny atrakcyjności Polski dla zagranicznych pra-cowników oraz wskazanie przez pracodawców głównych motywów napływu cudzoziemców. Ponad 46% respondentów twierdziło, że Polska jest atrakcyjna dla imigrantów zarobkowych. Zdaniem badanych głównym czynnikiem przyciągającym zagranicznych pracowników do Polski jest względna bliskość od ich kraju pochodzenia.
Introduction
Economic migration is growing in importance for developed countries because foreign workers (holding both high and low qualifications) play the two following roles: they comprise additional labour available in the case of a shortage of work-ers resulting from shifts in the economy or society; and they perform particular types of jobs that native workers do not want or are unable to do (cAStlES, MillEr 2011, p. 297). This is also true for Poland (orgaNiŚciak-krzykoWska et al. 2013). It is transforming from an emigration state into an emigration & immigration destination (iglickA 2001). According to estimates from Iglicka, in order to ensure a sufficient number of employees in Poland, more than 5 million people should settle in the country by 2060 (iglickA 2013, p. 1). On the other hand, the latest forecast from the Polish Central Statistical Office provides the revised demographic simulation until 2050 taking into account the effects of the “Family 500+” program, which included a higher fertility rate. It does not anticipate the halting of the population drop, but does foresee its significant slowdown. In 2050, the population of Poland may fall to only 35.7 million peo-ple, but that is over 1.7 million more than the previous forecast (wAligórSkA, witkowSki 2016, p. 64). The migration scenarios referring to emigration as well as return migration and the immigration of foreigners to Poland might change, and that could affect the size of the future population. Currently, three options are being considered. One considers an increase in emigration and immigration, with a negative migration balance throughout the forecast period. Another also equates immigration with emigration, but considers increases in immigration with an emigration reduction (Population projection… 2014, p. 98, 99).
Poland is more often chosen as a destination for immigration, including in particular labour immigration. In 2004, in the year of accession to the European Union, just over 12,000 work permits for foreigners were issued, while in 2016 their number significantly exceeded 120,000. Even more dynamic growth was recorded in the number of registered declarations of intent to entrust work to

The Attractiveness of Poland for Economic Migrants. Assessment by Employers:… 427
a foreigner (this is a simplified form of the legalization of employment of a for-eign labour force). Their number increased from 21 thousand in 2007 to over 1.3 million in 2016 (Ministry of Family, Labor and Social Policy). The majority were Ukrainians. They received almost 83% of permits and over 96% of decla-rations. Those who obtain work permits are mainly employed in construction, while those working on statements undertake work primarily in agriculture. In the same period, the unemployment rate in Poland was falling – in December 2004 it was 19%, while in December 2016 it had fallen to 8.2% (Stopa bezrobo-cia w latach…, online), which may indicate a propitious change in the Polish labour market.
There are also more foreigners in Poland who have obtained Polish citizen-ship. The naturalization rate (defined as the ratio of the number of foreigners who acquired citizenship in a given calendar year to the number of foreigners), according to data from 2015, ranks Poland as 3rd among the 28 EU countries (Acquisiton of citizenship… 2017).
The purpose of this paper is to present the current migration situation in Poland based on the example of selected results of studies carried out among enterprises from the Opolskie Voivodeship. The studies involved enterprises assessing Poland with respect to its attractiveness to foreign workers and listed the main factors that determined the influx of foreigners taking up employment in Poland.
The structure of economic migrant inflow to Poland – a statistical approach
The largest group of foreigners who, according to official data, are employed in Poland has Ukrainian descent. The presence of citizens from other countries is definitely less remarkable. The next largest groups for which work permits were issued in the years 2008–2016 were Chinese, Belarussians, Moldovans and Vietnamese (Fig. 1).
A closer look at the case of declarations of intention to entrust work to a foreigner, shows the domination of workers with Ukrainian descent, who in recent years received over 90% of documents (Fig. 2).
In the last couple of years, the growing share of Belarusian and Moldavian citizens among issued statements was noted. The significant change in the industry structure of issued work permits was also observed with the rapidly growing number of construction workers (Fig. 3).
The foreigners obtaining work permits in 2008 were most often employed in manufacturing. In 2016, most of them worked for construction and trade. In the entire period 2008–2016, the significant influence of catering services to the food service sector could be noticed.

428 Sabina Kubiciel-Lodzińska, Bogdan Ruszczak
Fig. 1. Work permits for foreigners in relation to citizenship in the years 2008–2016Source: based on data from Ministerstwo Rodziny, Pracy i Polityki Społecznej, http://psz.praca.gov.pl/rynek-pracy/statystyki-i-analizy/ (access:15.01.2018).
Fig. 2. Number of declarations in relation to the citizenship in the years 2008–2016Source: based on data from Ministerstwo Rodziny, Pracy i Polityki Społecznej, http://psz.praca.gov.pl/rynek-pracy/statystyki-i-analizy/ (access:15.01.2018).

The Attractiveness of Poland for Economic Migrants. Assessment by Employers:… 429
Fig. 3. Work permits in relation to the selected sectors in the years 2008–2016Source: based on data from Ministerstwo Rodziny, Pracy i Polityki Społecznej, http://psz.praca.gov.pl/rynek-pracy/statystyki-i-analizy/ (access:15.01.2018).
On the other hand, foreigners employed in the years 2007–2016, using the declarations, were mainly employed in agriculture. Significant growth was also observed in the construction sector, but the greatest dynamics in the number of issued documents was recorded in industrial processing in 2016 (Fig. 4).
Research Area, Method and Structure of Respondents
The studies, the selected results of which are discussed in this article, have been carried out in enterprises in the Opolskie Voivodeship. This migration re-gion (hEffnEr, SolgA 2013, p. 43, SolgA 2013, p. 126, 127) is characterised by a long-standing tradition of departures (usually abroad) having social, demo-graphic and economic consequences. The Opolskie Voivodeship has become a kind of a “laboratory” for the study of migratory processes, in particular eco-nomic migration. For several years, this has also been a region where research work on foreign migration, mainly economic (jończy,kubiciel2010, kuBiciEl- -loDzińska2012, 2016,kubiciel-loDzińska,ustrzycki2013) but also among students (kubiciel-loDzińska,ruszczak 2016), has been carried out.
The Opole Region is the smallest Voivodeship in Poland – both with regards to its territory and the number of inhabitants. According to the data provided by the Central Statistical Office (CSO), the population only slightly exceeds 1 million, which places the Region in the last position for the country.

430 Sabina Kubiciel-Lodzińska, Bogdan Ruszczak
Fig.
4. N
umbe
r of d
ecla
ratio
ns in
rel
atio
n to
the
sele
cted
sec
tors
– y
ears
200
7–20
16So
urce
: bas
ed o
n da
ta fr
om M
inis
ters
two
Rod
ziny
, Pra
cy i
Polit
yki S
połe
czne
j, ht
tp://
psz.
prac
a.go
v.pl
/ryn
ek-p
racy
/stat
ysty
ki-i-
anal
izy/
(a
cces
s:15.
01.2
018)
.

The Attractiveness of Poland for Economic Migrants. Assessment by Employers:… 431
Furthermore, according to prognoses the Region’s population will keep diminishing. It follows from the CSO’s prognoses for the years 2014–2050 that the Province will face the largest drop in population, since the number of its inhabitants will decrease in 2050 by over 25 per cent when compared to 2013 (Central Statistical Office 2014) as presented on Figure 5.
Fig. 5. Population change from 2013 to 2050 by Regions (in percentage)Source: own elaboration based on Central Statistical Office (2014), cited after: kuBiciEl- -loDzińska, MAj (2017).
The actual population situation in the Opole Province has outrun in time the unfavourable demographic scenarios presented for the region by the CSO. It has been assessed that the real population numbers have already dropped to less than 1 million and amounted to slightly over 870 thousand (the result having been corrected, taking into account the unregistered emigration) (dyBowSkA, widErA 2015, p. 113). The decline in the total population is accompanied by a change in the populations’ structure – a drop in the number of children and an increase in the number of people at post-working age, which can have a serious impact on the labour market (kubiciel-loDzińska,MaJ 2017, p. 179, 180).
The understanding of determinants and effects of foreign economic migration into the Opolskie Voivodeship is constantly being broadened. In late 2014 and in early 2015, studies regarding the demand for foreign labour in enterprises in that Polish voivodeship were carried out. These are the first studies carried out in the Opolskie Voivodeship including both employers having experience with foreign labour and employers without such exposure. Previous analyses

432 Sabina Kubiciel-Lodzińska, Bogdan Ruszczak
carried out in the region incorporated only those entities that employed foreign labour (Jończy,kubiciel 2010).
Respondents were contacted in several ways. Firstly, via an on-line survey sent to over 900 companies. However, only 44 completed and returned it, i.e. less than 5% of the group. Contacting respondents by email was found to be ineffec-tive. The second method used in the studies was direct contact with enterprises at meetings and training courses organised for them1. Ultimately, the studies included 263 employers. The research was based on interviewing the company managers, i.e. business owners, senior managers and human resources managers.
The largest group of respondents was micro-enterprises (43%, i.e. 113 entities). Over 1/3 were small companies (88 respondents). Medium and large enterprises comprised a much smaller part of the group: 17.1% (45 companies) and 6.4% (17 companies), respectively2.
The respondents were divided according to the segment of the labour market they represented, in line with the theory of the dual labour market (doEringEr, PiorE 1971, PiorE 1979). In the completed study, inclusion in the relevant segment depended on the profession (nature) in which the company hired or would be willing to hire a foreigner. The company’s business profile was taken into consideration in the case of companies that definitely did not intend to use migrant work in the future. In the undertaken research, qualification into the relevant segment depended on the profession in which the company employed or would be willing to employ a foreigner. The assignment to the primary market most often resulted from employing (or the willingness to employ) a foreigner in white-collar professions (such as foreign language teachers, doctors, IT special-ists, sales representatives, sports trainers, chemists, technologists, mechanical engineers, marketing specialists, automation specialists, and office workers). The assignment to the secondary labour market most often resulted from employ-ing or the willingness to employ a foreigner in blue-collar professions (including skilled and unskilled workers i.e. construction worker, welder, chef, driver, carpen-ter, mechanic, locksmith, electrician, barber, hairdresser, or cleaner). Regardless of the sector, the organizations which employed foreigners in ‘white collar’ posi-tions had been included into the primary sector; whereas enterprises employing foreigners in ‘blue collar’ jobs were included into the secondary labour market. For simplicity purposes, later in the paper organizations employing foreigners in the ‘good’ jobs will be referred to as companies from the primary labour market and organizations employing foreigners in the ‘bad’ jobs will be referred to as from the secondary labour market (kubiciel-loDzińska,MaJ 2017, p. 182).
1 The author of the studies was involved e.g. in business meetings organised by local government institutions and associations for enterprises.
2 The division of enterprises by size was based on the number of employees. Micro enterprises include an entity employing up to 9 employees, small companies: 10–49 employees, medium-sized enterprises 50–249 employees, large companies: more than 250 employees.

The Attractiveness of Poland for Economic Migrants. Assessment by Employers:… 433
Most of the companies involved in the studies were included in the secondary labour market. Enterprises from this segment accounted for 81% of the respond-ents (213 entities), while the share of companies from the primary labour market amounted to 19% (50 entities), as presented in detail in Table 1.
Table 1Surveyed enterprises according to the employment size and labour market segments
Labour market sector
Micro-enterprises
Small enterprises
Medium-sized enterprises
Large enterprises Total
number % number % number % number % number %Primary labour market 20 17.7 14 15.9 11 24.4 5 29.4 50 19.0
Secondary labour market 93 82.3 74 84.1 34 75.6 12 70.6 213 81.0
Total 113 100.0 88 100.0 45 100.0 17 100.0 263 100.0
Source: analysis of the results obtained in the study.
The Attractiveness of Poland as the Destination of Economic Migration from the Viewpoint of Surveyed Enterprises
The enterprises that participated in the studies were asked whether they thought Poland was attractive to economic migrants, or did not attract foreigners seeking employment3.
More than 46% of representatives of the enterprises involved in the studies (133 responses) claimed that Poland was attractive to foreigners interested in taking up work (Tab. 2). However, this was true only for those that originated from countries poorer than Poland as they could obtain higher income com-pared to their countries of origin. Almost 1/3 of respondents (81 responses) said that Poland was becoming more attractive due to the country’s increasingly better economic condition. According to nearly 14% (40 responses), Poland was not interesting from the viewpoint of economic migrants, and that foreigners treated the country as a stop along the way to the old EU countries. Roughly 6% of respondents (17 responses) thought Poland was not attractive to foreign workers because it belonged to the rather poorer countries. Slightly more than 4% of those surveyed (12 responses) felt that Poland as an economic destination was attractive only to those foreigners who worked illegally.
Almost half (48.5%, i.e. 114 responses) of respondents representing the sec-ondary labour market considered Poland to be attractive but only to migrants from poorer countries as they would be able to obtain higher income compared to their countries of origin. According to respondents from the primary labour market, apart from the above-mentioned argument (mentioned by 35.8%, i.e.
3 More detailed research results were presented in kubiciel-loDzińska(2016).

434 Sabina Kubiciel-Lodzińska, Bogdan Ruszczak
19 responses), the attractiveness of Poland was also demonstrated by the country’s increasingly better economic condition (37.7%, i.e. 20 responses) – see Table 2.
More than 15% (8 responses) of respondents from the primary labour market and nearly 14% (32 responses) of those from the secondary labour market argued that Poland was not attractive to economic migrants who treated it as a transit country to Western European countries. Far fewer respondents thought that from the viewpoint of foreigners, Poland was unattractive because it was relatively poor (5.7% of the primary segment and 6% of the secondary segment). About 4% from both segments deemed Poland as attractive but only to those working illegally.
Table 2The attractiveness of Poland to foreigners seeking work from the viewpoint
of surveyed enterprises – according to the labour market segment
OptionPrimary
labour marketSecondary
labour market Total
number % number % number %Yes, for those from poorer countries, as they could obtain higher income compared to their countries of origin
19 35.8 114 48.5 133 46.2
Yes, because of Poland’s increasingly better economic condition 20 37.7 61 26.0 81 28.1
Yes, but only to those foreigners who worked illegally 2 3.8 10 4.3 12 4.2
No, because Poland is still a poor country 3 5.7 14 6.0 17 5.9No, Poland is only a stop along the way to Western Europe 8 15.1 32 13.6 40 13.9
Other response 1 1.9 4 1.7 5 1.7Total 53 100.0 235 100.0 288 100.0
Source: analysis of the results obtained in the study.
During direct interviews forming part of the studies, it was found that most respondents associated the term “foreign worker” with people from Ukraine (thus the high share of responses demonstrating that Poland was an attractive place to work but only to people coming from poorer countries) who came to Poland for a few months (or years), earned money and eventually went back home. Therefore, the dominating position involves circular (temporary, periodic) labour migration. According to the studies, Polish employers perceive migrants as “guest workers”, not potential residents. On the one hand, temporary and seasonal migrations are positive for the country of immigration (the quick acquisition of the necessary labour without the need of integration programmes), the country of emigration (money transfers stimulating the demand in the country of origin), and for the migrants themselves (the ability to obtain higher salaries compared with their

The Attractiveness of Poland for Economic Migrants. Assessment by Employers:… 435
country of origin). On the other hand, temporary migration may always become permanent. If it is not followed by integrating actions, then, mainly in the event of the influx of people from countries with a different culture, it may have negative consequences in the form of the creation of non-integrated groups of foreigners. This was the case in e.g. Germany where, as noted by researchers, it was la-bour that was imported as part of recruitment programmes rather than people. No actions were taken that would favour permanent settlement. Immigrants (mainly men) were treated only as interim workers (guest workers, Gastarbeiter) necessary only to perform certain types of work and who would return to their countries of origin as soon as no job was available for them. However, this is not what happened. These people remained in Western Europe and, even though labour immigration stopped, the population of foreigners grew because husbands and fathers were being accompanied by their families (castles2006, p. 3).
Factors Stimulating the Influx of Economic Migrants to Poland
The factors that stimulate the influx of foreigners to certain areas include the ability to obtain well-paid employment; the presence of compatriots; cultural proximity; and easy access (influx) to such a place (chiStwick 1994, p. 105, SPörlEin 2015, p. 524). The distance between the area of the outflow and influx was considered a barrier to migration (although part of the discussion concerned internal migration, it seems this factor is more of a general nature and may be referred to when analysing migrations between countries); however, over the years, this conviction has changed (lEwiS 1982, p. 49, 50). Furthermore, it has been noted that the impact of the distance on the propensity to move depended on the migrant’s gender (rAVEnStEin 1885), status (friEdlAndEr, roShiEr 1966) and even profession (tarVer1964). However, the distance between the places of emigration still affects the selection of the direction of migration (kiM, cohEn 2010).
The vast majority of representatives of surveyed enterprises, i.e. more than 45% (152 responses), were convinced the main factor attracting foreign workers to Poland was its geographic location, meaning the relatively small distance from their country of origin made it easier to reach work. Here, it should be added that the majority of foreigners to whom work permits are issued and for whom declarations of the intention to employ foreigners are registered are citizens of Ukraine. A little more than 19% (63 responses) were of the opinion that foreigners were attracted to Poland due to attractive salaries, while 15% (51 responses) – good working conditions. For more than 8% of respondents (28 responses), an important factor attracting foreigners was their command of Polish, while according to 7.7%, the decisive factor to choose Poland was the ability to find work easily – see Table 3.

436 Sabina Kubiciel-Lodzińska, Bogdan Ruszczak
Table 3Factors attracting economic migrants to Poland from the viewpoint of employers –
according to the labour market segment
OptionPrimary labour
marketSecondary labour
market Total
number % number % Number %Geographic location 21 35.0 131 47.3 152 45.1Good work conditions 9 15.0 42 15.2 51 15.1Attractive salaries 18 30.0 47 17.0 65 19.3Command of polish 4 6.7 24 8.7 28 8.3Ability to find work easily 3 5.0 23 8.3 26 7.7Other reason 5 8.3 10 3.6 15 4.5Total 60 100.0 277 100.0 337 100.0
Source: analysis of the results obtained in the study.
Analysing the responses regarding the factors stimulating the influx of for-eign workers to Poland and considering the labour market segmentation, it may be concluded that respondents from both the primary and the secondary labour market deemed the geographic location as the most important factor. Yet, in the secondary segment, the share of responses was higher (47.3%, i.e. 131 responses) than on the primary market (35%, i.e. 21 responses). Employers’ responses are confirmed by other studies. Spörlein noted that the increase in geographical distances adversely affected decisions regarding migration by people with low qualifications (−94%), but encouraged people with high qualifications (+16%) (SPörlEin 2015, p. 541, 542).
For 1/3 of enterprises from the primary labour market (18 responses), attrac-tive salaries were also of key importance. In comparison, 17% of respondents (47 responses) selected this factor on the secondary labour market. In both segments of the labour market, the third most popular factor (15%) was good working conditions. The command of Polish as a factor stimulating the influx of foreign workers was selected by almost 7% (4 responses) of respondents from the primary labour market and almost 9% (24 responses) from the secondary labour market. Also in the case of the ability to find work easily, this factor was listed more often by employers of the secondary rather than the primary segment (8.3% compared to 5%).
Respondents were convinced that the main factor attracting foreign workers to Poland was the relative proximity of their country of origin and the related easy access. This probably results from the fact that most migrants are Ukrain-ians (kAczMArczyk 2015, p. 17). This factor was also selected by nearly 70% of foreigners working in the Opolskie Voivodeship who took part in the studies carried out in 2007–2008 (kubiciel-loDzińska2012, p. 107). The distance
The Attractiveness of Poland for Economic Migrants. Assessment by Employers:… 437
between the country of origin and the country of destination is an important factor affecting migration; however, its importance is dropping due to the increasing opportunities of quick (and inexpensive) transport (rottE, VoglEr 1998, p. 18). This means that if the ageing Europe starts vying for foreign workers, economic migrants will probably choose other countries than Poland.
Conclusion
Poland has been seen as an emigration country. The accession to the European Union and the gradual opening of the labour markets in individual countries of the old EU-15 resulted in the outflow of a significant number of Polish workers, especially young workers (MacHNis-Walasek,orgaNiŚciak-krzykoWska2014). It is estimated that about 2 million people have left Poland (The information on size and the directions… 2016), but the situation is changing. Economic im-migration in Poland is an issue of growing importance. It should be noted that while the unemployment rate in Poland fluctuated in 2004–2016, the number of work permits issued to foreigners and declarations of the intention to employ foreigners has been growing steadily every year. This growth was also reported during the period in which the situation in the Polish labour market deteriorated, resulting in an increase in the unemployment rate. Therefore, there seems to be a demand for foreign labour in Poland regardless of the situation in the labour market caused by foreign labour performing certain specific tasks that native workers do not perform. This results from labour market segmentation (diEtz, kAczMArczyk 2008, nEuMAn 2014); however, critics of this approach point out that the duality of the labour market enables to demonstrate the movement of people solely as an economic phenomenon that does not take the sending party into account (dE hAAS 2011, p. 12).
Nevertheless, the phenomenon of attraction of foreign labour as a result of labour market duality is confirmed by studies carried out in countries with long-term migration experience. They show that foreign workers do not displace native labour, but are employed precisely because native workers are not avail-able (MArtiS et al. 2012, p. 10, 11). George Borjas claimed that immigration also has a small impact on the employment of native labour because it moves to other sectors from the ones occupied by migrants (BorjAS 1994).
Some migration researchers have thought that, in the case of Poland, “there are no immediate relations between the economic situation and the influx of foreigners (…) that improving conditions in the labour market do not increase the influx of foreign labour, and the deteriorating economic condition does not result in the decrease of the influx” (górny et al. 2010, p. 225)4.
4 However, the period taken into account in the analysis of quoted researchers was 1989–2007. It did not include the years witnessing the most rapid increase in the number of documents that

438 Sabina Kubiciel-Lodzińska, Bogdan Ruszczak
It should be noted, however, that migration is affected not only by the economic development of a relevant country or its policy aimed at migrants, but also by migration networks and the openness of the relevant society to foreigners. Dorota Praszałowicz wrote that “although economic reasons trigger migrations, social reasons are responsible for their continuation” (PraszałoWicz 2002, p. 27). The social factors that increase the migration-related attractiveness of a rele-vant country may also include the relations created over centuries between the country of origin and the country of destination. These relationships may be perceived in the context of cultural and historical associations arising from the change of borders. This historical connection with third-country citizens who are arriving in Poland is best visible in relation to migrants from Ukraine. Many people who live behind Poland’s Eastern border refer to their Polish roots (wojtAn 2004, p. 127) or contacts with Poles. This makes Poland culturally close for newcomers from Ukraine, with Ukrainian being a similar language facilitating communication (nowickA, winiArSkA 2010, p. 147, 148). The lack of cultural differences is considered to be a significant factor affecting the influx and integration process (Wysieńska 2010, p. 19).
Poland has become the new target for economic migrants. It has caused, among many others, the change in Poland’s migration policy strategy. Greater empha-sis was put on the fight against illegal employment of foreigners, improvement of their safety and the preparation of the labor market needs catalog, which should reveal information on what professions and in what locations labour is missing (oSiEcki 2017). Although, thus far, there has not been an influx on an extensive scale as has been witnessed in Western European countries, there is a regular increase of interest among employers in hiring migrants and, therefore, the number of foreigners working in Poland is increasing. The growing impor-tance of these issues has also been demonstrated by the inclusion of support to migration (including economic and educational migration) in the document specifying the direction of changes in Poland: “Strategy for Responsible Develop-ment”. It is estimated that, around 2020, Poland will become a net immigration country (duSzczyk 2012, p. 111).
Translated by Linguini TłumaczeniaProofreading by Michael Thoene Accepted for print 5.11.2018
References
Acquisition of citizenship statistics. 2017. Eurostat, http://ec.europa.eu/eurostat/statistics-explained/index.php/Acquisition_of_citizenship_statistics (access: 19.12.2017).
BorjAS g. 1994. The Economics of Immigration. Journal of Economic Literature, XXXII: 1695–1700.
enabled foreigners to work legally in Poland.

The Attractiveness of Poland for Economic Migrants. Assessment by Employers:… 439
cAStlES S. 2006. Back to the Future? Can Europe meet its Labour Needs through Temporary Migration? International Migration Institute, Working Paper, 1, http://www.imi.ox.ac.uk/pdfs/wp/wp-01-06.pdf (access: 18.05.2016).
cAStlES S., MillEr M. 2011. The Age of Migration, New York.chiStwick B. 1994. The Performance of Immigrants in the United States Labor Market. In: Eco-
nomic Aspects of International Migration. Ed. H. Giersch. Springer-Verlag, Berlin. diEtz B., kAczMArczyk P. 2008. On the demand side of international labour mobility: The structure
of the German labour market as a causal factor of seasonal Polish migration. In: International Migration in Europe. New Trends and New Methods of Analysis. Eds. C. Bonifazi, M. Okólski, J. Schoorl, P. Simon. Amsterdam University Press, Amsterdam.
doEringEr P., PiorE M. 1971. Internal Labour markets and manpower Analysis. Harvard Univ., Cambridge, Mass., Massachusetts Inst. of Tech., Cambridge.
duSzczyk M. 2012. Polska polityka imigracyjna a rynek pracy. Aspra, Warszawa. dyBowSkA j., widErA k. 2015. Demograficzne uwarunkowania i skutki depopulacji w woje-
wództwie opolskim. Studia Ekonomiczne. Zeszyty Naukowe Uniwersytetu Ekonomicznego w Katowicach, 223: 106–118.
friEdlAndEr d., roShiEr r.j. 1966. A study of internal migration in England and Wales. Part II. Recent internal migrants – their movements and characteristics. Population Studies, 20: 45–59.
górNya.,graboWska-lusińskai.,lesińskaM.,okólskiM. 2010. Transformacja nieoczywista. Polska jako kraj imigracji. Studia Migracyjne, Ośrodek Badań and Migracjami. Wydawnictwa Uniwersytetu Warszawskiego, Warszawa.
hAAS h. dE. 2011. The determinants of international migration. Conceptualising policy, orgin and destination effects. Working Paper, 32. http://www.imi.ox.ac.uk/pdfs/wp/wp-32-11.pdf (access: 11.05.2016).
hEffnEr k., SolgA B. 2013. Features of a migration region – an analysis using the example of the Opolskie Voivodship. Bulletin of Geography. Socio-Economic Series, 20: 43–58.
iglickA k. 2001. Migration Movments from and into Poland in the Light of East – West European Migration. International Migration, 39(1): 3–32.
iglickA k. 2013. Imigranci pilnie potrzebni. Raport 8. Fundacja Energia dla Europy, Warszawa. Jończyr.,kubiciels. 2010. Zatrudnienie obcokrajowców w województwie opolskim (w kontekście
niedopasowań strukturalnych na opolskim rynku pracy). Pro Media Sp. z o.o., Opole. kAczMArczyk P. 2015. Burden or Relief? Fiscal Impacts of Recent Ukrainian Migration to Poland.
IZA Discussion Paper, 8779. http://ftp.iza.org/dp8779.pdf (access: 10.11.2016). kiM k., cohEn j.E. 2010. Determinants of International Migration Flows to and from Industrialized
Countries: A Panel Data Approach Beyond Gravity. International Migration Review, 44: 899–932. kubiciel-loDzińskas. 2012. The Wage Earning Immigration Into Opole Province. The Scale,
Conditions and Prospects. Politechnika Opolska, Opole. kubiciel-loDzińskas. 2016. Zatrudnienie cudzoziemców w przedsiębiorstwach. Determinanty
i perspektywy (przykład województwa opolskiego). Wydawnictwo Uniwersytetu Ekonomicznego, Katowice.
kubiciel-loDzińska s.,MaJ J. 2017. The Tendency of Entrepreneurs to Employ Foreigners: Labour Immigrants in the Opinion of Employers. Central and Eastern European Migration Review, 6(2): 178–191.
kubiciel-loDzińskas.,ruszczakb. 2016. The Determinants of Student Migration to Poland Based on the Opolskie Voivodeship Study. International Migration, 54(5): 162–174.
kubiciel-loDzińskas.,ustrzyckia. 2013. Systemy zaradcze ułatwiające integrację obywateli państw trzecich jako wynik kompleksowych badań w województwie opolskim. Skala napływu, problemy integracji oraz perspektywy pobytu. Wyższa Szkoła Zarządzania i Administracji, Opole.
lEwiS g.j. 1982. Human Migration. A Geographical Perspective. St. Martin’s Press, New York.MacHNis-WalasekJ.,orgaNiŚciak-krzykoWskaa. 2014. Return Migration of Higher educated
Poles in Times of Economic Crisis. The Macrotheme, 3(2): 71–84.

440 Sabina Kubiciel-Lodzińska, Bogdan Ruszczak
MArtiS P., PirAchA M., VArEjAo j. 2012. Do Immigrants Displace Native Workers? Evidence from Matched Panel Data. IZA Discussion Paper Series, 6644. http://ftp.iza.org/dp6644.pdf (access: 27.02.2013).
Ministry of Family Labour and Social Policy, http://psz.praca.gov.pl/rynek-pracy/statystyki-i-anal-izy/zatrudnianie-cudzoziemcow-w-polsce (access: 19.12.2017).
nEuMAn S. 2014. Job Quality in Segmented Labor Markets: The Israeli Case. IZA Discussion Paper, 8750. http://ftp.iza.org/dp8750.pdf (access: 17.03.2016).
nowickA E., winiArSkA A. 2010. Polska w doświadczeniach długoletnich migrantów. In: Sąsiedzi czy intruzi? O dyskryminacji cudzoziemców w Polsce. Ed. W. Klaus. Stowarzyszenie Interwencji Prawnej, Warszawa.
orgaNiŚciak-krzykoWskaa.,PiotroWskiM.,NykleWiczk.,skórskaa.,kucHarskil. 2013. Popyt na pracę cudzoziemców. UWM, Olsztyn.
oSiEcki g., 2017. Zapraszamy do Polski imigrantów. Szykuje się wielka zmiana w polskiej polityce migracyjnej. Gazeta Prawna 18.01.2017. http://serwisy.gazetaprawna.pl/praca-i-kariera/arty-kuly/1011469,imigracja-repatriacja-zmiany-w-polskiej-polityce-migracyjnej.html (access: 20.12.2017).
PiorE M. 1979. Birds of Passage: Migrant Labor and Industrial Societies. Cambridge University Press, Cambridge.
Population Projection 2014-2050. 2014. Central Statistical Office, Warszawa. PraszałoWiczD. 2002. Teoretyczne koncepcje procesów migracji. Przegląd Polonijny, 4: 9–40. rAVEnStEin E.g. 1889. The laws of migration. Journal of the Royal Statistical Society, 52(2):
241–305. rottE r., VoglEr M. 1998. Determinants of International Migration: Empirical Evidence for
Migration from Developing Countries to Germany. IZA Discussion Papers, 12. http://repec.iza.org/dp12.pdf (access: 16.05.2016).
SolgA B. 2013. Miejsce i znaczenie migracji zagranicznych w rozwoju regionalnym. Opole. SPörlEin ch. 2015, Destination Choices of Recent Pan – American Migrants: Opportunities, Costs
and Migrant Selectivity, International Migration Review, 49(2): 523–552. Stopa bezrobocia w latach 1990–2017, Główny Urząd Statystyczny, https://stat.gov.pl/obszary-te-
matyczne/rynek-pracy/bezrobocie-rejestrowane/stopa-bezrobocia-w-latach-1990-2017,4,1.html (acccess:19.12.2017).
tArVEr j.d. 1964. Occupational migration differentials. Social Forces, 43(1): 231-241. wAligórSkA M, witkowSki j. 2016. Prognoza demograficzna Polski do roku 2050 – nowe ujęcie.
In: Perspektywy demograficzne jako wyzwanie dla polityki ludnościowej Polski. Eds. J. Hryn-kiewicz, A. Potrykowska. Rządowa Rada Ludnościowa, Warszawa.
wojtAn M. 2004. Proces akcesji Polski do Unii Europejskiej w zakresie przepływu osób a doświad-czenia Niemiec. Monografie Centrum Studiów Niemieckich i Europejskich im. Willy Brandta Uniwersytetu Wrocławskiego, Wydawnictwo Uniwersytetu Wrocławskiego, Wrocław.
Wysieńskak. 2010. Integracja, stygmatyzacja, autosegregacja – tożsamość, preferencje i wzory relacji migrantów w Polsce. Instytut Spraw Publicznych, Warszawa, http://www.isp.org.pl/uploads/pdf/623151179.pdf (access: 29.01.2013).
OLSZTYN ECONOMIC JOURNAL2018, 13(4), 441–455
INTERNATIONAL ACTIVITIES OF YOUNG TECHNOLOGY COMPANIES LOCATED
IN SCIENCE AND TECHNOLOGY PARKS
Dorota SobolDepartment of Organisation and Management
Faculty of Economic SciencesUniversity of Warmia and Mazury in Olsztyn
e-mail: [email protected] 0000-0002-2514-9560
K e y w o r d s: internationalisation, young technology companies, science and technology park.
A b s t r a c t
This article presents selected results of the research carried out in the second half of 2017 as part of a research project entitled International business operations of companies located in science and technology parks in the Warmińsko-Mazurskie voivodeship1. The aim of the study was to rec-ognize the current and planned path of foreign expansion as well as to identify the main factors determining the internationalization of operations. To achieve the goal, literature studies on the subject and the conditions of internationalization of enterprises in relation to the SME group were carried out. Empirical studies were then conducted with the participation of three young, innovative enterprises located in science and technology parks in the Warmińsko-Masurskie Voivodeship. Due to the specificity of business operations and the desire to fully understand the paths of foreign expansion, the empirical study was carried out in two stages: an interview with the questionnaire method using a questionnaire survey and personal interviews with representatives of top man-agement of individual companies to enrich the results obtained earlier (case study). The results presented are for demonstration only and may not be used for generalisation. Nevertheless, they are an inspiration to undertake in-depth studies of this subject.
1 Research project funded by the Ministry of Science and Higher Education as part of the pro-gramme “Rozwój młodych naukowców” at the Faculty of Economics of the University of Warmia and Mazury in Olsztyn. Research project no.: 22.620.011–300.

442 Dorota Sobol
AKTYWNOŚĆ ZAGRANICZNA MŁODYCH FIRM TECHNOLOGICZNYCH ZLOKALIZOWANYCH W PARKACH NAUKOWO-TECHNOLOGICZNYCH
Dorota SobolKatedra Organizacji i Zarządzania
Wydział Nauk EkonomicznychUniwersytet Warmińsko-Mazurski w Olsztynie
S ł o w a k l u c z o w e: internacjonalizacja, młode firmy technologiczne, park naukowo-technologiczny.
A b s t r a k t
W artykule zaprezentowano wybrane wyniki badania przeprowadzonego w drugiej połowie 2017 r. w ramach projektu badawczego pn. Aktywność zagraniczna przedsiębiorstw zlokalizowanych w parkach naukowo-technologicznych w województwie warmińsko-mazurskim2. Celem badania było rozpoznanie stosowanej obecnie i planowanej ścieżki ekspansji zagranicznej, a także identyfikacja głównych czynników determinujących umiędzynarodowienie działalności. Realizując cel, przestu-diowano literaturę przedmiotu pod kątem istoty i uwarunkowań internacjonalizacji przedsiębiorstw w odniesieniu do grupy MSP. Następnie przeprowadzono badania empiryczne z udziałem trzech młodych, innowacyjnych przedsiębiorstw zlokalizowanych w parkach naukowo-technologicznych w województwie warmińsko-mazurskim. Z uwagi na specyfikę prowadzonej działalności gospodarczej oraz chęć pełnego zrozumienia realizowanych ścieżek ekspansji zagranicznej badanie empiryczne przeprowadzono w dwóch etapach: wywiadu metodą ankiety pocztowej z wykorzystaniem kwe-stionariusza ankietowego oraz osobistych wywiadów z przedstawicielami ścisłego kierownictwa poszczególnych firm w celu wzbogacenia uzyskanych wcześniej wyników (case study). Zaprezen-towane wyniki mają charakter poglądowy i nie mogą służyć do uogólnień. Mogą jednak stanowić inspirację do podjęcia pogłębionych studiów z przedstawionej tematyki.
Introduction
Until recently, the issue of international expansion of small and medium-sized enterprises (SMEs) has been rather neglected because of the restrictions they face in many areas when compared to large companies. Typical small businesses vary from large businesses not only in terms of the scale of their operations, but mostly in terms of resources they can use, governance policy they follow and the image and market position they have which has been built over the years.
However, studies of SME internationalisation reveal that despite numerous challenges and constraints of an endogenous and exogenous nature, entities in this group launch and successfully operate their businesses in international markets. It is said that SMEs are usually more flexible than large companies in responding to changes in the organisation itself and in their environment, thus
2 Temat badawczy finansowany ze środków Ministerstwa Nauki i Szkolnictwa Wyższego w ramach konkursu „Rozwój młodych naukowców” na Wydziale Nauk Ekonomicznych Uniwersy-tetu Warmińsko-Mazurskiego w Olsztynie. Numer tematu: 22.620.011–300.
International Activities of Young Technology Companies Located… 443
playing an important role in ensuring economic flexibility and dynamism. Such flexibility and initiative are particularly typical of SMEs, which are strongly growth-oriented and operate in sectors where they play a prominent role as subcontractors or where they are leaders in new industries or markets (Glo-balization and Small… 1997, p. 18); in reality, small, innovative companies are somehow forced to expand to foreign markets at an early stage of business (cieŚlik 2011, p. 8).
The establishment of present and anticipated expansion paths as well as identification of key determinants of business internationalisation may provide valuable insights for small technology companies that plan on expanding to for-eign markets. The research results may also help to formulate recommendations for managing bodies of science and technology parks on fostering businesses which plan on expanding internationally.
The nature of business internationalisation and conditions for it
There are various definitions of business internationalisation3. One of the first was proposed by johAnSon and VAhlnE (1977, p. 26) who see internation-alisation as a process in which companies gradually increase their international participation. The authors believe that internationalisation is a result of a series of incremental decisions. wElch and luoStArinEn (1988, p. 36) define inter-nationalisation as a dynamic process of increasing engagement in international markets, both internally and externally. cAlof and BEAMiSh (1995, p. 116) consider internationalisation to be a process of adapting business operations (e.g. strategies, structure, resources) to international environments. Such attempts to define internationalisation indicate that there are many aspects describing this process. As per the most important of them, business internationalisation (wu, zhAo 2007, p. 185):
– is a process including many incremental decisions and strategies;– involves various external and internal products, services or resources
transferred across national borders;– depends on a variety of business-related and environment-related
determinants.This article follows the definition of internationalisation proposed by ry-
MArczyk (2004, p. 19) who claims that internationalisation is “any type of economic activity conducted by a company abroad”4.
3 In the literature on the subject, internationalisation is interchangeable with international development. Cf. hynES (2010, p. 87), nuMMElA, SAArEnkEto (2010, p. 1).
4 The author considers globalisation as a further step of business internationalisation.

444 Dorota Sobol
In the literature on the subject, business internationalisation is illustrated statically (institutionally), as existing relations between international business partners or based on specific indicators, but also dynamically, as a process of development representing transformation into wider and more complex forms of activity in international markets and is usually presented as a model5.
In general, domestic (national) business internationalisation involves three phases: exchange, production and full internationalisation.
The first phase entails exchange through export of one’s own products or import of resources, materials and other things required for production. In this phase, the company learns about the nature of international markets (i.a. ge-ographical, cultural, political, and economic determinants) and seeks reliable business partners. In the second phase, the national company begins its produc-tion processes or other direct operations outside its home country, which makes it an international company, thus a new entity in the global economy in terms of quality. The third phase consists in business globalisation, which is manifested in the global coverage of the company’s operations and in the implementation of a global strategy (kisiel-łoWczyc 1999, p. 12, BEdnArz 2012, p. 44–45).
Domestic businesses that decide to expand abroad can undergo internation-alisation in many forms. They differ from each other in terms of risk, return of investment, use of resources and the possibility to run and manage foreign operations. Each of them has specific advantages and constraints for a business (ryMArczyk 2004, p. 28, 29, BucklEy 2002, p. 96–99, WąsoWska 2014, p. 76).
Business internationalisation means international expansion through export, contracts (e.g. licensing, franchising) or foreign direct investments implemented on the company’s own or in cooperation with another company.
It is worth noting that, in a broader sense, internationalisation may also proceed passively – by developing connections with foreign entities without expanding abroad. Signs of passive business international expansion may include, e.g. import of raw materials, use of a foreign license and participation in a domestic joint venture in cooperation with international corporations (goryniA 2007, p. 35, 36, ryMArczyk 2004, p. 28, 29). The reason behind passive internationalisation is usually seeking specific resources or trying to increase performance (kowAlSki 2015, p. 11). In addition, passive business internationalisation allows the company to gain specific knowledge and skills which the company can use in its expansion. Therefore, it is possible to go from passive internationalisation to active internationalisation (kArASzEwSki 2004, p. 73–84, gorczyńska 2008, p. 54, 55).
Table 1 presents the conventional internationalisation path with emphasis put on active and passive forms of expansion. As the process approach suggests, forms of operation in foreign markets change over time. The model indicates that
5 The forms mentioned in phase models may be considered as more or less equivalent variants and possible differences may regard the number of phases (usually 3–5).

International Activities of Young Technology Companies Located… 445
active internationalisation begins when the company’s organisational structure is transformed and a special department for international operations is established by that company, whereas the increased significance of direct import provide grounds for considering it as an active form of expansion. A company in the third phase of internationalisation may generate goods or provide services both in the home country and abroad. As the company gains experience, it becomes more and more involved in foreign markets and the benefits it achieves encourage the company to expand even further.
It has to be highlighted that, from a practical standpoint, foreign business expansion is a process that is not always is sequential with specifically defined steps and theories of international business development or of direct investments which are often inappropriate for the interpretation of internationalisation of SMEs. Company-specific factors (e.g. years of operation, size, resources, ex-perience) and characteristics of the environment may slow down model-based progression of the company to the next phases; and going beyond the traditional patterns, companies can establish their own ways of development of their oper-ations in foreign markets (cieŚlik 2011, p. 7, 8, golonkA 2014, p. 448, 449).
A company makes a decision on foreign expansion taking into consideration numerous aspects and reasons. Motives (stimuli) for internationalisation can be defined as internal and external determinants of a company’s decision to launch, develop and sustain international business operations (kowAlSki 2015, p. 26). In general, there are two categories of internationalisation drivers that make companies expand to international markets:
– proactive motives for internationalisation, – reactive motives for internationalisation.
Table 1 Active and passive business internationalisation
FeaturesInternationalisation
1st phase 2nd phase 3rd phase 4th phaseContact with foreign markets
indirect, passive direct, active direct, active direct, active
Place of international operations
at home at home at home and abroad
at home and abroad
Orientation of the company
domestic-oriented domestic-oriented mainly domes-tic-oriented
oriented towards many countries
Type of international operations
indirect export and direct import
direct export and direct import
mixed mixed
Organisational structure
conventional international di-vision located in the home country
parent company – branches
structure with an international division or glob-
al structure
Source: based on korth (1985, p. 7).

446 Dorota Sobol
In the first case, a strategic change is triggered in a company that wants to grow, e.g. as a result of excess production capacity or of skills development and the process of foreign expansion is initiated based on reasonable grounds and in the form of decisions. In the second case, a decision of the management to go international is a response to certain external stimuli (e.g. unexpected purchase orders from foreign partners, excess production for the domestic market which can be small and saturated, incentives provided by the government) and the management attempts to adapt to the changes in the business environment as well as to face competitive pressure in order to avoid loss (wiEdErShEiM-PAul et al. 1978, cAVuSgil, nEVin 1980, AlBAuM et al. 1994, hollEnSEn 2007, BucklEy 2002, czinkotA 2004).
Economically, it is evident that an initial decision to expand to international markets through exports is a sum of proactive and reactive motives for interna-tionalisation. It is also evident that the main reasons behind internationalisa-tion of a company shift when it increases the intensity of its activity in foreign markets (WąsoWska 2014, p. 57).
Nonetheless, export-related stimulus is necessary, yet insufficient, for a company to become an international entity. Business internationalisation is dependent on various factors and determinants which affect the choice of strategies, forms (instruments) and models allowing for analysing this entire process (nogAlSki, dASzkiEwicz 2006, p. 52). In principle, they can be divided into two main groups: external (endogenous) determinants which result from the nature of business operations and from resources the company has, and internal (exogenous) determinants related to the domestic and foreign environ-ment that is independent and beyond control of the company (root 1987, ford, lEonidou 1991, MckiErnAn 1992, SitEk 1997). In the literature on the subject, classifications of internationalisation factors (determinants) correspond to the above two-factor classification and are complemented by additional factors or in reference to particular groups of economic operators.
For instance, the classification of internationalisation determinants specific to SMEs proposed by the Organisation for Economic Cooperation and Devel-opment (Globalization and Small… 1997, p. 9, 35–37) includes the following:
– push factors (determinants) which force the company to consider interna-tional expansion,
– pull factors (determinants) where international sales are perceived as a potential source of higher profits,
– chance factors (determinants) related to seizing opportunities,– entrepreneurial factors (determinants) oriented towards continuous growth
and development. It is worth noting that the factors representative of individual groups usually
interact with each other, resulting in cause-and-effect relationships (wAch 2012, p. 74, MAtiuSinAitE, SEkliuckiEnE 2015, p. 28); thus when making a decision to go international, the company has to take into account all of the determinants.

International Activities of Young Technology Companies Located… 447
Concentration only on the key areas – from the point of view of a given compa-ny – disregarding other areas, may underlie wrong decisions and may result in loss (SitEk 1997, p. 76, BucklEy 2002, p. 99, 100). Table 2 illustrates the classification of the most important internationalisation determinants at SMEs developed on the basis of an analysis of the available empirical research results.
Since the phenomenon of internationalisation is observed in the formation of a business or from the early years of its operations (the Born Global concept), research was conducted to identify determinants of early internationalisation (oViAtti, McdougAl 1995, kEEBlE et al. 1998). Such information could help develop future theories about new international projects and their global success (zAhrA 2005, p. 20, MAtiuSinAitE, SEkliuckiEnE 2015, p. 28) as well as help formulate guidelines for SME candidates concerning business internationalisation and recommendations regarding activities aimed at fostering and supporting business operations outside the home country.
Table 2 Determinants of internationalisation in small and medium-sized enterprises
Endogenous determi-nants related to the entrepreneur and management
D e m o g r a ph i c i n -for mat ion on the entrepreneur
Age educational background
determinants related to international expo-sure and experience
experience in international businessknowledge of foreign marketsmanagerial strategic orientation
Endogenous deter-minants related to the enterprise
core profile of the enterprise
size of the enterprisetype of productsR&Dtechnological intensity
attitude towards internationalisation
exploration of foreign markets on a regular basisengagement in international business development
Exogenous determinants
external incentives public supportexternal international factorsexternal domestic factors
external difficulties various factors related to foreign markets, e.g. public support or political instability
Source: own analysis based on hESSElS (2007, p. 200–202).
Methodology of research carried out and a description of respondents
This article presents selected results of a survey carried out in the second half of 2017 as part of the research project entitled Aktywność zagraniczna przedsię-biorstw zlokalizowanych w parkach naukowo-technologicznych w województwie
448 Dorota Sobol
warmińsko-mazurskim (International business operations of companies operat-ing in science and technology parks in the Warmińsko-Mazurskie voivodeship).
The aim of the study was to recognize:– the current and planned path of foreign expansion,– identification of the main factors determining the internationalization
of activities.Three companies complying with the following criteria were invited to take
part in the survey (subject of research):– the company has to be located in one of the three science and technology
parks operating in the Warmińsko-Mazurskie voivodeship: Olsztyn, Elbląg, Ełk;– the company has to be a micro-, small or medium-sized enterprise;– the primary activity of the company has to have high innovative potential.An empirical study, aimed at obtaining primary data, was carried out using
a research tool, which was a questionnaire survey. At the beginning, the correct-ness of the research tool was verified. After taking into account the opinions of the scientific environment and consultations with the Head of the Science and Technology Park in Olsztyn, the final version of the questionnaire survey was developed and used in the empirical research.
Due to the specificity of business operations and the desire to fully under-stand the paths of foreign expansion, the empirical research was carried out in two stages. The first stage of the study consisted in conducting an interview using the questionnaire method using the research tool. In the second stage of the study, personal interviews were conducted with representatives of the top management of individual companies in order to enrich the results ob-tained earlier and a more comprehensive understanding of their individual paths of international expansion (case study – Brycz, dudrycz 2010).
To ensure the anonymity of the respondents, their business names are not disclosed. The results presented are for demonstration only and may not be used for generalisation. Nevertheless, they are an inspiration to undertake in-depth studies of this subject.
The companies participating in the research are so-called small businesses, including one medium-sized and two micro-enterprises. They are young companies that have been operating in the science and technology park for one to four years. In addition, only one of them has conducted an economic activity in the past.
The primary activities that the respondents are engaged in are related exclusively to production or provision of services, whereas according to the Polish Classification of Business Activities (PKD), they belong to the medium-high-technology production industry or render technologically advanced knowledge-oriented services characterised by high innovative potential (cf. List of industries in the field… 1995).
It is good that all of the companies implemented process innovations which resulted in improving the production or delivery process (material changes

International Activities of Young Technology Companies Located… 449
in technology, equipment and/or software). Two companies also implemented a product innovation which should be understood as a new or improved product (commodity or service). It is noteworthy that the solutions developed and imple-mented are environmentally friendly. Two of the companies have already begun commercialising the research results. All of the companies applied for a patent to protect their innovations being developed or already implemented; they also employed other forms of protection, including formal procedures (registration of utility models or trademarks). In addition, all of them commenced to collaborate with other entities to improve their innovativeness. They established lasting relationships with technology institutions (national universities, business incu-bators) as well as with vendors and suppliers at home and abroad.
A description of the respondents presented in Tables 3 and 4 indicates that they are the companies referred to in the literature as young technology com-panies which have been operating in the market for no longer than 5–8 years and usually have limited financial resources and property as well as little expe-rience in conducting an economic activity. The innovative nature of this group of companies can manifest itself by operating in hi-tech sectors or of having an advantage at least at a national level (cieŚlik 2011, p. 7).
Table 3Description of the companies participating in the questionnaire survey
Feature Company A Company B Company CPrimary business activity services production servicesTechnological advancement technologically
advanced knowl-edge-oriented services
medium-high technology
technologically advanced knowl-edge-oriented services
Status micro-enterprise medium-sized enterprise
micro-enterprise
Year of establishment of opera-tions in the science and technol-ogy park
2013 2013 2017
Economic activity new continued newImplementation of an innova-tion during the operation of the company in the science and technology park
yes yes yes
Type of the innovation imple-mented during the operation of the company in the science and technology park
process innovation product innovation and process innovation
product innovation and process innovation
Source: own research.

450 Dorota Sobol
Research results
Research shows that two companies participating in the study have already begun to expand to foreign markets and the third company, the youngest one, is preparing for business internationalisation. All of them have expanded to select-ed Member States of the EU. The main driver of business internationalisation was a desire to achieve higher profits (proactive motive) and when it comes to Companies B and C, also to gain a significant technological advantage over foreign competition (proactive motive) and spontaneous international purchase orders (reactive motive).
Studies suggest that the key determinants of expanding a business to foreign markets are both external and internal, though it turned out that the most important of them are the present and prospective potential of a given foreign market, barriers to entry and the way of establishing business relations (Fig. 1).
The respondents admit that their decisions to go international were preced-ed by a number of preparatory activities, particularly by identification of the company’s objectives in terms of internationalisation and by a comprehensive analysis of the market. Business internationalisation involved the necessity to design a new business model or modify an existing one, taking into account
Fig. 1. Core determinants of business internationalisation according to the respondentsExplanation: the importance (influence) index (in Polish: wskaźnik ważności W ) of the determinants of internationalisation of the businesses participating in the study was calculated as a weighted arithmetic mean as per the following: 3 – very important, 2 – important, 1 – neutral, 0 – insignificant. The importance (influence) index is a number between 0 and 1, whereas: index W=0 – insignificant determinant; 0<W≤0.5 – neutral determinant; 0.51≤W<1 – important determinant; W=1 – very important determinant. The index corresponds to the idea proposed by kArASzEwSki and suDoł
(1997, p. 17, 18)Source: own analysis.
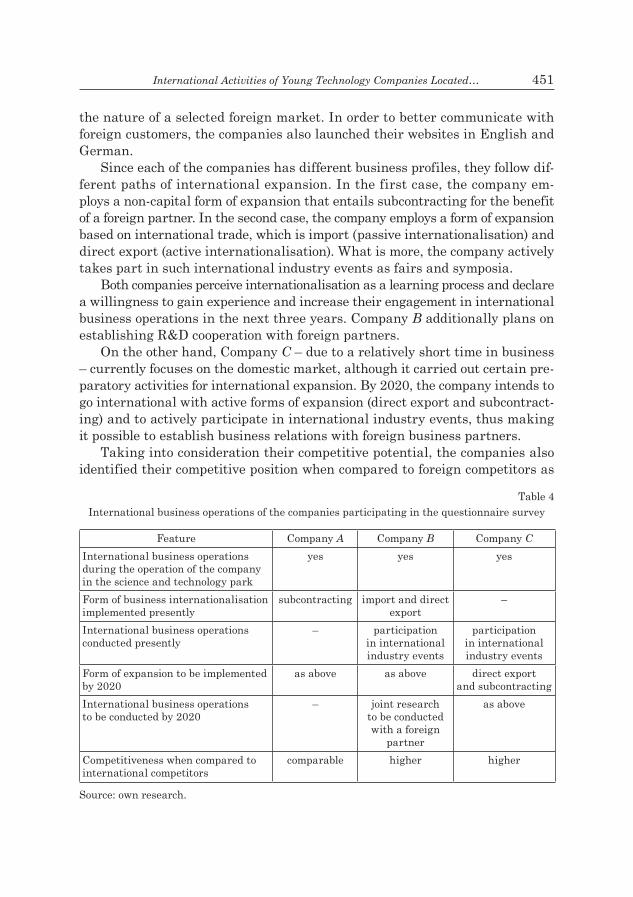
International Activities of Young Technology Companies Located… 451
the nature of a selected foreign market. In order to better communicate with foreign customers, the companies also launched their websites in English and German.
Since each of the companies has different business profiles, they follow dif-ferent paths of international expansion. In the first case, the company em-ploys a non-capital form of expansion that entails subcontracting for the benefit of a foreign partner. In the second case, the company employs a form of expansion based on international trade, which is import (passive internationalisation) and direct export (active internationalisation). What is more, the company actively takes part in such international industry events as fairs and symposia.
Both companies perceive internationalisation as a learning process and declare a willingness to gain experience and increase their engagement in international business operations in the next three years. Company B additionally plans on establishing R&D cooperation with foreign partners.
On the other hand, Company C – due to a relatively short time in business – currently focuses on the domestic market, although it carried out certain pre-paratory activities for international expansion. By 2020, the company intends to go international with active forms of expansion (direct export and subcontract-ing) and to actively participate in international industry events, thus making it possible to establish business relations with foreign business partners.
Taking into consideration their competitive potential, the companies also identified their competitive position when compared to foreign competitors as
Table 4 International business operations of the companies participating in the questionnaire survey
Feature Company A Company B Company CInternational business operations during the operation of the company in the science and technology park
yes yes yes
Form of business internationalisation implemented presently
subcontracting import and direct export
–
International business operations conducted presently
– participation in international industry events
participation in internationalindustry events
Form of expansion to be implemented by 2020
as above as above direct exportand subcontracting
International business operations to be conducted by 2020
– joint research to be conducted with a foreign
partner
as above
Competitiveness when compared to international competitors
comparable higher higher
Source: own research.

452 Dorota Sobol
comparable or higher. The respondents believe that the decisive factors of their position included: a range of very innovative products, marketing operations they conducted and knowledge of the foreign market (Tab. 4, Fig. 2). Even though their current position in the foreign market is as they expected, the companies are focused on the continuous development and improvement of their range of products and services addressed both to domestic customers and to interna-tional ones. The respondents unanimously claim that business internationali-sation fosters the development of the company and helps improve its image in Poland and abroad.
Fig. 2. Core determinants of international success according to the respondentsExplanation: see explanation to Figure 1.
Source: own analysis.
It is worth adding that the companies had no experience in conducting in-ternational business operations and have not yet benefited from international expansion support programmes, but they would gladly use some help from ex-perts collaborating with science and technology parks in virtually every area, though in relation to specific foreign target markets (i.e. in terms of market analysis, legal and tax advisory, opportunities of business relations with busi-ness partners, scale-up).
Conclusions
Studies of SME internationalisation show that despite numerous challeng-es and constraints of endogenous and exogenous nature, entities in this group launch and successfully operate their businesses in international markets.

International Activities of Young Technology Companies Located… 453
In reality, nowadays, young businesses with high innovative potential are some-how forced to go international right at the beginning of their operation.
The questionnaire survey conducted among the three small technology com-panies operating in science and technology parks in the Warmińsko-Mazurskie voivodeship proves that companies expand to foreign markets in their first years of operation.
The main motive for business internationalisation is a desire to achieve higher profits and to gain a significant technological advantage over foreign competition (proactive motives) as well as spontaneous purchase orders from abroad (reactive motive).
The key determinants to expanding a business to foreign markets are both external and internal, though the most important determinants are the present and prospective potential of a given foreign market, barriers to entry and the way of establishing business relations.
Companies approach business internationalisation with caution; the deci-sions of the companies under analysis were preceded by a series of preparatory activities.
Since companies generally have different business profiles, they follow differ-ent paths of international expansion and simultaneously declare a willingness to improve their engagement in international business operations in the next three years.
The companies under consideration had no experience in conducting in-ternational business operations and have not yet benefited from international expansion support programmes, but they would gladly use some help of experts collaborating with science and technology parks in virtually every area, though in relation to specific foreign target markets (i.e. in terms of market analysis, legal and tax advisory, opportunities of business relations with business part-ners, scale-up).
The results presented are for demonstration only and may not be used for generalisation. Nevertheless, they are an inspiration to undertake in-depth studies of this subject.
Translated by Joanna JensenProofreading by Mark Jensen
Accepted for print 5.11.2018
References
AlBAuM g., StrAndSkoV j., duErr E., dowd l. 1994. International Marketing and Export Management. Addison-Wesley Publishing Company, New York.
BEdnArz j. 2012. Podmioty gospodarki światowej. In: Globalizacja i regionalizacja w gospodarce światowej. Eds. R. Orłowska, K. Żołądkiewicz. Wyd. PWE, Warszawa.
Brycz B., dudrycz t. 2010. Case study jako popularna metoda w naukach o zarządzaniu. Kwar-talnik Nauk o Przedsiębiorstwie, 16(3): 15–23.

454 Dorota Sobol
BucklEy A. 2002. Inwestycje zagraniczne. Składniki wartości i ocena. Wyd. Nauk. PWN, Warszawa.cAlof j.l., BEAMiSh P.w. 1995. Adapting to foreign markets: Explaining internationalization.
International Business Review, 4(2): 115–131.cAVuSgil S.t., nEVin j.r. 1980. A conceptualization of the initial involvement in international
marketing. In: Theoretical Development in Marketing. Eds. C.W. Lamb, P.M. Dunne. American Marketing Association, New York.
cieŚlikJ. 2011. Internacjonalizacja młodych innowacyjnych firm. Wyd. PARP, Warszawa.Classification of High-Technology Products and Industries. 1995. oEcd. DSTI/EAS/IND/STP(95)1.czinkotA M.r. 2004. The Drive to Internationalize. The Export Marketing Imperative. Thomson
Learning, Texere.ford d., lEonidou l. 1991. Research developments in international marketing: European Perspec-
tive. In: New Perspectives on International Marketing. Ed. S.J. Paliwoda. Routledge, London.Globalization and Small and Medium Enterprises (SMEs): Synthesis report. 1997. Vol. 1. oEcd,
Paris.golonkA M. 2014. Współpraca międzyorganizacyjna jako strategia umiędzynarodowienia przed-
siębiorstw. In: Relacje międzyorganizacyjne w naukach o zarządzaniu. Eds. A.K. Koźmiński, D. Latusek-Jurczak. Wyd. Wolters Kluwer, Warszawa.
gorczyńskaa. 2008. Międzynarodowa ekspansja przedsiębiorstw. W poszukiwaniu źródeł war-tości rynkowej. Wyd. CeDeWu, Warszawa.
goryniA M. 2007. Strategie zagranicznej ekspansji przedsiębiorstw. Wyd. PWE, Warszawa.hESSElS j. 2007. The International Investment Dimension of SMEs: A Stocktaking of the Evi-
dence. In: International Investment Perspectives. Freedom of Investment in a Changing World. OECD, Paris.
hollEnSEn S. 2007. Global Marketing: A Decision-Oriented Approach. Pearson Education, Harlow.hynES B. 2010. International Small Business Growth: A Process Perspective, Irish Journal
of Management, 29(2): 87–106.johAnSon j., VAhlnE j.r. 1977. The Internationalization Process of the Firm — A Model
of Knowledge Development and Increasing Foreign Market Commitments. Journal of Interna-tional Business Studies, 8(1): 23–32.
kArASzEwSki w. 2004. Bezpośrednie inwestycje zagraniczne. Polska na tle świata. Wyd. TNOiK, Toruń.
karaszeWskiW.,suDołs. 1997. Emiprical Research on the Process of Transformation of Polish Companies in the Period of 1990–1995. Wyd. Uniwersytetu Mikołaja Kopernika, Toruń.
kEEBlEr d., lAwSon c., lAwton h., MoorE S.B., wilkinSon f. 1998. Internationalisation Processes, Networking and Local Embeddedness in Technology-Intensive Small Firms. Small Business Economics, 11(4): 327–342.
kisiel-łoWczyca.b. 1999. Współczesna gospodarka światowa. Wyd. Uniwersytetu Gdańskiego, Gdańsk.
korth ch.M. 1985. International Business. Environment and Management. Englewood Cliffs, New York.
kowAlSki A.M. 2015. Internationalization of Firms. Wyd. SGH, Warszawa.List of industries in the field of high and medium-high technologies. 1995. OECD. http://www.
ncbr.gov.pl/gfx/ncbir/userfiles/_public/fundusze_europejskie/innowacyjna_gospodarka (access: 1.10.2017).
MAtiuSinAitE A., SEkliuckiEnE j. 2015. Factors determining early internationalization of en-terprenurial SMEs: Theoretical approach. International Journal of Business and Economic Sciences Applied Research, 8(3): 21–32.
MckiErnAn P. 1992. Strategies of Growth: Maturity. Recovery and Internationalization, Rout-ledge, London.
Narodowe Centrum Badań i Rozwoju. http://www.ncbr.gov.pl/gfx/ncbir/userfiles/_public/fundu-sze_europejskie/innowacyjna_gospodarka (access: 1.10.2017).

International Activities of Young Technology Companies Located… 455
nogAlSki B., dASzkiEwicz n. 2006. Internacjonalizacja polskich małych i średnich przedsiębiorstw – przymus czy swobodny wybór. In: Strategie korporacji działających w skali ponadnarodowej. Eds. J. Rokita, W. Grudzewski. Wyd. GWSH, Katowice.
nuMMElA n., SAArEnkEto S. 2010. International Growth of SMEs. Past, Present and the Fu-ture. In: International Growth of Small and Medium Enterprises. Ed. N. Nummela. Routledge, Oxon-New York.
oViAtti B.M., McdougAl P.P. 1995. Global start-ups: Entrepreneurs on a worldwide stage. Acad-emy of Management Executive, 9(2): 30–44.
root f.r. 1987. Entry Strategies for International Markets. Lexington Books, Lexington. rozkwitAlSkA M. 2007. Zarządzanie międzynarodowe. Wyd. Difin, Warszawa.ryMArczyk j. 2004. Globalizacja i internacjonalizacji przedsiębiorstw. Wyd. PWE, Warszawa.SitEk E. 1997. Determinanty bezpośrednich inwestycji zagranicznych. Wyd. Politechniki Często-
chowskiej, Częstochowa.wAch k. 2012. Europeizacja małych i średnich przedsiębiorstw. Wyd. PWN, Warszawa.WąsoWskaa. 2014. Motywy umiędzynarodowienia działalności firmy. In: Zarządzanie między-
narodowe. Teoria i praktyka. Eds. K. Obłój, A. Wąsowska. Wyd. PWE, Warszawa. wElSch l.S., luoStArinEn r. 1988. Internationalization: Evolution of a concept. Journal
of General Management, 14(2): 34–55.wiEdErShEiM-PAul f., olSon h.c., wElch l.S. 1978. Pre-export activity: the first step in inter-
nationalization. Journal of International Business Studies, 9(1): 47–58.wu d., zhAo f. 2007. Entry Modes For International Markets: Case Study Of Huawei, A Chinese
Technology Enterprise. International Review of Business Research Papers, 3(1): 183–196. zAhrA S.A. 2005. A Theory of International New Ventures: A Decade of Research. Journal
of International Business Studies, 36(1): 20–28.

OLSZTYN ECONOMIC JOURNAL2018, 13(4), 457–473
SYSTEMIC RISK: CAUSE OR EFFECT OF THE FINANCIAL CRISIS IN THE EURO AREA?
THE CASE OF SPANISH BANKING SYSTEM BAILOUTS
Juan Luis Santos1, Jagoda Kaszowska21Department of Economics
University CEU San Pablo, Madrid, Spain email: [email protected]
2Institute of EconomicsPolish Academy of Sciences
K e y w o r d s: systemic risk, financial stability, Google Trends, bailout.
A b s t r a c t
The aim of this paper is to determine to which extent systemic risk is a cause and an effect of the 2008 financial crisis. In the context of Spanish bailouts, we study the transmission of risk in the Spanish banking system. We make use of data from Google Trends on all Spanish financial institutions, which are selected as examples of one of the countries most affected in the last financial crisis. This analysis is one of the first attempts to use this kind of data for purposes of financial analysis. We compute the impact of each bailout in the banking system and we show how it affects the activity of the bailed-out bank and other institutions according to their status both before and after the announcement of the bailouts. We then show that it is possible to quantify the subjective systemic risk, an elusive concept that is difficult to measure with data from standard sources.
RYZYKO SYSTEMOWE – PRZYCZYNA CZY KONSEKWENCJA KRYZYSU FINANSOWEGO W STREFIE EURO?
PRZYKŁAD POMOCY PUBLICZNEJ DLA HISZPAŃSKIEGO SYSTEMU FINANSOWEGO
Juan Luis Santos1, Jagoda Kaszowska2
1Katedra EkonomiiUniwersytet CEU San Pablo, Madryt, Hiszpania
2Instytut Nauk EkonomicznychPolskiej Akademii Nauk
S ł o w a k l u c z o w e: ryzyko systemowe, stabilność systemu finansowego, Google Trends, pro-gramy pomocy dla sektora bankowego.

458 Juan Luis Santos, Jagoda Kaszowska
A b s t r a k t
Celem artykułu jest określenie, czy wzrost ryzyka systemowego jest przyczyną, czy konsekwen-cją ostatniego kryzysu finansowego. W kontekście problemów hiszpańskiego systemu finansowego przeanalizowano, czy występuje transmisja ryzyka w systemie finansowym tego kraju. W artykule wykorzystano dane uzyskane z platformy Google Trends dotyczące hiszpańskich instytucji finan-sowych, które w dużym stopniu ucierpiały podczas kryzysu finansowego w strefie euro. Badanie to jest jedną z pierwszych prób wykorzystania tego typu danych w analizach sektora finansowe-go oraz transmisji ryzyka systemowego. W artykule przeanalizowano wpływ programów pomocy publicznej (bailouts) na cały system bankowy oraz na poszczególne grupy instytucji w systemie według ich statusu przed uzyskaniem pomocy publicznej i po jej ogłoszeniu. W artykule wskazano, że dane Google Trends mogą być wykorzystywane do analiz stabilności systemu finansowego oraz do kwantyfikacji subiektywnego ryzyka systemowego.
Introduction
The European debt crisis started in the first stages of the Great Recession in late 2009. It was characterized by an environment of excessively high structural deficits and accelerating debt levels (dE grAuwE 2011, groSS 2012). Four Euro Area countries needed to be rescued by sovereign bailout programmes (wyPloSz 2014). When the weak banking sector suffered big capital losses, most states in Europe had to bailout several of their banks with recapitalization loans with this affecting their sovereign debt and vice versa in a spiral process (AchAryA et al. 2014, AchAryA, StEffEn 2015). Since there is a direct relation between the survival of financial institutions and the financial stability, most Euro Area countries decided to provide funding through loans or injection of capital (BArth et al. 2012). The publicly funded bailouts to the banking system were one of the main causes of the sharply worsened debt-to-GDP ratios in several European countries, nonetheless it was only one of the causes of the outbreak of the sovereign debt-crisis in the Eurozone (dEwAtriPont 2014).
After the crisis, the new regulatory initiatives have made bailouts a more difficult solution to implement. Nonetheless, the cost of inaction could have been even higher than the bailout funds (luDWig,sobański2014). Most analysts agree the worst stages of the financial stability have already taken place. How-ever, the public support to failing banks has created a moral hazard problem and the risks that banks take tend to be higher after public assistance. Under this scenario, the current financial risk in the Euro Area could be even higher. This fact also explains the new regulations to prevent more bailouts. The desirable policy would urge the authorities to decrease more effectively the expected rents of banks after the financial assistance (gioVAnni, rAtnoVSki 2013).
In the current situation, we consider it important to continue the research on financial risk and financial crisis in the Euro Area to understand its causes and consequences as well as the ways of mitigating the systemic risk. In this

Systemic Risk: Cause or Effect of the Financial Crisis in the Euro Area?… 459
paper, we use public available data from Google Trends to explore the subjective systemic risk in the Spanish banking system.
In the second section, we briefly describe previous studies that used Google Trends data and we show how it is possible to predict and make useful analysis with this kind of data. In the third part, we present the research questions and we describe why the Spanish case has been chosen. In the section four, the main results are presented. Finally, the conclusions and further research areas are discussed in the fifth section.
Google Trends as a data source for complex analysis
The use of Google Trends data to predict events in the near future and to discover the popularity of a topic in the past is still infrequent but increasingly employed. Google Trends data can be useful as a key source to explore the inter-est on a subject. This kind of data has been used in a growing number of fields.
One of the areas in which Google Trends has shown a great predictive power is in the field of epidemiology. For example, US data on influenza at regional and national level have been published with a delay of two weeks. Instead, Google Trends forward these results for up to ten days, and may offer advanced predictions about the level of influenza regionally, depending on the number of searches about related symptoms (cArnEiro, MylonAkiS 2009).
In addition to the research on the flu contagion, Google Trends data provide valuable information at regional level for other diseases such as Lyme disease (SEiftEr et al. 2010), which is more prevalent in the warm season. Tuberculosis has ten million new cases each year and produces more than a million deaths. It can also be predicted with data from Google Trends (zhou et al. 2011).
Google Trends information has not only been used to predict levels of dis-eases, even though that is its best-known application. There are many exam-ples that show how one can use Google Trends to predict values of economic indicators and spreading of financial risk within the system. choi and VAriAn (2012) emphasize the ability to predict the near future, which has been called nowcasting as opposed to traditional forecasting. Using data from Google Trends it is possible to predict the number of unemployed individuals through search-es of terms related to job portals or information on administrative procedures to receive unemployment benefits.
Google Trends has also shown its validity for predicting consumption levels. VoSEn and SchMidt (2011) show that US search results improve survey indi-cators of consumption. The authors discussed whether the surveys on consumer expectations really reflect the current and future real purchases. Instead, Google Trends provides search data on each type of product. It is feasible to establish with a high degree of certainty what will be the current level of consumption

460 Juan Luis Santos, Jagoda Kaszowska
of each product, especially as a greater portion of consumption is now happen-ing on the internet with consumers tending to look for information prior to the purchase at the very least.
The predictive power of the research with this source of information is such that it is possible to predict variables such as the box-office of movies at the weekend premiere, video game sales the first month after their launch and even the position of them in the lists of popularity weeks in advance (goEl et al. 2010). Its use for specific markets, such as in the case of car sales (cArriérE-SwAl-low, lABBé 2013), also exceeds traditional prediction models. Google trends da-ta-models emerge as one of the most promising alternative tools. Thus, whenever a large part of consumers use the Internet to search for products, Google Trends database contains valuable information about future consumption patterns.
In economics, Google Trends has not been used only in studies on consump-tion patterns. Its application in financial economics is also promising. PrEiS et al. (2010) found key terms that allow designing strategies to over-perform the main indexes of the stock market. Strategies created with searches volumes of words such as debt, stocks and portfolio results were 2.31, 2.21 and 1.69 higher than a random investment. In fact, an investment strategy based on search levels of debt would have made a 326% profit in the period, compared to 16% obtained with a buy and hold strategy.
The key variable for asset pricing is an investor attention. However, there is no direct measure of this variable. In the past, only indirect measures of investment attention were used in the financial models such as news headings and adverts. With the extensive use of web searchers, the data from Google Trends can be considered as a faithful representation of investor attention (dA et al. 2011). The stocks that experience an atypical increase in attention are usually associated with a better performance than the average of the market during the subsequent two weeks.
Google Trends data can also be useful to supervise portfolio diversification and active risk management, because popularity of a stock calculated by search queries is highly correlated with the volatility of that stock (kriStoufEk 2013). In addition, nEri and roViEl (2017) described and predicted the dynamics of Norwegian stock market using Google data, while the goal of Brock (2018) was to quantify macroeconomic expectations in stock markets using this kind of data. The great number of applications of Google Trends data have been analyzed by jun et al. (2018).
This source of data has a wide range of applications and it is relevant for any study in which the searches are important, as it happens with disease symptoms, purchases and stocks. Individuals also use web searchers to compare products of different banks, access to their balances and perform activities with web services of their banks. Therefore, it is possible to make use of Google Trends data to analyze both news coverage and demand of financial institutions.

Systemic Risk: Cause or Effect of the Financial Crisis in the Euro Area?… 461
Systemic risk during financial crisis in Spain
There is no consensus on a unique definition of systemic risk (SzPunAr 2012, SMAgA 2014, jAjugA et al. 2017). On the one hand, some authors con-sider it an external shock that generates systemic effects. On the other, some authors assume it emerges endogenously (dAniElSSon 2002, dAniElSSon et al. 2013). The effects of systemic risk can be modeled as sequential or simultaneous (dE BrAndt, hArtMAnn 2000). These effects can also be classified as horizontal if the systemic risk only affects the financial sector or vertical if we analyze also its effects on the real economy. Finally, it can be classified as objective when the data of financial networks is studied and subjective if the focus is on the effects on the reputation and investors’ attention or attitude towards banks.
In previous works (kASzowSkA, SAntoS 2014, 2017) we attempted to model the role of risk perception on systemic risk generation and amplification. In this paper, however, we focus on how subjective systemic risks appears due to bailouts. We make use of weekly data from Google Trends of all the Spanish financial institutions for the period 2004–2014. This data includes all the web search-es: those intended to access bank web servers to perform operations, searches intended to compare bank services and products and others related to news.
In our study, the database was created using data from the Bank of Spain about financial institutions and information extracted from Google Trends. The link to database is provided at the end of article. We introduced names of Spanish financial institutions in Google Trends webpage: the names of banks as well as savings banks (cajas de ahorro in the local language). In the case of multiple names, all the possibilities were computed and added (e.g. Caja de Burgos, cajaburgos and Caja Burgos). We searched for 5 names each time (that is the maximum quantity allowed to be retrieved at once). Then, we need to rank banks from the less searched to the most searched. Google Trends offer an index from 0 to 100 where 100 is the maximum level of searches in the period for the most popular search. Empty records were used in the case the level of searches was too low and Google Trends did not report the value. The methodology that allows us to build the database uses groups of five banks with one common search term in the sample to be able to compare volumes of all of them altogether. At the end of the procedure, it is possible to compare the volume of all searches and arrive to the same index for all Spanish private banks and savings banks. Then, we can compare how index for each bank or group of banks is changing in time. The analysis could be carried out graphically, but we can also carry out any statistical analysis using these indexes. Below we provide the example how the index that we constructed can be used to analyze the consequences of bailouts in Spain.
Spain is the fourth biggest economy in the Euro Area and the biggest among those most affected by the financial crisis that started in 2008 (uxo 2017). It has a clearly segmented banking system between private banks and savings

462 Juan Luis Santos, Jagoda Kaszowska
banks (Informe sobre la crisis… 2014). The second type of banks were managed in a way that did not intend to maximize profits but rather to increase their size as it was perceived as a proof of adequate management prior to the crisis. This strategy provoked a high growth in their presence at national level with respect to their previous status as regional banks.
In 1998, the number of offices of saving banks and private banks were prac-tically the same and in 2008 the number of offices of saving banks exceeded the number of offices of private banks by 60%. In the last decade of the real estate bubble saving banks increased their market participation by 5% and represented 45% of web searches (excluding the six savings banks that did not need public assistance). However, the total financial assets of savings banks were lower than those of private banks as savings banks were created in the nineteenth century to provide financial services to the poorest families while private banks offered their services to wealthy families and industries. Nowadays, this difference can still be observed.
Since 2009, a series of bailouts have taken place. The most significant ones are indicated with white points (see: Fig. 1). The portion of searches for banks with bailouts in the period 2010–12 is tooth-shaped as the searches increased during bailouts but then a part of consumers changed institutions to more stable private banks. In 2013, the portion of searches for banks that received bailout money increased and then sharply declined as private banks acquired several entities previously nationalized.
Fig. 1. The decreasing market share of banks that needed bailouts Source: own elaboration.

Systemic Risk: Cause or Effect of the Financial Crisis in the Euro Area?… 463
The biggest banks only show three significant changes in the last decade. Caja Madrid and Bancaja, along with other five savings banks, merged into Bankia, receiving public funding in the process. Banco Sabadell acquired with public assistance CAM, a savings bank with financial problems that previously doubled the size of the acquiring bank. At the end of 2013, Santander bank acquired its partner bank – Banesto, that was maintained as a separated brand to improve the investment abilities of the current CEO of Santander bank until the former CEO passed away. Since 2012, the share of web searches for small and medium size banks has progressively declined. Prior to the bailout there were 45 savings banks and currently only two- small local savings banks main-tained their status. The remaining ones have merged and/or been acquired by private banks. However, many of them maintain their brand in their region of origin and therefore clients continue searching these names.
Fig. 2. Web searches – share of big banks Source: own elaboration.
Google Trends data show that among the small and medium banks there has been a higher amount of change in the market than in the case of banks. Some institutions appeared and subsequently ceased their activities in the period under consideration (e.g. Cajasol and Unnim). Others were merged and the level of searches for them has been decreasing asymptotically to zero (as in the case of Caixanova, Caixa Galicia, Caja Canarias or Caixa Penedés). New private banks have been created after merging several savings banks (as in the case of Kutxabank and BMN). This pattern occurred in case of most of the financial institutions of small and medium size (only a selection is presented in Figure 3 for visualization purposes).

464 Juan Luis Santos, Jagoda Kaszowska
Fig. 3. Web searches – share of small and medium banks (selection) Source: own elaboration.
The first bailout after the crisis emergence took place in March 2009. CCM, a savings bank that represented less than 1% of the Spanish financial system, was nationalized and later sold to another savings bank for a small part of the money spent in the bailout. In the next five years ten banks were nationalized, eight of them savings banks with only two small private bank needing public assistance. Another three mergers of savings banks needed support in form of public funding but comparatively the amount of public money devoted to those bailouts was much lower. A total amount of 95.3 billion euro was spent in bank
Table 1Bank nationalizations after 2005
Nationalization stage Date Bank affected Amount
(million €)% of total bailouts Type
1 29.03.2009 CCM 6,974 7.32 savings bank2 22.05.2010 Cajasur 358 0.38 savings bank3 22.07.2011 CAM 13,222 13.87 savings bank4 30.09.2011 Novacaixagalicia 11,081 11.63 savings bank4 30.09.2011 CatalunyaCaixa 13,652 14.33 savings bank4 30.09.2011 Unnim 1,992 2.09 savings bank5 21.11.2011 Banco de Valencia 7,223 7.58 private bank
6 09.05.2012 Bankia 36,183 37.97 savings bank7 12.03.2013 BMN 3,745 3.93 savings bank7 15.03.2013 Banco Gallego 867 0.91 private bank
Source: own elaboration.

Systemic Risk: Cause or Effect of the Financial Crisis in the Euro Area?… 465
nationalizations and 4.3 billion euro in bailouts to mergers. This amount equals to 2,175 euro per inhabitant. As shown in Table 1, these ten nationalizations happened in seven stages.
Results: Subjective systemic risk
In this section, we study the subjective systemic risk six months before the bailout and after the most important bank nationalizations. The first interven-tion changed the paradigm of the stability of Spanish financial institutions. The third and four nationalizations during 2011 happened within two months and they represented 41.9% of the total funds spent on this purpose. Finally, Bankia’s nationalization was the biggest and had important political and so-cial consequences as the government of Spain asked a bailout to the European Union to rescue this mismanaged bank. These three stages of nationalizations represent 85.1% of the financial assistance provided during the crisis.
We divide the banking system into the following categories:– entity(ies) nationalized;– other entities that received public aid during the crisis1;– stable savings banks2;– stable private banks3.If there were a transmission of systemic risk between groups, it would be
possible to observe how the level of searches of groups 2 to 4 would increase. This increase should be higher in groups 2, and 3 in a lesser degree. We establish level equal to 100 for each group during the week when the bailout took place.
The following results show the series of searches after the application of the Hodrick-Prescott filter (cf. hodrick, PrEScott 1997, McElroy 2008) because all the series add seasonality as the level of searches tend to be higher during the last and especially the first week of each month. This takes place because in Spain workers and retired people receive their monthly wage or retirement pay respectively during those weeks.
CCM: The first nationalization (6.9 billion euro)
CCM was the first nationalized bank in Spain after the burst of the real estate bubble in 2008. It was nationalized on Sunday, March 29, 2009, after two savings banks rejected a planned merger. Nine days after the bailout, Pedro Solbes, Minister of Economics and Finance resigned after he urged the Prime
1 Rest of Spanish financial institutions not included in other categories.2 La Caixa, Ibercaja, Unicaja, BBK, KutxaBank, Kutxa and Caja Vital.3 BBVA, Banco Santander, Banesto, Banco Popular, Bankinter and Banco Sabadell.

466 Juan Luis Santos, Jagoda Kaszowska
Minister to undertake the reforms in the financial sector with no delays. After two years of changes in regulations, mergers and acquisitions, and successive minor bailouts, the rest of financial institutions with severe problems were nationalized.
In Figure 4 we can observe that the level of searches of CCM was higher several weeks before the nationalization. The peak corresponds to the intense rounds of negotiations to merge with two potential partners.
Fig. 4. Searches six months prior and after the bailout (searches during the bailout = 100) Source: own elaboration.
The weeks immediately before the bailout the rest of savings banks started to increase their search level. There is no distinction between those that later needed to participate in a bailout and those that could change their status to private banks without public assistance. In this way, the subjective financial risk started before the nationalization of CCM.
After the nationalization, the searches level of CCM as well as the searches of stable banks declined. However, searches of the remaining savings banks increased for five weeks. The subsequent decrease of searches of those banks that needed assistance later was lower. This behavior shows a clear systemic risk transmission.
Table 2 presents quantitative information about the behavior observed in Figure 4. In the six months prior to the bailout, the searches of the entity na-tionalized (a saving bank) had a high correlation with both stable saving banks and other entities with bailouts (mostly saving banks). Saving banks and private banks had negative correlation showing the dual banking system of the country before the first bailout. In the following six months, correlation increase between all the four kinds of entities because of the risk transmission.

Systemic Risk: Cause or Effect of the Financial Crisis in the Euro Area?… 467
Table 2Correlation of searches prior and after the bailout
Entities6 months prior
and after the bailout
6 months prior the bailout
6 months after
the bailoutStable private banks stable saving banks 0.4418 –0.9379 0.9512
Stable private banks entity nationalized 0.8411 –0.6977 0.9675
Stable private banks other entities with bailouts 0.3197 –0.9421 0.9494
Stable saving banks entity nationalized 0.4057 0.6382 0.8437
Stable saving banks other entities with bailouts 0.9908 0.9998 1.000
Entity nationalized other entities with bailouts 0.3147 0.6373 0.8405
Source: own elaboration.
The entity nationalized presents high correlation with stable saving banks, that did not need public aid in the following years (0.8437) and the value is like the one with the entities that need subsequent bailouts (0.8405). The cor-relation is even higher with private banks, that did not need bailouts in these years, (0.9675) due to the decrease in the searches in both. The public interest in the entity that needed the bailout decrease sharply after the aid program was implemented, and private banks were not perceived as risky, so the level of searches decreased as well. However, both stable saving banks and other entities with subsequent bailouts (mostly other saving banks) had a correlation close to the unit both prior and after the bailout of 2009. Then, it is possible to conclude that, at this point, the public did not discern the risk level between different saving banks.
Third nationalization and triple nationalization (13.2 + 26.7 billion euro)
Fourteen months after the intervention in CCM, a small savings bank prop-erty of the diocese of Cordoba had to be nationalized and subsequently acquired by BBVA private bank for a compensation of 358 million euro.
After another period of fourteen months, the government continued denying the financial crisis, but the situation was highly unsustainable. In summer 2011, CAM savings bank still could not find any partner to merge with and had to be nationalized. In 2011, most of the merges of savings banks took place. The financial sector supervisor recommended the creation of new private banks created thanks to merges of saving banks of different regions in order to reduce duplicities. However, regional public authorities did not want to lose the control of their savings banks and forced inter-regional merges. Three out

468 Juan Luis Santos, Jagoda Kaszowska
of the four oversized regional banks had to be nationalized in September 2011 (two from Catalonia and the other ones from Galicia). The remaining regional banks that merged could only survive under private management with a bailout of 525 million euros.
In this case, the systemic risk transmission is not as clear as in the previous case. The searches level increased for private banks because in the period before the bailouts many mergers occurred, and many clients changed their bank to a more stable one.
After these bailouts, savings banks had to reduce their branch networks as stated in the memorandums of public assistance. For this reason, the level of searches declined and the searches of private banks, with the same number of branches, incorporated new customers.
Fig. 5. Searches prior and after the bailout (searches during the bailout = 100) Source: own elaboration.
Nationalized banks at this stage and other entities that needed bailouts decreased their activity at a higher rate than the rest of the savings banks that did not required public funding. In conclusion, the high level of changes in the sector at that time makes it hardly possible to identify the mechanisms of systemic risk transmission in this case.
Table 3 expands these results and presents the results of correlation among searches prior and after the triple bailout (26.7 billion euro). We can see how the results change dramatically after this event. The correlation between the five kinds of entities was close to the unit in all the cases before the bailout and the differences are broad in the six months after the event.
Banks affected by the bailouts of July and September of 2011 increased the correlation in searches up to 0.9999. However, their correlation with other

Systemic Risk: Cause or Effect of the Financial Crisis in the Euro Area?… 469
entities that needed bailouts afterwards decreased to 0.6163 and 0.6181. At this point the public still did not distinguish between entities that were about to be affected by subsequent bailouts and those that had higher solvency ratios (stable saving banks), that had similar correlation after the bailout (0.6164 and 0.6195).
However, the public at this point made a clear difference between saving banks and private banks, something that did not happened two years before as seen in Table 2. The correlation between banks with bailouts in July and September of 2011 and stable private banks became negative (–0.9350 and –0.9355 respectively). Other entities that needed subsequent bailouts also had a different search behavior after the summer of 2011 (correlation –0.4945) and stable private banks and stable savings banks perceived risk was also different after these bailouts (correlation –0.6597).
Table 3Correlation of searches prior and after the bailout (2)
Entities6 months prior
and after the bailout
6 months prior
the bailout
6 months after
the bailoutBank of the bailout (1) banks of the bailout (2) 0.9826 0.9873 0.9999Bank of the bailout (1) other entities with bailouts 0.7038 0.9695 0.6163Bank of the bailout (1) stable private banks –0.2450 0.9882 –0.9350Bank of the bailout (1) stable saving banks 0.7705 0.9684 0.6164Banks of the bailout (2) other entities with bailouts 0.7888 0.9959 0.6181Banks of the bailout (2) stable private banks 0.2053 0.9999 –0.9355Banks of the bailout (2) stable saving banks 0.6723 0.9956 0.6195Other entities with bailouts stable private banks 0.3499 0.9951 –0.4945Other entities with bailouts stable saving banks 0.9330 0.9999 0.8562Stable private banks stable saving banks 0.6230 0.9949 –0.6597
Source: own elaboration.
Bankia: the biggest nationalization (36.1 billion euro)
Bankia was created with a planned merge of Caja Madrid and other small savings banks. Finally, the financial authorities encourage middle-sized Bancaja to be part of this new bank, wrongly assuming its big size could be enough to make it sustainable. In May 2012, the viability of the rescue plan of R. Rato was questioned and the bank was nationalized in the biggest bailout in Spanish history. This bailout along with the second recession in the Euro Area made it advisable to ask for a bailout for the Spanish economy and financial system to the European Union authorities.

470 Juan Luis Santos, Jagoda Kaszowska
As it happened in case of the first nationalization, the pattern of subjective systemic risk transmission is observed. Searches for Bankia peaked several weeks before the bailout when the negotiations were taking place. It produced a temporary increase in searches for other entities that received bailout money previously and other stable saving banks with less intensity. Solvent private banks increased their searches share during this period and they maintained the new quota because of the increase in the number of clients. Again, subjective systemic risk was transmitted to savings banks even before the bailout took place.
Fig. 6. Searches prior and after the bailout (searches during the bailout = 100) Source: own elaboration.
In the first part of 2012 the search patterns of different kind of entities showed a different behavior with respect to one year before, as seen in Table 3. We can see in the second column of Table 4 how only stable private banks and
Table 4Correlation of searches prior and after the bailout
Entities6 months prior
and after the bailout
6 months prior
the bailout
6 months after
the bailoutStable private banks stable saving banks –0.6444 –0.8618 –0.6191Stable private banks Bankia & former brands –0.7520 0.7205 –0.8364Stable private banks other entities with bailouts 0.2041 –0.3609 –0.3142Stable saving banks Bankia & former brands 0.6813 –0.6783 0.9472Stable saving banks other entities with bailouts 0.6853 0.4742 0.9116Bankia & former brands other entities with bailouts 0.1060 –0.8919 0.7707
Source: own elaboration.

Systemic Risk: Cause or Effect of the Financial Crisis in the Euro Area?… 471
Bankia (entity that received the bailout) and stable saving banks and other entities with bailouts had positive correlation. In this way, it could be inferred that the public did not anticipate the bailout of Bankia and other bailouts that happened the following year.
The behavior of the public after the bailout changed especially in Bankia and stable private banks (–0.8364 from 0.7205), stable saving banks and Bankia (0.9472 from –0.6783) and other entities with bailouts and Bankia (–0.8919 and 0.7707). The opinion about Bankia was similar to the ones of stable private banks before the bailout and this entity was perceived like stable and insolvent saving banks after the bailout took place.
Discussion and further research
In this paper, we have made use of data from Google Trends to show how subjective systemic risk was transmitted during the nationalization of six Span-ish banks. We found that during two of the three stages studied in the article, the subjective systemic risk was transmitted to saving banks no matter if they needed public assistance or whether they were part of the few politically-man-aged banks that did not required public funding to survive.
The use of data from Google Trends allows discovering patterns of consumers activity given that internet is one of the main methods to search for products. This is also in the case of the banking sector as clients use web searchers to compare between different banks as well as to access their financial products.
We selected the Spanish case, as it is the biggest economy of the Euro Area among the most affected by the financial crisis of the Eurozone. Ten banks were nationalized since 2009 and approximately 100 billion euro was the total amount of public money spent to stabilize the national financial system. Spain had a segmented financial market in the beginning of the crisis with a low number of private banks and more than forty publicly-managed savings banks. The later were more affected by the crisis and monopolized most of the public assistance.
In the three nationalization stages that we studied, 85.1% of the total amount of public funding was spent. In the first and the third, we found a subjective systemic risk transmission to the savings banks. We found the transmission of subjective systemic risk to those banks that needed public funding to survive and to the low number of savings banks that were not experiencing viability problems.
In the second stage analyzed in the article, no systemic risk transmission processes were found as during this period plenty of changes in the financial system occurred and it was not feasible to isolate the potential systemic risk underlying processes. This suggests Google Trends data might not be enough to determine systemic risk, but it could be added to complex analysis such as in kASzowSkA and SAntoS (2017), BAttiSton and cAldArElli (2013), kASzowSkA

472 Juan Luis Santos, Jagoda Kaszowska
et al. (2018). In this way, it is possible to develop a tool than quantifies and even predicts the objective and subjective systemic risk and the chances of bailouts.
Future research includes extending this approach to all the countries of the Euro Area and study the changes in searches level for each bank, their inter-relations and the correlation with financial variables.
Data disclosure
The data used in this article can be downloaded at “Weekly searches of Spanish banks in 2004–2014” dataset available in ResearchGate. DOI:10.13140/2.1.4038.4800.
Acknowledgements
This article is one of the results of the research project funded by National Science Centre no. 2013/09/N/HS4/03740. We would to thank S. Cincotti and A. Russo for valuable comments on the project. The paper has been presented on the European Conference on Complex Systems.The paper presents the personal opinions of the authors and does not necessarily reflect the official position of their institutions. All mistakes are our own.
Proofreading by D. MatthewsAccepted for print 5.11.2018
References
AchAryA V., drEchSlEr I., SchnABl P. 2014. A pyrrhic victory? Bank bailouts and sovereign credit risk. The Journal of Finance, 69(6).
AchAryA V., StEffEn S. 2015. The greatest carry trade ever? Understanding eurozone bank risks. Journal of Financial Economics, 115(2).
AltAVillA c., PAgAno M, SiMonElli S. 2017. Bank exposures and sovereign stress transmission. Review of Finance, 21(6).
BArth J., PrABhA A., yun G. 2012. The Eurozone financial crisis: Role of interdependencies between bank and sovereign risk. Journal of Financial Economic Policy, 4(1).
BAttiStini n., PAgAno M., SiMonElli S. 2014. Systemic Risk, Sovereign Yields and Bank Expo-sures in the Euro Crisis. Economic Policy, 29(78).
BAttiSton S., cAldArElli G. 2013. Systemic risk in financial networks. Journal of Financial Management, Markets and Institutions, 1(2).
Bock j. 2018. Quantifying macroeconomic expectations in stock markets using Google Trends. Warwick Research Paper, DOI: 1805.00268.
BrAndt o. dE, hArtMAnn P. 2000. Systemic Risk: A Survey. ECB Working Paper, 35.cArnEiro H., MylonAkiS E. 2009. Google Trends: a web-based tool for real-time surveillance
of disease outbreaks. Clinical Infectious Diseases, 49(10).cArriérE-SwAllow Y., lABBéE F. 2013. Nowcasting with Google Trends in an emerging market.
Journal of Forecasting, 32(4).choi H., VAriAn H. 2012. Predicting the present with google trends. Economic Record, 88(1).dA Z., EngElBErg J., gAo P. 2011. In search of attention. The Journal of Finance, 66(5).dAniElSSon j., Shin h.-S. 2002. Endogeneous risk. LSE Working Paper, 1–22.

Systemic Risk: Cause or Effect of the Financial Crisis in the Euro Area?… 473
dAniElSSon j., Shin h.-S. zigrAnd j.-P. 2013. Endogeneous and Systemic Risk. In: Quantifying Systemic Risk. Eds. J. Haubrich, A. Lo. University of Chicago Press.
dEwAtriPont M. 2014. European banking: Bailout, bail-in and state aid control. International Journal of Industrial Organization, 34.
gioVAnni D., rAtnoVSki L. 2013. Bailouts and Systemic Insurance. International Monetary Fund, 13(233).
goEl S., hofMAn J.M., lAhAiE S., PEnnock D.M., wAttS D.J. 2010. Predicting consumer behavior with Web search. Proceedings of the National Academy of Sciences, 107(41).
grAuwE P. dE. 2011. The Governance of a Fragile Eurozone. The Australian Economic Review, 45(3).groS d. 2012. Macroeconomic Imbalances in the Euro Area: Symptom or cause of the crisis? Centre
for European Policy Studies, 266.hodrick r., PrEScott E. 1997. Postwar U.S. Business Cycles: An Empirical Investigation.
Journal of Money, Credit and Banking, 29(1).Informe sobre la crisis financiera y bancaria en España, 2008–2014. 2014. Banco de España, Madrid.JaJugak.,karaŚM.,kuziakk.,szczePaNiakW.2017. Ryzyko systemu finansowego. Metody
oceny i weryfikacja w wybranych krajach. Materiały i Studia, 329.jAkiMowicz A. 2010. Źródła niestabilności struktur rynkowych. PWN, Warszawa.jun S.-P., yoo h.S., choi S. 2018. Ten years of research change using Google Trends: From
the perspective of big data utilizations and application. Technological Forecasting and Social Change, 130.
kASzowSkA J. Macroprudential Policy in Heterogeneous Environment – An Application of Agent- Based Approach in Systemic Risk Modeling, under review.
kASzowSkA J., SAntoS J.L. 2014. The role of risk perception in the systemic risk generation and amplification: Agent-based approach. Journal of Finance and Risk Perspectives, 3(4).
kASzowSkA J., SAntoS J.L. 2017. Rola percepcji ryzyka i niepewności w ocenie ryzyka systemowego. Podejście symulacyjne ABM. Ekonomista, 4.
kriStoufEk L. 2013. Can Google Trends search queries contribute to risk diversification? Scien-tific Reports, 3.
ludwig A., sobański K. 2014. Banking sector fragility linkages in the euro area: Evidence for crisis years 2007–2010. Economics Letters, 125(3).
McElroy t. 2008. Exact Formulas for the Hodrick-Prescott Filter. Econometrics Journal, 11.MicoSSi S. 2015. The Monetary Policy of the European Central Bank (2002–2015). Centre for
European Policy Studies, 109. nEri k., roViEl V. 2017. Google and Financial Markets: Can Google Trends describe and predict
the dynamics of Norwegian stock market? Master Thesis, University of Stavanger, Stavanger.PrEiS T., rEith D., StAnlEy H. 2010. Complex dynamics of our economic life on different scales:
insights from search engine query data. Philosophical Transactions of the Royal Society A: Mathematical, Physical and Engineering Sciences, 368(1933).
Rebooting the Eurozone: Step 1 – agreeing a crisis narrative. 2015. Centre of Economic Policy Research.
SEiftEr A., SchwArzwAldEr A., gEiS K., Aucott J. 2010. The utility of Google Trends for epidemiological research: Lyme disease as an example. Geospatial Health, 4(2).
SMAgA P. 2014. The concept of systemic risk. SRC Special Paper, 5.SzPunAr P. 2012. Rola polityki makroostrożnościowej w zapobieganiu kryzysom finansowym. Ma-
teriały i Studia, 278.uxo J. 2017. Is the end of fiscal austerity feasible in Spain? An alternative plan to the current
Stability Programme (2015–2018). Cambridge Journal of Economics, 41. VoSEn S., SchMidt T. 2011. Forecasting private consumption: survey-based indicators vs. Google
trends. Journal of Forecasting, 30(6).wyPloSz C. 2014. The Eurozone crisis: A near-perfect case of mismanagement. Journal of Applied
Economics, XXXIII(1).zhou X., yE J., fEng Y. 2011 Tuberculosis surveillance by analyzing Google trends. Biomedical
Engineering, IEEE, 58(8).


OLSZTYN ECONOMIC JOURNAL2018, 13(4), 475–486
EXPECTATIONS RELATED TO THE IMPLEMENTATION OF PERFORMANCE BUDGET IN MUNICIPALITIES
Joanna Dynowska1, Sandra Janet Cereola21Department of Accounting
Faculty of Economic SciencesUniversity of Warmia and Mazury in Olsztyn
2School of AccountingJames Madison University
e-mail: [email protected]; [email protected]
K e y w o r d s: performance budget, municipality, expectations, documents.
A b s t r a c t
Local governments adopt performance budgeting for a number of reasons, identified in many areas of the commune’s operations including service management, work organization, decision-making process and, above all, at every stage of the budget process. Prior research focuses mainly on the effects of performance budgeting implementation such as increased efficiency of financial resources management and increased transparency and openness of the budget and the opportunity to ratio-nalize the costs of implementing specific tasks or improvements of the allocation of public funds. Using a questionaire, this study contributes by identifying the expectations of local governments related to the implementation of performance budgets in municipalities. A second contribution is in revealing the kinds of documents with which the performance budget should be linked and determining who should be responsible for its implementation in municipalities. The survey was conducted among 45 selected communes which are located in Warmia and Mazury voivodship. The results of the survey show that the greatest expectation in implementing the task budget was the desire to create better financial management in the municipality and to create a clearer budget for management, employees and residents of the municipality. According to the respondents, per-sons who should be involved in the process of budget preparation in the new task system should be the commune administrator or the treasurer of the commune. Most municipalities, as a means of transferring information about the budget assumptions, propose using a commune’s website and an information board at the commune office.
476 Joanna Dynowska, Sandra Janet Cereola
OCZEKIWANIA ZWIĄZANE Z WDROŻENIEM BUDŻETU ZADANIOWEGO W GMINACH
Joanna Dynowska1, Sandra Janet Cereola2
1Katedra RachunkowościWydział Nauk Ekonomicznych
Uniwersytet Warmińsko-Mazurski w Olsztynie2School of Accounting
James Madison University
S ł o w a k l u c z o w e: budżet zadaniowy, gminy, oczekiwania, dokumenty.
A b s t r a c t
Samorządy adaptują budżetowanie zadaniowe z wielu powodów zidentyfikowanych w różnych obszarach funkcjonowania gminy – zarządzania usługami, organizacji pracy, procesie decyzyjnym, a przede wszystkim na każdym etapie procesu budżetowego. Wcześniejsze badania koncentrują się głównie na takich efektach wdrożenia budżetu zadaniowego, jak: większa efektywność zarzą-dzania zasobami finansowymi, większa przejrzystość i otwartość budżetu, możliwość racjonalizacji kosztów realizacji konkretnych zadań, poprawa alokacji środków publicznych. Celem badań prze-prowadzonych z wykorzystaniem metody ankiety była identyfikacja oczekiwań władz lokalnych związanych z wdrażaniem budżetu zadaniowego w gminach. Opisano również rodzaje dokumentów, z którymi należy powiązać budżet wykonania zadań, oraz określono, kto powinien odpowiadać za jego wdrożenie w gminach. Badaniem objęto 45 wybranych gmin zlokalizowanych w województwie warmińsko-mazurskim. Badania wykazały, że po wdrożeniu budżetu zadaniowego najbardziej jest oczekiwane lepsze zarządzanie finansami w gminie oraz utworzenie budżetu bardziej przejrzystego dla kadry zarządzającej, pracowników i mieszkańców gminy. Zdaniem ankietowanych osobami, które powinny być zaangażowane w proces opracowania budżetu w nowym układzie zadaniowym, powinien być wójt bądź skarbnik gminy. Większość gmin proponuje stronę internetową gminy oraz tablicę informacyjną w urzędzie gminy jako środek przekazu informacji o założeniach budżetu.
Introduction
In the last decade, performance measurement has emerged as one of the most important public sector management reforms, surpassing management by objectives, total quality management, zero-based budgeting or program plan-ning (gilMour, lEwiS 2006). Closely related to performance measurement is performance budgeting, or performance-based budgeting, which seeks to link the findings of performance measurement to budget allocations (joycE 1999).
Performance budgeting roots date back to Anglo-Saxon tradition. The history of performance-based budgeting is in essence a history of public sector reforms that reach as far back as the end of the 1940s. It appeared then to be the key driving force of budget innovations in the USA (Schick 2007). The perfor-mance budget concept was introduced and associated with the under-performing of public finances due to the use of the traditional budgeting model (lEwiS

Expectations Related to the Implementation of Performance Budget in Municipalities 477
1952). The new concept of budgeting in the performance system was intended to replace the traditional procedure. Over the decades, this idea has been expand-ed and its implementation has taken place not only at the level of government administration, but also at the level of self-government units. Over time, it has spread to other countries, including the European Union.
In Poland, some self-governments have implemented a performance budgeting in the 1990s under the Partnership for Local Governance Program, funded by USAID (United States Agency for International Development). However, after their first experience, some of them withdrew from the experiment discouraged by a difficult procedure or the high costs of installing an IT program (wEBEr 2011).
The city of Cracow was the precursor of the implementation of the performance budget followed by, among others, Lublin, Poznań and Szczecin. At present, dozens of self-governments in Poland use task-based budgeting, but its scope varies (e.g., it covers individual areas of activity of a local government unit and/or its government in its entirety (kAczurAk-kozAk 2013, p. 181, 182).
The performance-based budget in Poland is most often used as a pre-sentation tool and, only to a moderate extent, as an instrument increasing the efficiency and effectiveness of spending public funds. Achieving better results of its application will be possible if it is related to management control (kArgol-wASiluk, wojEwódko 2016, p. 155). A new approach to managing public funds involves the introduction of other management methods and in-struments such as multi-annual planning or internal auditing. These methods provide the opportunity to measure the effectiveness of the tasks performed and the level of satisfaction of the society with the goods and services provided by JST (local goverment units) (filiPiAk 2011, p. 224, 225).
The most commonly cited definition of a performance budget is the definition formulated by R. Allen and D. Tomassi, according to which, the task budget “assigns financial operations by the government (administration) to functions and programs that meet specific socio-economic objectives; defining metrics for each program or task, and measuring the costs of performing these tasks and their effects” (AllEn, toMASSi 2001).
Performance-based budgeting (PBB) is the practice of developing flexible fnancial management tools to increase the efficiency and productivity of public institutions both in developed and developing countries (Erkutlu et al. 2017).
Among the Polish public finance specialists, Lubińska said that performance budgeting is “managing public funds through appropriately defined and hier-archical objectives, to achieve specific outcomes (performance goals) measured by a set system of measures. The task budget allows us to determine which tasks are most important for the achievement of objectives, and with the help of indicators it shows how far they have been accomplished” (Budżet zadaniowy w Polsce… 2007, p. 9).
With regard to the local government unit, it is possible to say that „the performance budget is a financial plan prepared in the following way: before

478 Joanna Dynowska, Sandra Janet Cereola
the planned expenditure is recognized in accordance with the budget classifi-cation in force, the local government prepares the programs – defines results declarations for them and draws up plans to provide services” (Budżet jako narzędzie zarządzania… 2000).
In many definitions of performance budgeting there is an emphasis on the importance of managerial freedom in budget management. The performance budgeting focus is on accountability for the results produced, rather than on control of how those results are produced (roBinSon 2007, p. 1).
From the controlling viewpoint, the most common type of performance bud-get is performance budgeting – often identified with a task budget in general. In the Polish literature, performance budgeting is defined as effective budget-ing, although it is not an accurate description, because from a methodological point of view, effective budgeting is the development and refinement of classi-cal task-based budgeting and it also places higher demands on municipalities (BiElAwSki 2013, p. 199).
The increase in the efficiency of managing the financial resources of local government units can be achieved by using appropriate methods of planning and distribution of budgeted funds, based on cost analysis and the application of modern management methods, including innovative solutions for budget cre-ation and implementation (SiErAk 2011, p. 102). A performance-based budget is a modern concept of preparation and implementation of the budget of the commune. Its essence is to bind revenues and budgetary expenditures with specific public tasks, while simultaneously considering the multi-annual investment plans of the municipality. There is also a link to the budgets in the accounting system of the municipality, which makes it easier to calculate the costs of municipal services.
The task-based budget is also a significant enhancement of the classi-cal budgeting method in the municipality in terms of reporting and analysis of its implementation and the study of cost-effectiveness relationships. It uses different types of indicators describing the degree of budgetary tasks and their effectiveness.
When evaluating the functions within public finance units, the level of effec-tiveness is determined, which is related to the performance of budgetary tasks and the satisfaction of social needs (ModzElEwSki 2014, p. 44).
Activity-based budgeting emphasizes not only the allocation of public funds, but also the assessment of the efficiency of public tasks that have used these funds (Szolno 2014, p. 504).
Due to the fact that the provisions in the Act on Public Finances of 2009 relating to the implementation of the budget in the task system for the local governments was optional (Ustawa z 27 sierpnia 2009 r. o finansach publicznych, Journal of Laws of 2009, no 157), few municipalities decide to implement it. According to public finance law, the task budget does not replace the traditional budget, but merely constitutes an additional form of subscription. As a result of this misalignment of the rules, municipalities that implement the task budget

Expectations Related to the Implementation of Performance Budget in Municipalities 479
cannot abandon the traditional budget, which makes them reluctant to adopt this financial plan despite the many benefits associated with its implementation.
The most frequently mentioned benefits of performance budgeting include: increased transparency and openness of the budget, the opportunity to ration-alize the implementation of individual tasks, improving the allocation of public funds, combining planning in the short, medium and long term, the introduction of direct responsibility for the implementation of budgetary tasks, and ultimately increasing the quality management of the local government unit (SiErAk 2011, p. 119). In the context of the above-mentioned advantages of budgeting in a task setting, the main aim of the article was to identify local governments’ expectations related to the implementation of the activity budget. The paper also discusses the issues with which the task budget should be linked and determines who should be responsible for its implementation in municipalities.
Research method and research sample
The study was conducted using a questionnaire. The survey questionnaire was designed to select 45 of the 116 municipal offices located in Warmia-Mazury voivodship. Sample selection was targeted and guided by a geographic criterion. The survey was conducted in the communes which expressed their willingness to participate in the study.
The research assumes that municipal finance managers expect that the task-based budget is primarily used to increase budget transparency and responsi-bility of the commune’s employees for its realization and long-term expenditure planning. Statistical analysis of interdependence of non-measurable features was performed to assess the significance of relationships between selected features (χ2 test, and Cramer’s V factor). To verify the H0 hypothesis, the significance level was assumed α = 0.05. Correlation analysis was continued only in the case of rejecting the null hypothesis about the stochastic independence of the ob-served variables.
In the research sample more than half (56%) constituted rural communities. One in four respondents was an urban-rural municipality, while the smallest percentage, about 20%, was urban municipality.
Among the surveyed communes, every fifth municipality occupied a rela-tively small area of 100 km2. The same surveyed units were communes with an area of over 300 km2. The other entities are municipalities with an area of 100 km2 to 300 km2.
In most of the surveyed communes, the population was in the range of 5,000–10,000 people. Only in 7% of the communes the number of inhabitants exceeded 40,000 (Fig. 1).

480 Joanna Dynowska, Sandra Janet Cereola
Fig. 1. Nubmer of inhibitants in the surveyed municipalitiesSource: own elaboration.
In the examined communes, a high share of subsidies in the budget was noted. About 64% of the surveyed communes exceeded 20% of the budget. For 17% of the surveyed entities the share of subsidies ranged between 15% and 20% of the budget, and for 14% of respondents the subsidies ranged from 10% to 15% of the budget revenue. Only in 5% of the surveyed entities this component was less than 10%.
Another important component in the budget of the examined communes was subsidies (Fig. 2). According to E. Wojciechowski, they should, together with their own incomes, be the main source of local government financing (Samorząd terytorialny w Polsce 2014, p. 35).
Fig. 2. The share of general subsidies in the budget of the surveyed municipalitiesSource: own elaboration.

Expectations Related to the Implementation of Performance Budget in Municipalities 481
Nearly half of the surveyed municipalities accounted for between 25% and 35% of the budget and 37% of municipalities were over 35%. Only 12% of the sample was within the range of 20–25%. For the other municipalities, subsidies have little influence on the budget as they represent less than 20% of the budget revenues (Fig. 2).
Also analyzed were the income in the examined municipalities per capita. Nearly 25% of the surveyed communities did not exceed 1,200 PLN per person, while the majority (in 47% of the surveyed units) was above 1,900 PLN (Fig. 3).
Fig. 3. Income per capita in the surveyed municipalitiesSource: own elaboration.
Results
Research on performance budgeting in selected municipalities was performed by verifying the number of entities that had a performance budget. According to the respondents, only 4 municipalities (9%) prepared the budget in a task system. A statistical analysis was carried out to test the hypotheses concerning linking characteristics of the examined communes with the development of the task budget. The study revealed no relationship between having a performance budget and the features characterizing the analyzed municipalities. In each case, the index p exceeded the boundary value of 0.05 (Tab. 1).
Having learned about the small number of communes that prepare the per-formance budget, an attempt was made to examine what effects the municipality would expect after its implementation. More than 53% of the respondents expected better financial management of the municipality. Few respondents (over 48%) expected increased budget transparency. To a lesser degree, about 27% of the respondents, expected the following from the task budget: providing new infor-mation on financial issues and tasks, multiannual expenditure planning and better coordination in the municipality. In turn, about 15% of the respondents identified a significant effect of the implementation of the task budget would be

482 Joanna Dynowska, Sandra Janet Cereola
to increase the responsibility of individual employees of the municipality and better cooperation in the municipality1 (Fig. 4).
The elaborated performance budget should be closely linked to the planning documents of the municipality and, in particular, to the municipality’s develop-ment strategy. In order to verify the knowledge and intentions of the surveyed communes, it was asked what documents should be linked to the budget in the task system (Fig. 5).
Most of the municipalities indicated the use of two documents. According to 67% of municipalities, this document is a commune development strategy, and in the opinion of half of the respondents, the performance budget should be linked to the Multiannual Financial Plan. Almost half of the respondents also believe that the budget in a task system should be linked to the Multiannual Investment Plan (Fig. 5).
Access to information contained in the budget should be provided to the in-habitants of the municipality. According to the report on local self-government in Poland, residents of municipalities generally have little information about where their money is allocated to (Samorząd terytorialny w Polsce, 2014, p. 39, 40).
In the analyzed research sample, most municipalities provide information on the budget to stakeholders in several ways: the most common (78% of communes) was the municipality’s website. In the era of the Internet the website is the best medium that allows stakeholders to quickly get the data needed. Another way of communicating information about budget assumptions, practiced by 58% of the surveyed communes, was an information board at the municipality office.
1 The survey conducted among the municipalities that implemented the performance budget shows that the greatest benefits are: involvement of middle management in planning, better presentation of tasks, improvement of planning procedures, better monitoring of tasks (Budżet władz lokalnych 2002, p. 141).
Tabele 1The relationship between the implementation of performance budget
and the features characterising the studied municipalities
Features Chi2 pArea 3.681 0.719Number of inhibitants 2.790 0.946Total income 4.432 0.816Total expenses 4.228 0.835Income per capita 5.990 0.424Own income 2.364 0.883Subsity 5.977 0.425General subsidies 3.776 0.706Type of municipality 3.384 0.495
Source: own elaboration.

Expectations Related to the Implementation of Performance Budget in Municipalities 483
Fig. 4. Expectations related to performance budget implementationSource: own elaboration.
Fig. 5. Documents, which should be linked to performance budgetSource: own elaboration.
This method is particularly important for people who do not have access to the Internet. Less often (20%) used was the local press. The communication meth-od was usually chosen by the municipalities. In addition, a small percentage of the surveyed communes (about 4%) also indicated other ways of informing the inhabitants about the budget assumptions (e.g., the commune bulletin or the mayor himself) (Fig. 6).
The process of creating a performance budget, including the definition of tasks and measures, involves a number of individuals. The most frequently mentioned individual (about 90% of the respondents) who is or will be involved in this process, was a mayor. The next most common individual mentioned (about 78% of municipalities surveyed) is the commune treasurer (Fig. 7)2.
2 On the other hand, research on the task budget carried out by M. Będzieszak showed that the treasurers, the directors of the municipal office departments and the employees were most

484 Joanna Dynowska, Sandra Janet Cereola
Fig. 6. Way to inform the inhibitants of municipality about the assumptions of budgetSource: own elaboration.
Fig. 7. People involved in creating the performance budgetSource: own elaboration.
More than half of the communes (51%) indicated councilors as responsible for developing the performance budget. A smaller number of respondents (33%) indicated that department heads or staff members of the municipality were in-volved in the task budget. Only 2% of the surveyed respondents indicated that external consultants were involved in this process (Fig. 7).
involved in the definition of tasks and their components. The employees of the board (the mayor, the president and his deputies), councilors or external consultants were less involved (bęDzieszak 2009).
Expectations Related to the Implementation of Performance Budget in Municipalities 485
Conclusion
The performance budget is one of the modern management tools used in local self-government units. It allows for the proper and effective use of public funds by linking public finance with the results that are achieved through each budgeted tasks.
The performance budget, as a modern management tool, is rarely used in municipalities. This is due to the fact that individuals do not have experience in implementing this financial plan. In addition, it is an additional budget and cannot replace the traditional budget at this time. It can only be a complement to the traditional plan and therefore is associated with additional workload. Because performance budgets are not required in the task system, only a small number of municipalities decide to undertake this additional task. Municipal-ities, in order to manage public finances well, should begin to see the modern budget as a tool that will increase the efficiency and effectiveness of spending public funds.
The conducted research confirmed the research hypothesis, assuming that the greatest expectation associated with the implementation of performance budgeting is the desire to create better financial management in the munici-pality and to establish a more transparent budget for managers, employees and local residents.
Among the most frequently mentioned persons, who should be involved in the budget process in the new task system, was the commune adminis-trator or treasurer. Respondents in the surveyed communes are aware that budget assumptions must be made available to residents. Most municipalities, as a means of transmitting information on budget assumptions, propose the use of the commune’s website and an information board at the municipality’s office.
The task budget cannot replace the traditional budget, but can only be a supplement to it. This causes the municipality to feel reluctant to create a new budget. Besides, since it is a form of non-obligatory budget, self-government units do not want to take on additional work. As long as the rules are not changed and the task budget is not mandatory in municipalities, despite the many benefits of its implementation, self-government units will take conservative action in budgeting the new system.
Translated and proofreading by Sandra Janet CereolaAccepted for print 3.12.2018

486 Joanna Dynowska, Sandra Janet Cereola
References
AllEn r., toMASSi d. 2001. Managing Public Expenditure. A Reference Book for Transition Countries. OECD, Sigma, Paris.
bęDzieszakM. 2009. Model budżetu zadaniowego samorządów w świetle badań. In: Finanse 2009. Teoria i praktyka. Finanse publiczne. II. Eds. B. Filipiak, B. Walczak. Zeszyty Naukowe Uniwersytetu Szczecińskiego, 547, Ekonomiczne Problemy Usług, 37.
BiElAwSki R. 2013. Budżet zadaniowy– nowa koncepcja w finansach publicznych gminy. Studia i Materiały „Miscellanea Oeconomicae”, 2: 199.
Budżet jako narzędzie zarządzania w administracji samorządowej, czyli jak osiągać cele przy ekonomicznym wykorzystaniu zasobów. 2000. Ed. K. Pakoński. In: Zintegrowane zarządzanie finansami. T. 3. Municipium, Warszawa.
Budżet władz lokalnych. 2002. Ed. S. Owsiak. PWE, Warszawa. Budżet zadaniowy w Polsce. Reorientacja z wydatkowania na zarządzanie pieniędzmi publicznymi
2007. Eds. T. Lubińska. Difin, Warszawa.chojnA-duch E. 2006. Polskie prawo finansowe. Finanse publiczne. Wydawnictwo Prawnicze
LexisNexis, WarszawaerkutluH.V.,taNcs.g.,koçyiğits.c. 2017. The Factors Used to Create Performance-Based
Budgeting: A Research on Turkey. In: Accounting and Corporate Reporting, Today and Tomor-row. Intech, Croatia.
filiPiAk B. 2011. Efektywność w zarządzaniu finansami samorządowymi. Skutek kryzysu czy obiektywna konieczność? Zeszyty Naukowe Polskiego Towarzystwa Ekonomicznego, 10.
GilMour j.B., lEwiS d.E. 2006.. Does Performance Budgeting Work? An Examination of the Office of Management and Budget’s PART Scores. Public Administration Review, September/October, p. 742.
joycE P.G. 1999. Performance-Based Budgeting. In: Handbook of Government Budgeting. Ed. T.R. Meyers. Jossey-Bass, San Francisco, p. 597–619.
kAczurAk-kozAk M. 2013. Wdrażanie i konstrukcja budżetu zadaniowego w Polsce. Państwowa Wyższa Szkoła Zawodowa w Sulechowie, Studia Lubuskie, IX.
kArgol-wASiluk A., wojEwódko E. 2016. Budżet zadaniowy jako narzędzie poprawy jakości rządzenia (na przykładzie Podlaskiego Urzędu Wojewódzkiego). Optimum. Studia Ekonomiczne, 2(86).
lEwiS V. 1952. Toward a Theory of Budgeting. Public Administration Review, 12(1). ModzElEwSki P. 2014. Kontrola zarządcza w jednostkach sektora publicznego w zakresie po-
miaru skuteczności i efektywności. In: Bezpieczeństwo ‒ efektywność ‒ budżet zadaniowy. Eds. P. Sienkiewicz, H. Świeboda. Akademia Obrony Narodowej, Warszawa.
Pakoński K. 2001. Zintegrowane zarządzanie finansami zorientowane na cele. In: Zintegrowane zarządzanie finansami. T. 3. Municipium, Warszawa.
roBinSon M. 2007. Performance Budgeting Models and Mechanisms. In: Performance Budgeting. Linking Funding and Results. Ed. M. Robinson. International Monetary Fund, New York.
Samorząd terytorialny w Polsce. 2014. Eds. E. Wojciechowski. Instytut Diagnoz i Analiz Społecz-nych, Łódź.
Schick A. 2007. Performance Budgeting and Accrual Budgeting: Decision Rules or Analytic Tools? OECD Journal on Budgeting, 7(2).
SiErAk J. 2011. Budżet zadaniowy jako narzędzie wzrostu efektywności gospodarowania finansami w jednostkach samorządu terytorialnego. Studia i Prace Kolegium Zarządzania, 107.
szołNo O. 2014. Uwarunkowania efektywnego funkcjonowania budżetowania w jednostkach sa-morządu terytorialnego. In: Rachunkowość a controlling. Eds. E. Nowak, M. Nieplowicz. Prace Naukowe Uniwersytetu Wrocławskiego we Wrocławiu, 344: 504.
Ustawa z 27 sierpnia 2009 r. o finansach publicznych, Dz.U. z 2009 r., nr 157, poz. 1240 ze zm.wEBEr M. 2011. Budżet zadaniowy w gminach. Rzeczpospolita. Prawo, Samorząd, Finanse. http://
www.rp.pl/artykul/716743-Budzet-zadaniowy-w-gminach.html#ap-1 (access 14.05.2017).

OLSZTYN ECONOMIC JOURNAL2018, 13(4), 487–498
TRUST MEASUREMENT IN AN ENTERPRISE. A CONCEPTUAL APPROACH
Adam RudzewiczDepartment of Market Analysis and Marketing
Faculty of Economic Sciences University of Warmia and Mazury in Olsztyn
e-mail: [email protected] ORCID 0000-0002-7807-9375
K e y w o r d s: trust, enterprise, stakeholders, measurement model.
A b s t r a c t
This paper presents the meaning of trust in the operation of enterprises and presents three original research tools to measure three areas of trust (internal, inter-organizational and consumer), which the author uses to form a complete construction of trust at the enterprise level.
Measurement assumptions are based on literature studies. The proposed division trust into three areas is justified by the fact that the process of trust development involves various entities and different factors determine specific areas of trust. The author tried to organize and demon-strate the most relevant contemporary dimensions of trust, including employee care, concern for stakeholders, competence, reliability, honesty and openness. The diagnosed dimensions of trust at the general level were then developed into an operational and measurement form, which should best describe the proposed areas of trust.
In the process of measurement of trust within the classification proposed was assessed and ap-propriate research medel were developed. Examples of empirical allowed to determine the usefulness of the proposed measurement tools. The research tools used for this purpose are comprehensible and suitable for management practice, they do not oversimplify reality. The concept of systemic trust analysis satisfies the reliability criterion and it can be hoped that it reflects, to the highest possible degree, the reality in which enterprises operate.
POMIAR ZAUFANIA W PRZEDSIĘBIORSTWIE. PODEJŚCIE KONCEPCYJNE
Adam RudzewiczKatedra Analizy Rynku i Marketingu
Wydział Nauk EkonomicznychUniwersytet Warmińsko-Mazurski w Olsztynie
S ł o w a k l u c z o w e: zaufanie, przedsiębiorstwo, interesariusze, model pomiarowy.

488 Adam Rudzewicz
A b s t r a k t
Celem artykułu jest przybliżenie znaczenia zaufania w funkcjonowaniu przedsiębiorstwa, a następnie przedstawienie trzech autorskich narzędzi badawczych zastosowanych do pomiaru zaufania wewnętrznego, międzyorganizacyjnego i konsumenckiego, które w zamierzeniu autora tworzą kompletny konstrukt zaufania na poziomie przedsiębiorstwa.
Założenia pomiarowe oparto na studiach literaturowych. Zaproponowany podział na trzy obszary był zasadny, ponieważ różne podmioty biorą udział w procesie kształtowania zaufania i inne czynniki determinują określony obszar zaufania. Autor starał się uporządkować i wykazać najbardziej istotne współcześnie wymiary zaufania, zaliczając do nich troskę o pracowników, tro-skę o interesariuszy, kompetencje, niezawodność, uczciwość i otwartość. Zdiagnozowano wymiary zaufania na poziomie ogólnym, a następnie rozwinięto je do postaci operacyjnej i pomiarowej, które powinny jak najlepiej opisywać zaproponowane obszary zaufania.
Podczas pomiaru zaufania w ramach zaproponowanego podziału opracowano odpowiedni model badawczy. W celu określenia jego przydatności przeprowadzono badania empiryczne, które pozwoliły na określenie przydatności zaproponowanych narzędzi pomiarowych. Narzędzia badawcze, które w tym celu wykorzystano, są zrozumiałe i możliwe do zastosowania w praktyce zarządzania, nie upraszczają nadmiernie rzeczywistości. Koncepcja systemowej analizy zaufania spełnia kryterium wiarygodności i można mieć nadzieję, że odzwierciedla w jak największym stopniu rzeczywistość, w jakiej funkcjonuje przedsiębiorstwo.
Introduction
In 2009, the President of the United States, Barack Obama, declared that Americans suffered from a lack of trust towards public organizations and pri-vate institutions. This is not only a problem of Americans. In the last decade, a deficit of trust has had a negative effect on economic and social development all over the world. Numerous studies have documented the lack of trust among the public towards contemporary organizations and their leaders (krAMEr, lEwicki 2010, p. 246)
Trust is a highly complex process, depending on various non-binding elements which occur in contacts between enterprises and in relations between the enter-prise and the customer. Enterprises, in their everyday activities, should avoid a lack of transparency, anonymity, casualness, excessive avarice, demanding advance payments from customers, tax frauds, financial pyramids, insurance frauds, aggressive loan offers or unfair and misleading advertisement (SztoMPkA 2008, p. 238, 239, Mróz 2009, p. 488).
The aim of this paper is to present the meaning of trust in the operation of enterprises, followed by the presentation of three original research tools ap-plied for the measurement of internal, intra-organizational and consumer trust which, in the author’s concept, form a complete construction of trust. Measure-ment assumptions have been based on literature studies in the field of sociology, economics and management sciences. In the next stage, the theoretical concept is verified through empirical studies and the obtained results are statistically analysed to enable verification of the usefulness of the proposed research tools.

Trust Measurement in an Enterprise. A Conceptual Approach 489
In the existing literature of the subject matter trust is analysed only par-tially. A gap in the area of complex and systemic approach to trust in company was noticed, which must be completed.
The nature of trust and its constituents at the enterprise level
Trust is a central point of all market relations. Customer trust towards a given company, its products and employees, leads to the profitability of the company and supports its existence in the market (kozłoWski et al. 2014, p. 177–179). This was confirmed by empirical studies (hEjduk et al. 2009, p. 59, 60). Polish enterprises in various market sectors were quite consistent in their opin-ions, since even 80% of respondents believe that trust in the environment to-wards the market leader is important or very important, and 77% respondents attribute the same importance to the trust inside an organization.
Mutual support of the parties and sharing necessary information are very important elements of trust. This allows a more reliable and fuller integration between partners, which brings them closer to shared values (BroniEwSkA 2012, p. 71–84), as well as convergent aims and visions. Trust builds the reputation of the enterprise, brings about competitive advantage and attracts investors, customers and employees. A higher level of trust ensures many other advantages as well (dyEr, chu 2003, p.60,zygaN2014,p.49–53,Dobiegała-koroNa2007, p. 19, gryczkA 2013, p. 85–97):
– reducing transaction costs,– supporting innovation,– enhancing competitiveness,– improving customer satisfaction,– increasing customer loyalty.Trust as an intangible phenomenon requires more operational, measurable
dimensions. Researchers (żąDło2014,p. 82–84, SAnkowSkA 2011, p. 39, 40, clAro, clAro 2008, p. 291, 192, SEPPänEn et al. 2007, p.249–265,bugDol2010, p. 23–30) attempting to describe attributes (dimensions) of trust, most often use such notions as: competence, honesty and benevolence. Very frequently, trust is earned through expert knowledge, ensuring safety, openness and honest intentions. Currently, the main focus as regards the shaping of trust is put on such factors as reputation, reliability and shared social values, demonstrated in the concern for employees and customers (rudzEwicz 2016, p. 36–38). On the basis of the quoted literature, four basic elements of trust can be distin-guished, shown in Figure 1.
These four dimensions of trust should be placed in the appropriate area of the company’s operation and then subjected to reliable measurement.

490 Adam Rudzewicz
Fig. 1. Basic dimension of trustSource: own elaboration.
A model approach to trust measurement in the enterprise
The company is a complex system, with all elements of its market operations related to trust. An enterprise should develop positive relations with its employ-ees, customers, suppliers and vendors. Trust occurs in all those aspects (Fig. 2):
– internal relations concerning employees of a given organization,– external relations focused on individual customers, and– external relations concerning other entities and companies cooperating with
a given organization. This can include suppliers, vendors and the institutional environment.
Fig. 2. Areas of trust in the enterpriseSource: own elaboration
The company is responsible for all its stakeholders (struMińska-kutra 2011, p. 69–83), with which it creates the right relationship. The essence and significance of each of the three relationships (areas of trust) will be described from the point of view of the company and verified by appropriate measuring tools.
The objective of the enterprise is to acquire and to retain employees who identify with the company and who are involved in the implementation of as-sumed objectives. Trust affects the loyalty and efficiency of employees and its absence reduces productivity and turnover of the company (winch 2011, p. 102–113). Trust emerges when the leaders are honest, trustful and keep their

Trust Measurement in an Enterprise. A Conceptual Approach 491
promises (lEVin et al. 2002, p. 8) and do not use their advantage or report-ing line relationship, particularly in a crisis situation (PucEtAitE et al. 2010, p. 320). As a result of that, employees can be sure that they have equal rights, access to information and clear career path. This involves reduction of supervi-sion rate and acceptance of risk. Proper relations inside the organization provide a foundation for developed trust.
In an attempt to operationalize the dimensions of intra-organizational trust, six elements making up trust components were distinguished (Fig. 3). Employ-ees should know the core values of the organization included in its mission and vision, as well as its strategic aims. In addition, the wage and incentive poli-cy (development, career path) should be known to employees and accepted by them. The atmosphere at work (organizational climate) is an important factor in building the culture of trust. An efficient enterprise requires competent employ-ees and managers. All of the above-mentioned measurement areas determine the final element – the internal image of the organization.
Fig. 3. Comprehensive model of trust dimensionsSource: own elaboration
In relations between organizations, trust building is a cyclical process based on negotiation and the involvement of parties. A supplier and a vendor, aiming at achievement of shared benefits, perceive that the success of one entity is con-ditioned by the success of the other (Mitręga 2009, p. 463–474). By combining forces with other stakeholders, partners gain greater bargaining power, they learn each other and complement (cHruPała-PNiak et al. 2016, p. 127–143).

492 Adam Rudzewicz
In this area of inter-organizational trust, the quality of products is impor-tant. What is also worth noting is the possibility to develop future cooperation, which is assured by the adopted development strategy, which is convergent with the expectations of suppliers and vendors. Entities operating in the market should rely on honest and ethical operations carried out by competent employees, which is reflected in the image of the organization, i.e. its real market strength. Business partners will also appreciate the loyalty of their contracting party. The concept concerning the operational measurement of interorganisational trust is presented in Figure. 3.
A significant aspect in the functioning of the enterprise is also consumer trust measurement. The customer is the most valuable asset of the enterprise, gener-ating its income, determining financial liquidity, profitability and, additionally, providing crucial information about his needs and wishes (DobiegałakoroNa 2006, p. 85–95). Customer satisfaction affects the opinion of the company and its products (hinnEr 2016, p. 54–73).
In this area of consumer trust, three dimensions have been distinguished, as presented in Figure 3. These are: image of the organization (or product brand), customer satisfaction and product quality. A positive image of the organization proves its high reliability and honesty. The products offered by the company should demonstrate high quality. This will help meet customer expectations and ensure satisfaction.
The division into three areas proposed in this study is justified by the fact that various entities participate in the process of shaping trust and different factors determine a specific trust area. Therefore, a need exists to adjust trust dimensions to relevant relations between the enterprise and its stakeholders. The measurement dimensions proposed in the model (Fig. 3) are an expansion of basic dimensions of trust at the general level, presented in Figure 1.
Methodological assumptions
In order to verify the concept proposed, it was advisable to carry out three different studies. The studies used three survey questionnaires (referring to three areas of trust). All respondents evaluated a positive aspect of relevant dimensions of trust. Each dimension was determined using the set of perception indicators, i.e. more detailed statements (typically 3–4) on a scale from 1 to 10, where 1 means total disagreement and 10 – total agreement with a given statement.
The basic aim of the first study was to estimate the level of intra-organi-zational trust. The study was carried out in January 2015 among employees of the production and trade company from the food sector. The study used a direct survey questionnaire. The employees were informed about the aim of the study and the process of its conduction. The employees were given a survey, which was later on collected in a manner ensuring full anonymity. The directors had

Trust Measurement in an Enterprise. A Conceptual Approach 493
no access to individual questionnaires. The company employed 40 employees. These were production employees, salesmen, drivers, warehouse workers and three managers. All of them participated in the study.
The basic aim of the second study was to estimate the level of inter-organi-zational trust. The study was carried out in the period between December 2014 and January 2015 among enterprises cooperating with a given entity. The entity in question was a consulting company, specialising in strategic management, business and economic consulting. The study used an online survey question-naire. The link to the survey was sent via e-mail to all partners (customers) of the examined company. The study was completely anonymous. The study involved 43 respondents (completed surveys). The response rate was achieved at the level of 40%. A respondent represented the management of the company providing the answer.
The basic aim of the third study was estimation of consumer trust. The study was conducted from January to March 2015 among young consumers (up to 26 years old) using a survey given to the respondents to be individually completed. The sample was selected using the convenience sampling method (MynArSki 2000, p. 32–34, churchill 2002, p. 497, 498). The survey was anonymous. Respondents evaluated the level of trust towards the brand of the sportswear they used most frequently (Nike, Adidas, Reebok, Puma). In total, 181 persons who correctly and completely filled in the questionnaire participated in the study. Women made up a prevailing number of the respondents (59%). The re-sults were presented as aggregates. Differences in the evaluation of individual brands were noticeable.
The studies identified the perceived reality, opinions and attitudes of re-spondents with regard to the examined phenomenon, in an aggregated and generalized manner. The results obtained are not the essence of this research procedure, but only an illustration of the research concept. The research was based on three different groups of respondents, various entities, with the application of various techniques of gathering information to present the universal nature of the concept proposed. This will be evidence that verifies the effectiveness of the construct developed.
Verification of measurement tools concerning trust
The results of the Cronbach alpha test used for determining the reliabil-ity of measurement tools proposed in the previous section are high. The first measurement tool (intra-organizational trust) reached the reliability indicator of 0.968 (Tab. 1). The reliability indicator of the tool used for measurement of the inter-organizational trust reached a value close to one (0.989). A very high Cronbach alpha indicator at the level of 0.951 was also found for the tool

494 Adam Rudzewicz
applied for measurement of consumer trust. Similarly, the high parameters of the Cronbach alpha index have obtained particular dimensions of trust within the relevant areas.
Table 1Statistical reliability of the trust measurement tool
Trust area Cronbach’s alpha
Number of items(statements
in the questionnaire)Intra-organizational trust 0.968 20
Image of the organizationKnowledge of mission, vision and aims of the organizationCompetence and attitude of the managementCompetence and attitude of employeesAtmosphere at workWage policy and development and career opportunities
0.7930.9290.9520.6850.9470.888
224453
Inter-organizational trust 0.989 18Image of the organizationCompetence and attitude of employeesQuality of products and servicesLoyalty towards partnersStrategy of development
0.9590.9570.9760.9720.965
45333
Consumer trust 0.951 11Image of brand (the organization)Customer satisfactionProduct quality
0.9030.9320.902
344
Source: own elaboration.
Analysing the intra-organizational trust (Tab. 2) it can be observed that a given entity had larger problems with wage policy and employee development opportunities (4.82 points). Other trust dimensions were evaluated at the level of 6 points. The employees slightly higher evaluated the image of the organization (above 7 points). These are the results which, in the opinion of the author, pro-vide a good base for improvement of the reputation of the organization. Despite a low score obtained for wage policy and development and career opportunities, the internal image of the enterprise was quite high. Generally, the trust of em-ployees towards their employer was at the level of 6.12 points.
As regards trust, the examined entity received both the maximum – 10 points and a very low score – 2 points. The divergences in scores are sig-nificant. The standard deviation ranges from 1.52 to 2.64. The median ranges from 5 to 7 points in individual dimensions of trust. The mode was similar, with one exception. The attitude of employees towards wage policy was very critical. The prevailing score was 2 points.

Trust Measurement in an Enterprise. A Conceptual Approach 495
Five dimensions of inter-organizational trust in the analysed case study (Tab. 3) received a high score. All dimensions exceeded the level of 8.5 points. The highest value of the dimension was found for the company development strategy (8.79). Such an evaluation of the examined entity in terms of trust (8.64 points) is advantageous and certainly satisfying, particularly in view of the fact that the observed median and mode are characterized by the maximum score – 10 points. However, it should be emphasized that the research process also revealed respondents who evaluated their contractor in a very critical manner, at the level of 1 point. Therefore, the standard deviation is high, i.e. 2.3–2.5 points.
As regards consumer trust, it should be noted that, based on the example of the investigated market, sportswear brands are ranked very high in the awareness of the surveyed sample. They are evaluated as very good. The obtained scores
Table 2Descriptive statistics of the estimated intra-organizational trust
Trust dimensions Mean Standard deviation Minimum Maximum Median Mode
Image 7.27 1.52 5 10 7 6.5Knowledge of mission, vision and aims of the organization 5.92 2.46 2 10 5 5
Competence and attitude of the management 6.13 2.64 2 10 7 7
Competence and attitude of employees 6.67 1.58 5 10 6.5 6.5
Atmosphere at work 6.06 2.20 2 10 6 5Wage policy and development and career opportunities 4.82 2.19 2 9 5 2
Trust 6.12
Source: own elaboration.
Table 3Descriptive statistics of the evaluated inter-organisational trust
Trust dimensions Mean Standard deviation Minimum Maximum Median Mode
Image 8.67 2.32 1 10 10 10Competence and attitude of employees 8.58 2.33 1 10 10 10
Product quality 8.62 2.49 1 10 10 10Loyalty towards partners 8.54 2.33 1 10 10 10Strategy of development 8.79 2.32 1 10 10 10Trust 8.64
Source: own elaboration.

496 Adam Rudzewicz
for dimensions of consumer trust for brand image and customer satisfaction are close to 9 points (Tab. 4). Slightly lower scores were obtained for the quality of products (probably in relation to their relatively high prices). The respond-ents were quite unanimous in their evaluation. The standard deviation was at the level of 1.16 – 1.38 points only, while for the previously examined areas of trust (intra-organizational and inter-organizational) it was generally well over 2 points. The respondents did not assign scores below 5 points for any of the trust dimensions. High scores can be seen also when examining the median or the mode, which generally amounted to 9 or 10 points.
The research conducted aimed at verifying the usefulness of the proposed tools derived from the research concept presented. The research tools used for this purpose are, on one hand, comprehensible and suitable for management practice while, on the other, they do not oversimplify reality. The concept of systemic trust analysis satisfies the reliability criterion and it can be hoped that it reflects, to the highest possible degree, the reality in which enterprises operate.
Summary
An increase in the importance of trust results from mutual, complex rela-tionships, which concern each contemporary organization. Managers should make every effort to understand the nature and the essence of trust, to be able to develop it in a competent manner and prevent its loss. The process is more efficient if the enterprise demonstrates such features as competence and relia-bility, honesty, openness and concern for (internal and external) stakeholders.
This paper proposes a concept facilitating trust measurement in a comprehen-sive manner from the perspective of the enterprise. In view of the complex and multifaceted nature of trust, the research approach was based on three pillars: employees, consumers and business partners. The division into three areas, as proposed in the study, is justified by the fact that various entities participate in the process of shaping trust and different factors determine specific trust areas.
Table 4Descriptive statistics of the evaluated consumer trust
Trust dimensions Mean Standard deviation Minimum Maximum Median Mode
Brand image 8.98 1.19 5 10 9 10Customer satisfaction 8.81 1.16 5 10 9 10Product quality 8.23 1.38 5 10 8 9Trust 8.63
Source: own elaboration.

Trust Measurement in an Enterprise. A Conceptual Approach 497
The proposed measurement dimensions satisfy reliability requirements. The studies carried out with the application of suggested dimensions make it possible to formulate relevant conclusions and to take appropriate managerial decisions. Managers using the tools to measure trust in a comprehensive manner, referring to the majority of stakeholders, may have knowledge that, if properly used, will improve the competitiveness and market position of enterprises.
In future, the tools developed can be used on larger research samples and the obtained results could be compared with the economic results achieved by enterprises, such as income, profits and customer loyalty.
A significant limitation of the presented research concept is its modest ver-ification on one-off and small research trials. It is based mainly on enterprises, that is commercial entities cooperating with many partners and consumers. It should also be noted that the service sector has been omitted from the analyzes.
Translated by biurotłuMaczeńoscarProofreading by MArk jEnSEn
Accepted for print 3.12.2018
References
BroniEwSkA M.j. 2012. Społeczna odpowiedzialność i zaufanie podstawą strategicznej współpracy międzysektorowej. Management and Business Administration, Central Europe, 21(1): 71–84. DOI: 10.7206/mba.ce.2084-3356.47.
Bugdol M. 2010. Wymiary i problemy zarządzania organizacja opartą na zaufaniu. Wydawnictwo Uniwersytetu Jagiellońskiego, Kraków.
cHruPała-PNiakM.,graboWskiD.,suliMoWska-ForMoWiczM. 2016. The value of trust in inter-organizational relations. Economics and Business Review, 2(16): 127–143. DOI: 10.18559/ebr.2016.2.8.
churchill g.A. 2002. Badania marketingowe. Podstawy metodologiczne. Wydawnictwo Naukowe PWN, Warszawa.
clAro d.P., clAro P.B.o. 2008. Managing trust relationships. Calculative, affective, belief and performance. Brazilian Administration Rewiew, Curitiba, 5(4): 291–292. http://dx.doi.org/10.1590/S1807-76922008000400004.
Dobiegała-koroNab. 2006. Klient kapitałem przedsiębiorstwa. In: Współczesne źródła wartości przedsiębiorstwa. Eds. B. Dobiegała-Korona, A. Herman. Difin, Warszawa.
Dobiegała-koroNab. 2007. Zaufanie klienta. Kwartalnik Nauk o Przedsiębiorstwie, 2: 19.dyEr j.h., chu w. 2003. The role of trustworthiness in reducing transaction costs and improving
performance. Organization Science, 14: 60.gryczkA M. 2013. Imperatyw zaufania i współpracy w procesie budowania otwartego ekosystemu
wiedzy w Polsce. Management and Business Administration, Central Europe, 21(1): 85–97. DOI: 10.7206/mba.ce.2084-3356.48.
HeJDuki.k.,gruDzeWskiW.M.,saNkoWskaa.,WańtucHoWiczM. 2009. Znaczenie zaufania i zarządzania zaufaniem w opinii przedsiębiorstw. E-mentor, 5: 59–60.
hinnEr M.B. 2016. Relationships and trust in perceiving price fairness: an exploratory study. Economics and Business Review, 2(16): 54–73. DOI: 10.18559/ebr.2016.2.4.
kozłoWskiW.,MicHalakJ.,ruDzeWicza.,WarzocHaz. 2014. Produkt i promocja w proble-matyce marketingowej. Wydawnictwo UWM w Olsztynie, Olsztyn.

498 Adam Rudzewicz
krAMEr r.M., lEwicki r.j. 2010. Repairing and enhancing trust. Approaches to reducing orga-nizational trust deficits. The Academy of Management Annals, 4(1): 246. http://dx.doi.org/10.1080/19416520.2010.487403.
lEVin d.z., croSS r., ABrAMS l.c., lESSEr E.l. 2002. Trust and knowledge sharing: A criti-cal combination. IBM Institute for Knowledge – Based Organizations. www.researchgate.net (access: 11.02.2017).
MitręgaM. 2009. Zależność i zaufanie w relacjach na rynku B2B. In: Kontrowersje wokół marke-tingu w Polsce. Niepewność i zaufanie a zachowania nabywców. Eds. L. Garbarski, J. Tkaczyk. WAiP, Warszawa.
Mróz B. 2009. Zaufanie w relacjach firma – konsument. Uwarunkowania i dylematy. In: Kon-trowersje wokół marketingu w Polsce. Niepewność i zaufanie a zachowania nabywców. Eds. L. Garbarski, J. Tkaczyk. WAiP, Warszawa.
MynArSki S. 2000. Praktyczne metody analizy danych rynkowych i marketingowych. Kantor Wydawniczy Zakamycze, Zakamycze, p. 32–34.
PucEtAitE r., lAMSA A.M., noVElSkAitE A. 2010. Organizations which have the strongest po-tential for high-level organizational trust in a low-trust societal context. Transformation in Business & Economics, 9(2): 320.
rudzEwicz A. 2016. Zaufanie w przedsiębiorstwie. Uwarunkowania – relacje – pomiar. Wydaw-nictwo UWM w Olsztynie, Olsztyn.
SAnkowSkA A. 2011. Wpływ zaufania na zarządzanie przedsiębiorstwem: perspektywa wewnątrz- organizacyjna. Difin, Warszawa.
SEPPänEn r., BloMQViSt k., SundQViSt S. 2007. Measuring inter–organizational trust – a critical review of the empirical research in 1990–2003. Industrial Marketing Management, 36: 249–265. https://doi.org/10.1016/j.indmarman.2005.09.003.
struMińska-kutra M. 2011. Przedsiębiorstwo – przedmiot czy podmiot odpowiedzialności? Instytucjonalne uwarunkowania CSR. Master of Business Administration, 4(111): 69–83.
SztoMPkA P. 2008. Odbudować piramidę. Polityka, 2677 (25.10.2008): 38–39.winch S. 2011. Kulturowe uwarunkowania przywództwa w przedsiębiorstwie – wyniki badań.
Master of Business Administration, 3: 102–113.zygAn M. 2014. Zaufanie a koszty transakcyjne. Kwartalnik Nauk o Przedsiębiorstwie, 1: 49–53. żąDłok. 2014. O wartości zaufania. Komunikacja i budowa zaufania a rynkowa wartość przed-
siębiorstwa. Wydawnictwo Poltext, Warszawa.

“OLSZTYN ECONOMIC JOURNAL”GENERAL INFORMATION
The “Olsztyn Economic Journal” (ISSN 1897–2721) is a scientific journal, published in English by the Faculty of Economic Sciences of the University of Warmia and Mazury in Olsztyn. It publishes scientific papers of me-thodical, review and empirical nature in economic sciences. During the years 2007–2012 the journal was published semi-annually and from 2013 is published quarterly. The “Olsztyn Economic Journal” is published by the Univer-sity of Warmia and Mazury in Olsztyn Publishing House. The print edition is the primary version of the Journal. All numbers of the magazine are available in the electronic format on the websites: http://www.uwm.edu.pl/wne/olsztyn-economic-journal, http://wydawnictwo.uwm.edu.pl (subpage Czytelnia).
„Olsztyn Economic Journal” is indexed in the following reference databases: BazEcon, BazHum, Index Coper-nicus Master List (ICV in 2016 74.51 pts), The Central European Journal of Social Sciences Humanities (CEJSH), Central and Eastern European Online Library (CEEOL), POL-index, RePEc.
Since 4th July 2018 „Olsztyn Economic Journal” has been on the Italian, ministerial list of scientific journals prepared by National Agency for the Evaluation of Universities and Research Institutes (Italian name: Agenzia Nazionale di Valutazione del sistema Universitario e della Ricerca − ANVUR).
PUBLICATION PROCEDURE Polish authors submit articles in Polish and in English. In order to ensure high quality of lin-
guistic editing of the journal, the article should be verified by native English speaker(s). The costs of translating/verifying the article are borne by the Authors. Foreign authors submit articles in English. Additionally, the title, key words and abstract of the article should be submitted in Polish.
Articles should be submitted to the editorial board either via e-mail ([email protected]) or snail mail, to the following address:
“Olsztyn Economic Journal”University of Warmia and Mazury in Olsztyn
Faculty of Economic Sciences Department of Social Policy and Insurance
M. Oczapowskiego 4 Street 10-719 Olsztyn, POLAND
Articles are subject to formal evaluation, initial evaluation by the editor-in-chief and associate editors, and then to evaluation by external reviewers and the statistical editor. The formal evaluation is made by the editorial secretary and refers, among other things, to: the length of the article, the in-clusion of the title, abstract and key words (in Polish and English) and correctly formatted bibliography. Articles which do not meet the guidelines are sent back to Authors for revision. Articles which meet the guidelines are subject to evaluation by the editor-in-chief and associate editors, who assess its sci-entific character and relevance to the thematic scope of the journal. After a positive internal evaluation articles are submitted to the evaluation by external reviewers, who are appointed by the editor-in-chief.
The reviewing procedure: 1) At least two independent reviewers from research institutions other than the one with which
the Author is affiliated are appointed to evaluate each article. 2) At least one of the reviewers is affiliated in an foreign institution other than the Author’s nationality. 3) The Author or Authors do not know the identities of the reviewers and vice versa (double-blind
review process). As regards the relations between the author and the reviewer, there is no: a) direct personal relationship (kinship, legal ties, conflict), b) professional supervisor-subordinate relation, c) direct scientific collaboration in the course of the last two years preceding the preparation
of the review. 4) The editorial board follows procedures preventing ghostwriting and guest authorship. Detailed
description of the procedures can be found on the website. 5) The reviewer is obliged to abide by the copyrights. In the case of detecting copyright infringement
by the Author, the reviewer is obliged to report it to the editorial board of the journal. 6) The reviewer is required to keep confidential all details of the article as well as the peer review
process. 7) The review is submitted in the written form and ends with a clear statement as to whether
the article is accepted for publication or rejected. 8) Only articles which have two positive reviews are submitted for printing. If one of the reviews is
negative, the article is submitted for evaluation to a third reviewer. 9) The review form is available on the website. 10) Names of the reviewers for individual issues of the journal are available in the current issue and
on the website.

After receiving two positive reviews and taking into considerations the reviewers’ corrections and recommendations the Author revises the article and submits to the editorial board the following:a) the final version of the article in English, together with the title, key words and abstract in Polish
and English (saved on CD or sent via e-mail to [email protected]),b) responses to reviews,c) the Author’s statement (the relevant form can be found on the website),d) information about the name and last name of the translator and the native speaker,e) consent for the processing of common personal data (the relevant form can be found on the website).
The final version of the article submitted by the author will be verified by the statistical editor.
SUBMISSION GUIDELINESManuscripts submitted to “Olsztyn Economic Journal” should be prepared in accordance with the
guidelines of the editorial board. At the top of the first page of the article the following header should be placed:
OLSZTYN ECONOMIC JOURNALUnderneath should be provided as well as:
– the title of the article,– the author’s first name and last name,– name of the research institution represented by the author (department, faculty, university),– author’s ORCID (Open Researcher and Contributor ID) number, – author’s e-mail address.
Key words should also be provided (not more than 5) as well as abstract (up to 0,5 page), which should include information about the objective, subject, methodology and results of the study.
All this information should be provided first in English and then in Polish (sample first page can be found on the website).
Each article should have the following distinct sections:– introduction with a clearly formulated objective,– description of the research methodology,– description and interpretation of the research results,– summary or conclusions, – bibliography.
The length of the article, including the abstract, should not exceed 12 pages of the printed text.
FORMATTING THE TEXT– Word (format doc.), use Times New Roman font, 12 pts, indentation 0,7 cm, line spacing 1,5, right
margin – 3 cm, other margins – 2,5 cm, text justified;– Intertitles centred, bold;– In-text references to bibliographic entries should be written in parentheses:
a) if work by one or two authors is cited: last name(s) of the author(s) (in small caps), year of publica-tion and page numbers, e.g. (PortEr 1998, p. 143) or […] according to PortEr (1998, p. 143) […],
b) if work by three or more authors is cited: the first author’s last name (small caps) followed by et al., year of publication and page numbers, e.g., (AdAMowicz et al. 2008, p. 12),
c) if more than one work by the same author(s) from the same year is cited, use the suffixes “a”, “b”, “c”, etc., to differentiate them, e.g. (PortEr 1998a, p. 143),
d) if the in-text reference is made to collected volumes, reports or analyses, instead of the author’s last name a full or shortened title of the work is provided (in italics), the year of publication and page numbers, e.g. (European Pork Chains 2009, p. 27, 29), (Informacja w sprawie zatrudnienia… 2011, p. 5–10),
e) references to legal acts: with the first reference full title of the legal act should be provided, to-gether with the description of the Journal of Laws or Polish Monitor, and the shortened version of the title, which will be used further on, e.g. (Ustawa z 27 sierpnia 2009 r. o finansach publicznych, Journal of Laws of 2009, no 157, item 1240, from now on referred to as: ustawa o finansach); the titles of Polish acts should not be translated into English,
f) references to electronic and Internet sources in accordance with the rules described in point a) to e). If the electronic and Internet sources has no author and title, in parentheses should give the name of the website or database and year of publication, update or access, e.g. (Local Data Bank 2016);
– Explanatory footnotes, font 10 pts, paragraph indentation 0,7 cm, single spacing, justified; footnote numbering in superscript, using Arabic numerals;
– Continuous page numbering.
BIBLIOGRAPHY– bibliography should be prepared using the Harvard system;– font size 10 pts, the first lines of each bibliographic entry should not be indented, while the second
and the consecutive lines should be indented 0,7 cm; – sources should be arranged in alphabetical order (without numbering); – if in the given year more than work by the same author was published, suffixes “a”, “b”, “c”, etc.,
should be used to differentiate them;– works by one author should be arranged chronologically (from the oldest to the most recent ones);– description of monograph: last name and initial(s) of the name (s) of the author(s), (small caps), year
of publication, title (italics), publisher and place of publication, e.g.: AdAMowicz E., dudEk S., PAchucki, d., wAlczyk k. 2008. Synchronizacja cyklu koniunkturalnego
polskiej gospodarki z krajami strefy euro w kontekście struktury tych gospodarek. Wydawnictwo IRG SGH, Warszawa.
PortEr M. E. 1999. On Competition. Harvard Business School Press, Boston.– description of a collected volume: title (in italics), year of publication, abbreviations Ed./Eds., initial(s)
of the name and last name of editor(s), publisher and place of publication, e.g.: Analiza ekonomiczna w przedsiębiorstwie. 2013. Ed. M. Jerzemowska. PWE, Warszawa. European Pork Chains. 2009. Eds. J. Trienekens, B. Pelersen, N. Wognum, D. Brinkmann. Wagenigen
Academic Publishers, Wagenigen.– description of a chapter in a monograph: last names and initial(s) of the first name(s) of the author(s)
of the chapter (small caps), year of publication, title of the chapter (italics), abbreviation In: title of the monograph (in italics), initials of the first name(s) and last names of author(s) of monographs or editor(s) of collected volumes, publisher and the place of publication, e.g.:
klEinMAn M. 2003. The Economic Impact of Labour Migration. In: The Politics of Migration. Managing Opportunity, Conflict and Change. Ed. S. Spencer. Blackwell Publishing, Malden.
kwiAtkowSki E. 2013. Metodologiczne problemy analizy makroekonomicznych skutków emigracji ludności. Przypadek Polski. In: Powroty z migracji wobec sytuacji na rynku pracy w Polsce. A. Orga-niściak-Krzykowska, E. Kwiatkowski, J. Machnis-Walasek, A. Krajewska, K. Piłat, S. Pieńkowska--Kamieniecka. Wydawnictwo UWM, Olsztyn.
– description of an article in a research journal: initial(s) of the name and last name of the author(s) (small caps), year of publication, title of the article (in italics), title of the journal, volume (number): article pages, DOI (Digital Object Identifier) number, e.g.:
orgaNiŚciak-krzykoWskaa.2017. The Determinants and the Size of International Migration in Central and Eastern Europe After 2004. Comparative Economic Research, 20(4): 159–178, doi: 10.1515/cer-2017-0033.
StEAd d. 2014. European Integration and Spatial Rescaling in the Baltic Region: Soft Spaces, Soft Plan-ning and Soft Security. European Planning Studies, 22(4): 680–693, doi: 10.1080/09654313.2013.772731.
– description of electronic and Internet sources (documents):a) description of a book on CD or a chapter from a book should be the same as in the paper version,
indicating the type of electronic carrier, e.g.: koPaliński W. 1998. Słownik wyrazów obcych i zwrotów obcojęzycznych. PRO-media CD, Łódź
[CD-ROM].b) article in electronic journal: author’s last name and first name initial (small caps), year of pub-
lication, title of the article (in italics), title of the journal, volume (number): article pages (if they are specified), DOI or online address, date of access, e.g.:
kozAk S., ochnio E. 2016. Did the financial crisis impact the level of investment efficiency of equity investment funds in Poland? EJPAU, 19(2), http://www.ejpau.media.pl/volume19/issue2/art-03.html (access: 3.02.2016).
c) Internet sources (documents) including from Eurostat or GUS: title of the source (documents), date of publication, name of the portal, online address, date of access, e.g.:
Aktywność ekonomiczna ludności Polski w latach 2010-2012. 2014. Główny Urząd Statystyczny, http://stat.gov.pl/download/gfx/portalinformacyjny/pl/defaultaktualnosci/5475/5/3/5/pw_aktyw-nosc_ekonomiczna_ludnosci_2010-2012.pdf (access: 3.02.2016).
Population on 1 January by five years age group, sex and NUTS 2 region. 2016. Eurostat, http://appsso.eurostat.ec.europa.eu/nui/show.do?dataset=demo_r_pjangroup&lang=en (access: 19.09.2016).
– description of reports, analyses, legal acts: Informacja w sprawie zatrudnienia obywateli polskich w państwach Europejskiego Obszaru Gospo-
darczego i Szwajcarii oraz obywateli państw EOG w Polsce. 2011. Ministerstwo Pracy i Polityki Społecznej, Warszawa.
Ustawa z 20 kwietnia 2004 r. o promocji zatrudnienia i instytucjach rynku pracy, Journal of Laws of 2004, no 99, item 1001.
– description of unpublished works: wiErzEjSki t. 2010. Makroekonomiczne determinanty internacjonalizacji sektora rolno-spożywczego
w Polsce. UWM w Olsztynie (doctoral thesis).
ADJUSTMENT OF THE BIBLIOGRAPHY TO DOI SYSTEMAs the articles published in “Olsztyn Economic Journal” has DOI number (which influences pos-
itively the citation of the articles) the authors are obliged to prepare their bibliography in a form that fulfil the criteria of the DOI system.
The authors must check all the articles that are included in the bibliography of the submitted paper whether the articles have DOI numbers. To check it, go to the website: http://www.crossref.org/guestquery/.
When a given article has the DOI number it should be added in the bibliography as follows: BErnAnkE. B., BoiVin j. 2010. Monetary policy in a data-rich environment. Journal of Monetary Eco-
nomics, 50(3): 525546, doi: 10.1016/S0304-3932(03)00024-2.wiErzBickA w. 2018. Information infrastructure as a pillar of the knowledge-based economy − an
analysis of regional differentiation in Poland. EQUILIBRIUM Quarterly Journal of Economics and Economic Policy, 13(1): 123–139, doi: 10.24136/eq.2018.007.
We also ask authors to include in the bibliography articles from previous issues of the “Olsztyn Economic Journal” on a similar topic and articles from Web of Science Database (minimum 3).
TABLES AND FIGURESTables and figures should be numbered using Arabic numerals. References to figures and tables
in the text should be made in the 1 to n sequence (in accordance with the numbering). Do not use the terms in the table/in the figure below/above.
Tables should be marked using:– number (e.g., Table 1) – written to the right, over the table, font size 10 pts,– title – placed over the table, centred, font size 10 pts, – source – written underneath the table, font size 10 pts, in the form of a bibliographic reference, e.g.: Source: PortEr (1998, p. 143); European Pork Chains (2009, p. 27, 29). Or if the table was elaborated by the author: Source: own elaboration on the basis of PortEr (1998, p. 143), European Pork Chains (2009, p. 27).
Illustrations, charts, maps, diagrams, etc., which are captioned as “Figures” should be marked using:– number (e.g., Fig. 1.) – placed underneath the figure, font size 10 pts,– title – placed after the number of the drawing, centred, font size 10 pts,– source – provided underneath the caption of the figure (analogously to the sources underneath tables),
font size 1 pts. Figures should be prepared using software working in the Windows environment (e.g., Excel,
Corel Draw). Figures prepared using other specialist software should be saved in the Windows Metafile format (.wmf), which allows importing to Corel.
Mathematical formulas should be written using the formula editor for MS Word. They can be numbered (using Arabic numerals in parentheses, to the right, alongside the formula) and they have to be editable. All variables have to be explained underneath the formula, indicating which letter-based symbols are supposed to be normal, italicized or bold. Reference to a specific formula in the main body of the text should be made by placing the number of the formula in parentheses. Units of measurement should be given according to the international SI system.