old dominion university director’s message hampton roads real … · 2020-03-13 · 1 old...
TRANSCRIPT
1
Old Dominion University Hampton Roads Real Estate
Market Review and Forecast2007
Presented by: E.V. Williams
Center for Real Estate and Economic Development
Director’s Message
John R. Lombard, PhDAssistant Professor, Department of
Urban Studies and Public Administration, College of Business and Public Administration
Director, E. V. Williams Center for Real Estate and Economic Development
A Message from the Dean
Nancy Bagranoff, DBADean, College of Business
& Public Administration, Old Dominion University
Executive CommitteeExecutive Committee
Chair: Joyce HartmanExecutive Director: John LombardVice Chair: Tom DillonPrograms Chair: Stephanie SankerPublications Chair: Brian DundonMembership Chair: Craig CopeCurriculum Co-Chairs: John Crunkleton, Brad SanfordSponsorship Chair: Cliff MooreBy-Laws Chair: Andrew KeeneyPast Chair: William E. KingAt Large: Jonathan Guion
Aubrey Layne
Sponsorship CommitteeSponsorship Committee
Cliff Moore, W.M. JordanBrad Sanford, Dominion Realty AdvisorsLarry Colorito, Axial Advisory Group
Program CommitteeProgram Committee
Stephanie Sanker, GVA AdvantisJoyce Hartman, Sperry Van Ness
Peggy Koch, GVA AdvantisDavid Chapman, Old Dominion University
2
Research Committee
Brian Dundon, Brian J. Dundon & Assoc. John Lombard, PhD, ODU
Beth Hancock, City of ChesapeakeJoy Learn, Resource Bank
Sandi Prestridge, City of NorfolkMaureen Rooks, Thalhimer
Bradley Sanford, Dominion Realty AdvisorsLane Shea, Harbor Group
Kristi Sutphin, City of Portsmouth
Our Proud SponsorsAtlantic Mortgage & Investment
Axial Advisory GroupBank of America
BB&TThe Breeden Company
Burgess & NippleCavalier Land, Inc.CB Richard Ellis
Chesapeake Economic DevelopmentCherry, Bekaert & Holland, LLP
Clancy & TheysClark Nexsen
CMSS ArchitectsCollins Enterprises
Continental Realty Services, Inc.CoStar Group
CREWCreative Office Environments
Davenport - Lefcoe DevelopmentDominion Realty Advisors
Drucker and Falk, LLCEmporia - Greensville Industrial Development Corp.
First American Title Insurance CompanyFirst Potomac Realty Trust
Great Atlantic Management CompanyGVA Advantis
Hampton Economic DevelopmentHarbor Group International
Our Proud SponsorsHayes, Seay, Mattern & Mattern, Inc.
Kaufman & CanolesLandMark Design Group
Laureate Capital Mortgage BankersLiberty Property Trust
McDonald Development CompanyMideastern Builders
The Morgan Real Estate GroupNAI Harvey Lindsay
Nancy Chandler & Associates, RealtorsNewport News Economic Development Authority
Norfolk Economic DevelopmentPortsmouth Economic Development
Resource BankRose and Womble Realty Co.
Runnymede CorporationS.L. Nusbaum Realty Company
Sam Segar & AssociatesSperry Van Ness Commercial Real Estate Advisors
Suffolk Economic DevelopmentSun Trust Real Estate Finance Group
Thalhimer Cushman WakefieldTowne Bank
Tri City Developers, LLCVirginia Beach Economic Development
Vanasse Hangen Brustlin, Inc.Williams Mullen
W.M. Jordan CompanyWall, Einhorn & Chernitzer, P.C.
Wexford Science & Technology, LLC
Special thank you to
Inside Businessfor their sponsorship
over the past five
years.
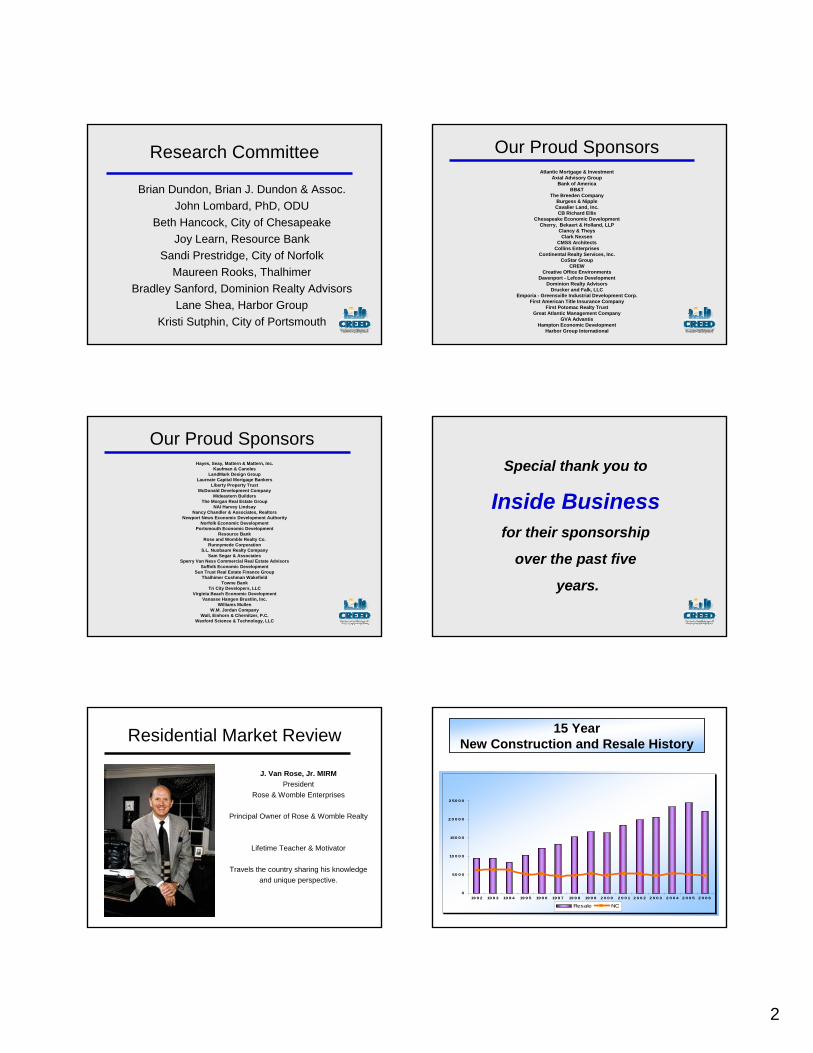
Residential Market Review
J. Van Rose, Jr. MIRMPresident
Rose & Womble Enterprises
Principal Owner of Rose & Womble Realty
Lifetime Teacher & Motivator
Travels the country sharing his knowledge and unique perspective.
15 Year New Construction and Resale History
0
50 0 0
10 0 0 0
150 0 0
2 0 0 0 0
2 50 0 0
19 9 2 19 9 3 19 9 4 19 9 5 19 9 6 19 9 7 19 9 8 19 9 9 2 0 0 0 2 0 0 1 2 0 0 2 2 0 0 3 2 0 0 4 2 0 0 5 2 0 0 6
Resale NC
3
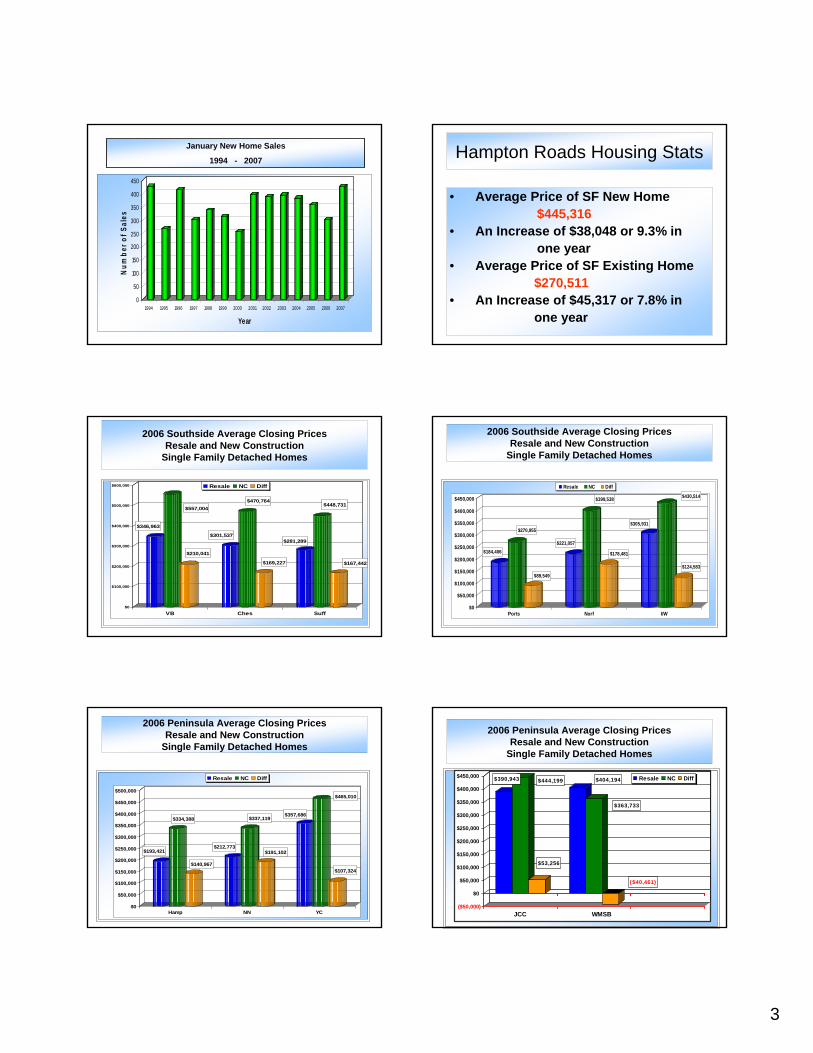
January New Home Sales
1994 - 2007
0
50
100
150
200
250
300
350
400
450
Num
ber o
f Sal
es
1994 1995 1996 1997 1998 1999 2000 2001 2002 2003 2004 2005 2006 2007
Year
Hampton Roads Housing Stats
• Average Price of SF New Home$445,316
• An Increase of $38,048 or 9.3% in one year
• Average Price of SF Existing Home$270,511
• An Increase of $45,317 or 7.8% inone year
$346,963
$557,004
$210,041
$301,537
$470,764
$169,227
$281,289
$448,731
$167,442
$0
$100,000
$200,000
$300,000
$400,000
$500,000
$600,000
VB Ches Suff
Resale NC Diff
2006 Southside Average Closing PricesResale and New Construction
Single Family Detached Homes
$184,406
$270,955
$89,549
$221,057
$399,538
$178,481
$305,931
$430,514
$124,583
$0
$50,000
$100,000
$150,000
$200,000
$250,000
$300,000
$350,000
$400,000
$450,000
Ports Norf I/W
Resale NC Diff
2006 Southside Average Closing PricesResale and New Construction
Single Family Detached Homes
2006 Peninsula Average Closing PricesResale and New Construction
Single Family Detached Homes
$193,421
$334,388
$140,967
$212,773
$337,119
$191,102
$357,686
$465,010
$107,324
$0
$50,000
$100,000
$150,000
$200,000
$250,000
$300,000
$350,000
$400,000
$450,000
$500,000
Hamp NN YC
Resale NC Diff $390,943 $444,199
$53,256
$404,194
$363,733
($40,461)
($50,000)
$0
$50,000
$100,000
$150,000
$200,000
$250,000
$300,000
$350,000
$400,000
$450,000
JCC WMSB
Resale NC Diff
2006 Peninsula Average Closing PricesResale and New Construction
Single Family Detached Homes
4
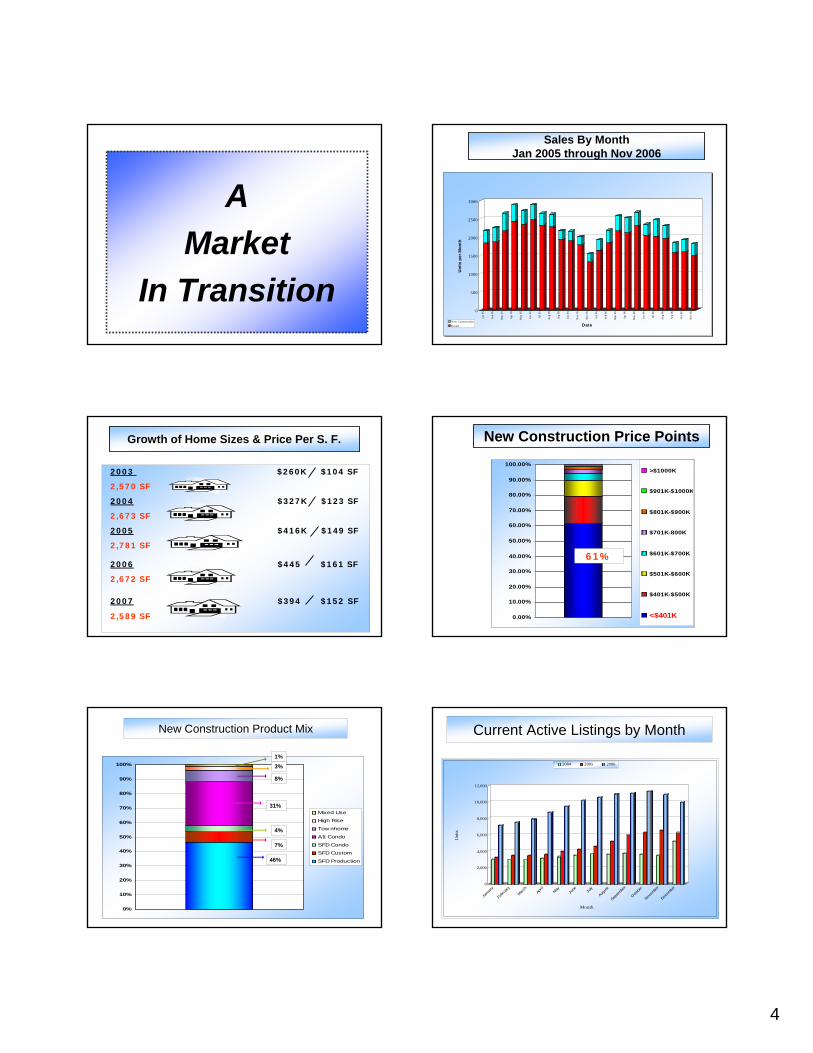
A Market
In Transition
Sales By MonthJan 2005 through Nov 2006
0
500
1000
1500
2000
2500
3000
Uni
ts p
er M
onth
Jan
05
Feb
05
Mar
05
Apr
05
May
05
Jun
05
Jul 0
5
Aug
05
Sep
05
Oct
05
Nov
05
Dec
05
Jan
06
Feb
06
Mar
06
Apr
06
May
06
Jun
06
Jul 0
6
Aug
06
Sep
06
Oct
06
Nov
06
DateNew ConstructionResale
Growth of Home Sizes & Price Per S. F.
2003 $260K $104 SF
2,570 SF
2004 $327K $123 SF
2,673 SF
2005 $416K $149 SF
2,781 SF
2006 $445 $161 SF
2,672 SF
2007 $394 $152 SF
2,589 SF 0.00%
10.00%
20.00%
30.00%
40.00%
50.00%
60.00%
70.00%
80.00%
90.00%
100.00%>$1000K
$901K-$1000K
$801K-$900K
$701K-800K
$601K-$700K
$501K-$600K
$401K-$500K
<$401K
New Construction Price Points
61%
New Construction Product Mix
0%
10%
20%
30%
40%
50%
60%
70%
80%
90%
100%
1
Mixed Use
High Rise
Tow nhome
Att Condo
SFD Condo
SFD Custom
SFD Production46%
7%
4%
31%
8%
3%1%
Current Active Listings by Month
0
2,000
4,000
6,000
8,000
10,000
12,000
Uni
ts
Janu
ary
Februa
ry
March
April
MayJu
ne July
Augus
t
Septem
ber
Octobe
r
Novem
ber
Decem
ber
Month
2004 2005 2006
5
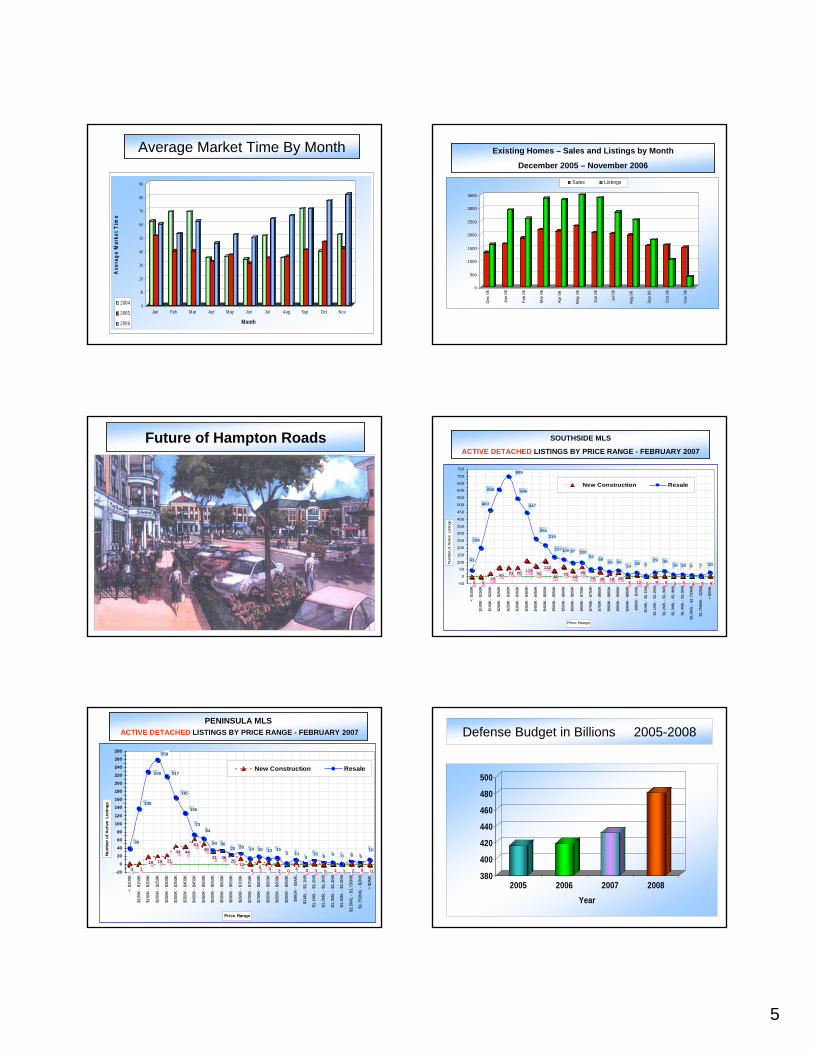
Average Market Time By Month
0
10
20
30
40
50
60
70
80
90
Ave
rage
Mar
ket T
ime
Jan Feb M ar Apr M ay Jun Jul Aug Sep Oct Nov
Month
2004
2005
2006
Existing Homes – Sales and Listings by Month
December 2005 – November 2006
0
500
1000
1500
2000
2500
3000
3500
Dec
05
Jan
06
Feb
06
Mar
06
Apr 0
6
May
06
Jun
06
Jul 0
6
Aug
06
Sep
06
Oct
06
Nov
06
Sales Listings
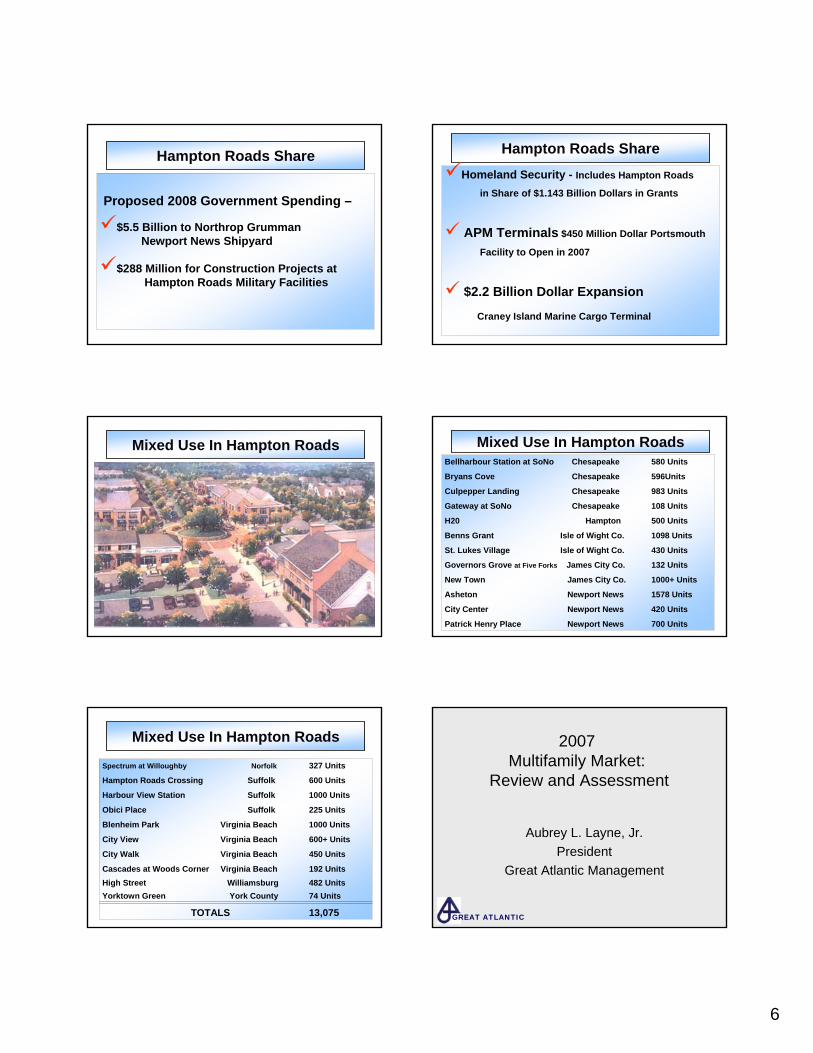
Future of Hampton Roads SOUTHSIDE MLS
ACTIVE DETACHED LISTINGS BY PRICE RANGE - FEBRUARY 2007
0 6644358512429183650
65447044
11276
11360616520
0
43
199
52
307915163929
52814
433359
10097120137
219264
699
608
463 447
545
-50
0
50
100
150
200
250
300
350
400
450
500
550
600
650
700
750<
$10
0K
$100
K - $
150K
$150
K - $
200K
$200
K - $
250K
$250
K - $
300K
$300
K - $
350K
$350
K - $
400K
$400
K - $
450K
$450
K - $
500K
$500
K - $
550K
$550
K - $
600K
$600
K - $
650K
$650
K - $
700K
$700
K - $
750K
$750
K - $
800K
$800
K - $
850K
$850
K - $
900K
$900
K - $
950K
$950
K - $
1MIL
$1M
IL -
$1.1
MIL
$1.1
MIL
- $1
.2M
IL
$1.2
MIL
- $1
.3M
IL
$1.3
MIL
- $1
.4M
IL
$1.4
MIL
- $1
.5M
IL
$1.5
MIL
- $1
.750
MIL
$1.7
50M
IL -
$2M
IL
> $2
MIL
Price Range
Num
ber o
f Act
ive
Lis
tings
New Construction Resale
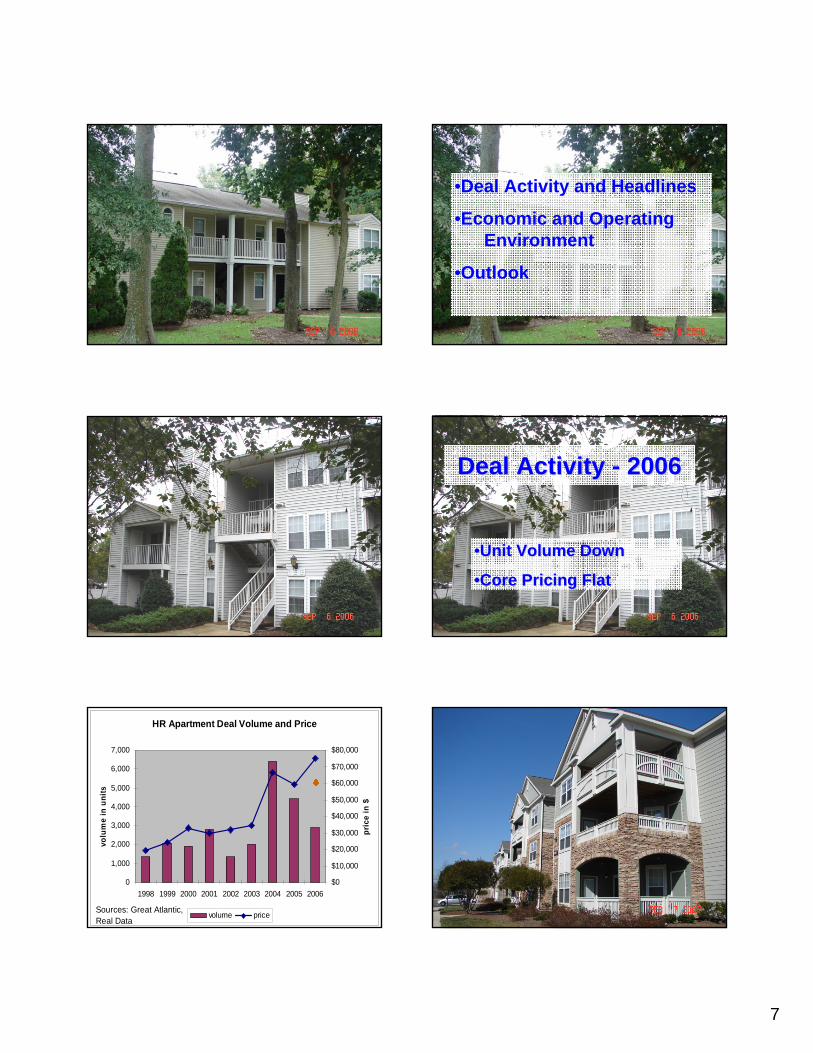
PENINSULA MLSACTIVE DETACHED LISTINGS BY PRICE RANGE - FEBRUARY 2007
0 00211030202362
1325
3631
4961
4444
2119181
39
138
14 105804610
4112
15131928253634
6473
217
258
229
126
165
-20
0
20
40
60
80
100
120
140
160
180
200
220
240
260
280
< $
100K
$100
K - $
150K
$150
K - $
200K
$200
K - $
250K
$250
K - $
300K
$300
K - $
350K
$350
K - $
400K
$400
K - $
450K
$450
K - $
500K
$500
K - $
550K
$550
K - $
600K
$600
K - $
650K
$650
K - $
700K
$700
K - $
750K
$750
K - $
800K
$800
K - $
850K
$850
K - $
900K
$900
K - $
950K
$950
K - $
1MIL
$1M
IL -
$1.1
MIL
$1.1
MIL
- $1
.2M
IL
$1.2
MIL
- $1
.3M
IL
$1.3
MIL
- $1
.4M
IL
$1.4
MIL
- $1
.5M
IL
$1.5
MIL
- $1
.750
MIL
$1.7
50M
IL -
$2M
IL
> $2
MIL
Price Range
Num
ber o
f Act
ive
Lis
tings
New Construction Resale
380
400
420
440
460
480
500
2005 2006 2007 2008Year
Defense Budget in Billions 2005-2008
6
Hampton Roads Share
Proposed 2008 Government Spending –
$5.5 Billion to Northrop Grumman Newport News Shipyard
$288 Million for Construction Projects at Hampton Roads Military Facilities
Hampton Roads ShareHomeland Security - Includes Hampton Roads
in Share of $1.143 Billion Dollars in Grants
APM Terminals $450 Million Dollar Portsmouth
Facility to Open in 2007
$2.2 Billion Dollar Expansion
Craney Island Marine Cargo Terminal
Mixed Use In Hampton Roads Mixed Use In Hampton RoadsBellharbour Station at SoNo Chesapeake 580 Units
Bryans Cove Chesapeake 596Units
Culpepper Landing Chesapeake 983 Units
Gateway at SoNo Chesapeake 108 Units
H20 Hampton 500 Units
Benns Grant Isle of Wight Co. 1098 Units
St. Lukes Village Isle of Wight Co. 430 Units
Governors Grove at Five Forks James City Co. 132 Units
New Town James City Co. 1000+ Units
Asheton Newport News 1578 Units
City Center Newport News 420 Units
Patrick Henry Place Newport News 700 Units
Mixed Use In Hampton Roads
Spectrum at Willoughby Norfolk 327 Units
Hampton Roads Crossing Suffolk 600 Units
Harbour View Station Suffolk 1000 Units
Obici Place Suffolk 225 Units
Blenheim Park Virginia Beach 1000 Units
City View Virginia Beach 600+ Units
City Walk Virginia Beach 450 Units
Cascades at Woods Corner Virginia Beach 192 UnitsHigh Street Williamsburg 482 UnitsYorktown Green York County 74 Units
TOTALS 13,075
2007Multifamily Market:
Review and Assessment
Aubrey L. Layne, Jr.President
Great Atlantic Management
GREAT ATLANTIC
7
•Deal Activity and Headlines
•Economic and Operating Environment
•Outlook
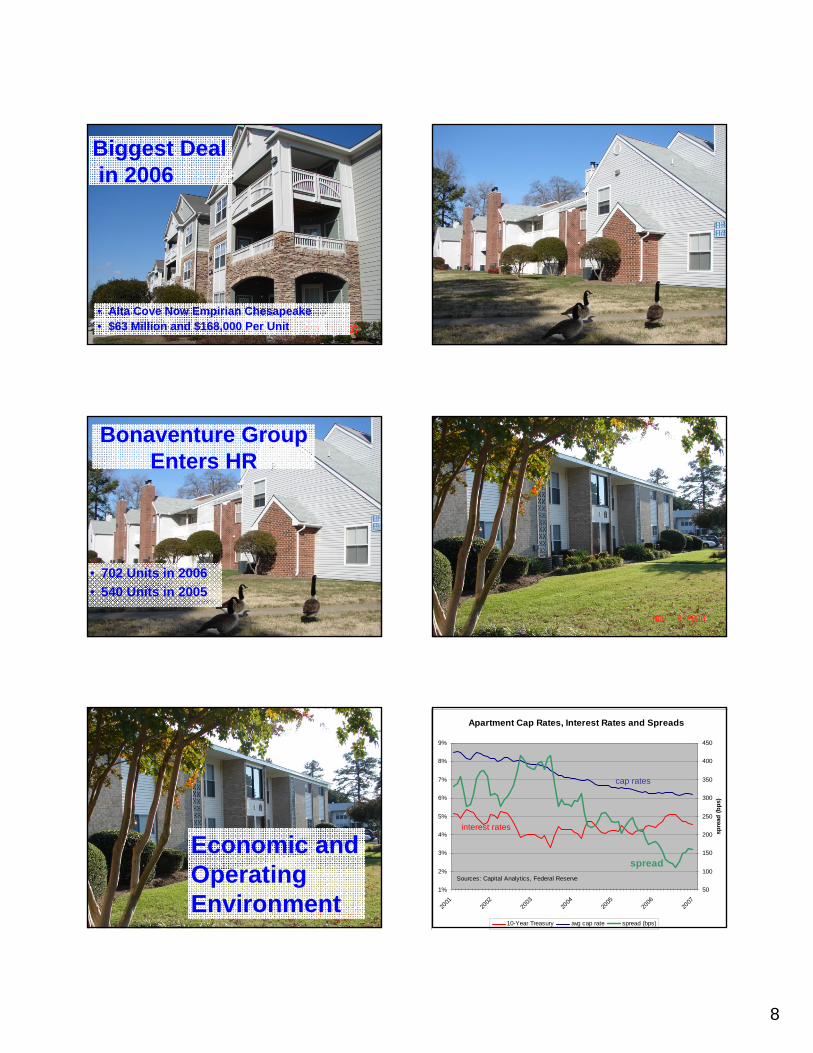
Deal Activity Deal Activity -- 20062006
••Unit Volume DownUnit Volume Down
••Core Pricing FlatCore Pricing Flat
HR Apartment Deal Volume and Price
0
1,000
2,000
3,000
4,000
5,000
6,000
7,000
1998 1999 2000 2001 2002 2003 2004 2005 2006
volu
me
in u
nits
$0
$10,000
$20,000
$30,000
$40,000
$50,000
$60,000
$70,000
$80,000
pric
e in
$
volume priceSources: Great Atlantic, Real Data
8
Biggest Dealin 2006
• Alta Cove Now Empirian Chesapeake• $63 Million and $168,000 Per Unit
Bonaventure Group Enters HR
• 702 Units in 2006• 540 Units in 2005
Economic and Operating Environment
Apartment Cap Rates, Interest Rates and Spreads
1%
2%
3%
4%
5%
6%
7%
8%
9%
2001
2002
2003
2004
2005
2006
2007
50
100
150
200
250
300
350
400
450
spre
ad (b
ps)
10-Year Treasury avg cap rate spread (bps)
cap rates
interest rates
spreadSources: Capital Analytics, Federal Reserve
9
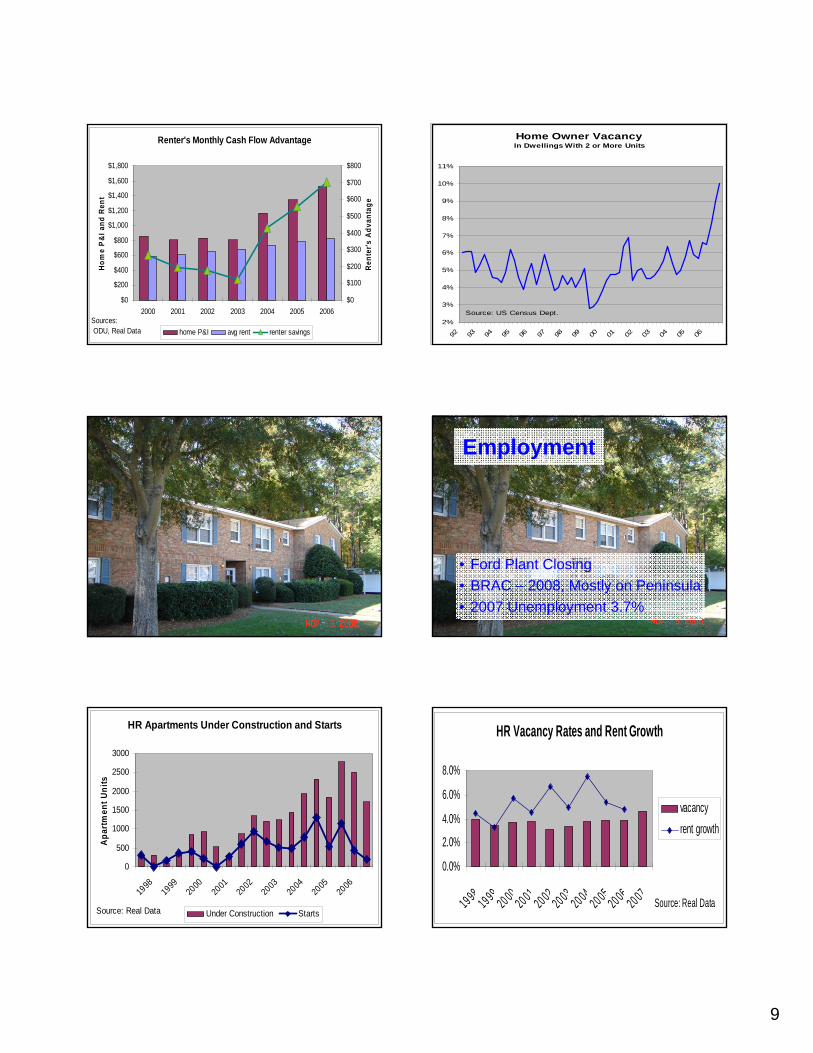
Renter's Monthly Cash Flow Advantage
$0
$200
$400
$600
$800
$1,000
$1,200
$1,400
$1,600
$1,800
2000 2001 2002 2003 2004 2005 2006
Hom
e P
&I a
nd R
ent
$0
$100
$200
$300
$400
$500
$600
$700
$800
Rent
er's
Adv
anta
ge
home P&I avg rent renter savingsSources: ODU, Real Data
Home Owner VacancyIn Dwellings With 2 or More Units
2%
3%
4%
5%
6%
7%
8%
9%
10%
11%
92 93 94 95 96 97 98 99 00 01 02 03 04 05 06
Source: US Census Dept.
Employment
• Ford Plant Closing • BRAC – 2008, Mostly on Peninsula• 2007 Unemployment 3.7%
HR Apartments Under Construction and Starts
0
500
1000
1500
2000
2500
3000
1998
1999
2000
2001
2002
2003
2004
2005
2006
Apar
tmen
t Uni
ts
Under Construction StartsSource: Real Data
HR Vacancy Rates and Rent Growth
0.0%
2.0%
4.0%
6.0%
8.0%
19 9819 99
20 0020 01
20 0220 03
20 0420 05
20 0620 07
vacancyrent growth
Source: Real Data

10
HR Rent Growth and Core Inflation
0.0%1.0%2.0%3.0%4.0%5.0%6.0%7.0%8.0%
1998 1999 2000 2001 2002 2003 2004 2005 2006
HR Rent Growth Core Inflation
Sources: US Dept. of Labor, Real Data
• Buyers: Competitive Market• Sellers: Relatively High Prices• Owners: Positive Operating Environment• Renters: More Choice and Modestly
Higher Rents
Outlook - 2007 Office Market Review
Vivian Turok
Senior Vice President Office Leasing Division
Divaris Real Estate
30 years experience in office sales, leasing, tenant and landlord representation
Bachelor of Social ScienceUniversity of Cape Town
South Africa
Hampton Roads Historical Vacancy Rate Trends
7.8%
9.7%
11.8%
14.3% 13.1%
10.1%
8%6.9%
0
2
4
6
8
10
12
14
16
1999 2000 2001 2002 2003 2004 2005 2006
Office Market Rental Rates
•Class A = $20.00 per square foot
•Class B = $15.42 per square foot
•Class C = $12.39 per square foot
11
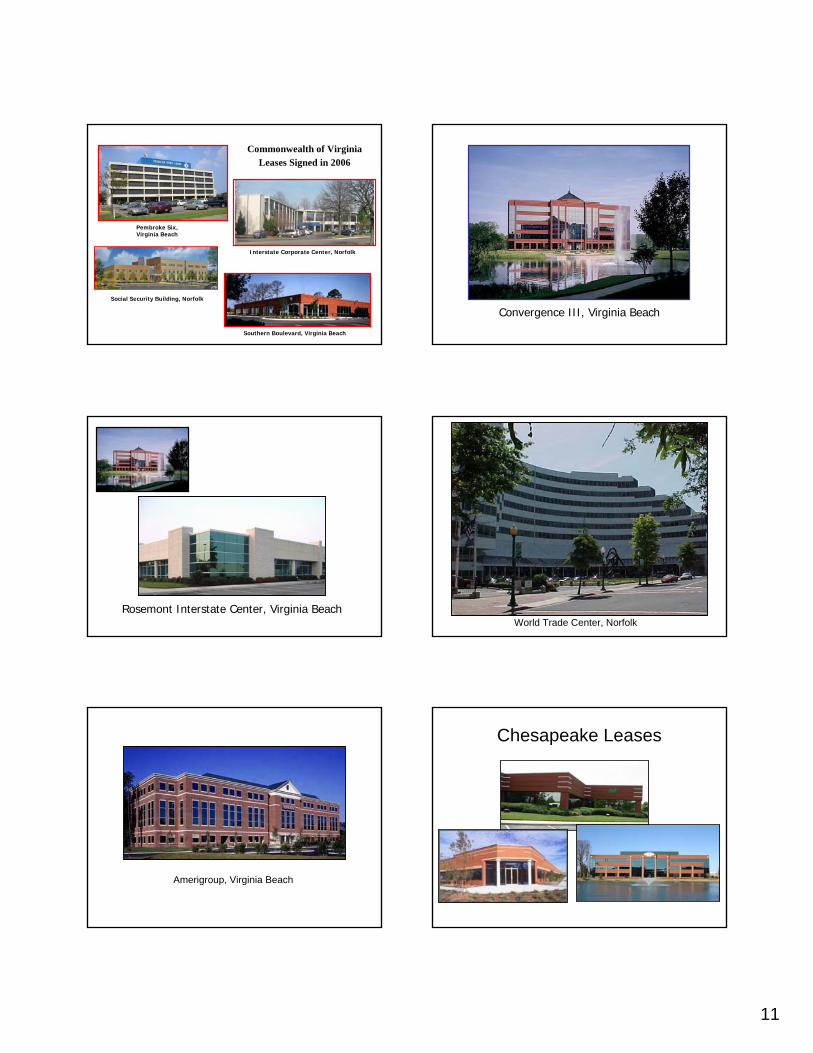
Pembroke Six, Virginia Beach
Interstate Corporate Center, Norfolk
Southern Boulevard, Virginia Beach
Social Security Building, Norfolk
Commonwealth of VirginiaLeases Signed in 2006
Convergence III, Virginia Beach
Rosemont Interstate Center, Virginia BeachWorld Trade Center, Norfolk
Amerigroup, Virginia Beach
Chesapeake Leases
12
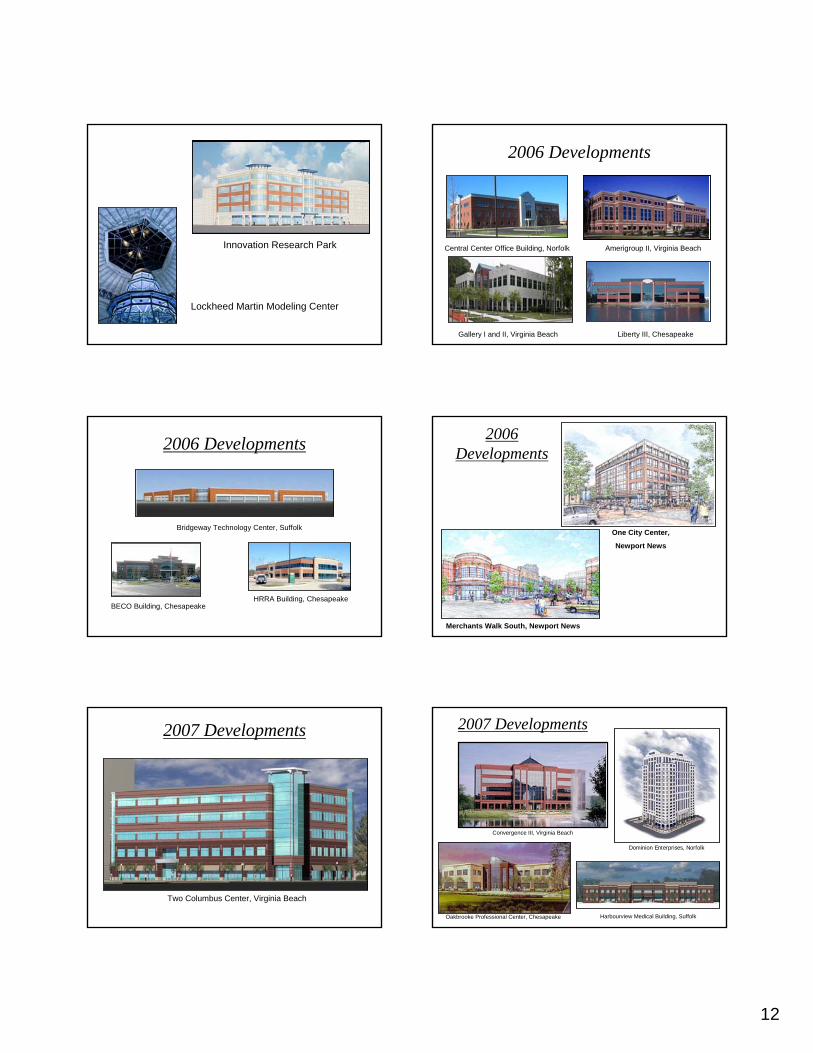
Innovation Research Park
Lockheed Martin Modeling Center
2006 Developments
Gallery I and II, Virginia Beach Liberty III, Chesapeake
Central Center Office Building, Norfolk Amerigroup II, Virginia Beach
2006 Developments
BECO Building, ChesapeakeHRRA Building, Chesapeake
Bridgeway Technology Center, Suffolk
2006 Developments
Merchants Walk South, Newport News
One City Center,
Newport News
2007 Developments
Two Columbus Center, Virginia Beach
2007 Developments
Dominion Enterprises, Norfolk
Oakbrooke Professional Center, Chesapeake
Convergence III, Virginia Beach
Harbourview Medical Building, Suffolk
13
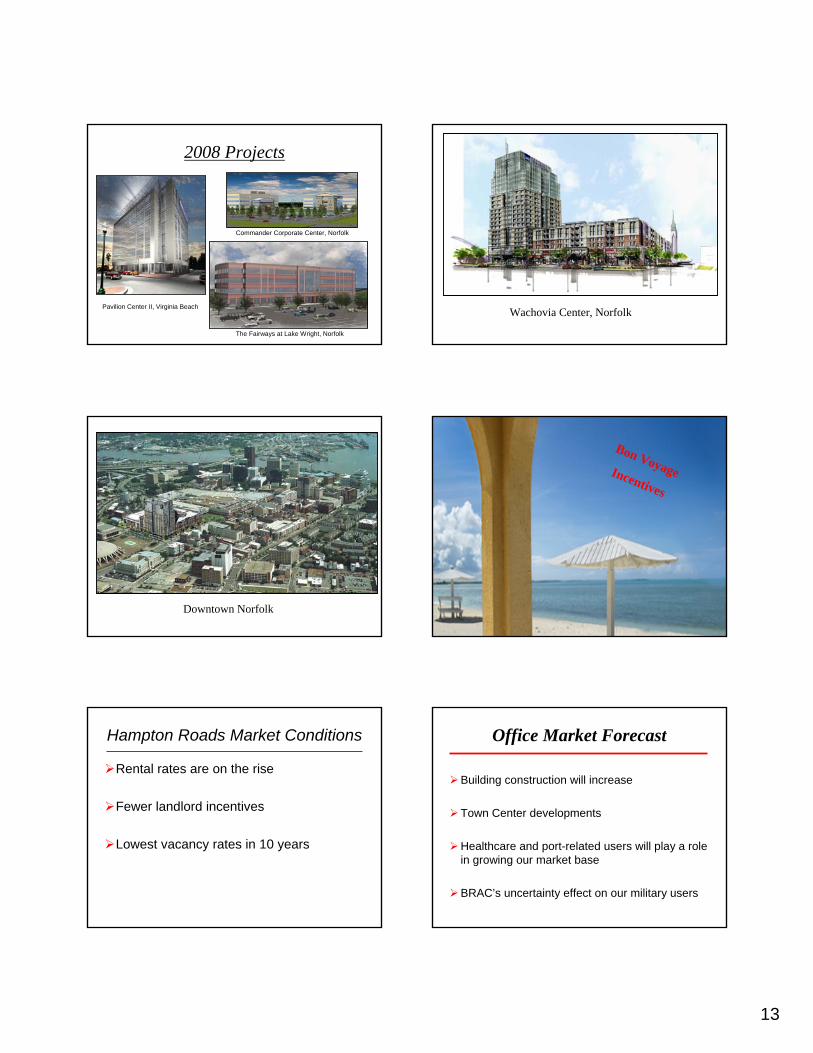
2008 Projects
Commander Corporate Center, Norfolk
Pavilion Center II, Virginia Beach
The Fairways at Lake Wright, Norfolk
Wachovia Center, Norfolk
Downtown Norfolk
Bon Voyage Incentives
Hampton Roads Market Conditions
Rental rates are on the rise
Fewer landlord incentives
Lowest vacancy rates in 10 years
Office Market Forecast
Building construction will increase
Town Center developments
Healthcare and port-related users will play a role in growing our market base
BRAC’s uncertainty effect on our military users
14
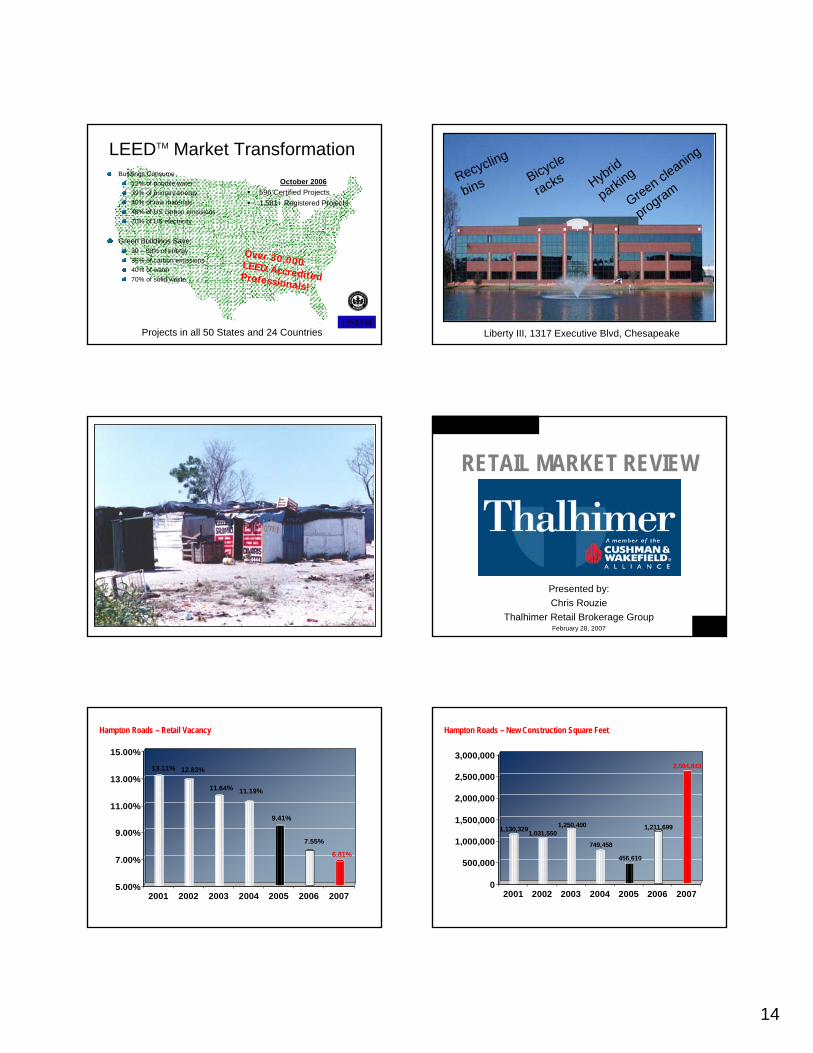
LEEDTM Market TransformationOctober 2006
596 Certified Projects1,581+ Registered Projects
Over 30,000 LEED Accredited Professionals!
Projects in all 50 States and 24 CountriesHSMM
Buildings Consume12% of potable water39% of primary energy40% of raw materials48% of US carbon emissions70% of US electricity
Green Buildings Save:30 – 50% of energy35% of carbon emissions40% of water70% of solid waste
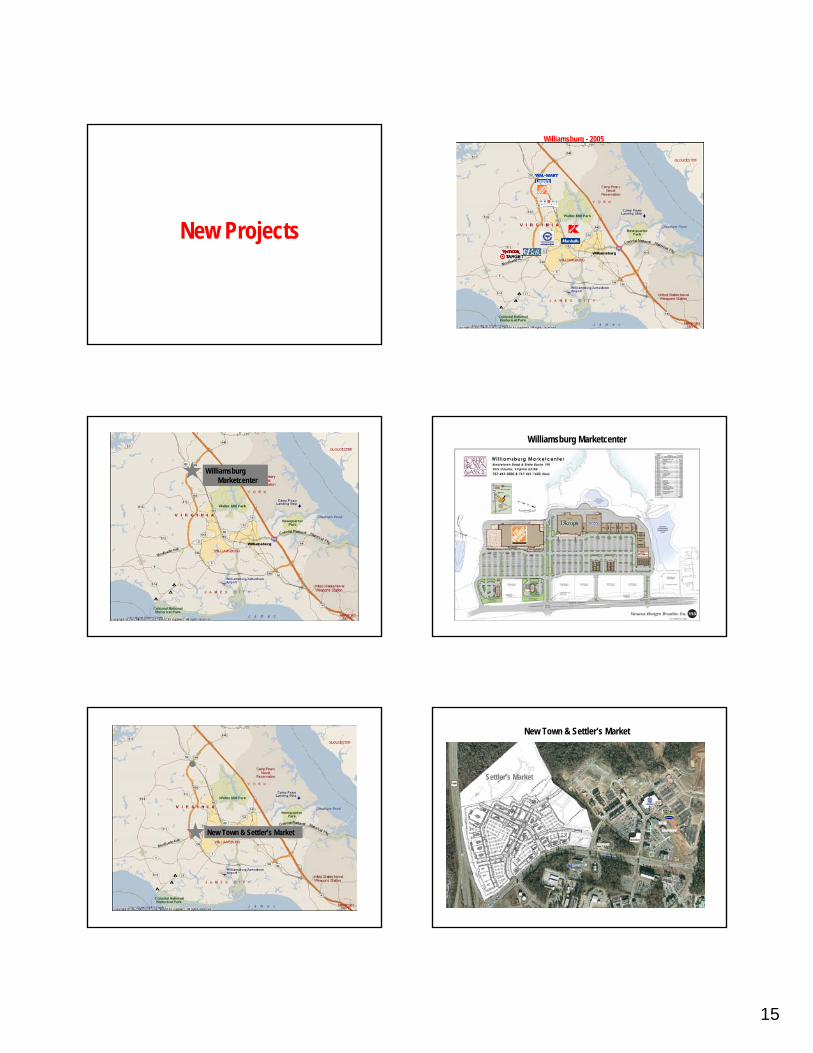
Recycling
bins Bicycle
racks
Liberty III, 1317 Executive Blvd, Chesapeake
Hybrid
parking
Green cleaning
program
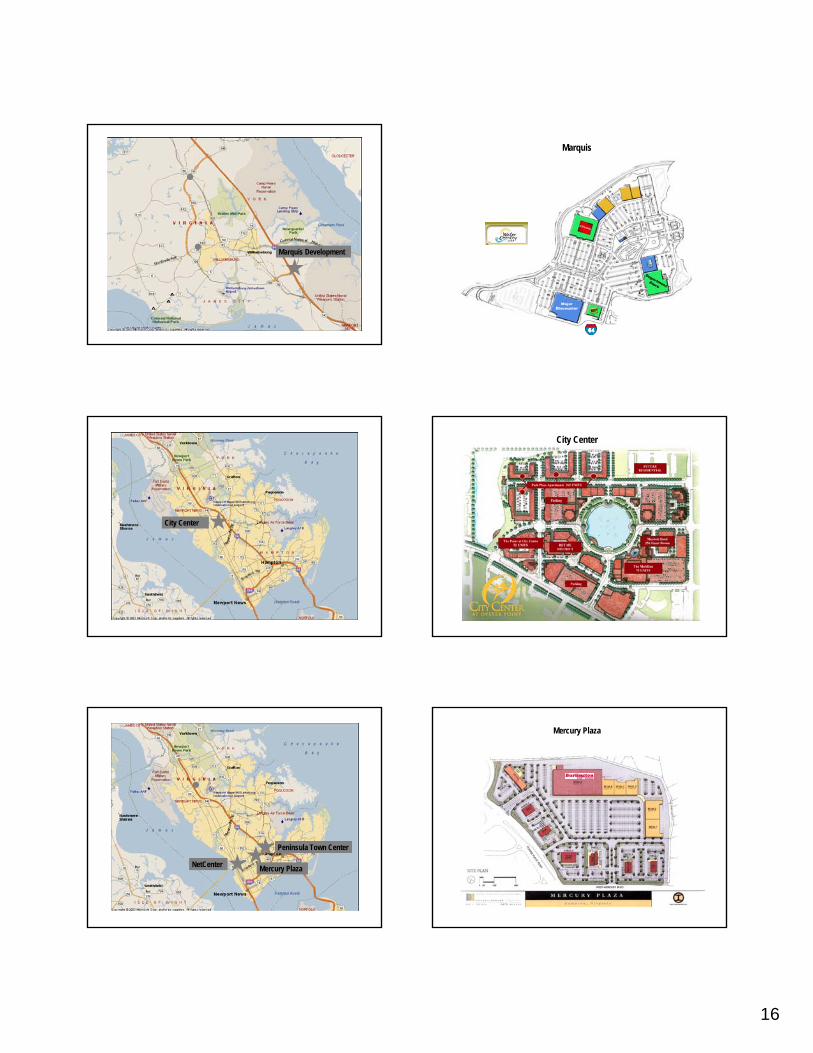
RETAIL MARKET REVIEW
Presented by:Chris Rouzie
Thalhimer Retail Brokerage GroupFebruary 28, 2007
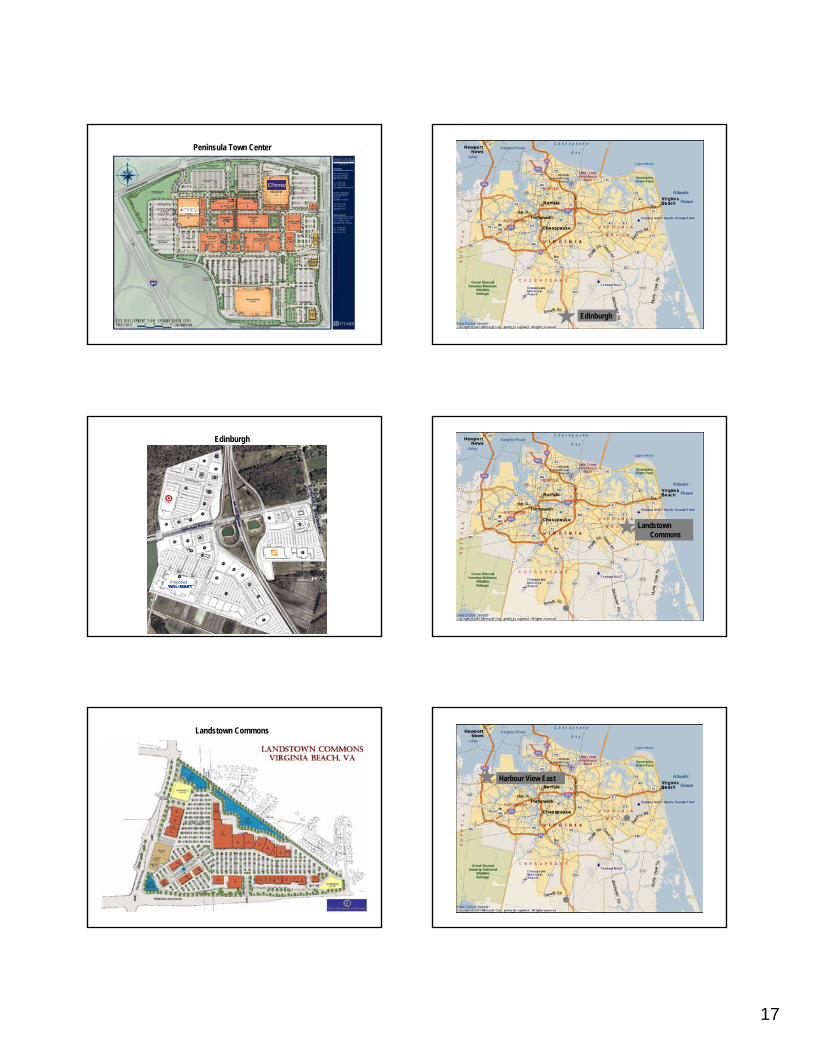
13.11% 12.83%
11.64% 11.19%
9.41%
7.55%
6.81%
5.00%
7.00%
9.00%
11.00%
13.00%
15.00%
2001 2002 2003 2004 2005 2006 2007
Hampton Roads – Retail Vacancy
1,130,3291,031,5501,250,400
749,458
456,610
1,211,699
2,594,843
0
500,000
1,000,000
1,500,000
2,000,000
2,500,000
3,000,000
2001 2002 2003 2004 2005 2006 2007
Hampton Roads – New Construction Square Feet
15
New Projects
Williamsburg - 2005
Williamsburg Marketcenter
Williamsburg Marketcenter
New Town
New Town & Settler’s Market
New Town & Settler’s Market
Settler’s Market New Town
16
Marquis Development
Marquis
City Center
City Center
Mercury Plaza
Peninsula Town Center
NetCenter
Mercury Plaza
17
Peninsula Town Center
Edinburgh
Edinburgh
Proposed
Landstown Commons
Landstown Commons
Harbour View East
18
Harbour View East
Grocery Sector
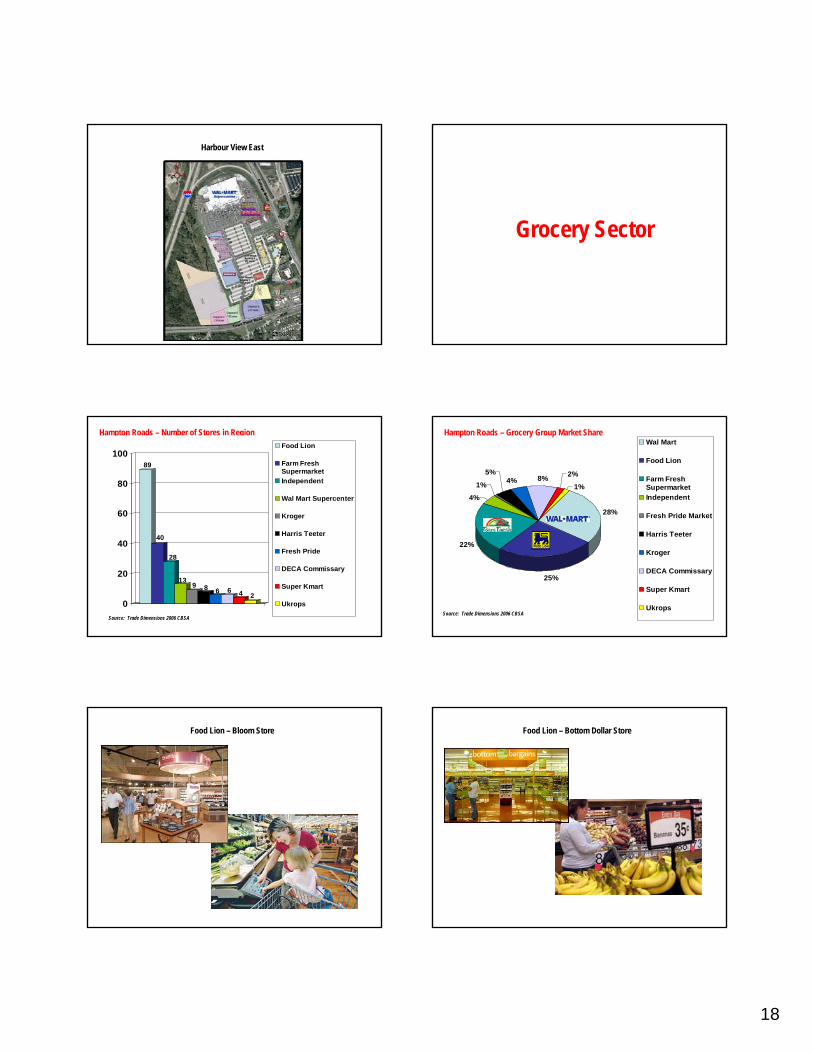
Hampton Roads – Number of Stores in Region
89
40
28
139 8 6 6 4 2
0
20
40
60
80
100Food Lion
Farm FreshSupermarketIndependent
Wal Mart Supercenter
Kroger
Harris Teeter
Fresh Pride
DECA Commissary
Super Kmart
Ukrops
Source: Trade Dimensions 2006 CBSA
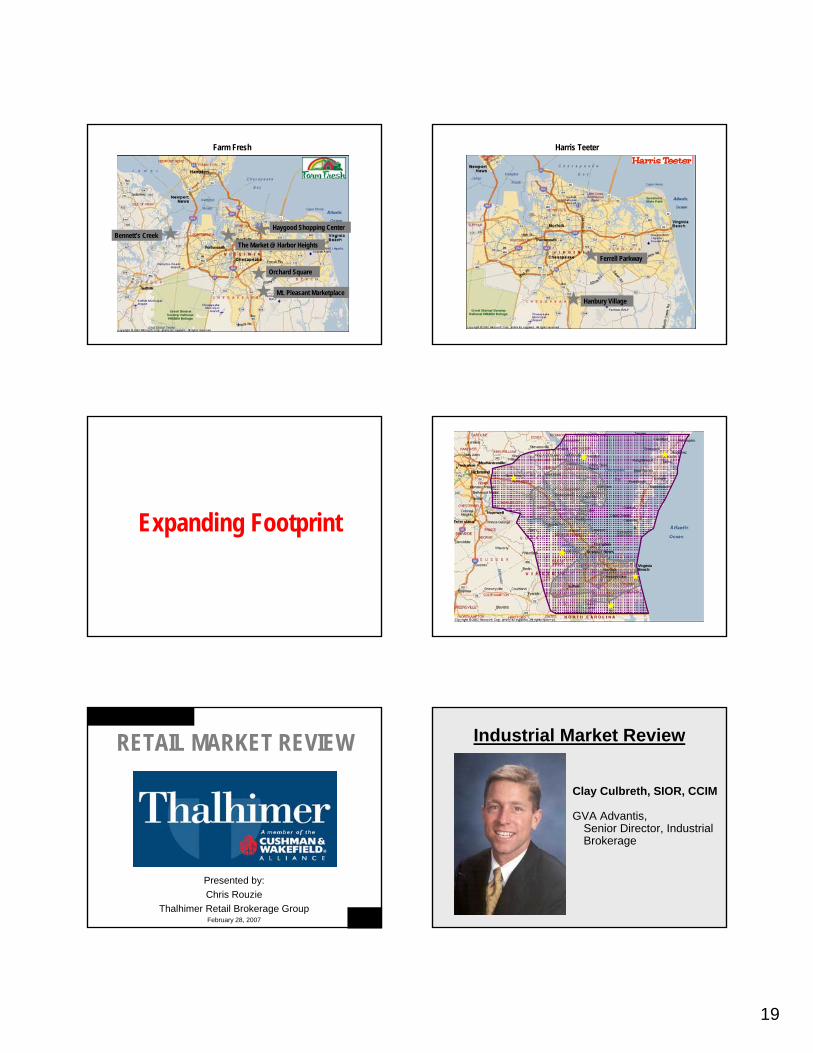
28%
25%
22%
4%
1%
5%4% 8% 2%
1%
Wal Mart
Food Lion
Farm FreshSupermarketIndependent
Fresh Pride Market
Harris Teeter
Kroger
DECA Commissary
Super Kmart
Ukrops
Hampton Roads – Grocery Group Market Share
Source: Trade Dimensions 2006 CBSA
Food Lion – Bloom Store Food Lion – Bottom Dollar Store
19
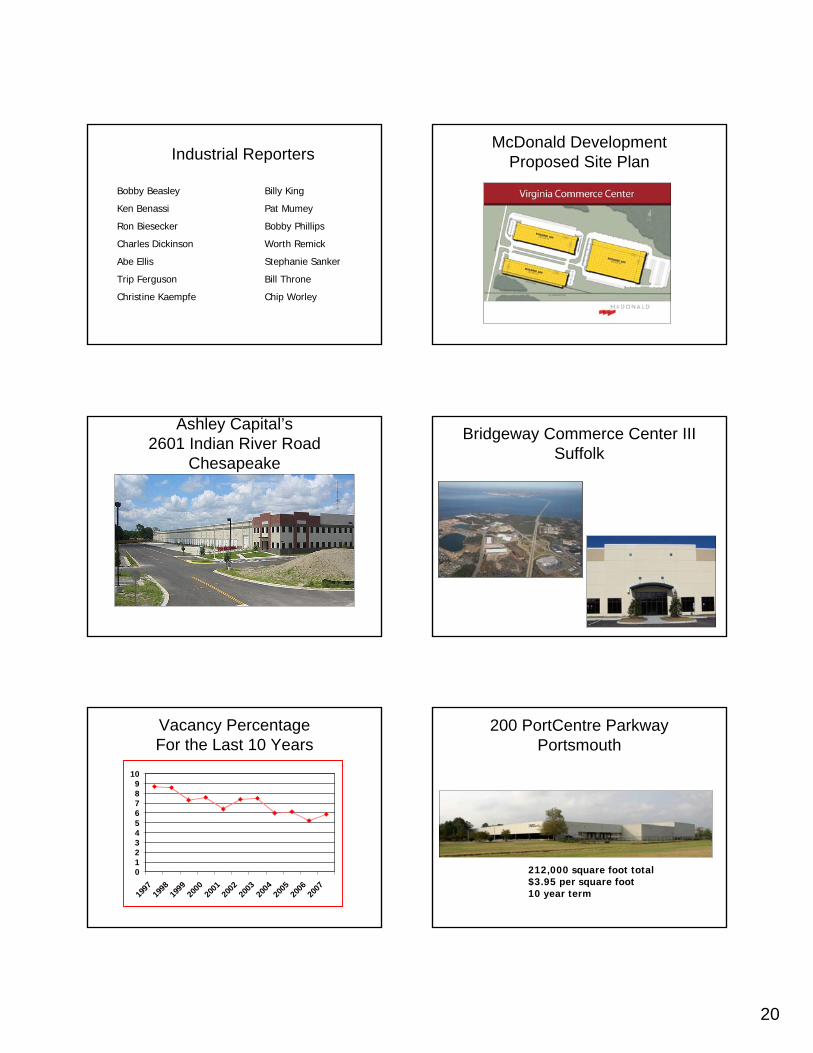
Farm Fresh
Haygood Shopping Center
Mt. Pleasant Marketplace
Bennett’s CreekThe Market @ Harbor Heights
Orchard Square
Harris Teeter
Ferrell Parkway
Hanbury Village
Expanding Footprint
RETAIL MARKET REVIEW
Presented by:Chris Rouzie
Thalhimer Retail Brokerage GroupFebruary 28, 2007
Industrial Market Review
Clay Culbreth, SIOR, CCIM
GVA Advantis,Senior Director, Industrial Brokerage
20
Industrial Reporters
Bobby Beasley Billy King
Ken Benassi Pat Mumey
Ron Biesecker Bobby Phillips
Charles Dickinson Worth Remick
Abe Ellis Stephanie Sanker
Trip Ferguson Bill Throne
Christine Kaempfe Chip Worley
McDonald Development Proposed Site Plan
Ashley Capital’s2601 Indian River Road
Chesapeake
Bridgeway Commerce Center IIISuffolk
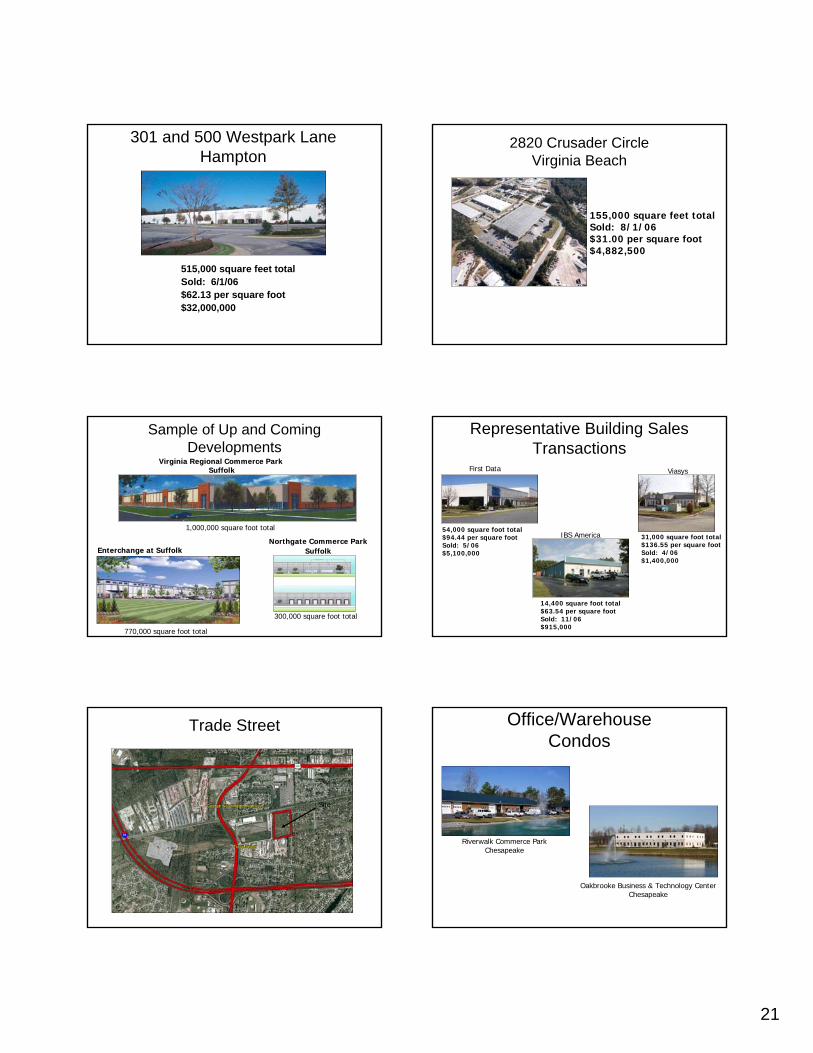
Vacancy Percentage For the Last 10 Years
0123456789
10
1997
1998
1999
2000
2001
2002
2003
2004
2005
2006
2007
200 PortCentre ParkwayPortsmouth
212,000 square foot total$3.95 per square foot10 year term
21
301 and 500 Westpark LaneHampton
515,000 square feet totalSold: 6/1/06$62.13 per square foot$32,000,000
2820 Crusader Circle Virginia Beach
155,000 square feet totalSold: 8/1/06$31.00 per square foot$4,882,500
Sample of Up and Coming Developments
Virginia Regional Commerce ParkVirginia Regional Commerce ParkSuffolkSuffolk
Northgate Commerce ParkNorthgate Commerce ParkSuffolkSuffolkEnterchange at SuffolkEnterchange at Suffolk
1,000,000 square foot total
300,000 square foot total
770,000 square foot total
Representative Building Sales Transactions
First Data
54,000 square foot total$94.44 per square footSold: 5/06$5,100,000
IBS America
14,400 square foot total$63.54 per square footSold: 11/06$915,000
Viasys
31,000 square foot total$136.55 per square footSold: 4/06$1,400,000
Trade Street
Site
Office/WarehouseCondos
Oakbrooke Business & Technology CenterChesapeake
Riverwalk Commerce ParkChesapeake
22
Charlie Taylor
Investment MarketInvestment Market
Jonathan Guion, SIORJonathan Guion, SIOR
February 28, 2007
National Market InfluencesNational Market Influences
Foreign Capital
Condo Conversion Market
Mobility of Capital
Privatizations and Mega Deals
Inflow of Foreign Capital
$16 billion$21 billion20062005
20% drop in foreign capital
Condo Conversion MarketCondo Conversion Market
Largest block of buyers in 2005
Off the radar in 2006
Mobility of CapitalMobility of Capital
23
Privatization and Mega DealsPrivatization and Mega Deals
REIT mergers and acquisitions increased to $100 billion
31 portfolios/properties valued over $1 billion
Hampton Roads MarketHampton Roads Market
Local portfolio sales declined
Dollar volume off by 25%
Hampton Roads TransactionsHampton Roads Transactions
Alta Cove Apartments$63 million
Dove Landing$32 million
Hampton Roads Research QuadBuildings I and III$28.75 million
Liberty Property Trust (3 building portfolio)$13 million
Hampton Roads TransactionsHampton Roads Transactions
Richmond Road Food Lion$14.5 million
Chesapeake Crossing Shopping Center
12 million
West Park Warehouses$32 million
Investment MarketInvestment Market
Jonathan Guion, SIORJonathan Guion, SIOR
February 28, 2007
Old Dominion University Hampton Roads Real Estate
Market Review and Forecast
Thank you for attending!Thank you for attending!
Please Join Us for the ReceptionPlease Join Us for the Reception
Presented by: E.V. Williams
Center for Real Estate and Economic Development