olam dismisses muddy waters report findings - martin lee · 2014-07-17 · page 1 of 45 olam...
TRANSCRIPT

Page 1 of 45
Olam dismisses Muddy Waters report findings
“Everyone is entitled to their own opinions, but they are not entitled to their own facts”
Senator Daniel Patrick Moynihan (1927-2003)
The Muddy Waters report on Olam was published on the afternoon of Tuesday 27th November in
Singapore. We refute the report’s allegations which are false and misleading. Our rebuttal to the 133
page report demonstrates the lack of substance in the claims. Our message to Carson Block (“CB”)
and Muddy Waters (“MW”) is therefore clear - this time the mud won’t stick.
We believe that the report’s assertions are motivated to distract and create panic amongst our
continuing shareholders, bond holders and creditors, to enable Carson Block and his associates to
benefit from their short positions in Olam securities – a strategy of shouting fire in a crowded room.
We will continue to vigorously defend the reputation of the company. We intend to pursue our
rights to take appropriate action and claim damages for the unfounded allegations.
We wish to provide here our response to the major allegations by MW and the conclusions in their
report.
In summary:
• SOLVENCY: Olam faces no risk of insolvency. We have proactively planned for an
appropriate capital structure and raised the requisite equity and debt to meet our
investment plans. We have sufficient liquidity to pursue our current business as well as
future investment plans.
• ACCOUNTING RELATED ASSERTIONS: Our financial statements and accounting policies
strictly follow and adhere to the Singapore Financial Reporting Standards (“SFRS”). Gains
generated by accounting for negative goodwill in certain acquisitions are treated as
‘exceptional’ which are one-off in nature and are excluded when reporting the core
operational profits of the company
• BUSINESS MODEL: Our differentiated strategy is working, is yielding the intended results,
and has helped us build leadership positions in many of our businesses. Therefore we
intend to stay the course.
• ACQUISITIONS AND CAPEX: Both organic Capex and M&A plans are an outcome of a
conscious and deliberate strategy which has been well articulated and constantly
refreshed. We have a proven track record of unlocking value through acquisitions and
pursuing profitable organic growth.

Page 2 of 45
SOLVENCY
OLAM FACES NO RISK OF INSOLVENCY. WE HAVE PROACTIVELY PLANNED FOR AN APPROPRIATE
CAPITAL STRUCTURE AND RAISED THE REQUISITE EQUITY AND DEBT TO MEET OUR INVESTMENT
PLANS. WE HAVE SUFFICIENT LIQUIDITY TO PURSUE OUR CURRENT BUSINESS AS WELL AS FUTURE
INVESTMENT PLANS
Various assumptions have been made and conclusions drawn on our cash position, debt repayment
schedule, and solvency situation.
In order to assess the Balance Sheet of agricultural commodity merchants and processors, it is
important to understand the quality of their current assets. In this regard, we would like to quote
from a recent S&P article (dated April 2012) on adjustments of Readily Marketable Inventories (RMI)
or Liquid Hedged Inventories (LHI):
How does Standard & Poor's adjust companies' reported debt balances for liquid
agricultural merchandising inventories when evaluating credit measures? Standard & Poor's Ratings Services' approach to analyzing agricultural commodity inventories recognizes
the liquid nature of these assets. We view this unique strength as an important offset to the industry's earnings
volatility, and it is a key factor in our assessment of financial risk. The characteristics of many agricultural
inventories, such as tobacco, sugar, and grains, are quite different from inventories in other industrial sectors.
In the agricultural sector, merchandisers usually buy and sell these commodity assets "as is" as part of their
physical trading or basis trading operations. Furthermore, agricultural inventories tend to be exceptionally
liquid because their homogenous nature makes them truly fungible and, thus, easily hedged in the commodity
futures market. These inventories also generally turn quite rapidly, supporting cash flows and greatly
diminishing the risk of an inventory write-down. In our opinion, this liquidity contributes to financial
flexibility. Because of these characteristics, we believe that liquid assets (hedgeable grain and commodity
inventories) should be treated distinctly from other financial accounts, and we adjust the various measures of
credit protection accordingly. For credit evaluation purposes, Standard & Poor's standard calculation of
leverage ratios does not include short-term debt incurred to finance hedged, liquid inventories. Debt leverage,
therefore, takes into account all long-term debt and only that amount of short-term debt that an issuer uses to
finance assets other than hedged grain and commodity inventories. A conservatively financed company would
generally have an excess of liquid assets over short-term debt at all times. In this way, in the event of a severe
tightening of available short-term credit, a company could liquidate fungible inventories in the normal course of
operations and use the funds to pay short-term borrowings as they come due. If a company uses short-term debt
to finance highly liquid inventories, then we make a distinction between interest expense on the short-term debt
and interest expense on long-term debt. Since companies typically include these inventory carrying charges in
their development of commodity selling prices, they are, for analytical purposes, a cost of goods sold, and we do
not include them in our calculation of pretax interest coverage. We add back these interest expenses as a cost of
sale, thus reducing operating income.
Please refer to Appendix 1 titled “S&P Research on Analyzing Agricultural Inventories” for their
detailed methodology in this regard.
At Olam, a large part of our working capital is used to fund LHI which meet four qualifying
conditions: non perishability, limited obsolescence risk, hedged or sold forward, and liquid. These
inventories and secured receivables are therefore liquid assets and are regarded as near cash.
Based on this treatment, our adjusted net debt to equity and net debt to EBITDA is given in the chart
below, as well as the operating cash flow adjusted for Liquid Hedged Inventories.

Page 3 of 45
The brand behind the brands
Adjusted Net Debt to Equity and Adjusted Net Debt to EBITDA ratios
5.2x 6.2x 5.8x
6.7x 6.6x 6.7x
1.2x 1.4x 1.1x 1.5x 1.6x 1.4x
FY07 FY08 FY09 FY10 FY11 FY12
Net debt/EBITDA Adjusted net debt/EBITDA
1. Before fair value adjustment reserves2. Liquid assets: Cash, bank balances and fixed deposits + RMI + secured receivables (trade receivables secured by letters of credit
or documents of title)3. Adjusted net debt: Total debt – liquid assets. Debt does not include bank lines.4. For the last 12 months ended 31 March
Net debt to equity1 and adjusted net debt2,3 to equity1 (x)
Net debt to EBITDA and adjusted net debt3 to EBITDA
2.9x 2.7x
2.2x 1.9x
2.2x 1.8x
0.7x 0.6x 0.4x 0.4x 0.5x 0.4x
FY07 FY08 FY09 FY10 FY11 FY12
Net debt/equity Adjusted net debt/equity
The brand behind the brands
Positive operating cash flows after adjusting for Liquid Hedged Inventories
Adjusting for liquid inventories and secured receivables, we typically maintain positive operating cash flows
Cash flow summary (S$mm)
1. RMI: inventories that are liquid, hedged, or sold forward
2. Secured receivables: receivables secured by letters of credit or documents of title
As reported FY07 FY08 FY09 FY10 FY11 FY12
Operating cash flow before working capital changes 285 369 346 461 811 894
Changes in working capital (310) (874) 268 (1,099) (2,095) (308)
Increase in inventories (143) (454) (187) (621) (1,153) (610)
Decrease/(increase) in receivables and other current assets (193) (428) 218 (449) (1,227) 590
Decrease/(increase) in advance payments to suppliers (95) (117) 95 29 (11) (106)
Increase in payables and other current liabilities 121 125 142 (58) 296 (182)
Operating cash flow after working capital changes (25) (505) 614 (638) (1,284) 586
Adjustment for increase in RMI1 108 608 105 581 829 744
Adjustment for increase in secured receivables2 57 145 24 231 521 (1)
Adjusted operating cash flow after working capital changes 140 248 743 174 66 1,329

Page 4 of 45
With this background, we would like to clarify the other issues on Solvency raised below:
MW CLAIM: “As of September 30, 2012, Olam had S$1.38 billion in cash and short-term fixed
deposits, and S$3.75 billion in borrowings due within the next 12 months. Our model shows that
Olam could have to raise or refinance as much as S$4.6 billion over the next 12 months in order to
stay solvent”
The assumptions and conclusions drawn on our solvency position are incorrect. As at 30 September,
2012, we had cash of S$1.38 billion, short term working capital of S$6.36 billion and long term fixed
assets of S$4.5 billion. It should be noted that approximately S$5.01 billion out of the short term
working capital is held in the form of Readily Marketable Inventories (S$3.71 billion) and secured
receivables (S$1.3 billion), which will get converted into cash and will be available for funding fresh
working capital.
The source of funding was through equity of S$3.45 billion, long term debt of S$4.61 billion and
short term debt of S$3.75 billion. Post Q1 FY2013, we have raised additional long term debt of S$500
million. Between equity and long term debt, we therefore have a total of S$8.55 billion covering
fixed assets of S$4.5 billion. We have been deliberate about raising additional long term debt in
advance of our debt refinancing requirements as well as to meet our planned capex/acquisitions.
We believe we have more than enough capacity to meet our repayment obligations of S$1.5 billion
in the next 12 months, as well as our likely capex of S$1-1.25 billion in the same period.
In addition to this we have unutilized short term working capital lines of S$4.3 billion which are
available to fund our on-going working capital requirements, with enough scope for taking care of
the anticipated volume increase and any commodity price changes.
The Net debt to equity was 1.81 X as at the end of FY2012 and now stands at 2.03 X at the end of Q1
FY2013. This is at one of the lowest levels in our history and after removing RMI and secured
receivables, we are at an adjusted net debt to equity of 0.37 X and 0.57 X respectively for the same
period.
We believe that even without raising any further debt we can easily meet our debt repayment
obligations and pursue our planned Capex, in addition to meeting the on-going working capital
needs. We also have the option of phasing out some of our fixed capital investments if the debt
markets completely dry up for some reason.

Page 5 of 45
MW CLAIM: “Brokers position: S$602.2 million of the cash balance appears to come from Olam
withdrawing significant margin from its brokerage accounts”
Margin account movements are mainly correlated with the net position on the hedges with brokers
and commodity price changes on the underlying. Draw down from broker accounts can be done only
when excess cash is available in our accounts with brokers. Cash availability in broker accounts is the
direct result of reduction in commodity prices, against our corresponding short position on the
exchange. Withdrawals from margin accounts can therefore only take place if the positions are in
the money and hence it’s misleading to suggest that “…Olam drew down its margin accounts just
before the end of the quarter in order to appear to be more liquid than it really is…”. It shows a lack
of understanding of how a hedge account actually works.
MW CLAIM: “Olam also had S$445.7 million of overdrafts as of the FY2012”
These are routine short term working capital loans. Banks in several countries refer to short term
working capital facilities as ‘bank overdrafts’. This does not mean that we are ‘overdrawing’ on our
current account balances. These loans are drawn by our subsidiaries in local currencies mainly to
avoid exposure to foreign currency fluctuations and are held for very short periods in the nature of
‘cash in transit’ to fund on-going operations. We have clarified in the Annual Report (AR) that
interest rates could range from 1-22% and would be a function of the devaluation rate in the local
currency also. Real interest rates on these loans (net of currency depreciation) would be
competitive.

Page 6 of 45
ACCOUNTING RELATED ASSERTIONS
OUR FINANCIAL STATEMENTS AND ACCOUNTING POLICIES STRICTLY FOLLOW AND ADHERE TO
THE SINGAPORE FINANCIAL REPORTING STANDARDS (“SFRS”). GAINS GENERATED BY
ACCOUNTING OF NEGATIVE GOODWILL IN CERTAIN ACQUISITIONS ARE TREATED AS
‘EXCEPTIONAL’ WHICH ARE ONE-OFF IN NATURE AND ARE EXCLUDED WHEN REPORTING THE
CORE OPERATIONAL PROFITS OF THE COMPANY.
We reaffirm that our financial statements and accounting policies follow and adhere to the
Singapore Financial Reporting Standards (“SFRS”). We would also like to reiterate that our financial
statements have been subject to annual audits by E&Y. E&Y have also stated in their letter dated 22
November 2012 to our Board of Directors that:
“The consolidated financial statements issued by Olam were prepared in accordance with SFRS. Our
audits were conducted in accordance with Singapore Standard on Auditing. Our latest statutory audit
was in respect of the consolidated financial statements of Olam for the year ended 30 June 2012. Our
audit report for those financial statements, which was issued on 28 September 2012, was not
qualified or otherwise modified in any respect and our opinion was that Olam’s consolidated financial
statements gave a true and fair view of its state of affairs and financial results for the year then
ended. Our audit report on Olam’s consolidated financial statements for the prior years for which we
had acted as auditors, issued on various dates, were similarly not qualified or otherwise modified. We
stand by our audit opinion on the consolidated financial statements of Olam.”
However as previously stated in our release dated 23 February 2011, there were a few instances of
reporting differences between the unaudited financial statements and the Annual Report (“AR”)
which were on account of presentation differences between the accounts of various subsidiaries and
their eventual treatment in the Group consolidation and/or reclassification between line items in the
Group accounts. At the time of the results announcement (unaudited) the auditors had substantially
reviewed the consolidation package of the subsidiaries and the MASNET announcement at the
Group level and satisfied themselves with the reported results of the Group. Subsequent to the
results announcement, in the process of the preparation of the AR there were occasions where
further refinement and re-classification in the course of the preparation of the detailed notes to
accounts were made. All these changes were reviewed by the auditors and presented to the Board
Audit Committee for consideration and approval before finalization of the AR.
We can re-confirm that there have been no changes to the P&L in any year between the unaudited
Financials and the AR. It is important to note that any material changes in financial statements
between the unaudited and audited version need to be approved by the auditors, Board Audit
Committee and the Board of Directors and a public disclosure via SGX has to be made. There has not
been a need for us to make such a statement since listing in 2005.
We have since strengthened our consolidation processes and procedures to ensure that such
instances of reclassification are minimized which is clearly reflected in our financial statements for
FY 2011 and FY2012.
NON-CASH ACCOUNTING GAINS
In their report, MW has repeatedly asserted that non-cash accounting gains (“NCAGs”), particularly
negative goodwill and biological gains are a significant portion of Olam’s PAT (37.9% from FY 2010
through FY2012). Our response to these specific assertions is given below.

Page 7 of 45
Negative Goodwill
MW CLAIM: “Much of Olam’s negative goodwill comes from it revaluing assets at the time of
acquisition, rather than acquiring them below their book value”
MW claims that much of the negative goodwill arises not from buying assets below book value but
by “its own upward revaluation of asset values”. To us, this shows a shocking lack of understanding
of basic accounting standards on the part of the “experts” hired by MW as part of their three
month full-time research on Olam.
How is Goodwill generated?
Goodwill, which arises as a result of a difference between the purchase price and the fair value (as
opposed to the book value) of the acquired business / asset is recognized in the profit and loss
statement/Balance Sheet after due verification by the Company’s auditors, Ernst & Young LLP
(“E&Y”). This accounting treatment is mandatory under SFRS 103 (Business Combinations) and
requires the Company to undertake a Purchase Price Allocation (“PPA”) exercise which is carried out
by an independent third party valuer and reviewed by E&Y. The fair value of the acquired
business/assets is not required to be reflected in the acquiree's financial statements but in the
Group's consolidated financial statements instead. The outcome of the PPA exercise forms the basis
for accounting of these acquisitions which then results in the recognition of goodwill which could be
positive or negative.
How does Olam treat negative goodwill?
Olam has consistently and explicitly reported any gains generated by the accounting of negative
goodwill as “exceptional”, which is one-off in nature, and has excluded these when reporting the
core operational profits of the Company. By the exclusion of such gains from our operating profit,
Olam has not sought, nor received any enhancement of our operational profits. Further, this and
any other non-operational income does not form part of our strategic plan target of US$1Bn PAT in
FY2016.
Does Olam acquire assets only to generate negative goodwill?
MW seems to allude that Olam sought to acquire assets for the sole purpose of generating negative
goodwill and enhancing profits. This could not be further from the truth. In the past few years,
Olam saw an opportunity post the global financial crisis of acting counter-cyclically and acquiring
assets and businesses at a deep discount to their fair value – as a result, some acquisitions resulted
in a negative goodwill (worth noting that many others resulted in a positive goodwill). All the
acquisitions, without exception, that resulted in a negative goodwill were part of our publically
disclosed strategic plan and were “on-strategy” (in line with our stated strategy) and “on-plan”. As
the business sentiment improved towards FY2011 and FY2012, the acquisitions were done closer to,
or at a premium to their fair values which resulted in lesser negative goodwill and/or positive
goodwill.
As mentioned above, while MW has consistently harped on Negative Goodwill, they failed to talk
about several acquisitions that resulted in a positive goodwill as well. Some of these transactions are
summarized below:

Page 8 of 45
How has negative goodwill increased as a result of re-classification?
MW states that S$118.2 million of negative goodwill in Olam’s FY2010 Annual Report was S$29.2
million higher than the negative goodwill recorded in the SGXNET announcement in Q4 FY2010. “In
other words, Olam somehow realized after reporting results that the assets were worth even more
than it had previously thought.”
This assertion is totally incorrect as MW is comparing a GROSS number of S$118 million which was
stated in the Annual report to a NET number of S$87.6 million in the Q4 FY2010 SGXNET. The
difference between the two is clearly explained on page 13 of Q4 FY2010 SGXNET, "During the
period, the Company has completed the Purchase Price Allocation (“PPA”) exercise for the recently
acquired tomato paste manufacturing facility (OTP) in California and the Almond Orchards in
Australia. This exercise resulted in an aggregate exceptional gain of S$87.6 million in the form of
negative goodwill (net of transactional and related expenses of S$29.1 million and a one off
impairment charges for certain ginning assets in the USA amounting to S$1.4 million)". Thus, 87.6 +
29.1 + 1.4 = 118!
MW CLAIM: “Negative goodwill on tt Timber acquisition”
As explained above, Olam consistently applies the guidelines under SFRS 103 for fair valuing the
acquired assets/businesses by independently conducting a PPA exercise. The reason for the negative
goodwill was mainly on account of the intangible assets of tt Timber (forestry concessions).
Under the accounting policy adopted for valuation of intangible assets by DLH as stated in page 29 of
their Annual Report, they reflected these concessions at historical cost. Their policy specifically
stated that "Other intangible assets, including intangible assets acquired in connection with business
combinations, covering certification costs and forest concessions, are measured at cost less
accumulated depreciation and impairment losses"
Considering that Olam had consistently followed the practice of fair valuing all acquired businesses /
assets (including intangibles), the same practice was also applied to the tt Timber acquisition.
BIOLOGICAL ASSETS VALUATION
SFRS 41 prescribes the accounting treatment for biological assets (a living animal or plant) during the
process of biological transformation (processes of growth, degeneration, production and
procreation) and for the initial measurement of agricultural produce (the harvested product of the
entity’s biological assets) at the point of harvest.
It prescribes principles for recognition and measurement of biological assets and agricultural
produce, and accounting of the associated gains and losses that arise as a result. It does not apply to

Page 9 of 45
the processing and eventual sale of agricultural produce after the point of harvest, nor the sale of
biological assets. Please refer to Appendix 2 for more details in this regard.
OLAM’S VIEW ON DISCLOSURE OF BIOLOGICAL GAINS
Olam’s Biological Assets consist of:
• Plantations (Tree crops) viz. Almond orchards, coffee plantations
• Annual crops viz. cotton, onions, tomatoes and other vegetables
• Livestock viz. dairy cattle
Fair value determination
The fair value of biological assets (other than annual crops and livestock) is estimated with reference
to a professional valuation using the present value of expected net cash flows from the biological
assets.
The valuations are based on following significant assumptions:
(i) The average life of trees for plantations has been taken up to 15 to 25 years;
(ii) Rates considered for discounting future cash flows range between 12% and 13% per annum;
(iii) Annual rate of inflation ranging from 0% to 4% per annum;
(iv) Location, soil type and infrastructure for determining estimated yield; and
(v) Market price of the biological assets dependent on the prevailing market price of the products after harvest.
The annual crops have been valued using adjusted cost, which is the estimate of the yield and cost of
the crop at harvest discounted for the remaining time to harvest, which approximates fair value.
The fair value of livestock is determined based on valuations by an independent professional valuer
using market prices of livestock of similar age, breed and generic merit.
Given SFRS 41 is a fairly new standard, not adopted universally and is still not fully understood, some
market participants often excluded biological gains from the profits of companies following SFRS 41.
The intent is to make companies comparable across regions and standards by excluding biological
gains, but the outcome is just the opposite. The below illustration should clarify the issue:

Page 10 of 45
The way the above scenario would play out in the financial statement is as follows:
As seen above, the Fair Value of the biological asset reduces to zero over the lifetime of the asset.
COMMUNICATION CHALLENGES
Changes in the fair value of Biological Assets can arise from two reasons:
a) Change in the productive capacity of the biological asset or
b) Changes to the assumptions used in the Fair Valuation model

Page 11 of 45
The resulting change in the biological asset value will result in a Biological Gain or Loss which gets
reported in the Profit and Loss account for the period under review.
However, at Olam we believe it is imperative to make a distinction between the two – the change
due to (a) is “Operational” in nature since it has risen from active management of the biological
transformation by better farming practices, application of fertilizer, better harvesting etc. On the
contrary, changes due to (b) are considered “Non Operational” in nature since they arise solely from
a change in the fair value model assumptions and other changes external to Olam arising from a
change in say the long term price of the commodity, or changes in the discount rates etc.
While SFRS 41 does not require this disclosure, Olam voluntarily discloses how much of the reported
biological gain during a period was Operational vs. Non-Operational.
It is also pertinent to note that the Fair Value Gains on Biological assets reported in the Profit and
Loss Account is gross of tax and the income tax computed as part of the valuation methodology is
included under “Income tax expense” head in the profit and loss account. The rates of income tax
can vary between 25% - 35% depending on the various jurisdictions in which the biological assets are
located.
While Fair value gains on biological assets is generally viewed as “Non cash” and excluded from the
core operational profits by the investor community, we wish to highlight the following:
• All our plantations are not yet fully mature and hence have not yet attained the full yield
potential.
• However the costs for managing the biological assets are incurred in cash and fully charged
off in the profit and loss account as period costs.
BALANCE SHEET: OUR STRONG BALANCE SHEET HELPS US PURSUE OUR WELL DEFINED AND
CLEARLY ARTICULATED STRATEGY
Olam has been explicit that the current strategic plan cycle (FY2010 to FY2016) involves selective
investments in upstream and midstream segments of the value chain. The Company has also, openly
and transparently communicated that given the front-loaded nature of the investments, the
Company would be free cash flow negative till FY2015 while the investments complete their
gestation phase and start generating cash flows.
The Company was well prepared to embark on this strategy and had pre-emptively built an
appropriate balance sheet structure supported both by equity (which was raised in 2011) and
diversified debt (across bank bilateral lines, syndicated facilities and debt capital markets) of varying
tenors to support the longer term nature of the investments being made. As of 30 September 2012,
we have ample liquidity (both cash in hand as well as near-cash sold/hedged inventory and secured
receivables), un-drawn lines from banks as well as debt headroom reflected by leverage levels
which are well below our bank covenants as well as internal gearing targets to continue on the path
of execution of our strategic plan.
With this background, the assertion that Olam’s capex is “off-the-rails” does not hold merit as the
Company is well “on track” towards achieving its stated goals.

Page 12 of 45
Specifically, MW’s assertions are centered on two themes:
MW CLAIMS: “Total acquisition consideration exceeds actual payments by S$571 million”
It is important to understand the timing difference that exists between the announcement of a
transaction and the subsequent cash outflow that occurs at the time of closing. For instance, the
UAP sugar mill acquisition was announced as of 30 June 2012, but since the transaction had not
closed as on that date, the cash outflow had not taken place. This is not what we would consider to
be “missing capex”.
Secondly, acquisition consideration is not always discharged in cash. The purchase consideration can
be paid either in cash or via assuming the debt of the acquired company. In the case of transactions
like Progida (Turkey), Hemarus (India), Olam has assumed the debt of the acquired entity and this
fact is clearly reflected in the Annual Reports of the Company. Thus NONE of the capex is missing as
alluded to in the MW report.
The detailed response to the table is attached below:
* The lot of differences could be explained by reading annual report notes to accounts :
S $ 000
Acquisitions Cashoutflow as per
annual report
Company press
releases and analyst
persection of cash
outflows on acquisitions
Gap Explained Remark
Almond Orchards 29,159 41,441 (12,282) (12,282)
No press release was issued as it was below our announcement
threshold. Cash outflow pertains to the acquisition of the asset
Vallabhdas Kanji Limited 22,216 22,882 (666) - Exchange difference
Hemarus Industries Limited 9,678 93,815 (84,137) (81,000) 81 M S $ debt taken over on acquisition.
Titanium Holding Limited 229,732 212,290 17,442 17,442 Difference is on account of working capital adjustment at closing
Progida - 48,306 (48,306) (45,000) 45 M S $ debt taken over on acquisition.
Macao 14,817 25,424 (10,607) (10,607) FY 12 Annual Report (Note 11): Total consideration paid of 21.0 M
S$ .
Milky Projects - Rusmolco 8,460 95,340 (86,880) (84,000)
FY 12 Annual Report (Note 11): S $ 77.6 M was fresh equity
invested by Olam in Rusmalco. The final consideration was S$6.4
M lower than the announced EV
Others - Wool + Trusty Foods + UB 28,737 - 28,737 28,737
No press release was issued as it was below our announcement
threshold.
UAP - 163,731 (163,731) (163,731)
FY 12 Annual Report (Note 38): Acquisition has not been
completed
Kayass - 84,545 (84,545) (84,545)
FY 12 Annual Report (Note 38): Acquisition has not been
completed
Total 342,799 787,774 (444,975) (434,986)
FY 12

Page 13 of 45
MW CLAIMS: “We cannot account for cumulative $996.2 million in booked but unattributed Capex
over the last four years”
MW seems to conclude that “Olam is pursuing more greenfield projects than investors realize”, and
state that in the 2012 Annual Report, there is a “distinct lack of disclosure” for the S$875 million
cash outflow for the purchase of property, plant and equipment, leading according to MW to a total
“unattributable Capex” of S$996 million over the last four years.
Olam has been explicit not only on its capex strategy, but has also notified the markets on every
material investment.
Further, Olam also states in its quarterly financial results the projects towards which capital
expenditure has been spent during the quarter. So evidently for MW to state that the capex cannot
be accounted is not true.
We wish to provide the detailed break-up of the incremental capex spend of S$875 million in FY2012
which should dismiss this unwarranted assertion:
Acquisitions Cashoutflow as per
annual report
Company press
releases and analyst
persection of cash
outflows on acquisitions
Gap Explained Remark
TT Timber 51,530 48,659 2,871 2,871 Exchange difference
Britannia 23,109 61,750 (38,641) -
Purchase consideration was discharged by a combination of cash
consideration, Debt, net working capital and completion profit.
NZFSU 93,700 165,490 (71,790) (71,790)
93.7 M S $ paid towards acquisition of 59.53 % of NZFSU in
FY2011
US Almond Orchards 74,263 69,778 4,485 4,485 Exchange difference
Gilroy Foods & Flavours 312,561 308,750 3,811 3,811 Exchange difference
Total 555,163 654,427 (99,264) (60,623)
S $ 000
Acquisitions Cashoutflow as per
annual report
Company press
releases and analyst
persection of cash
outflows on acquisitions
Gap Explained Remark
SK Foods 54,721 54,027 694 Exchange difference
Almond Orchards 389,574 358,793 30,781
Cash consideration was US$277.7 Mn which matches the cash
outflow as per the annual report
Crown Flour Mills 86,018 149,058 (63,040)
Announced value of $150Mn is EV. Paid by $70Mn in cash and
bank loans assumed of $80Mn
Dunavant + Algoda 3,440 - 3,440
No press release was issued as it was below our announcement
threshold
Total 533,753 561,878 (28,125)
S $ 000
Acquisitions Cashoutflow as per
annual report
Company press
releases and analyst
persection of cash
outflows on acquisitions
Gap Explained Remark
IMC 15,911 14,555 1,356 Exchange difference
Total 15,911 14,555 1,356
FY 11
FY 10
FY 09

Page 14 of 45
Nigeria Export Incentives
MW CLAIM: “The Nigerian export subsidies (called “EEGs”) have been particularly controversial,
with allegations of corruption within the program. Nigeria stops issuing the grants every few years
when the program becomes politically problematic”
This statement is incorrect. Nigeria first introduced export incentives in 1986. From 2000, the
scheme was changed from a cash grant to a Negotiable Duty Credit Certificate (NDCC) which can be
used to pay import duties for one’s own imports or traded in the secondary market to other
importers. From 2001, the scheme was changed to make it a product specific scheme with differing
incentive rates for different products as well as for different levels of local value addition or
manufacturing. This regime was again revised in 2006 (but with retrospective effect from 2005) to
include two separate criteria, including a product specific criteria and a company eligibility rating
based on various parameters and remains active till date. Further, this scheme does not mandate
any direct investment into the country as a pre-requisite for eligibility.
MW CLAIM: “Olam has denied that EEGs are material to its profits (…). We question Olam’s
assertions”
We receive export incentives in Nigeria for two broad activities (a) basic sourcing and export of
agricultural raw materials and (b) for export for value-added products from Nigeria.
In the case of (a) due to the intense competition for scarce raw material (In 2011 there were >200
beneficiary companies who received EEG under the scheme), we have to pass on almost all of this to
our suppliers thereby increasing our cost of procurement. Therefore, what is recorded as export
incentives does not directly flow down to our profits. In the case of (b) the incentive is intended to
offset the higher cost of operations in Nigeria arising from infrastructural deficiency (eg. Lack of
power supply, fuel shortages, logistics bottlenecks etc.). In this case as well, the offset is intended to
make Nigeria a cost competitive exporter of value-added agri commodities rather than a source of
profits for the exporter.
Country SGD Mn Projects
Gabon 339.2 Palm, Fertilizer, SEZ
Nigeria 89.9 CFM, Cashew Mech, Tomato Sachet, Rice Farming
Ghana 65.3 Wheat Mill, PFB
Australia 79.3 Cotton Gin, Wool, Grain elevator, Almonds
Uruguay 49.4 NZFSU
Vietnam 56.4 Soluble Coffee, Spices grinding, Cashew processing
USA 32.6 Almonds, Maintenance capex
Malaysia 19.9 Dairy processing
Ivory Coast 37.3 Cocoa processing, Mechanical cashew, Dairy processing
Mozambique 16.7 Palm Refinery, Cotton gin, Cashew processing
Argentina 10.9 Peanut processing
India 10.0 Maintenance capex
Republic of Congo 6.5 Timber co-gen
Others 61.6
Total 874.9
Fixed assets addition FY 12

Page 15 of 45
MW CLAIM: “There is a backlog of approximately NGN100 billion that is yet to be paid by the
Nigerian government”
Olam has consistently received its EEG in the form of NDCCs since the scheme has been in force. In
FY2012 Olam has received S$114 million worth of export incentives and subsidies, clearly reflecting
the continuity of the scheme.
MW CLAIM: “Nigerian Customs Service quota for duty collection leads to widening of NDCC
discounts from 5% to 20%”
While the discounts do vary depending on the demand and supply of NDCCs, Olam by virtue of being
a significant importer of agri-commodities such as rice, wheat and packaged foods has the flexibility
of using NDCCS for captive use. Further, market-linked discounts are provided upfront at the time of
recording the export incentives in our books.
Recent media reports have stated “the Nigerian Customs Service (“NCS”) says it has not stopped the
utilisation of the certificates for settlements, but is only embarking on close monitoring, to check
abuse. This, it says is typified by importation of other raw materials that are either not contributing
to the growth of the economy, or checking importation of contraband goods.
“I am not aware of any restriction or stoppage of the use of the certificates, but what we are doing is
close monitoring, to stop abuse of the policy. We are only monitoring the implementation to ensure
that it is in line with the objectives of the scheme,” said Wale Adeniyi, National public relations
officer, Nigeria Customs Service.” (http://www.businessdayonline.com/NG/index.php/news/76-hot-
topic/48114-banks-pressure-exporters-as-customs-rejects-credit-certificates)
Level 3 derivatives
MW claim: “The higher Level 3 balance in 2011 may be justifiable; however, it is interesting and
worth noting that the derivative net liability balance of S$468.4 million60 for Level 1 and 2 is
netted out by a new Level 3 net asset balance of S$491.2 million, which left Olam with its first net
asset derivative balance of S$22.8 million on open derivative positions.”
As stated by MW in their own report, some outstanding physical contracts were classified as Level 3
in FY2011 and FY2012 largely on account of lack of independent price discovery mechanism driven
by extreme price volatility, mainly in cotton. Level 3 classification is commonly adopted in our
industry.
MW claim: “The extraordinary increase in sensitivity from S$3.8 million per +/- 1% in 2011 to
S$12.2 million despite a decline in overall value of the Level 3 derivatives”
The increase in sensitivity is on account of an overall increases in the volume of outstanding physical
contracts that were fair valued in FY2012 vis-à-vis FY2011.

Page 16 of 45
BUSINESS MODEL
OUR DIFFERENTIATED STRATEGY IS WORKING, IS YIELDING THE INTENDED RESULTS, AND HAS
HELPED US BUILD LEADERSHIP POSITIONS IN MANY OF OUR BUSINESSES. THEREFORE WE INTEND
THE STAY THE COURSE.
MW CLAIM: “Olam’s trading business appears to be a failing business model”
We have been in this business for 23 years now. For 17 years, we have pursued an asset-lite strategy
focusing on the supply chain part of the business - sourcing & origination, primary processing,
logistics, trading and risk management. We have a differentiated core supply chain business built on
superior origination skills by going to the farm gate and building an extensive network of 3.5 million
farmers. We have also de-commoditised this business by offering value added services and building
a network of 12,300 customers. This fixed asset light part of the portfolio continues to witness
strong growth. Net contribution has increased from $469M in FY2009 to $956M in FY2012. This is a
27% CAGR growth over the last 3 years and is reflective of the continuing strength of this business.
Our strategic planning exercise in 2009 identified a number of attractive growth opportunities across
the value chain that would place us ahead of agri-megatrends. Our expansion into upstream and
mid/downstream is part of this well-thought through strategy.
Our upstream participation is differentiated, providing us a strategic hedge in cost-competitive
producing origins. Our midstream participation and selective value chain integration would help us
gain: security of supply/quality; purchasing, logistical and manufacturing scale effects, while our
limited downstream expansion offers demand visibility.

Page 17 of 45
We are committed to our strategy that we believe is differentiated:
I. Our competitive advantage is driven off a unique portfolio and a proven delivery model
Our uniquely shaped portfolio is a result of:
a) Our focus on a single commodity asset class (agri-complex): Given the growing imbalance
between the supply and demand for food ingredients and agriculture raw materials, agri will
remain an attractive industry with strong growth prospects
b) Well-balanced and diversified portfolio: across 16 platforms and 65 countries with no
platform or country dominating our revenues, earnings or investments
c) Defensible position: Of the 16 platforms that we are in, the top 10 players in our industry do
not compete with us in 6 of those and we have only one competitor in three others
d) Selective integration across the value chain: We have selectively integrated upstream in
plantations and farming across 19 commodities in 22 countries where we believe we have a
cost structure below the marginal cost producer’s cost of production that will allow us to be
viable across commodity pricing cycles. Nobody else in the industry has this upstream profile
e) Leadership positions: We are a global leader in 6 out of the 16 platforms and a regional
leader in 5 others
If MW had even asked our competitors, they would have got a good sense of how effective our
strategy has been in building leadership positions in the industry.
Our differentiated model rests on four key elements:
a) A differentiated core supply chain business: Our superior origination skills enable us to out-
origin our competition by sourcing directly from farm gate having 3.5 million grower
relationships. We have built a network of 12, 300 customers and de-commoditised the
business by offering highly value added services like risk management solutions, inventor
managed inventory solutions, proprietary market intelligence etc.
b) Deep emerging market expertise: 80% of the 65 countries where we are present are
emerging markets. Over time, we have built extensive and strong networks and deep
insights in these countries
c) Scalable adjacency based growth formula (illustrated later)
d) Organisational advantage based on building an entrepreneurial and empowered culture. Our
750 Global Assignee Talent Pool (GATP) managers carry our DNA and business model and
deftly transfer it to adjacent new businesses. This makes growth routine and reflexive,
allowing us to replicate and build a scalable business
II. Our investments so far have been in line with our strategy
Today, we are present in 5 categories across 16 diversified platforms. Our investments over the past
3 years have helped us achieve a successful and significant transformation. We have stayed true to
our governing objective, made investments to back our strategic plan, strengthened our balance
sheet to support those investments, acquired critical new capabilities and built a strong
management team to execute on the plan. The following chart highlights some of the key
investments and growth initiatives implemented in the last three years of the plan that have
transformed our portfolio shape.

Page 18 of 45
All investments are in line with our stated strategy. Twenty-eight out of 33 announced investments
are performing at or above plan, as shown in the tables below.

Page 19 of 45

Page 20 of 45

Page 21 of 45
For example, we invested behind and built a niche, profitable grains business in a complex that is
dominated by the ‘ABCDs’ owning key chokepoints and tradeflows. Our strategy as a new
entrant was to (i) participate in structurally attractive, wheat milling opportunities in sub-
Saharan Africa where we had a differentiated access, superior risk management capabilities and
access to talent; (ii) build an origination & trading business around the milling assets in less
contested, new origins like Russia, Ukraine and Australia; and (iii) selectively enter upstream in
low cost, high yielding origins as a strategic hedge. This strategy has resulted in us reaching
2Million MT in volumes in 3 years. We are now the top 3 exporter in Russia and top 5 out of
Ukraine. The chart below illustrates our path
Page 22 of 45
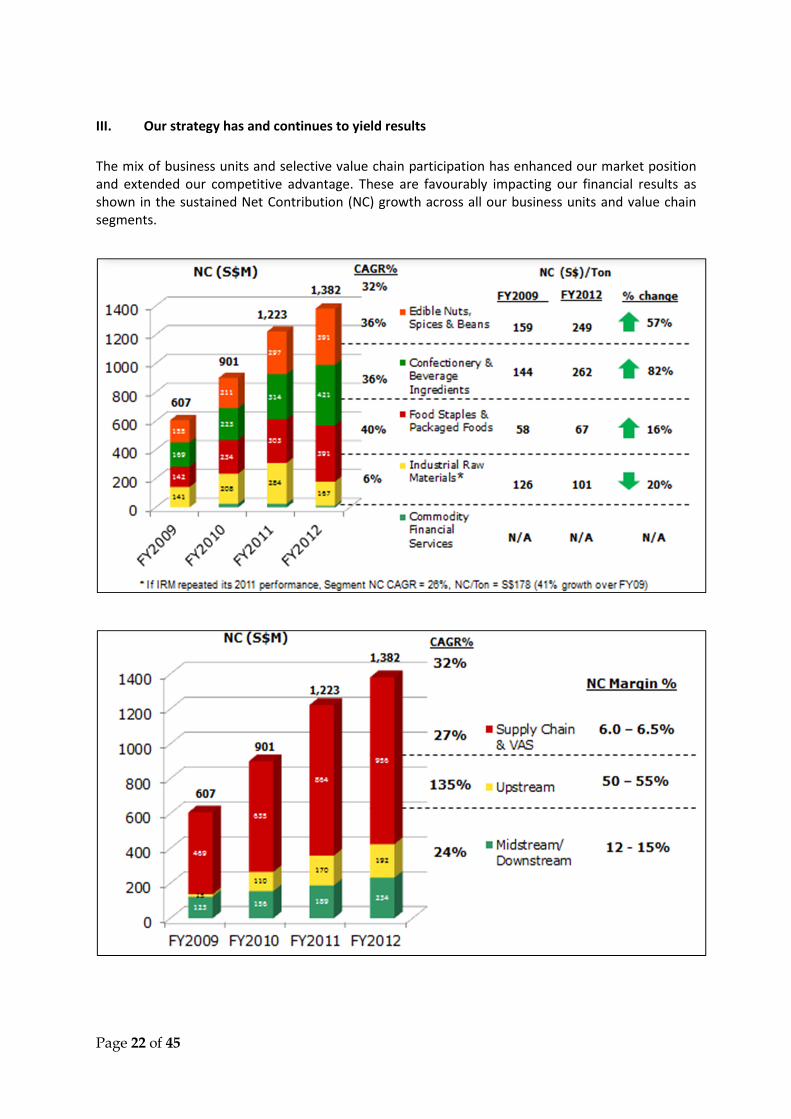
III. Our strategy has and continues to yield results
The mix of business units and selective value chain participation has enhanced our market position
and extended our competitive advantage. These are favourably impacting our financial results as
shown in the sustained Net Contribution (NC) growth across all our business units and value chain
segments.

Page 23 of 45
IV. With a differentiated strategy and a proven track record, we are confident of achieving our
goal of maximizing long term intrinsic value for our continuing shareholders
In 2009, we announced a goal of increasing our intrinsic value by 3-4x over the next two 3-year
cycles. In order to maximize value, we have, are and will impact three drivers:
(a) Open up the capital spread: We have been pursuing this through: (i) selectively integrating
upstream into excess return plantation and farming initiatives (eg. Almond Orchards in
Australia); (ii) selectively integrating into midstream manufacturing and processing assets
(eg. Onion & garlic dehydrates in our SVI platform); and (iii) building choke points in our
supply chain business (eg. cotton ginning capacity we have built in core origins like Australia,
US and Brazil)
(b) Increase the rate of profitable growth: We have a repeatable model that allows us to find
adjacent business opportunities that shares suppliers, customers, channels, costs or
capabilities. Our profitable growth model for a platform is predicated on: (i) expanding into
new origins; (ii) increasing our share of wallet with our customers; (iii) entering into
attractive value chain adjacencies; and (iv) improving margins through value added services.
For example, in our edible nuts platform we started off by focusing on cashews and peanuts.
Expanding into various key origins, we built global leadership positions in our historical core
of trading & origination. We then entered into the mid-stream processing space to capture a
greater portion of the profit pool. Having successfully executed on that, we have now
branched out into other attractive edible nut categories like Almonds and Hazels. This will
allow us to have global integrated value chain leadership in the edible nuts. The chart below
illustrates our growth model in edible nuts.

Page 24 of 45
In addition, we are successfully leveraging our latent assets and capabilities to pursue
growth through new businesses. Participation in agri-inputs (fertilizers), a relatively new
platform was announced as part of our 2009 strategy with a view to leverage our resource
access and grower relationships. In Gabon, we now have access to the one of the cheapest
sources of natural gas which will help us be extremely cost-competitive in the Urea complex.
Chart below illustrates our competitive advantage and excess-return potential in Gabon.
(c) Increase the duration of growth: We have been consciously seeding Horizon II (2016-2021)
growth, balancing it with Horizon I (2011-2016) profit aspiration. Our investments in Gabon
palm plantations, an alternate cost-competitive origin to supply constrained South East
Asian origins is a step in that direction.
This strong early momentum, together with the investments already committed for future growth,
gives us the confidence that we are well on track towards our FY2016 goals: US$1BN PAT, 3-4x
increase in intrinsic value and NPAT margin of >4%.

Page 25 of 45
ACQUISITIONS AND M&A
BOTH ORGANIC CAPEX AND M&A PLANS ARE AN OUTCOME OF A CONSCIOUS AND DELIBERATE
STRATEGY WHICH HAS BEEN WELL ARTICULATED AND CONSTANTLY REFRESHED. WE HAVE A
PROVEN TRACK RECORD OF UNLOCKING VALUE THROUGH ACQUISITIONS.
For example, we have two M&A deals which have performed extremely well and have created a
transformational impact in the competitive position of the respective BU’s / platforms: Queensland
Cotton (QCH) for natural fibres and Crown Flour Mills (CFM) for grains – both of which have been
dismissed as problems by MW.
MW’s central thesis in their report is that they “believe that Olam’s fatal flaw, and one of its best
kept secrets, is that its Capex projects seem to be a fiscal black hole”
We provide below clarification on the ‘issues’ raised on MW’s report regarding olam’s “problem”
acquisitions:
- Crown Flour Mills
- Queensland Cotton
- SK Foods
- NZFSU
- Rusmolco
- Ghana Flour Mill
- Kayass
- Nasarawa Rice Farm
- Gabon Urea Fertilizer Project
Crown Flour Mills (CFM)
The MW report raises four issues with respect to Olam’s acquisition of Crown Flour Mill (“CFM”) in
Nigeria:
1. Poor condition of manufacturing facilities and assets at time of acquisition
2. Olam’s potentially overpaying for the assets in terms of transaction valuation
3. CFM’s poor profitability track record prior to Olam acquisition
4. CFM’s performance post Olam acquisition
MW CLAIM: Poor condition of manufacturing facilities and assets at time of acquisition
The acquired CFM business comprised two mill complexes – Tin Can Island and Warri. The total
installed capacity of CFM at the time of acquisition was 1,550 MT per day, breakdown of which is
outlined below:
Installed Capacity At the time of acquisition Current
MT / day Tin Can Warri Tin Can Warri
Mill A 200 300 240 300
Mill B 400 250 420 250
Mill C 400 NA 420 NA
Total 1,000 550 1,080 550

Page 26 of 45
Based on 280 days production per year assumption as used in the MW report, installed capacity of
1,550 MT / day translates into an annual production capacity of 434,400 MT.
We were aware of the fact that the machinery was not in the best state of up keep at the time of
acquisition and required certain maintenance expenditure. However these mills, manufactured by
Buhler, the global leader in milling machinery, were clearly in running condition. With a total
incremental capital expenditure of US$5.6m, Olam refurbished the existing machinery and expanded
the capacity at Tin Can Mill complex from 1,000 MT/ day to 1,080 Mt/day as summarized in the table
above.
Further, CFM did have a Mill D which was defunct at the time of acquisition in a building within the
Tin Can Mill complex. The capacity of this mill was neither considered at the time of acquisition nor
used to date. Olam now has demolished the building in order to install new mills to expand its
capacity. This expansion comprises a new Mill D and E at Tin Can and new Mill C at Warri with
capacities of 250 MT / day each. This will increase the total milling capacity of CFM by an additional
750 MT / day.
In this regard, photographs on page 56 of the report are factually incorrect - Area B highlighted as
New Construction was part of the complex acquired and hence not new construction at all. Area C
highlighted construction in progress relates to expansion work in progress started in FY 2012
highlighted above.
As per MW report (Page 63), FY2011 total annual flour production stands at 257,367 MT which
implies quantity of wheat milled of 330,000 MT and in FY2010 6 month flour production was
137,594 tons implying wheat milled of 176,402 MT. This translates into an FY 2011 capacity
utilisation of 76%, which is above Nigeria average as well as our investment forecasts prepared at
the time of acquisition. The question that one must ask is how outdated, obsolete and allegedly poor
state of plant and equipment allowed us to mill more than 500,000 MT of wheat (@ >75% capacity
utilisation) within the first 18 months of our acquisition.
MW CLAIM 2: Olam’s potentially overpaying for the assets in terms of transaction valuation
At the outset we believe all the assertions made by MW in relation to valuation up lift by previous
owner and revaluation post Olam acquisition is totally irrelevant. The value of a milling asset lies in
its ability to get the job done, which for CFM has been sufficiently demonstrated in point 1.
As stated in Olam’s acquisition announcement January 12, 2010, the total enterprise valuation (EV)
of mill is US$87.6m. Based on the installed capacity of 1,550 MT / day, this implies an EV / MT of US$
202 / MT. It is pertinent to note that the implied entry multiple of Olam’s CFM acquisition is below
EV / MT of US$ 215 – 472 / MT of a recent comparable transaction in Nigeria earlier this year.
We believe given the port based location of both the mill complexes, available installed capacity at
the time of acquisition, expansion potential, platform of entry into Nigeria market and replacement
cost of new machinery for a similar capacity, Olam acquired CFM at a reasonable valuation.
MW CLAIM 3: CFM’s poor profitability track record prior to Olam acquisition
We were very well aware of CFM’s poor financial performance track record. This was driven by low
capacity utilisation as well as low manufacturing efficiencies. As stated in MW report page 60, CFM
generated revenues of only S$100.6 m to S$157 m per annum over 2006 to 2009.
MW CLAIM 4: CFM’s performance post Olam acquisition
As also stated in MW’s report page 63, post Olam’s acquisition FY2011 revenue was S$215.6 m. This
represents a 37.3% increase over FY 2009. Is this not enough proof of a successful implementation of
a turnaround plan?

Page 27 of 45
MW alleges that our EBITDA numbers of US$35 m is overstated compared to actual performance of
FY2011 and FY2010 (half year). It is pertinent to take note of the following:
- Steady state EBITDA estimate of US$35m pertains to FY2013. Hence FY2011 EBITDA
US$11.8m and FY2010 (half year) EBITDA of US$8.2 m is not a like-for-like comparison.
- More importantly the above FY2010 and FY2011 EBITDA numbers completely disregards the
profitability on account of wheat procurement, freight management, suppliers’ credit and
hedging margins. The margins for these activities are not reflected in CFM books as risks
arising from such activities are not carried by CFM.
- CFM is actually one of the best performing acquisitions of Olam to date and is generating
EBITDA and returns in excess of its investment thesis. Further, it is pertinent to note that
wheat milling is a global business with profitability driven by global wheat origination,
trading, and ocean freight management as much as processing at the mill complex.
Queensland Cotton (QCH)
In 2006 Queensland Cotton Corporation acquired the Warren, Mungindi and Collymongle cotton
gins from Twynam Agriculture. A condition of the sale agreement was that for a specified volume
(with a time period cap), Twynam Agricultural had to ensure the cotton production from specific
named farms was provided to QCC for both ginning and marketing. The transaction price was $25m
with an additional $10m of incentive payments due over a number of years if Twynam delivered
certain volumes for ginning to QCC. On acquisition of QCC by Olam as asset was recognised
representing the probable bales delivered by Twynam and an offsetting liability was recognised
representing the probable incentive payments payable to Twynam. As the bale commitment was
necessarily recognised as an asset on acquisition, when these bales were delivered there was
minimal profit impact as the asset was written down accordingly.
This period was during a sustained drought in Australia. As a result of this drought, the health of the
Murray Darling Basin became a public political issue and in response to this the Federal Government
made a decision to purchase Permanent Water Entitlements from irrigators for release of the water
for environmental flows. In May 2009, after a number of years of drought, Twynam Agricultural
made a decision to sell a number of Permanent Water Entitlements to the government for $303m.
This was a commercial decision made independent of Olam. This represented guaranteed cash flow
now and represents many years of profits that could be made from producing cotton. The intention
of the company was that in wet years, dryland cotton would still be grown. At the time of entering
into the agreement the potential sale of permanent water rights on such a scale was not considered
a possibility. Additionally, with QCC being the beneficiary of the volume commitment there was no
mechanism for this agreement to be reviewed during a QCC change of control. There were terms in
the agreement that ensured that if any of the properties were sold that Twynam needed to ensure
that new owners continued under the existing terms of the agreement. OIL was fully aware of the
terms of this agreement on acquisition, however the size of the commitment by Twynam did not
result in it being a "key supplier" and was not material to the financial outcomes of the business.
Regardless, the agreement was unable to be renegotiated when QCC was purchased by Olam given
the terms entered into by QCC management pre acquisition.
The financial impact of Twynam selling their water was negligible. The company wrote off the bale
commitment asset of A$3.1m and released the incentive payment provision of $2.9m. Due to the

Page 28 of 45
small volumes that Twynam were providing and the fact that the commitment period was almost at
an end, the forward profit impact was also negligible.
Since 2009, as the drought passed the QCC business has ginned and marketing record volumes of
cotton and increased its market share from prior to the Olam acquisition. The vast majority of
produced cotton in Australia is available to be contracted for ginning and marketing in each crop
year. The volume and financial outcomes for the business are not a result of long term commitments
for volumes such as Twynams but as a result of relationships, our network of marketing officers, and
our attractive prices able to be offered as a result of our risk management practices.
SK Foods/ Olam’s Tomato Business
MW CLAIM 1: “Negative goodwill is likely unjustified”
As explained earlier while addressing negative goodwill, fair value assessment of acquired assets is a
mandatory requirement under SFRS 103. In this particular instance, the valuation of SK Foods was
done by an independent Big 4 accounting firm. The firm determined that the proper basis to value
the assets was “value-in-use” since we intended to continue operating the assets in a continuous
business operation. They then considered the cost approach, market approach and income approach
in their valuation to arrive at the total fair value of the assets which was then reviewed by our
auditors.
MW CLAIM 2: “PP&E valuation increased”, “contesting tax assessment”
It is not appropriate to compare the fair value of real and tangible personal property for IFRS
purposes with those considered for property tax assessments. Property tax assessors utilize changes
in asset ownership to reset real and tangible personal property values to their estimate of fair
market value regardless of the values assessed for tax purposes of the previous asset owner. Upon
our acquisition of the assets, both Kings county and Colusa county assessors reviewed the
bankruptcy filings and utilized the documentation and the change in ownership as a basis to conduct
an audit. The Kings County assets were valued at approximately US$73 million and the Colusa
County assets were valued at approximately US$54 million for a total of approximately $127 million.
These values were determined by the assessors without any input from us.
Property taxes are assessed by grouping assets by type by year of acquisition into various tables that
depreciate the assets at varying amounts over their useful lives. We decided to file our appeal with
both King and Colusa Counties as we determined that each assessor had grouped our assets into the
incorrect table which had the effect of depreciating the assets at the incorrect rate, thus overstating
the values that were being assessed for property tax purposes. We were advised by legal counsel
assisting with the property tax appeals that a common practice is to indicate an opinion of value that
was 10% of the assessed value in an effort to expedite the appeals process. We did not propose
these values to indicate that we thought the assets were only worth 10% of their assessed value.
It should also be noted that the Muddy Waters report lists only the SK Foods assets of US$80 million
for the Lemoore location. RHM Industrial/Specialty Foods, Inc. is a separate legal entity that owned
the Williams assets. That filing shows additional book value of fixed assets of $46 million. The two
together show total fixed assets book value of $125 million which is in line with our valuation.

Page 29 of 45
MW CLAIM 3: “Assets still underperforming”
The business underperformance in FY2012 was primarily on a temporary market-led demand and
supply imbalance and not reflective of sustainable industry margins or our execution capacity.
The following two charts highlight the global supply and demand (“S&D”) issues that have been
weighing down the industry:
Global S&D has a one to two year lag to flush out inventory levels that are the result of
unprecedented production levels. In 2009, the year that Olam purchased the assets of SK Foods,
China and the EU experienced their highest production tonnage of processed tomatoes. The above
chart shows the return to normalized levels post 2009. The EU production will continue to decline
due to the elimination of agricultural subsidies and China has experienced labour cost increases
(Chinese harvest is manual as opposed to the mechanized harvest of the US) of 100% in the last five
years along with increased transportation costs. The global tomato industry has been under pressure
to liquidate the 2009 inventories due to shelf life issues.
During our 3 years of ownership, we have completely changed the business through initiatives such
as agricultural improvements (including increasing our internal farming capabilities which reduces
our raw tomato cost), proper matching of tomato varieties to production and sales plans, asset
improvements/investments, quality changes, increased retail mix (from 22% of business in FY10 to
37% in FY13), long-term contracts (5-10 years) with key customers, increase in higher margin
organic/value added business (from 20mm lbs. in FY10 to 55mm in FY13), significantly increasing our
export volumes from FY10 to FY13 (to approx. 120mm lbs.), etc. Any efficiency built into the current
model reflects these efforts and will not require any additional capital or systemic change in our
operations.
Some key data points are:
Self-farming acreage went up from 500 acres in 2011 to 2800 in 2013.
Sales volumes have grown from 285 m LBS in 2010 to 538 m LBS in 2012

Page 30 of 45
NZFSU
The MW report raises three issues with respect to Olam’s Investment in NZFSU:
• Accounting disclosure issue with respect to year ending June 2009 and cosy relationships
between NZFSU, management company PGG Wrightson and PGG contract companies
• Potentially flawed business plan driven a by New Zealand based dairy farming system,
involving predominantly grass feeding, being not viable for a Uruguayan environment
• No improvement on the quality of the management and issues related to recent operating
and financial performance and capex requirements
MW CLAIM 1: Accounting disclosure issue with respect to year ending June 2009 and cosy
relationships between NZFSU, management company PGG Wrightson and PGG contract companies
This is completely irrelevant to Olam as it occurred under a different management prior to Olam
taking control of NZFSU. The issue was known to Olam and NZFSU was investigated for this by NZX
and subsequently cleared. Further Olam on gaining control changed the board, got PGG completely
out of NZFSU and terminated its management contract.
MW CLAIM 2: Potentially flawed business plan driven a by New Zealand based dairy farming
system, involving predominantly grass feeding, being not viable for a Uruguayan environment
The report has offered nothing more than repeating issues raised by Olam to the previous
management team during its takeover offer. As an instance, the Olam’s public bidder statement
dated 6th August 2010 clearly states that “In Olam’s opinion, the current operational strategy
needs significant changes. New Zealand’s soil and climatic conditions lead to exceptional levels of
grass growth and grass quality compared with most other dairying regions in the Southern
Hemisphere. Many dairying countries, including Uruguay, have a more tropical climate and hence are
not able to produce either the same quantity or quality of grass as New Zealand. Dairy farms in such
countries therefore tend to use higher levels of supplemental feed including grains/concentrates to
achieve optimum levels of production.”
Olam’s investment thesis was clearly based on this determination that a pure pasture based Dairy
model would not work in Uruguay. Since takeover Olam has implemented a hybrid pasture and feed
model with significant improvement in operational parameters (this however does mean that cash
cost of production in Uruguay will be higher than that in New Zealand. On total cost of production,
Uruguay would be amongst the lowest given the lower capital cost of land vs. New Zealand – in
particular for the cost at which NZFSU was acquired)
MW CLAIM 3: No improvement on the quality of the management and issues related to recent
operating and financial performance and capex requirements
Within three months of assuming control, Olam employed new CEO David Beca based in Uruguay,
with significant experience in dairy farming in Australia, New Zealand and South Africa. He brought
in best practices, spearheaded the implementation of revised business plan results of which are
reflected in the steady improvements in operational performance to date.

Page 31 of 45
Note: Olam acquired control in the middle of FY 2011, too late to impact the spring milking flush.
Further improvements in 2012 operating performance have been achieved despite adverse weather
conditions.
With regards to recent financial performance, as acknowledged in NZFSU’s 2012 full year results, it
has been behind the business plan formulated post the takeover of NZFSU. While there has been
improvement in operational metrics the pace of improvement is slower than expected. However,
that has not changed the long term view on profitability and attractiveness of this investment.
Rusmolco
The MW report (Page 79-80) raises two issues with respect to Olam’s Rusmolco Investment.
MW CLAIM 1: Announced purchase price of “up to” US$75m compared with an actual cash flow of
S$8.5m
The announced purchased price, as in most cases, is subject to adjustments to net working capital at
closing of the transaction. In this case, irrespective of the net working capital at close, US$ 75m was
agreed as a cap on total Olam’s investment.
At closing, Olam paid a total S$88.2m (US$ 69.9m) as consideration for the acquisition (page 140 AR
2012), off which S$77.6m injected as new equity and the remaining S$10.6m paid to existing
shareholder towards purchase of part of their shareholding.
The MW report very selectively only highlights the actual cash flow of S$8.5m from page 138 AR
2012 which, as clearly stated, refers to cash outflow on acquisition of subsidiary net of cash and cash
equivalents acquired. The MW report interestingly does not even refer to the note on Page 140 AR
2012 explaining the total investment amount with respect to the acquisition.
MW CLAIM 2: Olam and Rusmolco’s ability to implement the envisaged business plan
Olam has revamped the management team bringing in new hires with significant relevant
experience. Rusmolco is still an early stage of implementation, and Olam remains confident of its
ability to execute the business plan and deliver forecast performance.
YE June 2008 2009 2010 2011 2012 2013B 2016F
Total Dairy Livestock Number 43,228 49,756 52,867 58,502 71,995 83,091 83,624
Milking Herd ** Number of cows 3,915 10,620 16,430 24,016 32,166 44,949 48,226
Milking Area *** Hectares 2,473 7,332 11,327 12,619 14,459 15,752 15,752
Milk Production Million litres 13.4 44.6 68.0 105.3 152.0 220.5 296.0
Milk Production / ha KgsMS/ha/yr 380 420 420 584 752 980 1,316
Milk Production / cow KgsMS/cow/yr 240 290 290 307 338 343 430
Cost of Production **** Cents / litre ***** 53 40 47 42 34 26
** number of average milking cows in herd over year
*** average number of milking hectares over year
**** cost of production = (operating expenses less non-milk operating revenue) / milk production
***** increased from 1 to 12 operating dairies during year so cost of production not interpretable

Page 32 of 45
Ghana Flour Mill
MW CLAIM: “Cost overrun of 74.6%”
The revision in the planned capital expenditure was on account of an enhancement of project scope
to provide for future capacity expansion. The increased cost was on account of site infrastructure
including increased storage silos as well as enhanced civil structures which will reduce the time and
capital required for future capacity expansion.
Capacity utilization levels at the facility ranged from between 50% to 70% during the initial period of
commercial production. These were on account of running varying setup configurations at the mill as
well as matching production output with distribution reach.
The increase in planned investment in Ghana does not reflect a commitment on the part of Olam.
Rather, it reflects our intent to evaluate Ghana as an attractive investment destination. Actual
commitments will be made only after conducting detailed evaluation of various investment
opportunities.
Kayass
MW CLAIM: “Olam’s purchase of Kayass Enterprises just before the close of FY2012 is worrying,
and its projections for the business approach the absurd”
The acquisition of Kayass was fully coherent with our strategy and presented a clear excess return
opportunity that Olam could exploit on the basis of our current strengths in distribution and
marketing in Nigeria
- Attractive categories: Juices and dairy beverages in Nigeria are attractive and sizeable
categories with total market size of US$1.2B, growing at a double digit clip and having high
gross margins of 38-45% in juices and 22-27% in dairy beverages.
- Acquisition as a strategic entry strategy:
1. Underperforming asset under prior owners: Primarily driven by high debt burden to
finance new plant investment and inability to finance working capital needs due to
prior owners’ mismanagement.
2. High quality manufacturing asset: Beverage manufacturing plant is only about two
years old and has been built to European standards.
3. Faster time to market: Setting up a Greenfield facility of this quality requires least 24
to 30 months in our assessment.
- Olam’s ability to add value: Olam has a strong track record in Packaged Foods Business in
Nigeria where we now have one of the strongest distribution and marketing infrastructure.
Our brands and products enjoy top 2 positions in 4 categories in Nigeria: Seasoning (MSG) at
over 50% market share, Tomato Paste at over 25%, Biscuits at over 16% and Candies at over
24%. We believe that this demonstrated track record of achieving strong market share gains
against established market players proves our capability to build market shares in Juice and
Dairy beverage categories as well.

Page 33 of 45
In our Investment Thesis assumption, we had factored a very conservative assumption of achieving
only 10% market share by year 2016-17 (after considering category growth) to project the estimates
of EBITDA of 20% in 2016 and equity IRR of 35%. This is on account of very high gross margin
structure of the industry and our ability to execute on the ground in Nigeria. We also derive
considerable cost and revenue synergies through shared sales, distribution and marketing
operations across our categories. We remain convinced of the strategic merits of this case.
Nasarawa Rice Farm
MW CLAIM 1: “Rice farm in a remote, difficult to access section of Nasarawa State”
The farm is located in middle belt of Nigeria which serves as the food bowl of Nigeria. It is 36 km
from Makurdi city, capital of Benue State, with a population of 500,000 and 60 km from the largest
grain market, Doma , in Nasarawa state. Both places are accessible by roads that are in reasonable
condition.
MW CLAIM 2: “We question the wisdom of such large investments in a region that experiences an
intense rainy season, chronic flooding, and suffers from an underdeveloped system of
infrastructure”
Fadama land is a lowland basin and a widely used source of crop production. Up to 70% of Nigerian
crops are grown in lowlands and are not impacted by frequent floods. Agronomy at the chosen site
has been proven with 500 ha of wheat cultivated in this farm in the past. Further, the site also
features a dyke protection system. In the last 4 years we have been operating model farms at the
site and have not faced any flood event till this current event. The polder protection system around
the cultivated areas is built to withstand upto 70.3msl of flood level (a level which was reached first
time in this site’s history in 2012).
This year’s flood has been declared as a 1 in 40 year event (source: NASA) and a 1 in in 100 year
event in Nigerian media and is not reflective of normal flood probability over the project life.
Olam has explicitly stated that the main incremental risk of pursing upstream investments is
weather. That is one risk factor that cannot be mitigated by management action. It is precisely for
this reason that we have not concentrated our upstream investments in any one crop or region. For
example, we are pursuing rice farming across both Nigeria and Mozambique, almonds across
Australia and the US, coffee across Laos, Ethiopia, Tanzania and Zambia etc. The incremental
weather risk, we believe, is more than compensated by the significantly higher return potential
which means that even on a risk-adjusted basis, it is financially rewarding to allocate some part of
our investment dollars to selective upstream investments. In line with our diversification and risk
mitigation strategy, we have further announced that a maximum of 10% of our balance sheet will be
invested in upstream farming by FY2016.
Current status on the ground is that the flood waters have receded and we have replanted 400
hectares with planting of an additional 600 hectares planned to be completed during December
2012 / January 2013.

Page 34 of 45
MW CLAIM 3: “We believe it is extremely unlikely Olam can achieve the targeted production
levels”
Most countries with a bimodal rainfall pattern and a precipitation level below 1500 mm annually
have demonstrated 2 crops per year. In our farm we have just planted the second crop under
irrigated condition over 400 Ha. This confirms the feasibility of 2 crops per year at the site and also
reflects the minimal damage to the farm infrastructure during the recent floods.
Over the last two years, Olam has conducted extensive testing hybrid seeds through SGAT
(Singapore Agri Tech) who have extensive experience in Asia on seed development with high yielding
and hybrid varieties, and local varieties through Africa Rice Centre (WARDA) which have yielded 5-6
tons per hectare. This information is also stated in the CGIAR Africa report.
Financial impact of the flood
Olam had planted an area of 400ha and the crop was around 40 days old when it was impacted by
the flood. The financial impact has been approximately US300K. More importantly, there has been
minimal damage to the infrastructure and we were able to repair the same within 5 days of the
water level receding. As on date, the area has already been planted with the second crop.
Pictures of the rice field taken in November 2012 are shown below.
Nasarawa Rice Farm, November 22, 2012

Page 35 of 45
Nasarawa Rice Farm, November 27, 2012
References
http://www.africarice.org/publications/StrategicPlan/AfricaRice_Strategic_Plan_2011-2020.pdf
http://earthobservatory.nasa.gov/IOTD/view.php?id=79404
http://www.businessdayonline.com/NG/index.php/analysis/commentary/46134-the-great-nigerian-
2012-flood-pt-2
Gabon Urea Fertilizer Project
There have been various doubts and questions cast over the project – which we would like to clarify
as below:
a) We realize the complex nature and size of the project, and as such we have ensured that we
provide regular updates on this project, with the most recent one being the Q1 FY2013
results announcement in November, wherein we have addressed some of the issues raised
again in the MW report.
b) Olam’s Gas supply agreement with Republic of Gabon (ROG) is already in place for a tenor of
25 years on a fixed price basis. ROG in turn has a back to back production sharing agreement
with the local Oil & Gas operator - Perenco. Perenco is headquartered in London, and has a
large stake in the O&G sector in Gabon. Their commitment to ROG for gas supply is very
secure, and they have the infrastructure to service GFC’s gas requirements.

Page 36 of 45
c) Gas DD was done by RPS Energy for Olam and GCA for Lender group has established
sufficient availability of the gas for the fertilizer project.
d) 2010 GCA report on Gabon gas reserves estimates the gas reserves in Gabon to be >2.3 TCF
mid case and not 1 TCF as asserted by MW.
e) Since Gabon has a power surplus, there are no other alternative uses of Gas. Further, a gas
flaring regulation is under preparation and is expected to be enacted in the near future.
f) Project execution – We have come a long way since the project was conceived. We have
completed the two major activities of Front end engineering design (FEED) as well as the
ESIA. IFC and AFDB have already posted the ESIA report in their respective websites. The
Open Book Estimate (OBE) is under final review and LSTK will be awarded shortly after that.
Due to the delays in OBE/LSTK negotiations, we’ve already signaled that there is an overall
delay and we expect the project to now get commissioned in the first quarter calendar 2016.
g) Tata Chemicals Limited will contribute to Equity only on Financial Closure as per the
investment conditions agreed.
h) The current imports of Sub Saharan Africa and South America for urea is 2M MT and 7.5M
MT respectively. So even if US stops importing Urea, GFC has a sufficiently large market,
which it can service most cost effectively. While we are tracking the recent developments of
Shale gas in the US/Canada, we do not expect them to have any significant impact on the
liquidity for Gabon urea, or viability of the project.
i) Last, but not the least, the lender’s group consisting of major DFIs, ECAs and commercial
lenders are still fully aligned behind the project and have completed most of their due
diligence – which was a very involved and multi-stakeholder effort over the last 9-10
months.

Page 37 of 45
OTHER CLAIMS
Individuals named:
Perhaps the most egregiously incorrect points made were in regard to various individuals. The
Muddy Waters report highlights the legal and commercial difficulties of two individuals who had sold
their businesses to Olam. Implying that Salyer’s ‘racketeering’, was in some way related to Olam –
placing it as a headline with no matching comment in the table of contents, was an attempt to
mislead and distort the facts. The events cited which indeed led to legal proceedings against Mr
Salyer in the USA, took place without any association with Olam and before we purchased his
businesses.
There was a mention of Mr. Ravikumar, our former CFO, he was a very effective and a long service
member of our team and a good friend to Olam. He was not, however, slated to replace the CEO
and was not even a member of the main Board. The reasons he left have nothing to do with the
reasons tabled and had to do entirely with an exceptionally attractive offer elsewhere, which he
took up with our best wishes and full support to him and his family.
To suggest that Scott Salyer or Labbabidi had anything to do with our company, and that Ravi left for
any culpable reason whatsoever, are entirely at odds with both fact and reality. In fact Olam has a
very unique track record of attracting back a lot of people who left the company to try out other
things. We have 15 people in senior managerial positions (Band A-C) who have rejoined the
company. Amongst our Global Assignee Talent Pool, for the last three years, our voluntary attrition
rates have been 7%, 6.2% and 9.5% respectively and it has been in single digits for the four years
preceding that. Our employee engagement scores for the last three employee engagement surveys
82%, 83% and 83% respectively which is in the top decile globally. Olam is the first and only
Singapore company to be named in the 2009 lists for the Global Top Companies for Leaders and the
Top Companies for Leaders in the Asia Pacific region by Hewitt Associates, the RBL Group and
Fortune. Olam also won the 2012 Asian Human Capital Award as the best company in Asia for
Human Capital Management.
Responses to pages 92/93 of the Muddy Waters report:
1. Timber Democratic Republic of Congo allegation unsubstantiated
In 2007, Olam Timber was buying from third parties in DRC but had in place appropriate internal
systems to ensure our suppliers complied with legality and traceability requirements as well as the
laws of the land including payment of all taxes. However, we found that there were a few instances
where some of our suppliers managed to deliver their cargoes to us while being in contravention of
the internal systems and documentation processes that had been laid out. As a result, we closed
down and exited the wood business entirely in DRC. In 2007, Olam purchased the equivalent of 3%
of the total country timber supply exported. Additionally, Olam paid $37,400 on behalf of those
suppliers that had not paid their taxes.
Olam has since revised its timber strategy to continue its operations under direct ‘concession
management’ to recognised sustainable forestry management standards moving towards
certification. Currently 65% of Olam’s timber supply chain is FSC certified with the balance in the
process of moving to third party certification.
2. Olam’s approach to Land Management

Page 38 of 45
Olam is committed to growing our business responsibly. As we move into activities upstream that
include farming and plantations, we take great care when acquiring the rights to own or operate on
the land through lease/tenure arrangements with national Governments. As a matter of course, it is
very unusual for Olam to hold land ownership.
Before any land development starts, we carry out thorough due diligence processes that include
Environmental and Social Impact Assessments (ESIA) and High Conservation Value assessments to
the highest international standards.
In addition, we undertake community engagement to obtain the free, prior and informed consent of
local communities (FPIC) which takes into consideration cultural, spiritual and religious importance
of land affected and notes any areas relied on for meeting the basic needs of communities in terms
of their own subsistence.
We engage specialist, independent third party environmental and cultural consultants to carry out
these assessments on our behalf which usually start with extensive audits on the ground. To ensure
robust internal systems, we have developed a full social audit process for all plantations and have
continued to successfully be audited against FSC and RSPO NPP requirements.
In the long term, Olam strives to continue to work closely with partners to value natural capital to
advise products of improved natural management and develop improved internal systems for
investments and monitoring impacts.
3. Granting of land rights in Laos (Update: 3rd October 2012)
This statement details the background and actions taken with regard to a dispute by local villagers,
over the granting of land rights in the Paksong District, Laos, where Olam operates a coffee growing
subsidiary, Outspan Bolovens.
Olam is committed to growing our business responsibly, applying the highest international standards
of best practice in surveying and assessing the social and environmental impact of cultivation of land
under our stewardship. A survey of the land in question was conducted according to national laws
and regulations and we commenced our development in the belief that there were no issues
outstanding. However, in December 2011, an international NGO brought some issues concerning
this plantation to our attention so we acted promptly to investigate.
We appointed an international consultancy to define a comprehensive approach and methodology
so that we could conduct a thorough audit of the alleged situation. As a result, a dedicated three
person team of non-Olam personnel was dispatched to carry out this audit on the ground. The team
comprised two Dutch consultants: one in natural resources to focus on land issues; the other a social
specialist on community based issues; and the third, a local consultant, to ensure that cultural and
gender considerations were handled appropriately.
This team conducted a full review with all local stakeholders, comprising the Government,
community leaders, and local farmers. Following the conclusions and recommendations of this
stakeholder review, we are currently in a consultation period to seek resolution with the
communities. We had hoped this would be completed in 12 weeks but to ensure all voices are heard
the consultation is still ongoing.
Amongst the recommendations, we sought the reactivation of the provincial Government-led
Committee, which had been established in early 2011 to address any potential local issues

Page 39 of 45
concerning plantation developments. This has subsequently been made effective and a local NGO is
also advising farmer representatives on the Committee.
In addition, we have appointed a qualified, local community specialist to ensure that we are able to
build strong local relationships and contribute to economic development within the area. This
includes recently meeting with a local NGO to better understand community perspectives; during
that session we were able to respond directly to a number of farmers who had been invited by the
NGO.
Our community specialist is now visiting each village to listen to individual concerns. Queries and
claim submissions can be made directly to Olam, which helps to avoid the often lengthy national
government grievance procedures. A clear deadline for our response is given to all enquiries and
submissions.
Permissions regarding land development
A specific criticism has been levelled at Olam - that land development commenced on an area
beyond the 150 hectares originally granted by the provincial Government, before we had the
permissions in place from national Government to plant a larger area.
It had been our understanding that this was the accepted practice - that the decision as to the grant
and use of land is made at local level where a survey is done and a map produced and, if no
reservations are expressed, it is sent to national Government in order that a certificate can be
formally issued. i.e. in local practice, possession of the certificate is merely a formality once the
provincial recommendation has been made. Olam is now fully cognisant of the difference between
national standards in Laos compared with international practices that we consider appropriate for
our work.
4. Olam International’s subsidiary CIB – a pioneering REDD+ initiative to realise value from
standing forests
Olam International’s subsidiary CIB (Congolaise Industrielle des Bois) and the Government of the
Republic of Congo (Brazzaville) announce a new Public Private Partnership (PPP) that aims to create
a viable commercial framework to realise value from standing forests under the REDD+ scheme in its
Pikounda Nord concession. This pioneering pilot is the first commercial deployment of the REDD+
(short for Reducing Emissions from Deforestation and Forest Degradation) option for sustainable
forest management in the Congo Basin. Olam International Ltd. acquired forestry company CIB in
January 2011. CIB manages 1.4million hectares of concessions in the Republic of Congo (R.O.C.) of
which 1.3 million hectares are Forestry Stewardship Council™ ( FSC™) certified – to date the largest
contiguous FSC™ certified tropical forest concessions in the world. The Pikounda Nord concession
which comprises the remaining 92,530 hectares is located in the Sangha region in the heart of the
Congo River Basin. The objective of this pilot initiative is to generate alternative revenues from
sustainably managed forest landscapes by valuing the forest as a carbon sink and to originate carbon
credits for the pre-compliance Voluntary Carbon market. This market is considered best practice and
recognised by the global carbon community as able to generate solid and marketable credits.
CIB has initiated a robust consultation process that adheres to the principles of the Free & Prior
Informed Consent (FPIC) methodology for this project. In addition, with the continual community
engagement across the broader concession area for many years, a good understanding has been
reached about the needs of the local community. Pikounda Nord has no human inhabitants but a

Page 40 of 45
revenue sharing arrangement will be agreed with the local communities in consultation with the
Government of the Republic of Congo.
5. Mozambique cashew processing worker dispute
Payment to processing workers is not simply a minimum wage but productivity linked minimum
wage as per the local regulations for the cashew sector. Processing productivity is negotiated and
agreed with staff representatives. Thus if a person does not process the minimum output, they will
not achieve the minimum wage level.
All other allegations referring to toilets are baseless.
CONCLUSION
This note is to make all our stakeholders aware of the deep bias and inappropriate conclusions
that MW/CB have drawn in their “research reports” prepared and distributed by a self-confessed
and avowed “short seller”, whose purpose is to pursue a profit pathway characterised by an
admitted “conflict of interest” (their own words, not ours) vs our pathway of building long term
lasting value for all our continuing stakeholders.
Having had the opportunity to study this report overnight, we would like to reiterate our position
that the conclusions drawn in the report are without merit. A number of irrelevant statements and
photographs, isolated facts taken out of context, unjustified observations and other elements of
spurious argument have been woven together to create a false fabric of a story which is neither
substantiated by the real facts nor consistent with any credible interpretation with the true and
full facts about our company.

Page 41 of 45
APPENDIX 1: “S&P RESEARCH ON ANALYZING AGRICULTURAL INVENTORIES”

Page 42 of 45

Page 43 of 45
APPENDIX 2: EXAMPLES OF BIOLOGICAL ASSETS
KEY DEFINITIONS:
1. Agricultural activity is the management by an entity of the biological transformation
of biological assets for sale, into agricultural produce, or into additional biological
assets.
Agricultural activity covers a diverse range of activities; for example, raising livestock, forestry, annual or perennial cropping, cultivating orchards and plantations, floriculture, and aquaculture (including fish farming). Certain common features exist within this diversity:
• Capability to change. Living animals and plants are capable of biological
transformation;
• Management of change. Management facilitates biological transformation by
enhancing, or at least stabilising, conditions necessary for the process to take
place (for example, nutrient levels, moisture, temperature, fertility, and light).
Such management distinguishes agricultural activity from other activities. For
example, harvesting from unmanaged sources (such as ocean fishing and
deforestation) is not agricultural activity; and

Page 44 of 45
• Measurement of change. The change in quality (for example, genetic merit,
density, ripeness, fat cover, protein content, and fibre strength) or quantity
(for example, progeny, weight, cubic metres, fibre length or diameter, and
number of buds) brought about by biological transformation is measured and
monitored as a routine management function.
2. Agricultural produce is the harvested product of the entity’s biological assets.
3. A biological asset is a living animal or plant.
4. Biological transformation comprises the processes of growth, degeneration, production,
and procreation that cause qualitative or quantitative changes in a biological asset.
Biological transformation results in the following types of outcomes:
• asset changes through (i) growth (an increase in quantity or improvement in
quality of an animal or plant), (ii) degeneration (a decrease in the quantity or
deterioration in quality of an animal or plant), or (iii) procreation (creation of
additional living animals or plants); or
• production of agricultural produce such as latex, tea leaf, wool, and milk.
5. A group of biological assets is an aggregation of similar living animals or plants.
6. Harvest is the detachment of produce from a biological asset or the cessation of a
biological asset’s life processes.
HOW ARE BIOLOGICAL ASSETS VALUED
SFRS 41 is a FAIR VALUE based model. This basis of valuation has two main advantages:
• For assets that have a long life cycle (such as plantations, timber), there is a
significant time lapse between planting and first harvest and under the historical cost
model, no income is reported until first harvest
• Fair value reflects better current value of the biological assets. As biological
transformation takes place, it directly impacts the expected economic benefits from
the asset while the historical cost model continues to reflect the asset at its acquisition
cost which is often disconnected from its current value
IAS 41 ACROSS THE GLOBE
Accounting boards of various countries around the world have yet to reach a consensus on a universal application of the standard. Accordingly, there are variances in the treatment of biological assets from country to country. In Singapore, FRS 41 is a MANDATORY standard. A comparison of the standard across some other countries is shown below:

Page 45 of 45
A few of the companies that adopt FRS 41 (or its equivalent) are: Jardine Cycle & Carriage, Wilmar, Indofood Agri Resources, Golden Agri-Resources, First Resources, Global Palm Resources, REA Holdings, Anglo-Eastern Plantation, New Britain Palm Oil, Almarai Company, Alpcot Agro, Adecoagro