oklahoma 2012 ces benchmark
TRANSCRIPT


Oklahoma 2012 CES Benchmark
A publication from Oklahoma Employment Security Commission
Economic Research and Analysis Division
P.O. Box 52003 Oklahoma City, OK 73152-2003
Richard McPherson, OESC Executive Director Lynn Gray, Director of Economic Research and Analysis
May 2013
Equal Opportunity Employer/Program Auxiliary aids and services are available upon request to individuals with disabilities.
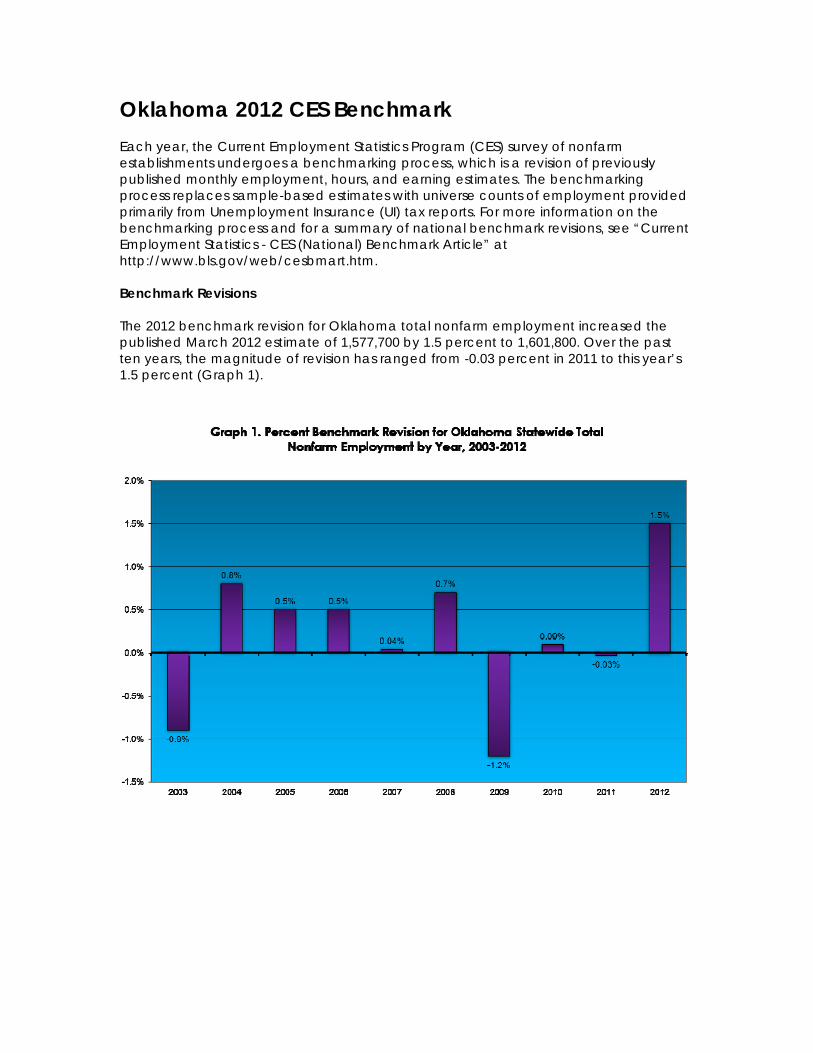
Oklahoma 2012 CES Benchmark Each year, the Current Employment Statistics Program (CES) survey of nonfarm establishments undergoes a benchmarking process, which is a revision of previously published monthly employment, hours, and earning estimates. The benchmarking process replaces sample-based estimates with universe counts of employment provided primarily from Unemployment Insurance (UI) tax reports. For more information on the benchmarking process and for a summary of national benchmark revisions, see “Current Employment Statistics - CES (National) Benchmark Article” at http://www.bls.gov/web/cesbmart.htm. Benchmark Revisions The 2012 benchmark revision for Oklahoma total nonfarm employment increased the published March 2012 estimate of 1,577,700 by 1.5 percent to 1,601,800. Over the past ten years, the magnitude of revision has ranged from -0.03 percent in 2011 to this year’s 1.5 percent (Graph 1).

Five industries had downward revisions, and six had upward or no revisions (Graph 2). The largest revision was in Education and Health Services (+7.2%). Professional and Business Services (-0.4%) and Manufacturing (-1.2%) had the smallest revisions while Trade, Transportation and Utilities (0%) had no revision.

Benchmark Employment In 2012, Oklahoma total nonfarm employment gained 19,200 jobs over the year. This brought employment over 2007 levels and only 6,200 jobs less than the peak in May 2008.

Graph 4 shows total nonfarm employment broken out by industry. Government, which includes jobs in public schools, law enforcement, and tribal government (including casino employment), had the largest portion of employment with 356,200 jobs, followed by Trade, Transportation, and Utilities with 296,000 jobs. The smallest industries were Information (22,100 jobs) and Mining and Logging (57,000 jobs).

The industries with the highest over the year change as a percentage of the industry’s employment level are Leisure and Hospitality, Mining and Logging, Manufacturing, and Information (Graph 5). Leisure and Hospitality Services and Financial Activities had the largest annual changes in terms of number of jobs gained or lost, followed by Trade, Transportation, and Utilities and Government. Eight industries increased over the year, while three decreased. Graphs 6-9 show a few industries in more detail over the past ten years.

