oiv - paris, march 11 2013 world wine supply chain survey: comparison among argentina germany and...
TRANSCRIPT

OIV - Paris, March 11 2013
World wine supply chain survey:
comparison among Argentina Germany
and ItalyANTONIO SECCIA
Department of Agro-Environmental and Territorial Sciences (Di.S.A.A.T.)
UNIVERSITY OF BARI

Classes (hectares) Italy Germany Argentina
< 1 63.888 6.200 2.018
1 - 2 70.713 6.400 5.269
2 - 5 141.973 17.000 24.724
5 - 10 105.405 30.000 34.749
10 - 20 71.969 30.400 43.073
20 - 50 51.383 2.400 56.584
50 - 100 18.375 2.800 32.835
> 100 22.916 2.200 28.734
Total 546.621 97.400 227.986
Area of farms by vineyard size

Area of farms by vineyard size %
Classes (hectares) Italy Germany Argentina
< 1 11,7 6,37 0,9
1 - 2 12,9 6,57 2,3
2 - 5 26,0 17,45 10,8
5 - 10 19,3 30,80 15,2
10 - 20 13,2 31,21 18,9
20 - 50 9,4 2,46 24,8
50 - 100 3,4 2,87 14,4
> 100 4,2 2,26 12,6
Total 100,0 100 100,0

Area of farms by vineyard size %
50,6
32,4
17,0Italy
30.39
62.01
7.60
Germany
14.0
34.151.8
Argentina
< 55-20> 20

Number of farms by vineyard size
Classes (hectares) Italy Germany Argentina
< 1 146.974 11.000 3.919
1 - 2 49.912 4.500 3.820
2 - 5 45.670 5.200 7.631
5 - 10 15.445 3.780 4.987
10 - 20 5.358 2.000 3.103
20 - 50 1.777 60 1.899
50 - 100 279 40 485
> 100 104 20 172
Total 265.519 26.600 26.016

Number of farms by vineyard size %
Classes (hectares) Italy Germany Argentina
< 1 55,35 41,35 15,06
1 - 2 18,80 16,92 14,68
2 - 5 17,20 19,55 29,33
5 - 10 5,82 14,21 19,17
10 - 20 2,02 7,52 11,93
20 - 50 0,67 0,23 7,30
50 - 100 0,11 0,15 1,86
> 100 0,04 0,08 0,66
Total 100,00 100,00 100,00

Number of farms by vineyard size %
91.35
7.83 0.81
Italy
77.82
21.73
0.45 Germany
59.0831.10
9.82
Argentina
< 55-20> 20

Farm average size
0.00
1.00
2.00
3.00
4.00
5.00
6.00
7.00
8.00
9.00
10.00
Italia 2,06
Argentina 8,76
Germania 3,66
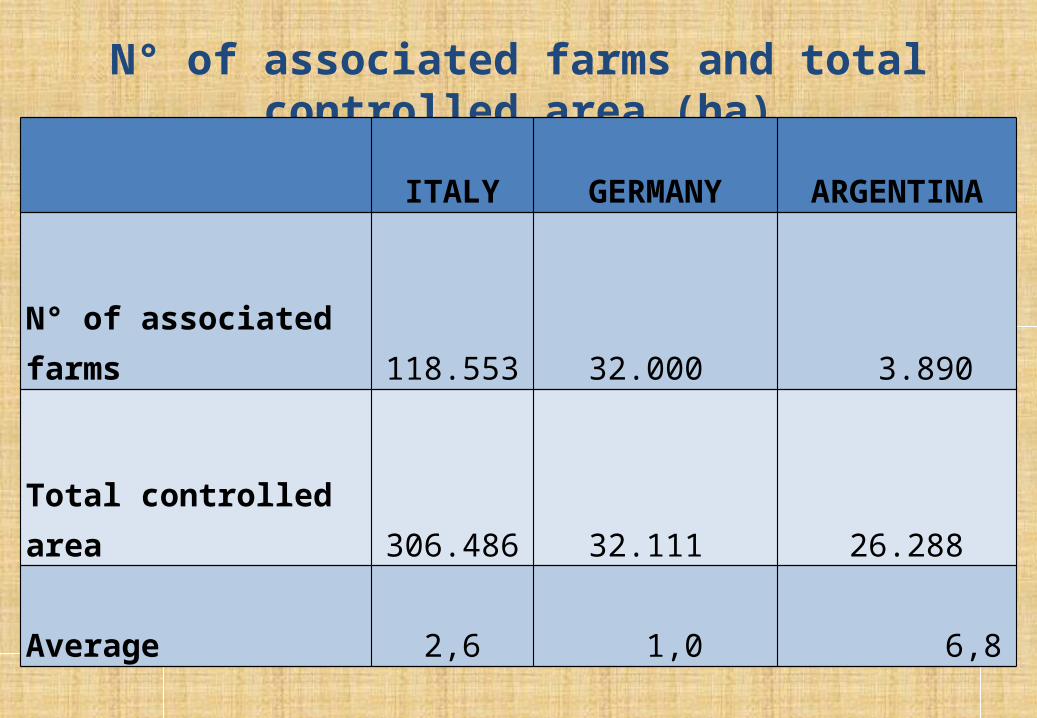
N° of associated farms and total controlled area (ha)
ITALY GERMANY ARGENTINA
N° of associated farms 118.553 32.000 3.890
Total controlled area 306.486 32.111 26.288
Average 2,6 1,0 6,8

Self consumption and total controlled area (ha)
ITALY GERMANY ARGENTINA
Number of farms 118.179 10.000 2.052
Total area controlled (ha)
312.865 1.500 55.593

Flows of grape from the grape production system to the wine making system (in
volume)
ITALY GERMANY ARGENTINA
% self processed 14 62 20
% individually traded 42 5 62
% delivered to co-operatives for processing
or trade44 33 18
total 100 100 100

Integrated wineries
ITALY GERMANY ARGENTINA
% Integrated wineries
95,4 95,0 12,5
% Not integrated wineries
4,6 5,0 87,5

Number of physical wineries by classes
Classes of processing capacity
ITALY GERMANY ARGENTINA
< 500 hl 29.402 4.000 108
500 - 10.000 hl 4.071 5.540 466
10.000-50.000 hl 763 50 296
> 50.000 hl 229 20 79
Total 34.465 9.610 949

Wine production of physical wineries by classes
Classes of processing capacity
ITALY GERMANY ARGENTINA
< 500 hl 2.239.229 720.000 23.121
500 - 10.000 hl 5.694.855 4.780.000 1.804.440
10.000-50.000 hl 12.759.368 1.000.000 6.389.147
> 50.000 hl 29.959.225 3.500.000 7.786.679
Total 50.652.677 10.000.000 16.003.387
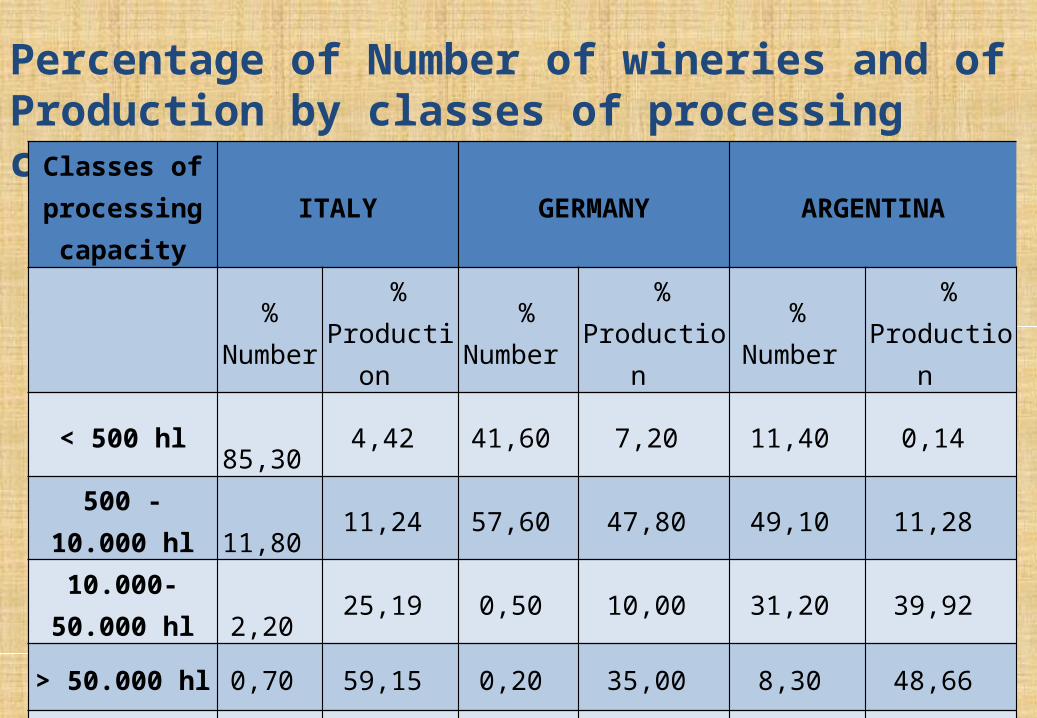
Percentage of Number of wineries and of Production by classes of processing capacity
Classes of processing capacity
ITALY GERMANY ARGENTINA
%
Number %
Production %
Number %
Production %
Number %
Production
< 500 hl 85,30 4,42 41,60 7,20 11,40 0,14
500 - 10.000 hl 11,80 11,24 57,60 47,80 49,10 11,28
10.000-50.000 hl
2,20 25,19 0,50 10,00 31,20 39,92
> 50.000 hl 0,70 59,15 0,20 35,00 8,30 48,66
Total 100,0 100,0 100,0 100,0 100,0 100,0

Distribution of wineries and production between private firms and cooperatives
ITALY ARGENTINA GERMANY
Number Production (hl) Number Production (hl) Number Production (hl)
Cooperatives 647 26.555.391 63 2.891.341 142 3.100.000
Private wineries
33.818 24.097.287 886 13.112.046 9.448 6.900.000
Total 34.465 50.652.678 949 16.003.387 9.590 10.000.000
ITALY ARGENTINA GERMANY
Number Production (hl) Number Production (hl) Number Production (hl)
Cooperatives 1,9 52,4 6,6 18,1 1,5 31,0
Private wineries
98,1 47,6 93,4 81,9 98,5 69,0
Total 100,0 100,0 100,0 100,0 100,0 100,0

Number of wine bottlers and their distribution by sales capacity
Classes of processing capacity
ITALY ARGENTINA GERMANY
Number % Number % Number %
< 5.000 hl 7.225 94,6 520 82,0 7.500 98,0
5.000 - 10.000 hl
148 1,9 26 4,1 80 1,0
> 10.000 hl 262 3,4 88 13,9 70 0,9
Total 7.635 100,0 634 100,0 7.650 100,0

Self consumption and traded wine
ITALY GERMANY ARGENTINA
% wine for self consumption
4 1 1
% traded wine 96 99 99
Total 100 100 100
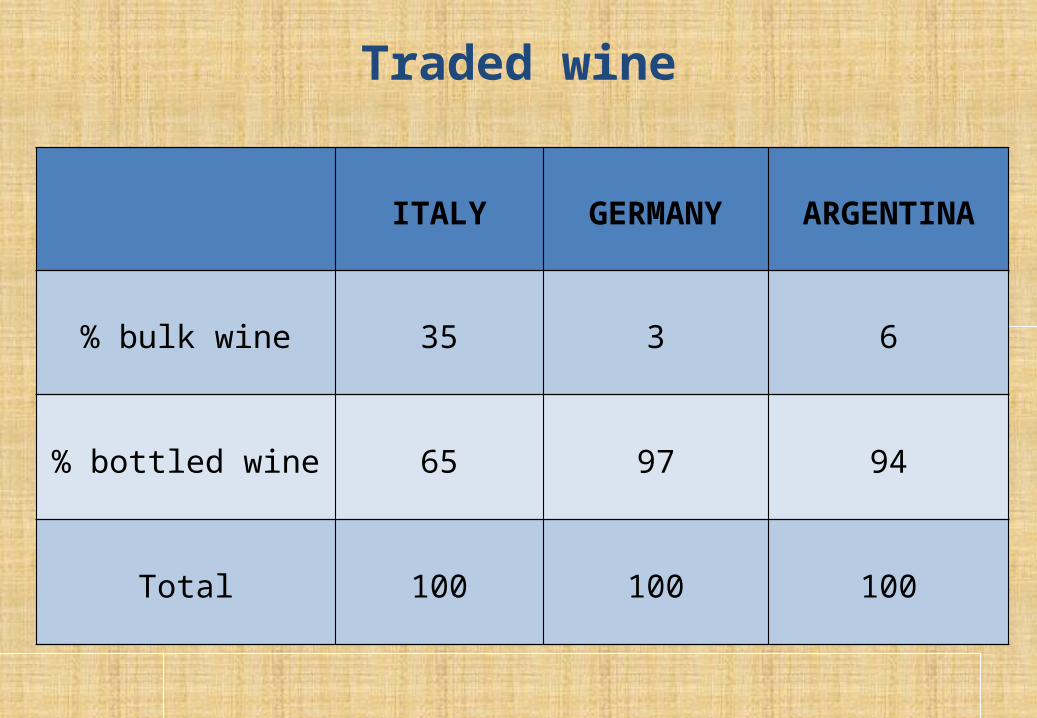
Traded wine
ITALY GERMANY ARGENTINA
% bulk wine 35 3 6
% bottled wine 65 97 94
Total 100 100 100

Bottled wine
ITALY GERMANY ARGENTINA
% bottled wine with producer label
- 40 -
% bottled wine with label of a wine bottler
- 20 -
% bottled wine with private label
- 40 -
Total 100

Distribution of wine
ITALY GERMANY ARGENTINA
% of wine sold off trade 85 82 -
% of wine sold on trade 15 18 -
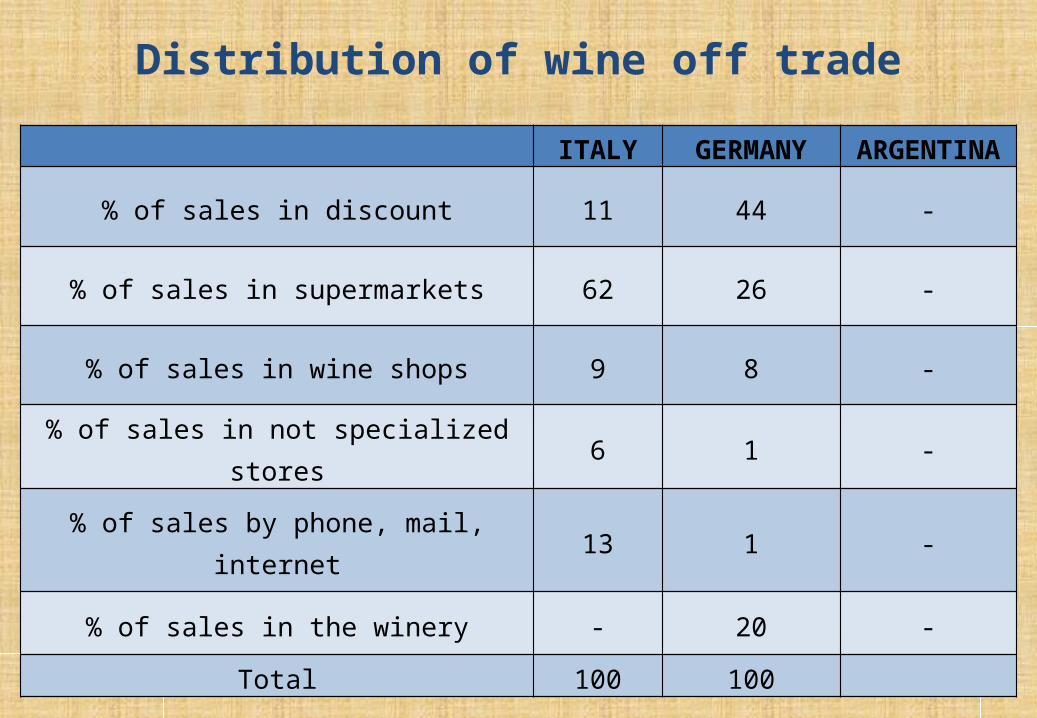
Distribution of wine off trade
ITALY GERMANY ARGENTINA
% of sales in discount 11 44 -
% of sales in supermarkets 62 26 -
% of sales in wine shops 9 8 -
% of sales in not specialized stores 6 1 -
% of sales by phone, mail, internet 13 1 -
% of sales in the winery - 20 -
Total 100 100

Distribution of wine off trade
11
62
9
6 13 ITALY% of sales in dicount
% of sales in supermarkets
% of sales in wine shops
% of sales in not specialized stores
% of sales by phone, mail, in-ternet
% of sales in the winery
44
26
8
1 1
20
GERMANY

Distribution of wine on trade
10
50
20
20
GERMANY
% of sales to catering companies
% of sales to restaurant chains
% of sales to hotel chains
% other

OIV - Paris, March 11 2013
Thank you
ANTONIO SECCIA
[email protected] of Agro-Environmental and Territorial Sciences
(Di.S.A.A.T.)UNIVERSITY OF BARI