oil prices—a long-term perspective
TRANSCRIPT

Oil prices - a long-term perspective
Dr Timothy Morgan THE TRAUMATIC COLLAPSE in world crude oil prices which took place in the first half of 1986 may reasonably be described as the “third oil shock”, following the two large price rises which occurred in the 1970s. Beyond its immediate impact on the economies of oil-producing countries, this third oil shock has major longer-term implications both for the techniques and for the results of oil market forecasting. The central point to be addressed by this paper is the fact that the events of last year fell far beyond the parameters in- corporated in pre-1986 scenario planning, and as such must prompt a funda- mental reappraisal in three main areas. First, the events of 1986 require a major re-evaluation of the supply, demand and price outlook for the balance of the century. Secondly, the movement of oil prices beyond the existing parameters of scenario planning must give rise to a reappraisal of the ap- proach to the forecasting of oil economics. Thirdly, the events of 1986 take OPEC strategists into completely new territory; indeed, one of our conclu- sions is that OPEC’s outstanding success, during 1987, in sustaining its cohe- sion and its price structure, has been facilitated by the Organization’s clear adherence to an effective long-term strategy.
We are therefore concerned here with three main points: the changes in the long-term oil market outlook; the fundamental reappraisal of forecast- ing techniques which these changes must prompt; and the strategic options now available to the OPEC alliance.
The oil market landscape with which the world has become familiar since 1974 has been fundamentally and irrevocably changed by the traumas of early 1986. As the old maps are torn up and the cartographers start again, we endeavour to identify in this paper some of the new landmarks.
Demand The decade before 1986 gave extremely limited empirical guidance to
the impact on consumption of sharp falls in oil prices. Although real crude prices drifted away from the two crisis-driven peaks of the early and late 1970s, such declines were, pre-1986, essentially gradual; the upwards rapidity of oil prices during the crises had no directly comparable downwards counter- part in speed or effect. Moreover, the 1986 collapse is still too recent for the magnitude and nature of its longer-term effects to be fully apparent. Certainly the demand consequences of a sharp price fall cannot necessarily be assumed
The author is Senior Energv Anabst at the London-based international stockbrokers, W.I. Carr L td.
Winter 1987 325
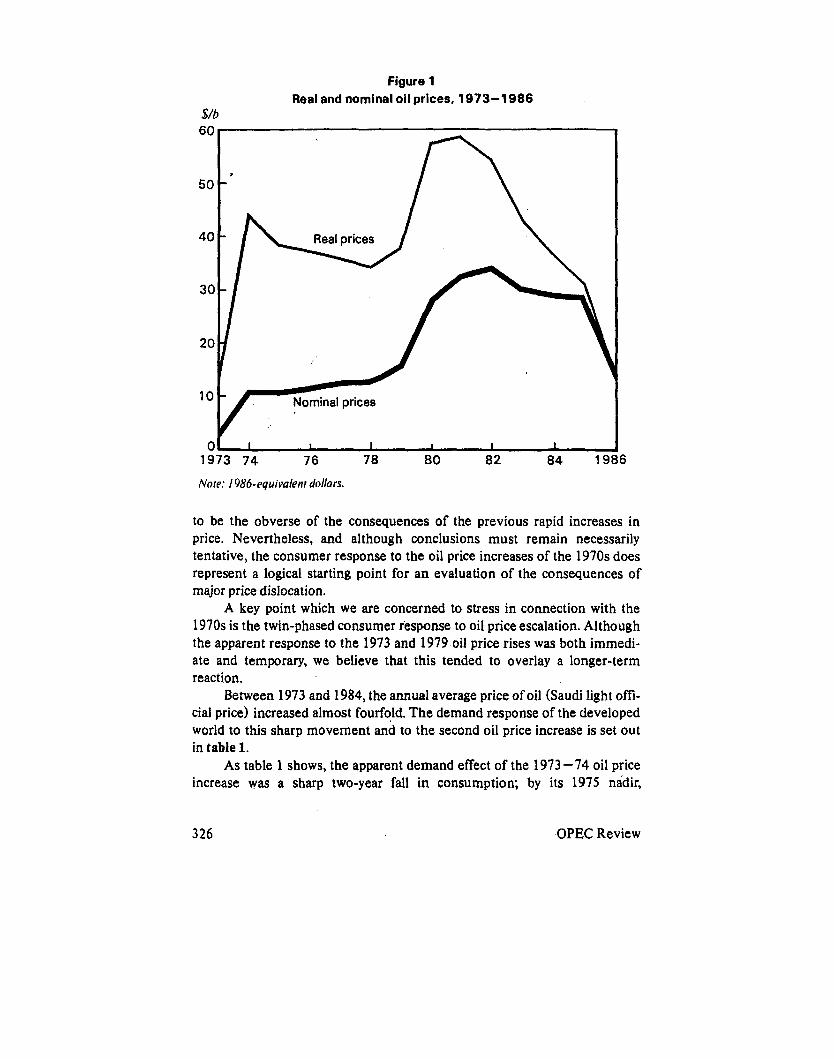
Figure 1 Real and nominal oil prices, 1973-1 986
$/b
40
Nominal prices 10
I I I I I I
84 19' 01
1973 74 76 78 80 82 i
Note: 1986-equivalent dollars.
to be the obverse of the consequences of the previous rapid increases in price. Nevertheless, and although conclusions must remain necessarily tentative, the consumer response to the oil price increases of the 1970s does represent a logical starting point for an evaluation of the consequences of major price dislocation.
A key point which we are concerned to stress in connection with the 1970s is the twin-phased consumer response to oil price escalation. Although the apparent response to the 1973 and 1979 oil price rises was both immedi- ate and temporary, we believe that this tended to overlay a longer-term reaction.
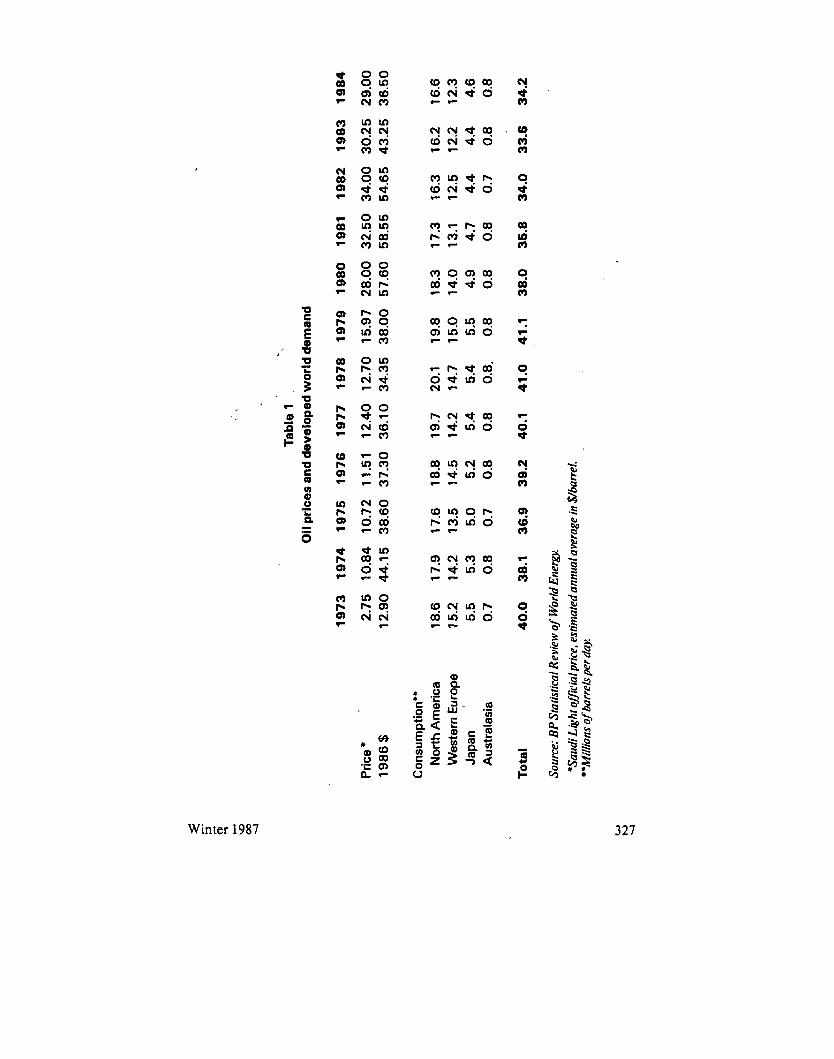
Between 1973 and 1984, the annual average price of oil (Saudi light offi- cial price) increased almost fourfold. The demand response of the developed world to this sharp movement and to the second oil price increase is set out in table 1.
As table 1 shows, the apparent demand effect of the 1973-74 oil price increase was a sharp two-year fall in consumption; by its 1975 nadir,
326 OPEC Review
.. .
Tabl
e 1
Oil
pric
es a
nd d
evel
oped
wor
ld d
eman
d
1973
1974
1975
1976
1977
1978
1979
1980
1981
1982
1983
1984
Pric
e *
2.75
10
.84
10.7
2 11
.51
12.4
0 12
.70
15.9
7 28
.00
32.5
0 34
.00
30.2
5 29
.00
1986
!§ 12
.90
44.1
5 38
.60
37.3
0 36
.10
34.3
5 38
.00
57.6
0 58
.55
54.6
5 43
.25
36.5
0
Con
sum
ptio
n"
Nor
th A
mer
ica
18.6
17
.9
17.6
18
.8
19.7
20
.1
19.8
18
.3
17.3
16
.3
16.2
16
.6
Wes
tern
Eur
ope
15.2
14
.2
13.5
14
.5
14.2
14
.7
15.0
14
.0
13.1
12
.5
12.2
12
.3
Japa
n 5.
5 5.
3 5.
0 5.
2 5.
4 5.
4 5.
5 4.
9 4.
7 4.
4 4.
4 4.
6 A
ustr
alas
ia
0.7
0.8
0.7
0.8
0.8
0.8.
0.
8 0.8
0.
8 0.
7 0.8
0.8
To
tal
40.0
38
.1
36.9
39
.2
40.1
41.0
41
.1
38.0
35
.8
34.0
33
.6
34.2
Sour
ce: B
PSta
tistic
al R
evie
w of
Wor
ld E
nerg
y.
'Mill
ions
of b
arre
ls pe
r day
. 'S
audi
Lig
ht o
ffici
al pr
ice,
estim
ated
ann
ual a
vera
ge in
$/b
arre
l.
m b/d 6 0
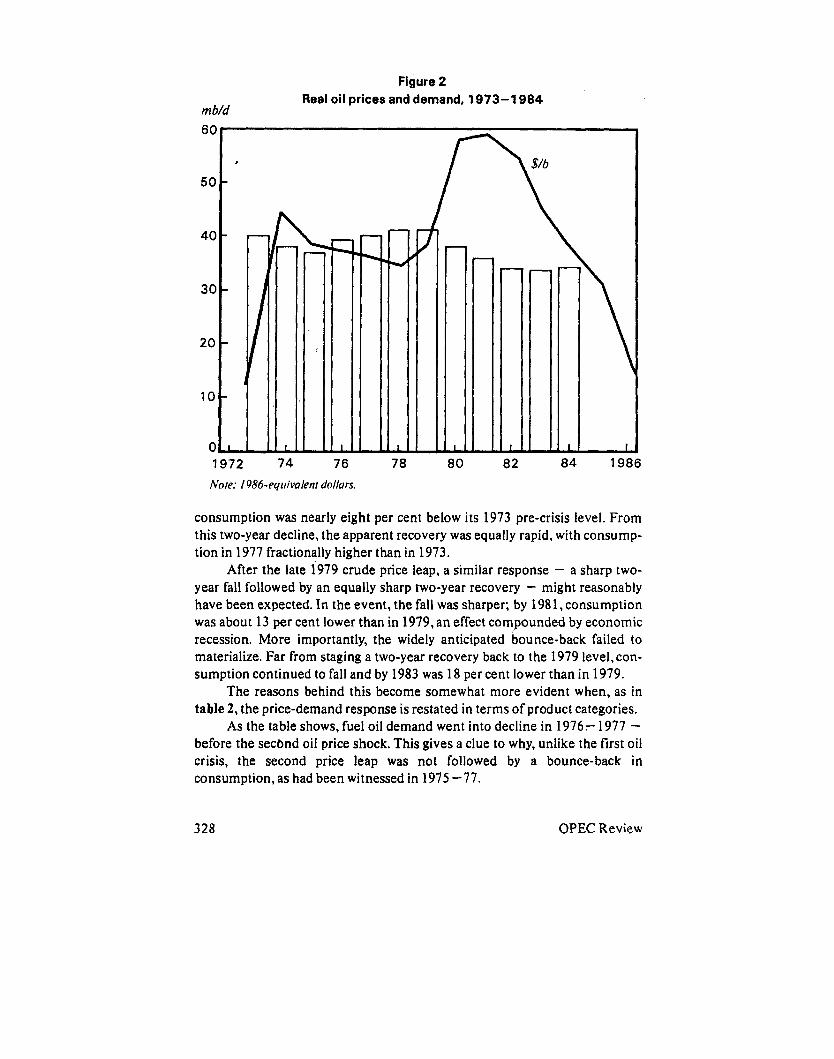
Figure 2 Real oil prices and demand, 1973-1 984
, 50 -
40 - - 30 -
20 -
10 -
0 1 1972 74
- Y
A 1 76 78 80 82 8 4 1986
Note: 1986-eqirivalent dollars.
consumption was nearly eight per cent below its 1973 pre-crisis level. From this two-year decline, the apparent recovery was equally rapid, with consump- tion in 1977 fractionally higher than in 1973.
After the late 1979 crude price leap, a similar response - a sharp two- year fall followed by an equally sharp two-year recovery - might reasonably have been expected. In the event, the fall was sharper; by 1981, consumption was about 13 per cent lower than in 1979, an effect compounded by economic recession. More importantly, the widely anticipated bounce-back failed to materialize. Far from staging a two-year recovery back to the 1979 leve1,con- sumption continued to fall and by 1983 was 18 per cent lower than in 1979.
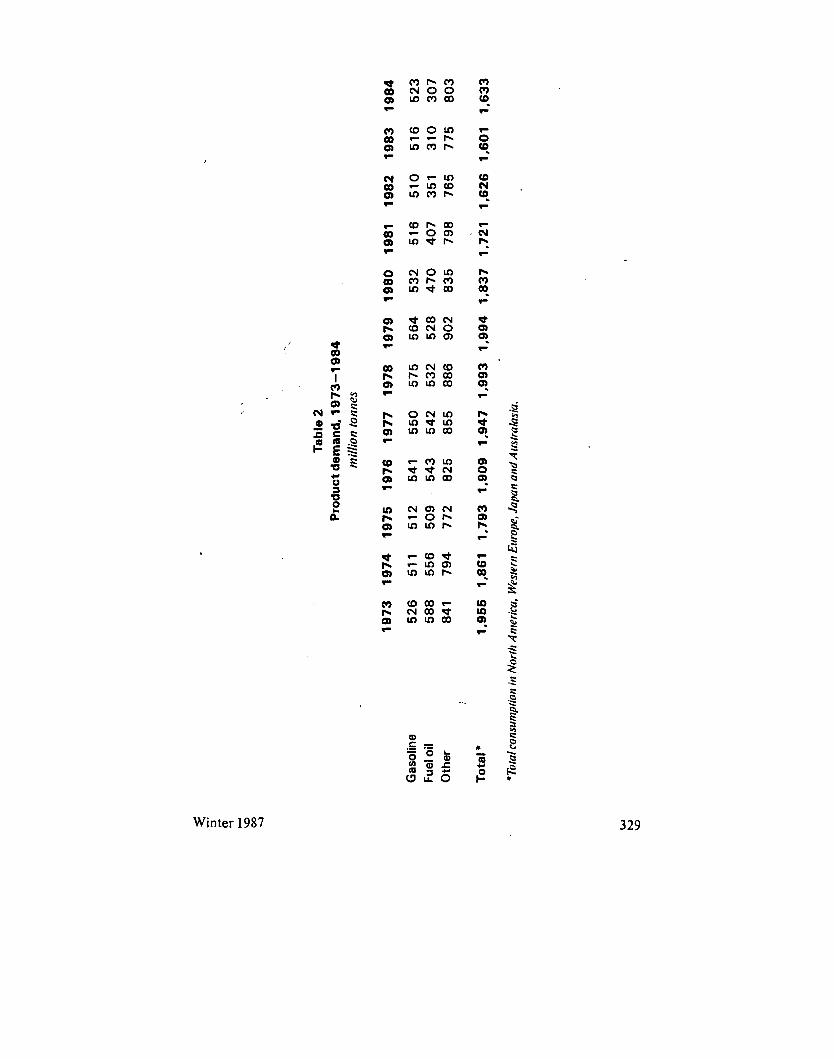
The reasons behind this become somewhat more evident when, as in table 2, the price-demand response is restated in terms of product categories.
As the table shows, fuel oil demand went into decline in 1976- 1977 - before the second oil price shock. This gives a clue to why, unlike the first oil crisis, the second price leap was not followed by a bounce-back in consumption, as had been witnessed in 1975 -77.
328 OPEC Review
.. .
Tabl
e 2
Pro
duct
dem
and,
197
3-1
984
mill
ion
tonn
es
19
73
1
97
4
1975
19
76
19
77
19
78
1979
1
98
0
1981
1
98
2
19
83
1
98
4
Gas
olin
e 5
26
5
11
5
12
5
41
5
50
57
5 5
64
5
32
51
6 5
10
5
16
5
23
Fu
el o
il 5
88
5
56
5
09
54
3 5
42
5
32
5
28
4
70
4
07
3
51
3
10
3
07
O
ther
84
1 7
94
7
72
82
5 8
55
8
86
9
02
8
35
7
98
76
5 7
75
8
03
Tota
l *
1,95
5 1,
861
1,79
3 1,
909
1,94
7 1,
993
1,99
4 1,
837
1,72
1 1,
626
1,60
1 1,
633
/
*Tai
al ca
nsun
iptia
n in
Nar
ili A
nier
ica.
Wes
lem
Eur
ape,
Japa
n an
d A
ustr
alas
ia.
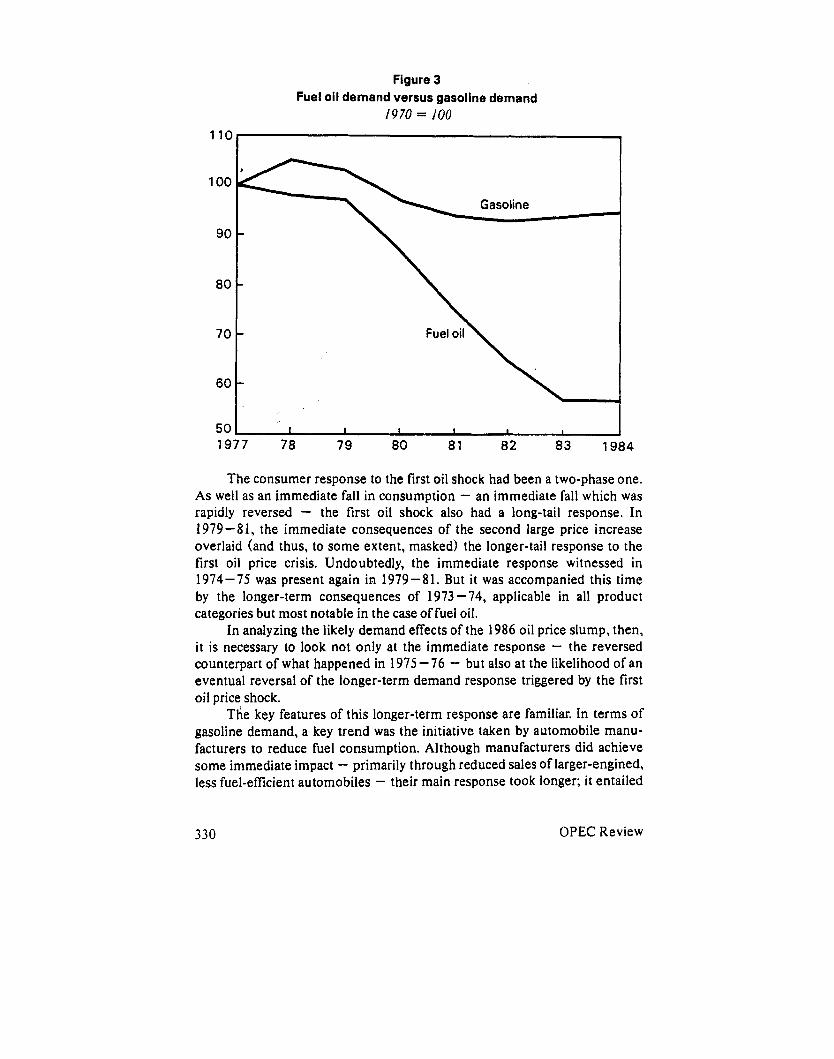
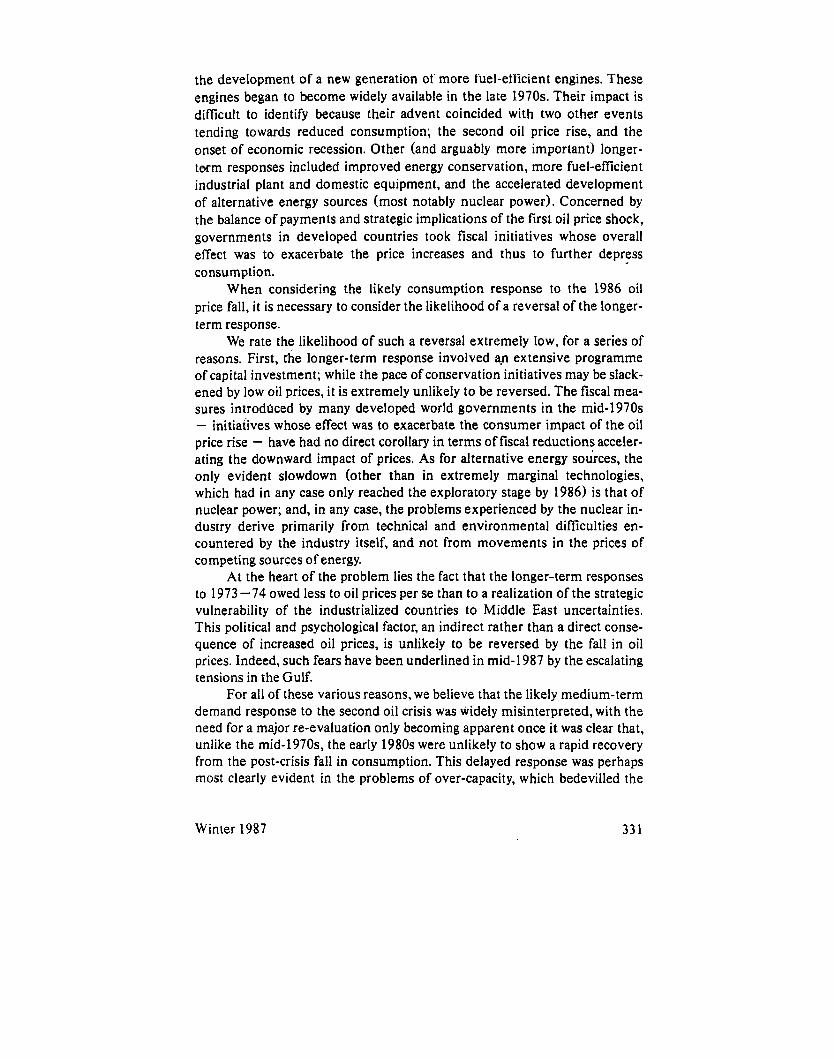
Figure 3 Fuel oil demand versus gasoline demand
1970 = 100 110
100
90
80
70
60
I 50 I I I I I I I
1977 78 79 80 81 82 83 1984
The consumer response to the first oil shock had been a two-phase one. As well as an immediate fall in consumption - an immediate fall which was rapidly reversed - the first oil shock also had a long-tail response. In 1979-81, the immediate consequences of the second large price increase overlaid (and thus, to some extent, masked) the longer-tail response to the first oil price crisis. Undoubtedly, the immediate response witnessed in 1974-75 was present again in 1979-81. But it was accompanied this time by the longer-term consequences of 1973 -74, applicable in all product categories but most notable in the case of fuel oil.
In analyzing the likely demand effects of the 1986 oil price slump, then, it is necessary to look not only at the immediate response - the reversed counterpart of what happened in 1975 -76 - but also at the likelihood of an eventual reversal of the longer-term demand response triggered by the first oil price shock.
The key features of this longer-term response are familiar. In terms of gasoline demand, a key trend was the initiative taken by automobile manu- facturers to reduce fuel consumption. Although manufacturers did achieve some immediate impact - primarily through reduced sales of larger-engined, less fuel-eficient automobiles - their main response took longer; it entailed
330 OPEC Review
the development of a new generation of more fuel-efficient engines. These engines began to become widely available in the late 1970s. Their impact is difficult to identify because their advent coincided with two other events tending towards reduced consumption; the second oil price rise, and the onset of economic recession. Other (and arguably more important) longer- term responses included improved energy conservation, more fuel-eficient industrial plant and domestic equipment, and the accelerated development of alternative energy sources (most notably nuclear power). Concerned by the balance of payments and strategic implications of the first oil price shock, governments in developed countries took fiscal initiatives whose overall effect was to exacerbate the price increases and thus to further depress consumption.
When considering the likely consumption response to the 1986 oil price fall, it is necessary to consider the likelihood of a reversal of the longer- term response.
We rate the likelihood of such a reversal extremely low, for a series of reasons. First, rhe longer-term response involved an extensive programme of capital investment; while the pace of conservation initiatives may be slack- ened by low oil prices, i t is extremely unlikely to be reversed. The fiscal mea- sures introdslced by many developed world governments in the mid-1970s - initiatives whose effect was to exacerbate the consumer impact of the oil price rise - have had no direct corollary in terms of fiscal reductions acceler- ating the downward impact of prices. As for alternative energy sources, the only evident slowdown (other than in extremely marginal technologies, which had in any case only reached the exploratory stage by 1986) is that of nuclear power; and, in any case, the problems experienced by the nuclear in- dustry derive primarily from technical and environmental difficulties en- countered by the industry itself, and not from movements in the prices of competing sources of energy.
At the heart of the problem lies the fact that the longer-term responses to 1973 -74 owed less to oil prices per se than to a realization of the strategic vulnerability of the industrialized countries to Middle East uncertainties. This political and psychological factor, an indirect rather than a direct conse- quence of increased oil prices, is unlikely to be reversed by the fall in oil prices. Indeed, such fears have been underlined in mid-1987 by the escalating tensions in the Gulf.
For all of these various reasons, we believe that the likely medium-term demand response to the second oil crisis was widely misinterpreted, with the need for a major re-evaluation only becoming apparent once it was clear that, unlike the mid-l970s, the early 1980s were unlikely to show a rapid recovery from the post-crisis fall in consumption. This delayed response was perhaps most clearly evident in the problems of over-capacity, which bedevilled the
Winter 1987 33 1
refining industry in the early 1980s, when capacity closures were frequently delayed in the anticipation of a demand recovery which failed to materialize.
In 1986, total non-CPE (centrally planned economy) oil consumption increased by some 2.6 per cent; indications to mid-1987 suggest a full-year 1.3 per cent rise, leaving 1987 non-CPE consumption 3.9 per cent higher than in’1985 - a meagre response to a dramatic price fall whose effects have been prolonged by the weakness of the dollar.
Economic activity and energy consumption Behind the short- and medium-term consumption responses to oil
price movements lies the longer-term relationship between levels of economic activity and energy usage. Our own analysis leads us to believe that a direct relationship does exist between energy usage and economic activity, but that major qualifying points must be made about this relationship.
Our research shows the equation to be a dynamic rather than a static one, with economic growth being accompanied by a falling level of usage of energy per unit of real GDP.
Because the relationship involves the overall level of economic activity, rather than the rate of year-on-year growth per se, levels of energy usage have fallen even in periods of substantial economic growth. For North America, Japan and Western Europe, figure 4 shows our analysis of the trend in energy usage per unit GDP. For each of the developed economies, a dis- tinctive downtrend in the relationship - a trend which we term the EF curve - is evident.
The factors which cause the EF curve to dip are familiar, and consist largely of structural changes in developed economies, the effect of which is to reduce energy usage per unit GDP. The key structural changes are:
- The replacement of older manufacturing plant with more energy-efficient equipment.
- The addition, as a function of economic growth, of new, more energy-efficient units of production, the effect of which is to in- crease the average energy efficiency of total productive capacity.
- A structural shift in the economy away from energy-intensive heavy industries.
- An increased proportion of GDP being accounted for by the service sector.
332 OPEC Review
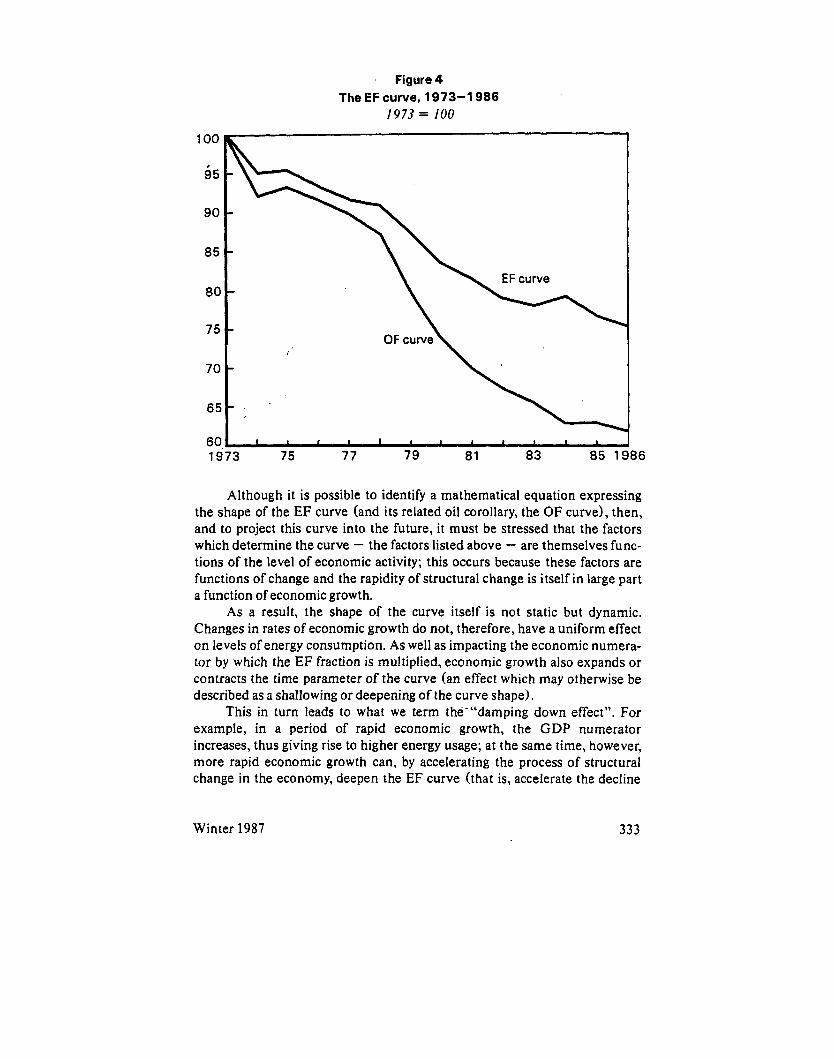
' Figure 4 The EF curve, 1973-1 986
I973 = 100
60 I I I I I I 1 1 I & I I 1
1973 75 77 79 8 1 83 8 5 1 ' 86
Although it is possible to identify a mathematical equation expressing the shape of the EF curve (and its related oil corollary, the OF curve), then, and to project this curve into the future, it must be stressed that the factors which determine the curve - the factors listed above - are themselves func- tions of the level of economic activity; this occurs because these factors are functions of change and the rapidity of structural change is itself in large part a function of economic growth.
As a result, the shape of the curve itself is not static but dynamic. Changes in rates of economic growth do not, therefore, have a uniform effect on levels of energy consumption. As well as impacting the economic numera- tor by which the EF fraction is multiplied, economic growth also expands or contracts the time parameter of the curve (an effect which may otherwise be described as a shallowing or deepening of the curve shape).
This in turn leads to what we term the-"damping down effect". For example, in a period of rapid economic growth, the GDP numerator increases, thus giving rise to higher energy usage; at the same time, however, more rapid economic growth can, by accelerating the process of structural change in the economy, deepen the EF curve (that is, accelerate the decline
Winter 1987 333
in the relationship between energy usage and unit GDP). The effect of this is, in turn, to damp down the impact on energy usage of the increased economic activity. This “damping down effect” is particularly relevant in a period of falling energy prices.
Another point to be borne in mind is the likelihood of an eventual flat- teningDoff of the EF curve. The attainment of this flat position would in theory mean that each increase in real GDP thereafter would result in a directly proportionate increase in energy consumption.
In the less developed countries (LDCs), the EF/OF curves evident in the developed economies tend to be absent; indeed, a rising EF level is a function of primary industrialization, as industry increases its percentage share of GDP at the expense of agriculture and extractive industries, and as private energy consumption rises in response to increased personal incomes.
Oil prices and oil consumption As outlined in the foregoing paragraphs, then, our analysis of the
energy and oil demand patterns in the developed econamies suggests that the series of factors to be taken into account when forecasting the interrela- tionships between energy prices, economic growth and energy consumption are as follows:
- The falling level of energyloil consumption per unit GDP over
- The relationship between the pace of economic growth and the
- The “damping down” effect.
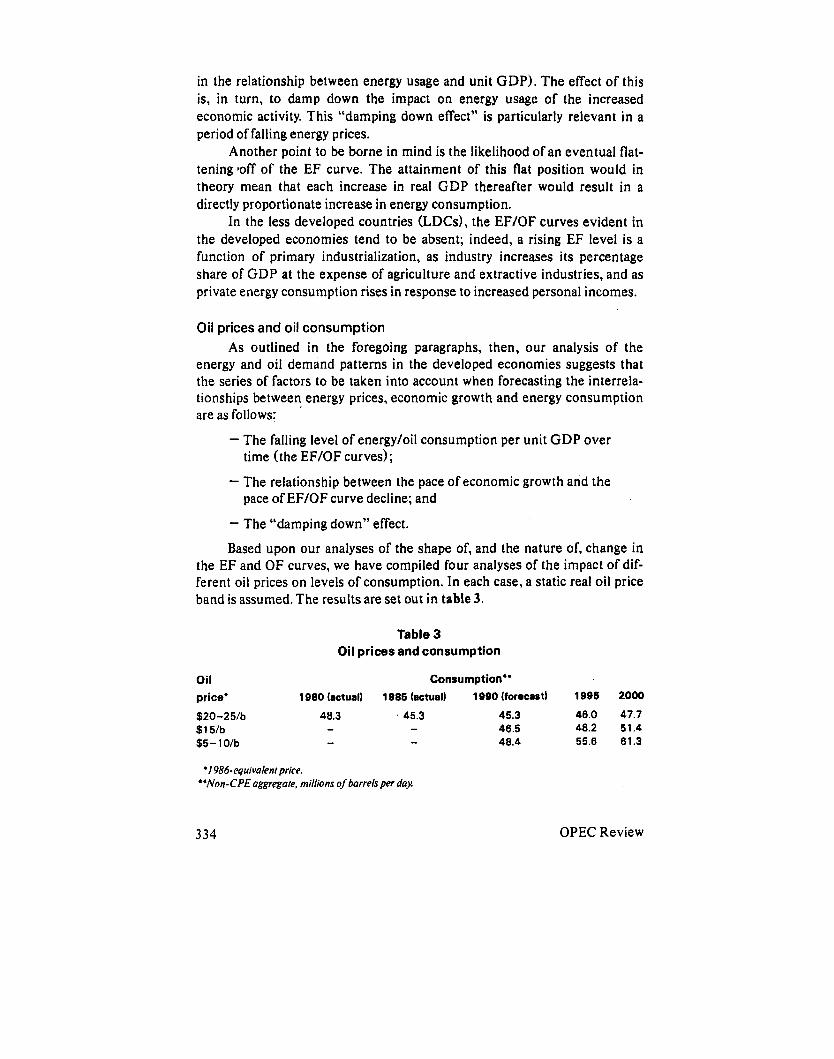
Based upon our analyses of the shape of, and the nature of, change in the EF and OF curves, we have compiled four analyses of the impact of dif- ferent oil prices on levels of consumption. In each case, a static real oil price band is assumed. The results are set out in table 3.
time (the EF/OF curves);
pace of EF/OF curve decline; and
Table 3 Oil prices and consumption
Oil Consumption” price’ 1980 (actual) 1985 (actual) 1990 (forecast) 1996 2000
$20-25/b 48.3 ’ 45.3 45.3 46.0 47.7 $1 5Ib - - 46.5 40.2 51.4 - - 40.4 55.6 61.3 $5- 1 Olb
‘ I 986-equivalent price. “Non-CPE aggregate, millions of barrels per day.
334 OPEC Review
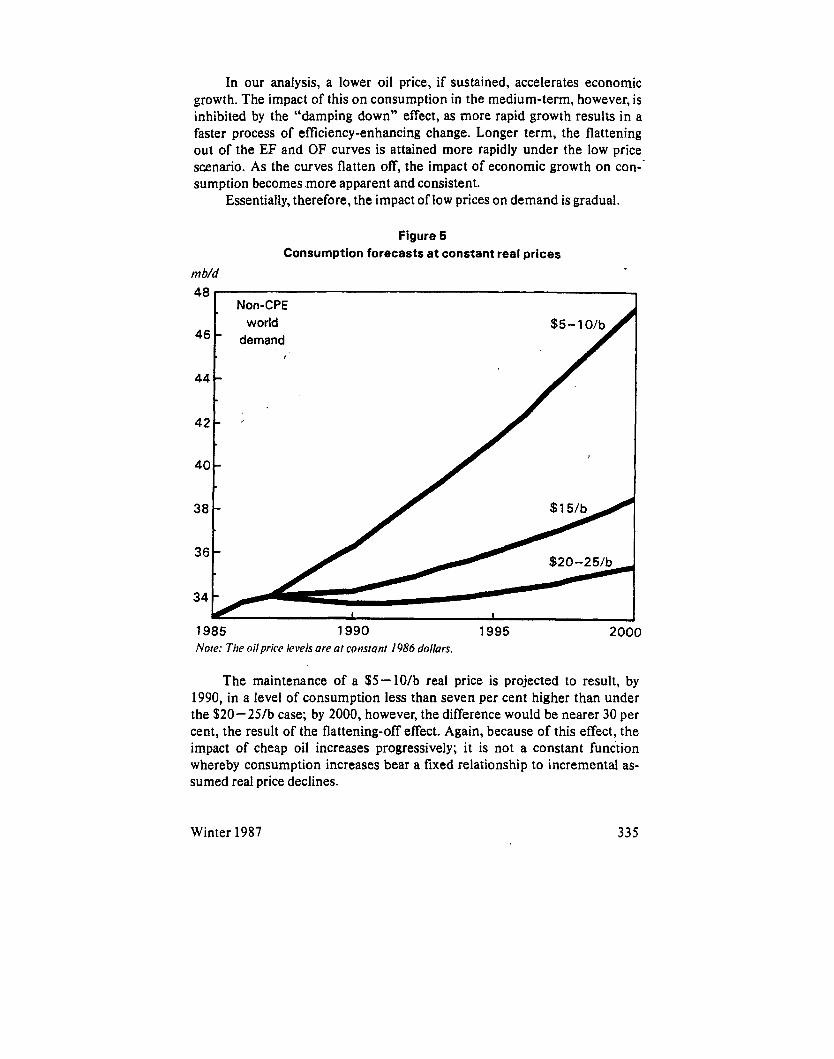
In our analysis, a lower oil price, if sustained, accelerates economic growth. The impact of this on consumption in the medium-term, however, is inhibited by the “damping down” effect, as more rapid growth results in a faster process of ef‘ficiency-enhancing change. Longer term, the flattening out of the EF and OF curves is attained more rapidly under the low price scenario. As the curves flatten off, the impact of economic growth on con-’ sumption becomes .more apparent and consistent.
Essentially, therefore, the impact of low prices on demand is gradual.
1985 1990 1995 Note: The oil price levels are at cortsiant I986 dollars.
2000
The maintenance of a $5 - 10/b real price is projected to result, by 1990, in a level of consumption less than seven per cent higher than under the $20-25/b case; by 2000, however, the difference would be nearer 30 per cent, the result of the flattening-off effect. Again, because of this effect, the impact of cheap oil increases progressively; it is not a constant function whereby consumption increases bear a fixed relationship to incremental as- sumed real price declines.
Winter 1987 335
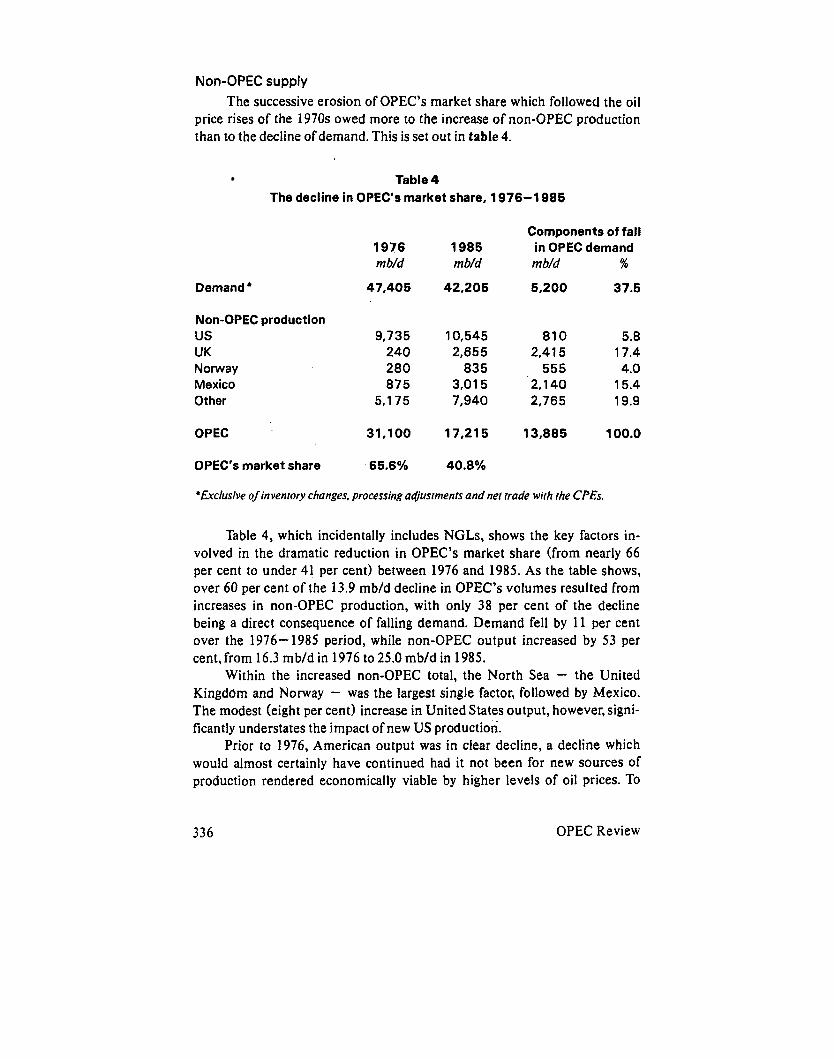
Non-OPEC supply The successive erosion of OPEC’s market share which followed the oil
price rises of the 1970s owed more to the increase of non-OPEC production than to the decline of demand. This is set out in table 4.
Table 4
The decline in OPEC‘s market share, 1976-1 986
Components of fall 1976 1985 in OPEC demand m b/d mb/d m b/d %
Demand * 47,405 42,205 5,200 37.5
Non-OPEC production us 9,735 10,545 81 0 5.8 UK 240 2,655 2.41 5 17.4 Noway 280 835 555 4.0 Mexico 875 3,015 2,140 15.4 Other 5,175 7,940 2,765 19.9
OPEC 31,100 17.21 5 13,885 100.0
OPEC’s market share 65.6% 40.8%
*ficlusive of inventory changes, processing ac#ustments and net trade with the CPEs.
Table 4, which incidentally includes NGLs, shows the key factors in- volved in the dramatic reduction in OPEC’s market share (from nearly 66 per cent to under 41 per cent) between 1976 and 1985. As the table shows, over 60 per cent of the 13.9 mb/d decline in OPEC’s volumes resulted from increases in non-OPEC production, with only 38 per cent of the decline being a direct consequence of falling demand. Demand fell by 11 per cent over the 1976-1985 period, while non-OPEC output increased by 53 per cent,from 16.3 mb/d in 1976 to 25.0 mb/d in 1985.
Within the increased non-OPEC total, the North Sea - the United Kingdom and Norway - was the largest single factor, followed by Mexico. The modest (eight per cent) increase in United States output, however, signi- ficantly understates the impact of new US production.
Prior to 1976, American output was in clear decline, a decline which would almost certainly have continued had it not been for new sources of production rendered economically viable by higher levels of oil prices. TO
336 OPEC Review
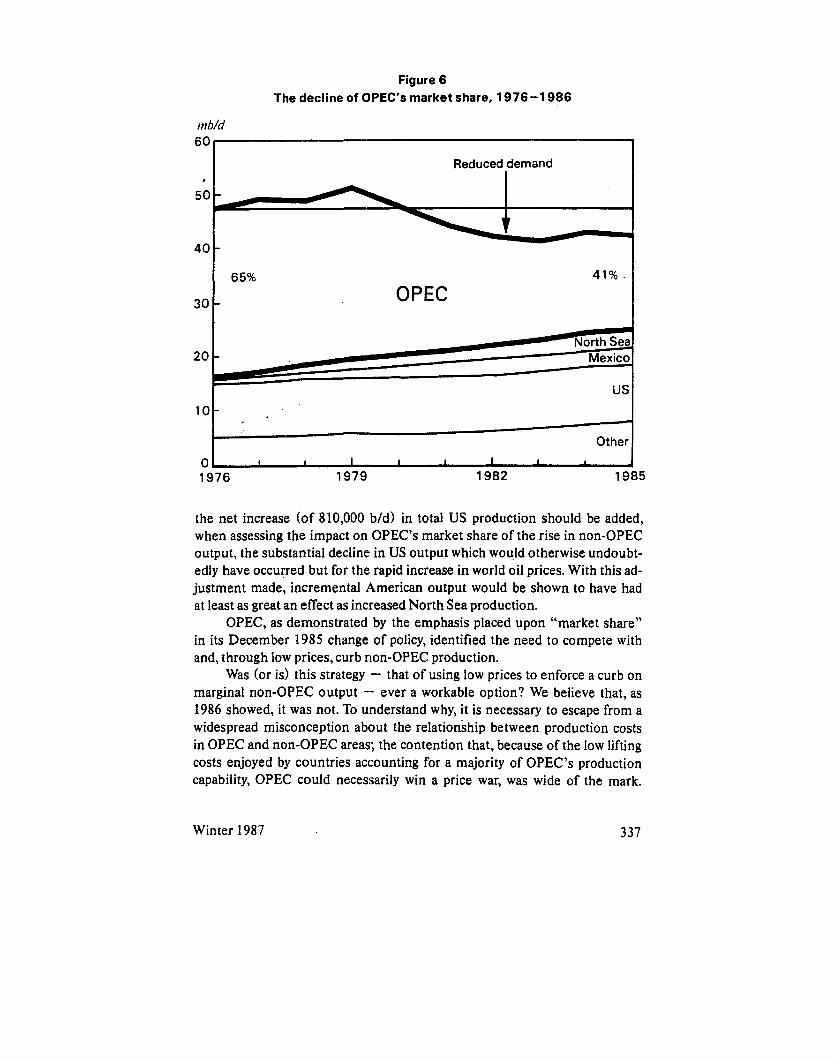
Figure 6 The decline of OPEC’s market share, 1976-1 986
40
30
- 65% 41%.
OPEC -
the net increase (of 810,000 bfd) in total US production should be added, when assessing the impact on OPEC’s market share of the rise in non-OPEC output, the substantial decline in US output which would otherwise undoubt- edly have occurred but for the rapid increase in world oil prices. With this ad- justment made, incremental American output would be shown to have had at least as great an effect as increased North Sea production.
OPEC, as demonstrated by the emphasis placed upon “market share” in its December 1985 change of policy, identified the need to compete with and, through low prices, curb non-OPEC production.
Was (or is) this strategy - that of using low prices to enforce a curb on marginal non-OPEC output - ever a workable option? We believe that, as 1986 showed, it was not. To understand why, it is necessary to escape from a widespread misconception about the relationship between production costs in OPEC and non-OPEC areas; the contention that, because of the low lifting costs enjoyed by countries accounting for a majority of OPEC’s production capability, OPEC could necessarily win a price war, was wide of the mark.
10
0
Winter 1987 337
-
Other I k I I I I I I

When assessing, for example, production in Alaska or the North Sea, produc- tion which is undertaken primarily by private enterprise corporations, it is reasonable to consider price/production thresholds in terms of physical lifting and transportation costs. When considering countries where the oil industry is both a state-controlled concern and the major contributor to national revenues, however, national needs, rather than physical production costs per se, need to be considered. Although it would no doubt be possible, in lifting cost terms, for several OPEC nations to produce oil at a level below, for example, marginal Alaskan costs, such prices would not yield revenues suffi- cient for national needs.
This is not to say, however, that many of the OPEC nations do not enjoy major competitive advantages derived from the favourable economic cost structures of their oil industries; but such advantages are not primarily to be found in terms of lifting costs. The disadvantages faced by, for example, North Sea producers, are disadvantages of capital cost and development lead- times rather than of operating cost. This in turn means that a degree of longer-term certainty is required for North Sea developments. If the North Sea were to lose a price war, it would lose it over the long-term (through the erosion of the confidence required for new developments) rather than in the short-term (through an inability to recover operating expenses). No North Sea production was, to our knowledge, shut in as a direct result of low oil prices during 1986; what did happen, however, was that the price slump im- paired long-term capital investment confidence sufficiently to deter the deci- sion to develop many new fields.
The cost structure of the North American oil industry suggests a tiered response to low prices. Although there were significant shut-ins last year of low volume mature-area wells as a result of low prices - a process which has now, we estimate, run its course - the real threat posed to American output by low oil prices is the threat to the incremental (and often high-cost) production, much of it involving high-cost extraction techniques, which is re- quired to stem the decline'in output resulting from falling production from mature areas.
Our analysis of the responsiveness of non-OPEC production to varying oil prices is set out in table 5.
Table 5 echoes, from a supply perspective, two points which have emerged from our foregoing discussion of demand. First, the immediate impact, even of quite low real oil prices, would be relatively limited. Assum- ing a $15/b constant price, we forecast that output would by 1990 be some 18 per cent below its 1985 level; but, even under the $20-25/b case, it would have been seven per cent lower. Over time, however, the price impact gathers momentum, as high development cost (most notably North Sea) production
338 OPEC Review
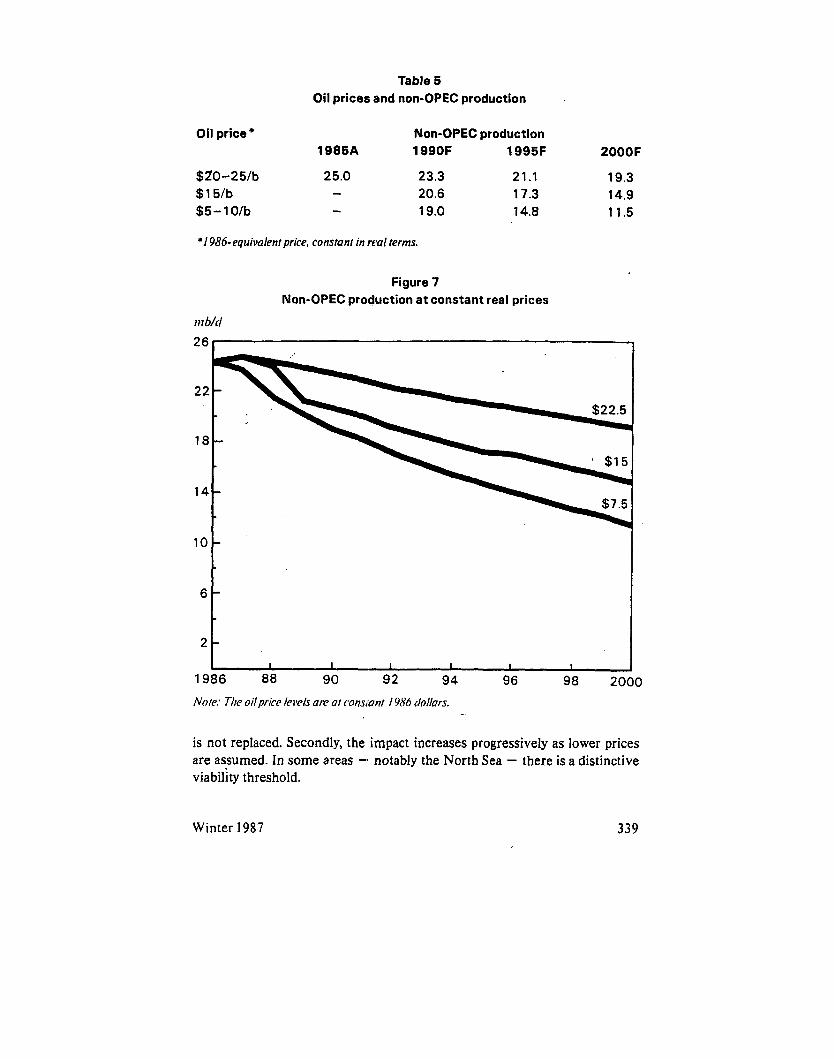
Table 5 Oil prices and non-OPEC production
10
6 -
2-
Oil price * Non-OPEC production 1985A 199OF 1995F 2000F
$20-25/b 25.0 23.3 21.1 19.3 20.6 17.3 14.9 $ 1 5Ib -
$5-1 O/b - 19.0 14.8 11.5
-
I I I I 1 I
*I 986-equivalent price, constant in real terms.
Noie: The ail price levels are at cotIsmr 1986 dollars. - _
is not replaced. Secondly, the impact increases progressively as lower prices are assumed. In some areas -. notably the North Sea - there is a distinctive viability threshold.
Winter 1987 339

The key point about non-OPEC output, however - and a major cause of market disequilibrium - is that non-OPEC production responds slowly to changes in price. Under our $S-lO/b case, output is projected 15 per cent lower in 1995 than had a constant $15/b price been maintained. A reversion to $15/b in that year would not, however, lead to a reversion to the %15/b pro- jection output level, even over five years (let alone over one).
Scenario forecasting Much conventional oil market scenario analysis comprises a series of
cases, each of which contains varying degrees of optimism/pessimism within its parameters. The results of such analyses tend to be a series of divergent projections reflecting the optimism/pessimism of the input assumptions.
Our approach differs significantly from this, and this difference is shown most clearly from the fact that, as shown in figure 8, our re- sulting scenarios cross over rather than diverge. A supposedly “pessimistic” case, resulting in low oil prices in the early years of the model, tends to result in increases in consumption and declines in non-OPEC production, whose medium-term result is to tighten the market and in consequence to move real prices upwards. Conversely, an “optimistic” commencement scenario tends to result in projected levels of near-term prices whose result is to in- hibit and delay the tightening of the market. In consequence, these analyses tend to converge and cross over.
Our forecasting model contains a mathematical forwards projection of the EF and OF curves for consuming regions, together with a capability of decelerating or accelerating movement along the curves (i.e. varying the curve shape) in response to changing levels of economic activity. This in- corporates the “damping down effect” referred to earlier. The model is itera- tive between energy prices and economic growth, reflecting the impact of changes in real energy prices on levels of economic activity. A series of pro- jected non-OPEC production profiles at different oil price levels is included.
In projecting forward levels of demand and supply, our model is looking for a significant tightening in the oil market; the model continues the com- mencement price until the occurrence of tightening dictates a change. We assess “tightness” primarily in terms of demand for OPEC supplies. Determining the level at which such “tightness” occurs is a necessarily con- jectural exercise; it can be undertaken either by reference to OPEC’s market share or by reference to a specified level of OPEC output. Given the conjec- tural nature of the “tightness” criteria, precise accuracy in its recognition is, necessarily, not achievable, but neither is it essential; what is being sought is not a precise timing of price changes but, rather, an overall grasp of the mechanics of price movement, a grasp which in turn leads to an appreciation
340 OPEC Review
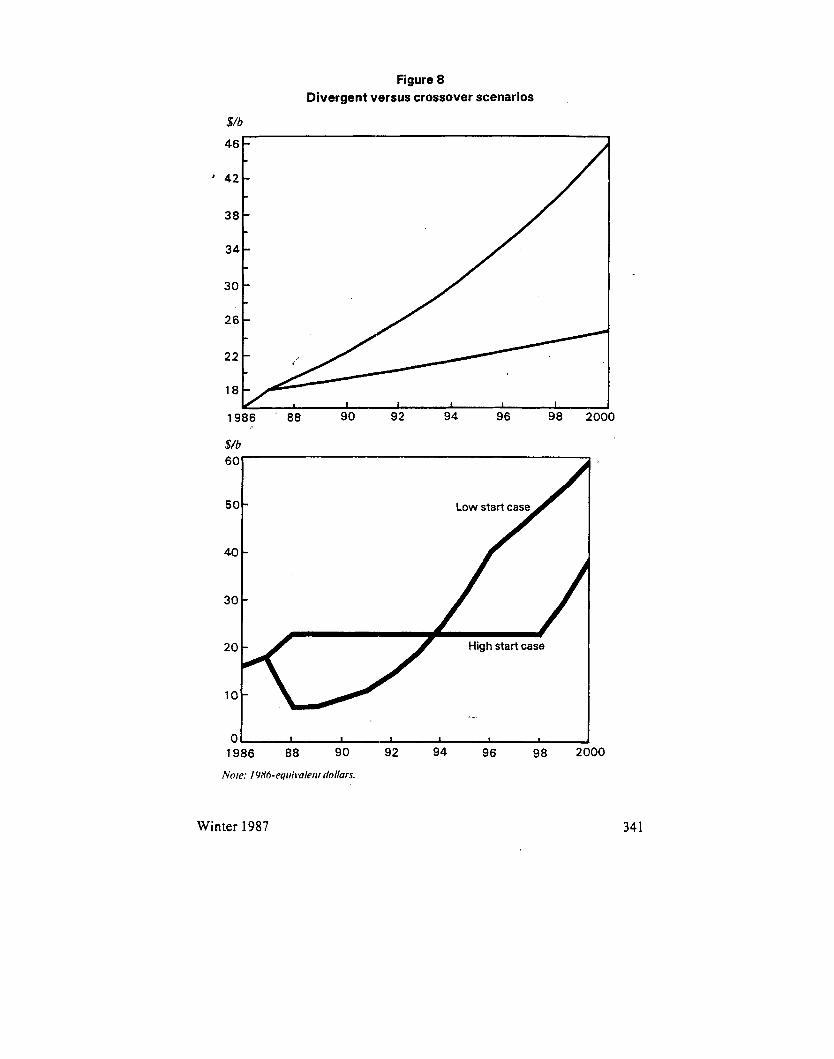
Figure 8 Divergent versus crossover scenarios
$/b
46 -
' 42- -
38 -
34 - - 30 - - 26 -
98 2000 1986 ' 88 90 92 94 96
1986 88 90 92 94 96
Note: I c/X6-eqiii~~aIciit dollars.
Winter 1987 341
of overall trends. When “tightness” is attained, prices - and, in consequence, demand and non-OPEC supply - are adjusted accordingly, the objective being the restoration of equilibrium through the price mechanism.
Under a supposedly ultra-pessimistic case, with a $5-10/b real oil price range assumed, the market moves tight by 1990. By that year, cheap oil is projected to have increased non-CPE consumption by six per cent (compared with 19861, while non-OPEC production is forecast to be 22 per cent reduced. As a result, demand for OPEC production has increased to 27.8 mb/d (a 59 per cent market share), and the market is deemed to be “tight”.
As a result of this, our model successively increases real prices, the object being to restore equilibrium through the price impact on both sides of the supply/demand equation. But even a leap in (1986-equivalent) prices from $5-10/b to $15-20/b fails to achieve this. Thereafter, prices are pro- jected to rise steadily.
Although on this model prices are through $15/b by 1990, the market remains significantly “tighter” than had prices been at $15/b from the outset. This is because non-OPEC output, having lost ground, cannot catch up with the level at which it would otherwise have been had prices not fallen so low. The result is steadily rising real prices.
By contrast,’the supposedly “optimistic” case, which projects real prices at $20-25/b from 1987 onwards, does not show a “tighter” market until 1998. The result is a crossover. Under the (supposedly) “optimistic” c‘ase (that is, the case which employs the highest commencement price), the price is determined at $20 - 25/b until/unless there is “tightness” pressure. In fact, the projected $20-25/b constant real price results in such market weak- ness that real prices could actually fall slightly under this analysis in the early 1990s.
Even a $15-20/b real price, if sustained, results in only a marginal tightening of the market from the early 1990s.
The conclusions to which this Leads us are tentative but intriguing. These are two main scenarios, with a potential end-1980s crossover:
- If (presumably through an OPEC accord) a real price range of $20- 25/b is established, underlying market disequilibrium is projected as being stagnant/weak.
- If; on the other hand, prices were to remain extremely weak (meaning single-figure prices from the present until end-19881, the market would tighten from 1989 onwards. Prices could, through this cyclical process, be expected to be progressively stronger through the 1990s.
342 OPEC Review
OPEC options This analysis immediately suggests two distinct options available to
OPEC, First, OPEC could limit its production sufficiently to maintain real prices in the $20-25/b range; alternatively, OPEC could raise its production in order to cause very much lower prices to prevail over the medium term. In oui analysis, however, neither of these strategies is wholly satisfactory. What remains is an essentially mid-way approach.
The adoption of a policy designed to maintain real (1986-equivalent) prices in the $20 - 25/b bracket would possess, in our analysis, some serious flaws, flaws sufficient to render this a policy option unsuited to OPEC’s longer-term strategic objectives. First, it would inhibit demand growth .- and bolster levels of non-OPEC supply - such as to delay a tightening of the market into the late 1990s. At or above $20/b, oil moves through a “thermal barrier”, with demand weakening in response to widespread switching.
In consequence, any measures taken to sustain such a price range would have to be measures to which OPEC would be prepared to adhere for a long period. These measures would principally consist of greatly re- strained output. Were the prices of competing energy sources to reflect the movement of oil prices into the $20-25/b range, demand for OPEC’s pro- duction would be unlikely to exceed 23 mb/d until the late 1990s; if - as seems probable - this price move was not fully matched by other fuels, oil’s competitiveness, and hence its share of the energy market, could’ decline, leaving demand for OPEC’s production at sub-20 mb/d levels for a lengthy period of time.
By contrast, a policy of forcing prices down into the $5-10/b range offers considerable (but purely theoretical) attractions, because of the rapidi- ty with which this would tighten the market and thus exert strong upwards pressure on prices. This would, nevertheless, require the Member Countries to accept a sustained (two- to three-year) period of extremely curtailed petro- leum revenues; it is, in consequence, unlikely to be regarded as an acceptable option. There is also the (slight) additional risk of the policy acting as a self- defeating prophecy; foreseeing the eventual higher-price consequences, non- OPEC producers might press ahead with new projects, despite low current prices.
Instead, we expect OPEC to continue to pursue a middle course, limit- ing production in order to sustain an intermediate price. Such a policy would be designed to sustain modest demand growth, to inhibit any reduction in the oil share of the energy market and to curb the development of new sources of non-OPEC production. On our analysis, this policy is likely to “tighten” the market in 1991 -92.
Winter 1987 343
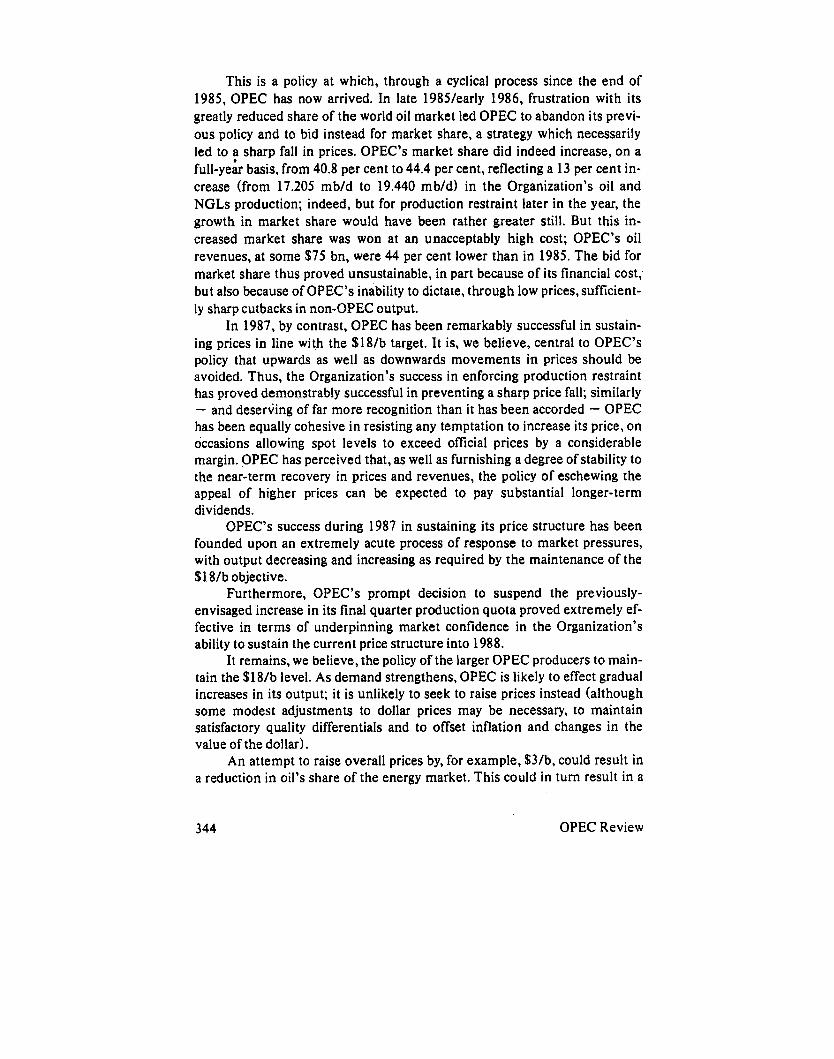
This is a policy at which, through a cyclical process since the end of 1985, OPEC has now arrived. In late 198Wearly 1986, frustration with its greatly reduced share of the world oil market led OPEC to abandon its previ- ous policy and to bid instead for market share, a strategy which necessarily led to a sharp fall in prices. OPEC’s market share did indeed increase, on a full-ye& basis, from 40.8 per cent to 44.4 per cent, reflecting a 13 per cent in- crease (from 17.205 mb/d to 19.440 mb/d) in the Organization’s oil and NGLs production; indeed, but for production restraint later in the year, the growth in market share would have been rather greater still. But this in- creased market share was won at an unacceptably high cost; OPEC’s oil revenues, at some $75 bn, were 44 per cent lower than in 1985. The bid for market share thus proved unsustainable, in part because of its financial cost; but also because of OPEC’s inability to dictate, through low prices, sufficient- ly sharp cutbacks in non-OPEC output.
In 1987, by contrast, OPEC has been remarkably successful in sustain- ing prices in line with the $18/b target. It is, we believe, central to OPEC’s policy that upwards as well as downwards movements in prices should be avoided. Thus, the Organization’s success in enforcing production restraint has proved demonstrably successful in preventing a sharp price fall; similarly - and deserving of far more recognition than it has been accorded - OPEC has been equally cohesive in resisting any temptation to increase its price, on occasions allowing spot levels to exceed official prices by a considerable margin. OPEC has perceived that, as well as furnishing a degree of stability to the near-term recovery in prices and revenues, the policy of eschewing the appeal of higher prices can be expected to pay substantial longer-term dividends.
OPEC’s success during 1987 in sustaining its price structure has been founded upon an extremely acute process of response to market pressures, with output decreasing and increasing as required by the maintenance of the $18/b objective.
Furthermore, OPEC’s prompt decision to suspend the previously- envisaged increase in its final quarter production quota proved extremely ef- fective in terms of underpinning market confidence in the Organization’s ability to sustain the current price structure into 1988.
It remains, we believe, the policy of the larger OPEC producers to main- tain the $1 8/b level. As demand strengthens, OPEC is likely to effect gradual increases in its output; it is unlikely to seek to raise prices instead (although some modest adjustments to d o h prices may be necessary, to maintain satisfactory quality differentials and to offset inflation and changes in the value of the dollar).
An attempt to raise overall prices by, for example, $3/b, could result in a reduction in oil’s share of the energy market. This could in turn result in a
344 OPEC Review
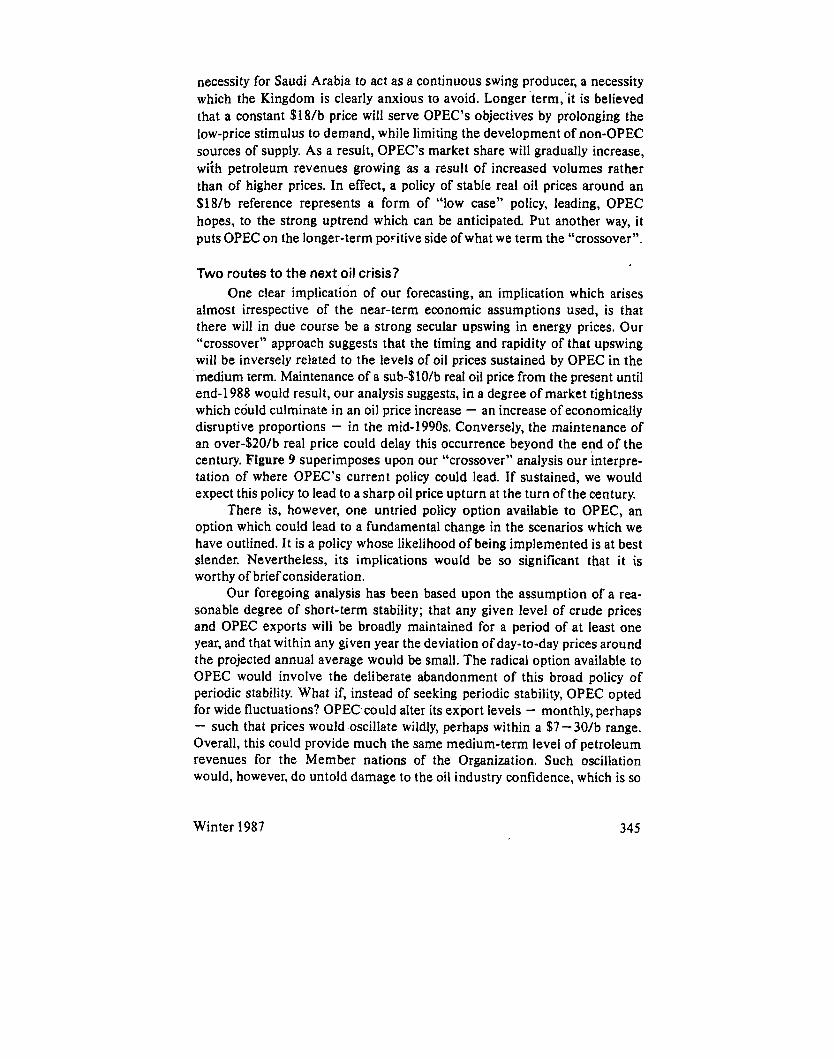
necessity for Saudi Arabia to act as a continuous swing producer, a necessity which the Kingdom is clearly anxious to avoid. Longer ’term, it is believed that a constant $18/b price will serve OPEC’s objectives by prolonging the low-price stimulus to demand, while limiting the development of non-OPEC sources of supply. As a result, OPEC’s market share will gradually increase, wiih petroleum revenues growing as a result of increased volumes rather than of higher prices. In effect, a policy of stable real oil prices around an $18/b reference represents a form of “low case” policy, leading, OPEC hopes, to the strong uptrend which can be anticipated. Put another way, it puts OPEC on the longer-term poFitive side ofwhat we term the “crossover”.
Two routes to the next oil crisis? One clear implication of our forecasting, an implication which arises
almost irrespective of the near-term economic assumptions used, is that there will in due course be a strong secular upswing in energy prices. Our “crossover” approach suggests that the timing and rapidity of that upswing will be inversely related to the levels of oil prices sustained by OPEC in the medium term. Maintenance of a sub-$lO/b real oil price from the present until end-1988 wo,uld result, our analysis suggests, in a degree of market tightness which could culminate in an oil price increase - an increase of economically disruptive proportions - in the mid-1990s. Conversely, the maintenance of an over-$20/b real price could delay this occurrence beyond the end of the century. Figure 9 superimposes upon our “crossover” analysis our interpre- tation of where OPEC’s current policy could lead. If sustained, we would expect this policy to lead to a sharp oil price upturn at the turn of the century.
There is, however, one untried policy option available to OPEC, an option which could lead to a fundamental change in the scenarios which we have outlined. It is a policy whose likelihood of being implemented is at best slender. Nevertheless, its implications would be so significant that it is worthy of brief consideration.
Our foregoing analysis has been based upon the assumption of a rea- sonable degree of short-term stability; that any given level of crude prices and OPEC exports will be broadly maintained for a period of at least one year, and that within any given year the deviation of day-to-day prices around the projected annual average would be small. The radical option available to OPEC would involve the deliberate abandonment of this broad policy of periodic stability. What if, instead of seeking periodic stability, OPEC opted for wide fluctuations? OPEC could alter its export levels - monthly, perhaps - such that prices would oscillate wildly, perhaps within a $7-30/b range. Overall, this could provide much the same medium-term level of petroleum revenues for the Member nations of the Organization. Such oscillation would, however, do untold damage to the oil industry confidence, which is so
Winter 1987 345
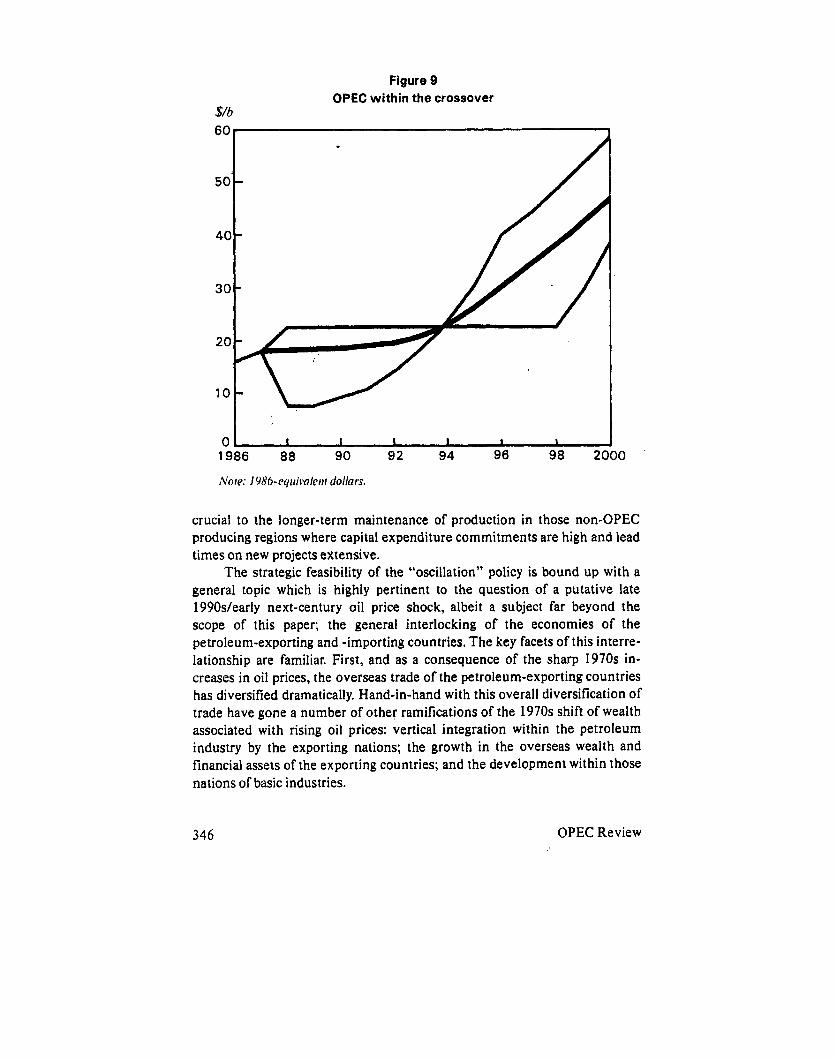
Figure 9 OPEC within the crossover
$/b
0 I 1 I I I I
crucial to the longer-term maintenance of production in those non-OPEC producing regions where capital expenditure commitments are high and lead times on new projects extensive.
The strategic feasibility of the “oscillation” policy is bound up with a general topic which is highly pertinent to the question of a putative late 1990s/early next-century oil price shock, albeit a subject far beyond the scope of this paper; the general interlocking of the economies of the petroleum-exporting and -importing countries. The key facets of this interre- lationship are familiar. First, and as a consequence of the sharp 1970s in- creases in oil prices, the overseas trade of the petroleum-exporting countries has diversified dramatically. Hand-in-hand with this overall diversification of trade have gone a number of other ramifications of the 1970s shift of wealth associated with rising oil prices: vertical integration within the petroleum industry by the exporting nations; the growth in the overseas wealth and financial assets of the exporting countries; and the development within those nations of basic industries.
346 OPEC Review

A complementary trend has been the growing sophistication of petro- leum markets, which have moved from simple spot and contract trading into futures, netback and other formula pricing, and diverse product trading.
We conclude this paper by suggesting some of the implications for sce- nario planning resulting from our “crossover” thesis. The first implication is best shown in pictorial form, as in figure 10. In sharp contrast to the divergent scenario planning still widely employed in the appraisal of upstream petro- leum investment, a radically different shape of parameter spread is envisaged, which in turn has implications for the timing and nature of long- lead time development projects. It should also be reiterated that a clear lesson of the 1986 oil price slump was the elasticity of petroleum industry costs, most notably in terms of drilling and fabrication expenses. Finally, and additional to the need to plan upstream investment within a crossover- derived set of parameters, our projections have significant implications for planning within the refining, marketing and petrochemicals business.
Figure 10 Parameters for scenario planning
Winter 1987 347
OPEC publications All publications are in the English language, unless otherwise stated.
Available from the OPEC Secretariat The following publications may be obtained from: Public Information Department, Organization of the Petroleum Exporting Countries, Obere Donaustrasse 93, A-1020 Vienna, Austria.
Free (surcharge for air mail, ifrequested) OPEC Bulletin - ten issues per annum Facts and Figures OPEC at a Glance (French, German and Spanish only) OPEC Information (Spanish and Arabic only) OPEC Statute (also Spanish) OPEC Official Resolutions and Press Releases:
1984- 1986 Supplement
On sale (surcharge for air mail, ifrequested) Annual Statistical Bulletin 1985 Annual Statistical Bulletin 1986
AS 350 AS 350
AS - Ausrrion wbi/h?xs
Available from commercial publishers The following OPEC publications are available from commercial publishers.
OPEC Review - quarterly (Pergamon Journals,
OPEC Official Resolutions and Press Releases
DM I40/year
US $50 Oxford OX3 OBW, England) DM = DPrrrxhnwrks
1960- 1983 (Pergamon Journals) For 1984- I986 supplement, see above
OPEC: Instrument of Change (Macmillan Press Ltd, 4 Little Essex Street, London WC2R 3LF, England)
29.50pounds
OPEC and Future Energy Markets (Macmillan) -
Available from the OPEC Fund Publications relating to the activities of the OPEC Fund can be obtained only from that source. The address is: OPEC Fund for International Development, PO Box 995,101 1 Vienna, Austria.