oil prices and stock markets: what drives what in the gulf ... · [email protected] . 1. ... gcc...
TRANSCRIPT

Oil Prices and Stock Markets: What Drives what in the Gulf Corporation Council Countries?
Mohamed El Hedi Arouri Christophe Rault
CESIFO WORKING PAPER NO. 2934 CATEGORY 10: ENERGY AND CLIMATE ECONOMICS
JANUARY 2010
An electronic version of the paper may be downloaded • from the SSRN website: www.SSRN.com • from the RePEc website: www.RePEc.org
• from the CESifo website: Twww.CESifo-group.org/wp T

CESifo Working Paper No. 2934
Oil Prices and Stock Markets: What Drives what in the Gulf Corporation Council Countries?
Abstract In the empirical literature, only few studies have focused on the relationship between oil prices and stock markets in net oil-importing countries. In net oil-exporting countries this relationship has not been widely researched. This paper implements the panel-data approach of Kónya (2006), which is based on SUR systems and Wald tests with country-specific bootstrap critical values to study the sensitivity of stock markets to oil prices in GCC (Gulf Corporation Council) countries. Using two different (weekly and monthly) datasets covering respectively the periods from 7 June 2005 to 21 October 2008, and from January 1996 to December 2007, we show strong statistical evidence that the causal relationship is consistently bi-directional for Saudi Arabia. Stock market price changes in the other GCC member countries do not Granger cause oil price changes, whereas oil price shocks Granger cause stock price changes. Therefore, investors in GCC stock markets should look at the changes in oil prices, whereas investors in oil markets should look at changes in the Saudi stock market.
JEL-Code: G12, F30, Q43.
Keywords: GCC stock markets, oil prices.
Mohamed El Hedi Arouri University of Orléans
(LEO, CNRS, UMR 6221) Rue de Blois-B.P.6739
France – 45067 Orléans Cedex 2 [email protected]
Christophe Rault University of Orléans
(LEO, CNRS, UMR 6221) Rue de Blois-B.P.6739
France – 45067 Orléans Cedex 2 [email protected]

1. Introduction
In theory, the value of stock is equal to the discounted sum of expected future cash-flows.
Identifying the factors that affect these cash-flows is of utmost relevance and importance to
investors and policy makers. As oil price has changed with sequences of very large increases
and decreases over recent years, it is now quite opportune to augment the existing research on
its impacts on stock prices. Indeed, corporate cash-flows are affected by macroeconomic
events that can be influenced by oil price variations. The aim of this article is to contribute to
the literature by investigating the causal links between stock markets and oil prices.
Unlike most previous papers, which focus on the U.S., European and major Asian stock
markets, our paper analyses the impact of oil price fluctuations on Gulf Corporation Council
(GCC) markets. These markets are interesting for several reasons. First, GCC markets have
attracted increasing attention in the last decade. In the wake of high oil prices since 2003, they
have known high economic growth rates. They have also become important international
investors and trade partners, and play a crucial role in world energy markets. Indeed, most
GCC countries are major exporters of oil in global energy markets, so their stock markets may
be susceptible to changes in oil prices. However, the transmission mechanisms of oil price
shocks to stock returns in GCC markets should be different from those in net oil-importing
countries. Indeed, oil price increases positively affect earnings, government budget revenues
and expenditures and aggregate demand, and thus positively affect corporate income and
stock prices. However, oil price increases are also synonyms of high expected inflation
pressure and money supply, which in turn affect the discount rate and therefore negatively
affect stock prices in GGC countries. Second, the GCC markets differ from those of
developed and from those of major emerging countries in that they are largely segmented
from the international markets and are overly sensitive to regional political events. Finally,
GCC markets are very promising areas for international portfolio diversification. Studying the
2

influence of oil price shocks on GCC stock market returns can help investors make necessary
investment decisions and for policy-makers regulate stock markets more effectively.
A large body of recent work examines the links between oil prices and macroeconomic
variables. This work has underscored the significant effects of oil price fluctuations on
economic activity in mature and in emerging markets [Brown and Yücel (2002), Cunado and
Perez de Garcia (2005), Balaz and Londarev (2006), Gronwald (2008), Cologni and Manera
(2008), Kilian (2008), Lardic and Mignon (2006, 2008), and Lescaroux and Mignon (2008)].
Despite studies showing that oil price shocks have significant effects on the economy,
relatively fewer works have looked into the relationship between oil prices and stock markets.
Furthermore, most of this research has focused on developed oil importers; very little has
looked at emerging markets or exporters. The pioneering paper by Jones and Kaul (1996) tests
the reaction of international stock markets (Canada, UK, Japan, and US) to oil price shocks on
the basis of the standard cash flow dividend valuation model. They found that for the US and
Canada this reaction can be accounted for entirely by the impact of the oil shocks on cash-
flows. The results for Japan and the UK were inconclusive. Using an unrestricted vector
autoregressive (VAR), Huang et al. (1996) show a significant link between some US oil
company stock returns and oil price changes. However, they find no evidence of a
relationship between oil prices and market indices such as the S&P500. In contrast, Sadorsky
(1999) applies an unrestricted VAR with GARCH effects to US monthly data and shows a
significant relationship between oil price changes and aggregate stock returns. More recently,
El-Sharif et al. (2005) examine the links between oil price changes and stock returns in the
UK oil and gas sector. They establish that the relationship between the two variables is
significantly positive.
Some works have more recently focused on major European, Asian and Latin American
emerging markets. In general, these studies show significant short- and long-term
3

relationships between oil price changes and emerging stock market returns. Using a VAR
model, Papapetrou (2001) shows a significant relationship between oil price changes and
stock markets in Greece. Basher and Sadorsky (2006) use an international multifactor model
and reach the same conclusion for other emerging stock markets. However, less attention has
been paid to smaller emerging markets, especially in the GCC countries where share dealing
is a relatively recent phenomenon. Using VAR models and cointegration tests, Hammoudeh
and Eleisa (2004) show that there is a bidirectional relationship between Saudi stock returns
and oil price changes. The findings also suggest that the other GCC markets are not directly
linked to oil prices and are less dependent on oil exports and are more influenced by domestic
factors. Bashar (2006) uses VAR analysis to study the effect of oil price changes on GCC
stock markets and shows that only the Saudi and Omani markets have the power to predict
increases in the price of oil. More recently, Hammoudeh and Choi (2006) have examined the
long-term relationship among the GCC stock markets in the presence of the US oil market,
the S&P500 index and the US Treasury bill rate. They find that the T-bill rate has a direct
impact on these markets, while oil and the S&P500 have indirect effects. Finally, Lescaroux
and Mignon (2008) have studied the relationships between oil and stock prices for a large
panel of developed and emerging countries. They find some evidence of positive causality
from oil prices to stock prices in some GCC countries.
As we can see, the findings of the little available work on GCC countries are contradictory.
These findings are puzzling because most GCC countries are heavy oil exporters.
Furthermore, the GCC economies are oil dependent and are thus sensitive to oil price
changes. But previous results are based on country analysis and use time series data from
relatively short periods. Our paper differs from previous studies by applying a recent
bootstrap panel causality test to examine the relationship between oil and stock markets in
4

GCC countries. The advantages of panel-data methods in the macro-panel setting include the
use of data for which the spans of individual time series data are insufficient for the study of
many hypotheses.
In addition, in the specific approach we use in this paper that requires no pre-testing for unit
roots and cointegration [as in Phillips (1995)], we allow for cross-country correlation. This
question is crucial and responds to the complex nature of the interactions and dependencies
that generally exist over time and across the individual units in the panel. For instance,
observations of firms, industries, regions and countries tend to be cross-correlated as well as
serially dependent. As pointed out by Breitung and Pesaran (2005), the cross-section
dependence can arise for a variety of reasons, including spatial spill-over effects, common
unobserved shocks, social interactions, or a combination of these factors. For our paper, cross-
dependence can mirror cultural similarities, common financial, economic and social policies
in GCC countries, high dependency on the revenues generated from oil exports, herding,
contagion, and volatility transmission.
Our econometric investigation is based on two different complementary (weekly and
monthly) datasets, respectively from 7 June 2005 to 21 October 2008, and from January 1996
to December 2007. There are two main reasons for this. Firstly, we think that weekly data
may adequately capture the interaction of oil and stock prices in the region better than any
other data frequency. However, our weekly data set, which deals with all the six GCC
countries, only includes less than four years of data, which can be considered as too short to
test for causality. Indeed, as emphasized by Shiller and Perron (1985) it is not the frequency
(number of observations) rather the span (number of years) of the data that is more important
to test for random walk hypothesis of economic variables or causal relationships. Secondly,
our monthly database which covers twelve years of data only includes four GCC countries out
5

of six and doesn’t permit to draw any conclusion about Qatar and United Arab Emirates
which are absent from the database. Consequently, given data availability, using
simultaneously the two different datasets can be seen as test of robustness of our econometric
results.
The rest of the paper is organized as follows. Section 2 briefly presents the GCC markets and
discusses the role of oil. Section 3 presents the data and discusses the results of the empirical
analysis, while section 4 provides summary conclusions and policy implications.
2. GCC economies, stock markets and the role of oil
The GCC was established in 1981 and it includes six countries, namely, Bahrain, Oman,
Kuwait, Qatar, Saudi Arabia and the United Arab Emirates (UAE). GCC countries share
several common patterns. In 2007, they produce together about 20% of all world oil, control
36% of world oil exports and possess 47% of proven reserves. Oil exports largely determine
earnings, government budget revenues and expenditures and aggregate demand. Table 1
shows some key financial indicators for the GCC economies. The contributions of oil to GDP
range from 22% in Bahrain to 44% in Saudi Arabia. Moreover, Table 1 indicates that for the
three largest GCC economies—Saudi Arabia, UAE, and Kuwait—the liquidity of the stock
market is positively associated with the importance of oil in these economies.
The rationale for using oil price movements as a factor affecting stock valuations is that, in
theory, the value of stock equals the discounted sum of expected future cash flows. These
cash flows are affected by macroeconomic events that can be influenced by oil shocks.
Indeed, oil exports affect the main economic variables in GCC countries: earnings,
government budget revenues and expenditures and aggregate demand. So oil price increases
6
should positively affect corporate output and earnings, and then stock returns in these
countries. However, GCC countries are also importers of manufactured goods from developed
and emerging countries. Therefore, oil price fluctuations can indirectly impact GCC markets
through their influence on the prices of imported products and in this case increases in the
price of oil are often indicative of inflationary pressure in the GCC economies, pressure that
could indicate the future of interest rates and investment of all types.3 In short, oil price
fluctuations should affect corporate output and earnings, domestic prices and stock market
share prices in GCC countries. However, unlike the link, expected to be negative, between oil
prices and stock markets in most net-oil importing countries, the link between oil price shocks
and stock market returns in GCC countries is ambiguous and the total impact of oil price
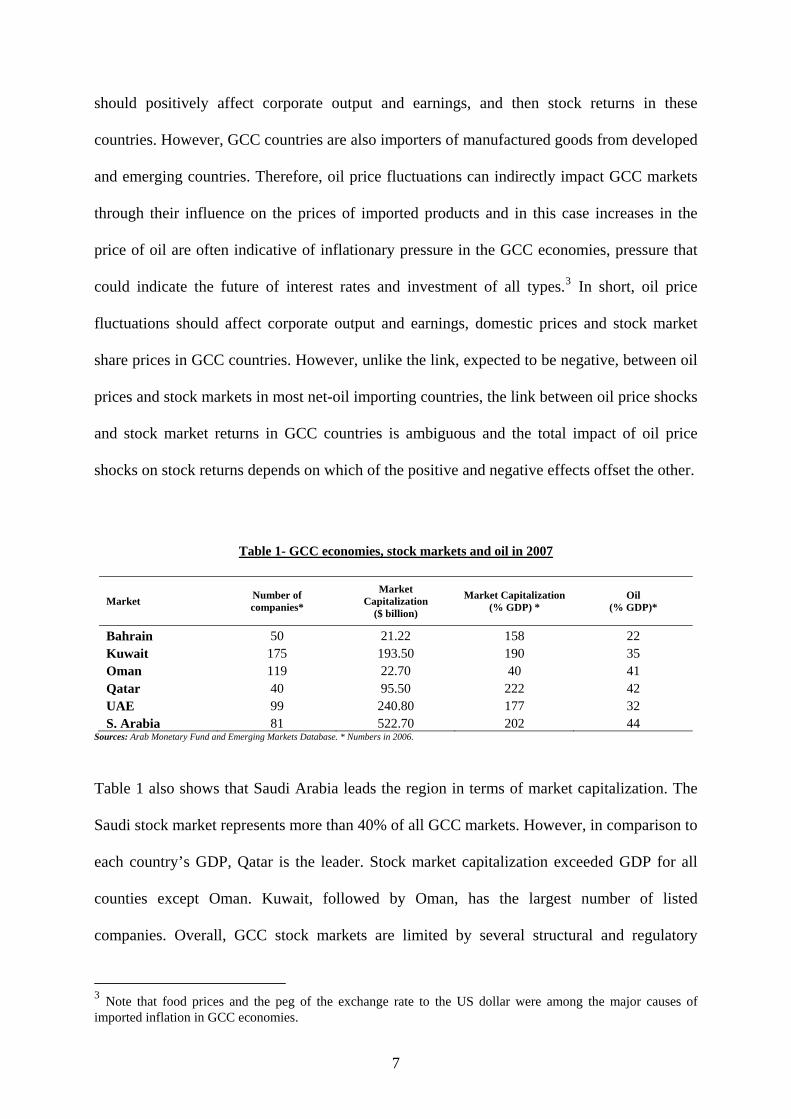
shocks on stock returns depends on which of the positive and negative effects offset the other.
Table 1- GCC economies, stock markets and oil in 2007
Market Number of companies*
Market Capitalization
($ billion)
Market Capitalization (% GDP) *
Oil (% GDP)*
Bahrain 50 21.22 158 22 Kuwait 175 193.50 190 35 Oman 119 22.70 40 41 Qatar 40 95.50 222 42 UAE 99 240.80 177 32 S. Arabia 81 522.70 202 44
Sources: Arab Monetary Fund and Emerging Markets Database. * Numbers in 2006.
Table 1 also shows that Saudi Arabia leads the region in terms of market capitalization. The
Saudi stock market represents more than 40% of all GCC markets. However, in comparison to
each country’s GDP, Qatar is the leader. Stock market capitalization exceeded GDP for all
counties except Oman. Kuwait, followed by Oman, has the largest number of listed
companies. Overall, GCC stock markets are limited by several structural and regulatory
3 Note that food prices and the peg of the exchange rate to the US dollar were among the major causes of imported inflation in GCC economies.
7

weaknesses: relatively small numbers of listed firms, large institutional holdings, low sector
diversification, and several other deficiencies. In recent years, however, legal, regulatory, and
supervisory changes have increased market transparency. The liquidity of GCC markets has
improved and operations were opened to foreign investors. In March 2006 Saudi authorities
lifted the restriction that limited foreign residents to dealing only in mutual funds and the
other markets have progressively followed suit.4
Figure 1: GCC countries and oil dependency
Source: Fasano and Iqbal (2003), International Monetary Fund.
Finally, GCC countries may have much in common, but they depend on oil to differing
degrees and are making differing efforts to diversify and liberalize their economies. For
example, the UAE and Bahrain are less dependent on oil than Saudi Arabia and Qatar (Figure
1). The comparison of GCC stock markets thus makes for an interesting subject. The panel-
data econometric tools we use in this paper take into account these different features.
4 For interested readers, further information and discussions of the market characteristics and financial sector development of these countries can be found in Neaime (2005) and Naceur and Ghazouani (2007).
8

3. Panel Granger causality test methodology
The panel-data approach developed by Kónya (2006) is based on the following bivariate (here
an oil price index, oil; and a stock market index, stock) finite-order vector autoregressive
model, with the variables taken in level5:
1 2
1 2
1, 1, , , 1, , , 1, ,1 1
2, 2, , , 2, , , 2, ,1 1
1,..., 1,..., (1 )
1,..., 1,..., (1 )
i i
i i
p p
it i i j i t j i j i t j i tj j
p p
it i i j i t j i j i t j j tj j
oil oil stock t T i N a
stock oil stock t T i N b
α β γ ε
α β γ ε
− −= =
− −= =
⎧= + + + = =⎪
⎪⎪⎨⎪⎪ = + + + = =⎪⎩
∑ ∑
∑ ∑
(1)
where the index i is the country, the index t ( Ni ,...,1= ) ( )Tt ,...,1= the period, j the lag, and
p1i, p2i the longest lags in the system. The error terms, 1, ,i tε and 2, ,i tε , are supposed to be
white-noise and may be correlated with each other for a given country.
The seemingly unrelated regressions (SUR) procedure (since possible links may exist among
individual regressions via contemporaneous correlation6 within equations (1a) and (1b) of
system (1) is used to estimate system (1)). Wald tests for Granger causality are then done with
country-specific bootstrap critical values generated by simulations.
With respect to system (1), for instance, in country i there is one-way Granger-causality
running from stock to oil if in the first equation not all 1,iγ are zero but in the second all 2,iβ are
zero; there is one-way Granger-causality from oil to stock if in the first equation all 1,iγ are
zero but in the second not all 2,iβ are zero; there is two-way Granger-causality between from
5 Larger models including external factors such as interest rate, inflation, and economic growth have led to very similar results. The estimation results for these models are available upon request from authors. 6 This assumption is very likely to be relevant for many macroeconomic time series for GCC countries for which strong economic links exist.
9

oil to stock if neither all 2,iβ nor all 1,iγ are zero; and there is no Granger-causality between oil
to stock if all 2,iβ and 1,iγ are zero.7
This procedure has several advantages. Firstly, it does not assume that the panel is
homogenous, so it is possible to test for Granger-causality on each individual panel member
separately. However, since contemporaneous correlation is allowed across countries, it makes
it possible to exploit the extra information provided by the panel data setting and therefore
country-specific bootstrap critical values are generated. Secondly, this panel approach which
generalizes the methodology developed by Phillips (1995)8 that tests for non-causality in
levels VARs, in a time series context, does not also require pretesting for unit roots and
cointegration, though it still requires the specification of the lag structure (which is
determined here using the Akaike Information Criterion (AIC) and the Schwarz Information
Criterion (SIC)). This is an important feature since the unit-root and cointegration tests in
general suffer from low power, and different tests often lead to contradictory outcomes.
Thirdly, this panel Granger causality approach allows the researcher to detect for how many
and for which members of the panel there exists one-way Granger-causality, two-way
Granger-causality or no Granger-causality.
4. Econometric investigation 7 As stressed by Kónya (2006), this definition implies causality for one period ahead. 8 As it is now well known the issue of testing for non-causality is addressed in a time series setting, in particular by Phillips (1995) in the context of a VAR in levels estimated using the fully modified (FM) estimator, and also by Toda and Yamamoto (1995) who suggest augmenting the VAR by the maximal order of integration for the process being examined. The former method provides some very interesting results as far as asymptotic inference is concerned. The most important one is that statistical inference in this framework can be conducted by means of standard asymptotics; no unit root limit theory is required. Normal and mixed normal limit theory are applied to the stationary and non-stationary components of the VAR respectively. This implies that optimal inference in levels VARs and Wald test for non-causality can be obtained without prior knowledge of the number of unit roots or the order of cointegration rank in the system, and without the use of reduced rank Johansen-type regressions (which are subject to pre-testing bias, as tests for cointegration ranks are extremely sensitive to the values of the nuisance parameters). The approach by Toda and Yamamoto (1995) also results in a standard Wald statistic for non-causality restrictions, although it does require some pre-testing for determining the lag length of the VAR.
10

First, we present the datasets we use in our empirical investigation of the link between oil
prices and stock returns in GCC countries. Then, we discuss the results we obtain at both
weekly and monthly frequencies.
4.1 Data
Unlike previous studies, which use low-frequency data (yearly, quarterly or monthly), our
study uses both weekly and monthly data for the reasons discussed in the introduction of the
paper.
Weekly data are obtained from MSCI and covered the six GCC members. We think that
weekly data may more adequately capture the interaction of oil and stock prices in the region
than low-frequency data. We do not use daily data in order to avoid time difference problems
with international markets. In fact, the equity markets are generally closed on Thursdays and
Fridays in GCC countries, while the developed and international oil markets close for trading
on Saturdays and Sundays. Furthermore, for the common open days, the GCC markets close
just before US stocks and commodity markets open. Accordingly, we opt to use weekly data
and choose Tuesday as the weekday for all variables because this day lies in the middle of the
three common trading days for all markets. Moreover, the data used in all the analyses predate
the end of 2005, so previous studies missed the spectacular evolutions that took place in the
GCC and oil markets in the last three years. Therefore, our sample period goes from 7 June
2005 to 21 October 2008 for the six GCC members.
As for our second dataset, we use monthly data obtained from Arab Monetary Fund (AMF)
over the period January 1996 – December 2007. Note that stock exchanges in UAE and Qatar
are newly established and did not participate in the AMF database when it began in 2002.
Thus, the AMF data we use include only four of the six GCC stock markets: Bahrain, Kuwait,
Oman and Saudi Arabia.9
As for oil, we use the weekly and monthly OPEC spot prices. These prices are weighted by
estimated export volume and are obtained from the Energy Information Administration
(EIA).10 All prices are in US dollars.
9 Data for 2008 are not available in AMF database. Furthermore, weekly data are not available in this database. 10 Very similar results are obtained with West Texas Intermediate and Brent spot prices. Oil prices are in US dollars per barrel. Note also that GCC currencies have been officially pegged to the U.S. dollar since 2003. However, Kuwait has recently moved back to pegging its currency to a basket currency.
11

4.2 Empirical results
Using the AIC and SIC criteria and a maximal lag parameters of 4, a VAR(1) model is found
to describe adequately the dynamics of the series under consideration for the two databases,
the misspecification tests indicating no departure from the underlying assumptions. We then
carry out the Breusch and Pagan (1980) test to investigate whether the variance-covariance
matrix of the errors is diagonal, and the null hypothesis of no contemporaneous correlation
within the different systems can always be rejected at the five percent significance level. This
justifies the application of the SUR estimators which is here more efficient than the OLS
estimators.
We report in Tables 2a, 2b and 3a, 3b the results for the Granger causality tests (associated
respectively to our weekly and monthly datasets), using a bivariate model, from stock markets
to oil prices, and from to oil prices to stock markets for GCC countries11.
Table 2a – Granger causality tests from stock markets to oil prices for the Gulf Corporation Countries panel (weekly dataset from 7 June 2005 to 21 October 2008 on the 6 GCC countries),
bivariate (OIL, STOCK) model
Country Estimated Test Statistic Bootstrap critical values coefficient 1% 5% 10%
Bahrain 0.02811 2.08482 5.66717 4.03923 3.17804 Kuwait -0.01252 -.620305 6.39197 5.00073 3.62678 Oman 0.01638 0.73068 6.4651 4.37293 3.67639 Saudi Arabia -0.09361 -3.79621** 5.6690 3.08229 2.00697 Qatar 0.00759 0.44267 52.2202 3.70653 2.62674 United Arab Emirates 0.01327 1.09262 5.0565 3.02775 2.84203 Notes: a) ***, ** and * denote significance at the 1%, 5% and 10% levels. b) H0: STOCK does not cause OIL. OIL – oil prices, and STOCK – stock market indices (taken in logarithms).
Tables 2a and 2b show the existence of one-way direct Granger causality from the Saudi stock
markets to oil prices. In fact, the null hypothesis of absence of causality is strongly rejected
11 Note that a sensitivity analysis reveals that the Granger causality results reported in Tables 2a, 2b and 3a, 3b are actually not very sensitive to the number of lags included in the estimated VARs. Indeed, the specifications of VARs incorporating 2 or 3 lags instead of 1, lead to the same test outcomes about non-causality.
12

based on both weekly and monthly data. For the other GCC countries, changes in national
stock indices do not significantly cause changes in oil prices.
Table 2b – Granger causality tests from stock markets to oil prices for the Gulf Corporation Countries
panel (monthly dataset from January 1996 to December 2007 on 4 GCC countries), bivariate (OIL, STOCK) model
Country Estimated Test Statistic Bootstrap critical values
coefficient 1% 5% 10% Bahrain 0.000038 0.393636 9.68393 4.68711 3.03222 Kuwait 0.000603 0.205246 0.80760 0.48910 0.30363 Oman -0.00024 0.150259 0.69011 0.476602 024491 Saudi Arabia -0.000010 1.343260*** 0.88615 0.577966 0.23960 Notes: a) ***, ** and * denotes significance at the 1%, 5% and 10% levels, respectively. b) H0: STOCK does not cause OIL. OIL – oil prices, and STOCK – stock market indices (taken in logarithms).
Our findings are not totally unexpected for at least two reasons. First, the Saudi market is the
biggest stock market in the region: it makes up more than 40% of all GCC markets and one-
third of all Arab markets. Second, Saudi Arabia plays a leading role in worldwide energy
markets. Indeed, estimates show that Saudi Arabia has about 260 billion barrels of oil
reserves, some 24% of the world’s proven total. Hence, Saudi Arabia is the world’s largest
exporter of total petroleum liquids and is currently the world’s second largest crude oil
producer behind Russia. In 2007, International Monetary Fund statistics showed that oil
export revenues accounted for around 90% of total Saudi export earnings and state revenues
and more than 40% of the country’s GDP. Our empirical results suggest that changes in the
Saudi stock markets, which should reflect changes in the Saudi economy, significantly cause
changes in OPEC oil prices.
Table 3a – Granger causality tests from oil prices to stock markets for the Gulf Corporation Countries panel (weekly dataset from 7 June 2005 to 21 October 2008 on the 6 GCC countries),
bivariate (OIL, STOCK) model
Country Estimated Test Statistic Bootstrap critical values
13

coefficient 1% 5% 10% Bahrain 0.00191 0.14211* 0.29211 0.14789 0.00911 Kuwait 0.00231 0.13652** 0.30546 0.12611 0.07768 Oman 0.00155 0.09968** 0.16304 0.08177 0.05540 Saudi Arabia -0.0400 1.14244*** 0.46554 0.24260 0.17622 Qatar 0.00003 0.10445* 0.26374 0.11511 0.07641 United Arab Emirates 0.00022 0.34326** 0.38124 0.22056 0.16416 Notes: a) ***, ** and * denote significance at the 1%, 5% and 10% levels. b) H0: OIL does not cause STOCK.
Tables 3a and 3b show that oil price significantly affect stock prices in all GCC countries.
These results are robust and highly significant at both weekly and monthly data frequencies.
These findings are not surprising given the role played by oil revenues in all GCC economies
(cf. Figure 1). In fact, oil price increases raise national and corporate revenues; stock market
prices are affected.
Table 3b – Granger causality tests from oil prices to stock markets for the Gulf Corporation Countries panel (monthly dataset from January 1996 to December 2007 on 4 GCC countries),
bivariate (OIL, STOCK) model
Country Estimated Test Statistic Bootstrap critical values coefficient 1% 5% 10%
Bahrain 1.32582 8.362054*** 7.31205 4.06357 2.56081 Kuwait 0.20590 3.425624** 5.06262 3.05210 2.93863 Oman 0.08286 0.8525599** 1.4490 0.84143 0.15531 Saudi Arabia 0.35612 5.189276*** 3.84234 2.72987 1.19159 Notes: a) ***, ** and * denotes significance at the 1%, 5% and 10% levels, respectively. b) H0: OIL does not cause STOCK.
In short, there is strong bi-directional Granger causality between oil prices and Saudi stock
market prices. The Saudi market has a close link to the price of oil and can predict it. In other
words, oil prices affect stock prices in Saudi Arabia and political and economic shocks that
influence Saudi Arabia can have an impact on oil prices. For the other GCC countries,
significant Granger causalities are obtained from oil price changes to stock market returns,
results that suggest that oil price changes affect stock markets in these countries but that
changes in these markets do not significantly affect oil prices. In conclusion, traders in the
14

GCC stock markets should look at the changes in oil prices, whereas investors in oil markets
should look at changes in the Saudi stock market and economy.
5. Conclusion
This paper studied the relationship between oil prices and stock markets in GCC countries.
Most GCC members are major net oil-exporters and important OPEC members and their
economies are excessively dependent on oil prices. Thus, their actions as decision makers in
OPEC may take into account their impact on GCC stock markets and economic activities.
Using the panel-data approach of Kónya (2006), which is based on SUR systems and Wald
tests with country-specific bootstrap critical values, and two different (weekly and monthly)
datasets covering respectively the periods from 7 June 2005 to 21October 2008, and from
January 1996 to December 2007, we show strong statistical evidence that the causal
relationship is consistently bi-directional for Saudi Arabia. In the other GCC countries, stock
market price changes do not Granger cause oil price changes, whereas oil price shocks
Granger cause stock price changes. Therefore, investors and policy makers in the GCC stock
markets should keep an eye on changes in oil prices because these changes significantly affect
stock returns. On the other hand, investors in world oil markets should look at changes in the
Saudi stock market because these changes significantly affect oil prices.
Our findings offer several avenues for future research on the linkages between energy product
prices and stock markets. First, the link between oil and stock markets in GCC countries can
be expected to vary across different economic sectors. A sectoral analysis of this link would
be informative. Second, exploring empirically the channels through which high oil prices
affect the stock markets would offer some contribution to the existing literature. Finally, the
methodology applied in this article could be used to examine the effects of other energy
products such as gaz.
15

References
• Balaz, P. and Londarev, A. (2006), “Oil and its position in the process of globalization of
the world economy”. Politicka Ekonomie, 54 (4), 508-528.
• Bashar, Z. (2006), “Wild oil prices, but brave stock markets! The case of Gulf
Cooperation Council (GCC) stock markets”, Operational Research: an International
Journal, 6(2), 145-162.
• Basher, S. A. and Sadorsky, P. (2006), “Oil Price Risk and Emerging Stock Markets”,
Global Finance Journal, 17, 224-251.
• Breitung, J. and Pesaran, M. (2005). “Unit Roots and Cointegration in Panels”, in
Matyas, L., Sevestre, P. (eds.), The Econometrics of Panel Data, Klüver Academic Press.
• Breusch, T. and Pagan, A. (1980), “The LM Test and Its Applications to Model
Specification in Econometrics”, Review of Economic Studies, vol. 47, pp. 239-254.
• Brown, S.P.A. and M.K. Yücel (2002), "Energy Prices and Aggregate Economic Activity:
An Interpretative Survey", The Quarterly Review of Economics and Finance, 42, 193-208.
• Cologni, A. and Manera M. (2008), “Oil prices, inflation and interest rates in a structural
cointegrated VAR model for the G-7 countries.” Energy Economics, 30, 856-88.
• Cunado, J., Perez de Garcia, F. (2005), “Oil prices, economic activity and inflation:
evidence for some Asian countries.” The Quarterly Review of Economics and Finance 45
(1), 65-83.
• El-Sharif, I., Brown, D., Burton, B., Nixon, B. and A. Russell (2005), "Evidence on the
nature and extent of the relationship between oil prices and equity values in the UK",
Energy Economics, 27, 819-830.
• Fasano, U., and Iqbal, Z. (2003), “GCC Countries: from oil dependence to
diversification”, International Monetary Fund, Washington D.C.
• Gronwald, M. (2008). “Large oil shocks and the US economy: Infrequent incidents with
large effects,” Energy Journal, 29, 151-71.
• Hammoudeh, S. and Aleisa, E. (2004), ‘Dynamic relationship among GCC stock markets
and NYMEX oil futures’, Contemporary Economic Policy, 22, 250–269.
• Hammoudeh, S. and Choi, K. (2006), “Behavior of GCC Stock Markets and Impacts of
US Oil and Financial Markets,” Research in International Business and Finance, 20(1),
22-44.
16
• Huang, R. D., Masulis, R. W., and Stoll H. R. (1996), “Energy shocks and financial
markets,” Journal of Futures Markets, 16, 1-27.
• Jones, C.M. and Kaul, G. (1996), “Oil and the Stock Markets”, Journal of Finance, 51(2),
463-491.
• Kilian, L. (2008), “Exogenous Oil Supply Shocks: How Big Are They and How Much Do
They Matter for the US Economy?”, Review of Economics and Statistics, 90, 216-40.
• Kónya, L. (2006), “Exports and growth: Granger causality analysis on OECD countries
with a panel data approach”, Economic Modelling, 23, 978-982.
• Lardic S. and Mignon V. (2006), “The impact of oil prices on GDP in European countries:
An empirical investigation based on asymmetric cointegration”, Energy Policy, 34(18),
3910-3915.
• Lardic S. and Mignon V. (2008), “Oil prices and economic activity: An asymmetric
cointegration approach”, Energy Economics, 30(3), 847-855.
• Lescaroux, F. and V. Mignon (2008), "On the influence of oil prices on economic activity
and other macroeconomic and financial variables", OPEC Energy Review, 32(4), 343-380.
• Naceur, S. B. and Ghazouani, S. (2007), “Stock markets, banks, and economic growth:
empirical evidence from MENA region”, Research in International Business and Finance,
21, 297-315.
• Neaime, S. (2005), “Financial market integration and macroeconomic volatility in the
MENA region: an empirical investigation”, Review of Middle East Economics and
Finance, 3, 231-253.
• Papapetrou, E. (2001), “Oil Price Shocks, Stock Market, Economic Activity and
Employment in Greece,” Energy Economics, 23, 511-32.
• Phillips, P. C. B. (1995), “Fully modified least squares and vector autoregression”.
Econometrica, 63, 1023—1078.
• Sadorsky, P. (1999), “Oil Price Shocks and Stock Market Activity”, Energy Economics, 2,
449-469.
• Shiller, R.J. and Perron, P. (1985), “Testing the random walk hypothesis: Power versus
frequency of observation”, Economic Letters,18, 381-386.
• Toda, H. Y. and Yamamoto, T. (1995), “Statistical inference in vector autoregressions
with possibly integrated processes”, Journal of Econometrics, 66, 225—250.
17
CESifo Working Paper Series for full list see Twww.cesifo-group.org/wp T (address: Poschingerstr. 5, 81679 Munich, Germany, [email protected])
___________________________________________________________________________ 2873 Burkhard Heer and Alfred Maußner, Computation of Business-Cycle Models with the
Generalized Schur Method, December 2009 2874 Carlo Carraro, Enrica De Cian and Massimo Tavoni, Human Capital Formation and
Global Warming Mitigation: Evidence from an Integrated Assessment Model, December 2009
2875 André Grimaud, Gilles Lafforgue and Bertrand Magné, Climate Change Mitigation
Options and Directed Technical Change: A Decentralized Equilibrium Analysis, December 2009
2876 Angel de la Fuente, A Mixed Splicing Procedure for Economic Time Series, December
2009 2877 Martin Schlotter, Guido Schwerdt and Ludger Woessmann, Econometric Methods for
Causal Evaluation of Education Policies and Practices: A Non-Technical Guide, December 2009
2878 Mathias Dolls, Clemens Fuest and Andreas Peichl, Automatic Stabilizers and Economic
Crisis: US vs. Europe, December 2009 2879 Tom Karkinsky and Nadine Riedel, Corporate Taxation and the Choice of Patent
Location within Multinational Firms, December 2009 2880 Kai A. Konrad, Florian Morath and Wieland Müller, Taxation and Market Power,
December 2009 2881 Marko Koethenbuerger and Michael Stimmelmayr, Corporate Taxation and Corporate
Governance, December 2009 2882 Gebhard Kirchgässner, The Lost Popularity Function: Are Unemployment and Inflation
no longer Relevant for the Behaviour of Germany Voters?, December 2009 2883 Marianna Belloc and Ugo Pagano, Politics-Business Interaction Paths, December 2009 2884 Wolfgang Buchholz, Richard Cornes and Dirk Rübbelke, Existence and Warr Neutrality
for Matching Equilibria in a Public Good Economy: An Aggregative Game Approach, December 2009
2885 Charles A.E. Goodhart, Carolina Osorio and Dimitrios P. Tsomocos, Analysis of
Monetary Policy and Financial Stability: A New Paradigm, December 2009 2886 Thomas Aronsson and Erkki Koskela, Outsourcing, Public Input Provision and Policy
Cooperation, December 2009

2887 Andreas Ortmann, “The Way in which an Experiment is Conducted is Unbelievably
Important”: On the Experimentation Practices of Economists and Psychologists, December 2009
2888 Andreas Irmen, Population Aging and the Direction of Technical Change, December
2009 2889 Wolf-Heimo Grieben and Fuat Şener, Labor Unions, Globalization, and Mercantilism,
December 2009 2890 Conny Wunsch, Optimal Use of Labor Market Policies: The Role of Job Search
Assistance, December 2009 2891 Claudia Buch, Cathérine Tahmee Koch and Michael Kötter, Margins of International
Banking: Is there a Productivity Pecking Order in Banking, too?, December 2009 2892 Shafik Hebous and Alfons J. Weichenrieder, Debt Financing and Sharp Currency
Depreciations: Wholly vs. Partially Owned Multinational Affiliates, December 2009 2893 Johannes Binswanger and Daniel Schunk, What is an Adequate Standard of Living
during Retirement?, December 2009 2894 Armin Falk and James J. Heckman, Lab Experiments are a Major Source of Knowledge
in the Social Sciences, December 2009 2895 Hartmut Egger and Daniel Etzel, The Impact of Trade on Employment, Welfare, and
Income Distribution in Unionized General Oligopolistic Equilibrium, December 2009 2896 Julian Rauchdobler, Rupert Sausgruber and Jean-Robert Tyran, Voting on Thresholds
for Public Goods: Experimental Evidence, December 2009 2897 Michael McBride and Stergios Skaperdas, Conflict, Settlement, and the Shadow of the
Future, December 2009 2898 Ben J. Heijdra and Laurie S. M. Reijnders, Economic Growth and Longevity Risk with
Adverse Selection, December 2009 2899 Johannes Becker, Taxation of Foreign Profits with Heterogeneous Multinational Firms,
December 2009 2900 Douglas Gale and Piero Gottardi, Illiquidity and Under-Valuation of Firms, December
2009 2901 Donatella Gatti, Christophe Rault and Anne-Gaël Vaubourg, Unemployment and
Finance: How do Financial and Labour Market Factors Interact?, December 2009 2902 Arno Riedl, Behavioral and Experimental Economics Can Inform Public Policy: Some
Thoughts, December 2009
2903 Wilhelm K. Kohler and Marcel Smolka, Global Sourcing Decisions and Firm
Productivity: Evidence from Spain, December 2009 2904 Marcel Gérard and Fernando M. M. Ruiz, Corporate Taxation and the Impact of
Governance, Political and Economic Factors, December 2009 2905 Mikael Priks, The Effect of Surveillance Cameras on Crime: Evidence from the
Stockholm Subway, December 2009 2906 Xavier Vives, Asset Auctions, Information, and Liquidity, January 2010 2907 Edwin van der Werf, Unilateral Climate Policy, Asymmetric Backstop Adoption, and
Carbon Leakage in a Two-Region Hotelling Model, January 2010 2908 Margarita Katsimi and Vassilis Sarantides, Do Elections Affect the Composition of
Fiscal Policy?, January 2010 2909 Rolf Golombek, Mads Greaker and Michael Hoel, Climate Policy without Commitment,
January 2010 2910 Sascha O. Becker and Ludger Woessmann, The Effect of Protestantism on Education
before the Industrialization: Evidence from 1816 Prussia, January 2010 2911 Michael Berlemann, Marco Oestmann and Marcel Thum, Demographic Change and
Bank Profitability. Empirical Evidence from German Savings Banks, January 2010 2912 Øystein Foros, Hans Jarle Kind and Greg Shaffer, Mergers and Partial Ownership,
January 2010 2913 Sean Holly, M. Hashem Pesaran and Takashi Yamagata, Spatial and Temporal
Diffusion of House Prices in the UK, January 2010 2914 Christian Keuschnigg and Evelyn Ribi, Profit Taxation and Finance Constraints,
January 2010 2915 Hendrik Vrijburg and Ruud A. de Mooij, Enhanced Cooperation in an Asymmetric
Model of Tax Competition, January 2010 2916 Volker Meier and Martin Werding, Ageing and the Welfare State: Securing
Sustainability, January 2010 2917 Thushyanthan Baskaran and Zohal Hessami, Globalization, Redistribution, and the
Composition of Public Education Expenditures, January 2010 2918 Angel de la Fuente, Testing, not Modelling, the Impact of Cohesion Support: A
Theoretical Framework and some Preliminary Results for the Spanish Regions, January 2010
2919 Bruno S. Frey and Paolo Pamini, World Heritage: Where Are We? An Empirical
Analysis, January 2010

2920 Susanne Ek and Bertil Holmlund, Family Job Search, Wage Bargaining, and Optimal
Unemployment Insurance, January 2010 2921 Mariagiovanna Baccara, Allan Collard-Wexler, Leonardo Felli and Leeat Yariv, Gender
and Racial Biases: Evidence from Child Adoption, January 2010 2922 Kurt R. Brekke, Roberto Cellini, Luigi Siciliani and Odd Rune Straume, Competition
and Quality in Regulated Markets with Sluggish Demand, January 2010 2923 Stefan Bauernschuster, Oliver Falck and Niels Große, Can Competition Spoil
Reciprocity? – A Laboratory Experiment, January 2010 2924 Jerome L. Stein, A Critique of the Literature on the US Financial Debt Crisis, January
2010 2925 Erkki Koskela and Jan König, Profit Sharing, Wage Formation and Flexible
Outsourcing under Labor Market Imperfection, January 2010 2926 Gabriella Legrenzi and Costas Milas, Spend-and-Tax Adjustments and the
Sustainability of the Government’s Intertemporal Budget Constraint, January 2010 2927 Piero Gottardi, Jean Marc Tallon and Paolo Ghirardato, Flexible Contracts, January
2010 2928 Gebhard Kirchgässner and Jürgen Wolters, The Role of Monetary Aggregates in the
Policy Analysis of the Swiss National Bank, January 2010 2929 J. Trent Alexander, Michael Davern and Betsey Stevenson, Inaccurate Age and Sex
Data in the Census PUMS Files: Evidence and Implications, January 2010 2930 Stefan Krasa and Mattias K. Polborn, Competition between Specialized Candidates,
January 2010 2931 Yin-Wong Cheung and Xingwang Qian, Capital Flight: China’s Experience, January
2010 2932 Thomas Hemmelgarn and Gaetan Nicodeme, The 2008 Financial Crisis and Taxation
Policy, January 2010 2933 Marco Faravelli, Oliver Kirchkamp and Helmut Rainer, Social Welfare versus
Inequality Concerns in an Incomplete Contract Experiment, January 2010 2934 Mohamed El Hedi Arouri and Christophe Rault, Oil Prices and Stock Markets: What
Drives what in the Gulf Corporation Council Countries?, January 2010