oil & natural gas technology library/research/oil-gas/nt42951... · an alternative approach is...
TRANSCRIPT

Oil & Natural Gas Technology
Development and Application of Insulated Drill Pipe for
High Temperature, High Pressure Drilling
Final Technical Report October 1, 2006 – November 30, 2008
Tom Champness
Tony Worthen John Finger
Issued: January, 2009
DOE Award No.: DE-FC26-06NT42951
Submitted by:
Drill Cool Systems 627 Williams St
Bakersfield, CA 93305
Office of Fossil Energy

DISCLAIMER: This report was prepared as an account of work sponsored by an agency of the United States Government. Neither the United States Government nor any agency thereof, nor any of their employees, makes any warranty, express or implied, or assumes any legal liability or responsibility for the accuracy, completeness, or usefulness of any information, apparatus, product, or process disclosed, or represents that its use would not infringe privately owned rights. Reference herein to any specific commercial product, process, or service by trade name, trademark, manufacturer, or otherwise does not necessarily constitute or imply its endorsement, recommendation, or favoring by the United States Government or any agency thereof. The views and opinions of authors expressed herein do not necessarily state or reflect those of the United States Government or any agency thereof. ABSTRACT: This project aimed to extend the insulated drill pipe (IDP) technology already demonstrated for geothermal drilling to HTHP drilling in deep gas reservoirs where temperatures are high enough to pose a threat to downhole equipment such as motors and electronics. The major components of the project were: a preliminary design; a market survey to assess industry needs and performance criteria; mechanical testing to verify strength and durability of IDP; and development of an inspection plan that would quantify the ability of various inspection techniques to detect flaws in assembled IDP. This report is a detailed description of those activities.

TABLE OF CONTENTS 1. Executive Summary ......................................................................................................1 2. Introduction and Background ...................................................................................... 3 3. Preliminary Design .......................................................................................................6 4. Mechanical Testing ...................................................................................................... 9 5. Inspection Plan ............................................................................................................13 6. Market Survey .............................................................................................................15 7. Conclusions .................................................................................................................18 Bibliography ................................................................................................................... 20 List of Acronyms and Abbreviations .............................................................................. 20 Appendix A – Mechanical testing procedure .................................................................. 21 Appendix B – Mechanical testing results .........................................................................22 Appendix C – Scope of Work: Development of inspection plan ......................................53 Appendix D – Inspection development procedure ............................................................54 Appendix E – Scope of Work: Market survey ..................................................................57 Appendix F – Market Survey Results ...............................................................................58

1. EXECUTIVE SUMMARY Hydrocarbon reservoirs that produce high drilling temperatures – both on the surface and in particular downhole – have historically driven the cost of reaching these reservoirs to a level that precludes any economic benefits. Reservoirs where either or both high temperatures and high pressures produce significant problems in drilling have become known generically as HTHP (high-temperature, high-pressure), and are increasingly common, especially in deep gas drilling. Unacceptable failure rates—caused by premature failure of both surface equipment and downhole equipment—are typical of wells in these reservoirs and the more costly of these failures include downhole motors, logging-while-drilling (LWD) and measurement-while-drilling (MWD) tools, drill bits, and other tools that incorporate hydraulic seals and electronic components. Drilling fluid properties can also deteriorate at high temperatures, resulting in an inability to carry the cuttings and promoting higher wear rates on drill bits due to the higher temperatures at the bit face. This latter effect is particularly acute with bits having pressure seals. Additionally, corrosion rates can increase exponentially at elevated temperatures, resulting in premature failure of even conventional drilling components such as drill pipe and drill collars. Finally, steel alloys used for drill pipe can lose 8-10% of their yield strength at temperatures above 450oF. Each of the problems mentioned above can be addressed by individual technology developments, but this R&D process can be very costly in both time and resources. An alternative approach is simply to control the temperature of the downhole environment so that existing drilling technology can more easily survive in this harsh environment. Insulated drill pipe (IDP) enables management of the drilling fluid temperature at the bottom hole assembly (BHA) and provides a more favorable environment.
Figure 1 – drilling fluid temperatures with IDP and CDP
0 100 200 300 400 500Temperature, F
16000
12000
8000
4000
0
Dep
th, f
eet
TemperaturesFormationDrilling fluid with CDPDrilling fluid with IDP
In conventional rotary drilling, fluid circulates down the steel drill pipe, passes through the bit to clean the hole-bottom, and returns, carrying the cuttings, up the annulus between the pipe and borehole. Because the drill pipe is an effective counter-flow heat exchanger, drilling fluid temperatures inside and outside the pipe are very similar to each other at any given depth (see Figure 1 – the left-hand side of each curve is temperature inside the drill pipe and the right-hand side is temperature in the annulus between the drill pipe and wellbore). Fluid temperatures also tend to follow the formation temperature. In a given formation, downhole temperatures are affected by many drilling parameters – fluid flow rate, rate of penetration, fluid properties, bit-jet sizes, and the like – but sensitivity studies have shown that these factors are minor in comparison to the thermal conductivity of the drill pipe. Figure 1 also shows the calculated
- 1 -

temperature reduction with IDP compared to conventional drill pipe (CDP) in a 15,000 foot gas well, with 4.75” bottom-hole diameter, assuming that the well is drilled with water-based mud over a period of 50 days. Thermal properties for IDP are taken from those of existing 3.5” IDP. Drilling parameters and formation temperatures used in these calculations are based on those in an actual South Texas gas well. This performance is discussed in more detail later, but the crucial factor is that IDP provides a significantly lower bottomhole temperature than conventional drill pipe. To meet this project’s objective of extending IDP use into deep gas drilling, a two-phase project was originally proposed: Phase 1 would be preparatory, including a preliminary design for IDP, mechanical testing of that design, development of an inspection plan for the design, and a market survey to assess industry’s needs and concerns; while Phase 2 would build on this work to fabricate 12-15 joints of prototype IDP (based on any design changes suggested by the mechanical testing and market survey), use the prototype pipe for drilling in an actual HTHP well, and confirm the thermal performance with a field test in a hot well (either geothermal or hydrocarbon). The market survey was inconclusive, however, with respect to industry needs and concerns (described in detail in the body of the report), so the project was ended at the conclusion of Phase 1. The Phase 1 work described in detail in this report comprises these four major activities:
• Produce a preliminary design: Drill Cool Systems (DCS) submitted a preliminary design, based on existing drill pipe, to DOE for approval of the basic approach to construction of IDP.
• Perform mechanical testing that verifies IDP’s strength and ruggedness: It is clearly
necessary to assure a potential customer that the extra steps involved in building IDP have not compromised its strength and durability relative to conventional drill pipe. An extensive mechanical testing program demonstrated IDP’s undiminished performance.
• Design an inspection program that will quantify the ability to detect flaws in assembled
IDP: If there is a mechanical flaw in the drill pipe body before insertion of the insulation liner, it cannot be seen by conventional visual inspection. An inspection program was designed to evaluate the ability of various techniques to detect such flaws.
• Run a market survey to identify industry concerns about IDP and to choose the optimum
size pipe for industry needs: The industry is generally unfamiliar with the concept of IDP, and is often resistant to new technology. A market survey attempted to identify their concerns and also to predict where the principal markets might be, so that the prototype IDP would be built in an appropriate size.
In the organization of this report, each of these topics is discussed with individual sub-heads of “Methods”, “Results and Discussion”, and “Conclusions”, and there is a “Conclusions” section for the complete report.
- 2 -

2. INTRODUCTION AND BACKGROUND The Master Announcement for this funding opportunity presents an excellent statement of the problem, “Extremely high temperatures (>400oF), exceptionally high pressures (>15,000 psi), exceedingly hard rock, and highly corrosive gases all combine to create a very hostile environment for well drilling and completion. These conditions lead to material and electronic failures, increased wear on equipment, and increased technical and safety risk due to an inability to monitor downhole conditions. ” Hydrocarbon reservoirs that produce high drilling temperatures – both in surface equipment and in particular downhole – have historically driven the cost of reaching these reservoirs to a level that precludes any economic benefits. Unacceptable failure rates—caused by premature degradation of both surface equipment and downhole equipment—are typical of wells in these reservoirs and the more costly of these failures include downhole motors, logging-while-drilling (LWD) and measurement-while-drilling (MWD) tools, drill bits, and other tools that incorporate hydraulic seals and electronic components. Drilling fluid properties can also deteriorate at high temperatures, resulting in an inability to carry the cuttings and promoting higher wear rates on drill bits due to the higher temperatures at the bit face. This latter effect is particularly acute with bits having pressure seals. Additionally, corrosion rates can increase exponentially at elevated temperatures, resulting in premature failure of even conventional drilling components such as drill pipe and drill collars. Finally, steel alloys used for drill pipe can lose 8-10% of their yield strength at temperatures above 450oF. Each of the problems mentioned above can be addressed by individual technology developments, but this process can be very costly in both time and resources. An alternative approach is simply to control the temperature of the downhole environment so that existing drilling technology can more easily survive in this harsh environment. Insulated drill pipe provides a means to deliver much cooler drilling fluid to the bottom hole assembly (BHA) allowing these components to successfully function in a more favorable environment. Insulated drill pipe has a long history. Sandia National Laboratories worked on this concept in the early 1980s for application to the Magma Energy Program1. Thermal and mechanical analyses were done at Sandia in the 1980s. Contracts for feasibility studies and preliminary designs of double-wall IDP were placed with two companies experienced in manufacturing insulated tubing for steam injection, but a grant from the California Energy Commission was rescinded at about the same time as the DOE ended the Magma Energy Program. The project lay dormant until the mid-1990s, when Drill Cool Systems (DCS) of Bakersfield, CA, became interested in pursuing IDP as a business line for the geothermal drilling industry. They built three joints of prototype IDP, did preliminary tests to evaluate the effective thermal conductivity of the pipe, and ran these joints in field operations – drilling one geothermal well and working-over another. This effort led to further analysis, fabrication, and testing of IDP, including the construction of a complete string of large-diameter IDP used in a field test in an Imperial Valley geothermal well in 1999. 1 J. T. Finger, “Drilling Fluid Temperatures in a Magma-Penetrating Wellbore,” Geothermal Resources Council, TRANSACTIONS, Vol. 10, September 1986
- 3 -

This field test demonstrated not only that IDP delivered the thermal advantages predicted by analysis, but also that we could reliably model its performance2. The 5” IDP developed for the geothermal industry, however, was much too large and heavy (>50% increase over 5” CDP) for a typical deep HTHP gas well below 15,000 feet. The design concept used for insulated drill pipe in this project is shown in Figure 2. Construction is based on conventional drill pipe, with the tool joints modified to accept a liner tube (described in detail in Section 3), and with the annulus between the pipe body and liner filled with insulation. This assembly is simple and rugged, with virtually no effect on the strength of the parent drill pipe. The insulating material is a proprietary, but commercially available, compound.
InsulationLiner
tube
Figure 1 – drilling fluid temperatures with IDP and CDP
0 100 200 300 400 500Temperature, F
16000
12000
8000
4000
0
Dep
th, f
eet
TemperaturesFormationDrilling fluid with CDPDrilling fluid with IDP
To discuss the performance of IDP built to this design, we will return to Figure 1, shown in the Executive Summary. These curves are calculations, not field data but, as stated earlier, the thermal properties of the IDP are measured quantities; the drilling, wellbore, and formation parameters are taken from an actual well in South Texas; and the calculation method is one that has proven realistic in field experiments in a geothermal well. Several important aspects of IDP performance are shown in the figure.
• Bottom-hole circulating temperature is reduced from 387oF with CDP to 252oF with IDP. This is the temperature that downhole motors, steering tools, or measurement-while-drilling (MWD) instrumentation must survive. A temperature
2 J. T. Finger, R. D. Jacobson, A. T. Champness, “Development and Testing of Insulated Drillpipe”, SPE 59144, presented at the 2000 IADC/SPE Drilling Conference, New Orleans, LA, February 2000
Drill Figure 2 - Schematic of IDP pipe
- 4 -

reduction in this temperature range is especially valuable because many tools have a performance limit at about 310-325oF. It is important to note that the bottom-hole cannot be effectively cooled by simply lowering the mud inflow temperature. In the situation illustrated by Figure 1, for example, using coolers to lower the inflow temperature by 40oF while using CDP lowers the bottom-hole temperature by less than 2oF.
• Maximum fluid temperatures, which are not at the bottom of the hole, are 388oF for CDP and 270oF for IDP. For drilling fluid additives that degrade at high temperature, this difference can be critical.
• Fluid return temperatures are 130oF for CDP and 148oF for IDP (with inflow temperatures of 130oF.) This indicates that more heat is being removed from the wellbore, and therefore formation temperatures will be lower after drilling with IDP.
• The equivalent circulating density (ECD) is very important in calculating pressure drops in deep wells, and ECD is highly temperature-dependent. Because the curve of annulus temperature is more nearly vertical with IDP, this means the ECD will be more constant, and therefore more predictable, with IDP.
• The wellbore temperature profile can be controlled at some level between the curves defined by the “full IDP” and “full CDP” cases by tailoring the drillstring with a mixture of the two kinds of pipe.
• A little bit of insulation makes a profound difference. It is shown in detail elsewhere3 that the un-insulated tool joints and a variation in insulation conductivity by a factor of five have relatively small effects on the thermal performance.
With this basic understanding, then, the balance of the report is devoted to activities pursued under this Award.
3 J. Finger, R. Jacobson, G. Whitlow, T. Champness; “Insulated Drill Pipe for High-Temperature Drilling”, Sandia Report SAND2000-1679, Sandia National Laboratories, July 2000
- 5 -

3. PRELIMINARY DESIGN 3.1 Method/Approach The preliminary design presented to DOE/NETL was based on an existing string of 3.5” drill pipe built by Drill Cool Systems. The design follows the general concept shown in Figure 2 (p. 4) but is augmented by details of materials and construction methods. Given that concept, there are several decisions to be made: what kind of insulation should be used; how should it be applied/attached to the drill pipe; how much protection does it need; and what should be the overall configuration of the assembled pipe? Many of these decisions, however, are greatly simplified by the fundamental principle that a relatively small amount of insulation has a major impact on drilling temperatures. With that in mind, we can examine several design features in more detail. Insulation quality: In the equation for heat transfer through a unit length of the insulated portion of the pipe, five quantities make up the thermal resistance through the pipe wall: convective heat transfer coefficients at the outside and inside surfaces, and conductivities of the drill pipe, the liner tube, and the insulation. For conditions typical of drilling, four of the five quantities are numerically of similar magnitude. Only the quantity that represents the low-conductivity insulation is much smaller than the others. For conventional steel pipe (CDP), then, the convective and conductive terms are relatively equal in importance, while the insulation dominates the total heat transfer for insulated pipe. This means that even a small amount of insulation has a significant effect on heat transfer; in other words, the insulation doesn’t have to be extremely efficient. Another limit on minimum heat transfer is set by the un-insulated tool joints at each end of each piece of pipe, which would conduct heat even if insulation in the pipe body were perfect. In considering possible insulation materials, there are many kinds of plastic, glass, or rock that have conductivity, or k, values from 0.1 to 0.5 B/hr-ft-F, compared to steel at 26 or good insulators such as cork at 0.025 or glass wool at 0.022 B/hr-ft-F, so a key question is to determine what range of k value is necessary. In evaluating insulation requirements, however, calculated drilling fluid temperatures (including the effect of the tool joints) show that there is little difference in performance among IDP designs with an insulating layer having conductivity values of 0.05, 0.3, and 1.0 B/hr-ft-F. Tool joints: Using the same rationale as above, there is little advantage to insulating the tool joint area, since this only represents about 10% of the total length of the drill string (and the tool joints’ wall thicknesses are already much greater than the pipe body, which reduces heat transfer through them.) Insulating the tool joints is also a difficult technical challenge, which would adversely affect cost, complexity, and reliability. Insulation protection: Given that the insulating layer is contained between inner and outer metal tubes, there is a question as to how much protection it needs. Early in the IDP evolution, the inner tube was designed to be strong enough to withstand internal pressure on its own, but with the use of an insulating material having enough compressive strength to support the liner tube against internal pressure in the pipe, the liner tube can be of much less robust construction.
- 6 -

Pipe strength: Because of the design approach discussed above, strength of the IDP is taken to be the strength of the parent drill pipe. This pipe is first modified by attaching the liner tube and by drilling a hole in the flank of the tool joint to fill the annular cavity with the insulation material. The liner tube and the insulating material are thus assumed to neither detract from nor add to the strength of the original pipe insofar as pressure capability is concerned. Because the IDP is somewhat heavier than equivalent CDP (16.4 lb/ft versus 14.2 lb/ft for the preliminary 3.5” design) there may be an issue with tensile strength for very long drill strings. 3.2 Results The design principles above led to the preliminary design shown in diagram below (Figure 3).
Insulation
Fill/Vacuum Port Plug
Liner
Parent Drill Pipe
Liner Termination Sleeve
Figure 3 – IDP components
Table 1 gives relevant dimensions for the IDP components. Conventional Drill Pipe Description 3-1/2" 13.3# NC38
Conventional Drill Pipe Tool Joint ID (in) 2.125Conventional Drill Pipe Nominal ID (in) 2.764
Insulation Thickness (in) 0.195
Liner ID - IDP Adjusted ID (in) 2.245
IDP Adjusted Weight per Foot (lbs/ft) 16.426 In general, the parent drill pipe is modified to accept the liner in the following way:
1. The inside diameter of the box end tool joint is bored slightly larger than the outside diameter of the liner.
- 7 -

2. The pin end tool joint is bored to form a register, or “stop” for the end of the liner, which is inserted from the box end. (Figure 4)
3. Both tool joints receive a threaded hole, used for filling the annulus with insulation. 4. The liner is inserted into the drill pipe, marked for the correct length, then withdrawn and
cut to length. 5. Liner is re-inserted into the drill pipe and the brass Liner Termination Sleeve is fixed in
place in the box end tool joint to retain the liner. 6. The insulation and its curing agent are mixed and de-aerated, then injected into the
annulus between the liner and drill pipe. Insulation is injected into one fill hole while vacuum is drawn on the other.
7. After the insulation is cured, the fill plugs are screwed into the fill holes and secured with thread-lock compound.
Note: The composition of the insulation material, and details of the installation procedure for the Liner Termination Sleeve, are proprietary to Drill Cool Systems, but the complete process has been described in a separate Topical Report submitted to DOE/NETL.
Liner register
Insulation fill hole
Figure 4 – Pin end detail
3.3 Conclusions Insulated pipe can be used in any HTHP environment serviced by conventional drill pipe. None of IDP’s components are susceptible to high temperature and its performance does not change with temperature. The parent drill pipe can be any grade, in case there is a need for corrosion resistance or other unique properties. A possible limitation on IDP use is its inside diameter, which is smaller than equivalent conventional pipe because of the liner tube. This means that, for a given flow rate, there will be greater pressure drop through a string of IDP than through an equivalent string of conventional pipe. This factor turned out to be one of industry’s principal concerns.
- 8 -

4. MECHANICAL TESTING 4.1 Method/Approach The general approach to mechanical testing was to identify the operating environment that the pipe sees in HTHP use and to analyze the stresses that result from that situation. The test plan, which attempted to reproduce those stresses and to evaluate their effect, was developed with Stress Engineering Services (SES) in Houston, and the Scope of Work for the SES contract is given in Appendix A. An outline of the test plan, with a brief rationale for each test, is given below.
1. Tensile: The principal concern in tension is that the pipe body is made from stronger steel than the liner. This means that when the assembled pipe is stretched, the liner may yield while the pipe body is still in the elastic range. When the tensile load is relaxed then, the liner will be in compression and might experience slight buckling. In the tensile test, the pipe will be loaded to 90% of the pipe body yield, with simultaneous internal pressure, and will be cycled through this loading several times. The complete inside diameter surface of the pipe will be inspected before and after the test with a “borescope” that can optically identify any distortion. As the final step in the testing, the pipe will be pulled until the pipe body yields.
2. Internal pressure: Internal pressure capacity of the IDP should actually be greater than
for the parent drill pipe, but the contribution of the liner and insulation will be ignored. The concern is that somehow a flow path might be established through the fill plugs used to inject the insulation into the annulus between the drill pipe body and the liner. The IDP will be pressurized to 7500 psi and the fill plugs will be monitored for leaks while this pressure is held. Fill plugs will also be monitored during the tensile test, when the pipe will be internally pressurized.
3. Fatigue: Most drill pipe failures are related in some way to fatigue loading, and most of
these failures occur near the point where the drillpipe and tool joint are joined. This is particularly relevant for IDP because of the tool joint modifications required to seat the insulation liner. Although the drill pipe manufacturer has done finite-element analysis of this modification and found it to be inconsequential, we felt that it is important to confirm this with fatigue testing.
Stress levels for the fatigue test will reproduce stresses developed in drilling a deviated well with a build rate of 15O/100 feet. Pipe configuration for the test, to focus on the tool joint area, will be an assembly in which a joint of IDP will be cut in two at the middle and the two ends screwed together. A rotating eccentric weight applied to the end of the pipe will then load the pipe in a fatigue mode until it fails. Pipe condition will be monitored by internal water pressure, with a wet-detector near the tool joint to signal when there is a leak. The pipe will be tested to failure in this fatigue mode, and the results will be compared with other proprietary fatigue data at Stress Engineering. This will enable us to make sure that the IDP fatigue performance lies roughly on the same fatigue curves as conventional drill pipe.
- 9 -

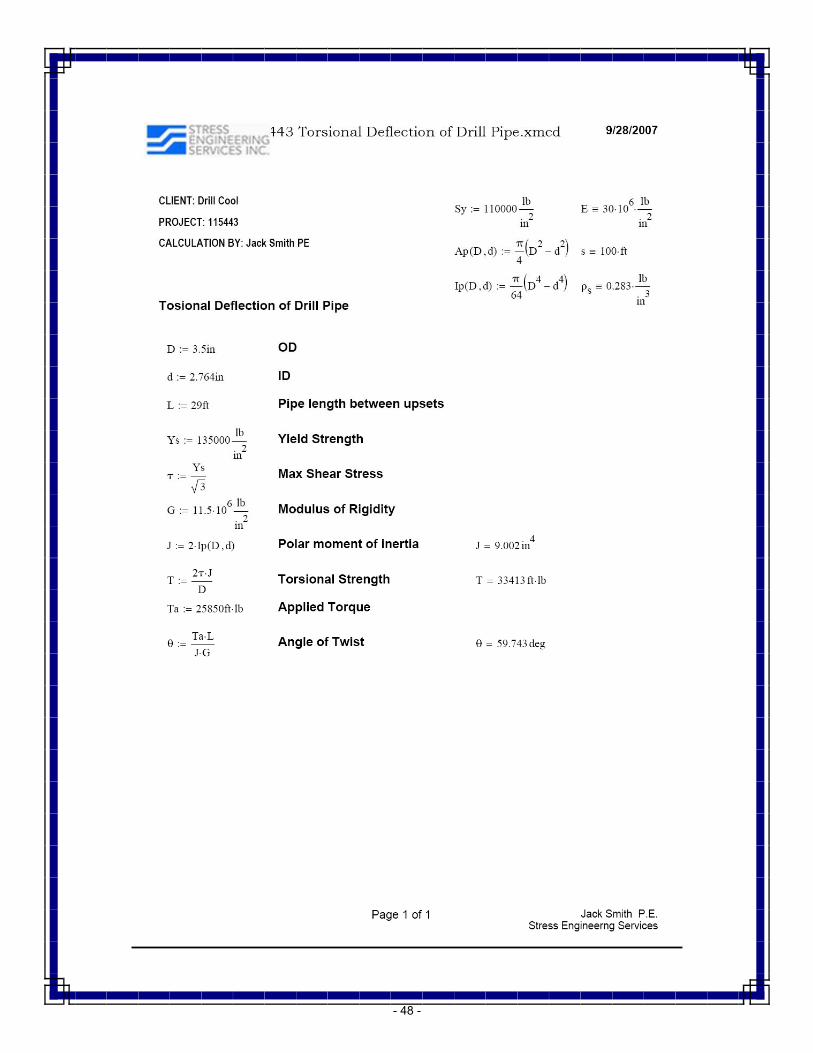
4. Torsion: Torsion load on the drill pipe will be 20,000 ft-lb, which represents 60% of the torsional yield strength of the pipe. It is also well above the recommended make-up torque (11,000 ft-lb) for the connection. The pipe will be cycled through this loading five times and will be monitored for leakage.
5. Compression: This test will address any concern that the liner would deform under
compressive loads on the drill string. Normally, the bottom-hole assembly is designed so that drill collar weight will keep the drill string in tension, but as deviated wells become common, there is some occasion for drill pipe in compression. The test will load the pipe to 50% of compressive yield.
4.2 Results Testing was done at SES facilities in Houston. Most of the testing was done during July, 2007. A brief recap of each test procedure and its results is given below, and the complete SES test report is in Appendix B. Internal pressure test: Applied 2500 psi internal pressure to pipe. No leakage into insulated annulus. Tensile to proof load: Applied axial tensile load of 343,650 lbs (90% of premium class strength). Leakage from pipe ID into annulus between internal tube and drill pipe body was measured by removing the insulation fill plug and testing for leaks. Leakage occurred at 800 psi, but it should be emphasized that this is only an indication of a leak at the point where the liner tube is seated into the tool joint. This is a minimal effect because it would only introduce a small amount of drilling fluid into the insulation volume, which would have a negligible effect on the insulating properties of the IDP. Because the fill plug is very sturdy, it is extremely unlikely that the fluid path could pass through it and lead to a washout. Tensile to yield: Applied axial tensile load of 492 kips. No apparent yielding of pipe body. No visual buckling or damage to internal tube. Compression to yield: Applied compressive load of 235 kips. Pipe buckled. Fatigue Test: Induced cyclic outer fiber strain of 600 microstrain (18,000 psi) in pipe adjacent to external upset. Pipe ran for 1,362,900 cycles. No leakage at 200 psi into insulated annulus after test. Fatigue test set-up is shown in Figure 5.
- 10 -

Figure 5 – Schematic of fatigue test set-up
These fatigue test results showed that the IDP fell along a line for steel pipe in general (Figure 6), which is a desired outcome because it indicates that the mechanical modifications to the pipe required by the addition of insulation do not degrade the fatigue strength of the parent pipe body.
Figure 6 – Fatigue life for IDP sample
Torsion to yield: Pipe loaded in torsion to more than 33,000 ft-lbs (above yield strength), which produced a twist angle of 77O. No leakage from pipe bore into insulation annulus after test.
- 11 -

4.3 Conclusions The test program, which we consider to be successful, is summarized in Table 1 below. The mechanical test program did not reveal any fundamental flaws in the preliminary design.
Table 2 – Mechanical Testing Test Activity Rationale Results
Internal pressure Monitor fill-plug performance
IDP pressurized to 2500 psi. No leakage into insulated annulus.
Tensile, proof load Evaluate liner movement
Pipe loaded to 344 k-lbs (90% premium strength). Small leakage into insulated annulus, but this is not critical to either strength or insulation properties.
Tensile to yield Pipe failure or liner buckling
Pipe loaded to 492 k-lbs. No parting of pipe body, no visible buckling of liner.
Compression to yield
Evaluate effect on liner
Pipe loaded to 235 k-lbs (above 50% yield), with anti-buckling supports. No noticeable effect on liner. Drilling plans always strive to keep drill pipe in tension, but occasionally deviated wells will apply compression.
Fatigue Effect of liner installation
Induced cyclic strain of 600 µin/in (18,000 psi stress). Pipe ran for 1,362,900 cycles with no leakage at 200 psi into insulation annulus. This result fell along the curve for steel pipe in general, which indicates that the liner modifications did not degrade the fatigue strength of the IDP.
Torsion to yield Effect of torsion on liner
Pipe loaded in torsion to more than 33,000 ft-lbs (above yield strength), which produced a twist angle of 77O. No leakage from pipe bore into insulation annulus after test.
Perhaps the most important part of the mechanical testing dealt with fatigue, because there had been some industry feedback that machining the tool joints to accept the ends of the insulation liner tube might create a stress riser. Although analysis had indicated that this effect is negligible, it was important to be able to show this in physical testing.
- 12 -
5. INSPECTION PLAN 5.1 Method/Approach Much of conventional drill pipe inspection relies on visual access to the pipe surface, or on NDT techniques (ultrasonic, etc.) that can look “through” the pipe from the outside to detect flaws on the inside surface. Once conventional drill pipe is converted into IDP by installation of the liner and insulation, then visual access is no longer possible, and the inside diameter is no longer a free surface. It is important to verify that NDT techniques can still detect flaws inside the drill pipe body (i.e., in the annular space beneath the insulation and liner). To provide quality assurance for the assembled IDP, Drill Cool Systems contracted with TH Hill Associates in Houston to develop an inspection plan for the assembly. (See Appendix C for Scope of Work for the TH Hill contract and Appendix D for details of the inspection procedure.) 5.2 Results The essence of the inspection plan was to compare four conventional NDT methods and their abilities to detect flaws on the inner surface of the parent drill pipe after assembly of the IDP components. The planned mechanism for this comparison was to deliberately machine flaws into a virgin pipe body, inspect this pipe with various methods to evaluate their accuracy, install the liner and insulation, and re-inspect the assembled IDP to verify that the chosen method(s) could still identify the flaws. The essential nature of this activity is to machine “standard” flaws into premium drill pipe before the insulation is installed, and then develop an inspection protocol using the standardized method that best captures the nature of the flaws with insulation in place. (See Appendix C for details) This plan is a modification of the industry-standard DS-1 inspection, so it should be widely acceptable even to people who are not familiar with the IDP concept. The inspection methods considered in development of the plan are the following:
• Full Length Ultrasonic Testing (FLUT) • Ultrasonic Wall Thickness Inspection • Ultrasonic Slip/Upset Inspection • Electromagnetic Inspection (EMI)
Three pipe sizes were chosen for use in this development: 3-1/2”, 5”, and 6-5/8”, and in each case, the heaviest available wall thickness was acquired to evaluate how deeply into the material the relevant NDT method could penetrate. Pipe sizes reflected our best estimates of what the potential markets for IDP might be: 3-1/2” is typical for South Texas and other onshore drilling; 6-5/8” is commonly used offshore; and 5” is a generic, and common, pipe size for other applications. The pipes’ specific weights, tool joint sizes, conditions, and diameters were the following (the variation in condition-new to used-would also help evaluate the effect of wear on the inspection procedure):
• 3-½ “, 13.30 lb/ft, NC38 connection (used) • 5”, 19.50 lb/ft, NC50 connection (new) • 6-5/8”, 27.70 lb/ft, 6-5/8FH connection (premium)
A secondary objective of the inspection development was to determine whether the inspection
- 13 -

procedure can measure the concentricity of the pipe and liner (how well the liner is centered in the pipe) and evaluate the insulation fill (whether there are voids in the insulation). This function is less important structurally than flaw detection, but would be a useful addition to the IDP quality control. There were four basic steps for completion of the inspection plan:
1. Three sizes of drill pipe to be bored out and machined to accept liners so they could be converted into IDP.
2. The modified DP to go to an inspection facility where the artificial flaws would be machined into the pipe, and the pipe then be inspected by four NDT methods to assure that these methods can detect the flaws.
3. The modified pipe, with flaws, to be shipped to Bakersfield where Drill Cool would install liners and insulation, and then be returned to Houston.
4. The assembled IDP with flaws would be inspected by the same four methods as before and the methods will be evaluated to choose the most effective one(s).
This component of the project was plagued by several factors related to the extremely high level of activity in the drilling industry. First, acquisition of the required drill pipe was very difficult: manufacturers were not interested in small orders for new pipe, and available inventories were committed to other buyers. Second, machine shops with the equipment and qualifications to work on oil-field equipment were booked up months in advance. Finally, even the inspection facility was overloaded with work, although it was not as severe a delay as in the other steps. The total delay caused by these considerations, relative to what could have been accomplished with prompt access to materials and services, was roughly one year. After these delays, this activity reached a point at which the pipe was in hand, the artificial flaws were machined into it, and baseline inspection with the various techniques was performed. 5.3 Conclusions During the long hiatus described above, however, a new consensus began to emerge about the optimum design for insulated drill pipe. Driven in large measure by the market surveys and industry interaction, Drill Cool moved toward an IDP concept based on application of an insulating coating to the outside diameter of the parent drill pipe, with no separate liner or other metal jacket to protect the insulation. This idea is discussed in more detail in Sections 6 and 7, but the basic notion was that, if IDP with double-wall construction was not marketable, then further work on development of an inspection plan was not worthwhile.
- 14 -

6. MARKET SURVEYS 6.1 Method/Approach The projected Phase 2 of this project included tasks of building 12-15 pieces of prototype IDP and then running these in an actual HTHP well. The market surveys, then, had two major objectives—determine what size pipe would most likely be acceptable to an operator with a potential drilling opportunity, and identify any concerns that operators, drilling contractors, or service companies might have that would bias them against using IDP. To gather this information, Drill Cool contracted with Spears and Associates, a market research firm in Tulsa, OK, that has extensive experience in the oil and gas industry (Scope of Work for Spears and Associates is given in Appendix E). Drill Cool representatives also attended the World Oil HTHP trade show in Houston, both in 2007 and 2008, where other attendees filled out questionnaires related to possible IDP use, and returned them to Drill Cool. 6.2 Results Spears and Associates contacted more than 100 operators and service companies in an attempt to answer some of the basic questions given previously (What is the market for IDP? What are the barriers to industry acceptance? And, perhaps most critical, what is the optimum IDP size to meet most industry needs?) Unfortunately, because of the extreme press of business in the oil industry, they received a limited response. Operators were about evenly divided on whether they considered IDP to be worth further investigation, but the responses made clear the fact that many of them didn’t really understand the concept. Unfortunately, the interviewers themselves were not knowledgeable enough about IDP to provide answers to some of the operators’ concerns (e.g., several interviewees were concerned about getting fishing/logging tools through the reduced inside diameter, but the interviewers were not familiar enough with IDP to point out that the drill pipe ID is no smaller than the ID of the tool joints). Service companies (directional drilling) were much more enthusiastic about the IDP concept, with six out of seven interviewees expressing definite and favorable interest in the technology.
Drill Pipe Sizes
0 2 4 6 8 10
3.5
4.5
5.5
6.5
Dril
l Pip
e O
D (i
nche
s)
- -
-
Number of Responses -
12
LandOffshore
Figure 7 – Desired pipe sizes from market survey
On the subject of pipe size, the relatively small sample size did not lend confidence to a choice
- 15 -

of optimum diameter for a string of IDP to meet industry needs. For example, responses to the market survey are shown in Figure 7.
Drill Pipe Size
0 1 2 3 4 5 6
7
6.5
6
5.5
5
4.5
4
3.5
No Response
7
Figure 8 – Desired pipe sizes from trade show survey
In comparison, Drill Cool passed out questionnaires at the HTHP trade show in April 2007, and the results of those surveys is shown in Figure 8. Although some trends are apparent, the small sample size does not give sufficient confidence to identify the optimum pipe size. As a generality, almost all interviewees were strongly in favor of the largest possible inside diameter, to address both hydraulics and fishing tool issues. In an attempt to improve this result, Drill Cool requested additional survey activity from Spears and Associates, and once again had representatives passing out questionnaires at the 2008 HTHP Trade Show and Conference in Houston. Although some additional data were acquired, and we can make the general statement that off-shore operators favor larger pipe (~ 6-5/8”) and on-shore operators prefer smaller (~ 4”) sizes, there was no clear answer to the question of optimum pipe size. Because Drill Cool could not afford to make more than one size prototype pipe, it was critical to choose a size that had some assurance of use in the market. 6.3 Conclusions In the course of these conversations about pipe size, however, another issue arose that turned out to be more important to the project’s progress, and that was the matter of pipe hydraulics. The quandary was this: although the market survey did not provide enough information to specify an optimum size, both on- and off-shore potential users remained concerned about pipe hydraulics. With the inherent configuration of the existing IDP design, there will always be a conflict because a pipe OD chosen for maximum strength in a given hole will always have a smaller ID with insulated drill pipe, thus increasing the circulating pressure drop compared to conventional pipe. This conflict appeared to be intractable with the operators interviewed,
- 16 -

although it's very possible that they rejected the proposed sizes without sufficient knowledge or consideration. For example, in considering pressure drop, it is well known that pressure losses are very sensitive to pipe diameter, but it may not be clear that having a relatively constant inside diameter with IDP offsets some of the effect of diameter change at the tool joints in conventional pipe. In a field test in 1999, pressures during circulation were measured at top and bottom of strings (~ 4000’ each) of 5” IDP and 4-1/2” CDP with inside pipe body diameters of 3.068” and 3.826”, respectively. In the conventional pipe, tool joint diameters were 2.812”, and this represented about 10% of the pipe length. At 500 gpm circulation rate, pressure drops in the IDP and CDP were 0.204 psi/ft and 0.156 psi/ft, respectively. If we consider just the inside diameters of the pipes, however, and use the mathematical relation that pressure drop varies inversely as the fifth power of the diameter, the calculated result is that the IDP would be expected to have more than twice the pressure drop of the CDP, but the data show that the IDP pressure drop is actually only about 30% higher. The tool-joint diameter reduction apparently has a substantial effect on pressure drop in the 4-1/2” drill pipe. This is just one example of possible misperception or lack of information, but whatever the case, we seem to face, late in the game, a scenario in which the current IDP concept appears to be unmarketable. This situation is discussed in more detail in Section 7.
- 17 -

7. CONCLUSIONS Bringing new technology to market requires at least two major accomplishments—the new hardware or technique must satisfy the technical requirements it is designed to meet, and the target industry must recognize or be persuaded that this technology is an appropriate answer to their needs. The authors of this report will argue that we succeeded in the first part, but failed in the second. The insulated drill pipe design described in Section 3 is proven, in that it has been used in the field, mechanical testing showed no flaws, and very similar pipe has demonstrated the desired and expected thermal performance in a carefully controlled field test. At the very minimum, we can claim that there is no evidence showing the existing IDP doesn’t perform as desired. All this is virtually irrelevant, of course, if the industry does not accept IDP as a legitimate answer to the needs of HTHP drilling. New technology will face resistance in almost anywhere, and the oil and gas industry has two particular challenges: innate conservatism in drilling practices, and the “boom/bust” business cycle that seems prevalent for much of recent history. Given the very expensive nature of new drilling projects, it is quite reasonable that drilling engineers or contractors would be reluctant to use any new piece of equipment that might pose a risk to the well, without having some firm basis for believing either that the risk is negligible or that the performance benefits justify some small amount of risk. Either of these reassurances, however, will almost certainly require some kind of field test or drilling exercise, which is why it’s so important for DOE or other Federal agency to take the lead in providing this sort of demonstration. Even with performance verification, the question of timing remains. If drilling is in “boom” times, activity is high, and riskier (often, higher temperature) wells are being drilled. Contractors and service companies are stretched to the limit just to keep up with ordinary demand, and they have little time or incentive to investigate a new technology. This is more or less confirmed by the fact that, in the market survey, service companies were far more enthusiastic than operators about IDP—directional drilling service companies see a direct benefit in mitigating the high-temperature risk to their delicate and expensive equipment, while operators view this situation as the risk being borne by someone else. In the market survey, in fact, there were several direct quotes from operators to the effect that, “We don’t have any high-temperature problems,” whereas the service companies had a much different view. It is worth noting that the president of Drill Cool has recently talked with three different Gulf Coast operators who have severe problems with bottom-hole circulating temperatures above 300OF—in one case, the operator has suffered loss above $1M from high-temperature tool failure. With drilling in a “bust” cycle, by contrast, wells are not as challenging (usually, lower temperatures) and the drilling industry is under financial pressure that precludes investment of time and/or money in new technology if the existing equipment can do the job in any fashion. In summary, then, the marketing problems fell into two general areas: some operators and drilling contractors didn’t feel that they needed the capability of managing downhole temperature; and, among those who did, there was concern over the reduction in inside diameter.
- 18 -

As a result, we found ourselves, very late in the game, facing a basic paradigm shift in which the IDP design would become drill pipe with either a coating on the ID to reduce friction with the existing double-wall design, or a single-wall design with an insulating coating on the OD of the pipe body between the tool joints. There was not enough time or budget to investigate these approaches in the present project, so we ended this project having done the work described in this report. Drill Cool will most likely pursue the revised design concepts independent of NETL funding, but it is uncertain when this might happen.
- 19 -

BIBLIOGRAPHY • J. T. Finger, “Drilling Fluid Temperatures in a Magma-Penetrating Wellbore,” Geothermal
Resources Council, TRANSACTIONS, Vol. 10, September 1986 • J. T. Finger, R. D. Jacobson, A. T. Champness, “Development and Testing of Insulated
Drillpipe”, SPE 59144, presented at the 2000 IADC/SPE Drilling Conference, New Orleans, LA, February 2000
• J. Finger, R. Jacobson, G. Whitlow, T. Champness; “Insulated Drill Pipe for High-Temperature Drilling”, Sandia Report SAND2000-1679, Sandia National Laboratories, July 2000
• J. T. Finger, R. D. Jacobson, and A. T. Champness, “Development and Testing of Insulated Drill Pipe”, SPE Drilling & Completion, June 2002, pp. 131-136
LIST OF ACRONYMS AND ABBREVIATIONS BHA – bottom-hole assembly; essentially the components between the lower end of the drill pipe and the bit CDP – conventional drill pipe DCS – Drill Cool Systems, Inc. ECD – equivalent circulating density (the effective density of the drilling fluid, after adjusting for temperature, fluid friction, and viscosity effects) HTHP – high-temperature, high-pressure; definition of these conditions is not uniform, but for this report it will mean temperatures above 400OF and pressures above 15,000 psi IDP – insulated drill pipe LWD – logging while drilling (usually implies gathering formation data) MWD – measurement while drilling (usually related to drilling parameters) NDT – non-destructive testing SES – Stress Engineering Services, a Houston company that helped design and then perform mechanical testing
- 20 -

APPENDIX A – MECHANICAL TESTING PROCEDURE
Test Procedure: 3-1/2” Double wall insulated drill pipe. Client: Drill Cool Systems, Inc. Objective: To conduct tension, compression, internal pressure, torsion and elevated temperature tests on 3-1/2” pipe with NC38 (3-1/2 IF) tool joints. Pass/fail criteria: Does annular space hold pressure? Record data at 1 scan/sec 1. Set-up frame. Pipe is approximately 32 ft long. Adaptor subs are at Stress Engineering. 2. Put 1-3/4” filler bar in pipe. 3. Buck on adaptor subs – 10,000 ft-lbs. Use o-rings on subs. Use copper base thread compound. 4. Pipe has a port on each tool joint that will be used to detect leaking through inner pipe seals. Inner pipe seals against tool joint ID on each end. 5. Apply tensile load of 343,650 lbs (90% of premium class strength). Hold 15 minutes. Release load. Record applied load and axial stretch between drill pipe external upsets. 6. Apply pressure of 2500 psi gas to pipe ID. Hold 15 minutes. Record pressure. Watch ports in tool joints for leakage. Release pressure. ID volume with filler bar – 600 in^3. 7. Apply torsional load of 25,850 ft-lbs.
a. Use chain tongs and load cell. b. Hold 15 minutes c. Release torque
8. Repeat step 5. 9. Heat each end of pipe to 300 F.
a. Use induction heat b. Hold 15 minutes after temperature stabilizes c. Remove heat source.
10. Repeat step 5 before pipe cools off. 11. Repeat step 5 after pipe cools off. 12. Weld anti-buckling rings to frame. 13. Apply compressive load of 343,650 lbs. Hold 15 minutes. Record load and axial compression between drill pipe upsets. Release load. 14. Repeat step 5 15. Apply 7500 psi water pressure to pipe ID. Hold 15 minutes. Record pressure. 16. Release pressure 17. Apply axial tensile load to yield – Approximately 380,000 lbs. Release 18. Repeat step 5. Record applied load and axial stretch between drill pipe external upsets.
- 21 -

APPENDIX B – MECHANICAL TESTING RESULTS
- 22 -

Certificate of Test Stress Engineering Services, Inc.
13800 Westfair East Drive Houston, Texas 77041
Date: September 28,2007 PN115443
Client: Drill Cool
Test Pieces: 3-1/2” 13.30 ppf S-135 Previously Used Insulated Drill Pipe Assemblies. The drill pipe had NC38 tool joints and was 31-1/2 ft long from make-up shoulder to make-up shoulder.
Test Requirements: 1. Determine if leakage occurred at interface of inner tube on each end of pipe after subjecting pipe to tension, torsion and compression.
2. Determine fatigue characteristics of drill pipe assemblies.
Tension Test Prior to conducting the tension test, 2528 psi internal pressure only was applied to verify that there was no leakage at the ends of the inner tube.
A tensile load of 347,268 lbs (90% of the tensile strength of premium class pipe) was applied to the pipe and held for 15 minutes. Pass/fail criteria was leaking from pipe ID into annulus between internal tube and drill pipe body
Internal pressure only was applied and leakage occurred at 800 psi at the interface of the inner tube and tool joint on the box end.
Compression Test A compressive load of 234,519 lbs was applied to a second piece of pipe at which time buckling occurred. The calculated compressive strength of the pipe with no buckling is 488,825 lbs. The pipe was laterally supported at 7.33 foot intervals to increase the buckling load. The calculated buckling load of each end of the pipe was 377,221 lbs. The calculated buckling strength of the two center sections was 737,634 lbs. Calculations are in Appendix H.
Tony Worthen chose not to conduct the internal pressure test on this test.
Fatigue Test A single joint of pipe was cut in two at approximately mid length and the pin and box were bucked-up to each other. End caps were welded to each end of the test piece so that the pipe ID could be pressurized – a drop in pressure during the test would indicate a through wall crack. The pipe ran for 1,362,900 cycles before a crack formed in the pipe body two feet from the make-up shoulder on the pin end. The pipe had a cyclic outer fiber stress of 18,000 psi adjacent to the external upset.
- 23 -

The end caps had a pressure rating of 200 psi. There was no leakage at 200 psi into the insulated annulus after test..
Torsion test Pipe was subjected to torsional deflection of greater than 77 deg. Seventy seven degrees is the angle of twist at a torque of 33,413 ft-lbs which is the torsional yield of this pipe. An internal pressure of 2500 psi was applied to the pipe after the test. The pressure held for 15 minutes. There is no computer record of the pressure test.
Table of Contents Appendix A: Photographs
Appendix B: Pressure Test 1, Internal Pressure Test before Tensile Test, Pipe #1.
Appendix C: Tensile Test, Pipe #1.
Appendix D: Pressure Test 2, Internal Pressure Test after Tensile Test, Pipe #1.
Appendix E: Compression Test, Pipe #2.
Appendix F: Torsion Test, Pipe #3.
Appendix G: Hand log, tensile test
Appendix H: Calculation Sheets
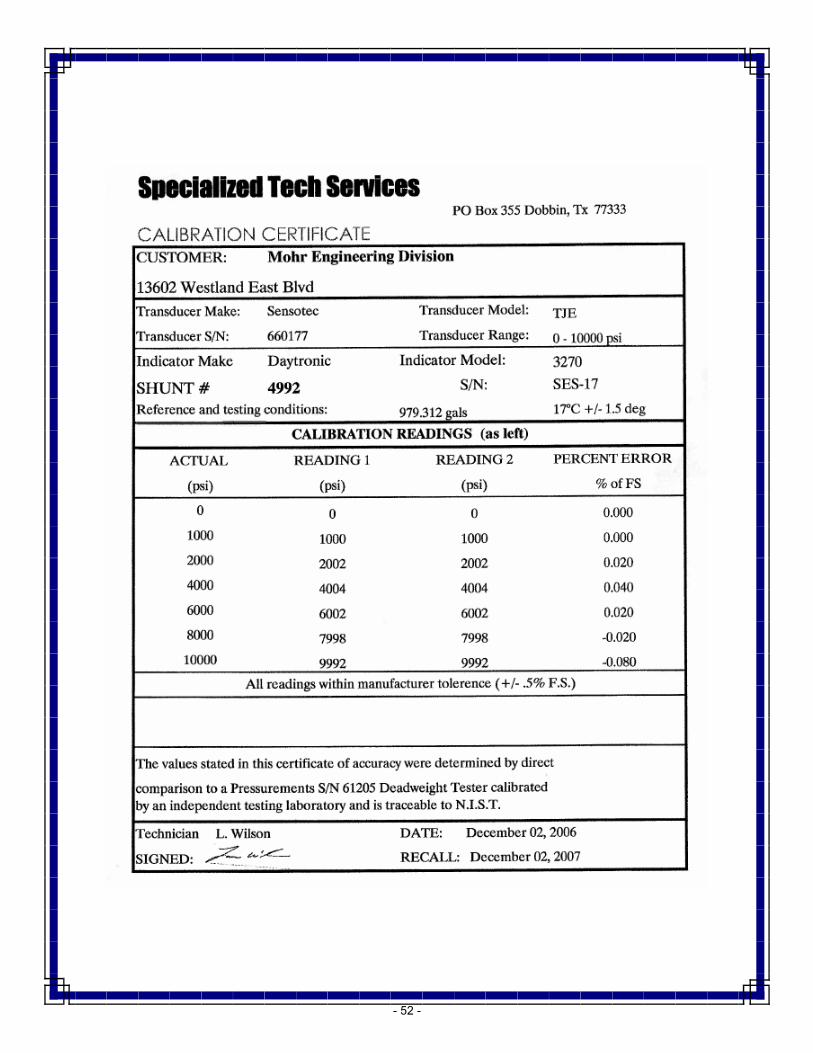
Appendix I: Calibration Sheets
Jackie E. Smith PE Staff Consultant

Appendix A Photographs
- 25 -

Drill pipe in test frame. Axial load is applied to drill pipe with 4 hydraulic cylinders not visible in
photograph.
Displacement transducer (yoyo) used to measure axial deflection or change in length of the pipe
as load is applied.
- 26 -

Anti buckling members were welded to the test frame to decrease the unsupported length from 29 ft to about 7.33 ft. With the anti buckling members, the buckling strength was about 234,500
lbs. Calculated buckling strength for unsupported pipe is 11,775 lbs.
Buckled pipe in frame during compression test. A maximum axial compressive load of 234,519
lbs was applied to the pipe.
- 28 -

Pipe being made ready for torsion test. Truck mounted tongs applied torque to one end of pipe.
Other end held to prevent rotation.
End of pipe in chain vise to prevent rotation during torsion test.
- 29 -

End of pipe before being gripped by tongs in torsion test. 77 degree mark, when vertical,
indicates degrees rotation for torque of 33,413 ft-lbs, yield torque of pipe.
Final position of pipe during torsion test. Pipe had an angle of twist greater than 77 degrees
which means it went beyond its torsional yield strength of 33,413 ft-lbs. No leakage at 200 psi occurred from the tool joint bore to the insulated annulus.
- 30 -

Fatigue crack in pipe. Pipe developed fatigue crack after oscillating 1,362,900 cycles with an
outer fiber stress of 18,000 psi adjacent to the external upset.
Location of fatigue crack on pipe. Crack is 24 inches from pin make-up shoulder.
- 31 -

Appendix B Pressure Test 1, Pipe #1
Plot of pressure test before tensile test of pipe #1. Pressure of 2528 psi was applied to bore of
drill pipe assembly and held for 15 minutes. A decrease in pressure would have indicated a leak where the inner tube was mated with the tool joint.
- 32 -

Appendix C Tensile Test Pipe #1
Plot of load and displacement from tensile test of pipe #1. Load was increased from 0 to
347,268 lbs and held for more than 15 minutes. Axial stretch in pipe was measured as tensile load was applied. Pipe stretched 1.037 inches.
- 33 -

Appendix D Pressure Test 2, Pipe #1
Plot of pressure test after tensile test of pipe #1. Pressure of 802 psi was applied to bore of drill
pipe assembly before leakage occurred on box end.
- 34 -

Appendix E Compression Test Pipe #2
Plot of load and displacement from compression test of pipe #2. Compressive load was
increased from 0 to a maximum of 234,519 lbs. The onset of buckling prevented the load from going above this value. The pipe was supported at approximately 7 ft intervals. The axial
deformation of the pipe, which includes the effect of buckling, was 1.234 inches.
- 35 -

Appendix F Torque Test Data
- 36 -

Trial Make-up Torque from tongs twisted pipe 0.120 revolutions or 43.2 degrees. Only revolutions were recorded because torque
load cell is on back-up tongs. Back-up tongs were not used because end of pipe was held in chain vise.
- 37 -

Torque Test. Pipe had torque induced that caused a twist of 0.154 revolutions or 55.4 degrees. Rotation was stopped at this point.
- 38 -

Completion of Torque Test. Rotation was resumed and pipe was torqued an additional 0.062 revolutions or 22.3 degrees for a total
of 77.8 degrees. This angle of twist reaches the torsional yield of the pipe.
- 39 -

Appendix G Handlog – Tensile Test
- 40 -

- 41 -

Appendix H Calculation Sheets
- 42 -

115443.xmcd 10/4/2007
CLIENT: Cool Drill E 30 106
⋅lb
in2⋅≡
PROJECT: 115443
CALCULATION BY: Jack Smith PE
Liner stretch and collapse 3-1/2 13.30 Drill Pipe ρs 0.283lb
in3⋅≡
Sy 135000lb
in2:=
Dp 3.5in:= Lp 31.5ft:= Lpb 30ft:=
dp 2.764in:= tn 0.368in:=
Apπ
4Dp
2 dp2
−⎛⎝
⎞⎠:= Ap 3.621 in2
⋅=
Ipπ
64Dp
4 dp4
−⎛⎝
⎞⎠:= Ip 4.501 in4
⋅=
Stretch of 30 ft long S135 drill pipe pipe body
δSy Lpb⋅
E:= δ 1.62 in⋅= Fc Ap Sy⋅ 488824.78 lb=:=
Stretch of 30 ft long 1018 liner @ 70 ksi
Sl 70000lb
in2:=
δlSl Lpb⋅
E:= δl 0.84 in⋅=
difference δ δl− 0.78 in⋅=
Stress in 1018 when compress 0.78 inches
σlδ δl−( ) E⋅
Lpb:= σl 65000
lb
in2⋅=
Dprem Dp 2 tn⋅− 2( ) 0.8( )⋅ tn⋅+:= Dprem 3.353 in⋅=
Apremπ
4Dprem2 dp
2−⎛
⎝⎞⎠:= Aprem 2.829 in2
⋅=
90% premium tensile load
Ft 0.9 Aprem⋅ Sy⋅:= Ft 343683 lb=
Aprem Sy⋅ 381870.168 lb=
Page 1 of 5 Jack Smith P.E.Stress Engineerng Services
- 43 -

115443.xmcd 10/4/2007
ID
OD
t
Ys 55000lb
in2⋅:= Dl 2.375 in⋅:= t 0.065in:=
σt Ys:=
dl Dl 2 t⋅−:= dl 2.245 in⋅= G3Dlt
:= G3 36.538=
P2 t⋅ Ys⋅
dl:= P 3184.855
lb
in2⋅=
Collapse Pressure of inner tube
IDOD F
L
F IDOD F
L
F
External pressure Po 000lb
in2⋅:= Internal Pressure Pi 0
lb
in2⋅:=
Ys 55000:=
Wall Thickness t 0.065in:= G3Dlt
:= G3 36.538=
Material Yield Strength
Constant A A 2.8762 1.0679 10 6−× Ys⋅+ 2.1301 10 11−
⋅ Ys2⋅+ 5.313 10 17−
⋅ Ys3⋅−:=
A 2.991=
B 0.026233 .50609 10 6−⋅ Ys⋅+:=Constant B
B 0.054=
Constant C C 465.93− .030867 Ys⋅+ 1.0483 10 8−⋅ Ys2
⋅− 3.6989 10 14−⋅ Ys3
⋅+:=
C 1206.198=
G93
BA⋅
2BA
+:= G9 0.027=
Page 2 of 5 Jack Smith P.E.Stress Engineerng Services
- 44 -

115443.xmcd 10/4/2007
Constant F F4.695 107
⋅ G93⋅
Ys G9BA
−⎛⎜⎝
⎞⎠
⋅ 1 G9−( )2⋅
:=
F 1.989=
G FBA⋅:= G 0.036=Constant G
D/t Intersection between yield strength collapse and plastic collapse A11
DtypA 2−( )2 8 B
CYs
+⎛⎜⎝
⎞⎠
⋅+⎡⎢⎣
⎤⎥⎦
.5A+ 2−
2 BCYs
+⎛⎜⎝
⎞⎠
⋅:=
Dtyp 14.81=
D/t intersection between plastic collapse and transition collapse
Dtpt YsA F−
C Ys B G−( )⋅+⋅:= Dtpt 25.008=
D/t intersection between transition collapse and elastic collapse
Dtte1
G9:= Dtte 37.207=
Minimum yield strength collapse pressure
Py2 Ys⋅ G3 1−( )⋅
G32:=
Py 2928.133=
Minimum plastic collapse pressure
Pp YsAG3
B−⎛⎜⎝
⎞⎠
⋅ C−:=
Pp 321.6=
Minimum transition collapse pressure
Pt YsF
G3G−⎛⎜
⎝⎞⎠
⋅:= Pt 1016.364=
Minimum elastic collapse pressure
Pe4.696 107
⋅
G3 G3 1−( )2⋅
:= Pe 1017.608=
Page 3 of 5 Jack Smith P.E.Stress Engineerng Services
- 45 -

115443.xmcd 10/4/2007
Mode "Yield" G3 Dtyp≤if
"Plastic" G3 Dtpt≤if
"Transition" G3 Dtte≤if
"Elastic" otherwise
otherwise
otherwise
:=
Mode "Transition"=
Pcollapse Py G3 Dtyp≤if
Pp G3 Dtpt≤if
Pt G3 Dtte≤if
Pe otherwise
otherwise
otherwise
:=
Pcollapse 1016.364=
Buckling
n 1:=
Page 4 of 5 Jack Smith P.E.Stress Engineerng Services
- 46 -

115443.xmcd 10/4/2007
Mom of Inertia
The drill pipe, during the compression test, was lateraly supported in four place. Distance betweenlateral supports was 7' 4" (7.33 ft).
Each end of pipe was condition (c). The two center sections of pipe was condition (d).
L 7.33ft:=
c1 20.2:=
Pcr1c1 E⋅ I⋅
L2377221 lb=:=
c2 39.5:=
Pcr2c2 E⋅ I⋅
L2737634.9 lb=:=
Page 5 of 5 Jack Smith P.E.Stress Engineerng Services
- 47 -
- 48 -

Appendix I Calibration Sheets
- 49 -

- 50 -

- 51 -
- 52 -

APPENDIX C – SCOPE OF WORK: DEVELOPMENT OF INSPECTION PROCEDURE Phase I -- Phase I of the project will involve the following items: 1. Development of a testing protocol to determine the response of the insulated drill pipe to
standard inspection methods: a. The program will test the effectiveness of the following inspection methods:
• Full Length Ultrasonic Testing (FLUT) • Ultrasonic Wall Thickness Inspection • Ultrasonic Slip/Upset Inspection • Electromagnetic Inspection (EMI)
b. Each inspection method’s level of effectiveness will be analyzed based on comparison of the test results for the same set of drill pipe test joints with and without the insulation installed. c. The number of test joints will be chosen by consultation between TH Hill Associates and Drill Cool Systems. d. Standardized flaws (notches, radial holes, etc.) will be specified for each inspection method. Such flaws will be machined into a reference standard joint, which will be used to standardize each inspection process. e. The protocol will outline the standardization and inspection processes as well as the methodology for data collection and documentation.
2. Implementation of the experimental inspection program:
a. The drill pipe test joints will be obtained, and the standardized flaws will be machined into the reference standard joint. The machined flaws will be accurately measured to ensure proper dimensions and orientations. b. The experimental inspections will be performed and completely monitored. The inspections will be performed at a testing facility in Houston. c. Data generated during standardization and inspection will be collected and recorded.
3. A report will be prepared that outlines the details and results of the experimental inspection
program. Phase II -- Phase II of the project will involve the following items: 1. Analysis of data generated in Phase I:
a. The data collected in Phase I will be analyzed to study the drill pipe response (with and without insulation) to the standard inspection methods. b. Using the inspection results for the test joints without insulation as the standard, the accuracy and effectiveness of each inspection method on the insulated drill pipe will be analyzed and documented.
2. Development of the inspection program and acceptance criteria for insulated drill pipe:
a. This process will be based on the conclusions of the Phase I analysis. b. The program will be designed to address inspection considerations that are specifically related to insulated drill pipe. c. The recommended inspection program and acceptance criteria will be presented in a final report with the supporting data and conclusions from Phase I.
- 53 -

APPENDIX D – INSPECTION PLAN PROCEDURE Summary: In support of the Inspection Requirements of the Insulated Drill Pipe (IDP) the following summary describes operations that each of the six pieces of drill pipe will undergo during this phase of testing. Sample #1 (condition: premium) 6-5/8” S-135 27.7 lb/ft with 5-1/2FH Connections (approx length: 32.0ft) Sample #2 (condition: premium) 6-5/8” S-135 27.7 lb/ft with 5-1/2FH Connections (approx length: 32.0ft) Sample #3 (S/N NN97469) (condition: new) 5” G-105 19.5 lb/ft with NC50 Connections (approx length: 31.5ft) Sample #4 (S/N NN97454) (condition: new) 5” G-105 19.5 lb/ft with NC50 Connections (approx length: 31.5ft) Sample #5 (S/N K8261) (condition: used)
3-1/2” X-95 13.3 lb/ft with NC38 Connections (approx length: 31.0ft) Sample #6 (S/N K8252) (condition: used)
3-1/2” X-95 13.3 lb/ft with NC38 Connections (approx length: 31.0ft) Description of Basic Work Flow for Inspection Testing: All samples will undergo a total of three inspections. The general flow of this work is as follows: Step#1: Baseline Inspection This will be completed to fully characterize each piece of drill pipe in its current state prior to any work being completed. This is done to verify the condition of the pipe and ensure the accuracy of the results. Each piece of pipe will be oriented radially prior to inspection as to ensure repeatability in inspection and aid in comparing the inspection results. The 0 degree (12 o’clock) position will be positions at the top, vertical point of the pipe. This point corresponds to the point of thread termination (near the shoulder) on the pin of each sample. Prior to inspection a 0 degree line will be scribed into the tool joint (pin end of each sample). Step #2: Machining of Notch Geometry and IDP Parent Pipe Modifications Each sample of drill pipe will be machined with a careful selection of notches based on TH Hill’s DS-1 Category 5 inspection methods. To minimize machining costs each sample of IDP will receive a custom selection of notches per the following: Internal Upset
A
B
C
External Upset
D
F
Tube Body (Mid-Tube)
EG
- 54 -

General Description of Notches Type A – 2 Transverse, 5% of wall Thickness (W.T.) from OD & ID, ½” Length Type B – 2 Oblique at 6° left hand transverse, 5% of W.T. from OD & ID, ½” Length Type C – 1 Transverse 5% W.T. form OD (External Upset) Type D – 2 Transverse, 5% of W.T. form OD & ID, ½” Length Type E – 2 Longitudinal, 5% of W.T. from OD & ID, ½” Length Type F – 2 Oblique at 6° left hand transverse, 5% of W.T. from OD & ID, ½” Length Type G – 1 Wall Reduction 5% of W.T. on ID DS-1 Required Notch Dimensions Length: 0.5” max Width: 0.040” max Depth: 5% of nominal wall ±0.004” The following Chart indicates the notches to be included on each sample of IDP involved in this test. Type A Type B Type C Type D Type D Type E Type F Type G Sample #1 (6-5/8”)
X X X X X X X X
Sample #2 (6-5/8”)
X X X
Sample #3 (5” )
X X X X X X
Sample #4 (5”)
X X X
Sample #5 (3-1/2”)
X X X X X
Sample #6 (3-1/2”)
X X X
It should also be noted that any machining required to convert the Drill Pipe Samples into IDP will be completed during this step. Additionally the fill ports required for IDP will oriented at the 0 degree position described previously. Step #3: Pre-Fabrication Inspection Each sample will undergo an additional baseline inspection that will now capture and verify the modifications created in Step #2. The Notch Geometries will also be verified and documented by the inspection company. Step #4: IDP Fabrication The drill pipe samples will now undergo the process to fully convert them to insulated drill pipe (IDP). This includes the installation of the liner, termination sleeve, and insulation material. During fabrication certain manufacturing errors will be built into some of the samples as indicated below:
- 55 -

Sample #1: Standard Assembly Sample #2: Standard Assembly Sample #3: Standard Assembly with biased liner at Mid Tube Sample #4: Standard Assembly Sample #5: Standard Assembly with incomplete insulation fill Sample #6: Standard Assembly with liner failure and biased liner at Mid Tube Step #5: IDP Inspection This final inspection will allow the operator to confirm detection of the machined geometries determined in Steps 2 and 3 but also investigate the possible detection of manufacturing flaws. It may also be desired to produce a full Visonic 3-D image of Sample #1 to aid in the presentation of the results. Step #6: Post Inspection Destructive Testing & Inspection It may be desirable to provide a partial section of Samples #3, #5, & #6 to reveal the true characteristics of the manufacturing defects. These sections can then be used to aid in the interpretation of the Inspection Results produced in Step #5.
- 56 -

APPENDIX E – SCOPE OF WORK FOR MARKET SURVEY
Phase 1: Market Analysis 1. Identify HT basins in the US using Spears’ proprietary HT database. 2. Using the SmithSTATS database, identify and quantify the activity (average # of rigs per
year) of E&P companies drilling in US HT basins (identified in the previous step) during the past three years.
3. Build a list of drilling managers and/or drilling engineers working for those active HT E&P companies (identified in the previous step) using directories from RigData, the Society of Petroleum Engineers, etc.
4. Prepare two questionnaires that address the specific study requirements: one to be used for interviewing E&P companies drilling HT wells and one to be used for interviewing directional drilling service companies working on HT wells.
5. Interview 20 drilling managers and/or drilling engineers working for the E&P companies identified in step 2 using the study questionnaire.
6. Interview five directional drilling service companies to evaluate their perception of the need and impact of using insulated drill pipe for US HT drilling using the study questionnaire.
7. Tabulate interview responses from E&P companies and directional drilling service firms and analyze the data.
8. Prepare forecast of US HT drilling activity by region through 2010 by combining interview results with Spears’ proprietary forecast of US drilling activity.
9. Gather information on the estimated maximum operating temperatures, operating life under HT conditions, and cost of failure for selected drilling equipment and materials including LWD/MWD tools, mud motors, and drilling fluids.
10. Gather information on current and expected rig rates and HT well costs. 11. Prepare a report and presentation summarizing the results of the market survey and HT
drilling forecast.
- 57-

APPENDIX F – MARKET SURVEY RESULTS
- 58 -

- 59 -

- 60 -

- 61-

- 62 -

- 63 -

- 64 -

- 65 -

- 66 -

- 67 -

- 68 -

- 69 -

- 70 -

-71 -

- 72 -

- 73 -

- 74 -

- 75 -

- 76 -

- 77 -

- 78 -

- 79 -

- 80 -
National Energy Technology Laboratory 626 Cochrans Mill Road P.O. Box 10940 Pittsburgh, PA 15236-0940 3610 Collins Ferry Road P.O. Box 880 Morgantown, WV 26507-0880 One West Third Street, Suite 1400 Tulsa, OK 74103-3519 1450 Queen Avenue SW Albany, OR 97321-2198 2175 University Ave. South Suite 201 Fairbanks, AK 99709 Visit the NETL website at: www.netl.doe.gov Customer Service: 1-800-553-7681