oil and refined products petroleum 101 - national … of oil delivered bs&w content...
TRANSCRIPT

Petroleum 101
J. Richard Moore
Oil and refined products

B
B
B
R
R
R
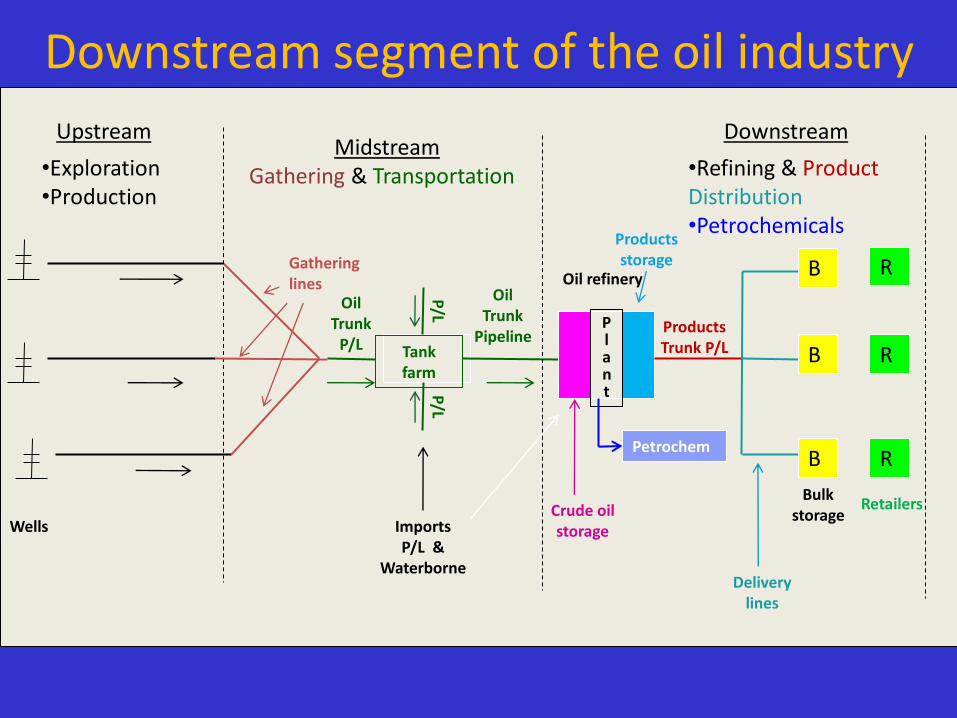
Upstream
•Exploration•Production
MidstreamGathering & Transportation
Downstream
•Refining & ProductDistribution•Petrochemicals
Wells
Tank farm
Plant
Gathering lines
Oil Trunk
P/L
P/LP/L
OilTrunk
Pipeline
ImportsP/L &
Waterborne
Crude oil storage
Productsstorage
Bulk storage
Retailers
ProductsTrunk P/L
Delivery lines
Petrochem
Oil refinery
Oil industry segments

Annual (TCF) Avg Day (BCF)
26.0 71.2
20.6 56.4
3.3 9.0
0.5 1.4
493,100 493,100
41,610 MCF 114 MCF/D
Annual (BBBLS) Avg Day (MMBLS)
1.959 5.361
1.959 5.361
.709 (CAN) 1.943
2.581 7.070
526,000 526,000
3,685 BBLS 10.1 BBLS/D
NATURAL GAS OIL
Gross Domestic Production
# of Domestic Wells
Average Production (Per gas well-gross)
U.S. supplies of natural gas & oil
Dry Domestic Production
Pipeline Imports
Waterborne Imports
Source: EIA 2009 AER

Well productivity comparison (EOY 2009)
Total DailyOil Production
# of Producingoil Wells BOPD/well
USA
Saudi Arabia
Middle East
5.360 mm bbl/d 525,998 10 bbl/d
7.920 mm bbl/d 2,811 2818 bbl/d (280 x)
21.175 mm bbl/d 15,074 1,405 bbl/d (140x)
USA formations= brick; Middle East = concrete blockin terms of porosity and permeability comparisons
More favorable geology means fewer wells, better flow rates,lower lifting costs, and longer economic lives for wells.
Result = Lower cost producer
Source: 12/06/10 O&GJ Worldwide reserves and production

HYDROGENSULFIDE
METHANE PROPANENITROGEN
HELIUMNATURALGASOLINE
OIL OR CONDENSATE
ETHANEDIRT
&RUST
CARBONDIOXIDE
WATER
BUTANES
RECOVERABLE HYDROCARBONS
RESIDUE GAS
NON-HYDOCARBONS AND CONTAMINANTS
FROM
WELLHEAD
LEASE SURFACE EQUIPMENT
FLOWLINE
Potential well stream components

Oil/Condensate
LineHeater
Separator
Treating
(CO2, H2S) DehydrationUnit
Sales Gas
Liquid Sales
To Disposal
Water
Gas
Well surface flow schematic

Crude OilMidstream

Information Needed
Volume of oil delivered BS&W content Sulfur/Gravity Temperature
Information Provided By
Gauger (producer) Truck driver (buyer/transporter) LACT = Lease Automatic Custody
Transfer
Lease
Stock TanksTank truck
(Barge) Pipeline Dump Station
Gathering Line
To Trunk line
Gathering LineStock Tanks
Lease
OR
Crude oil gathering: place in physical distribution network
LACTUnit

P Pump Station
Gathering Pipeline
Interstate Trunk Pipeline A
Intrastate Trunk Pipeline
H Supply hub (tank farm)
R Refinery
Interstate Trunk Pipeline B
Interstate Trunk Pipeline C
S Supply Source(Field or dump station)
S
S
P P H P
R
S R
ImportTerminal
R
H
FUNCTIONS / ACTIVITIES
Provide high pressure / large volume, long distance transport of crude oil
• Uses energy from pump stations
• Safety & environmental regulation -DOT, OSHA, EPA, DOI, states
• Intrastate rate regulation – state
• Interstate rate regulation - FERC
H
Crude oil trunk pipelines
Place in physical distribution network

Major crude oil trunk Lines in U.S.
• < 50,000 miles
• Common carriers
EIA

U.S. imports of crude oil
EIA
Source: EIA AER 2009

GENERALIZATION
Oil stored for operational reasons, natural gas stored for seasonal demand
OIL STORAGE FACILITIES MORE NUMEROUS & EXHIBIT GREATER SIZE VARIATIONS
Location Inventory EOM 12/10 Tank size (BBLS) Approximate #
Lease storage 20 MM BBLS 100-500 100,000 (500,000 wells)
Tank farms & pipelines 219 MM BBLS 10,000-500,000 141 Terminals
Refinery stocks 89 MM BBLS 50,000-500,000 150 Refineries
Operating stocks 328 MM BBLS (3 weeks supply)
Strategic Petroleum 727 MM BBLS (Cavern size) 6 to 35 MM BBLs 1 (62 caverns)
Reserve (SPR)*
Crude oil storage facilities
Source: EIA
*Withdrawal rate: 4.4 mm bopd for 90 days; declining to 1.0 mm bopd. Oil displaced with fresh water.
B
B
B
R
R
R
Upstream
•Exploration•Production
MidstreamGathering & Transportation
Downstream
•Refining & ProductDistribution•Petrochemicals
Wells
Tank farm
Plant
Gathering lines
Oil Trunk
P/L
P/LP/L
OilTrunk
Pipeline
ImportsP/L &
Waterborne
Crude oil storage
Productsstorage
Bulk storage
Retailers
ProductsTrunk P/L
Delivery lines
Petrochem
Oil refinery
Downstream segment of the oil industry

Crude oil refining
Why refine oil?
CONSUMER
Cannot use crude oil
Needs motor gasoline, petrochemicals (plastics),
cosmetics, paint, etc.
OIL PRODUCER
Could not sell crude oil to consumer. Must have refiner.
REFINER
In business to make a margin. Sell refined products for more than cost of crude oil plus refining costs.

US refinery receipts of crude oil
Method % Domestic % Foreign%Pipeline 51 64 36Tanker 45 10 90 Barge 03 40 60Tank cars/trucks 01 100 0
Land(P/L & trucks) 52 65 35Water 48 12 88
Source: EIA

Oil refining capacities (US-12/10)Number of refineries (operable) 148 (309 in 1960)
Atmospheric distillation capacity 17.6 MM BBLS / Day
Vacuum distillation capacity 8.5 MM BBLS / Day
Thermal cracking capacity 2.6 MM BBLS / Day
Catalytic cracking capacity 6.1 MM BBLS / Day
Catalytic reforming capacity 3.7 MM BBLS / Day
Feed to US refineries (2009 avg) 17.3 (14.7) MM BBLS/Day
(14.7/17.6 = 84 % capacity utilization; 2008 = 81%, prior to recession = 90+ %)
2009
Total U.S. refinery & blender net production 17.8 MM BBLS / Day
Total U.S. product supplied (=demand) 19.1 MM BBLS / Day
Source: EIA

Crude oil distillation
Process review
Refinery crude unit(distillation tower)
Source: Wikipedia

Oil refining processes & units(employing heat, pressure & catalysts)
Distillation* Conversion* (upgrading)Blending &Treating
Atmospheric
Vacuum
Catalytic cracking
Coking/visbreaking
Hydro-cracking
Finished products
Fractionation Decomposition
Alkylation
Polymerization
Unification
•Catalytic reforming
•Isomerization
Rearrangement
Crude Oil (Arab LT)
Middle & light Gasoil
80
60
40
20
Other
Motor Gasoline
Residual
Diesel, jet fuel, heating oil, kero
Simple Distillation
Avg. U.S. Refinery Yield
Source: EIA
•Hydro treating (sulfur removal) may occur
Naphtha
Residual
Separation

Typical U.S. refinery products yield from crude oil
PRODUCT %
LRG 3.8
Motor Gasoline 41.5
Jet Fuel 9.1
Distillate Fuel Oil 26.1
Residual Fuel Oil 3.8
Petr. Coke & Asphalt & Other 15.7
(Yield=44.7 gals for 42 gal feed) 100
Source: EIA

Refinery margin and expense
GRM / BBL (USGC-Last 10 years)
Range* Refinery Type Refinery Complexity
-$2 to +$2 for Hydro skimmers (Least complex / severe)
-$4 to $19 for Cracking (More complex / severe)
-$2 to $20 for Coking (Most complex / severe)
Gross Refining = GRMMargin (Per BBL)
Refined products revenue minus feedstock costs (for same periods)
Crude BBLS processed during period
Souces: *IEA Oil Market Report, EIA;
=
=
OPERATING EXPENSE (excl. depr.)
Historical Range**: $.50-$4.50 / BBL (> with complexity)
2010: $3.79 / BBL (Valero)
( $5.35/bbl including $1.56/bbl depr.)
CATEGORIES
Energy (more than 50%)
Labor
Chemicals & catalysts
Environmental Compliance
CAPITAL
New Plant: $15-$20k per BBL/D***
Large: >100,000 BBL / Day
Lead Time: 5 Years
Permits: Environmental
Crude Supply: Secure / known price
Competition: Lower cost foreign
** Baker and Obrien, 2005 O&GJ Nelson Farrar Index
2010 GRM = $7.80 (Valero—composite of plants / regions ) (2007=$12.33, 2009=$6.00)

Refined Products
Distribution & Marketing

D.O.T. --BTS
Refined products distribution network
REFINERY
Retail Outlet
Jobber or Retail Outlet
Jobber or Retail Outlet
Retail Outlet
Retail Outlet
Terminal or Dealer
Terminal
Terminal
Barge
Rail
Pipeline
About 60% of refined products move via pipeline
About 30% of refined products move via water
Final leg is by truck

Petroleum product transport costs
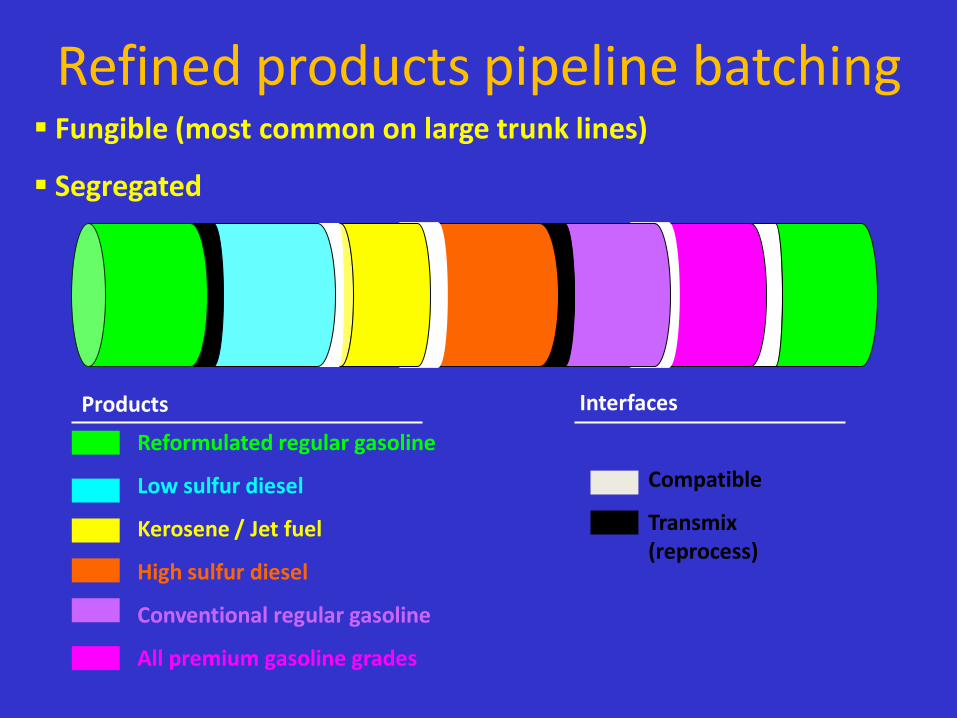
Refined products pipeline batching Fungible (most common on large trunk lines)
Segregated
Reformulated regular gasoline
Low sulfur diesel
Kerosene / Jet fuel
High sulfur diesel
Conventional regular gasoline
All premium gasoline grades
Interfaces
Compatible
Transmix (reprocess)
Products

Motor gasoline specifications
Source: ExxonMobil
Gasoline Product Codes (Specs)
13 (38 Voc/RVP)4 (12 RVP)
1812 (48 RVP)
Geographic Area
SoutheastSouth/Midwest/East
South/MidwestWest (TX to CA)
Products Pipeline
ColonialTEPPCOExplorer
Kinder Morgan
Diesel Product Codes (Specs)
164
4 (8)4

Refined products—issues
Motor gasoline—octane, RVP, additives
Number of grades (specifications) – supply/cost
Seasonal change in RVP, etc.
Motor gasoline—ethanol (E(10), E(85))
Diesel—low sulfur, biodiesel
Increasing distillate demand in U.S. & worldwide
Historically mutually beneficial U.S. & Europe diesel / motor gasoline demand & relationship
Seasonality of demand

Gasoline pump price
Dec.08=$1.61 Dec. 09= $2.61
More recent price
