oil and gas : short & medium term outlook and long term ...eneken.ieej.or.jp/data/5507.pdf ·...
TRANSCRIPT

© OECD/IEA 2014 © OECD/IEA 2014
IEEJ, 30 May 2014
Keisuke Sadamori, Director, IEA
Oil and Gas : Short & Medium Term Outlook and Long Term Uncertainty
IEEJ : June 2014. All Rights Reserved.

© OECD/IEA 2014
The new oil paradox: High supply, high prices
-1.5
-1.0
-0.5
0.0
0.5
1.0
1.5
2.0
2.5
1Q10 1Q11 1Q12 1Q13 1Q14
mb/d
Other North America Total
Total Non-OPEC Supply, y-o-y Change
85
90
95
100
105
110
115
120
Apr 13 Jul 13 Oct 13 Jan 14 Apr 14
$/bblCrude Futures
Front Month Close
NYMEX WTI ICE Brent
Source: ICE, NYMEX
•Non-OPEC Supply remains exceptionally high • Annual growth of 1.8 mb/d in 1Q14 and April • Forecast growth of 1.5 mb/d for 2014 as a whole •US crude supply to exceed 8 mb/d in 2014 reaching 8.6 mb/d in 4Q14 •US NGL supply to exceed 2.8 mb/d in 4Q14 •Total US liquids (exc. biofuels & processing gains) 11.3 mb/d April 2014 •Total US liquids >11 mb/d for the first time since at least the 1980s
•Yet oil prices also remain exceptionally elevated
IEEJ : June 2014. All Rights Reserved.

© OECD/IEA 2014
Global demand inches upwards…
Global oil demand grows as the economic recovery gains momentum
But inter-fuel competition rises, including in the transport sector
0
0.2
0.4
0.6
0.8
1
1.2
1.4
2011 2012 2013 2014
Global demand growth (mb/d)
IEEJ : June 2014. All Rights Reserved.

© OECD/IEA 2014
… and rebalances across regions US resilience offsets China slowdown
Chinese economic slowdown dampens demand
Fuel switching out of oil
But from a high base
Chinese demand up 2% y-o-y to 10.2 mb/d in March
OECD demand swung back into growth in 2013
US demand grew by 1.3% y-o-y to 19 mb/d in February
Demand also rising in other non-OECD economies
1,950
2,450
2,950
3,450
JAN APR JUL OCT JAN
kb/d China: Gasoil/Diesel Demand
Range 09-13 2013
2014 5-year avg
8,100
8,300
8,500
8,700
8,900
9,100
9,300
JAN APR JUL OCT JAN
kb/d US 50: Motor Gasoline Demand
Range 09-13 2013
2014 5-year avg
IEEJ : June 2014. All Rights Reserved.

© OECD/IEA 2014
OPEC faces production hurdles…
OPEC’s real production challenges are internal not external (shale)
Production back near 30 mb/d in April, up 405 kb/d
But supply down nearly 1 mb/d on the year
Libyan production still at 220 kb/d in April
28.5
29.0
29.5
30.0
30.5
31.0
31.5
32.0
Jan Mar May Jul Sep Nov Jan
mb/d OPEC Crude Production
2011 2012 2013 2014
IEEJ : June 2014. All Rights Reserved.

© OECD/IEA 2014
... but must ramp up production to meet demand
1Q12 2Q12 3Q12 4Q12 1Q13 2Q13 3Q13 4Q13 1Q14 2Q14 3Q14 4Q14
World Demand 89.3 89.5 90.7 91.3 90.4 90.8 92.1 92.4 91.3 92.1 93.6 94
Non-OPEC Supply 53.5 52.9 53 54.2 53.9 54.2 55 55.8 55.7 56.1 56.3 56.8
OPEC NGLs 6.1 6.1 6.2 6.2 6.3 6.3 6.4 6.3 6.4 6.4 6.6 6.6
OPEC Crude 31.3 31.7 31.5 30.7 30.5 30.9 30.6 29.8 30
Stock Ch. & Misc. 1.6 1.2 0 -0.2 0.3 0.6 -0.2 -0.4 0.8
Call on OPEC + Stock Ch. 29.7 30.5 31.4 30.9 30.2 30.3 30.8 30.2 29.2 29.6 30.7 30.7
27.5
28
28.5
29
29.5
30
30.5
31
31.5
32
1Q12 2Q12 3Q12 4Q12 1Q13 2Q13 3Q13 4Q13 1Q14 2Q14 3Q14 4Q14
mb
/d
Call on OPEC + Stock Ch. OPEC Crude Production
IEEJ : June 2014. All Rights Reserved.

© OECD/IEA 2014
Ukraine gas transit still vital – Nord Stream only alternative with excess capacity
37
53 6
20
13
18
24
29
Azerbaijan 4
Iran 9
30
41
30
27 7
Major physical flows in 2013 in bcm
LNG 5
LNG 1 LNG 6
4
Russian gas exports to Europe
IEEJ : June 2014. All Rights Reserved.

© OECD/IEA 2013
The engine of energy demand growth moves to South Asia
Primary energy demand, 2035 (Mtoe)
China is the main driver of increasing energy demand in the current decade, but India takes over in the 2020s as the principal source of growth
4%
65%
10%
8%
8% 5%
OECD
Non-OECD Asia
Middle East
Africa
Latin America
Eurasia
Share of global growth 2012-2035
480
Brazil 1 540
India
1 000 Southeast
Asia
4 060
China
1 030
Africa
2 240 United States 440
Japan
1 710
Europe 1 370
Eurasia
1 050 Middle East
IEEJ : June 2014. All Rights Reserved.

© OECD/IEA 2013
A mix that is slow to change
Growth in total primary energy demand
Today's share of fossil fuels in the global mix, at 82%, is the same as it was 25 years ago; the strong rise of renewables only reduces this to around 75% in 2035
500 1 000 1 500 2 000 2 500 3 000
Nuclear
Oil
Renewables
Coal
Gas
Mtoe
1987-2011
2011-2035
the strong rise of renewables only reduces this to around 75% in 2035
IEEJ : June 2014. All Rights Reserved.
© OECD/IEA 2013
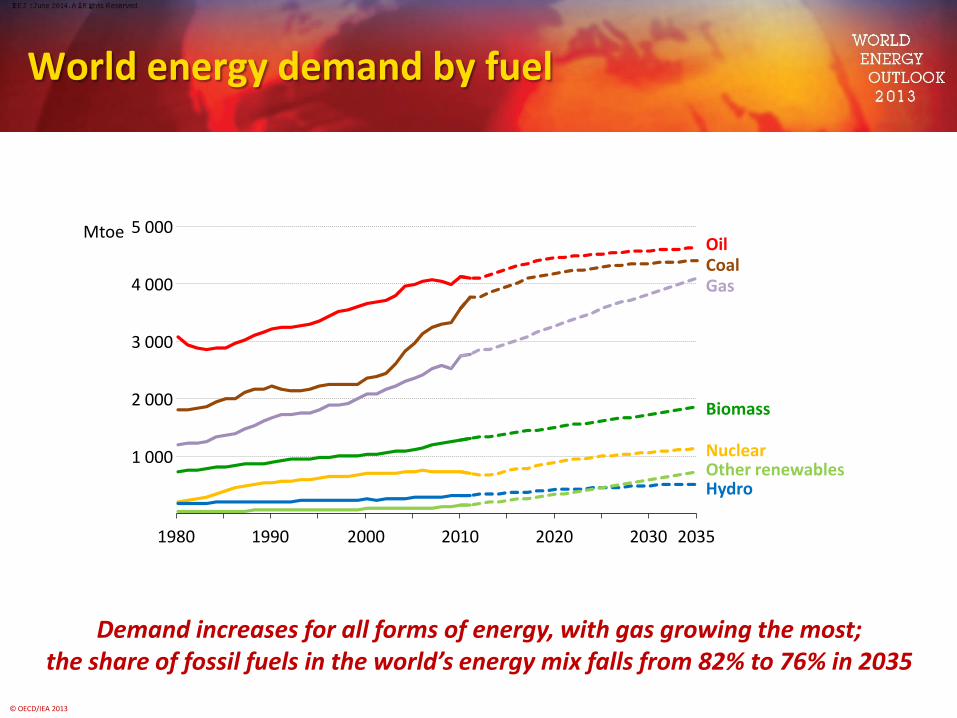
World energy demand by fuel
Demand increases for all forms of energy, with gas growing the most; the share of fossil fuels in the world’s energy mix falls from 82% to 76% in 2035
1 000
2 000
3 000
4 000
5 000
1980 1990 2000 2010 2020 2030 2035
Mtoe Oil Coal Gas
Biomass
Nuclear
Hydro Other renewables
IEEJ : June 2014. All Rights Reserved.

© OECD/IEA 2013
Change in world energy demand by fuel & scenario, 2011-2035
There are striking differences in demand for fossil fuels across scenarios, while global demand for renewable energy increases strongly in all cases
-1 500
-1 000
-500
0
500
1 000
1 500
2 000
Coal Oil Gas Nuclear Hydro Bioenergy Other renewables
Mtoe Current Policies Scenario
New Policies Scenario
450 Scenario
IEEJ : June 2014. All Rights Reserved.

© OECD/IEA 2013
Emissions off track in the run-up to the 2015 climate summit in France
Cumulative energy-related CO2 emissions
Non-OECD countries account for a rising share of emissions, although 2035 per capita levels are only half of OECD
Non-OECD
OECD
200
400
600
800 Gt
1900 -1929
1930 -1959
1960 -1989
1990 -2012
2013 -2035
OECD
Non-OECD
Total emissions 1900-2035
51%
49%
IEEJ : June 2014. All Rights Reserved.

© OECD/IEA 2013
China becomes the largest consumer of oil by 2030, as OECD oil use drops; demand is concentrated in transport, where diesel use surges by 5.5 mb/d, & petrochemicals
China becomes the largest consumer of oil by 2030, as OECD oil use drops;
Oil demand by region sector
Oil use grows, but in a narrowing set of markets
75
80
85
90
95
100
105
2012 2035
mb/d
China
India
Middle East
Other
Transport Petrochemicals Other sectors
OECD
Diesel
Gasoline
Other
80
85
90
95
100
105
2012 2035
mb/d
Transport Petrochemicals Other sectors
Diesel
Gasoline
Other
, & petrochemicals
IEEJ : June 2014. All Rights Reserved.

© OECD/IEA 2013
Two chapters to the oil production story
Contributions to global oil production growth
The United States (light tight oil) & Brazil (deepwater) step up until the mid-2020s, but the Middle East is critical to the longer-term oil outlook
-2 0 2 4 6 8
Rest of the world
United States
Brazil
Middle East
mb/d
2013-2025
2025-2035
IEEJ : June 2014. All Rights Reserved.

© OECD/IEA 2013
2035 Middle East crude oil exports by destination
Ever-growing crude trade between the Middle East & Asia
N. America’s imports diminish as it becomes more self-sufficient, Europe’s decrease with falling demand, and Middle East exports are drawn increasingly to Asia
6.3
North America
China
Other Asia
India
Europe
IEEJ : June 2014. All Rights Reserved.

© OECD/IEA 2013
More oil bypassing the refining system and new capacity in growing non-OECD markets piles pressure on existing refiners, especially in Europe
Oil demand Oil processed by refineries
New refinery capacity China
India
Middle East
Other
Turbulent times for the refining sector
Refinery capacity and operation
More oil bypassing the refining system
75
80
85
90
95
100
105
2012 2035
mb/d Oil bypassing refineries
Existing spare & excess
capacity
Spare & excess
capacity
with 10 mb/d at risk of closure by 2035
70
65
IEEJ : June 2014. All Rights Reserved.

© OECD/IEA 2014 17
Non-OECD oil demand increasing
17
Growing importance of consuming countries outside IEA
91.3 million barrels per day
101.4 million barrels per day
IEEJ : June 2014. All Rights Reserved.
© OECD/IEA 2013
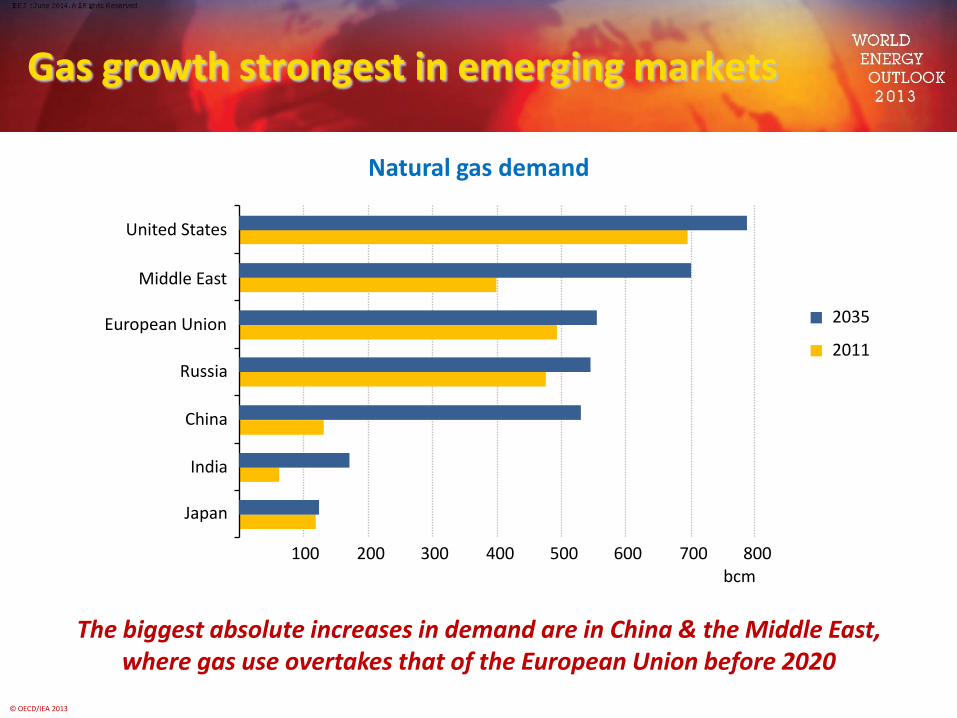
Gas growth strongest in emerging markets
Natural gas demand
The biggest absolute increases in demand are in China & the Middle East, where gas use overtakes that of the European Union before 2020
100 200 300 400 500 600 700 800
Japan
India
China
Russia
European Union
Middle East
United States
2035
2011
bcm
IEEJ : June 2014. All Rights Reserved.
© OECD/IEA 2013
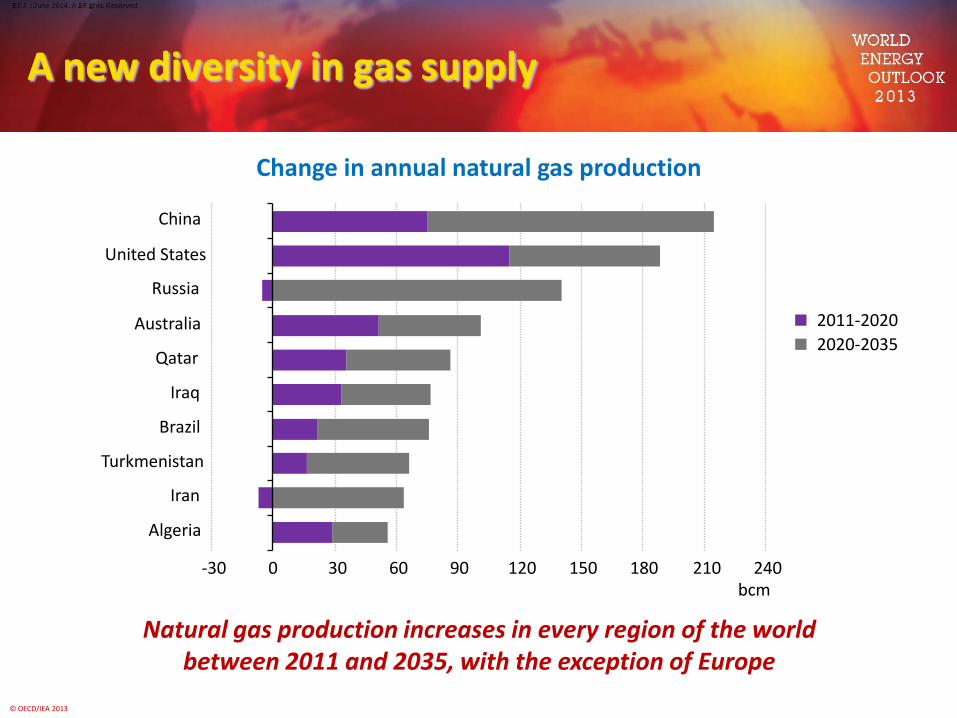
A new diversity in gas supply
Change in annual natural gas production
Natural gas production increases in every region of the world between 2011 and 2035, with the exception of Europe
-30 0 30 60 90 120 150 180 210 240
Algeria
Iran
Turkmenistan
Brazil
Iraq
Qatar
Australia
Russia
United States
China
2011-2020
2020-2035
bcm
IEEJ : June 2014. All Rights Reserved.

© OECD/IEA 2013
Regional Gas Price Disparity
IEEJ : June 2014. All Rights Reserved.

© OECD/IEA 2014
Electricity generation in non-OECD countries has only begun to rise
Electricity generation by source
2 000
4 000
6 000
8 000
10 000
1990 2035
TWh
OECD
2011 1990 2035
Non-OECD
2011
Coal Renewables Gas Nuclear Oil
IEEJ : June 2014. All Rights Reserved.

© OECD/IEA 2013
Impact of gas prices increase on the merit order (Europe)
IEEJ : June 2014. All Rights Reserved.
© OECD/IEA 2013
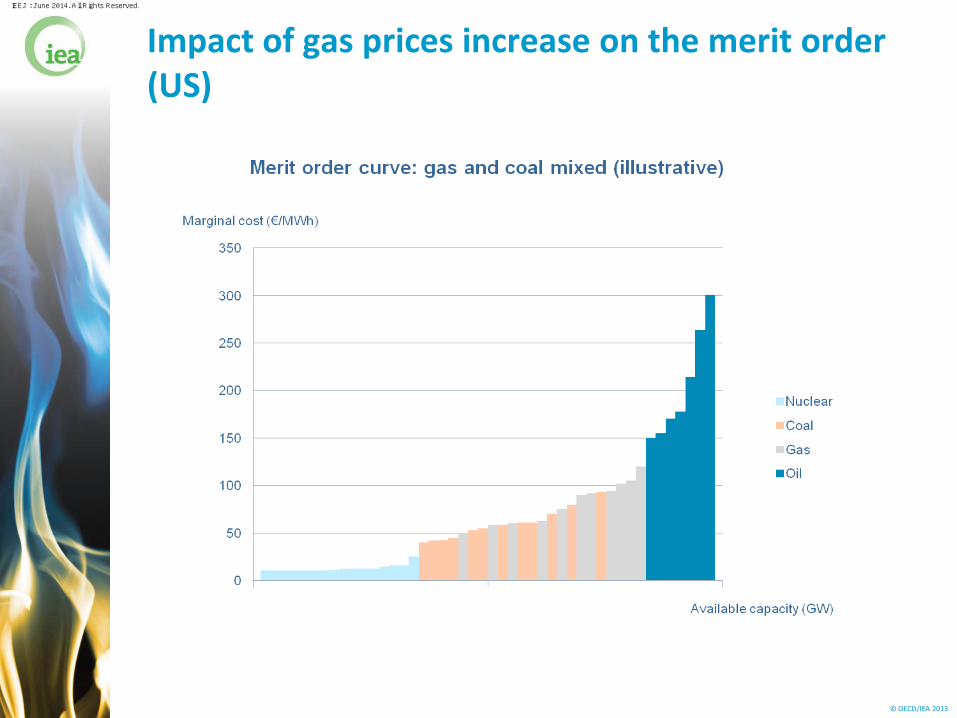
Impact of gas prices increase on the merit order (US)
IEEJ : June 2014. All Rights Reserved.

© OECD/IEA 2014
Displacing coal in Asia will not be that easy
COAL AND GAS PRICES. IMPLIED CO2 PRICE TO TRIGGER FUEL SWITCHING
IEEJ : June 2014. All Rights Reserved.

© OECD/IEA 2014
The power sector is fundamental to the energy outlook of Southeast Asia
ASEAN incremental electricity generation by fuel, 2011-2035
-100 0 100 200 300 400 500 600 700
Oil
Nuclear
Gas
Renewables
Coal
TWh
IEEJ : June 2014. All Rights Reserved.

© OECD/IEA 2014
Over the long term, the power generation mix is set to change
Global electricity generation by source, 2010-2035
2 000
4 000
6 000
8 000
10 000
12 000
14 000
1990 1995 2000 2005 2010 2015 2020 2025 2030 2035
TWh
Coal Renewables
Gas
Nuclear
Oil
Source: IEA World Energy Outlook 2012
© OECD/IEA 2014
IEEJ : June 2014. All Rights Reserved.
© OECD/IEA 2014
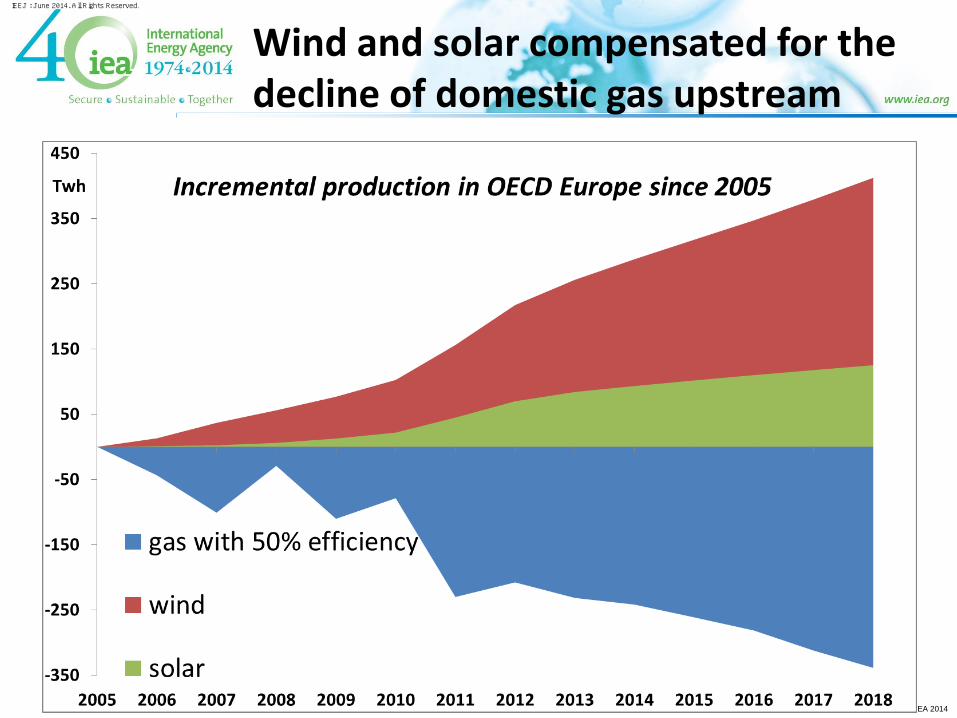
Wind and solar compensated for the decline of domestic gas upstream
IEEJ : June 2014. All Rights Reserved.
© OECD/IEA 2014
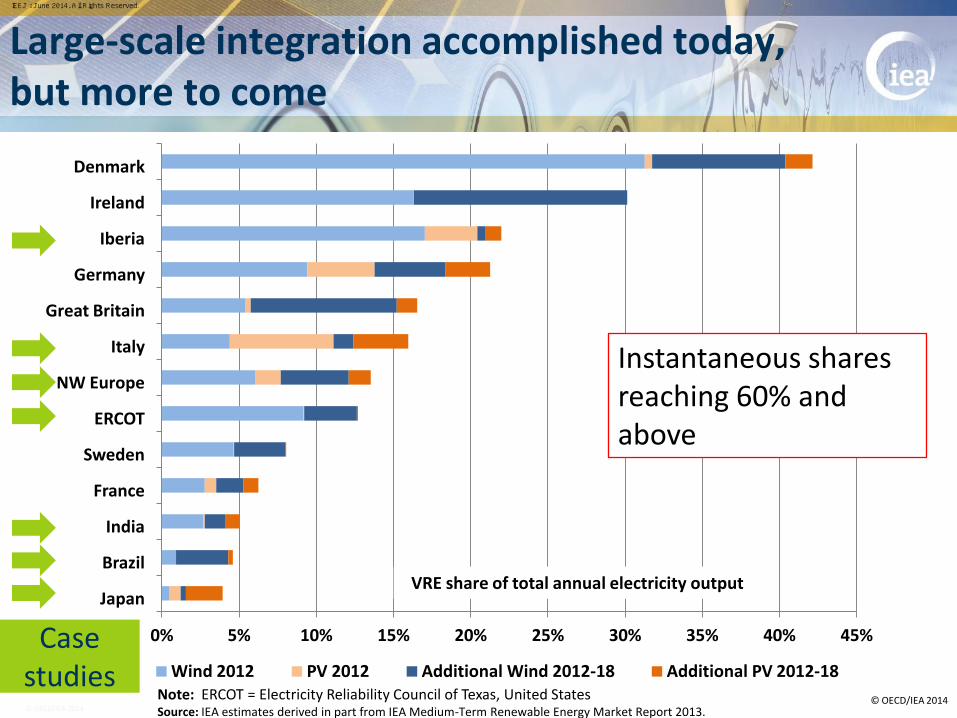
0% 5% 10% 15% 20% 25% 30% 35% 40% 45%
Japan
Brazil
India
France
Sweden
ERCOT
NW Europe
Italy
Great Britain
Germany
Iberia
Ireland
Denmark
Wind 2012 PV 2012 Additional Wind 2012-18 Additional PV 2012-18
VRE share of total annual electricity output
Note: ERCOT = Electricity Reliability Council of Texas, United States Source: IEA estimates derived in part from IEA Medium-Term Renewable Energy Market Report 2013.
Large-scale integration accomplished today, but more to come
Instantaneous shares reaching 60% and above
Case studies
© OECD/IEA 2014
IEEJ : June 2014. All Rights Reserved.

© OECD/IEA 2014
Interaction is key
Properties of variable renewable energy (VRE)
Flexibility of other power system components
© OECD/IEA 2014
Variable
Uncertain
Non-synchronous
Location constrained
Modularity
Low short-run cost
sec
yrs
1 km
100s km
Grids Generation
Storage Demand Side
IEEJ : June 2014. All Rights Reserved.

© OECD/IEA 2014
Carbon Intensity of supply is stuck
The political will to make meaningful progress at a global scale has yet to be demonstrated
IEEJ : June 2014. All Rights Reserved.

© OECD/IEA 2014
Total primary energy supply
IEEJ : June 2014. All Rights Reserved.

© OECD/IEA 2014
Investment in our future pays off…
…and it is cost effective to make the transition
IEEJ : June 2014. All Rights Reserved.

© OECD/IEA 2014
Systems thinking and integration
Today’s energy system paradigm is based on a unidirectional energy delivery philosophy
A sustainable electricity system is a smarter, multidirectional and integrated energy system that requires long-term
planning for services delivery
IEEJ : June 2014. All Rights Reserved.

© OECD/IEA 2014
Thank you [email protected]
www.iea.org
IEEJ : June 2014. All Rights Reserved.
Contact : [email protected]