ohio schools covid-19 evaluation
TRANSCRIPT

Ohio Schools COVID-19 Evaluation
Final Report
January 29, 2021
Submitted to
The Office of the Governor The Ohio Department of Health
The Ohio Department of Medicaid The Ohio Department of Insurance Ohio Pandemic Leadership Team
Submitted by
The Ohio Schools COVID-19 Evaluation Research Team
The Ohio State University Wright State University
Ohio University The Post-Acute Rapid Response Team
Dayton Children’s Hospital Research Triangle Institute, International
The Ohio Colleges of Medicine Government Resource Center

Executive Summary
Ohio’s schools face an unprecedented challenge with COVID-19. In-person schooling benefits children’s learning and social development, but many children are missing school because of quarantine when they have been in close contact with another child with COVID-19.
The Ohio Schools COVID-19 Evaluation (OSCE) explored the question: If a child in a supervised setting was in close contact (defined as within six feet for 15 minutes by the United States Center for Disease Control and Prevention) to another child with COVID-19 and both children were wearing masks properly, did the close contact child need to stay at home to quarantine? The OSCE also explored school policies and context, as well as teachers’ and parents’ reports of activities and risk perception.
Evaluation approach
Nine (9) school districts throughout the state broadly participated in the evaluation, and seven (7) participated in COVID-19 testing. The districts were selected through recommendations of the Office of the Governor, the Ohio Department of Medicaid, and The Ohio State University.
Schools could choose whether to have close contact children quarantine at home or be allowed to remain in school with regular testing.
Close contact children were identified by the schools working with their local health departments.
Two comparison groups were included: All grade levels—comparison children were selected from the same grades as the close contact (other class group); elementary schools—additional comparison children were selected from children in the same class who were not close contacts (same class group).
Close contact children were scheduled to be tested four times over two weeks (14 days). Comparison children were scheduled to be tested twice over two weeks. The test used was the Abbot BinaxNow Ag test. All children with a positive test were isolated and the local health department was informed.
Supplemental surveys were provided to school administrators, teachers, and parents.
Findings
During the evaluation, 1,494 tests were performed on 727 children. Overall, 21 children had a positive test for COVID-19.
In the close contact children 2.9% (15/524) had a positive test for COVID-19. In the other class group 3.5% (6/172) children had a positive test, and in the same class group 0% (0/31) had a positive test.
The rate of COVID-19 in high schools was similar to the rate in elementary schools.
In teacher surveys, about half of the teachers expressed concerns about changes in policies related to quarantine of children who were close contacts but wore a mask appropriately.
Parent and student surveys identified considerable exposure of children outside of the home, such as extracurricular activities and friend groups. These exposures often occurred without mask usage.
Qualitative interviews with school superintendents indicate an overriding theme for balancing education and student safety and concerns relating to the pandemic’s impact for equity issues, poverty, food insecurity, a lack of internet (e.g., wi-fi and digital access), and neighborhood and parental dynamics with the districts.
Implications
Children who were close contacts and appropriately masked had rates of COVID-19 that were similar to children with no known COVID-19 exposure in school.
The COVID-19 rate in the comparison group suggests community transmission outside the school setting. This rate is consistent with the findings in the parent survey, which identified considerable exposure of children outside the home.
The OSCE could be done safely because of the mask and distancing protocols in the schools, combined with the testing program for close contact children.
I. Introduction COVID-19 presents a once-in-a-generation challenge to the people of Ohio. SARS-CoV-2, the respiratory virus that causes COVID-19, is highly transmissible. Extreme public health mitigation measures have been necessary to minimize morbidity and mortality. Those mitigation measures have affected schools, forcing alternative school attendance strategies, and potentially affecting children’s education. When a child attending school is found to have COVID-19, the child is placed in isolation for 10- days and must remain at home, away from other children. In addition, other children that meet the definition of a close contact to the child with COVID-19 have been routinely placed in quarantine for 14 days to reduce the potential of transmission. These infection prevention measures are in place because a substantial portion of COVID-19 transmission occurs when people are pre-symptomatic or asymptomatic. Quarantine and isolation reduce transmission from exposed people to others by limiting their contact to other people, effectively breaking the chain of transmission. The need for quarantine of some students is clear. But the appropriate definition of a close contact, which determines who needs to be in quarantine, is less clear. In early 2020, the US Centers for Disease Control and Prevention established a close contact definition as a person that is within 6 feet of a person with diagnosed COVID-19 for at least 15 minutes, regardless of mask usage by the case and contact. Since the time that this definition was established, mask usage has been widely recommended and the effectiveness of mask usage had been repeatedly supported in epidemiological studies. These shifts in our understanding of the benefits of masks effectiveness raise a critical question: In settings where mask usage is high and the masks are worn appropriately (both supervised by school personnel), can the definition of close contact be modified to account for appropriate mask usage by both the case and the contact? The answer to this question is important to Ohio’s schools, as many students who meet the original close contact definition could be allowed to safely remain in school because of appropriate mask usage. The Ohio Schools COVID Evaluation (OSCE) was designed to evaluate the frequency of infections among children who were considered close contacts when both the case child and the contact child were wearing masks appropriately. This frequency was compared with the frequency of infection among children who were not close contacts or otherwise known to be exposed. Comparing these frequencies provides insight into the potential impact of change in guidelines about quarantine for schools—specifically, can children who are exposed to another child with COVID-19 remain in school if both children are wearing a mask appropriately? The OSCE was also designed to provide information about the context of COVID-19 in Ohio schools. In addition to examining close contacts and other students, the OSCE conducted surveys of students, parents, teachers, and administrators. In-depth qualitative interviews were conducted among a small group of 8 school administrators in 7 school districts to provide additional contextual data. The OSCE was a pilot evaluation; it was not a research study, nor was it designed to answer the mask and quarantine question definitively. The OSCE was a collaboration of the State of Ohio Governor’s Office, the Ohio Department of Medicaid, the Ohio Department of Health, the Ohio Pandemic Leadership Team, and select school districts throughout the state.
II. Procedures Planning for the OSCE began in early October 2020. The first data were collected on November 11, 2020, and the final tests were performed on December 18, 2020 (a six-week collection period). Parent, teacher, and administrator surveys were completed by January 4, 2021. Qualitative interviews were completed by January 7, 2021.

Schools participating in the OSCE were selected purposively and iteratively. Schools were identified by the Office of the Governor’s school representative and supplemented by recommendations from the Ohio Department of Medicaid and The Ohio State University. School district characteristics, such as the number of recent documented COVID-19 cases, size, location (urban/suburban/rural), school model (hybrid/in-person), the proportion of impoverished students, and the proportion of students enrolled in Medicaid were considered with a goal of obtaining a reasonably representative sample. Initially 10 school districts were selected; one subsequently withdrew leaving nine school districts. As the COVID-19 rates increased statewide through the months of November and December 3 schools changed instruction models to remote or hybrid attendance, reducing the number of districts that participated throughout the evaluation. A. Student Mask & Quarantine Evaluation Nine (9) school districts throughout the state broadly participated in the evaluation, and seven (7) participated in COVID-19 testing. Adjustments in school attendance policies facilitated a change in status for two (2) districts. Schools could choose whether to have close contact children quarantine at home or be allowed to remain in school with regular testing. Figure 1: Evaluation design
Design overview: Participating school districts identified close contacts to COVID-19 cases where both case and contact were wearing masks appropriately. These close contacts were enrolled in a testing program to assess COVID-19 prevalence in this group. In elementary schools, two comparison groups were used: same class comparisons (other students in the same class as the close contact) and other class comparisons (other students in the same grade but not the same class). In middle and high schools, due to varying course attendance only one comparison group was used—the other class comparison. Close contact children were scheduled for testing four times over 14 days. Comparison children were scheduled twice for testing over 14 days.
Students: COVID-19 cases among students and teachers were identified by the schools and their local health departments. All COVID-19 cases were isolated.
Close contact children were identified by the schools working with their local health departments. Close contacts were expected to meet the following definition for participation: exposure to a COVID-19 case in the school within 6 feet for more than 15 minutes and both case and contact were wearing masks appropriately. If either the contact or the case was not wearing a mask, the contact was not considered eligible. In general, students exposed in extracurricular activities (e.g., sports) were not eligible for participation. When close contacts were identified, the schools reported them to the evaluation team. Parental consent was obtained for close contact students to participate in the evaluation and student assent was obtained at the testing session for children 7 years and older.
Two comparison groups were included. In all grade levels, one set of comparison children was selected from the same grades as the close contact (other class group). In elementary schools an additional

comparison set was included, selected from children in the same class who were not close contacts (same class group) (Figure 2). Students eligible for the comparison group were identified by the schools. Flexibility was allowed for specific situations. Parental consent was obtained for comparison group students to participate in the evaluation.
Figure 2: Evaluation student classifications
Testing and monitoring: Close contact children were scheduled to be tested four times over two weeks (14 days). Comparison children were scheduled to be tested twice over two weeks. Some students in the comparison group were tested more than twice. The days of the testing were flexible to accommodate the testing program and school needs. Testing typically occurred on a Monday/Thursday schedule or Tuesday/Friday schedule. The Abbott Laboratories BinaxNow Ag test was used, with published rates of sensitivity and specificity 97.1% and 98.5%, respectively. The tests were performed by trained staff who followed all accepted clinical infection control procedures including the wearing of appropriate personal protective equipment. Prior to each test, the students were monitored for symptoms and fever. This information was recorded on a standardized form. Analyses: We report the data as frequencies of all student tests. We do not perform any formal statistical tests in this report. We report the results based on students (the denominator of the evaluation is the student), not independent tests. Accordingly, any student who had a positive test result utilizing the BinaxNow was considered positive for COVID-19. Any student who had at least one negative result without a positive result was considered negative for COVID-19, regardless of the number of tests administered. B. Student, Parent, Teacher, and Administrator Surveys Student surveys were administered at the beginning of the COVID-19 testing session, as a complement to an intake form that asked about recent illness, select symptoms, anxiety relating to being tested and confirming assent to participate. The student surveys utilized paper data collection methods. Survey topics included COVID-19 prevention practices, interactions with friends and people beyond family, whether anyone in the home besides the student was positive for COVID-19, friendship bubbles or pods, and potential areas of exposure outside of school.

Surveys were requested of parents of students who received at least one COVID-19 test, regardless of the test result. Once a student received a test, the school administration contacted the student’s parent requesting that they participate in the OSCE Parent Survey. The survey collection mode was computer-assisted web interview (CAWI), with the URL address being provided to the parents by the schools. The parent survey asked about COVID-19 exposure for the student and family, prevention practices, and stressors relating to the pandemic for the student and the family. Teacher surveys were offered by school administrators to gather teacher input on school COVID-19 prevention policies, teacher prevention practices, considerations about educational concerns, and COVID-19 exposure for teachers. Particularly, the teacher survey focused on the school structure, classroom activities, and mask usage. The teacher surveys were also collected using CAWI. School administrator surveys targeted school principals or their designees and used a CAWI collection mode. Only one survey was used per school. However, when more than one survey was received from a school, the survey from the highest-ranking official was selected – in one case with two vice principal submissions, one survey was randomly selected. C. Qualitative Interviews The OSCE used a semi-structured qualitative interview protocol to individually question seven school district superintendents and one assistant about balancing educational access, educational quality, student safety, and prevention, given the pandemic. The main interview themes preset by the OSCE research team were: (1) Project participation experiences; (2) pandemic communication priorities; (3) the role of collaborative leadership given the pandemic; (4) pandemic equity challenges for schools; (5) desires to respond to socioemotional uncertainties associated with the pandemic; and (6) pathways forward.
III. Findings - Student Mask & Quarantine Evaluation Schools and Student Participants
This evaluation included data from seven school districts.1 Of these, two districts were fully in-person for the entire period, three districts were in a hybrid format, one district shifted from in-person to fully remote, and one district varied by individual school within the district between in-person and remote due to staff shortages. The first student was tested on 11/11/2020; the final test was performed on 12/18/2020.
Overall, 727 students participated in the OSCE, including 480 high school students, 58 middle school students, and 189 elementary students. Of these students, 524 were considered close contacts to a case of COVID-19. In the comparison groups, 31 were identified as in-class comparison (elementary only) and 172 were other class comparison (all grades). Note that because of the small number of in-class comparison students, in some analyses the in class and other class comparisons are combined.
Tests
During the evaluation, 1,494 tests were performed. In the close contact group, 1,083 tests were performed. In the comparison groups, 50 tests were performed among the in-class comparison and 361 were performed among the other class comparison. Among the 524 students in the close contact group, the mean number of tests was 2.1 and in the combined comparison group the mean was 2.0 (Table 1). Not all students in the close contact group and combined comparison groups completed all tests. Incomplete testing was due to discontinuation of testing after a positive result, interruption of testing due
1 The districts included Ashland City Schools, Athens City Schools, Champion Local Schools, Lakota Local Schools, Marysville Exempt Village Schools, Mason City Schools, Princeton City Schools, Troy City Schools, and Whitehall City Schools. Two districts (Athens City and Troy City) remained in the evaluation but did not have student tests administered due to changes in attendance policy, rendering testing infeasible.

to school closure for holidays or moving to virtual teaching only, discontinuation of testing at the completion of the evaluation, failure to present for testing, and other unknown reasons.
Table 1: Number of tests per student
Overall Close
Contacts Combined
Comparison
N Mean (SD) N Mean (SD) N Mean (SD)
# Tests Per Child 727 2.1 (0.97) 524 2.1 (1.00) 203 2.0 (0.92)
# Tests N % N % N %
1 223 31% 161 31% 62 31%
2 336 46% 241 46% 95 47%
3 79 11% 54 10% 25 12%
4 85 12% 64 12% 21 10%
5 2 0.3% 2 0.4% 0 0
6 2 0.3% 2 0.4% 0 0
The timing of tests after the initial test had a reasonable distribution with the second test administered a mean of 5.3 days after the first test (median 4) (Table 2).
Table 2: Distribution of multiple COVID-19 tests
Test Number N
Days Since 1st Test
Mean (SD) Median (IQR) Range
2nd 504 5.3 (3.1) 4 (3-8) 2-29
3rd 168 10.1 (3.8) 8 (8-12) 4-29
4th 89 12.8 (3.7) 10 (10-15) 10-26
5th 4 19.5 (6.4) 19.5 (14-25) 14-25
6th 2 25.5 (2.1) -- 24-27
Test results
Considering all tests administered to close contact and comparison students (initial and all repeated tests), 1.4% of all student tests were positive.
By groupings, 2.9% of students (21/727) had a positive test for COVID-19. For the close contact group, 15 of the 524 children (2.9%) had a positive test (Table 3). The number of children in the in-class comparison group was small (n=31), and none had a positive test (0/31). In the other class comparison group, the percentage of children with a positive test was slightly higher (6/172, 3.5%). If both comparison groups are combined, the percentage of students with a positive test was nearly identical to the close contact group (3.0%, 6/203).
The percentage of high school students with a positive test was similar to elementary students (Table 3). After stratification by type of student, no meaningful differences were identifiable, although these estimates are imprecise.
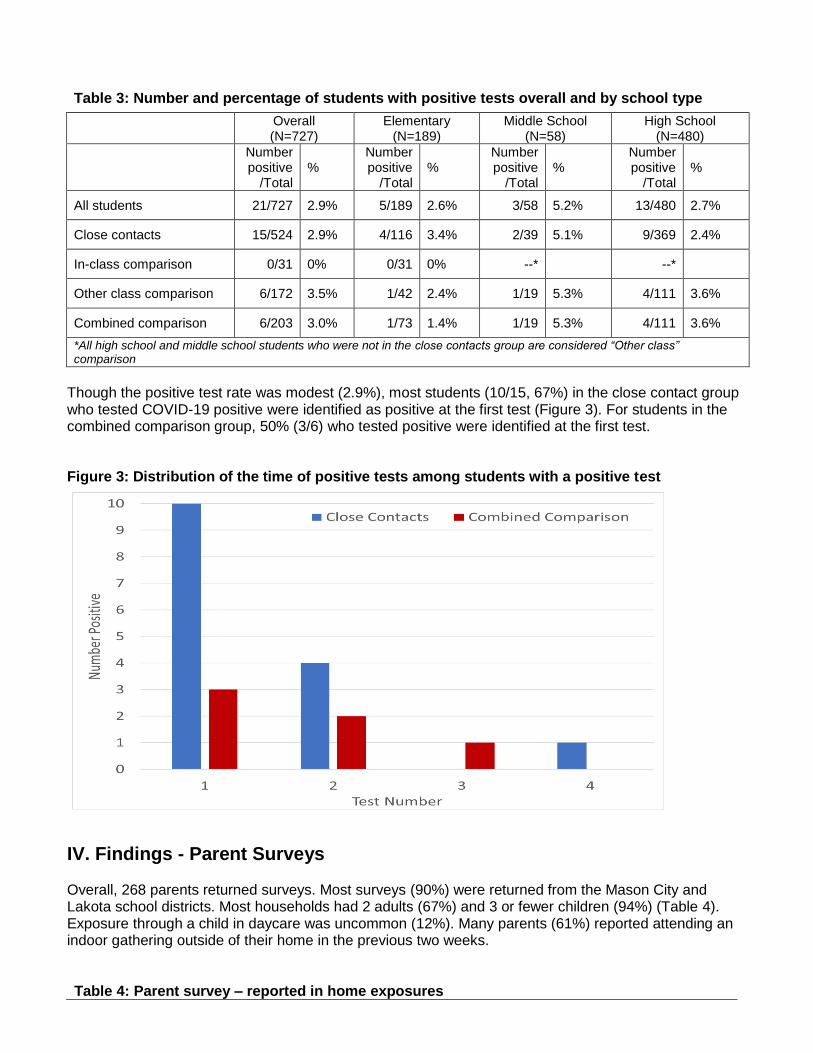
Table 3: Number and percentage of students with positive tests overall and by school type
Overall (N=727)
Elementary (N=189)
Middle School (N=58)
High School (N=480)
Number positive
/Total %
Number positive
/Total %
Number positive
/Total %
Number positive
/Total %
All students 21/727 2.9% 5/189 2.6% 3/58 5.2% 13/480 2.7%
Close contacts 15/524 2.9% 4/116 3.4% 2/39 5.1% 9/369 2.4%
In-class comparison 0/31 0% 0/31 0% --* --*
Other class comparison 6/172 3.5% 1/42 2.4% 1/19 5.3% 4/111 3.6%
Combined comparison 6/203 3.0% 1/73 1.4% 1/19 5.3% 4/111 3.6%
*All high school and middle school students who were not in the close contacts group are considered “Other class” comparison
Though the positive test rate was modest (2.9%), most students (10/15, 67%) in the close contact group who tested COVID-19 positive were identified as positive at the first test (Figure 3). For students in the combined comparison group, 50% (3/6) who tested positive were identified at the first test. Figure 3: Distribution of the time of positive tests among students with a positive test
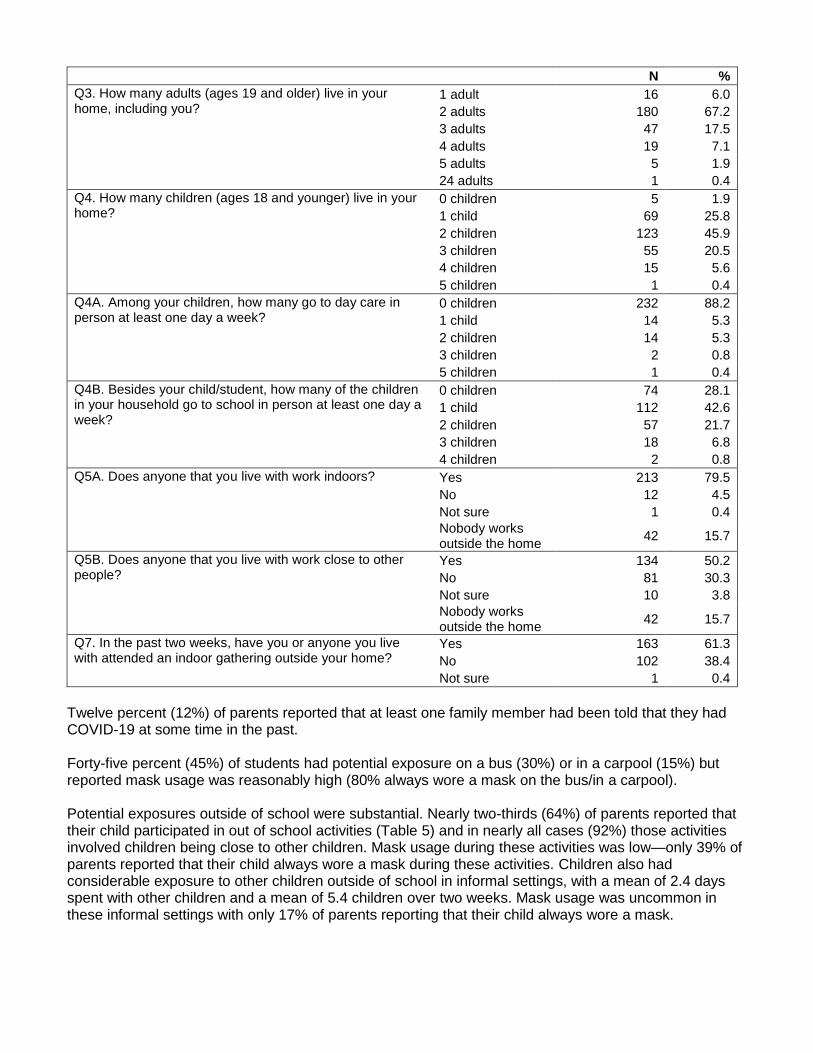
IV. Findings - Parent Surveys Overall, 268 parents returned surveys. Most surveys (90%) were returned from the Mason City and Lakota school districts. Most households had 2 adults (67%) and 3 or fewer children (94%) (Table 4). Exposure through a child in daycare was uncommon (12%). Many parents (61%) reported attending an indoor gathering outside of their home in the previous two weeks. Table 4: Parent survey – reported in home exposures
N %
Q3. How many adults (ages 19 and older) live in your home, including you?
1 adult 16 6.0
2 adults 180 67.2
3 adults 47 17.5
4 adults 19 7.1
5 adults 5 1.9
24 adults 1 0.4
Q4. How many children (ages 18 and younger) live in your home?
0 children 5 1.9
1 child 69 25.8
2 children 123 45.9
3 children 55 20.5
4 children 15 5.6
5 children 1 0.4
Q4A. Among your children, how many go to day care in person at least one day a week?
0 children 232 88.2
1 child 14 5.3
2 children 14 5.3
3 children 2 0.8
5 children 1 0.4
Q4B. Besides your child/student, how many of the children in your household go to school in person at least one day a week?
0 children 74 28.1
1 child 112 42.6
2 children 57 21.7
3 children 18 6.8
4 children 2 0.8
Q5A. Does anyone that you live with work indoors? Yes 213 79.5
No 12 4.5
Not sure 1 0.4
Nobody works outside the home
42 15.7
Q5B. Does anyone that you live with work close to other people?
Yes 134 50.2
No 81 30.3
Not sure 10 3.8
Nobody works outside the home
42 15.7
Q7. In the past two weeks, have you or anyone you live with attended an indoor gathering outside your home?
Yes 163 61.3
No 102 38.4
Not sure 1 0.4
Twelve percent (12%) of parents reported that at least one family member had been told that they had COVID-19 at some time in the past. Forty-five percent (45%) of students had potential exposure on a bus (30%) or in a carpool (15%) but reported mask usage was reasonably high (80% always wore a mask on the bus/in a carpool). Potential exposures outside of school were substantial. Nearly two-thirds (64%) of parents reported that their child participated in out of school activities (Table 5) and in nearly all cases (92%) those activities involved children being close to other children. Mask usage during these activities was low—only 39% of parents reported that their child always wore a mask during these activities. Children also had considerable exposure to other children outside of school in informal settings, with a mean of 2.4 days spent with other children and a mean of 5.4 children over two weeks. Mask usage was uncommon in these informal settings with only 17% of parents reporting that their child always wore a mask.
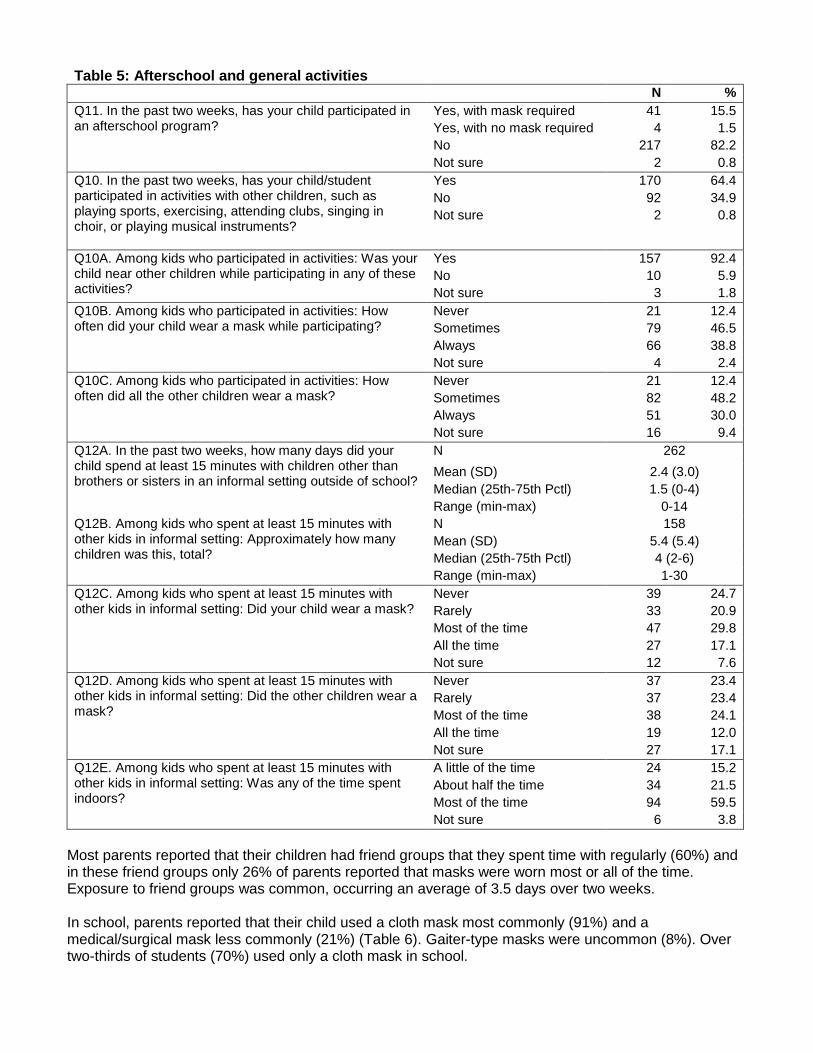
Table 5: Afterschool and general activities
N %
Q11. In the past two weeks, has your child participated in an afterschool program?
Yes, with mask required 41 15.5
Yes, with no mask required 4 1.5
No 217 82.2
Not sure 2 0.8
Q10. In the past two weeks, has your child/student participated in activities with other children, such as playing sports, exercising, attending clubs, singing in choir, or playing musical instruments?
Yes 170 64.4
No 92 34.9
Not sure 2 0.8
Q10A. Among kids who participated in activities: Was your child near other children while participating in any of these activities?
Yes 157 92.4
No 10 5.9
Not sure 3 1.8
Q10B. Among kids who participated in activities: How often did your child wear a mask while participating?
Never 21 12.4
Sometimes 79 46.5
Always 66 38.8
Not sure 4 2.4
Q10C. Among kids who participated in activities: How often did all the other children wear a mask?
Never 21 12.4
Sometimes 82 48.2
Always 51 30.0
Not sure 16 9.4
Q12A. In the past two weeks, how many days did your child spend at least 15 minutes with children other than brothers or sisters in an informal setting outside of school?
N 262
Mean (SD) 2.4 (3.0)
Median (25th-75th Pctl) 1.5 (0-4)
Range (min-max) 0-14
Q12B. Among kids who spent at least 15 minutes with other kids in informal setting: Approximately how many children was this, total?
N 158
Mean (SD) 5.4 (5.4)
Median (25th-75th Pctl) 4 (2-6)
Range (min-max) 1-30
Q12C. Among kids who spent at least 15 minutes with other kids in informal setting: Did your child wear a mask?
Never 39 24.7
Rarely 33 20.9
Most of the time 47 29.8
All the time 27 17.1
Not sure 12 7.6
Q12D. Among kids who spent at least 15 minutes with other kids in informal setting: Did the other children wear a mask?
Never 37 23.4
Rarely 37 23.4
Most of the time 38 24.1
All the time 19 12.0
Not sure 27 17.1
Q12E. Among kids who spent at least 15 minutes with other kids in informal setting: Was any of the time spent indoors?
A little of the time 24 15.2
About half the time 34 21.5
Most of the time 94 59.5
Not sure 6 3.8
Most parents reported that their children had friend groups that they spent time with regularly (60%) and in these friend groups only 26% of parents reported that masks were worn most or all of the time. Exposure to friend groups was common, occurring an average of 3.5 days over two weeks. In school, parents reported that their child used a cloth mask most commonly (91%) and a medical/surgical mask less commonly (21%) (Table 6). Gaiter-type masks were uncommon (8%). Over two-thirds of students (70%) used only a cloth mask in school.
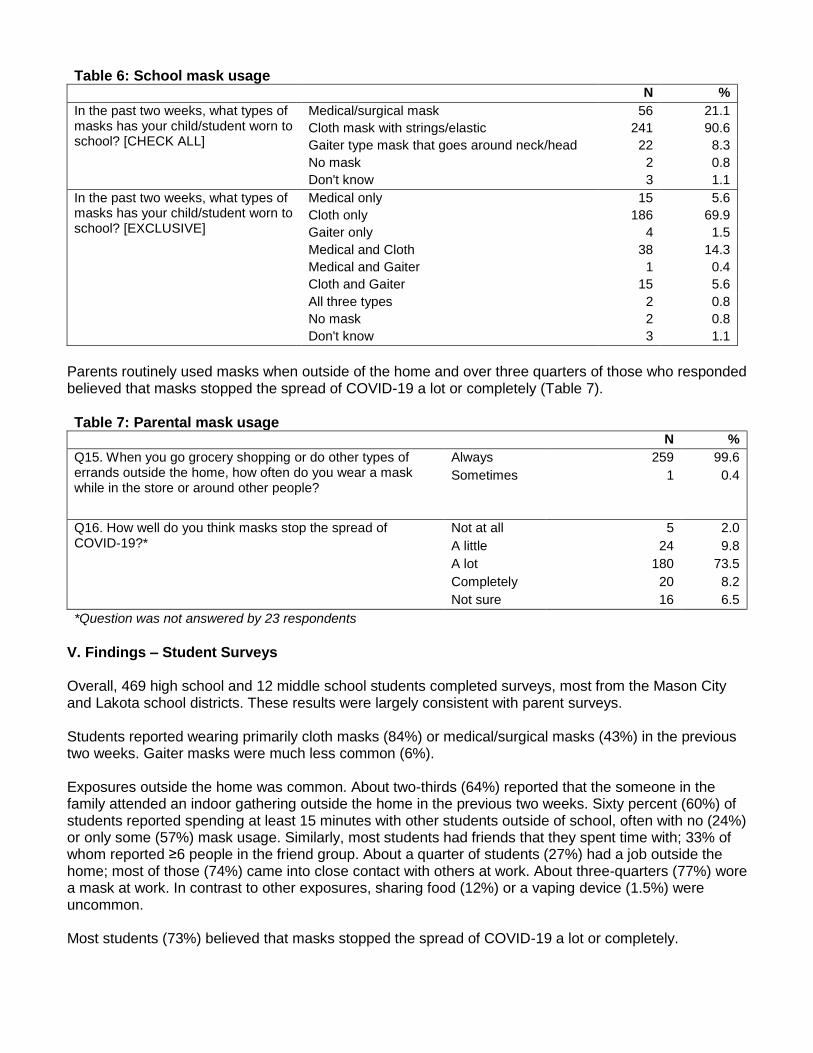
Table 6: School mask usage
N %
In the past two weeks, what types of masks has your child/student worn to school? [CHECK ALL]
Medical/surgical mask 56 21.1
Cloth mask with strings/elastic 241 90.6
Gaiter type mask that goes around neck/head 22 8.3
No mask 2 0.8
Don't know 3 1.1
In the past two weeks, what types of masks has your child/student worn to school? [EXCLUSIVE]
Medical only 15 5.6
Cloth only 186 69.9
Gaiter only 4 1.5
Medical and Cloth 38 14.3
Medical and Gaiter 1 0.4
Cloth and Gaiter 15 5.6
All three types 2 0.8
No mask 2 0.8
Don't know 3 1.1
Parents routinely used masks when outside of the home and over three quarters of those who responded believed that masks stopped the spread of COVID-19 a lot or completely (Table 7).
Table 7: Parental mask usage
N %
Q15. When you go grocery shopping or do other types of errands outside the home, how often do you wear a mask while in the store or around other people?
Always 259 99.6
Sometimes 1 0.4
Q16. How well do you think masks stop the spread of COVID-19?*
Not at all 5 2.0
A little 24 9.8
A lot 180 73.5
Completely 20 8.2
Not sure 16 6.5
*Question was not answered by 23 respondents
V. Findings – Student Surveys Overall, 469 high school and 12 middle school students completed surveys, most from the Mason City and Lakota school districts. These results were largely consistent with parent surveys. Students reported wearing primarily cloth masks (84%) or medical/surgical masks (43%) in the previous two weeks. Gaiter masks were much less common (6%). Exposures outside the home was common. About two-thirds (64%) reported that the someone in the family attended an indoor gathering outside the home in the previous two weeks. Sixty percent (60%) of students reported spending at least 15 minutes with other students outside of school, often with no (24%) or only some (57%) mask usage. Similarly, most students had friends that they spent time with; 33% of whom reported ≥6 people in the friend group. About a quarter of students (27%) had a job outside the home; most of those (74%) came into close contact with others at work. About three-quarters (77%) wore a mask at work. In contrast to other exposures, sharing food (12%) or a vaping device (1.5%) were uncommon. Most students (73%) believed that masks stopped the spread of COVID-19 a lot or completely.
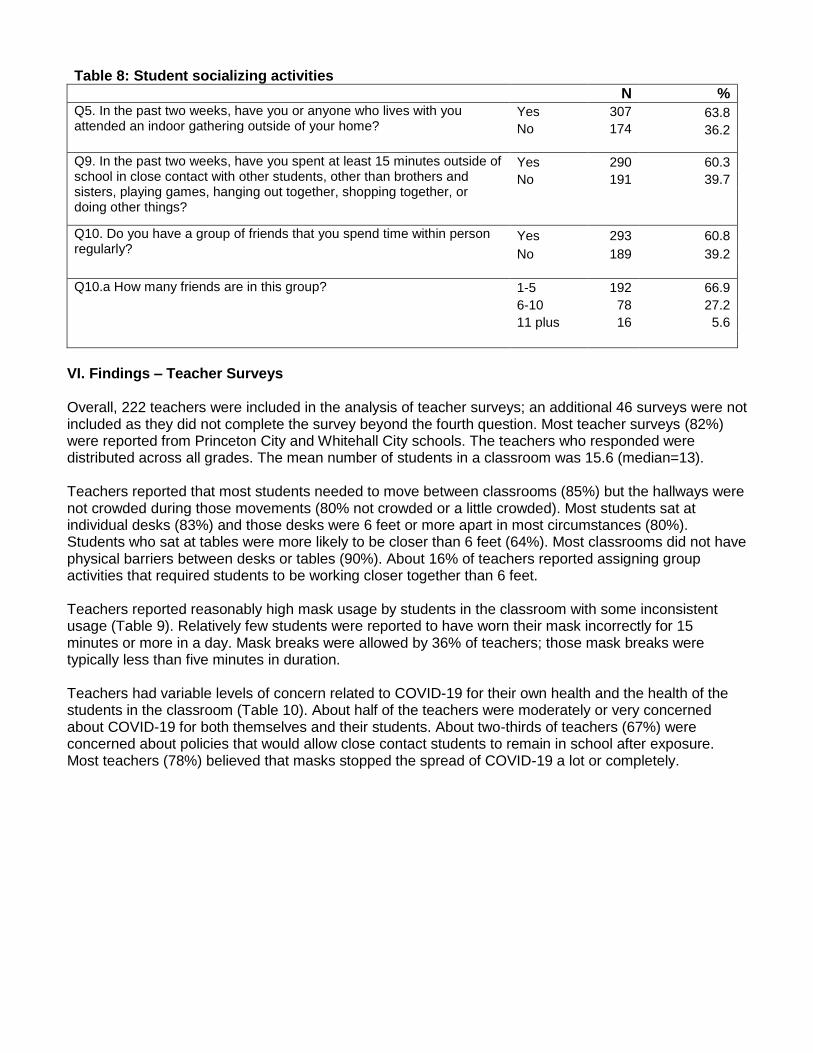
Table 8: Student socializing activities
N % Q5. In the past two weeks, have you or anyone who lives with you attended an indoor gathering outside of your home?
Yes 307 63.8
No 174 36.2
Q9. In the past two weeks, have you spent at least 15 minutes outside of school in close contact with other students, other than brothers and sisters, playing games, hanging out together, shopping together, or doing other things?
Yes 290 60.3
No 191 39.7
Q10. Do you have a group of friends that you spend time within person regularly?
Yes 293 60.8
No 189 39.2
Q10.a How many friends are in this group? 1-5 192 66.9
6-10 78 27.2
11 plus 16 5.6
VI. Findings – Teacher Surveys Overall, 222 teachers were included in the analysis of teacher surveys; an additional 46 surveys were not included as they did not complete the survey beyond the fourth question. Most teacher surveys (82%) were reported from Princeton City and Whitehall City schools. The teachers who responded were distributed across all grades. The mean number of students in a classroom was 15.6 (median=13). Teachers reported that most students needed to move between classrooms (85%) but the hallways were not crowded during those movements (80% not crowded or a little crowded). Most students sat at individual desks (83%) and those desks were 6 feet or more apart in most circumstances (80%). Students who sat at tables were more likely to be closer than 6 feet (64%). Most classrooms did not have physical barriers between desks or tables (90%). About 16% of teachers reported assigning group activities that required students to be working closer together than 6 feet. Teachers reported reasonably high mask usage by students in the classroom with some inconsistent usage (Table 9). Relatively few students were reported to have worn their mask incorrectly for 15 minutes or more in a day. Mask breaks were allowed by 36% of teachers; those mask breaks were typically less than five minutes in duration. Teachers had variable levels of concern related to COVID-19 for their own health and the health of the students in the classroom (Table 10). About half of the teachers were moderately or very concerned about COVID-19 for both themselves and their students. About two-thirds of teachers (67%) were concerned about policies that would allow close contact students to remain in school after exposure. Most teachers (78%) believed that masks stopped the spread of COVID-19 a lot or completely.

Table 9: Student mask use
N %
Q10. Overall, in the past two weeks, how many of the students in your classroom have worn a mask consistently and correctly?
None 6 2.9
Less than half 5 2.4
About half 11 5.3
More than half 82 39.4
All 104 50.0
Q11. Overall, in the past two weeks, how many of the students in your classroom have worn a mask incorrectly for more than one minute, except when eating?
None 79 38.0
Less than half 103 49.5
About half 12 5.8
More than half 7 3.4
All 7 3.4
Q12. Among the students that wore a mask incorrectly, about how many students wear their masks incorrectly for 15 minutes or more in a day, except when eating?
None 46 36.5
Less than half 47 37.3
About half 11 8.7
More than half 13 10.3
All 9 7.1
Q13. Do you allow a mask break in the classroom, excluding times when students are eating?
Yes 75 36.4
No 131 63.6
Q13A. Among classrooms with mask break allowed: How long is the mask break?
1 minute 11 14.9
2-3 minutes 20 27.0
4-5 minutes 27 36.5
more than 5 minutes
16 21.6
Q13B. Among classrooms with mask break allowed: How many students are allowed to take a break at the same time?
N 72
Mean (SD) 8.1 (5.5)
Median (25th-75th Pctl)
7 (3-12)
Range (min-max)
1-20
Q13C. Among classrooms with mask break allowed: Are there partitions in place during the mask break(s)?
Yes 4 5.4
No 70 94.6
Table 10: Risk Perception*
N %
Q19. Taking into account everything you know about COVID-19 and your own observations of your students and your classroom, how concerned are you about the risk to your own health?
Not concerned 22 13.5
Mildly concerned 64 39.3
Moderately concerned
48 29.5
Very concerned 29 17.8
Q20. Taking into account everything you know about COVID-19 and your own observations of your students and your classroom, how concerned are you about the risk to your students’ health?
Not concerned 18 11.0
Mildly concerned 67 41.1
Moderately concerned
51 31.3
Very concerned 27 16.6
Q23. If a student in your class was diagnosed with COVID-19, how concerned would you be if other students, identified as close contacts, who wore their masks consistently and correctly, were allowed to stay in class rather than quarantine at home?
Not concerned 14 8.6
Mildly concerned 40 24.5
Moderately concerned
44 27.0
Very concerned 65 39.9
Q24. Do you think masks, worn consistently and correctly, stop the spread of COVID-19?
Not at all 3 1.8
A little 33 20.3
A lot 113 69.3
Completely 14 8.6

VII. Findings – Administrator Surveys Overall, 55 administrator surveys were received. Of these, 10 partial surveys without responses beyond question 6 were excluded. When multiple surveys were received from a school, the highest-ranking school official was selected, leaving a total of 29 surveys for analysis. Most schools used a hybrid design (69%) with a mean of 21 hours per week in school (Table 11).
Table 11: School information
N %
Q2. Which level of education is your school? Elementary 17 58.6
Middle School 4 13.8
High School 8 27.6
Q3. Are your classes offered fully in-person or with a hybrid design?
Fully in person 9 31.0
Hybrid design 20 69.0
Q3A. Hybrid Schools: How many hours per week is each student at the school in-person?
N 20
Mean (SD) 21.0 (11.2)
Median (25th-75th Pctl) 14.5 (13-30)
Range (min-max) 7-50
Allowable classroom sizes varied considerably (minimum=12, maximum=30; mean=18.3). Many administrators (41%) reported desks less than 6 feet apart. Most principals reported that students ate lunch in the cafeteria (90%). The cafeterias had many students at the same time (mean=129.6, median=60), typically without partitions. Table 12: Classroom information
Classroom Information N %
Q4. What is the maximum number of students allowed in a classroom at a time?
N 28
Mean (SD) 18.3 (5.7)
Median (25th-75th Pctl) 15 (14-24)
Range (min-max) 12-30
Q5. What is the distance between students’ desks in classrooms?
3-5 feet 12 41.4
6 feet 17 58.6
Q6. Do students eat lunch at the school? Yes 28 96.6
No 1 3.5
Q6A. Among schools where students eat lunch at school: Do they eat at their desk or in the cafeteria?
Desk 2 7.1
Cafeteria 26 92.9
Q6B. Among schools where students eat in cafeteria: How many students are in the cafeteria at the same time?
N 25
Mean (SD) 129.6 (133.6)
Median (25th-75th Pctl) 60 (30-174)
Range (min-max) 8-425
Q6C. Among schools where students eat in cafeteria: Are there partitions between students while they are eating in the cafeteria?
Yes 6 24.0
No 19 76.0
Q6D. Among schools where students eat at desks: Are there partitions between students while they are eating at their desks?
Yes 1 50.0
No 1 50.0
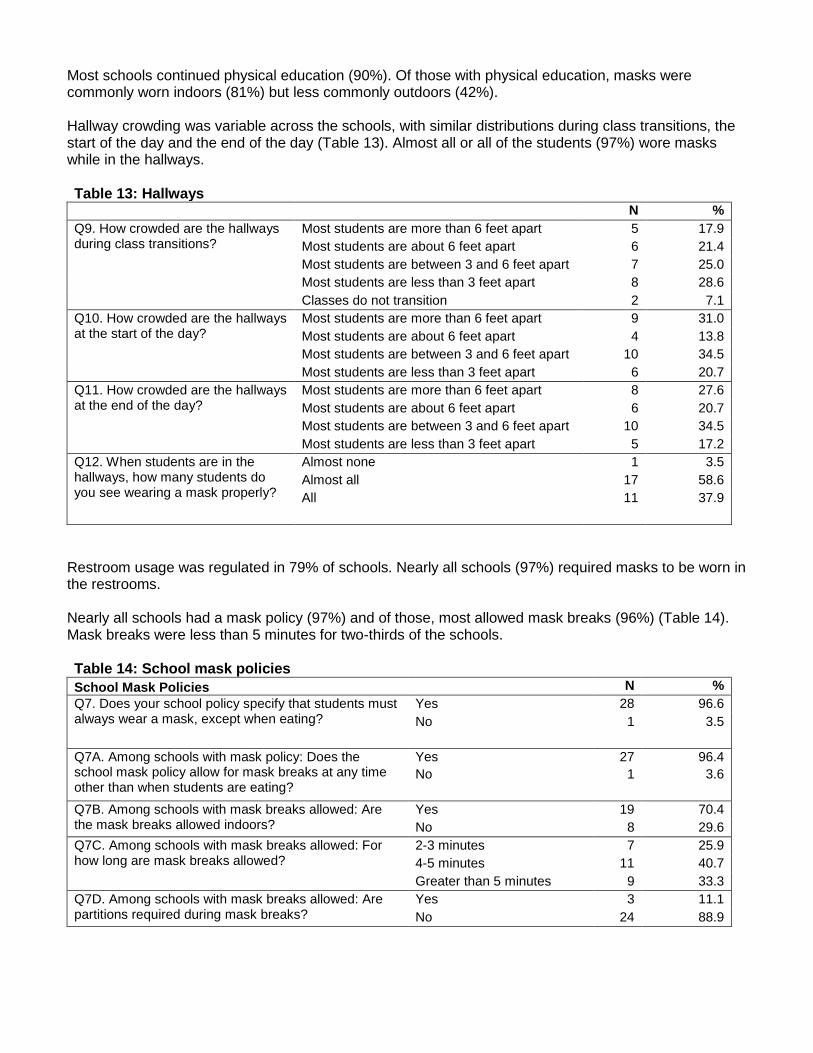
Most schools continued physical education (90%). Of those with physical education, masks were commonly worn indoors (81%) but less commonly outdoors (42%). Hallway crowding was variable across the schools, with similar distributions during class transitions, the start of the day and the end of the day (Table 13). Almost all or all of the students (97%) wore masks while in the hallways.
Table 13: Hallways
N %
Q9. How crowded are the hallways during class transitions?
Most students are more than 6 feet apart 5 17.9
Most students are about 6 feet apart 6 21.4
Most students are between 3 and 6 feet apart 7 25.0
Most students are less than 3 feet apart 8 28.6
Classes do not transition 2 7.1
Q10. How crowded are the hallways at the start of the day?
Most students are more than 6 feet apart 9 31.0
Most students are about 6 feet apart 4 13.8
Most students are between 3 and 6 feet apart 10 34.5
Most students are less than 3 feet apart 6 20.7
Q11. How crowded are the hallways at the end of the day?
Most students are more than 6 feet apart 8 27.6
Most students are about 6 feet apart 6 20.7
Most students are between 3 and 6 feet apart 10 34.5
Most students are less than 3 feet apart 5 17.2
Q12. When students are in the hallways, how many students do you see wearing a mask properly?
Almost none 1 3.5
Almost all 17 58.6
All 11 37.9
Restroom usage was regulated in 79% of schools. Nearly all schools (97%) required masks to be worn in the restrooms. Nearly all schools had a mask policy (97%) and of those, most allowed mask breaks (96%) (Table 14). Mask breaks were less than 5 minutes for two-thirds of the schools.
Table 14: School mask policies
School Mask Policies N %
Q7. Does your school policy specify that students must always wear a mask, except when eating?
Yes 28 96.6
No 1 3.5
Q7A. Among schools with mask policy: Does the school mask policy allow for mask breaks at any time other than when students are eating?
Yes 27 96.4
No 1 3.6
Q7B. Among schools with mask breaks allowed: Are the mask breaks allowed indoors?
Yes 19 70.4
No 8 29.6
Q7C. Among schools with mask breaks allowed: For how long are mask breaks allowed?
2-3 minutes 7 25.9
4-5 minutes 11 40.7
Greater than 5 minutes 9 33.3
Q7D. Among schools with mask breaks allowed: Are partitions required during mask breaks?
Yes 3 11.1
No 24 88.9
VIII. Findings – Qualitative Interviews Planned interview themes included: (1) project participation; (2) information priorities; (3) collaborative leadership; (4) equity challenges; (5) responding to socioemotional uncertainties; and (6) pathways forward. Topics that superintendents stressed included: (1) Student safety; (2) learning alternatives and dynamics; (3) flexibility managing school operations; (4) working with local health authorities and professionals; (5) determinants of health and health stressors; (6) technology gaps for students; (7) curriculum adjustments; and (8) future strategic planning, given pandemic lessons learned. 1. Project Participation (motives and benefits)
Superintendent motives for OSCE project participation included: gaining information so that they could provide a more informed leadership, being part of the solution to the COVID pandemic and its educational implications, exploring hypotheses about schools as a safe space, identifying learning alternatives to the quarantine process, and being a reliable resource to challenge the “negativity and misinformation” being shared with their district families from media and other sources. Among their comments, superintendents stated the following:
Student safety as priority – It was information. That's the number one reason. When Tim Sahr called me and told me about the project, and I was going to be able to find out more information about what was happening in our schools, that was an easy sell. I was thankful that we were selected … The idea of feeling like you're as informed as you can be, and you've done your homework when making tough decisions about whether school should be open or to close them. What more can we do to keep kids safe?
Learning alternatives – As soon as Gov. DeWine announced that he was going to commission a study, I started texting his liaison to the schools. I started texting anybody. I had to be a part of it. Because we thought we had a good story to tell … When you see the purpose of this, to be [able to] track quarantined [students]. We've had, you know, hundreds of kids that have been quarantined and they weren't getting sick. But they were missing a lot of school. And some kids were getting quarantine more than once. And so, we wanted every opportunity to be a part of that.
2. Information Priorities (sources and interdependence)
Superintendents reached out and gathered information from a variety of sources. They assessed that information and how it can be best shared to effectively respond to their primary tension and goal of balancing educational access with student safety. Participating in the OSCE was an enriching part of a larger set of information sharing for improved leadership.
Flexibility, managing the pace of change – Things move quickly. Sometimes answers aren't as clear as you would like. We rely on the state health department to formalize recommendations or guidance regarding processes, procedures [and] interpretation of CDC guidelines on who gets quarantined, or who has to get isolated. How that impacts the home. Our local health department has been extremely helpful. We communicate with the county health department director weekly in a superintendents meeting.
3. Collaborative leadership
Superintendent collaborations included those with teachers, school health staff, local health professional groups, parent and community groups, and peer-led student leadership. Availability, flexibility, and consistently exploring alternatives to achieve their balancing mission (of access and student safety) led collaboration to be a central means of achieving these ends.
Working with local doctors and community – Local physicians have met with us as well. We have an advisory council of five local doctors, and they also have kids in our school district or a neighboring school district. So, they have vested interests in getting kids in school or the right support. And then we have a community group made up of parents and staff members and community leaders who we'll bounce ideas off of and give us guidance as well … ODH drives our local department. We stay pretty aligned [with] their guidance.
4. Equity challenges
Equity generated the most discussion and responsiveness. They addressed its multiple dimensions (e.g., class, race/ethnicity, neighborhood, etc.), the socioemotional and other consequences for their students and families, concerns about what these issues mean moving forward, and strategies of change for addressing them. Strategies included outreach for funding to supplement resources they otherwise have access to, and other strategies of superintendent leadership.
Severe food insecurity – So, for in person, kids’ lunches are accessible and free. But also, for our online students. Some of our high poverty neighborhoods and buildings in the district have been [in great need] … The honest answer is we know that we have children that if we do not have lunch or breakfast provided for them, then they are not going to eat. That's some of the basic needs we try to take a pretty serious approach to. So, we've got a pretty good food service team. For this school year, the federal government has provided a program that all students can be eligible for lunches this year, free of charge. Now for the district, that's a reimbursed expense [to] eliminate any barriers.
Wi-fi access differences and consequences – People say it all the time. ‘We got to do something about this digital divide.’ Before knowing how I was going to do it, I guaranteed connectivity for every one of our students… We partnered with a bunch of different people [to get] small wi-fi devices and we passed them out. So, I'm doing a home visit today. Is that enough? No, it's not enough. So, we went out and there were a couple outside organizations … I said, ‘I'm looking at numbers. It's easier for me to talk from a $100,000 perspective. Here's what that would do.’ And then we got a check for $100,000. We [also] have a church talking specifically to them about the connectivity gap, and their tithing [which] is going to be $150-200,000. On top of that, we wrote grants. We used some CARES [Act] dollars … So, there's going to be zero connectivity gap.
Equity Review – So, just the equity audit itself. It was me and my parent group. I was in the process of considering that as a next step. The parent group contacted me and said, ‘You know, hey, we've been working on how we can create a better bridge between the district and our group.’ So, they had written a proposed board resolution to consider … As we were meeting and talking about it, I said, ‘Well, you know, interestingly, I've been working on the idea of an equity audit, and I wanted to ask your opinion of that.’ And they immediately said, ‘That would be awesome. Great. Please do it.’
5. Responding to socioemotional uncertainties
Superintendents stated that their leadership during the pandemic has been affected by, and often had to respond to, socioemotional challenges at every level of their districts. The severity and interactions between traumas and strategies to address them were important to improve the health in their districts.
Curriculum and training – We just implemented a new curriculum. There's a period in the day at each of the buildings [to] focus on social emotional learning. We embed that in other cross-curricular lessons. This has been at the top of our list of importance for many, many years in our district … We trained our staff in ACEs [Adverse Childhood Experiences assessment] and have coaching in trauma-informed care. Our staff is pretty skilled at deescalating situations and understanding the impact of trauma on our kids and the science behind it now.

6. Pathways forward
Superintendents expressed enthusiasm for how to move forward, while acknowledging diverse uncertainties they face including challenging funding shifts. They repeatedly expressed resilience and hope for their district’s future.
Benefits of pandemic innovation – Remote learning. Programming online learning. Hybrid learning. I think we have learned that we are capable of so much more flexibility than what we thought. And there will be things we take from that, that drive what we do in the future in terms of learning options for students or creative ways to educate kids who may be or are in difficult situations. I think there's a sense of optimism [since] we've tried some things that maybe weren't as effective or that we've learned from.
Present and future hope – Our new plan is focused on, you know, resiliency. Being ready learners and being resourceful. Those are the three R's that we build our plan around. Recently our curriculum department talked about how do we take that plan and infuse our recovery plan with this in moving forward, to that day when we can get kids all in school? … How do we make sure that we're doing everything we can to emphasize a culture that takes care of these kids in the middle of everything else all the chaos going on in the world around them?
IX. Impressions and Guidance for Interpretation This pilot evaluation shows that it is feasible to engage with school districts and schools to assess the potential impact of alternative quarantine procedures for students. Despite substantial logistical challenges, the evaluation provides useful insights regarding the need for quarantine when both a student case and a close contact are wearing masks in supervised school settings. We must emphasize three critical points: (1) This pilot evaluation was not intended nor designed to provide the definitive answer regarding mask usage and quarantine in schools; (2) the evaluation was conducted in schools with a mix of hybrid and in-person instruction; and (3) the low rates of test positivity cannot be compared directly to the much higher community test positivity as testing in communities is often prompted by symptomatic illness.
This evaluation was performed in the context of a significant surge of COVID-19 cases across the State of Ohio. The percentage of positive test results observed in the comparison groups was relatively high, suggesting substantial transmission in the local communities of the school systems. Interpretation of the specific value must be made cautiously. The students in the comparison group underwent testing without any associated symptoms or known indication for testing, other than participation in the evaluation. As a result, this percentage cannot be meaningfully compared to positivity rates observed in the local communities.
The observed percentages across the three groups (close contacts, in-class comparison, and other class comparison) were comparable. Also, the percentage in the close contact group was very close to the a priori value of 3%, above which we suggested that we would have concern for retaining those children in school during a quarantine period.2 Taken together, we do not identify any differences in the groups that would imply a mandatory, at-home quarantine was necessary for students who were close contacts with appropriate mask usage. But we must emphasize that the evaluation was not designed of a scale to answer school attendance questions definitively.
The OSCE did not address certain additional questions that may affect in-person school activities. The OSCE did not evaluate the necessity of quarantine when masks were not used appropriately or distance
2 The a priori, defined as the reasoning or knowledge which proceeds from theoretical deduction of assumption, of three percent (3%) is suggested by the US Centers for Disease Control and Prevention and utilized in COVID-19 investigations of university students in the State of Ohio.

between desks was less than six feet. The OSCE also did not evaluate the impact of sports or other extracurricular activities on COVID-19 within schools.
The survey data collected as part of OSCE provides important context for the testing data. At the school level, most schools were using a hybrid design. Nearly all schools had appropriate mask policies in place. Teachers reported reasonably high and appropriate mask usage in their classrooms. The surveys also identified some areas of potential concern: potentially crowded hallways, many students in cafeterias at the same time, and desks less than six feet apart.
Many teachers reported considerable concern for their own health and their students’ health related to COVID-19. And most teachers were uncomfortable with a policy change to allow close contact students who had worn a mask appropriately to remain in school. This concern highlights the need for careful messaging around any policy change.
Parent and student surveys provided potential explanations for the observed rate of COVID-19 among the comparison groups. Children had substantial exposure from outside the home. Children were exposed to indoor gatherings outside of the home, extracurricular activities, and informal friend groups. Many of these activities were reported to occur with inconsistent mask usage. Most masks worn were cloth, which may be of importance as new variants of concern with potentially greater transmissibility increase in Ohio communities.
X. Summary
The OSCE was completed safely because of the supervised mask and distancing protocols in the schools and the use of testing to isolate children with COVID-19. The rates of infection in the close contact and the comparison group were relatively high, at nearly 3%. The supplemental data indicate substantial out-of-school exposure of the children, which may contribute the high rate of infection in the comparison group. To ensure low rates of infection in schools, protocols must be in place to lessen exposure to other students using the mitigation measures that are known to work: physical distancing and masks.
A special thanks to Ashland City, Athens City, Champion Local, Lakota Local, Marysville Exempted Village, Mason City, Princeton City, Troy City, and Whitehall City school districts for their cooperation with this evaluation.