ohio job outlook 2016-2026
TRANSCRIPT

TO STRENGTHEN OHIO’S FAMILIES WITH SOLUTIONS TO TEMPORARY CHALLENGES
Employment Projections
2026 Ohio Job Outlook

1
Table of Contents
Table of Contents ........................................................................................................................ 1
Overview ...................................................................................................................................... 2
Ohio Population Trends .............................................................................................................. 3
Ohio Industry Employment ...................................................................................................... 7
Industry Sectors ....................................................................................................................... 7
High-Growth Industry Groups ................................................................................................ 9
Most New Jobs ...................................................................................................................... 10
Ohio Occupational Employment ............................................................................................ 12
Fastest-Growing Occupational Groups ............................................................................... 14
Occupational Groups with the Most New Jobs .................................................................. 14
Occupations with the Most Annual Openings .................................................................... 15
Self-Employment ................................................................................................................... 16
Education and Training ......................................................................................................... 17
Appendix Tables ....................................................................................................................... 20
A - Ohio Business Types by Industry Sector ....................................................................... 21
B - Ohio Employment Projections Report by Major Industry ............................................ 22
C - Ohio’s Top 30 Industries with the Fastest Job Growth ................................................. 23
D - Ohio’s Top 30 Industries with the Most New Jobs ....................................................... 24
E - Ohio’s Industry Employment Projections Report .......................................................... 25
F - Ohio Occupational Employment Projections by Occupational Group ......................... 33
G - Ohio’s Fastest Growing Occupations ............................................................................ 34
H - Occupations in Ohio with the Most Annual Openings ................................................. 35
I - Ohio Occupations with at least 1,000 Self-Employed .................................................... 36
J - Ohio Occupational Employment ..................................................................................... 37
K - Ohio Occupational Education and Training Classification ........................................... 54

2
Ohio Job Outlook to 2026
Overview
Employment projections are a key product of the Bureau of Labor Market Information.
The bureau completes 10-year employment projections every two years and two-year
employment projections annually. The projections are based on the most current data
available at the time they are made; they are estimates of future employment assuming
there are no changes in the current situation. People who use this information include
individuals planning their education, training and careers; educational program planners
developing training courses and curricula; administrators and legislators responsible for
government policies; and business executives planning marketing and personnel
strategies.
One key use of the long-term employment projections is the identification of Ohio’s in-
demand occupations. Statistical thresholds for wage, growth and annual openings
determine the baseline list of occupations used.1 The list of in-demand jobs is for
operational and implementation purposes, specifically to foster cross-agency alignment
and to better target job-matching and career-planning services through
OhioMeansJobs.com.
This report presents Ohio employment projections from 2016 to 2026. It is divided into
three sections. The “Ohio Population Trends” section presents population projections and
historical labor force participation rates. The “Ohio Industry Employment” section
presents employment projections for Ohio’s goods-producing and service-providing
industries. The “Ohio Occupational Employment” section presents employment
projections for occupations and occupational groups.
Overall, the Ohio economy is expected to add 253,000 additional jobs between 2016 and
2026, with an expected 664,000 job openings annually.2 The health care and social
assistance services industries are expected to add the most jobs, and a large portion of
job growth will come from health care occupations. Read more to learn about the growth
expectations for Ohio’s industries and occupations.
1 Additional factors included are employment patterns for key industry clusters, employer job-forecasting survey data, and
assessments by a review committee. 2 Read the New Annual Openings Methodology on page 12 to learn about how a newly adopted method of calculating
separation rates has impacted the number of job openings.

3
Ohio Population Trends
Ohio’s population has been growing more slowly than the national average. While the
U.S. population grew 30.3 percent from 1990 to 2017, Ohio’s population grew only 7.3
percent (see Figure 1). Nationally, population growth has been trending slower. U.S.
population grew 23.8 percent from 1990 to 2000, but only 15.4 percent since 2000. This
trend is more pronounced in Ohio, where the state population grew 6.2 percent from 1990
to 2000, but only 2.6 percent since 2000.
Figure 1. Population Growth as a Percentage from 1990
Source: U.S. Census Bureau and U.S. Bureau of Economic Analysis
Ohio’s slower-than-average growth is likely to continue, as growth rates are expected to
nearly flatten in the coming decade (Figure 2). The projected 10-year population growth
rate for the U.S. is 8.1 percent, with the working-age population (age 16 and older)
expected to grow at a rate of 9.6 percent. In comparison, the projected 10-year population
growth rate for Ohio is 0.4 percent, with the working-age population expected to grow at
a rate of 1.1 percent. The oldest population group (65 and older) is expected to grow 37.8
percent in the entire U.S. and 25.0 percent in Ohio. While the 25-to-64 age group is
expected to increase nationally by 4.1 percent, it is expected to decline in Ohio by 5.5
percent.

4
Figure 2. U.S. and Ohio Population Projections (in thousands)
2015
2020
2025
% change
2015-2025
U.S.
Total Population 321,369 334,503 347,335 8.1%
Working-Age Population 256,107 268,750 280,749 9.6%
Age 25 to 64 168,689 173,379 175,664 4.1%
Age 65 and over 47,830 56,441 65,920 37.8%
Ohio
Total Population 11,549 11,575 11,599 0.4%
Working-Age Population 9,228 9,273 9,328 1.1%
Age 25 to 64 6,006 5,874 5,678 -5.5%
Age 65 and over 1,795 2,011 2,244 25.0%
Source: Ohio Development Services Agency and U.S. Census Bureau
Even though the total and working-age populations in Ohio have been growing, labor
force participation rates have been declining. This means fewer people in the working-
age population are working or actively looking for work. In 2000, the labor force
participation rate for Ohio was 67.1 percent; by 2016 it had dropped to 62.6 percent.
Figure 3 shows the labor force participation rates for men, women, and the total working-
age population from 1990 to 2016.

5
Figure 3. Ohio Labor Force Participation Rates by Gender – 1990 to 2016
Source: Bureau of Labor Statistics
The decline in labor force participation is part of a national trend. At first glance it appears
the recession may have caused a steep decline in participation rates. During the
recession, some individuals were discouraged and stopped looking for work, which
means they were no longer part of the labor force. Many of these individuals rejoined the
labor force as the economy recovered.
However, other factors have been driving the decline, as well. The strongest factor, one
that began at the height of the recession, was the beginning of retirements for the baby
boom generation. In 2008 the first of the baby boomers turned 62 and became eligible for
Social Security; in 2011 they turned 65, the traditional age for retirement. Nationally,
about 10,000 baby boomers turn 65 each day, and this number is expected to surpass
11,000 per day in the next decade.3 Even though they have retired, they are still part of the
working age population. If they are not employed and not actively looking for work, they
count against the labor force participation rate. Continuing retirements among the baby
boomers will push labor force participation rates lower. Figure 4 shows the percentage of
those 65 and older in the working-age population projected to 2021.
A second factor affecting participation rates is an overall decline in labor force
participation among many demographic groups. For example, labor force participation
among prime-age men (ages 25 to 54) declined for 60 years, from 1954 to 2014.4
3 https://www.gao.gov/assets/690/680646.pdf 4 https://data.bls.gov/timeseries/LNS11300061

6
Figure 4. Percentage of Working-Age Population Age 65 and Older
Source: IHS Markit Ltd

7
Ohio Industry Employment
This section shows projected employment changes for a variety of industry
classifications. Business establishments are classified into industries according to the
primary goods and services they produce or provide, using the North American Industry
Classification System (NAICS). For example, factories assembling cars are classified in
the motor vehicle manufacturing industry, and supermarkets are in the grocery store
industry. See Appendix Table A for examples of types of businesses by NAICS
classification. NAICS has several levels of classification, each giving a more detailed
picture of each industry. This report presents industry employment projections at the
NAICS sector and industry-group levels to illustrate expected changes.5 Industry
employment projections were made at the four-digit NAICS industry level using a variety
of models, including single-equation regression models. These models related Ohio
industry employment to national industry employment and other key economic
determinates for Ohio, especially income and population.
Industry Sectors: Industries typically are grouped in two broad categories: goods-
producing, which produce physical products, and service-providing, which are all other
industries. The goods-producing industry sectors are agriculture, forestry, fishing and
hunting; mining, quarrying, and oil and gas extraction; construction; and manufacturing.
The service-providing industry sectors are wholesale trade; retail trade; transportation
and warehousing; utilities; information; finance and insurance; real estate and rental and
leasing; professional, scientific and technical services6; management of companies and
enterprises; administrative and support and waste management and remediation
services7; educational services; health care and social assistance; arts, entertainment and
recreation; accommodation and food services; other services (except public
administration); and government.
5 NAICS consists of the following industry levels: 11 supersectors (individual two-digit NAICS or several two- digit NAICS
grouped together); 20 sectors (individual two-digit NAICS); 99 subsectors (three-digit NAICS); 312 industry groups (four-
digit NAICS); 713 industries (five-digit NAICS); and 1,065 detailed NAICS (six-digit NAICS). 6 Short title, “Professional and technical services” used in charts / tables. 7 Short title, “Administrative and waste services” used in charts / tables.

8
Figure 5. Ohio Industry Employment Outlook
Source: Ohio Bureau of Labor Market Information
Figure 5 details employment projections for goods-producing and service-providing
industries. Overall, the number of jobs for Ohioans is expected to rise from 5.794 million
in 2016 to 6.047 million by 2026, an increase of more than 253,000 jobs. Service-providing
industries are expected to add 252,721 jobs, an increase of 5.6 percent. Goods-producing
industries are expected to shrink by 19,216 jobs, a decrease of 1.9 percent.8
Figure 6 shows the employment change expected for each industry sector between 2016
and 2026. Service-providing industries are indicated by a dark red bar; goods-producing
industries are indicated by a blue bar. Among the goods-producing sectors, construction
is projected to grow by 21,474 jobs and manufacturing is projected to shrink by 40,512
jobs. Growth among the service-providing sectors will be led by the health care and
social assistance industry, which is expected to add more than 135,000 jobs, a 16.5
percent increase. The administrative and waste services industry is expected to add more
than 25,000 jobs. Educational services is also expected to add nearly 25,000 jobs.
See Appendix Table B for industry projections by absolute and percent change.
8 Self-employed and other workers whose jobs fall outside of traditional industry classifications are expected to add 19,828
jobs, an increase of 6.7 percent.

9
Figure 6. Ohio Employment Outlook by Industry Sector, 2016-2026
Source: Ohio Bureau of Labor Market Information
High-Growth Industry Groups: Each sector contains industry groups of related
industries; these industry groups can change in different ways. Figure 7 shows the 10
industry groups expected to grow the fastest (between 25.2 and 50.7 percent) from 2016
to 2026.
The fastest-growing industry group is projected to be home health care services (NAICS
6216), with an increase of 50.7 percent. This industry group is in the health care and social
assistance sector. Five other fastest-growing industry groups are also in that sector:
individual and family services (NAICS 6241), with a 40.2 percent increase; community
care facilities for the elderly (NAICS 6233), with a 31.2 percent increase; specialty
(excluding psychiatric and substance abuse) hospitals (NAICS 6223), with a 28.1 percent
increase; residential mental health facilities (NAICS 6232), with a 26.9 percent increase;
and offices of other health practitioners (NAICS 6213), with a 25.6 percent increase. One
reason for the growth in this sector is Ohio’s aging population, as more baby boomers
reach retirement age.
See Appendix Table C for a list of the top 30 industry groups with the fastest expected
growth.

10
Figure 7. Top 10 Ohio Industry Groups with the Fastest Job Growth
Source: Ohio Bureau of Labor Market Information
Most New Jobs: The 10 industry groups projected to add the most new jobs are shown
in Figure 8; they are expected to add 156,077, or 61.6 percent, of new jobs from 2016 to
2026.
The fastest growing industry group, home health care services (NAICS 6216), is also the
industry group expected to add the most jobs by 2026. Five of the top six industry groups
expected to create the most jobs are in the health care and social assistance sector. These
include home health care services (NAICS 6216), general medical and surgical hospitals
(6221), individual and family services (NAICS 6241), offices of physicians (NAICS 6211),
and community care facilities for the elderly (NAICS 6233).
See Appendix Table D for a complete list of the top 30 private-sector industries with the
most new jobs.

11
Figure 8. Ohio Industries Adding the Most New Jobs, 2016-2026
Source: Ohio Bureau of Labor Market Information
See Appendix Table E for a complete look at industry projections by NAICS classification
levels.

12
Ohio Occupational Employment
The employment outlook for individual occupations is affected by the industries that
employ them. These occupational estimates are derived by creating an industry-
occupation matrix using industry staffing patterns developed from data supplied by Ohio
employers in the Occupational Employment Statistics (OES) survey. For example, some
occupations, such as registered nurses and structural iron workers, are highly
concentrated in a few industries; demand for those occupations depends on the health of
those industries. Other occupations, such as secretaries and computer systems analysts,
are present in many industries; demand for those occupations is more closely tied to
changes in the economy. Changes in technology, business practices and operations affect
how employers structure staffing to improve productivity. For example, technological
advances will continue to reduce the need for such occupations as telephone operators,
typists, travel agents and order clerks. Industry staffing patterns were adjusted for
expected technological change and other factors from national data provided by the U.S.
Bureau of Labor Statistics (BLS).
Understanding the employment outlook of occupations is important for career planning.
As some occupations are expected to grow and others are expected to shrink, Ohio
developed a list of in-demand occupations to assist in career planning. Along with other
information, the employment outlook of occupations provides the baseline data for the
in-demand list using statistical thresholds for wages, annual openings and growth. The
in-demand list is available and utilized throughout OhioMeansJobs.com to better target
job matching and career planning services provided on the website. This section presents
the job outlook in Ohio by type of work and required education and training levels.
Occupations are classified using the Standard Occupational Classification (SOC) system,
which has 22 groups of occupations with related types of work. For example, one
occupational group consists of managerial occupations. Within each occupational group
are specific occupations, each with different requirements for knowledge, skills, abilities
and duties. Occupations are classified at the six-digit SOC level. See Appendix Table F for
a comprehensive look at occupational projections by occupational group.
New Annual Openings Methodology
Users familiar with projections data may notice that the numbers of projected openings
are significantly higher in this report than in past projections. This is due to the adoption
of a new methodology developed by BLS that changes the way job openings are
estimated. Because of the change in methodology, long-term projections from previous
periods should not be compared to newer projections going forward. The previous
methodology assumed that most individuals followed a “traditional” career path:
entering employment at a young age, remaining in the same occupation until retirement,
and then being replaced by another worker. The new methodology reflects the changing
workforce of the 21st century and recognizes that workers may have several career
changes during their working lives. This dynamic workforce is reflected in the estimation
of job openings, which are created not only when workers retire, but also when they
move from one occupation to another. The resulting data is more accurate and reliable,
especially for smaller occupations. (For more information on the new separations rate
methodology, see https://www.bls.gov/emp/documentation/separations.htm).

13
Ohio is expected to add 253,000 jobs from 2016 to 2026. Perhaps more important to
individuals searching for jobs, however, is the expected number of annual job openings.
On average, Ohio’s economy is expected to have over 650,000 job openings annually.
About 4 percent of annual job openings will result from the creation of additional jobs.
About 41 percent of annual job openings will result from the need to replace workers who
leave the labor force, usually upon retirement. The remaining nearly 55 percent of
openings will result from the need to replace workers who switch occupations.
The accuracy of employment projections is subject to error because of the many
unknown factors that will affect the economy over the projection period. Furthermore,
although employment projections and related job outlook information can greatly inform
career decisions, they should not be the sole basis for a choice of career.

14
Fastest-Growing Occupational Groups: Figure 9 shows the projected fastest-growing
occupational groups. Health care support occupations are expected to grow the most, at
21.7 percent. The next-fastest growing occupational group is personal care and service
occupations, at 13.8 percent. Two of the three fastest-growing occupational groups are
healthcare support and healthcare practitioners and technical occupations. See Appendix
Table G for a list of Ohio’s fastest-growing occupations.
Figure 9. Ohio Rate of Employment Change by Major Occupational Group, 2016-2026
Source: Ohio Bureau of Labor Market Information
Occupational Groups with the Most New Jobs: As with industries, fast-growing
occupational groups may be relatively small and may not add as many new jobs as larger
groups that are growing more slowly. The health care practitioners and technical
occupations group is expected to add 46,256 jobs, and the health care support
occupations group is expected to add 44,348 jobs. Almost one-third of new jobs will be in
these health care occupational groups. Figure 10 shows the major occupational groups
ranked in terms of number of jobs.
15
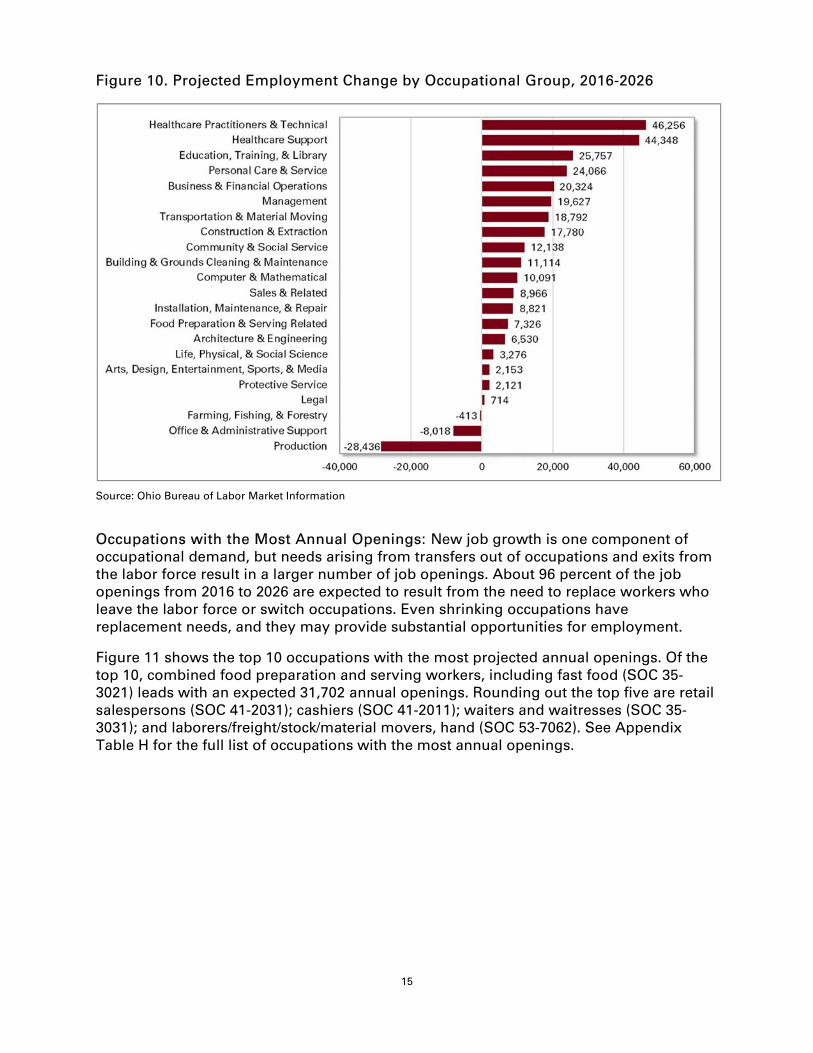
Figure 10. Projected Employment Change by Occupational Group, 2016-2026
Source: Ohio Bureau of Labor Market Information
Occupations with the Most Annual Openings: New job growth is one component of
occupational demand, but needs arising from transfers out of occupations and exits from
the labor force result in a larger number of job openings. About 96 percent of the job
openings from 2016 to 2026 are expected to result from the need to replace workers who
leave the labor force or switch occupations. Even shrinking occupations have
replacement needs, and they may provide substantial opportunities for employment.
Figure 11 shows the top 10 occupations with the most projected annual openings. Of the
top 10, combined food preparation and serving workers, including fast food (SOC 35-
3021) leads with an expected 31,702 annual openings. Rounding out the top five are retail
salespersons (SOC 41-2031); cashiers (SOC 41-2011); waiters and waitresses (SOC 35-
3031); and laborers/freight/stock/material movers, hand (SOC 53-7062). See Appendix
Table H for the full list of occupations with the most annual openings.

16
Figure 11. Occupations in Ohio with the Most Projected Annual Openings, 2016-2026
Median Wage9 Occupational Title Total May 2017
Comb. Food Prep. & Serv. Work, inc. Fast Food (SOC 35-3021) 31,702 $9.21
Retail Salespersons (SOC 41-2031) 22,607 $10.67
Cashiers (SOC 41-2011) 21,723 $9.31
Waiters and Waitresses (SOC 35-3031) 18,007 $9.25
Laborers/Freight/Stock/Material Movers, Hand (SOC 53-7062) 16,347 $12.92
Janitors & Cleaners, ex. Maids/Housekeeping Cleaners (SOC 37-2011) 12,606 $11.50
Home Health Aides (SOC 31-1011) 12,020 $10.33
Customer Service Representatives (SOC 43-4051) 11,757 $15.50
Stock Clerks and Order Fillers (SOC 43-5081) 11,107 $11.56
Office Clerks, General (SOC 43-9061) 10,498 $14.88
Source: Ohio Bureau of Labor Market Information
Self-Employment: The number of self-employed individuals varies widely by occupation.
Appendix Table I provides a list of the 57 occupations that have at least 1,000 self-
employed workers. The self-employed percentage ranges from 1 percent for
laborers/freight/stock/material movers, hand (SOC 53-7062) to 90.3 percent for door-to-
door sales workers, news and street vendors, and related workers (SOC 41-9091).
Figure 12 shows occupations in which more than half the people employed in that
occupation are self-employed.
9 Wage estimates are based on Ohio’s OES surveys.

17
Figure 12. Occupations with High Self-Employment, 2016
Occupational Title 2016
Employment Self-
Employed
Percent Self-
Employed Door-To-Door Sales, News/Street Vendors, &
Related Sales Workers (SOC 41-9091) 5,168 4,665 90.3%
Photographers (SOC 27-4021) 5,724 3,903 68.2%
Funeral Service Managers (SOC 11-9061) 1,316 876 66.6%
Writers and Authors (SOC 27-3043) 4,185 2,673 63.9%
Craft Artists (SOC 27-1012) 508 305 60.0%
Art Directors (SOC 27-1011) 2,889 1,716 59.4%
Multi-Media Artists and Animators (SOC 27-1014) 1,007 594 59.0%
Fine Artists, including Painters, Sculptors, &
Illustrators (SOC 27-1013) 1,784 1,045 58.6%
Managers, All Others (SOC 11-9199) 24,170 13,717 56.8%
Real Estate Brokers (SOC 41-9021) 1,623 917 56.5%
Real Estate Sales Agents (SOC 41-9022) 15,323 8,556 55.8%
Source: Ohio Bureau of Labor Market Information
Education and Training: Each occupation has typical education levels associated with it,
although in practice workers in an occupation may have a range of educational
experience. Some occupations have specific requirements associated with licensure or
certification. Knowledge of the typical education level associated with an occupation can
be useful for career planning and job seeking.
Figure 13 shows the distribution of jobs by their typical education level in 2016. That year,
about 64 percent of all jobs had a typical education level of a high school diploma or less.
Over 35 percent of jobs had a typical education level of some form of post-secondary
education, which could be anything from a certificate to an advanced degree. Over 24
percent of jobs had a bachelor’s degree or higher as a typical education.

18
Figure 13. 2016 Employment by Typical Education Levels
Source: Ohio Bureau of Labor Market Information
Figure 14 shows projected net job growth by education level. Thirty-six percent of the net
job growth from 2016 to 2026 is expected to be in occupations typically associated with a
high school diploma or less. Sixty-three percent of net job growth is anticipated in
occupations typically associated with some form of post-secondary education. A
predicted 47 percent of job growth will be in occupations typically associated with a
bachelor’s degree or higher. This represents an expected shift toward occupations
associated with higher education levels.
Figure 14. Projected Net Job Growth by Education Level, 2016-2026
Source: Ohio Bureau of Labor Market Information
Despite this expected shift, an anticipated 71.6 percent of annual job openings still will be
in occupations associated with a high school diploma or less. See Figure 15.

19
Figure 15. Estimated Annual Job Openings by Education Level, 2016-2026
Source: Ohio Bureau of Labor Market Information
For detailed data regarding annual openings for occupations with employment of 100 or
more, see Appendix Table J. This table also includes employment, wage, and education
and training information.
Appendix Table K provides a detailed list of the educational and training classifications
for all occupations.

20
Appendix Tables

21
Appendix Table A Ohio Business Types by Industry Sector
GOODS-PRODUCING (PRIVATE)
MINING & LOGGING Mining and support activities, oil and gas extraction, cutting and transporting
timber
CONSTRUCTION Construction of buildings; heavy and civil engineering (bridges, roads); and
specialty trade contractors (pouring concrete, site preparation, plumbing, painting,
and electrical work)
MANUFACTURING
Durable Goods Nonmetal and metal products, machinery, computers and electronics, appliances,
transportation equipment, furniture, medical, and wood products
Non-durable Goods Food, printing, chemicals (toiletries), plastics, textiles, paper, apparel, leather,
petroleum, and coal products
SERVICE-PROVIDING (PRIVATE)
TRADE, TRANSPORTATION, and UTILITIES Wholesale Trade Wholesalers of durable and nondurable goods, business to business electronic
markets, and sales representatives
Retail Trade Auto dealers, building and garden supply centers, furniture, electronic, appliance,
food, health, gasoline, clothing, sporting, hobby, book, and music stores
Transportation, Warehousing &
Utilities
Transportation (air, rail, water, truck, transit, pipeline, scenic, and sightseeing);
private postal services, couriers, warehousing, and storage; utilities (power,
natural gas distribution, water, and sewage)
INFORMATION Publishing, motion picture, sound recording, broadcasting, phone services, data
processing and hosting, news, libraries, and internet
FINANCIAL ACTIVITIES
Finance and Insurance Banks, securities, insurance, funds, and trusts
Real Estate, Rental, & Leasing Real estate agents; rental and leasing of automobiles, consumer goods, and
machinery
PROFESSIONAL & BUSINESS SERVICES Professional, Scientific, &
Technical Services
Legal services, accounting, bookkeeping, architectural, engineering, design,
computer system design, scientific research, advertising, marketing, photography,
translation, and veterinary
Management of Companies and
Enterprises
Holding companies, corporate offices, and management offices
Admin. Support & Waste Mgmt.
Services
Administrative management (hotel management) and facilities support;
employment placement, executive search, temporary help, and professional
employer organizations; document preparation, telephone call centers, collection
agencies, travel arrangement, security, pest control, janitorial, landscaping, carpet
cleaning, packing and labeling, trade show organizer, and auctioneers
EDUCATIONAL & HEALTH SERVICES Educational Services Private schools and universities and support services for education (college
selection, test preparation, and guidance counseling)
Health Care & Social Assistance Private ambulatory health, hospitals, nursing and residential care, and social
assistance (care for children, elderly, and disabled, emergency relief, vocational
and rehabilitation services)
LEISURE & HOSPITALITY
Arts, Entertainment, &
Recreation
Performing arts, spectator sports, museums, historical sites, zoos, parks,
amusement, and gambling
Accommodation & Food
Services
Hotels, RV parks, food, and drinking places
OTHER SERVICES Repair (autos, electronics, machinery, and appliances); personal (hair, nail, skin,
weight reduction, and tattoos); funeral homes; dry-cleaning and laundry services;
pet care, parking lots, astrology, coin machines, dating, escort, future telling, life
coaching, and personal fitness trainer; associations (churches, grant making,
social advocacy, and unions)
GOVERNMENT (PUBLIC)
Federal Government Civilian federal employees including the U.S. Postal Service
State Government Includes state universities and hospitals
Local Government Includes local schools, community colleges, and local hospitals; township, city,
and county employees such as fire fighters and park rangers

22
Appendix Table B Ohio Employment Projections Report by Major Industry, 2016–2026
Industry Title
2016
Annual
Employment
2026
Projected
Employment
Change in
Employment
2016-2026
Percent
Change
2016-2026
Total 5,793,823 6,047,156 253,333 4.4%
Goods-Producing Industries 997,420 978,204 -19,216 -1.9%
Agriculture, Forestry, Fishing and Hunting 95,392 94,553 -839 -0.9%
Mining 11,082 11,743 661 6.0%
Construction 205,953 227,427 21,474 10.4%
Manufacturing 684,993 644,481 -40,512 -5.9%
Service-Providing Industries 4,502,614 4,755,335 252,721 5.6%
Wholesale Trade 235,282 236,107 825 0.4%
Retail Trade 575,582 585,667 10,085 1.8%
Transportation and Warehousing 192,221 204,430 12,209 6.4%
Utilities 19,275 19,108 -167 -0.9%
Information 71,762 66,446 -5,316 -7.4%
Finance and Insurance 236,224 250,293 14,069 6.0%
Real Estate and Rental and Leasing 63,179 66,948 3,769 6.0%
Professional and Technical Services 257,130 266,681 9,551 3.7%
Management of Companies and Enterprises 138,338 152,421 14,083 10.2%
Administrative and Waste Services 327,078 352,871 25,793 7.9%
Educational Services 428,683 453,597 24,914 5.8%
Health Care and Social Assistance 820,391 956,022 135,631 16.5%
Arts, Entertainment and Recreation 78,114 83,031 4,917 6.3%
Accommodation and Food Services 473,566 473,383 -183 0.0%
Other Services (Except Government) 233,824 237,048 3,224 1.4%
Government 351,965 351,282 -683 -0.2%
Self-Employed and Unpaid Family Workers 293,789 313,617 19,828 6.8%
Source: Ohio Department of Job and Family Services, Bureau of Labor Market Information, September 2018.

23
Appendix Table C Ohio’s Top 30 Industries with the Fastest Job Growth, 2016–2026
NAICS
Code
Industry Title
2016*
Annual
Employment
2026*
Projected
Employment
Change in
Employment
2016-2026
Percent
Change
2016-2026
6216 Home Health Care Services 62,447 94,098 31,651 50.7%
6241 Individual and Family Services 57,970 81,269 23,299 40.2%
4533 Used Merchandise Stores 7,680 10,178 2,498 32.5%
6233 Community Care Facilities for the Elderly 36,862 48,380 11,518 31.3%
5313 Activities Related to Real Estate 20,216 26,056 5,840 28.9%
6223
Specialty (except Psychiatric and Substance
Abuse) Hospitals 8,027 10,285 2,258 28.1%
5611 Office Administrative Services 20,056 25,668 5,612 28.0%
6232 Residential Mental Health Facilities 30,574 38,786 8,212 26.9%
6213 Offices of Other Health Practitioners 32,179 40,410 8,231 25.6%
5621 Waste Collection 5,510 6,896 1,386 25.2%
6117 Educational Support Services 21,228 26,525 5,297 25.0%
6116 Other Schools and Instruction 10,770 13,406 2,636 24.5%
4541 Electronic Shopping and Mail Order Houses 18,960 23,586 4,626 24.4%
5416
Management, Scientific, and Technical Consulting
Services 30,729 38,030 7,301 23.8%
6219 Other Ambulatory Health Care Services 11,156 13,787 2,631 23.6%
4881 Support Activities for Air Transportation 5,171 6,368 1,197 23.2%
5417 Scientific Research and Development Services 19,650 24,104 4,454 22.7%
4248
Beer, Wine, and Distilled Alcoholic Beverage
Merchant Wholesalers 5,945 7,288 1,343 22.6%
8129 Other Personal Services 9,850 12,070 2,220 22.5%
6215 Medical and Diagnostic Laboratories 6,308 7,670 1,362 21.6%
5223 Activities Related to Credit Intermediation 13,760 16,616 2,856 20.8%
2131 Support Activities for Mining 4,763 5,739 976 20.5%
4442 Lawn and Garden Equipment and Supplies Stores 7,162 8,602 1,440 20.1%
6244 Child Day Care Services 32,856 39,237 6,381 19.4%
5629
Remediation and Other Waste Management
Services 5,846 6,967 1,121 19.2%
2212 Natural Gas Distribution 5,438 6,442 1,004 18.5%
5414 Specialized Design Services 6,812 7,996 1,184 17.4%
4539 Other Miscellaneous Store Retailers 10,856 12,708 1,852 17.1%
5112 Software Publishers 6,406 7,490 1,084 16.9%
4931 Warehousing and Storage 46,448 53,874 7,426 16.0%
* Industries with 5,000 or more workers.
Source: Ohio Department of Job and Family Services, Bureau of Labor Market Information, September 2018.

24
Appendix Table D Ohio’s Top 30 Industries with the Most New Jobs, 2016–2026
NAICS
Code
Industry Title
2016
Annual
Employment
2026
Projected
Employment
Change in
Employment
2016-2026
Percent
Change
2016-2026
6216 Home Health Care Services 62,447 94,098 31,651 50.7%
6221 General Medical and Surgical Hospitals 267,454 291,370 23,916 8.9%
6241 Individual and Family Services 57,970 81,269 23,299 40.2%
5511 Management of Companies and Enterprises 138,338 152,421 14,083 10.2%
6211 Offices of Physicians 90,330 102,250 11,920 13.2%
6233 Community Care Facilities for the Elderly 36,862 48,380 11,518 31.3%
6111 Elementary and Secondary Schools 276,445 287,652 11,207 4.1%
4523 Warehouse Clubs and Supercenters 77,337 87,528 10,191 13.2%
2382 Building Equipment Contractors 67,412 76,670 9,258 13.7%
5613 Employment Services 142,094 151,128 9,034 6.4%
6213 Offices of Other Health Practitioners 32,179 40,410 8,231 25.6%
6232
Residential Intellectual and Developmental
Disability, Mental Health, and Substance
Abuse Facilities 30,574 38,786 8,212 26.9%
4931 Warehousing and Storage 46,448 53,874 7,426 16.0%
5416
Management, Scientific, and Technical
Consulting Services 30,729 38,030 7,301 23.8%
6244 Child Day Care Services 32,856 39,237 6,381 19.4%
5242
Agencies, Brokerages, and Other Insurance
Related Activities 45,063 51,033 5,970 13.3%
5313 Activities Related to Real Estate 20,216 26,056 5,840 28.9%
5611 Office Administrative Services 20,056 25,668 5,612 28.0%
6113
Colleges, Universities, and Professional
Schools 95,652 101,070 5,418 5.7%
6117 Educational Support Services 21,228 26,525 5,297 25.0%
4541 Electronic Shopping and Mail Order Houses 18,960 23,586 4,626 24.4%
9991 Federal Government, Excluding Post Office 54,612 59,182 4,570 8.4%
5417
Scientific Research and Development
Services 19,650 24,104 4,454 22.7%
5617 Services to Buildings and Dwellings 71,742 76,084 4,342 6.1%
6214 Outpatient Care Centers 29,144 33,445 4,301 14.8%
5614 Business Support Services 35,562 39,464 3,902 11.0%
6212 Offices of Dentists 31,959 35,690 3,731 11.7%
8121 Personal Care Services 27,830 30,946 3,116 11.2%
7139 Other Amusement and Recreation Industries 42,320 45,424 3,104 7.3%
4461 Health and Personal Care Stores 36,915 39,920 3,005 8.1%
Industries expected to have the most new jobs and growth rates of at least 25 percent.
Source: Ohio Department of Job and Family Services, Bureau of Labor Market Information, September 2018.

25
Appendix Table E Ohio’s Industry Employment Projections Report, 2016–2026
NAICS
Code
Industry Title
2016*
Annual
Employment
2026*
Projected
Employment
Change in
Employment
2016-2026
Percent
Change
2016-2026
Total All Industries 5,793,823 6,047,156 253,333 4.4%
Agriculture, Forestry, Fishing, and Hunting 95,392 94,553 -839 -0.9%
Mining 11,082 11,743 661 6.0%
213 Support Activities for Mining 4,763 5,739 976 20.5%
Construction 205,953 227,427 21,474 10.4%
236 Construction of Buildings 45,011 50,070 5,059 11.2%
2361 Residential Building Construction 19,383 21,511 2,128 11.0%
2362 Nonresidential Building Construction 25,628 28,559 2,931 11.4%
237 Heavy and Civil Engineering Construction 27,018 28,426 1,408 5.2%
2371 Utility System Construction 14,879 15,031 152 1.0%
2373 Highway, Street, and Bridge Construction 9,798 10,960 1,162 11.9%
238 Specialty Trade Contractors 133,924 148,931 15,007 11.2%
2381 Building Foundation and Exterior Contractors 26,452 29,297 2,845 10.8%
2382 Building Equipment Contractors 67,412 76,670 9,258 13.7%
2383 Building Finishing Contractors 20,543 21,381 838 4.1%
2389 Other Specialty Trade Contractors 19,517 21,583 2,066 10.6%
Manufacturing 684,993 644,481 -40,512 -5.9%
311 Food Manufacturing 59,796 59,965 169 0.3%
3114
Fruit and Vegetable Preserving and Specialty
Manufacturing 10,918 12,017 1,099 10.1%
3115 Dairy Product Manufacturing 7,198 7,214 16 0.2%
3116 Animal Slaughtering and Processing 11,471 11,440 -31 -0.3%
3118 Bakeries and Tortilla Manufacturing 12,272 11,433 -839 -6.8%
3119 Other Food Manufacturing 10,463 10,801 338 3.2%
312 Beverage and Tobacco Product Manufacturing 8,410 8,309 -101 -1.2%
321 Wood Product Manufacturing 12,968 12,525 -443 -3.4%
3219 Other Wood Product Manufacturing 9,524 9,101 -423 -4.4%
322 Paper Manufacturing 19,855 18,083 -1,772 -8.9%
3222 Converted Paper Product Manufacturing 17,504 16,339 -1,165 -6.7%
323 Printing and Related Support Activities 21,608 17,679 -3,929 -18.2%
324 Petroleum and Coal Products Manufacturing 5,047 4,759 -288 -5.7%
325 Chemical Manufacturing 44,282 41,499 -2,783 -6.3%
3251 Basic Chemical Manufacturing 9,628 9,499 -129 -1.3%
3252 Resin, Rubber, and Artificial Fibers Manufacturing 5,558 5,206 -352 -6.3%
3255 Paint, Coating, and Adhesive Manufacturing 7,899 7,433 -466 -5.9%
3256 Soap, Cleaning Compound, and Toiletry Manufacturing 9,243 8,733 -510 -5.5%
326 Plastics and Rubber Products Manufacturing 56,685 50,099 -6,586 -11.6%
3261 Plastics Product Manufacturing 43,423 39,889 -3,534 -8.1%
3262 Rubber Product Manufacturing 13,262 10,210 -3,052 -23.0%
327 Nonmetallic Mineral Product Manufacturing 27,137 24,363 -2,774 -10.2%
3272 Glass and Glass Product Manufacturing 8,282 6,901 -1,381 -16.7%
3273 Cement and Concrete Product Manufacturing 5,776 5,493 -283 -4.9%
3279 Other Nonmetallic Mineral Product Manufacturing 7,775 7,545 -230 -3.0%
331 Primary Metal Manufacturing 36,821 32,443 -4,378 -11.9%
3311 Iron and Steel Mills and Ferroalloy Manufacturing 7,744 6,540 -1,204 -15.6%
3312 Steel Product Manufacturing from Purchased Steel 7,402 7,181 -221 -3.0%
3314 Other Nonferrous Metal Production 5,740 5,240 -500 -8.7%
3315 Foundries 12,655 10,629 -2,026 -16.0%
332 Fabricated Metal Product Manufacturing 98,413 95,830 -2,583 -2.6%
3321 Forging and Stamping 9,968 9,425 -543 -5.5%
3323 Architectural and Structural Metals Manufacturing 17,296 16,689 -607 -3.5%
3324 Boiler, Tank, and Shipping Container Manufacturing 7,708 7,756 48 0.6%
3327
Machine Shops; Turned Product; and Screw, Nut, and
Bolt Manufacturing 24,724 25,453 729 3.0%

26
Appendix Table E – cont’d. Ohio’s Industry Employment Projections Report, 2016-2026
NAICS
Code
Industry Title
2016*
Annual
Employment
2026*
Projected
Employment
Change in
Employment
2016-2026
Percent
Change
2016-2026
3328 Coating, Engraving, Heat Treating, and Allied Activities 12,643 11,928 -715 -5.7%
3329 Other Fabricated Metal Product Manufacturing 18,748 17,901 -847 -4.5%
333 Machinery Manufacturing 76,925 70,965 -5,960 -7.8%
3331
Agriculture, Construction, and Mining Machinery
Manufacturing 6,318 6,534 216 3.4%
3332 Industrial Machinery Manufacturing 9,674 8,220 -1,454 -15.0%
3334
Ventilation, Heating, Air-Conditioning, and Commercial
Refrigeration Equipment Manufacturing 6,646 5,697 -949 -14.3%
3335 Metalworking Machinery Manufacturing 22,411 20,933 -1,478 -6.6%
3339 Other General Purpose Machinery Manufacturing 24,270 22,642 -1,628 -6.7%
334 Computer and Electronic Product Manufacturing 20,410 18,060 -2,350 -11.5%
3344
Semiconductor and Other Electronic Component
Manufacturing 6,252 5,597 -655 -10.5%
3345
Navigational, Measuring, Electromedical, and Control
Instruments Manufacturing 10,700 9,770 -930 -8.7%
335
Electrical Equipment, Appliance, and Component
Manufacturing 27,426 24,808 -2,618 -9.6%
3353 Electrical Equipment Manufacturing 8,187 7,548 -639 -7.8%
3359
Other Electrical Equipment and Component
Manufacturing 6,824 6,509 -315 -4.6%
336 Transportation Equipment Manufacturing 125,354 123,325 -2,029 -1.6%
3361 Motor Vehicle Manufacturing 21,851 22,948 1,097 5.0%
3362 Motor Vehicle Body and Trailer Manufacturing 8,567 8,272 -295 -3.4%
3363 Motor Vehicle Parts Manufacturing 75,015 72,720 -2,295 -3.1%
3364 Aerospace Product and Parts Manufacturing 18,595 18,168 -427 -2.3%
337 Furniture and Related Product Manufacturing 15,514 15,689 175 1.1%
3371 Household and Institutional Furniture Manufacturing 11,282 11,556 274 2.4%
339 Miscellaneous Manufacturing 21,365 20,434 -931 -4.4%
3391 Medical Equipment and Supplies Manufacturing 8,779 9,003 224 2.6%
3399 Other Miscellaneous Manufacturing 12,586 11,431 -1,155 -9.2%
Wholesale Trade 235,282 236,107 825 0.4%
423 Merchant Wholesalers, Durable Goods 128,126 129,912 1,786 1.4%
4231
Motor Vehicle and Motor Vehicle Parts and Supplies
Merchant Wholesalers 14,597 14,901 304 2.1%
4233
Lumber and Other Construction Materials Merchant
Wholesalers 7,345 7,452 107 1.5%
4234
Professional and Commercial Equipment and Supplies
Merchant Wholesalers 25,093 23,851 -1,242 -5.0%
4235
Metal and Mineral (except Petroleum) Merchant
Wholesalers 10,109 11,659 1,550 15.3%
4236 Electrical and Electronic Goods Merchant Wholesalers 11,764 11,324 -440 -3.7%
4237
Hardware, and Plumbing and Heating Equipment and
Supplies Merchant Wholesalers 10,988 11,628 640 5.8%
4238
Machinery, Equipment, and Supplies Merchant
Wholesalers 32,363 33,476 1,113 3.4%
4239 Miscellaneous Durable Goods Merchant Wholesalers 12,711 12,927 216 1.7%
424 Merchant Wholesalers, Nondurable Goods 67,629 67,485 -144 -0.2%
4241 Paper and Paper Product Merchant Wholesalers 5,078 4,245 -833 -16.4%
4242 Drugs and Druggists' Sundries Merchant Wholesalers 7,052 6,197 -855 -12.1%
4244 Grocery and Related Product Wholesalers 24,472 26,500 2,028 8.3%
4246 Chemical and Allied Products Merchant Wholesalers 8,403 8,608 205 2.4%
4248
Beer, Wine, and Distilled Alcoholic Beverage Merchant
Wholesalers 5,945 7,288 1,343 22.6%
4249
Miscellaneous Nondurable Goods Merchant
Wholesalers 9,385 8,438 -947 -10.1%
425 Wholesale Electronic Markets and Agents and Brokers 39,527 38,710 -817 -2.1%

27
Appendix Table E – cont’d. Ohio’s Industry Employment Projections Report, 2016-2026
NAICS
Code
Industry Title
2016*
Annual
Employment
2026*
Projected
Employment
Change in
Employment
2016-2026
Percent
Change
2016-2026
Retail Trade 575,582 585,667 10,085 1.8%
441 Motor Vehicle and Parts Dealers 78,297 79,669 1,372 1.8%
4411 Automobile Dealers 49,358 51,719 2,361 4.8%
4413 Automotive Parts, Accessories, and Tire Stores 24,307 23,600 -707 -2.9%
442 Furniture and Home Furnishings Stores 13,344 12,547 -797 -6.0%
4421 Furniture Stores 7,106 6,346 -760 -10.7%
4422 Home Furnishings Stores 6,238 6,201 -37 -0.6%
443 Electronics and Appliance Stores 16,775 14,546 -2,229 -13.3%
444
Building Material and Garden Equipment and Supplies
Dealers 50,074 52,618 2,544 5.1%
4441 Building Material and Supplies Dealers 42,912 44,016 1,104 2.6%
4442 Lawn and Garden Equipment and Supplies Stores 7,162 8,602 1,440 20.1%
445 Food and Beverage Stores 105,100 105,851 751 0.7%
4451 Grocery Stores 94,025 94,626 601 0.6%
4452 Specialty Food Stores 6,768 6,671 -97 -1.4%
446 Health and Personal Care Stores 36,915 39,920 3,005 8.1%
447 Gasoline Stations 36,980 39,132 2,152 5.8%
448 Clothing and Clothing Accessories Stores 39,621 34,235 -5,386 -13.6%
4481 Clothing Stores 28,880 24,224 -4,656 -16.1%
4482 Shoe Stores 6,285 5,829 -456 -7.3%
451 Sporting Goods, Hobby, Book, and Music Stores 21,365 22,432 1,067 5.0%
4511 Sporting Goods, Hobby, and Musical Instrument Stores 18,911 20,595 1,684 8.9%
452 General Merchandise Stores 118,399 123,276 4,877 4.1%
4522 Department Stores 41,062 35,748 -5,314 -12.9%
4523 Warehouse Clubs and Supercenters 77,337 87,528 10,191 13.2%
453 Miscellaneous Store Retailers 29,965 31,052 1,087 3.6%
4532 Office Supplies, Stationery, and Gift Stores 8,554 5,875 -2,679 -31.3%
4533 Used Merchandise Stores 7,680 10,178 2,498 32.5%
4539 Other Miscellaneous Store Retailers 10,856 12,708 1,852 17.1%
454 Nonstore Retailers 28,747 30,389 1,642 5.7%
4541 Electronic Shopping and Mail Order Houses 18,960 23,586 4,626 24.4%
4542 Vending Machine Operators 5,424 2,950 -2,474 -45.6%
Transportation and Warehousing 192,221 204,430 12,209 6.4%
481 Air Transportation 10,299 10,981 682 6.6%
4812 Nonscheduled Air Transportation 6,102 6,617 515 8.4%
484 Truck Transportation 71,376 73,063 1,687 2.4%
4841 General Freight Trucking 54,114 55,369 1,255 2.3%
4842 Specialized Freight Trucking 17,262 17,694 432 2.5%
485 Transit and Ground Passenger Transportation 10,501 11,673 1,172 11.2%
4854 School and Employee Bus Transportation 4,535 5,229 694 15.3%
488 Support Activities for Transportation 19,625 19,888 263 1.3%
4881 Support Activities for Air Transportation 5,171 6,368 1,197 23.2%
4885 Freight Transportation Arrangement 7,142 6,039 -1,103 -15.4%
492 Couriers and Messengers 23,328 24,324 996 4.3%
4921 Couriers 21,782 22,557 775 3.6%
493 Warehousing and Storage 46,448 53,874 7,426 16.0%
Utilities 19,275 19,108 -167 -0.9%
2211 Power Generation and Supply 12,605 11,473 -1,132 -9.0%
2212 Natural Gas Distribution 5,438 6,442 1,004 18.5%
Information 71,762 66,446 -5,316 -7.4%
511 Publishing Industries, except Internet 22,703 19,618 -3,085 -13.6%
5111 Newspaper, Periodical, Book, and Directory Publishers 16,297 12,128 -4,169 -25.6%
5112 Software Publishers 6,406 7,490 1,084 16.9%
512 Motion Picture and Sound Recording Industries 5,998 6,696 698 11.6%

28
Appendix Table E – cont’d. Ohio’s Industry Employment Projections Report, 2016-2026
NAICS
Code
Industry Title
2016*
Annual
Employment
2026*
Projected
Employment
Change in
Employment
2016-2026
Percent
Change
2016-2026
5121 Motion Picture and Video Industries 5,820 6,533 713 12.3%
515 Broadcasting, except Internet 6,385 5,768 -617 -9.7%
517 Telecommunications 24,345 20,875 -3,470 -14.3%
5173 Telecommunications Carriers, except Satellite 21,671 18,698 -2,973 -13.7%
518 Data Processing, Hosting, and Related Services 6,586 7,457 871 13.2%
519 Other Information Services 5,745 6,032 287 5.0%
Finance and Insurance 236,224 250,293 14,069 6.0%
522 Credit Intermediation and Related Activities 92,603 95,412 2,809 3.0%
5221 Depository Credit Intermediation 58,690 56,638 -2,052 -3.5%
5222 Nondepository Credit Intermediation 20,153 22,158 2,005 10.0%
5223 Activities Related to Credit Intermediation 13,760 16,616 2,856 20.8%
523
Securities, Commodity Contracts, and Other Financial
Investments and Related Activities 18,209 22,551 4,342 23.9%
5231
Securities and Commodity Contracts Intermediation and
Brokerage 9,186 8,713 -473 -5.2%
524 Insurance Carriers and Related Activities 124,247 131,360 7,113 5.7%
5241 Insurance Carriers 79,184 80,327 1,143 1.4%
5242
Agencies, Brokerages, and Other Insurance Related
Activities 45,063 51,033 5,970 13.3%
Real Estate and Rental and Leasing 63,179 66,948 3,769 6.0%
531 Real Estate 44,114 48,727 4,613 10.5%
5311 Lessors of Real Estate 17,204 16,644 -560 -3.3%
5312 Offices of Real Estate Agents and Brokers 6,694 6,027 -667 -10.0%
5313 Activities Related to Real Estate 20,216 26,056 5,840 28.9%
532 Rental and Leasing Services 18,520 17,663 -857 -4.6%
5321 Automotive Equipment Rental and Leasing 6,741 6,089 -652 -9.7%
5322 Consumer Goods Rental 6,467 5,809 -658 -10.2%
Professional, Scientific, and Technical Services 257,130 266,681 9,551 3.7%
5411 Legal Services 32,418 28,598 -3,820 -11.8%
5412
Accounting, Tax Preparation, Bookkeeping, and Payroll
Services 31,374 30,565 -809 -2.6%
5413 Architectural, Engineering, and Related Services 40,958 43,581 2,623 6.4%
5414 Specialized Design Services 6,812 7,996 1,184 17.4%
5415 Computer Systems Design and Related Services 59,438 59,092 -346 -0.6%
5416
Management, Scientific, and Technical Consulting
Services 30,729 38,030 7,301 23.8%
5417 Scientific Research and Development Services 19,650 24,104 4,454 22.7%
5418 Advertising, Public Relations, and Related Services 13,617 13,872 255 1.9%
5419 Other Professional, Scientific, and Technical Services 22,134 20,843 -1,291 -5.8%
Management of Companies and Enterprises 138,338 152,421 14,083 10.2%
Administrative and Support and Waste Management
and Remediation Services 327,078 352,871 25,793 7.9%
561 Administrative and Support Services 311,038 335,043 24,005 7.7%
5611 Office Administrative Services 20,056 25,668 5,612 28.0%
5613 Employment Services 142,094 151,128 9,034 6.4%
5614 Business Support Services 35,562 39,464 3,902 11.0%
5616 Investigation and Security Services 23,952 25,878 1,926 8.0%
5617 Services to Buildings and Dwellings 71,742 76,084 4,342 6.1%
5619 Other Support Services 10,626 10,114 -512 -4.8%
562 Waste Management and Remediation Service 16,040 17,828 1,788 11.2%
5621 Waste Collection 5,510 6,896 1,386 25.2%
5629 Remediation and Other Waste Services 5,846 6,967 1,121 19.2%

29
Appendix Table E – cont’d. Ohio’s Industry Employment Projections Report, 2016-2026
NAICS
Code
Industry Title
2016*
Annual
Employment
2026*
Projected
Employment
Change in
Employment
2016-2026
Percent
Change
2016-2026
Educational Services 428,683 453,597 24,914 5.8%
6111 Elementary and Secondary Schools 276,445 287,652 11,207 4.1%
6112 Junior Colleges 19,781 20,639 858 4.3%
6113 Colleges, Universities, and Professional Schools 95,652 101,070 5,418 5.7%
6116 Other Schools and Instruction 10,770 13,406 2,636 24.5%
6117 Educational Support Services 21,228 26,525 5,297 25.0%
Health Care and Social Assistance 820,391 956,022 135,631 16.5%
621 Ambulatory Health Care Services 263,523 327,350 63,827 24.2%
6211 Offices of Physicians 90,330 102,250 11,920 13.2%
6212 Offices of Dentists 31,959 35,690 3,731 11.7%
6213 Offices of Other Health Practitioners 32,179 40,410 8,231 25.6%
6214 Outpatient Care Centers 29,144 33,445 4,301 14.8%
6215 Medical and Diagnostic Laboratories 6,308 7,670 1,362 21.6%
6216 Home Health Care Services 62,447 94,098 31,651 50.7%
6219 Other Ambulatory Health Care Services 11,156 13,787 2,631 23.6%
622 Hospitals 280,332 306,854 26,522 9.5%
6221 General Medical and Surgical Hospitals 267,454 291,370 23,916 8.9%
6222 Psychiatric and Substance Abuse Hospitals 4,851 5,199 348 7.2%
6223
Specialty (except Psychiatric and Substance Abuse)
Hospitals 8,027 10,285 2,258 28.1%
623 Nursing and Residential Care Facilities 168,436 181,796 13,360 7.9%
6231 Nursing Care Facilities 96,150 90,385 -5,765 -6.0%
6232
Residential Intellectual & Developmental Disability,
Mental Health, and Substance Abuse Facilities 30,574 38,786 8,212 26.9%
6233 Community Care Facilities for the Elderly 36,862 48,380 11,518 31.3%
624 Social Assistance 108,100 140,022 31,922 29.5%
6241 Individual and Family Services 57,970 81,269 23,299 40.2%
6242
Community Food and Housing, and Emergency and
Other Relief Services 6,288 6,927 639 10.2%
6243 Vocational Rehabilitation Services 10,986 12,589 1,603 14.6%
6244 Child Day Care Services 32,856 39,237 6,381 19.4%
Arts, Entertainment, and Recreation 78,114 83,031 4,917 6.3%
711 Performing Arts, Spectator Sports, and Related Industries 14,381 14,999 618 4.3%
7113 Promoters of Performing Arts and Sports 5,520 6,318 798 14.5%
712 Museums, Historical Sites, and Similar Institutions 7,512 8,364 852 11.3%
713 Amusement, Gambling, and Recreation Industries 56,221 59,668 3,447 6.1%
7131 Amusement Parks and Arcades 6,122 6,116 -6 -0.1%
7132 Gambling Industries 7,779 8,128 349 4.5%
7139 Other Amusement and Recreation Industries 42,320 45,424 3,104 7.3%
Accommodation and Food Services 473,566 473,383 -183 0.0%
721 Accommodation, including Hotels and Motels 36,960 39,124 2,164 5.9%
7211 Traveler Accommodation 35,037 37,056 2,019 5.8%
722 Food Services and Drinking Places 436,606 434,259 -2,347 -0.5%
7223 Special Food Services 18,447 20,901 2,454 13.3%
7224 Drinking Places (Alcoholic Beverages) 15,036 13,570 -1,466 -9.8%
7225 Restaurants and Other Eating Places 403,123 399,788 -3,335 -0.8%
Other Services (Except Government) 233,824 237,048 3,224 1.4%
811 Repair and Maintenance 46,958 49,302 2,344 5.0%
8111 Automotive Repair and Maintenance 32,434 33,751 1,317 4.1%
8113
Commercial and Industrial Machinery and Equipment
(except Automotive and Electronic) Repair and
Maintenance 9,054 10,311 1,257 13.9%
812 Personal and Laundry Services 55,841 61,294 5,453 9.8%
8121 Personal Care Services 27,830 30,946 3,116 11.2%
8122 Death Care Services 6,910 6,953 43 0.6%

30
Appendix Table E – cont’d. Ohio’s Industry Employment Projections Report, 2016-2026
NAICS
Code
Industry Title
2016*
Annual
Employment
2026*
Projected
Employment
Change in
Employment
2016-2026
Percent
Change
2016-2026
8123 Drycleaning and Laundry Services 11,251 11,325 74 0.7%
8129 Other Personal Services 9,850 12,070 2,220 22.5%
813
Religious, Grantmaking, Civic, Professional, and Similar
Organizations 111,435 109,921 -1,514 -1.4%
8131 Religious Organizations 67,095 67,246 151 0.2%
8133 Social Advocacy Organizations 4,926 5,172 246 5.0%
8134 Civic and Social Organizations 20,427 19,743 -684 -3.4%
814 Private Households 19,590 16,531 -3,059 -15.6%
Government 351,965 351,282 -683 -0.2%
Postal Service 22,884 19,378 -3,506 -15.3%
Federal Government, Excluding Post Office 54,612 59,182 4,570 8.4%
State Government, Excluding Education and Hospitals 53,265 50,426 -2,839 -5.3%
Local Government, Excluding Education and Hospitals 221,204 222,296 1,092 0.5%
Self-Employed and Unpaid Family Workers, All Jobs 293,789 313,617 19,828 6.8%
* Industries with 5,000 or more workers.
Source: Ohio Department of Job and Family Services, Bureau of Labor Market Information, September 2018.

31
Appendix Table F Ohio Occupational Employment Projections by Occupational Group, 2016–
2026
Employment Change in
2016 2026 Employment Annual Openings
Occupational Title Annual Projected 2016 - 2026 Percent Growth Exit Transfers Total
Total, All Occupations 5,793,823 6,047,156 253,333 4.4% 25,333 274,557 364,606 664,496
Management Occupations 355,489 375,116 19,627 5.5% 1,963 11,764 15,984 29,711
Business & Financial Operations
Occupations 282,682 303,006 20,324 7.2% 2,032 8,531 17,201 27,764
Computer & Mathematical
Occupations 147,225 157,316 10,091 6.9% 1,009 2,578 7,267 10,854
Architecture & Engineering
Occupations 96,728 103,258 6,530 6.8% 653 2,457 4,469 7,579
Life, Physical, & Social Science
Occupations 37,253 40,529 3,276 8.8% 328 1,020 2,412 3,760
Community & Social Service
Occupations 101,986 114,124 12,138 11.9% 1,214 4,394 7,090 12,698
Legal Occupations 35,984 36,698 714 2.0% 71 896 1,268 2,235
Education, Training, & Library
Occupations 315,378 341,135 25,757 8.2% 2,576 13,412 13,365 29,353
Arts, Design, Entertainment,
Sports, & Media Occupations 87,126 89,279 2,153 2.5% 215 3,703 4,734 8,652
Healthcare Practitioners &
Technical Occupations 371,975 418,231 46,256 12.4% 4,626 10,557 10,163 25,346
Healthcare Support Occupations 204,376 248,724 44,348 21.7% 4,435 12,977 12,257 29,669
Protective Service Occupations 118,191 120,312 2,121 1.8% 212 5,926 6,651 12,789
Food Preparation & Serving
Related Occupations 507,785 515,111 7,326 1.4% 733 39,007 48,397 88,137
Building & Grounds Cleaning &
Maintenance Occupations 195,352 206,466 11,114 5.7% 1,111 12,160 12,797 26,068
Personal Care & Service
Occupations 174,752 198,818 24,066 13.8% 2,407 14,002 13,098 29,507
Sales & Related Occupations 551,916 560,882 8,966 1.6% 897 31,994 42,440 75,331
Office & Administrative Support
Occupations 840,532 832,514 -8,018 -1.0% -802 42,566 49,986 91,750
Farming, Fishing, & Forestry
Occupations 13,947 13,534 -413 -3.0% -41 504 1,523 1,986
Construction & Extraction
Occupations 212,889 230,669 17,780 8.4% 1,778 7,781 14,597 24,156
Installation, Maintenance, &
Repair Occupations 223,384 232,205 8,821 3.9% 882 7,922 13,320 22,124
Production Occupations 503,651 475,215 -28,436 -5.6% -2,844 19,361 34,971 51,488
Transportation & Material
Moving Occupations 415,222 434,014 18,792 4.5% 1,879 21,046 30,617 53,542
Source: Ohio Department of Job and Family Services, Bureau of Labor Market Information, September 2018.

32
Appendix Table G Ohio’s Fastest Growing Occupations*, 2016–2026
Occupational Title
Percent
Change
Total Annual
Openings
Median Wage**
May 17
Home Health Aides (SOC 31-1011) 43.7% 12,020 $10.33
Personal and Home Care Aides (SOC 39-9021) 36.5% 6,241 $10.61
Statisticians (SOC 15-2041) 34.4% 85 $40.31
Physician Assistants (29-1071) 31.0% 294 $49.40
Nurse Practitioners (29-1171) 29.7% 574 $47.65
Occupational Therapist Assistants (SOC 31-2011) 27.5% 576 $28.19
Physical Therapist Assistants (SOC 31-2021) 27.3% 1,005 $27.63
Massage Therapists (SOC 31-9011) 26.9% 450 $16.58
Information Security Analysts (SOC 15-1122) 25.8% 292 $42.62
Respiratory Therapists (SOC 29-1126) 25.0% 504 $26.49
Operations Research Analysts (SOC 15-2031) 24.4% 346 $38.74
Actuaries (SOC 15-2011) 22.3% 99 $45.23
Personal Financial Advisors (SOC 13-2052) 21.7% 780 $39.12
Mental Health Counselors (SOC 21-1014) 21.6% 700
Physical Therapists (SOC 29-1123) 21.5% 537 $41.25
Occupational Therapists (SOC 29-1122) 21.1% 367 $40.13
Health Specialties Teachers, Postsecondary (SOC 25-1071) 20.9% 875 $84,980 ††
Nursing Instructors and Teachers, Postsecondary (SOC 25-1072) 20.8% 327 $67,990 ††
Ambulance Drivers & Attendants, Ex. EMT (SOC 53-3011) 20.6% 163 $10.83
Phlebotomists (SOC 31-9097) 20.5% 722 $15.56
Residential Advisors (SOC 39-9041) 20.4% 616 $13.28
Biological Scientists, All Other (SOC 19-1029) 20.3% 100 $25.96
Medical Assistants (SOC 31-9092) 20.0% 3,146 $14.72
Diagnostic Medical Sonographers (SOC 29-2032) 19.6% 165 $30.30
Market Research Analysts and Marketing Specialists (SOC 13-1161) 19.4% 2,766 $28.87
Physical Therapist Aides (SOC 31-2022) 19.2% 136 $13.10
Nonfarm Animal Caretakers (SOC 39-2021) 19.0% 1,502 $9.86
Appraisers and Assessors of Real Estate (SOC 13-2021) 18.4% 198 $26.76
Preschool Teachers, Except Special Education (SOC 25-2011) 17.9% 1,572 $11.80
Software Developers, Applications (SOC 15-1132) 17.5% 3,011 $42.89
Social and Community Service Managers (SOC 11-9151) 17.4% 505 $32.21
Education Admin., Pre- & Child Care Center/Prog. (SOC 11-9031) 17.3% 258 $18.60
Athletic Trainers (SOC 29-9091) 17.3% 91 $46,570 ††
Roustabouts, Oil and Gas (SOC 47-5071) 17.3% 105 $16.92
Education, Training, and Library Workers, All Other (SOC 25-9099) 17.1% 428 $19.36
* Occupations with at least 500 employment.
** Wage estimates were based on Ohio’s OES surveys.
†† Certain occupations only report wages at the annual level - for elementary and secondary teachers this typically reflects
a 9 1/2-month school year.
Wage data unavailable - OES consolidated these occupations in 2017.
Source: Ohio Department of Job and Family Services, Bureau of Labor Market Information, September 2018.

33
Appendix Table H Occupations in Ohio with the Most Annual Openings, 2016–2026
Occupational Title*
Total Annual
Openings
Median Wage**
May 2017
Comb. Food Prep. & Serv. Work, inc. Fast Food (SOC 35-3021) 31,702 $9.21
Retail Salespersons (SOC 41-2031) 22,607 $10.67
Cashiers (SOC 41-2011) 21,723 $9.31
Waiters and Waitresses (SOC 35-3031) 18,007 $9.25
Laborers/Freight/Stock/Material Movers, Hand (SOC 53-7062) 16,347 $12.92
Janitors & Cleaners, ex. Maids/Housekeeping Cleaners (SOC 37-2011) 12,606 $11.50
Home Health Aides (SOC 31-1011) 12,020 $10.33
Customer Service Representatives (SOC 43-4051) 11,757 $15.50
Stock Clerks and Order Fillers (SOC 43-5081) 11,107 $11.56
Office Clerks, General (SOC 43-9061) 10,498 $14.88
Registered Nurses (SOC 29-1141) 8,848 $30.43
Truck Drivers, Heavy and Tractor-Trailer (SOC 53-3032) 8,465 $20.09
Nursing Assistants (SOC 31-1014) 8,184 $12.54
Secretaries, Except Legal, Medical, and Executive (SOC 43-6014) 7,758 $16.62
Bookkeeping, Accounting, and Auditing Clerks (SOC 43-3031) 6,928 $18.13
Packers and Packagers, Hand (SOC 53-7064) 6,546 $10.98
Child Care Workers (SOC 39-9011) 6,386 $9.86
Personal and Home Care Aides (SOC 39-9021) 6,241 $10.61
Landscaping and Groundskeeping Workers (SOC 37-3011) 5,908 $12.67
Maintenance and Repair Workers, General (SOC 49-9071) 5,895 $18.87
Farmers, Ranchers, and Other Agricultural Managers (SOC 11-9013) 5,852 $35.11
First-Line Sup/Mgrs of Retail Sales Workers (SOC 41-1011) 5,793 $17.60
General and Operations Managers (SOC 11-1012) 5,791 $44.77
Maids and Housekeeping Cleaners (SOC 37-2012) 5,413 $10.13
Cooks, Restaurant (SOC 35-2014) 5,359 $11.40
Medical Secretaries (SOC 43-6013) 5,278 $15.52
Construction Laborers (SOC 47-2061) 5,142 $18.75
Sales Rep., Wholesale/Mfg, ex. Tech./Sci. Prod. (SOC 41-4012) 5,121 $27.59
FL Sup/Mgrs of Food Prep. & Serving Workers (SOC 35-1012) 5,036 $14.93
First-Line Sup/Mgrs of Office & Admin. Support (SOC 43-1011) 4,529 $25.52
Accountants and Auditors (SOC 13-2011) 4,493 $31.02
* Certain Occupations are abbreviated.
Abbreviations:
AO = All Other
FL Sup/Mgrs = First-Line Supervisors/Managers
M/P = Metal and Plastic
PS = Postsecondary
O/T = Operators and Tenders
S/O/T = Setters, Operators and Tenders
** Wage estimates were based on Ohio’s OES surveys.
Source: Ohio Department of Job and Family Services, Bureau of Labor Market Information, September 2018.

34
Appendix Table I Ohio Occupations with at least 1,000 Self-Employed, 2016–2026
Occupational Title
2016
Employment Self-Employed
Percent Self-
Employed
Managers, All Other (SOC 11-9199) 24,170 13,717 56.8%
Hairdressers, Hairstylists, and Cosmetologists (SOC 39-5012) 30,193 12,940 42.9%
First-Line Sup/Mgrs of Retail Sales Workers (SOC 41-1011) 53,622 12,204 22.8%
Child Care Workers (SOC 39-9011) 41,155 11,853 28.8%
Construction Laborers (SOC 47-2061) 45,157 11,314 25.1%
Landscaping and Groundskeeping Workers (SOC 37-3011) 45,531 9,962 21.9%
Carpenters (SOC 47-2031) 28,110 9,326 33.2%
Real Estate Sales Agents (SOC 41-9022) 15,323 8,556 55.8%
Truck Drivers, Heavy and Tractor-Trailer (SOC 53-3032) 76,084 6,044 7.9%
Construction Managers (SOC 11-9021) 15,213 5,755 37.8%
Retail Salespersons (SOC 41-2031) 159,133 5,024 3.2%
Maids and Housekeeping Cleaners (SOC 37-2012) 40,548 4,980 12.3%
First-Line Sup/Mgrs of Non-Retail Sales Workers (SOC 41-1012) 13,195 4,857 36.8%
Door-To-Door Sales, News/St. Vendors, & Rel. (SOC 41-9091) 5,168 4,665 90.3%
Taxi Drivers and Chauffeurs (SOC 53-3041) 11,650 4,226 36.3%
Lawyers (SOC 23-1011) 20,148 4,112 20.4%
Painters, Construction and Maintenance (SOC 47-2141) 9,405 3,979 42.3%
Food Service Managers (SOC 11-9051) 11,493 3,909 34.0%
Photographers (SOC 27-4021) 5,724 3,903 68.2%
Insurance Sales Agents (SOC 41-3021) 21,025 3,864 18.4%
Management Analysts (SOC 13-1111) 21,549 3,748 17.4%
Property, Real Estate & Community Assn Mgrs (SOC 11-9141) 8,940 3,724 41.7%
Automotive Service Technicians and Mechanics 9SOC 49-.3023) 28,328 3,722 13.1%
Janitors & Cleaners, ex. Maids/Housekeeping Cleaners (SOC 37-2011) 91,100 3,470 3.8%
Accountants and Auditors (SOC 13-2011) 47,433 3,178 6.7%
Truck Drivers, Light or Delivery Services (SOC 53-3033) 37,947 2,986 7.9%
Writers and Authors (SOC 27-3043) 4,185 2,673 63.9%
FL Sup/Mgrs of Landscape/Lawn Ser/Groundskeeping (SOC 37-1012) 6,423 2,595 40.4%
Bookkeeping, Accounting, and Auditing Clerks (SOC 43-3031) 66,288 2,494 3.8%
Musicians and Singers (SOC 27-2042) 6,488 2,290 35.3%
First-Line Sup/Mgrs of Personal Serv. Workers (SOC 39-1021) 8,226 2,156 26.2%
Self-Enrichment Education Teachers (SOC 25-3021) 10,462 2,066 19.7%
FL Sup/Mgrs of Housekeeping & Janitorial Workers (SOC 37-1011) 6,901 2,021 29.3%
Plumbers, Pipefitters, and Steamfitters (SOC 47-2152) 16,071 2,020 12.6%
Electricians (SOC 47-2111) 24,524 1,990 8.1%
Driver/Sales Workers (SOC 53-3031) 24,089 1,944 8.1%
Sales Rep., Wholesale/Mfg, ex. Tech./Sci. Prod. (SOC 41-4012) 50,220 1,922 3.8%
Personal Financial Advisors (SOC 13-2052) 7,554 1,836 24.3%
Art Directors (SOC 27-1011) 2,889 1,716 59.4%
First-Line Sup/Mgrs of Con. Trades/Extract. Work (SOC 47-1011) 16,026 1,630 10.2%
Chief Executives (SOC 11-1011) 7,038 1,606 22.8%
Graphic Designers (SOC 27-1024) 8,738 1,594 18.2%
Substitute Teachers (SOC 25-3098) 19,045 1,539 8.1%
Nonfarm Animal Caretakers (SOC 39-2021) 8,242 1,510 18.3%
Nursing Assistants (SOC 31-1014) 68,537 1,364 2.0%
Home Health Aides (SOC 31-1011) 67,055 1,341 2.0%
Massage Therapists (SOC 31-9011) 3,175 1,250 39.4%
Brickmasons and Blockmasons (SOC 47-2021) 4,062 1,210 29.8%
Roofers (SOC 47-2181) 5,757 1,204 20.9%
Laborers/Freight/Stock/Material Movers, Hand (SOC 53-7062) 111,616 1,160 1.0%
Merchandise Displayers and Window Trimmers (SOC 27-1026) 5,903 1,144 19.4%
Personal and Home Care Aides (SOC 39-9021) 30,913 1,117 3.6%
Heating, AC, & Refrigeration Mechanics/Installers (SOC 49-9021) 11,788 1,071 9.1%
Coaches and Scouts (SOC 27-2022) 10,608 1,066 10.0%
Fine Artists, inc. Painters, Sculptors & Illustrators (SOC 27-1013) 1,784 1,045 58.6%
Refuse and Recyclable Material Collectors (SOC 53-7081) 7,230 1,018 14.1%
Recreation Workers (SOC 39-9032) 14,532 1,010 7.0%
The all-occupation average of self-employed individuals was 6.7 percent.
Source: Ohio Department of Job and Family Services, Bureau of Labor Market Information, September 2018.

35
Appendix Table J Ohio Occupational Employment* Projections Report, 2016–2026
Employment Change in Median
2016 2026 Employment Annual Openings Wage***
Code Occupational Title** Annual Projected 2016-2026 Percent Growth Exit Transfers Total May 2017
00-0000 Total, All Occupations 5,793,823 6,047,156 253,333 4.4% 25,333 274,557 364,606 664,496 $17.55
11-0000 Management Occupations 355,489 375,116 19,627 5.5% 1,963 11,764 15,984 29,711 $45.76
11-1011 Chief Executives 7,038 6,537 -501 -7.1% -50 196 278 424 $91.62
11-1021 General and Operations Managers 65,768 69,370 3,602 5.5% 360 1,401 4,030 5,791 $44.77
11-1031 Legislators 3,433 3,524 91 2.7% 9 94 146 249 $19,190 ††
11-2011 Advertising and Promotions Managers 486 504 18 3.7% 2 13 37 52 $39.96
11-2021 Marketing Managers 5,631 6,069 438 7.8% 44 133 355 532 $57.03
11-2022 Sales Managers 11,958 12,475 517 4.3% 52 278 742 1,072 $56.88
11-2031 Public Relations Managers 1,841 2,003 162 8.8% 16 42 110 168 $48.33
11-3011 Administrative Services Managers 9,938 10,657 719 7.2% 72 308 504 884 $40.52
11-3021 Computer and Information Systems Managers 13,506 14,126 620 4.6% 62 243 753 1,058 $59.26
11-3031 Financial Managers 21,513 25,128 3,615 16.8% 362 536 1,154 2,052 $55.81
11-3051 Industrial Production Managers 10,949 10,818 -131 -1.2% -13 254 497 738 $46.23
11-3061 Purchasing Managers 2,520 2,682 162 6.4% 16 76 128 220 $54.81
11-3071 Transportation, Storage, and Distribution Managers 5,398 5,804 406 7.5% 41 128 291 460 $41.85
11-3111 Compensation and Benefits Managers 572 593 21 3.7% 2 13 28 43 $53.53
11-3121 Human Resources Managers 4,314 4,664 350 8.1% 35 111 241 387 $50.18
11-3131 Training and Development Managers 795 855 60 7.5% 6 23 49 78 $47.66
11-9013 Farmers, Ranchers, and Other Agricultural Managers 80,348 80,065 -283 -0.4% -28 4,689 1,191 5,852 $35.11
11-9021 Construction Managers 15,213 16,552 1,339 8.8% 134 364 706 1,204 $43.66
11-9031 Education Admin., Pre & Child Care Center/Prog. 2,648 3,107 459 17.3% 46 81 131 258 $18.60
11-9032 Education Admin., Elem. & Secondary School 9,451 10,077 626 6.6% 63 274 444 781 $86,230 ††
11-9033 Education Administrators, Postsecondary 4,780 5,055 275 5.8% 28 138 224 390 $44.19
11-9039 Education Administrators, All Other 1,011 1,148 137 13.6% 14 30 49 93 $37.76
11-9041 Engineering Managers 6,586 6,983 397 6.0% 40 137 326 503 $60.84
11-9051 Food Service Managers 11,493 11,851 358 3.1% 36 369 861 1,266 $23.28
11-9061 Funeral service Managers 1,316 1,387 71 5.4% 7 37 57 101 $39.07
11-9081 Lodging Managers 1,225 1,292 67 5.5% 7 43 81 131 $19.49
11-9111 Medical and Health Services Managers 16,073 18,607 2,534 15.8% 253 471 846 1,570 $43.67
11-9121 Natural Sciences Managers 1,143 1,303 160 14.0% 16 28 69 113 $58.40
11-9131 Postmasters and Mail Superintendents 489 377 -112 -22.9% -11 12 18 19 $36.53
11-9141 Property, Real Estate & Community Assn Mgrs 8,940 9,876 936 10.5% 94 390 315 799 $24.32
11-9151 Social and Community Service Managers 4,594 5,393 799 17.4% 80 164 261 505 $32.21
11-9161 Emergency Management Directors 310 334 24 7.7% 2 12 12 26 $30.82
11-9199 Managers, All Other 24,170 25,859 1,689 7.0% 169 677 1,050 1,896 $47.61
13-0000 Business & Financial Operations Occupations 282,682 303,006 20,324 7.2% 2,032 8,531 17,201 27,764 $30.20
13-1011 Agents/Business Mgrs. Artist/Performer/Athlete 116 151 35 30.2% 4 6 10 20 $21.33
13-1021 Purchasing Agents and Buyers, Farm Products 337 312 -25 -7.4% -2 15 22 35 13-1022 Wholesale and Retail Buyers, Except Farm Products 4,895 4,737 -158 -3.2% -16 190 348 522 13-1023 Purchasing Agents, ex. Whole., Retail, & Farm 13,186 12,433 -753 -5.7% -75 380 708 1,013 13-1031 Claims Adjusters, Examiners, and Investigators 11,383 11,113 -270 -2.4% -27 282 626 881 $31.10
13-1032 Insurance Appraisers, Auto Damage 715 712 -3 -0.4% 0 18 40 58 $28.69
13-1041 Compl. Off., ex. Agric, Con, Hlth/Safety, & Trans. 7,270 7,808 538 7.4% 54 211 380 645 $28.46
13-1051 Cost Estimators 11,135 12,061 926 8.3% 93 365 753 1,211 $28.53
13-1071 Human Resource Specialists 19,963 21,236 1,273 6.4% 127 598 1,354 2,079 $27.14

36
Appendix Table J – cont’d. Ohio Occupational Employment* Projections Report, 2016-2026
Employment Change in Median
2016 2026 Employment Annual Openings Wage***
Code Occupational Title** Annual Projected 2016-2026 Percent Growth Exit Transfers Total May 2017
13-1075 Labor Relations Specialists 6,761 5,741 -1,020 -15.1% -102 182 411 491 $9.51
13-1081 Logisticians 5,946 6,277 331 5.6% 33 150 431 614 $35.46
13-1111 Management Analysts 21,549 24,461 2,912 13.5% 291 739 1,189 2,219 $35.71
13-1121 Meeting and Convention Planners 2,654 2,817 163 6.1% 16 103 205 324 $21.25
13-1131 Fundraisers 4,797 5,188 391 8.2% 39 155 327 521 $24.74
13-1141 Compensation, Benefits, and Job Analysis Specialists 3,152 3,603 451 14.3% 45 86 183 314 $27.83
13-1151 Training and Development Specialists 9,314 10,140 826 8.9% 83 299 625 1,007 $26.47
13-1161 Market Research Analysts and Marketing Specialists 22,330 26,671 4,341 19.4% 434 650 1,682 2,766 $28.87
13-1199 Business Operations Specialists, All Other 34,128 36,632 2,504 7.3% 250 1,110 2,041 3,401 $31.24
13-2011 Accountants and Auditors 47,433 49,962 2,529 5.3% 253 1,438 2,802 4,493 $31.02
13-2021 Appraisers and Assessors of Real Estate 2,251 2,665 414 18.4% 41 86 71 198 $26.76
13-2041 Credit Analysts 2,819 3,104 285 10.1% 28 68 170 266 $32.39
13-2051 Financial Analysts 9,189 10,273 1,084 11.8% 108 194 612 914 $34.98
13-2052 Personal Financial Advisors 7,554 9,192 1,638 21.7% 164 206 410 780 $39.12
13-2053 Insurance Underwriters 5,789 5,193 -596 -10.3% -60 141 294 375 $33.60
13-2061 Financial Examiners 3,442 3,898 456 13.2% 46 103 168 317 $32.70
13-2072 Loan Officers 12,385 13,618 1,233 10.0% 123 314 721 1,158 $31.50
13-2081 Tax Examiners, Collectors, and Revenue Agents 1,672 1,678 6 0.4% 1 50 65 116 $28.94
13-2082 Tax Preparers 2,797 2,849 52 1.9% 5 153 140 298 $17.03
13-2099 Financial Specialists, All Other 5,789 6,429 640 11.1% 64 188 315 567 $35.22
15-0000 Computer & Mathematical Occupations 147,225 157,316 10,091 6.9% 1,009 2,578 7,267 10,854 $36.89
15-1111 Computer & Information Research Scientists 173 190 17 9.8% 2 3 9 14 $50.96
15-1121 Computer Systems Analysts 28,795 29,211 416 1.4% 42 530 1,295 1,867 $40.67
15-1122 Information Security Analysts 2,890 3,637 747 25.8% 75 58 159 292 $42.62
15-1131 Computer Programmers 5,847 4,919 -928 -15.9% -93 94 240 241 $33.21
15-1132 Software Developers, Applications 35,099 41,253 6,154 17.5% 615 522 1,874 3,011 $42.89
15-1133 Software Developers, Systems Software 5,839 5,931 92 1.6% 9 80 289 378 $45.64
15-1134 Web Developers 3,803 4,034 231 6.1% 23 73 198 294 $27.30
15-1141 Database Administrators 4,361 4,646 285 6.5% 28 94 187 309 $40.03
15-1142 Network and Comp. Systems Architects and Admins 14,012 14,056 44 0.3% 4 197 660 861 $35.21
15-1143 Computer Network Architects 5,501 5,433 -68 -1.2% -7 77 269 339 $45.80
15-1151 Computer User Support Specialists 18,737 19,441 704 3.8% 70 388 982 1,440 $21.68
15-1152 Computer Network Support Specialists 9,960 10,413 453 4.5% 45 207 524 776 $27.76
15-1199 Computer Occupations, All Other 6,435 6,930 495 7.7% 50 129 310 489 $38.15
15-2011 Actuaries 1,114 1,362 248 22.3% 25 16 58 99 $45.23
15-2031 Operations Research Analysts 3,852 4,791 939 24.4% 94 89 163 346 $38.74
15-2041 Statisticians 710 954 244 34.4% 24 18 43 85 $40.31
17-0000 Architecture & Engineering Occupations 96,728 103,258 6,530 6.8% 653 2,457 4,469 7,579 $35.60
17-1011 Architects, Except Landscape and Naval 3,533 3,611 78 2.2% 8 90 159 257 $34.68
17-1012 Landscape Architects 933 978 45 4.8% 4 24 43 71 $28.36
17-1022 Surveyors 1,065 1,152 87 8.2% 9 32 45 86 $28.08
17-2011 Aerospace Engineers 4,973 5,272 299 6.0% 30 116 184 330 $54.95
17-2031 Biomedical Engineers 680 738 58 8.5% 6 16 31 53 $35.20
17-2041 Chemical Engineers 1,448 1,540 92 6.4% 9 32 61 102 $44.13
17-2051 Civil Engineers 8,049 8,655 606 7.5% 61 181 411 653 $37.75

37
Appendix Table J – cont’d. Ohio Occupational Employment* Projections Report, 2016-2026
Employment Change in Median
2016 2026 Employment Annual Openings Wage***
Code Occupational Title** Annual Projected 2016-2026 Percent Growth Exit Transfers Total May 2017
17-2061 Computer Hardware Engineers 1,074 1,118 44 4.1% 4 21 46 71 $47.68
17-2071 Electrical Engineers 6,258 6,665 407 6.5% 41 146 259 446 $39.73
17-2072 Electronics Engineers, Except Computer 3,774 3,947 173 4.6% 17 87 154 258 $45.17
17-2081 Environmental Engineers 1,218 1,278 60 4.9% 6 29 51 86 $44.47
17-2111 Health & Safety Engineers, ex. Mining Safety 533 556 23 4.3% 2 12 22 36 $42.33
17-2112 Industrial Engineers 14,744 16,005 1,261 8.6% 126 350 626 1,102 $38.24
17-2131 Materials Engineers 1,593 1,661 68 4.3% 7 51 62 120 $42.56
17-2141 Mechanical Engineers 14,985 16,798 1,813 12.1% 181 323 661 1,165 $36.71
17-2151 Mining & Geological Engineers, Inc Mining Safety Eng. 114 124 10 8.8% 1 2 6 9 $38.17
17-2171 Petroleum Engineers 377 387 10 2.7% 1 7 18 26 $38.94
17-2199 Engineers, All Other 7,380 7,827 447 6.1% 45 175 307 527 $41.94
17-3011 Architectural and Civil Drafters 2,812 2,971 159 5.7% 16 85 156 257 $24.09
17-3012 Electrical and Electronics Drafters 763 801 38 5.0% 4 23 42 69 $25.44
17-3013 Mechanical Drafters 2,463 2,531 68 2.8% 7 74 135 216 $25.44
17-3019 Drafters, All Other 1,217 1,266 49 4.0% 5 37 67 109 $24.29
17-3021 Aerospace Engineering and Operations Technicians 424 430 6 1.4% 1 14 22 37 $33.59
17-3022 Civil Engineering Technicians 1,987 2,126 139 7.0% 14 66 108 188 $26.32
17-3023 Electrical and Electronic Engineering Technicians 2,453 2,423 -30 -1.2% -3 78 128 203 $28.50
17-3024 Electro-Mechanical Technicians 419 422 3 0.7% 0 13 22 35 $25.19
17-3025 Environmental Engineering Technicians 324 337 13 4.0% 1 11 17 29 $23.07
17-3026 Industrial Engineering Technicians 3,216 3,235 19 0.6% 2 103 170 275 $25.94
17-3027 Mechanical Engineering Technicians 2,302 2,467 165 7.2% 16 76 126 218 $26.22
17-3029 Engineering Technicians, Except Drafters, All Other 3,278 3,535 257 7.8% 26 109 179 314 $27.18
17-3031 Surveying and Mapping Technicians 1,507 1,606 99 6.6% 10 52 111 173 $20.02
19-0000 Life, Physical, & Social Science Occupations 37,253 40,529 3,276 8.8% 328 1,020 2,412 3,760 $28.91
19-1012 Food Scientists and Technologists 840 930 90 10.7% 9 24 64 97 $31.24
19-1013 Soil and Plant Scientists 213 221 8 3.8% 1 6 16 23 $22.58
19-1022 Microbiologists 552 583 31 5.6% 3 12 36 51 $29.27
19-1023 Zoologists and Wildlife Biologists 164 173 9 5.5% 1 3 11 15 $32.66
19-1029 Biological Scientists, All Other 880 1,059 179 20.3% 0 20 62 100 $25.96 19-1031 Conservation Scientists 392 414 22 5.6% 2 8 25 35 $24.46
19-1032 Foresters 180 180 0 0.0% 0 4 11 15 $28.72
19-1041 Epidemiologists 197 208 11 5.6% 1 4 13 18 $30.20
19-1042 Medical Scientists, Except Epidemiologists 4,306 4,821 515 12.0% 52 84 290 426 $36.17
19-2012 Physicists 513 593 80 15.6% 8 11 31 50 $54.37
19-2031 Chemists 4,121 4,325 204 5.0% 20 106 264 390 $33.50
19-2032 Materials Scientists 641 713 72 11.2% 7 17 42 66 $41.70
19-2041 Environmental Scientists/Specialists, inc. Health 3,230 3,498 268 8.3% 27 73 231 331 $32.25
19-2042 Geoscientists, Except Hydrologists and Geographers 360 391 31 8.6% 3 8 26 37 $32.60
19-2043 Hydrologists 266 277 11 4.1% 1 6 19 26 $37.69
19-2099 Physical Scientists, All Other 446 489 43 9.6% 4 8 27 39 $48.58
19-3011 Economists 122 120 -2 -1.6% 0 2 7 9 $48.16
19-3022 Survey Researchers 158 154 -4 -2.5% 0 4 10 14 $25.03
19-3031 Clinical, Counseling, and School Psychologists 4,029 4,572 543 13.5% 54 108 164 326 $33.43
19-3039 Psychologists, All Other 458 504 46 10.0% 5 12 18 35 $46.87

38
Appendix Table J – cont’d. Ohio Occupational Employment* Projections Report, 2016-2026
Employment Change in Median
2016 2026 Employment Annual Openings Wage***
Code Occupational Title** Annual Projected 2016-2026 Percent Growth Exit Transfers Total May 2017
19-3051 Urban and Regional Planners 574 619 45 7.8% 4 12 36 52 $30.60
19-3091 Anthropologists and Archeologists 119 119 0 0.0% 0 3 7 10 $28.45
19-3099 Social Scientists and Related Workers, All Other 1,812 1,966 154 8.5% 15 54 116 185 $34.73
19-4011 Agricultural and Food Science Technicians 515 554 39 7.6% 4 15 38 57 $17.68
19-4021 Biological Technicians 2,868 3,146 278 9.7% 28 77 205 310 $19.88
19-4031 Chemical Technicians 3,822 3,992 170 4.4% 17 129 230 376 $21.32
19-4061 Social Science Research Assistants 324 346 22 6.8% 2 13 25 40 $18.77
19-4091 Environ. Science & Protection Tech., inc. Health 1,562 1,711 149 9.5% 15 66 122 203 $20.26
19-4092 Forensic Science Technicians 377 418 41 10.9% 4 16 30 50 $30.34
19-4093 Forest and Conservation Technicians 247 255 8 3.2% 1 10 19 30 $20.10
19-4099 Life, Physical, & Social Science Tech., All Other 1,603 1,763 160 10.0% 16 67 125 208 $24.06
21-0000 Community & Social Service Occupations 101,986 114,124 12,138 11.9% 1,214 4,394 7,090 12,698 $20.52
21-1011 Substance Abuse & Behavioral Dis. Counselors 3,109 3,615 506 16.3% 51 124 220 395
21-1012 Educational, Vocational, and School Counselors 9,481 10,511 1,030 10.9% 103 368 654 1,125 $26.02
21-1013 Marriage and Family Therapists 495 601 106 21.4% 11 20 36 67 $23.44
21-1014 Mental Health Counselors 5,196 6,318 1,122 21.6% 112 212 376 700
21-1015 Rehabilitation Counselors 4,878 5,669 791 16.2% 79 194 345 618 $16.74
21-1019 Counselors, All Other 1,509 1,723 214 14.2% 21 59 106 186 $21.23
21-1021 Child, Family, and School Social Workers 9,767 11,439 1,672 17.1% 167 381 674 1,222 $19.28
21-1022 Medical and Public Health Social Workers 9,503 11,030 1,527 16.1% 153 369 652 1,174 $26.65
21-1023 Mental Health and Substance Abuse Social Workers 5,185 6,020 835 16.1% 84 201 356 641 $18.45
21-1029 Social Workers, All Other 3,283 3,696 413 12.6% 4 125 222 388 $21.75
21-1091 Health Educators 1,888 2,113 225 11.9% 22 90 148 260 $26.80
21-1092 Probation Officers & Correct. Treatment Spec. 2,952 3,014 62 2.1% 6 90 157 253 $23.28
21-1093 Social and Human Service Assistants 16,289 18,438 2,149 13.2% 215 776 1,242 2,233 $15.10
21-1094 Community Health Workers 1,554 1,773 219 14.1% 22 75 123 220 $17.94
21-1099 Community and Social Service Specialists, All Other 3,081 3,377 296 9.6% 30 146 240 416 $19.30
21-2011 Clergy 19,121 19,888 767 4.0% 77 894 1,197 2,168 $20.99
21-2021 Directors, Religious Activities and Education 2,043 2,124 81 4.0% 8 92 158 258 $19.50
21-2099 Religious Workers, All Other 2,652 2,775 123 4.6% 12 176 184 372 $12.42
23-0000 Legal Occupations 35,984 36,698 714 2.0% 71 896 1,268 2,235 $31.56
23-1011 Lawyers 20,148 20,365 217 1.1% 22 402 438 862 $45.66
23-1012 Judicial Law Clerks 355 363 8 2.3% 1 5 12 18 $21.61
23-1021 Admin. Law Judges & Adjudicators & Hearing Officers 466 480 14 3.0% 1 9 10 20 $45.31
23-1022 Arbitrators, Mediators, and Conciliators 148 153 5 3.4% 0 3 3 6 $30.92
23-1023 Judges, Magistrate Judges, and Magistrates 2,460 2,488 28 1.1% 3 49 54 106 $31.86
23-2011 Paralegals and Legal Assistants 8,088 8,542 454 5.6% 45 274 553 872 $21.24
23-2091 Court Reporters 472 483 11 2.3% 1 17 22 40 $22.47
23-2093 Title Examiners, Abstractors, and Searchers 2,738 2,652 -86 -3.1% -9 95 123 209 $22.13
23-2099 Legal Support Workers, All Other 1,109 1,172 63 5.7% 6 40 52 98 $24.79
25-0000 Education, Training, & Library Occupations 315,378 341,135 25,757 8.2% 2,576 13,412 13,365 29,353 $24.48
25-1011 Business Teachers, Postsecondary 4,338 4,942 604 13.9% 60 170 177 407 $82,030 ††
25-1021 Computer Science Teachers, Postsecondary 1,219 1,279 60 4.9% 6 46 48 100 $92,660 ††
25-1022 Mathematical Science Teachers, Postsecondary 1,863 1,970 107 5.7% 11 70 73 154 $76,310 ††
25-1031 Architecture Teachers, Postsecondary 439 464 25 5.7% 2 16 17 35 $76,160 ††

39
Appendix Table J – cont’d. Ohio Occupational Employment* Projections Report, 2016-2026
Employment Change in Median
2016 2026 Employment Annual Openings Wage***
Code Occupational Title** Annual Projected 2016-2026 Percent Growth Exit Transfers Total May 2017
25-1032 Engineering Teachers, Postsecondary 1,202 1,318 116 9.7% 12 46 48 106 $97,300 ††
25-1042 Biological Science Teachers, Postsecondary 1,623 1,798 175 10.8% 18 63 65 146 $81,590 ††
25-1051 Atmos., Earth, Marine & Space Sci. Teachers, PS 271 285 14 5.2% 1 10 11 22 $92,970 ††
25-1052 Chemistry Teachers, Postsecondary 732 772 40 5.5% 4 28 29 61 $84,960 ††
25-1053 Environmental Science Teachers, Postsecondary 148 154 6 4.1% 1 6 6 13 $82,520 ††
25-1054 Physics Teachers, Postsecondary 513 540 27 5.3% 3 19 20 42 $96,020 ††
25-1061 Anthropology & Archeology Teachers, Postsecondary 207 219 12 5.8% 1 8 8 17 $81,390 ††
25-1062 Area/Ethnic/Cultural Studies Teachers, Postsecondary 422 446 24 5.7% 2 16 17 35 $71,130 ††
25-1063 Economics Teachers, Postsecondary 393 416 23 5.9% 2 15 15 32 $96,860 ††
25-1064 Geography Teachers, Postsecondary 199 206 7 3.5% 1 7 8 16 $88,130 ††
25-1065 Political Science Teachers, Postsecondary 502 531 29 5.8% 3 19 20 42 $82,180 ††
25-1066 Psychology Teachers, Postsecondary 1,148 1,271 123 10.7% 12 44 46 102 $70,490 ††
25-1067 Sociology Teachers, Postsecondary 571 602 31 5.4% 3 22 22 47 $77,720 ††
25-1069 Social Sciences Teachers, Postsecondary, All Other 338 363 25 7.4% 2 13 13 28 $74,420 ††
25-1071 Health Specialties Teachers, Postsecondary 8,460 10,231 1,771 20.9% 177 342 356 875 $84,980 ††
25-1072 Nursing Instructors and Teachers, Postsecondary 3,157 3,813 656 20.8% 66 128 133 327 $67,990 ††
25-1081 Education Teachers, Postsecondary 2,976 3,144 168 5.6% 17 112 117 246 $61,490 ††
25-1082 Library Science Teachers, Postsecondary 319 331 12 3.8% 1 12 12 25 $64,310 ††
25-1111 Criminal Justice/Law Enforcement Teachers, PS 468 513 45 9.6% 4 18 19 41 $61,350 ††
25-1112 Law Teachers, Postsecondary 639 683 44 6.9% 4 24 25 53 $103,310 ††
25-1113 Social Work Teachers, Postsecondary 535 564 29 5.4% 3 20 21 44 $62,170 ††
25-1121 Art, Drama, and Music Teachers, Postsecondary 4,259 4,588 329 7.7% 33 162 169 364 $65,330 ††
25-1122 Communications Teachers, Postsecondary 1,268 1,349 81 6.4% 8 48 50 106 $59,480 ††
25-1123 English Language/Literature Teachers, Postsecondary 2,687 2,844 157 5.8% 16 101 106 223 $64,320 ††
25-1124 Foreign Language/Literature Teachers, Postsecondary 1,189 1,261 72 6.1% 7 45 47 99 $62,140 ††
25-1125 History Teachers, Postsecondary 784 829 45 5.7% 4 30 31 65 $74,100 ††
25-1126 Philosophy and Religion Teachers, Postsecondary 814 878 64 7.9% 6 31 32 69 $63,670 ††
25-1191 Graduate Teaching Assistants 1,572 1,653 81 5.2% 8 59 62 129 $47,030 ††
25-1194 Vocational Education Teachers, Postsecondary 3,935 3,990 55 1.4% 6 145 151 302 $27.41
25-2011 Preschool Teachers, Except Special Education 12,788 15,071 2,283 17.9% 228 600 744 1,572 $11.80
25-2012 Kindergarten Teachers, Except Special Education 5,940 6,289 349 5.9% 35 263 327 625 $54,640 ††
25-2021 Elementary School Teachers, ex. Special Ed. 45,363 47,844 2,481 5.5% 248 1,538 1,725 3,511 $59,560 ††
25-2022 Middle School Teachers, ex. Special & Voc. Ed. 30,085 31,759 1,674 5.6% 167 1,020 1,145 2,332 $59,810 ††
25-2023 Vocational Education Teachers, Middle School 276 291 15 5.4% 2 9 10 21 $68,630 ††
25-2031 Secondary Sch. Teachers, ex. Spec. & Voc. Ed. 50,776 53,714 2,938 5.8% 294 1,600 1,949 3,843 $59,990 ††
25-2032 Career/Technical Education Teachers, Secondary School 5,748 6,012 264 4.6% 26 180 219 425 $62,750 ††
25-2051 Special Education Teachers, Preschool 917 1,010 93 10.1% 9 32 35 76 $55,700 ††
25-2052 Special Education Teachers, Kindergarten/Elementary 7,682 8,154 472 6.1% 47 263 289 599 $56,030 ††
25-2053 Special Education Teachers, Middle School 4,442 4,706 264 5.9% 26 152 167 345 $59,530 ††
25-2054 Special Education Teachers, Secondary School 6,598 7,058 460 7.0% 46 227 249 522 $56,730 ††
25-2059 Special Education Teachers, All Other 669 744 75 11.2% 8 24 26 58 $36,780 ††
25-3011 Adult Literacy, Remedial Ed., & GED Teachers 2,172 1,998 -174 -8.0% -17 127 98 208 $23.82
25-3021 Self-Enrichment Education Teachers 10,462 12,045 1,583 15.1% 158 686 527 1,371 $16.43
25-3097 Teachers and Instructors, All Other except Substitute Teachers 5,819 6,554 735 12.6% 74 377 290 741 $38,040 ††
25-3098 Substitute Teachers 19,045 21,355 2,310 12.1% 231 1,231 945 2,407 $13.05

40
Appendix Table J – cont’d. Ohio Occupational Employment* Projections Report, 2016-2026
Employment Change in Median
2016 2026 Employment Annual Openings Wage***
Code Occupational Title** Annual Projected 2016-2026 Percent Growth Exit Transfers Total May 2017
25-4011 Archivists 121 132 11 9.1% 1 5 7 13 $19.24
25-4012 Curators 507 559 52 10.3% 5 22 31 58 $23.21
25-4013 Museum Technicians and Conservators 382 426 44 11.5% 4 17 23 44 $16.91
25-4021 Librarians 3,791 3,926 135 3.6% 14 211 144 369 $26.12
25-4031 Library Technicians 3,975 4,107 132 3.3% 13 318 207 538 $14.31
25-9031 Instructional Coordinators 2,928 3,213 285 9.7% 28 146 126 300 $29.38
25-9041 Teacher Assistants 34,956 38,166 3,210 9.2% 321 2,007 1,668 3,996 $25,520 ††
25-9099 Education, Training, and Library Workers, All Other 3,773 4,420 647 17.1% 65 195 168 428 $19.36
27-0000 Arts, Design, Entertainment, Sports, & Media Occupations 87,126 89,279 2,153 2.5% 215 3,703 4,734 8,652 $18.97
27-1011 Art Directors 2,889 3,014 125 4.3% 12 144 86 242 $38.80
27-1012 Craft Artists 508 516 8 1.6% 1 25 15 41 $13.02
27-1013 Fine Artists, inc. Painters, Sculptors & Illustrators 1,784 1,918 134 7.5% 13 90 54 157 $16.16
27-1014 Multi-Media Artists and Animators 1,007 1,049 42 4.2% 4 50 30 84 $25.50
27-1021 Commercial and Industrial Designers 1,490 1,576 86 5.8% 9 54 86 149 $28.63
27-1023 Floral Designers 2,100 1,868 -232 -11.0% -23 70 112 159 $11.50
27-1024 Graphic Designers 8,738 8,995 257 2.9% 26 313 498 837 $21.51
27-1025 Interior Designers 2,254 2,418 164 7.3% 16 83 131 230 $21.08
27-1026 Merchandise Displayers and Window Trimmers 5,903 5,748 -155 -2.6% -16 206 328 518 $13.62
27-1027 Set and Exhibit Designers 472 509 37 7.8% 4 17 28 49 $21.36
27-1029 Designers, All Other 191 190 -1 -0.5% 0 7 11 18 $27.66
27-2011 Actors 1,029 1,093 64 6.2% 6 51 53 110 $9.43
27-2012 Producers and Directors 2,099 2,264 165 7.9% 16 55 135 206 $23.40
27-2021 Athletes and Sports Competitors 110 115 5 4.5% 0 6 8 14 $40,990 ††
27-2022 Coaches and Scouts 10,608 11,517 909 8.6% 91 617 834 1,542 $21,800 ††
27-2023 Umpires, Referees, and Other Sports Officials 376 394 18 4.8% 2 22 29 53 $19,300 ††
27-2031 Dancers 398 421 23 5.8% 2 25 29 56 $14.63
27-2041 Music Directors and Composers 3,299 3,341 42 1.3% 4 191 123 318 $29.70
27-2042 Musicians and Singers 6,488 6,597 109 1.7% 11 376 242 629 $24.42
27-2099 Entertainers & Performers, Sports & Rel. Work., AO 636 672 36 5.7% 4 31 38 73 $19.57
27-3011 Radio and Television Announcers 1,350 1,159 -191 -14.1% -19 54 65 100 $15.56
27-3022 Reporters and Correspondents 1,813 1,505 -308 -17.0% -31 51 110 130 $15.53
27-3031 Public Relations Specialists 7,204 7,707 503 7.0% 50 209 505 764 $26.86
27-3041 Editors 2,810 2,582 -228 -8.1% -23 89 170 236 $24.77
27-3042 Technical Writers 1,809 1,886 77 4.3% 8 59 111 178 $29.53
27-3043 Writers and Authors 4,185 4,360 175 4.2% 18 182 182 382 $21.36
27-3091 Interpreters and Translators 2,206 2,432 226 10.2% 23 105 101 229 $19.78
27-3099 Media and Communication Workers, All Other 2,330 2,583 253 10.9% 25 111 107 243 $21.89
27-4011 Audio and Video Equipment Technicians 1,335 1,452 117 8.8% 12 39 86 137 $16.30
27-4012 Broadcast Technicians 921 895 -26 -2.8% -3 26 56 79 $14.88
27-4014 Sound Engineering Technicians 343 359 16 4.7% 2 10 22 34 $19.77
27-4021 Photographers 5,724 5,233 -491 -8.6% -49 234 192 377 $13.56
27-4031 Camera Operators, TV, Video & Motion Picture 568 600 32 5.6% 3 17 37 57 $25.54
27-4032 Film and Video Editors 454 530 76 16.7% 8 14 31 53 $20.74
27-4099 Media & Communication Equip. Workers, AO 330 327 -3 -0.9% 0 9 20 29 $28.11

41
Appendix Table J – cont’d. Ohio Occupational Employment* Projections Report, 2016-2026
Employment Change in Median
2016 2026 Employment Annual Openings Wage***
Code Occupational Title** Annual Projected 2016-2026 Percent Growth Exit Transfers Total May 2017
29-0000 Healthcare Practitioners & Technical Occupations 371,975 418,231 46,256 12.4% 4,626 10,557 10,163 25,346 $28.78
29-1011 Chiropractors 1,669 1,804 135 8.1% 14 29 14 57 $37.37
29-1021 Dentists, General 4,001 4,480 479 12.0% 48 78 32 158 $84.51
29-1022 Oral and Maxillofacial Surgeons 276 309 33 12.0% 3 5 2 10 N/A
29-1023 Orthodontists 325 364 39 12.0% 4 6 3 13 N/A
29-1029 Dentists, All Other Specialists 377 421 44 11.7% 4 7 3 14 $91.75 †††
29-1031 Dietitians and Nutritionists 2,534 2,802 268 10.6% 27 84 76 187 $27.59
29-1041 Optometrists 1,232 1,393 161 13.1% 16 22 17 55 $55.58
29-1051 Pharmacists 12,779 13,496 717 5.6% 72 303 253 628 $57.98
29-1061 Anesthesiologists 1,325 1,409 84 6.3% 8 20 15 43 N/A
29-1062 Family and General Practitioners 4,523 4,849 326 7.2% 33 69 52 154 $91.12
29-1063 Internists, General 3,044 3,238 194 6.4% 19 46 35 100 $92.75 †
29-1064 Obstetricians and Gynecologists 1,190 1,270 80 6.7% 8 18 14 40 N/A
29-1065 Pediatricians, General 1,479 1,577 98 6.6% 10 22 17 49 $75.41
29-1066 Psychiatrists 1,469 1,575 106 7.2% 11 22 17 50 $89.33
29-1067 Surgeons 2,503 2,666 163 6.5% 16 38 28 82 N/A
29-1069 Physicians and Surgeons, All Other 15,627 16,793 1,166 7.5% 117 238 179 534 N/A
29-1071 Physician Assistants 3,198 4,189 991 31.0% 99 64 131 294 $49.40
29-1081 Podiatrists 727 771 44 6.1% 4 17 20 41 $60.33
29-1122 Occupational Therapists 4,925 5,963 1,038 21.1% 104 112 151 367 $40.13
29-1123 Physical Therapists 8,152 9,904 1,752 21.5% 175 174 188 537 $41.25
29-1124 Radiation Therapists 619 677 58 9.4% 6 16 14 36 $35.79
29-1125 Recreational Therapists 363 372 9 2.5% 1 10 10 21 $22.57
29-1126 Respiratory Therapists 6,547 8,187 1,640 25.0% 164 173 167 504 $26.49
29-1127 Speech-Language Pathologists 5,342 6,247 905 16.9% 90 105 180 375 $35.65
29-1128 Exercise Physiologists 492 547 55 11.2% 6 12 15 33 $22.85
29-1129 Therapists, All Other 1,319 1,515 196 14.9% 20 34 41 95 $31.55
29-1131 Veterinarians 3,337 3,443 106 3.2% 11 63 55 129 $44.27
29-1141 Registered Nurses 129,954 148,344 18,390 14.2% 1,839 3,984 3,025 8,848 $30.43
29-1151 Nurse Anesthetists 2,596 2,853 257 9.9% 26 37 90 153 $72.73
29-1161 Nurse Midwives 245 270 25 10.2% 2 5 7 14 $46.21
29-1171 Nurse Practitioners 6,757 8,767 2,010 29.7% 201 151 222 574 $47.65
29-1181 Audiologists 636 735 99 15.6% 10 17 13 40 $34.07
29-1199 Health Diagnosing and Treating Practitioners, All Other 1,577 1,765 188 11.9% 19 67 17 103 $38.03
29-2011 Medical and Clinical Laboratory Technologists 6,903 7,565 662 9.6% 66 219 219 504
29-2012 Medical and Clinical Laboratory Technicians 6,380 6,984 604 9.5% 60 202 202 464
29-2021 Dental Hygienists 7,905 8,795 890 11.3% 89 302 187 578 $32.74
29-2031 Cardiovascular Technologists and Technicians 2,348 2,594 246 10.5% 25 64 62 151 $26.50
29-2032 Diagnostic Medical Sonographers 2,186 2,615 429 19.6% 43 62 60 165 $30.30
29-2033 Nuclear Medicine Technologists 917 1,002 85 9.3% 8 25 24 57 $33.70
29-2034 Radiologic Technologists 8,873 9,679 806 9.1% 81 240 231 552 $26.38
29-2035 Magnetic Resonance Imaging Technologists 1,433 1,570 137 9.6% 14 39 37 90 $31.12
29-2041 Emergency Medical Technicians and Paramedics 11,104 12,401 1,297 11.7% 130 205 483 818 $14.11
29-2051 Dietetic Technicians 672 714 42 6.3% 4 22 31 57 $14.23
29-2052 Pharmacy Technicians 16,427 18,263 1,836 11.2% 184 563 769 1,516 $13.82

42
Appendix Table J – cont’d. Ohio Occupational Employment* Projections Report, 2016-2026
Employment Change in Median
2016 2026 Employment Annual Openings Wage***
Code Occupational Title** Annual Projected 2016-2026 Percent Growth Exit Transfers Total May 2017
29-2053 Psychiatric Technicians 1,216 1,342 126 10.4% 13 42 57 112 $15.90
29-2055 Surgical Technologists 4,078 4,439 361 8.9% 36 138 189 363 $20.67
29-2056 Veterinary Technologists and Technicians 3,368 3,457 89 2.6% 9 111 151 271 $15.12
29-2057 Ophthalmic Medical Technicians 1,706 1,881 175 10.3% 18 58 80 156 $17.03
29-2061 Licensed Practical and Licensed Vocational Nurses 40,254 44,069 3,815 9.5% 382 1,487 1,465 3,334 $20.21
29-2071 Medical Records and Health Information Technicians 9,365 10,638 1,273 13.6% 127 293 298 718 $18.09
29-2081 Opticians, Dispensing 3,032 3,402 370 12.2% 37 107 119 263 $17.98
29-2092 Hearing Aid Specialists 415 480 65 15.7% 6 12 15 33 $27.84
29-2099 Health Technologists and Technicians, All Other 4,478 5,014 536 12.0% 54 132 157 343 $18.25
29-9011 Occupational Health and Safety Specialists 4,039 4,259 220 5.4% 22 92 114 228 $33.67
29-9012 Occupational Health and Safety Technicians 839 883 44 5.2% 4 19 24 47 $24.56
29-9091 Athletic Trainers 1,267 1,486 219 17.3% 22 31 38 91 $46,570 ††
29-9092 Genetic Counselors 112 135 23 20.5% 2 3 3 8 $32.02
29-9099 Healthcare Practitioners and Technical Workers, All Other 736 817 81 11.0% 8 17 21 46 $27.35
31-0000 Healthcare Support Occupations 204,376 248,724 44,348 21.7% 4,435 12,977 12,257 29,669 $12.32
31-1011 Home Health Aides 67,055 96,334 29,279 43.7% 2,928 4,963 4,129 12,020 $10.33
31-1013 Psychiatric Aides 1,354 1,477 123 9.1% 12 86 72 170 $16.36
31-1014 Nursing Assistants 68,537 72,119 3,582 5.2% 358 4,272 3,554 8,184 $12.54
31-1015 Orderlies 2,281 2,450 169 7.4% 17 144 120 281 $12.36
31-2011 Occupational Therapist Assistants 3,467 4,419 952 27.5% 95 198 283 576 $28.19
31-2021 Physical Therapist Assistants 6,246 7,953 1,707 27.3% 171 311 523 1,005 $27.63
31-2022 Physical Therapist Aides 923 1,100 177 19.2% 18 44 74 136 $13.10
31-9011 Massage Therapists 3,175 4,028 853 26.9% 85 236 129 450 $16.58
31-9091 Dental Assistants 10,580 11,748 1,168 11.0% 117 570 639 1,326 $17.58
31-9092 Medical Assistants 23,153 27,790 4,637 20.0% 464 1,118 1,564 3,146 $14.72
31-9093 Medical Equipment Preparers 2,249 2,454 205 9.1% 20 147 140 307 $15.92
31-9094 Medical Transcriptionists 2,209 2,027 -182 -8.2% -18 141 107 230 $17.57
31-9095 Pharmacy Aides 759 717 -42 -5.5% -4 49 50 95 $12.77
31-9096 Veterinary Assistants and Laboratory Animal Caretakers 2,740 2,827 87 3.2% 9 161 260 430 $11.72
31-9097 Phlebotomists 5,486 6,611 1,125 20.5% 112 261 349 722 $15.56
31-9099 Healthcare Support Workers, All Other 4,090 4,591 501 12.2% 50 272 259 581 $16.26
33-0000 Protective Service Occupations 118,191 120,312 2,121 1.8% 212 5,926 6,651 12,789 $19.18
33-1011 First-Line Supervisors/Mgrs of Correctional Officers 592 532 -60 -10.1% -6 17 19 30 $30.98
33-1012 First-Line Superv./Mgrs of Police & Detectives 2,546 2,614 68 2.7% 7 72 80 159 $38.22
33-1021 FL Sup/Mgrs of Fire Fighting & Prev. Workers 2,428 2,493 65 2.7% 6 83 75 164 $34.20
33-1099 First-Line Sup/Mgrs, Protective Serv. Work., AO 2,635 2,739 104 3.9% 10 123 134 267 $18.84
33-2011 Fire Fighters 18,899 19,395 496 2.6% 50 429 811 1,290 $22.29
33-3011 Bailiffs 1,466 1,390 -76 -5.2% -8 50 64 106 $21.20
33-3012 Correctional Officers and Jailers 13,171 11,645 -1,526 -11.6% -153 438 558 843 $20.81
33-3021 Detectives and Criminal Investigators 2,110 2,179 69 3.3% 7 57 75 139 $31.49
33-3031 Fish and Game Wardens 149 147 -2 -1.3% 0 8 5 13 $28.99
33-3041 Parking Enforcement Workers 161 99 -62 -38.5% -6 7 4 5 $18.22
33-3051 Police and Sheriff's Patrol Officers 24,743 25,370 627 2.5% 63 605 976 1,644 $29.21
33-3052 Transit and Railroad Police 249 255 6 2.4% 1 6 10 17 $30.00
33-9011 Animal Control Workers 346 361 15 4.3% 2 16 21 39 $15.63

43
Appendix Table J – cont’d. Ohio Occupational Employment* Projections Report, 2016-2026
Employment Change in Median
2016 2026 Employment Annual Openings Wage***
Code Occupational Title** Annual Projected 2016-2026 Percent Growth Exit Transfers Total May 2017
33-9021 Private Detectives and Investigators 1,222 1,313 91 7.4% 9 64 55 128 $17.97
33-9031 Gaming Surveillance Officers and Gaming Investigators 532 554 22 4.1% 2 32 38 72 $23.43
33-9032 Security Guards 32,617 34,063 1,446 4.4% 145 1,977 2,352 4,474 $11.95
33-9091 Crossing Guards 1,628 1,675 47 2.9% 5 231 65 301 $12.52
33-9092 Lifeguards, Ski Patrol, and Other Recreational Protective Service Workers 7,026 7,348 322 4.6% 32 995 758 1,785 $9.29
33-9093 Transportation Security Screeners 750 823 73 9.7% 7 39 30 76 $18.62
33-9099 Protective Service Workers, All Other 4,551 4,923 372 8.2% 37 656 500 1,193 $13.17
35-0000 Food Preparation & Serving Related Occupations 507,785 515,111 7,326 1.4% 733 39,007 48,397 88,137 $9.45
35-1011 Chefs and Head Cooks 4,491 4,783 292 6.5% 29 149 423 601 $17.95
35-1012 FL Sup/Mgrs of Food Prep. & Serving Workers 35,299 35,811 512 1.5% 51 1,593 3,392 5,036 $14.93
35-2011 Cooks, Fast Food 15,959 13,683 -2,276 -14.3% -228 868 1,186 1,826 $9.38
35-2012 Cooks, Institution and Cafeteria 17,813 18,536 723 4.1% 72 1,065 1,454 2,591 $12.12
35-2014 Cooks, Restaurant 37,560 38,467 907 2.4% 91 2,227 3,041 5,359 $11.40
35-2015 Cooks, Short Order 12,334 10,658 -1,676 -13.6% -168 674 920 1,426 $9.69
35-2021 Food Preparation Workers 25,545 26,052 507 2.0% 51 2,062 2,236 4,349 $9.69
35-3011 Bartenders 23,000 22,125 -875 -3.8% -88 1,087 2,588 3,587 $9.21
35-3021 Comb. Food Prep. & Serv. Work, inc. Fast Food 163,182 174,409 11,227 6.9% 1,123 14,947 15,632 31,702 $9.21
35-3022 Counter Attend., Café/Food Concess/Coffee Sh. 17,152 16,965 -187 -1.1% -19 2,049 1,610 3,640 $9.38
35-3031 Waiters and Waitresses 98,003 96,136 -1,867 -1.9% -187 7,185 11,009 18,007 $9.25
35-3041 Food Servers, Nonrestaurant 14,518 15,504 986 6.8% 99 1,130 1,055 2,284 $9.72
35-9011 Dining Room & Cafeteria Attend. & Bar Helpers 11,292 11,282 -10 -0.1% -1 1,005 894 1,898 $9.24
35-9021 Dishwashers 13,838 13,275 -563 -4.1% -56 1,003 1,080 2,027 $9.35
35-9031 Hosts & Hostesses, Rest./Lounge/Coffee Shop 16,096 15,674 -422 -2.6% -42 1,830 1,738 3,526 $9.21
35-9099 Food Preparation and Serving Related Workers, All Other 1,030 1,073 43 4.2% 4 94 83 181 $9.70
37-0000 Building & Grounds Cleaning & Maintenance Occupations 195,352 206,466 11,114 5.7% 1,111 12,160 12,797 26,068 $11.70
37-1011 FL Sup/Mgrs of Housekping & Janitorial Workers 6,901 7,402 501 7.3% 50 361 432 843 $20.24
37-1012 FL Sup/Mgrs of Lndscap./Lawn Ser/Groundskp 6,423 6,953 530 8.3% 53 216 404 673 $20.91
37-2011 Janitors & Cleaners, ex. Maids/Hsekping Cleaners 91,100 96,861 5,761 6.3% 576 6,118 5,912 12,606 $11.50
37-2012 Maids and Housekeeping Cleaners 40,548 41,420 872 2.2% 87 3,035 2,291 5,413 $10.13
37-2019 Building Cleaning Workers, All Other 518 549 31 6.0% 3 35 34 72 $11.52
37-2021 Pest Control Workers 1,661 1,701 40 2.4% 4 65 160 229 $15.52
37-3011 Landscaping and Groundskeeping Workers 45,531 48,861 3,330 7.3% 333 2,204 3,371 5,908 $12.67
37-3012 Pesticide Handlers/Sprayers/Applicators, Veg. 1,033 989 -44 -4.3% -4 47 72 115 $15.44
37-3013 Tree Trimmers and Pruners 1,470 1,563 93 6.3% 9 71 108 188 $17.90
37-3019 Grounds Maintenance Workers, All Other 167 167 0 0.0% 0 8 12 20 $22.46
39-0000 Personal Care & Service Occupations 174,752 198,818 24,066 13.8% 2,407 14,002 13,098 29,507 $10.66
39-1011 Gaming Supervisors 288 304 16 5.6% 2 14 32 48
39-1012 Slot Supervisors 124 132 8 6.5% 1 6 14 21
39-1021 First-Line Sup/Mgrs of Personal Serv. Workers 8,226 9,234 1,008 12.3% 101 418 392 911 $16.67
39-2011 Animal Trainers 726 816 90 12.4% 9 37 48 94 $12.28
39-2021 Nonfarm Animal Caretakers 8,242 9,810 1,568 19.0% 157 617 728 1,502 $9.86
39-3012 Gaming and Sports Book Writers and Runners 279 285 6 2.2% 1 16 25 42 13.68
39-3031 Ushers, Lobby Attendants, and Ticket Takers 2,413 2,625 212 8.8% 21 331 281 633 $9.45
39-3091 Amusement and Recreation Attendants 11,347 12,071 724 6.4% 72 1,236 1,392 2,700 $9.30
39-3092 Costume Attendants 109 111 2 1.8% 0 12 13 25 $17.38

44
Appendix Table J – cont’d. Ohio Occupational Employment* Projections Report, 2016-2026
Employment Change in Median
2016 2026 Employment Annual Openings Wage***
Code Occupational Title** Annual Projected 2016-2026 Percent Growth Exit Transfers Total May 2017
39-3093 Locker Room, Coatroom, & Dressing Room Attendants 578 618 40 6.9% 4 63 71 138 $9.71
39-4021 Funeral Attendants 2,329 2,374 45 1.9% 4 208 145 357 $11.86
39-5012 Hairdressers, Hairstylists, and Cosmetologists 30,193 33,609 3,416 11.3% 342 2,129 1,592 4,063 $10.86
39-5092 Manicurists and Pedicurists 2,552 2,850 298 11.7% 30 162 137 329 $11.23
39-5093 Shampooers 197 221 24 12.2% 2 13 11 26 $9.12
39-5094 Skin Care Specialists 1,984 2,230 246 12.4% 25 127 107 259 $14.37
39-6011 Baggage Porters and Bellhops 491 545 54 11.0% 5 25 46 76 $9.45
39-6012 Concierges 310 349 39 12.6% 4 16 29 49 $11.09
39-9011 Child Care Workers 41,155 43,936 2,781 6.8% 278 3,473 2,635 6,386 $9.86
39-9021 Personal and Home Care Aides 30,913 42,182 11,269 36.5% 1,127 2,917 2,197 6,241 $10.61
39-9031 Fitness Trainers and Aerobics Instructors 8,887 9,605 718 8.1% 72 605 925 1,602 $12.43
39-9032 Recreation Workers 14,532 15,132 600 4.1% 60 971 1,484 2,515 $11.18
39-9041 Residential Advisors 3,042 3,662 620 20.4% 62 222 332 616 $13.28
39-9099 Personal Care and Service Workers, All Other 1,588 1,644 56 3.5% 6 108 126 240 $10.34
41-0000 Sales & Related Occupations 551,916 560,882 8,966 1.6% 897 31,994 42,440 75,331 $12.46
41-1011 First-Line Superv./Mgrs of Retail Sales Workers 53,622 54,973 1,351 2.5% 135 2,004 3,654 5,793 $17.60
41-1012 First-Line Sup./Mgrs of Non-Retail Sales Workers 13,195 13,668 473 3.6% 47 447 748 1,242 $31.91
41-2011 Cashiers 116,913 117,084 171 0.1% 17 10,985 10,721 21,723 $9.31
41-2012 Gaming Change Persons and Booth Cashiers 416 435 19 4.6% 2 40 39 81 $11.33
41-2021 Counter and Rental Clerks 13,782 13,942 160 1.2% 16 728 1,017 1,761 $11.18
41-2022 Parts Salespersons 10,515 10,709 194 1.8% 19 462 839 1,320 $13.15
41-2031 Retail Salespersons 159,133 158,568 -565 -0.4% -56 10,057 12,606 22,607 $10.67
41-3011 Advertising Sales Agents 4,162 3,820 -342 -8.2% -34 149 345 460 $22.21
41-3021 Insurance Sales Agents 21,025 23,039 2,014 9.6% 201 895 1,185 2,281 $22.38
41-3031 Securities/Commodities/Fin. Serv. Sales Agents 10,748 11,516 768 7.1% 77 292 734 1,103 $29.03
41-3041 Travel Agents 1,972 1,457 -515 -26.1% -52 92 104 144 $14.42
41-3099 Sales Representatives, Services, All Other 33,702 35,510 1,808 5.4% 181 1,095 2,987 4,263 $23.53
41-4011 Sales Rep., Wholesale & Mfg, Tech./Sci. Prod. 19,441 19,811 370 1.9% 37 648 1,314 1,999 $33.84
41-4012 Sales Rep., Wholesale/Mfg, ex. Tech./Sci. Prod. 50,220 50,887 667 1.3% 67 1,668 3,386 5,121 $27.59
41-9011 Demonstrators and Product Promoters 1,210 1,273 63 5.2% 6 125 84 215 $12.26
41-9021 Real Estate Brokers 1,623 1,642 19 1.2% 2 84 64 150 $39.91
41-9022 Real Estate Sales Agents 15,323 16,693 1,370 8.9% 137 820 624 1,581 $15.57
41-9031 Sales Engineers 3,683 3,730 47 1.3% 5 87 285 377 $40.04
41-9041 Telemarketers 13,498 14,246 748 5.5% 75 827 1,308 2,210 $11.11
41-9091 Door-To-Door Sales, News/St. Vendors, & Rel. 5,168 5,074 -94 -1.8% -9 345 191 527 $10.96
41-9099 Sales and Related Workers, All Other 2,509 2,745 236 9.4% 24 139 200 363 $13.19
43-0000 Office & Administrative Support Occupations 840,532 832,514 -8,018 -1.0% -802 42,566 49,986 91,750 $16.22
43-1011 First-Line Sup/Mgrs of Office & Admin. Support 45,938 46,583 645 1.4% 64 1,795 2,670 4,529 $25.52
43-2011 Switchboard Operators, Including Answering Service 2,676 2,154 -522 -19.5% -52 152 161 261 $13.06
43-2021 Telephone Operators 340 274 -66 -19.4% -7 19 23 35 $17.69
43-3011 Bill and Account Collectors 13,759 13,338 -421 -3.1% -42 509 889 1,356 $15.91
43-3021 Billing and Posting Clerks and Machine Operators 21,639 24,041 2,402 11.1% 240 977 1,258 2,475 $17.36
43-3031 Bookkeeping, Accounting, and Auditing Clerks 66,288 63,954 -2,334 -3.5% -233 4,032 3,129 6,928 $18.13
43-3041 Gaming Cage Workers 382 403 21 5.5% 2 24 36 62 $13.21
43-3051 Payroll and Timekeeping Clerks 6,295 6,038 -257 -4.1% -26 260 347 581 $20.33

45
Appendix Table J – cont’d. Ohio Occupational Employment* Projections Report, 2016-2026
Employment Change in Median
2016 2026 Employment Annual Openings Wage***
Code Occupational Title** Annual Projected 2016-2026 Percent Growth Exit Transfers Total May 2017
43-3061 Procurement Clerks 3,891 3,872 -19 -0.5% -2 163 252 413 $19.41
43-3071 Tellers 19,334 17,474 -1,860 -9.6% -186 943 1,182 1,939 $12.59
43-3099 Financial Clerks, All Other 2,447 2,680 233 9.5% 23 97 169 289 $18.08
43-4011 Brokerage Clerks 2,918 3,228 310 10.6% 31 77 234 342 $21.53
43-4021 Correspondence Clerks 508 491 -17 -3.3% -2 23 33 54 $16.68
43-4031 Court, Municipal, and License Clerks 7,957 8,154 197 2.5% 20 360 316 696 $17.38
43-4041 Credit Authorizers, Checkers, and Clerks 1,412 1,360 -52 -3.7% -5 48 90 133 $17.54
43-4051 Customer Service Representatives 90,387 92,566 2,179 2.4% 218 4,676 6,863 11,757 $15.50
43-4061 Eligibility Interviewers, Government Programs 4,313 4,588 275 6.4% 28 177 209 414 $19.85
43-4071 File Clerks 4,453 3,832 -621 -13.9% -62 254 251 443 $15.46
43-4081 Hotel, Motel, and Resort Desk Clerks 6,143 6,605 462 7.5% 46 352 630 1,028 $9.67
43-4111 Interviewers, Except Eligibility and Loan 8,922 9,082 160 1.8% 16 481 563 1,060 $15.06
43-4121 Library Assistants, Clerical 6,118 6,298 180 2.9% 18 494 375 887 $11.58
43-4131 Loan Interviewers and Clerks 11,375 12,675 1,300 11.4% 130 432 695 1,257 $17.57
43-4141 New Accounts Clerks 2,307 2,171 -136 -5.9% -14 96 138 220 $16.47
43-4151 Order Clerks 10,193 9,763 -430 -4.2% -43 463 653 1,073 $15.36
43-4161 Human Resources Assis., ex. Payroll & Timekp 4,599 4,483 -116 -2.5% -12 192 305 485 $18.47
43-4171 Receptionists and Information Clerks 26,252 26,369 117 0.4% 12 1,636 1,746 3,394 $12.29
43-4181 Reservation/Trans. Ticket Agents & Travel Clerks 2,436 2,560 124 5.1% 12 108 149 269 $11.90
43-4199 Information and Record Clerks, All Other 3,787 4,108 321 8.5% 32 192 247 471 $19.51
43-5011 Cargo and Freight Agents 2,682 2,461 -221 -8.2% -22 80 128 186 $19.04
43-5021 Couriers and Messengers 2,042 2,176 134 6.6% 13 97 92 202 $12.50
43-5031 Police, Fire, and Ambulance Dispatchers 4,258 4,429 171 4.0% 17 153 234 404 $20.91
43-5032 Dispatchers, Except Police, Fire, and Ambulance 7,520 7,337 -183 -2.4% -18 262 400 644 $18.76
43-5041 Meter Readers, Utilities 1,017 918 -99 -9.7% -10 31 39 60 $21.38
43-5051 Postal Service Clerks 2,673 2,292 -381 -14.3% -38 126 68 156 $28.15
43-5052 Postal Service Mail Carriers 12,761 10,940 -1,821 -14.3% -182 458 334 610 $26.39
43-5053 Postal Service Mail Sorters/Proc/Proc Mach. Op 3,806 3,100 -706 -18.5% -71 146 98 173 $27.53
43-5061 Production, Planning, and Expediting Clerks 14,237 14,685 448 3.1% 45 502 938 1,485 $22.47
43-5071 Shipping, Receiving, and Traffic Clerks 34,237 33,890 -347 -1.0% -35 1,330 2,028 3,323 $15.21
43-5081 Stock Clerks and Order Fillers 83,964 87,287 3,323 4.0% 332 4,675 6,100 11,107 $11.56
43-5111 Weighers/Meas./Checkers/Samplers, Recordkp 2,505 2,610 105 4.2% 10 101 146 257 $15.65
43-6011 Executive Secretaries and Administrative Assistants 21,735 17,486 -4,249 -19.5% -425 1,056 1,028 1,659 $25.74
43-6012 Legal Secretaries 7,417 5,365 -2,052 -27.7% -205 344 335 474 $20.72
43-6013 Medical Secretaries 40,237 46,776 6,539 16.3% 654 2,344 2,280 5,278 $15.52
43-6014 Secretaries, Except Legal, Medical, and Executive 83,502 76,216 -7,286 -8.7% -729 4,302 4,185 7,758 $16.62
43-9011 Computer Operators 1,432 1,074 -358 -25.0% -36 50 76 90 $18.83
43-9021 Data Entry Keyers 6,249 4,765 -1,484 -23.7% -148 283 355 490 $14.46
43-9022 Word Processors and Typists 1,788 1,184 -604 -33.8% -60 94 71 105 $18.72
43-9041 Insurance Claims and Policy Processing Clerks 20,268 22,277 2,009 9.9% 201 909 1,194 2,304 $18.11
43-9051 Mail Clerks & Mail Machine Op., ex. Postal Serv. 3,631 3,182 -449 -12.4% -45 185 191 331 $13.92
43-9061 Office Clerks, General 94,521 91,652 -2,869 -3.0% -287 5,462 5,323 10,498 $14.88
43-9071 Office Machine Operators, Except Computer 2,829 2,420 -409 -14.5% -41 115 173 247 $13.18
43-9111 Statistical Assistants 658 685 27 4.1% 3 31 51 85 $20.16
43-9199 Office and Administrative Support Workers, All Other 5,526 6,170 644 11.7% 64 254 372 690 $17.74

46
Appendix Table J – cont’d. Ohio Occupational Employment* Projections Report, 2016-2026
Employment Change in Median
2016 2026 Employment Annual Openings Wage***
Code Occupational Title** Annual Projected 2016-2026 Percent Growth Exit Transfers Total May 2017
45-0000 Farming, Fishing, & Forestry Occupations 13,947 13,534 -413 -3.0% -41 504 1,523 1,986 $13.51
45-1011 FL Sup/Mgrs of Farming/Fishing/Forestry Wrks. 645 631 -14 -2.2% -1 21 63 83 $20.63
45-2011 Agricultural Inspectors 390 393 3 0.8% 0 17 35 52 $23.97
45-2041 Graders and Sorters, Agricultural Products 549 534 -15 -2.7% -2 22 51 71 $11.26
45-2091 Agricultural Equipment Operators 1,071 1,089 18 1.7% 2 40 123 165 $17.21
45-2092 Farmworkers/Laborers, Crop/Nursery/Greenhse 8,993 8,781 -212 -2.4% -21 325 1,013 1,317 $11.85
45-2093 Farmworkers, Farm and Ranch Animals 1,414 1,288 -126 -8.9% -13 49 154 190 $11.75
45-4021 Fallers 131 116 -15 -11.5% -2 4 11 13 $19.56 †††
45-4022 Logging Equipment Operators 338 306 -32 -9.5% -3 11 29 37 $14.17
47-0000 Construction & Extraction Occupations 212,889 230,669 17,780 8.4% 1,778 7,781 14,597 24,156 $22.36
47-1011 First-Line Sup/Mgrs of Con. Trades/Extract. Work 16,026 17,544 1,518 9.5% 152 537 1,059 1,748 $30.05
47-2011 Boilermakers 608 631 23 3.8% 2 19 40 61 $33.82
47-2021 Brickmasons and Blockmasons 4,062 4,450 388 9.6% 39 123 236 398 $25.64
47-2031 Carpenters 28,110 30,019 1,909 6.8% 191 999 1,615 2,805 $21.88
47-2041 Carpet Installers 866 928 62 7.2% 6 28 47 81 $16.78
47-2042 Floor Layers, Except Carpet, Wood, and Hard Tiles 333 361 28 8.4% 3 11 18 32 $18.99
47-2044 Tile and Marble Setters 923 1,005 82 8.9% 8 30 50 88 $21.54
47-2051 Cement Masons and Concrete Finishers 4,721 5,241 520 11.0% 52 189 338 579 $21.21
47-2061 Construction Laborers 45,157 49,079 3,922 8.7% 392 1,644 3,106 5,142 $18.75
47-2071 Paving, Surfacing, and Tamping Equipment Operators 1,193 1,309 116 9.7% 12 41 85 138 $22.51
47-2073 Operating Engineers & Other Con. Equip. Op. 15,198 16,072 874 5.8% 87 597 1,096 1,780 $26.15
47-2081 Drywall and Ceiling Tile Installers 1,585 1,559 -26 -1.6% -3 48 88 133 $18.22
47-2082 Tapers 251 252 1 0.4% 0 8 14 22 $25.73
47-2111 Electricians 24,524 26,506 1,982 8.1% 198 889 1,896 2,983 $24.17
47-2121 Glaziers 1,453 1,574 121 8.3% 12 55 116 183 $19.02
47-2131 Insulation Workers, Floor, Ceiling, and Wall 502 516 14 2.8% 1 14 39 54 $18.67
47-2132 Insulation Workers, Mechanical 964 1,064 100 10.4% 10 27 78 115 $27.52
47-2141 Painters, Construction and Maintenance 9,405 9,816 411 4.4% 41 328 479 848 $18.61
47-2142 Paperhangers 421 438 17 4.0% 2 15 21 38 $17.42
47-2151 Pipelayers 675 697 22 3.3% 2 25 46 73 $21.91
47-2152 Plumbers, Pipefitters, and Steamfitters 16,071 18,454 2,383 14.8% 238 626 1,155 2,019 $25.15
47-2161 Plasterers and Stucco Masons 356 362 6 1.7% 1 13 20 34 $22.33
47-2171 Reinforcing Iron and Rebar Workers 463 498 35 7.6% 4 12 37 53 $26.03
47-2181 Roofers 5,757 6,353 596 10.4% 60 174 410 644 $17.53
47-2211 Sheet Metal Workers 4,154 4,491 337 8.1% 34 149 296 479 $25.04
47-2221 Structural Iron and Steel Workers 3,121 3,506 385 12.3% 38 96 249 383 $28.63
47-3011 Helpers--Brick/Block/Stone/Tile & Marble Setters 615 688 73 11.9% 7 28 63 98 $16.86
47-3012 Helpers--Carpenters 834 930 96 11.5% 10 37 85 132 $13.39
47-3013 Helpers--Electricians 943 1,033 90 9.5% 9 42 95 146 $13.51
47-3015 Helpers--Pipelayers/Plumbers/Pipefitters/Steamf 1,026 1,193 167 16.3% 17 47 107 171 $12.58
47-3016 Helpers--Roofers 465 520 55 11.8% 6 21 48 75 $14.09
47-4011 Construction and Building Inspectors 2,883 3,073 190 6.6% 19 147 168 334 $26.56
47-4021 Elevator Installers and Repairers 526 592 66 12.5% 7 18 46 71 $36.60
47-4031 Fence Erectors 796 874 78 9.8% 8 29 62 99 $16.75
47-4041 Hazardous Materials Removal Workers 2,226 2,421 195 8.8% 20 93 182 295 $21.00

47
Appendix Table J – cont’d. Ohio Occupational Employment* Projections Report, 2016-2026
Employment Change in Median
2016 2026 Employment Annual Openings Wage***
Code Occupational Title** Annual Projected 2016-2026 Percent Growth Exit Transfers Total May 2017
47-4051 Highway Maintenance Workers 7,848 8,012 164 2.1% 16 335 455 806 $19.24
47-4071 Septic Tank Servicers and Sewer Pipe Cleaners 1,469 1,658 189 12.9% 19 78 114 211 $20.42
47-4099 Construction and Related Workers, All Other 1,073 1,151 78 7.3% 8 44 72 124 47-5012 Rotary Drill Operators, Oil and Gas 241 282 41 17.0% 4 6 24 34 $24.21
47-5013 Service Unit Operators, Oil, Gas, and Mining 686 798 112 16.3% 11 18 69 98 $20.35
47-5021 Earth Drillers, Except Oil and Gas 458 472 14 3.1% 1 12 37 50 $20.17
47-5041 Continuous Mining Machine Operators 736 691 -45 -6.1% -4 21 62 79 $28.05
47-5042 Mine Cutting and Channeling Machine Operators 200 187 -13 -6.5% -1 6 17 22 $21.01
47-5051 Rock Splitters, Quarry 116 105 -11 -9.5% -1 3 10 12 $14.93
47-5071 Roustabouts, Oil and Gas 713 836 123 17.3% 12 26 67 105 $16.92
47-5081 Helpers--Extraction Workers 179 198 19 10.6% 2 6 17 25 $12.96
49-0000 Installation, Maintenance, & Repair Occupations 223,384 232,205 8,821 3.9% 882 7,922 13,320 22,124 $21.02
49-1011 FL Sup/Mgrs of Mechanics/Installers/Repairers 16,746 17,401 655 3.9% 66 553 880 1,499 $29.66
49-2011 Computer, ATM, & Office Machine Repairers 3,923 3,745 -178 -4.5% -18 126 244 352 $16.54
49-2021 Radio Mechanics 671 613 -58 -8.6% -6 21 45 60 $27.43
49-2022 Telecomm. Equip. Install/Repair, ex. Line Install 9,158 8,534 -624 -6.8% -62 293 625 856 $23.05
49-2091 Avionics Technicians 436 518 82 18.8% 8 10 27 45 $24.69
49-2092 Electric Motor, Power Tool, and Related Repairers 796 845 49 6.2% 5 25 50 80 $21.64
49-2093 Electrical/Electronics Install/Repair, Trans. Equip. 231 237 6 2.6% 1 6 14 21 $24.31
49-2094 Electrical/Electronics Repair, Comm/Indus Equip. 2,324 2,325 1 0.0% 0 58 142 200 $27.09
49-2095 Electrical/Electronics Repair, Pwrhse/Substa/Rly 582 560 -22 -3.8% -2 14 35 47 $36.00
49-2096 Electronic Equipment Install/Repair, Motor Veh. 229 124 -105 -45.9% -10 6 11 7 $18.04
49-2097 Electronic Home Entertainm Equip. Install/Repair 1,362 1,384 22 1.6% 2 49 92 143 $13.37
49-2098 Security and Fire Alarm Systems Installers 2,569 2,882 313 12.2% 31 89 204 324 $21.62
49-3011 Aircraft Mechanics and Service Technicians 4,130 4,566 436 10.6% 44 136 192 372 $26.32
49-3021 Automotive Body and Related Repairers 6,453 6,711 258 4.0% 26 228 392 646 $18.56
49-3022 Automotive Glass Installers and Repairers 976 1,003 27 2.8% 3 37 57 97 $18.21
49-3023 Automotive Service Technicians and Mechanics 28,328 28,675 347 1.2% 35 899 1,721 2,655 $18.02
49-3031 Bus & Truck Mechanics & Diesel Engine Spec. 12,376 13,073 697 5.6% 70 390 726 1,186 $21.74
49-3041 Farm Equipment Mechanics 1,470 1,582 112 7.6% 11 48 96 155 $17.18
49-3042 Mobile Heavy Equipment Mechanics, Except Engines 3,620 3,847 227 6.3% 23 116 235 374 $26.07
49-3043 Rail Car Repairers 621 646 25 4.0% 2 20 40 62 $18.00
49-3051 Motorboat Mechanics 431 426 -5 -1.2% 0 17 26 43 $17.48
49-3052 Motorcycle Mechanics 751 742 -9 -1.2% -1 30 46 75 $16.68
49-3053 Outdoor Power Equip. & Other Sm Engine Mech. 1,288 1,403 115 8.9% 12 55 83 150 $14.63
49-3091 Bicycle Repairers 390 465 75 19.2% 8 16 37 61 $13.10
49-3092 Recreational Vehicle Service Technicians 332 319 -13 -3.9% -1 12 28 39 $16.89
49-3093 Tire Repairers and Changers 3,844 3,748 -96 -2.5% -10 141 326 457 $11.64
49-9011 Mechanical Door Repairers 1,141 1,256 115 10.1% 12 30 59 101 $19.32
49-9012 Control & Valve Install/Repair, ex. Mech. Door 1,348 1,459 111 8.2% 11 35 70 116 $29.40
49-9021 Heating, AC, & Refrigeration Mechanics/Installers 11,788 13,560 1,772 15.0% 177 350 850 1,377 $22.19
49-9031 Home Appliance Repairers 2,454 2,302 -152 -6.2% -15 116 104 205 $16.67
49-9041 Industrial Machinery Mechanics 19,485 20,854 1,369 7.0% 137 681 1,043 1,861 $24.14
49-9043 Maintenance Workers, Machinery 2,562 2,698 136 5.3% 14 112 152 278 $21.00
49-9044 Millwrights 2,340 2,608 268 11.5% 27 78 140 245 $29.47
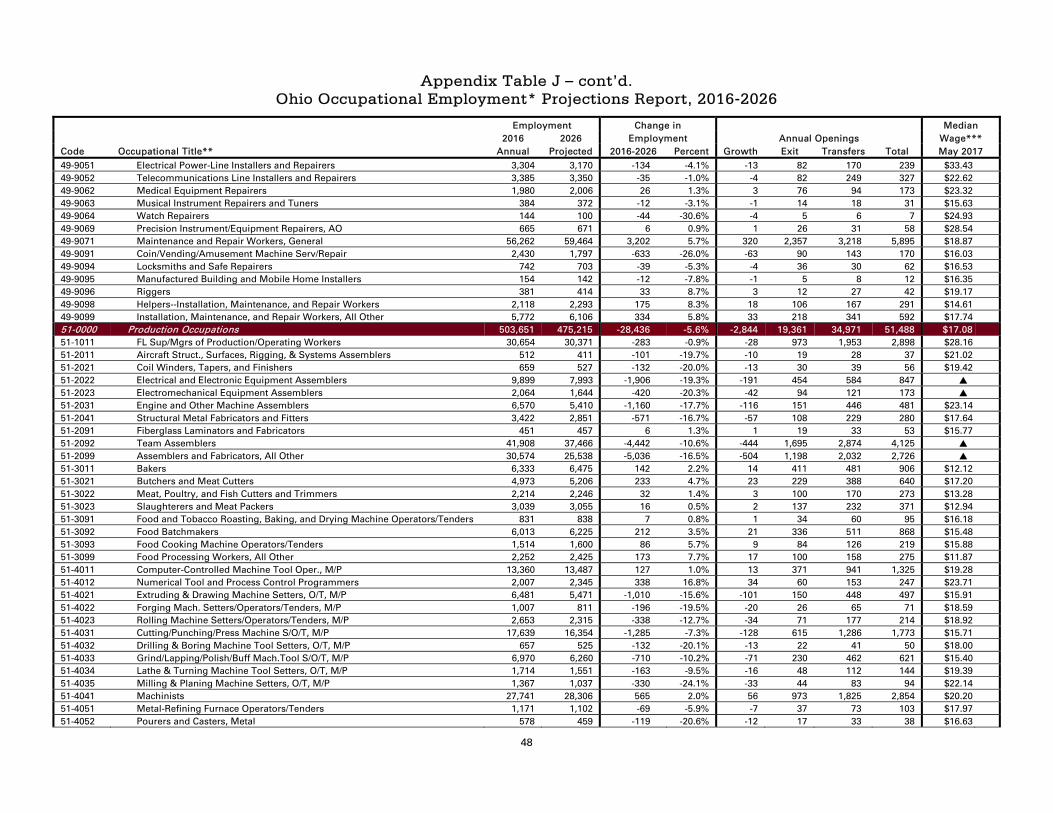
48
Appendix Table J – cont’d. Ohio Occupational Employment* Projections Report, 2016-2026
Employment Change in Median
2016 2026 Employment Annual Openings Wage***
Code Occupational Title** Annual Projected 2016-2026 Percent Growth Exit Transfers Total May 2017
49-9051 Electrical Power-Line Installers and Repairers 3,304 3,170 -134 -4.1% -13 82 170 239 $33.43
49-9052 Telecommunications Line Installers and Repairers 3,385 3,350 -35 -1.0% -4 82 249 327 $22.62
49-9062 Medical Equipment Repairers 1,980 2,006 26 1.3% 3 76 94 173 $23.32
49-9063 Musical Instrument Repairers and Tuners 384 372 -12 -3.1% -1 14 18 31 $15.63
49-9064 Watch Repairers 144 100 -44 -30.6% -4 5 6 7 $24.93
49-9069 Precision Instrument/Equipment Repairers, AO 665 671 6 0.9% 1 26 31 58 $28.54
49-9071 Maintenance and Repair Workers, General 56,262 59,464 3,202 5.7% 320 2,357 3,218 5,895 $18.87
49-9091 Coin/Vending/Amusement Machine Serv/Repair 2,430 1,797 -633 -26.0% -63 90 143 170 $16.03
49-9094 Locksmiths and Safe Repairers 742 703 -39 -5.3% -4 36 30 62 $16.53
49-9095 Manufactured Building and Mobile Home Installers 154 142 -12 -7.8% -1 5 8 12 $16.35
49-9096 Riggers 381 414 33 8.7% 3 12 27 42 $19.17
49-9098 Helpers--Installation, Maintenance, and Repair Workers 2,118 2,293 175 8.3% 18 106 167 291 $14.61
49-9099 Installation, Maintenance, and Repair Workers, All Other 5,772 6,106 334 5.8% 33 218 341 592 $17.74
51-0000 Production Occupations 503,651 475,215 -28,436 -5.6% -2,844 19,361 34,971 51,488 $17.08
51-1011 FL Sup/Mgrs of Production/Operating Workers 30,654 30,371 -283 -0.9% -28 973 1,953 2,898 $28.16
51-2011 Aircraft Struct., Surfaces, Rigging, & Systems Assemblers 512 411 -101 -19.7% -10 19 28 37 $21.02
51-2021 Coil Winders, Tapers, and Finishers 659 527 -132 -20.0% -13 30 39 56 $19.42
51-2022 Electrical and Electronic Equipment Assemblers 9,899 7,993 -1,906 -19.3% -191 454 584 847 51-2023 Electromechanical Equipment Assemblers 2,064 1,644 -420 -20.3% -42 94 121 173 51-2031 Engine and Other Machine Assemblers 6,570 5,410 -1,160 -17.7% -116 151 446 481 $23.14
51-2041 Structural Metal Fabricators and Fitters 3,422 2,851 -571 -16.7% -57 108 229 280 $17.64
51-2091 Fiberglass Laminators and Fabricators 451 457 6 1.3% 1 19 33 53 $15.77
51-2092 Team Assemblers 41,908 37,466 -4,442 -10.6% -444 1,695 2,874 4,125 51-2099 Assemblers and Fabricators, All Other 30,574 25,538 -5,036 -16.5% -504 1,198 2,032 2,726 51-3011 Bakers 6,333 6,475 142 2.2% 14 411 481 906 $12.12
51-3021 Butchers and Meat Cutters 4,973 5,206 233 4.7% 23 229 388 640 $17.20
51-3022 Meat, Poultry, and Fish Cutters and Trimmers 2,214 2,246 32 1.4% 3 100 170 273 $13.28
51-3023 Slaughterers and Meat Packers 3,039 3,055 16 0.5% 2 137 232 371 $12.94
51-3091 Food and Tobacco Roasting, Baking, and Drying Machine Operators/Tenders 831 838 7 0.8% 1 34 60 95 $16.18
51-3092 Food Batchmakers 6,013 6,225 212 3.5% 21 336 511 868 $15.48
51-3093 Food Cooking Machine Operators/Tenders 1,514 1,600 86 5.7% 9 84 126 219 $15.88
51-3099 Food Processing Workers, All Other 2,252 2,425 173 7.7% 17 100 158 275 $11.87
51-4011 Computer-Controlled Machine Tool Oper., M/P 13,360 13,487 127 1.0% 13 371 941 1,325 $19.28
51-4012 Numerical Tool and Process Control Programmers 2,007 2,345 338 16.8% 34 60 153 247 $23.71
51-4021 Extruding & Drawing Machine Setters, O/T, M/P 6,481 5,471 -1,010 -15.6% -101 150 448 497 $15.91
51-4022 Forging Mach. Setters/Operators/Tenders, M/P 1,007 811 -196 -19.5% -20 26 65 71 $18.59
51-4023 Rolling Machine Setters/Operators/Tenders, M/P 2,653 2,315 -338 -12.7% -34 71 177 214 $18.92
51-4031 Cutting/Punching/Press Machine S/O/T, M/P 17,639 16,354 -1,285 -7.3% -128 615 1,286 1,773 $15.71
51-4032 Drilling & Boring Machine Tool Setters, O/T, M/P 657 525 -132 -20.1% -13 22 41 50 $18.00
51-4033 Grind/Lapping/Polish/Buff Mach.Tool S/O/T, M/P 6,970 6,260 -710 -10.2% -71 230 462 621 $15.40
51-4034 Lathe & Turning Machine Tool Setters, O/T, M/P 1,714 1,551 -163 -9.5% -16 48 112 144 $19.39
51-4035 Milling & Planing Machine Setters, O/T, M/P 1,367 1,037 -330 -24.1% -33 44 83 94 $22.14
51-4041 Machinists 27,741 28,306 565 2.0% 56 973 1,825 2,854 $20.20
51-4051 Metal-Refining Furnace Operators/Tenders 1,171 1,102 -69 -5.9% -7 37 73 103 $17.97
51-4052 Pourers and Casters, Metal 578 459 -119 -20.6% -12 17 33 38 $16.63

49
Appendix Table J – cont’d. Ohio Occupational Employment* Projections Report, 2016-2026
Employment Change in Median
2016 2026 Employment Annual Openings Wage***
Code Occupational Title** Annual Projected 2016-2026 Percent Growth Exit Transfers Total May 2017
51-4061 Model Makers, Metal and Plastic 458 416 -42 -9.2% -4 16 30 42 $24.57
51-4062 Patternmakers, Metal and Plastic 351 305 -46 -13.1% -5 12 23 30 $19.53
51-4071 Foundry Mold and Coremakers 1,797 1,451 -346 -19.3% -35 60 123 148 $16.63
51-4072 Molding/Coremaking/Casting Mach. S/O/T, M/P 15,854 13,498 -2,356 -14.9% -236 537 1,110 1,411 $14.70
51-4081 Multiple Machine Tool Setters, Operators, and Tenders, Metal and Plastic 13,980 13,601 -379 -2.7% -38 511 954 1,427 $16.45
51-4111 Tool and Die Makers 7,846 7,294 -552 -7.0% -55 297 411 653 $24.70
51-4121 Welders, Cutters, Solderers, and Brazers 18,078 18,593 515 2.8% 52 488 1,432 1,972 $18.58
51-4122 Welding/Soldering/Brazing Machine Setters, O/T 3,152 2,870 -282 -8.9% -28 80 235 287 $17.97
51-4191 Heat Treating Equip. Setters, O/T, M/P 1,677 1,454 -223 -13.3% -22 58 108 144 $18.12
51-4192 Lay-Out Workers, Metal and Plastic 143 138 -5 -3.5% 0 5 10 15 $18.42
51-4193 Plating & Coating Machine Setters, O/T, M/P 2,408 2,101 -307 -12.7% -31 57 166 192 $15.75
51-4194 Tool Grinders, Filers, and Sharpeners 742 726 -16 -2.2% -2 22 68 88 $17.35
51-4199 Metal Workers and Plastic Workers, All Other 1,448 1,342 -106 -7.3% -11 52 96 137 $17.24
51-5111 Prepress Technicians and Workers 1,813 1,363 -450 -24.8% -45 66 120 141 $18.33
51-5112 Printing Press Operators and Job Printers 9,117 8,093 -1,024 -11.2% -102 335 560 793 $16.42
51-5113 Print Binding and Finishing Workers 2,901 2,462 -439 -15.1% -44 203 148 307 $13.95
51-6011 Laundry and Dry-Cleaning Workers 6,685 6,792 107 1.6% 11 452 453 916 $9.88
51-6021 Pressers, Textile, Garment, and Related Materials 2,167 2,147 -20 -0.9% -2 130 142 270 $9.88
51-6031 Sewing Machine Operators 3,283 2,688 -595 -18.1% -60 170 144 254 $11.80
51-6041 Shoe and Leather Workers and Repairers 480 456 -24 -5.0% -2 22 22 42 $11.36
51-6062 Textile Cutting Machine Setters, Operators, & Tenders 247 221 -26 -10.5% -3 16 16 29 $14.28
51-6063 Textile Knitting and Weaving Machine Setters, O/T 174 154 -20 -11.5% -2 9 11 18 $13.94
51-6091 Extrud/Form Mach S/O/T, Synthetic/Glass Fibers 748 707 -41 -5.5% -4 38 49 83 $16.13
51-6093 Upholsterers 1,030 1,025 -5 -0.5% 0 45 59 104 $13.90
51-6099 Textile, Apparel, and Furnishings Workers, All Other 299 291 -8 -2.7% -1 16 20 35 $14.45
51-7011 Cabinetmakers and Bench Carpenters 4,758 4,931 173 3.6% 17 226 268 511 $15.58
51-7021 Furniture Finishers 1,331 1,350 19 1.4% 2 75 48 125 $14.50
51-7041 Sawing Mach. Setters/Operators/Tenders, Wood 1,181 1,181 0 0.0% 0 48 87 135 $15.28
51-7042 Woodworking Machine Setters, O/T, Except Sawing 4,611 4,698 87 1.9% 9 179 324 512 $14.46
51-8012 Power Distributors and Dispatchers 826 759 -67 -8.1% -7 19 49 61 $38.13
51-8013 Power Plant Operators 1,181 1,118 -63 -5.3% -6 28 71 93 $34.70
51-8021 Stationary Engineers and Boiler Operators 1,043 1,060 17 1.6% 2 34 74 110 $27.02
51-8031 Water/Liquid Waste Treatment Plant/System Op. 4,766 4,387 -379 -8.0% -38 130 244 336 $23.05
51-8091 Chemical Plant and System Operators 2,629 2,397 -232 -8.8% -23 58 189 224 $28.30
51-8093 Petroleum Pump System Oper./Refinery Oper./Gaugers 1,548 1,522 -26 -1.7% -3 36 115 148 $30.80
51-8099 Plant and System Operators, All Other 461 448 -13 -2.8% -1 10 34 43 $25.00
51-9011 Chemical Equipment Operators/Tenders 5,634 5,354 -280 -5.0% -28 151 431 554 $21.30
51-9012 Sep./Filter/Clarify/Precipitating/Still Mach. S/O/T 1,901 1,840 -61 -3.2% -6 51 147 192 $17.66
51-9021 Crushing/Grinding/Polishing Machine S/O/T 1,179 1,058 -121 -10.3% -12 40 84 112 $16.96
51-9022 Grinding and Polishing Workers, Hand 839 669 -170 -20.3% -17 27 56 66 $14.65
51-9023 Mixing/Blending Machine Setters/Operators/Tenders 7,656 7,279 -377 -4.9% -38 269 560 791 $17.81
51-9032 Cutting/Slicing Mach. Setters/Operators/Tenders 3,843 3,638 -205 -5.3% -20 135 285 400 $16.80
51-9041 Extrud/Form/Pressing/Compacting Mach. S/O/T 6,994 6,301 -693 -9.9% -69 258 534 723 $15.89
51-9051 Furnace/Kiln/Oven/Drier/Kettle Oper./Tenders 1,481 1,348 -133 -9.0% -13 60 78 125 $17.20
51-9061 Inspectors, Testers, Sorters, Samplers, and Weighers 31,179 26,970 -4,209 -13.5% -421 1,209 2,226 3,014 $18.11

50
Appendix Table J – cont’d. Ohio Occupational Employment* Projections Report, 2016-2026
Employment Change in Median
2016 2026 Employment Annual Openings Wage***
Code Occupational Title** Annual Projected 2016-2026 Percent Growth Exit Transfers Total May 2017
51-9071 Jewelers and Precious Stone and Metal Workers 1,145 1,078 -67 -5.9% -7 66 49 108 $18.89
51-9081 Dental Laboratory Technicians 983 1,096 113 11.5% 11 45 69 125 $19.10
51-9082 Medical Appliance Technicians 691 787 96 13.9% 10 32 49 91 $16.11
51-9083 Ophthalmic Laboratory Technicians 960 1,069 109 11.4% 11 44 68 123 $13.80
51-9111 Packaging and Filling Machine Operators/Tenders 17,975 18,266 291 1.6% 29 857 1,203 2,089 $14.74
51-9121 Coating/Painting/Spraying Machine Setters, O/T 6,639 6,570 -69 -1.0% -7 188 494 675 $16.54
51-9122 Painters, Transportation Equipment 2,641 2,820 179 6.8% 18 78 204 300 $18.63
51-9141 Semiconductor Processors 676 650 -26 -3.8% -3 26 48 71 $18.81
51-9151 Photographic Process Workers and Processing Machine Operators 980 722 -258 -26.3% -26 44 87 105 $13.84
51-9191 Cementing and Gluing Machine Operators/Tenders 898 846 -52 -5.8% -5 41 53 89 $15.87
51-9192 Cleaning/Washing/Metal Pickling Equipment O/T 1,390 1,395 5 0.4% 0 65 114 179 $15.27
51-9193 Cooling and Freezing Equipment Operators/Tenders 888 895 7 0.8% 1 35 65 101 $13.69
51-9194 Etchers and Engravers 572 565 -7 -1.2% -1 35 33 67 $16.34
51-9195 Molders/Shapers/Casters, ex. Metal & Plastic 2,591 2,399 -192 -7.4% -19 96 154 231 $15.59
51-9196 Paper Goods Machine Setters, Operators, and Tenders 4,111 3,753 -358 -8.7% -36 142 256 362 $18.24
51-9197 Tire Builders 1,146 911 -235 -20.5% -24 33 82 91 $24.31
51-9198 Helpers--Production Workers 18,320 19,742 1,422 7.8% 142 1,020 1,812 2,974 $13.85
51-9199 Production Workers, All Other 18,211 18,992 781 4.3% 78 731 1,359 2,168 $14.26
53-0000 Transportation & Material Moving Occupations 415,222 434,014 18,792 4.5% 1,879 21,046 30,617 53,542 $14.64
53-1021 FL Sup/Mgrs of Help/Labor/Mat. Movers, Hand 7,054 7,523 469 6.6% 47 234 501 782 53-1031 FL Sup/Mgr of Trans/Mat.-Mov. Mach & Veh Op 7,124 7,513 389 5.5% 39 235 503 777 53-2011 Airline Pilots, Copilots, and Flight Attendants 1,137 1,200 63 5.5% 6 33 75 114 $90,890 ††
53-2012 Commercial Pilots 2,165 2,397 232 10.7% 23 64 146 233 $77,510 ††
53-2021 Air Traffic Controllers 758 839 81 10.7% 8 26 47 81 $65.96
53-2022 Airfield Operations Specialists 279 308 29 10.4% 3 9 17 29 $20.12
53-2031 Flight Attendants 790 880 90 11.4% 9 41 47 97 $50,720 ††
53-3011 Ambulance Drivers & Attendants, Ex. EMT 926 1,117 191 20.6% 19 62 82 163 $10.83
53-3021 Bus Drivers, Transit and Intercity 6,077 6,330 253 4.2% 25 487 253 765 $20.18
53-3022 Bus Drivers, School 10,891 11,921 1,030 9.5% 103 895 466 1,464 $15.44
53-3031 Driver/Sales Workers 24,089 21,382 -2,707 -11.2% -271 964 1,428 2,121 $9.47
53-3032 Truck Drivers, Heavy and Tractor-Trailer 76,084 79,093 3,009 4.0% 301 3,290 4,874 8,465 $20.09
53-3033 Truck Drivers, Light or Delivery Services 37,947 39,515 1,568 4.1% 157 1,642 2,433 4,232 $14.27
53-3041 Taxi Drivers and Chauffeurs 11,650 12,810 1,160 10.0% 116 726 495 1,337 $10.39
53-3099 Motor Vehicle Operators, All Other 6,020 6,296 276 4.6% 28 711 340 1,079 $10.04
53-4013 Rail Yard Engineers, Dinkey Operators, & Hostlers 247 260 13 5.3% 1 6 14 21 $26.15
53-4021 Railroad Brake, Signal, and Switch Operators 336 340 4 1.2% 0 8 23 31 $23.95
53-5011 Sailors and Marine Oilers 260 270 10 3.8% 1 10 21 32 $17.26
53-5021 Captains, Mates, and Pilots of Water Vessels 328 353 25 7.6% 2 11 23 36 $24.32
53-6011 Bridge and Lock Tenders 177 195 18 10.2% 2 8 13 23 $25.38
53-6021 Parking Lot Attendants 3,975 4,033 58 1.5% 6 235 353 594 $9.88
53-6031 Service Station Attendants 4,640 4,972 332 7.2% 33 258 524 815 $10.82
53-6041 Traffic Technicians 111 116 5 4.5% 0 5 8 13 $23.98
53-6051 Transportation Inspectors 762 824 62 8.1% 6 28 47 81 $26.66
53-6061 Transportation Attendants, Except Flight Attendants 368 381 13 3.5% 1 31 18 50 $12.33
53-6099 Transportation Workers, All Other 1,026 1,171 145 14.1% 14 47 76 137 $15.00

51
Appendix Table J – cont’d. Ohio Occupational Employment* Projections Report, 2016-2026
Employment Change in Median
2016 2026 Employment Annual Openings Wage***
Code Occupational Title** Annual Projected 2016-2026 Percent Growth Exit Transfers Total May 2017
53-7011 Conveyor Operators/Tenders 1,198 1,161 -37 -3.1% -4 58 98 152 $14.91
53-7021 Crane and Tower Operators 1,810 1,919 109 6.0% 11 61 131 203 $19.73
53-7032 Excavating & Loading Machine & Dragline Oper. 1,062 1,045 -17 -1.6% -2 38 75 111 $19.58
53-7041 Hoist and Winch Operators 114 111 -3 -2.6% 0 6 9 15 $17.77
53-7051 Industrial Truck and Tractor Operators 21,996 22,765 769 3.5% 77 780 1,675 2,532 $15.66
53-7061 Cleaners of Vehicles and Equipment 12,908 13,659 751 5.8% 75 685 1,152 1,912 $10.82
53-7062 Laborers/Freight/Stock/Material Movers, Hand 111,616 119,223 7,607 6.8% 761 5,718 9,868 16,347 $12.92
53-7063 Machine Feeders and Offbearers 3,993 3,899 -94 -2.4% -9 212 317 520 $11.99
53-7064 Packers and Packagers, Hand 41,664 43,514 1,850 4.4% 185 2,885 3,476 6,546 $10.98
53-7071 Gas Compressor and Gas Pumping Station Operators 151 145 -6 -4.0% -1 5 12 16 $34.02
53-7072 Pump Operators, Except Wellhead Pumpers 196 215 19 9.7% 2 7 17 26 $15.08
53-7073 Wellhead Pumpers 545 629 84 15.4% 8 21 49 78 $18.21
53-7081 Refuse and Recyclable Material Collectors 7,230 8,207 977 13.5% 98 349 562 1,009 $16.81
53-7121 Tank Car, Truck, and Ship Loaders 252 234 -18 -7.1% -2 11 18 27 $14.87
53-7199 Material Moving Workers, All Other 452 423 -29 -6.4% -3 19 32 48 $14.26
* Occupations with 100 or more workers. † National Wages
** Certain Occupations are abbreviated. †† Certain occupations only report wages at the annual level - for elementary and secondary teachers this typically reflects a 9 1/2 month school year.
Abbreviations: ††† Annual National Wages
AO = All Other N/A This wage is equal or greater than $100 per hour or $208,000 per year.
FL Sup/Mgrs = FirstLine Supervisors/Managers Wage data unavailable – OES consolidated these occupations in 2017.
M/P = Metal and Plastic *** Wage estimates are based on Ohio’s OES surveys.
PS = Postsecondary
O/T = Operators and Tenders
S/O/T = Setters, Operators and Tenders
Source: Ohio Department of Job and Family Services, Bureau of Labor Market Information, September 2018.

52
Appendix Table K
Ohio Occupational Education and Training Classification
Work Experience Typical On-The-Job Training Median
Typical Education**** in a Related Needed to Attain Competency in Wage***
Code Occupational Title** Needed for Entry Occupation the Occupation May 2017
00-0000 Total, All Occupations $17.55
11-0000 Management Occupations $45.76
11-1011 Chief Executives Bachelor's degree 5 years or more None $91.62
11-1021 General and Operations Managers Bachelor's degree 5 years or more None $44.77
11-1031 Legislators Bachelor's degree Less than 5 years None $19,190 ††
11-2011 Advertising and Promotions Managers Bachelor's degree Less than 5 years None $39.96
11-2021 Marketing Managers Bachelor's degree 5 years or more None $57.03
11-2022 Sales Managers Bachelor's degree Less than 5 years None $56.88
11-2031 Public Relations Managers Bachelor's degree 5 years or more None $48.33
11-3011 Administrative Services Managers Bachelor's degree Less than 5 years None $40.52
11-3021 Computer and Information Systems Managers Bachelor's degree 5 years or more None $59.26
11-3031 Financial Managers Bachelor's degree 5 years or more None $55.81
11-3051 Industrial Production Managers Bachelor's degree 5 years or more None $46.23
11-3061 Purchasing Managers Bachelor's degree 5 years or more None $54.81
11-3071 Transportation, Storage, and Distribution Managers High school diploma or equivalent 5 years or more None $41.85
11-3111 Compensation and Benefits Managers Bachelor's degree 5 years or more None $53.53
11-3121 Human Resources Managers Bachelor's degree 5 years or more None $50.18
11-3131 Training and Development Managers Bachelor's degree 5 years or more None $47.66
11-9013 Farmers, Ranchers, and Other Agricultural Managers High school diploma or equivalent 5 years or more None $35.11
11-9021 Construction Managers Bachelor's degree None Moderate-term on-the-job training $43.66
11-9031 Education Admin., Pre & Child Care Center/Prog. Bachelor's degree Less than 5 years None $18.60
11-9032 Education Admin., Elem. & Secondary School Master's degree 5 years or more None $86,230 ††
11-9033 Education Administrators, Postsecondary Master's degree Less than 5 years None $44.19
11-9039 Education Administrators, All Other Bachelor's degree Less than 5 years None $37.76
11-9041 Engineering Managers Bachelor's degree 5 years or more None $60.84
11-9051 Food Service Managers High school diploma or equivalent Less than 5 years None $23.28
11-9061 Funeral service Managers Associate's degree Less than 5 years None $39.07
11-9081 Lodging Managers High school diploma or equivalent Less than 5 years None $19.49
11-9111 Medical and Health Services Managers Bachelor's degree Less than 5 years None $43.67
11-9121 Natural Sciences Managers Bachelor's degree 5 years or more None $58.40
11-9131 Postmasters and Mail Superintendents High school diploma or equivalent Less than 5 years Moderate-term on-the-job training $36.53
11-9141 Property, Real Estate & Community Assn Mgrs High school diploma or equivalent Less than 5 years None $24.32
11-9151 Social and Community Service Managers Bachelor's degree Less than 5 years None $32.21
11-9161 Emergency Management Directors Bachelor's degree 5 years or more None $30.82
11-9199 Managers, All Other Bachelor's degree Less than 5 years None $47.61
13-0000 Business & Financial Operations Occupations $30.20
13-1011 Agents/Business Mgrs. Artist/Performer/Athlete Bachelor's degree Less than 5 years None $21.33
13-1021 Purchasing Agents and Buyers, Farm Products Bachelor's degree None Moderate-term on-the-job training 13-1022 Wholesale and Retail Buyers, Except Farm Products Bachelor's degree None Moderate-term on-the-job training 13-1023 Purchasing Agents, ex. Whole., Retail, & Farm Bachelor's degree None Moderate-term on-the-job training 13-1031 Claims Adjusters, Examiners, and Investigators High school diploma or equivalent None Long-term on-the-job training $31.10
13-1032 Insurance Appraisers, Auto Damage Postsecondary non-degree award None Moderate-term on-the-job training $28.69
13-1041 Compl. Off., ex. Agric, Con, Hlth/Safety, & Trans. Bachelor's degree None Moderate-term on-the-job training $28.46
13-1051 Cost Estimators Bachelor's degree None Moderate-term on-the-job training $28.53

53
Appendix Table K – cont’d. Ohio Occupational Education and Training Classification
Work Experience Typical On-The-Job Training Median
Typical Education**** in a Related Needed to Attain Competency in Wage***
Code Occupational Title** Needed for Entry Occupation the Occupation May 2017
13-1071 Human Resource Specialists Bachelor's degree None None $27.14
13-1075 Labor Relations Specialists Bachelor's degree Less than 5 years None $9.51
13-1081 Logisticians Bachelor's degree None None $35.46
13-1111 Management Analysts Bachelor's degree Less than 5 years None $35.71
13-1121 Meeting and Convention Planners Bachelor's degree None None $21.25
13-1131 Fundraisers Bachelor's degree None None $24.74
13-1141 Compensation, Benefits, and Job Analysis Specialists Bachelor's degree Less than 5 years None $27.83
13-1151 Training and Development Specialists Bachelor's degree Less than 5 years None $26.47
13-1161 Market Research Analysts and Marketing Specialists Bachelor's degree None None $28.87
13-1199 Business Operations Specialists, All Other Bachelor's degree None None $31.24
13-2011 Accountants and Auditors Bachelor's degree None None $31.02
13-2021 Appraisers and Assessors of Real Estate Bachelor's degree None Long-term on-the-job training $26.76
13-2041 Credit Analysts Bachelor's degree None None $32.39
13-2051 Financial Analysts Bachelor's degree None None $34.98
13-2052 Personal Financial Advisors Bachelor's degree None Long-term on-the-job training $39.12
13-2053 Insurance Underwriters Bachelor's degree None Moderate-term on-the-job training $33.60
13-2061 Financial Examiners Bachelor's degree None Long-term on-the-job training $32.70
13-2072 Loan Officers Bachelor's degree None Moderate-term on-the-job training $31.50
13-2081 Tax Examiners, Collectors, and Revenue Agents Bachelor's degree None Moderate-term on-the-job training $28.94
13-2082 Tax Preparers High school diploma or equivalent None Moderate-term on-the-job training $17.03
13-2099 Financial Specialists, All Other Bachelor's degree None Moderate-term on-the-job training $35.22
15-0000 Computer & Mathematical Occupations $36.89
15-1111 Computer & Information Research Scientists Master's degree None None $50.96
15-1121 Computer Systems Analysts Bachelor's degree None None $40.67
15-1122 Information Security Analysts Bachelor's degree Less than 5 years None $42.62
15-1131 Computer Programmers Bachelor's degree None None $33.21
15-1132 Software Developers, Applications Bachelor's degree None None $42.89
15-1133 Software Developers, Systems Software Bachelor's degree None None $45.64
15-1134 Web Developers Associate's degree None None $27.30
15-1141 Database Administrators Bachelor's degree None None $40.03
15-1142 Network and Comp. Systems Architects and Admins Bachelor's degree None None $35.21
15-1143 Computer Network Architects Bachelor's degree 5 years or more None $45.80
15-1151 Computer User Support Specialists Some college, no degree None None $21.68
15-1152 Computer Network Support Specialists Associate's degree None None $27.76
15-1199 Computer Occupations, All Other Bachelor's degree None None $38.15
15-2011 Actuaries Bachelor's degree None Long-term on-the-job training $45.23
15-2031 Operations Research Analysts Bachelor's degree None None $38.74
15-2041 Statisticians Master's degree None None $40.31
17-0000 Architecture & Engineering Occupations $35.60
17-1011 Architects, Except Landscape and Naval Bachelor's degree None Internship/residency $34.68
17-1012 Landscape Architects Bachelor's degree None Internship/residency $28.36
17-1022 Surveyors Bachelor's degree None Internship/residency $28.08
17-2011 Aerospace Engineers Bachelor's degree None None $54.95
17-2031 Biomedical Engineers Bachelor's degree None None $35.20

54
Appendix Table K – cont’d. Ohio Occupational Education and Training Classification
Work Experience Typical On-The-Job Training Median
Typical Education**** in a Related Needed to Attain Competency in Wage***
Code Occupational Title** Needed for Entry Occupation the Occupation May 2017
17-2041 Chemical Engineers Bachelor's degree None None $44.13
17-2051 Civil Engineers Bachelor's degree None None $37.75
17-2061 Computer Hardware Engineers Bachelor's degree None None $47.68
17-2071 Electrical Engineers Bachelor's degree None None $39.73
17-2072 Electronics Engineers, Except Computer Bachelor's degree None None $45.17
17-2081 Environmental Engineers Bachelor's degree None None $44.47
17-2111 Health & Safety Engineers, ex. Mining Safety Bachelor's degree None None $42.33
17-2112 Industrial Engineers Bachelor's degree None None $38.24
17-2131 Materials Engineers Bachelor's degree None None $42.56
17-2141 Mechanical Engineers Bachelor's degree None None $36.71
17-2151 Mining & Geological Engineers, Inc Mining Safety Eng. Bachelor's degree None None $38.17
17-2171 Petroleum Engineers Bachelor's degree None None $38.94
17-2199 Engineers, All Other Bachelor's degree None None $41.94
17-3011 Architectural and Civil Drafters Associate's degree None None $24.09
17-3012 Electrical and Electronics Drafters Associate's degree None None $25.44
17-3013 Mechanical Drafters Associate's degree None None $25.44
17-3019 Drafters, All Other Associate's degree None None $24.29
17-3021 Aerospace Engineering and Operations Technicians Associate's degree None None $33.59
17-3022 Civil Engineering Technicians Associate's degree None None $26.32
17-3023 Electrical and Electronic Engineering Technicians Associate's degree None None $28.50
17-3024 Electro-Mechanical Technicians Associate's degree None None $25.19
17-3025 Environmental Engineering Technicians Associate's degree None None $23.07
17-3026 Industrial Engineering Technicians Associate's degree None None $25.94
17-3027 Mechanical Engineering Technicians Associate's degree None None $26.22
17-3029 Engineering Technicians, Except Drafters, All Other Associate's degree None None $27.18
17-3031 Surveying and Mapping Technicians High school diploma or equivalent None Moderate-term on-the-job training $20.02
19-0000 Life, Physical, & Social Science Occupations $28.91
19-1012 Food Scientists and Technologists Bachelor's degree None None $31.24
19-1013 Soil and Plant Scientists Bachelor's degree None None $22.58
19-1022 Microbiologists Bachelor's degree None None $29.27
19-1023 Zoologists and Wildlife Biologists Bachelor's degree None None $32.66
19-1029 Biological Scientists, All Other Bachelor's degree None None $25.96
19-1031 Conservation Scientists Bachelor's degree None None $24.46
19-1032 Foresters Bachelor's degree None None $28.72
19-1041 Epidemiologists Master's degree None None $30.20
19-1042 Medical Scientists, Except Epidemiologists Doctoral or professional degree None None $36.17
19-2012 Physicists Doctoral or professional degree None None $54.37
19-2031 Chemists Bachelor's degree None None $33.50
19-2032 Materials Scientists Bachelor's degree None None $41.70
19-2041 Environmental Scientists/Specialists, inc. Health Bachelor's degree None None $32.25
19-2042 Geoscientists, Except Hydrologists and Geographers Bachelor's degree None None $32.60
19-2043 Hydrologists Bachelor's degree None None $37.69
19-2099 Physical Scientists, All Other Bachelor's degree None None $48.58
19-3011 Economists Master's degree None None $48.16

55
Appendix Table K – cont’d. Ohio Occupational Education and Training Classification
Work Experience Typical On-The-Job Training Median
Typical Education**** in a Related Needed to Attain Competency in Wage***
Code Occupational Title** Needed for Entry Occupation the Occupation May 2017
19-3022 Survey Researchers Master's degree None None $25.03
19-3031 Clinical, Counseling, and School Psychologists Doctoral or professional degree None Internship/residency $33.43
19-3039 Psychologists, All Other Master's degree None Internship/residency $46.87
19-3051 Urban and Regional Planners Master's degree None None $30.60
19-3091 Anthropologists and Archeologists Master's degree None None $28.45
19-3099 Social Scientists and Related Workers, All Other Bachelor's degree None None $34.73
19-4011 Agricultural and Food Science Technicians Associate's degree None Moderate-term on-the-job training $17.68
19-4021 Biological Technicians Bachelor's degree None None $19.88
19-4031 Chemical Technicians Associate's degree None Moderate-term on-the-job training $21.32
19-4061 Social Science Research Assistants Bachelor's degree None None $18.77
19-4091 Environ. Science & Protection Tech., inc. Health Associate's degree None None $20.26
19-4092 Forensic Science Technicians Bachelor's degree None Moderate-term on-the-job training $30.34
19-4093 Forest and Conservation Technicians Associate's degree None None $20.10
19-4099 Life, Physical, & Social Science Tech., All Other Associate's degree None None $24.06
21-0000 Community & Social Service Occupations $20.52
21-1011 Substance Abuse & Behavioral Dis. Counselors Bachelor's degree None None
21-1012 Educational, Vocational, and School Counselors Master's degree None None $26.02
21-1013 Marriage and Family Therapists Master's degree None Internship/residency $23.44
21-1014 Mental Health Counselors Master's degree None Internship/residency
21-1015 Rehabilitation Counselors Master's degree None None $16.74
21-1019 Counselors, All Other Master's degree None None $21.23
21-1021 Child, Family, and School Social Workers Bachelor's degree None None $19.28
21-1022 Medical and Public Health Social Workers Master's degree None Internship/residency $26.65
21-1023 Mental Health and Substance Abuse Social Workers Master's degree None Internship/residency $18.45
21-1029 Social Workers, All Other Bachelor's degree None None $21.75
21-1091 Health Educators Bachelor's degree None None $26.80
21-1092 Probation Officers & Correct. Treatment Spec. Bachelor's degree None Short-term on-the-job training $23.28
21-1093 Social and Human Service Assistants High school diploma or equivalent None Short-term on-the-job training $15.10
21-1094 Community Health Workers High school diploma or equivalent None Short-term on-the-job training $17.94
21-1099 Community and Social Service Specialists, All Other Bachelor's degree None None $19.30
21-2011 Clergy Bachelor's degree None Moderate-term on-the-job training $20.99
21-2021 Directors, Religious Activities and Education Bachelor's degree Less than 5 years None $19.50
21-2099 Religious Workers, All Other Bachelor's degree None None $12.42
23-0000 Legal Occupations $31.56
23-1011 Lawyers Doctoral or professional degree None None $45.66
23-1012 Judicial Law Clerks Doctoral or professional degree None None $21.61
23-1021 Admin. Law Judges & Adjudicators & Hearing Officers Doctoral or professional degree 5 years or more Short-term on-the-job training $45.31
23-1022 Arbitrators, Mediators, and Conciliators Bachelor's degree Less than 5 years Moderate-term on-the-job training $30.92
23-1023 Judges, Magistrate Judges, and Magistrates Doctoral or professional degree 5 years or more Short-term on-the-job training $31.86
23-2011 Paralegals and Legal Assistants Associate's degree None None $21.24
23-2091 Court Reporters Postsecondary non-degree award None Short-term on-the-job training $22.47
23-2093 Title Examiners, Abstractors, and Searchers High school diploma or equivalent None Moderate-term on-the-job training $22.13
23-2099 Legal Support Workers, All Other Associate's degree None None $24.79

56
Appendix Table K – cont’d. Ohio Occupational Education and Training Classification
Work Experience Typical On-The-Job Training Median
Typical Education**** in a Related Needed to Attain Competency in Wage***
Code Occupational Title** Needed for Entry Occupation the Occupation May 2017
25-0000 Education, Training, & Library Occupations $24.48
25-1011 Business Teachers, Postsecondary Doctoral or professional degree None None $82,030 ††
25-1021 Computer Science Teachers, Postsecondary Doctoral or professional degree None None $92,660 ††
25-1022 Mathematical Science Teachers, Postsecondary Doctoral or professional degree None None $76,310 ††
25-1031 Architecture Teachers, Postsecondary Doctoral or professional degree None None $76,160 ††
25-1032 Engineering Teachers, Postsecondary Doctoral or professional degree None None $97,300 ††
25-1042 Biological Science Teachers, Postsecondary Doctoral or professional degree None None $81,590 ††
25-1051 Atmos., Earth, Marine & Space Sci. Teachers, PS Doctoral or professional degree None None $92,970 ††
25-1052 Chemistry Teachers, Postsecondary Doctoral or professional degree None None $84,960 ††
25-1053 Environmental Science Teachers, Postsecondary Doctoral or professional degree None None $82,520 ††
25-1054 Physics Teachers, Postsecondary Doctoral or professional degree None None $96,020 ††
25-1061 Anthropology & Archeology Teachers, Postsecondary Doctoral or professional degree None None $81,390 ††
25-1062 Area/Ethnic/Cultural Studies Teachers, Postsecondary Doctoral or professional degree None None $71,130 ††
25-1063 Economics Teachers, Postsecondary Doctoral or professional degree None None $96,860 ††
25-1064 Geography Teachers, Postsecondary Doctoral or professional degree None None $88,130 ††
25-1065 Political Science Teachers, Postsecondary Doctoral or professional degree None None $82,180 ††
25-1066 Psychology Teachers, Postsecondary Doctoral or professional degree None None $70,490 ††
25-1067 Sociology Teachers, Postsecondary Doctoral or professional degree None None $77,720 ††
25-1069 Social Sciences Teachers, Postsecondary, All Other Doctoral or professional degree None None $74,420 ††
25-1071 Health Specialties Teachers, Postsecondary Doctoral or professional degree Less than 5 years None $84,980 ††
25-1072 Nursing Instructors and Teachers, Postsecondary Doctoral or professional degree Less than 5 years None $67,990 ††
25-1081 Education Teachers, Postsecondary Doctoral or professional degree Less than 5 years None $61,490 ††
25-1082 Library Science Teachers, Postsecondary Doctoral or professional degree None None $64,310 ††
25-1111 Criminal Justice/Law Enforcement Teachers, PS Doctoral or professional degree None None $61,350 ††
25-1112 Law Teachers, Postsecondary Doctoral or professional degree Less than 5 years None $103,310 ††
25-1113 Social Work Teachers, Postsecondary Doctoral or professional degree None None $62,170 ††
25-1121 Art, Drama, and Music Teachers, Postsecondary Master's degree None None $65,330 ††
25-1122 Communications Teachers, Postsecondary Doctoral or professional degree None None $59,480 ††
25-1123 English Language/Literature Teachers, Postsecondary Doctoral or professional degree None None $64,320 ††
25-1124 Foreign Language/Literature Teachers, Postsecondary Doctoral or professional degree None None $62,140 ††
25-1125 History Teachers, Postsecondary Doctoral or professional degree None None $74,100 ††
25-1126 Philosophy and Religion Teachers, Postsecondary Doctoral or professional degree None None $63,670 ††
25-1191 Graduate Teaching Assistants Bachelor's degree None None $47,030 ††
25-1194 Vocational Education Teachers, Postsecondary Bachelor's degree Less than 5 years None $27.41
25-2011 Preschool Teachers, Except Special Education Associate's degree None None $11.80
25-2012 Kindergarten Teachers, Except Special Education Bachelor's degree None None $54,640 ††
25-2021 Elementary School Teachers, ex. Special Ed. Bachelor's degree None None $59,560 ††
25-2022 Middle School Teachers, ex. Special & Voc. Ed. Bachelor's degree None None $59,810 ††
25-2023 Vocational Education Teachers, Middle School Bachelor's degree Less than 5 years None $68,630 ††
25-2031 Secondary Sch. Teachers, ex. Spec. & Voc. Ed. Bachelor's degree None None $59,990 ††
25-2032 Career/Technical Education Teachers, Secondary School Bachelor's degree Less than 5 years None $62,750 ††
25-2051 Special Education Teachers, Preschool Bachelor's degree None None $55,700 ††
25-2052 Special Education Teachers, Kindergarten/Elementary Bachelor's degree None None $56,030 ††
25-2053 Special Education Teachers, Middle School Bachelor's degree None None $59,530 ††

57
Appendix Table K – cont’d. Ohio Occupational Education and Training Classification
Work Experience Typical On-The-Job Training Median
Typical Education**** in a Related Needed to Attain Competency in Wage***
Code Occupational Title** Needed for Entry Occupation the Occupation May 2017
25-2054 Special Education Teachers, Secondary School Bachelor's degree None None $56,730 ††
25-2059 Special Education Teachers, All Other Bachelor's degree None None $36,780 ††
25-3011 Adult Literacy, Remedial Ed., & GED Teachers Bachelor's degree None None $23.82
25-3021 Self-Enrichment Education Teachers High school diploma or equivalent Less than 5 years None $16.43
25-3097 Teachers and Instructors, All Other except Substitute Teachers Bachelor's degree None None $38,040 ††
25-3098 Substitute Teachers Bachelor's degree None None $13.05
25-4011 Archivists Master's degree None None $19.24
25-4012 Curators Master's degree None None $23.21
25-4013 Museum Technicians and Conservators Bachelor's degree None None $16.91
25-4021 Librarians Master's degree None None $26.12
25-4031 Library Technicians Postsecondary non-degree award None None $14.31
25-9031 Instructional Coordinators Master's degree 5 years or more None $29.38
25-9041 Teacher Assistants Some college, no degree None None $25,520 ††
25-9099 Education, Training, and Library Workers, All Other Bachelor's degree None None $19.36
27-0000 Arts, Design, Entertainment, Sports, & Media Occupations $18.97
27-1011 Art Directors Bachelor's degree 5 years or more None $38.80
27-1012 Craft Artists No formal educational credential None Long-term on-the-job training $13.02
27-1013 Fine Artists, inc. Painters, Sculptors & Illustrators Bachelor's degree None Long-term on-the-job training $16.16
27-1014 Multi-Media Artists and Animators Bachelor's degree None None $25.50
27-1021 Commercial and Industrial Designers Bachelor's degree None None $28.63
27-1023 Floral Designers High school diploma or equivalent None Moderate-term on-the-job training $11.50
27-1024 Graphic Designers Bachelor's degree None None $21.51
27-1025 Interior Designers Bachelor's degree None None $21.08
27-1026 Merchandise Displayers and Window Trimmers High school diploma or equivalent None Short-term on-the-job training $13.62
27-1027 Set and Exhibit Designers Bachelor's degree None None $21.36
27-1029 Designers, All Other Bachelor's degree None None $27.66
27-2011 Actors Some college, no degree None Long-term on-the-job training $9.43
27-2012 Producers and Directors Bachelor's degree Less than 5 years None $23.40
27-2021 Athletes and Sports Competitors No formal educational credential None Long-term on-the-job training $40,990 ††
27-2022 Coaches and Scouts Bachelor's degree None None $21,800 ††
27-2023 Umpires, Referees, and Other Sports Officials High school diploma or equivalent None Moderate-term on-the-job training $19,300 ††
27-2031 Dancers No formal educational credential None Long-term on-the-job training $14.63
27-2041 Music Directors and Composers Bachelor's degree Less than 5 years None $29.70
27-2042 Musicians and Singers No formal educational credential None Long-term on-the-job training $24.42
27-2099 Entertainers & Performers, Sports & Rel. Work., AO No formal educational credential None Short-term on-the-job training $19.57
27-3011 Radio and Television Announcers Bachelor's degree None None $15.56
27-3022 Reporters and Correspondents Bachelor's degree None None $15.53
27-3031 Public Relations Specialists Bachelor's degree None None $26.86
27-3041 Editors Bachelor's degree Less than 5 years None $24.77
27-3042 Technical Writers Bachelor's degree Less than 5 years Short-term on-the-job training $29.53
27-3043 Writers and Authors Bachelor's degree None Long-term on-the-job training $21.36
27-3091 Interpreters and Translators Bachelor's degree None None $19.78
27-3099 Media and Communication Workers, All Other High school diploma or equivalent None Short-term on-the-job training $21.89
27-4011 Audio and Video Equipment Technicians Postsecondary non-degree award None Short-term on-the-job training $16.30

58
Appendix Table K – cont’d. Ohio Occupational Education and Training Classification
Work Experience Typical On-The-Job Training Median
Typical Education**** in a Related Needed to Attain Competency in Wage***
Code Occupational Title** Needed for Entry Occupation the Occupation May 2017
27-4012 Broadcast Technicians Associate's degree None Short-term on-the-job training $14.88
27-4014 Sound Engineering Technicians Postsecondary non-degree award None Short-term on-the-job training $19.77
27-4021 Photographers High school diploma or equivalent None Long-term on-the-job training $13.56
27-4031 Camera Operators, TV, Video & Motion Picture Bachelor's degree None None $25.54
27-4032 Film and Video Editors Bachelor's degree None None $20.74
27-4099 Media & Communication Equip. Workers, AO High school diploma or equivalent None Short-term on-the-job training $28.11
29-0000 Healthcare Practitioners & Technical Occupations $28.78
29-1011 Chiropractors Doctoral or professional degree None None $37.37
29-1021 Dentists, General Doctoral or professional degree None None $84.51
29-1022 Oral and Maxillofacial Surgeons Doctoral or professional degree None Internship/residency N/A
29-1023 Orthodontists Doctoral or professional degree None Internship/residency N/A
29-1029 Dentists, All Other Specialists Doctoral or professional degree None Internship/residency $91.75 †††
29-1031 Dietitians and Nutritionists Bachelor's degree None Internship/residency $27.59
29-1041 Optometrists Doctoral or professional degree None None $55.58
29-1051 Pharmacists Doctoral or professional degree None None $57.98
29-1061 Anesthesiologists Doctoral or professional degree None Internship/residency N/A
29-1062 Family and General Practitioners Doctoral or professional degree None Internship/residency $91.12
29-1063 Internists, General Doctoral or professional degree None Internship/residency $92.75 †
29-1064 Obstetricians and Gynecologists Doctoral or professional degree None Internship/residency N/A
29-1065 Pediatricians, General Doctoral or professional degree None Internship/residency $75.41
29-1066 Psychiatrists Doctoral or professional degree None Internship/residency $89.33
29-1067 Surgeons Doctoral or professional degree None Internship/residency N/A
29-1069 Physicians and Surgeons, All Other Doctoral or professional degree None Internship/residency N/A
29-1071 Physician Assistants Master's degree None None $49.40
29-1081 Podiatrists Doctoral or professional degree None Internship/residency $60.33
29-1122 Occupational Therapists Master's degree None None $40.13
29-1123 Physical Therapists Doctoral or professional degree None None $41.25
29-1124 Radiation Therapists Associate's degree None None $35.79
29-1125 Recreational Therapists Bachelor's degree None None $22.57
29-1126 Respiratory Therapists Associate's degree None None $26.49
29-1127 Speech-Language Pathologists Master's degree None Internship/residency $35.65
29-1128 Exercise Physiologists Bachelor's degree None None $22.85
29-1129 Therapists, All Other Bachelor's degree None None $31.55
29-1131 Veterinarians Doctoral or professional degree None None $44.27
29-1141 Registered Nurses Bachelor's degree None None $30.43
29-1151 Nurse Anesthetists Master's degree None None $72.73
29-1161 Nurse Midwives Master's degree None None $46.21
29-1171 Nurse Practitioners Master's degree None None $47.65
29-1181 Audiologists Doctoral or professional degree None None $34.07
29-1199 Health Diagnosing and Treating Practitioners, All Other Master's degree None None $38.03
29-2011 Medical and Clinical Laboratory Technologists Bachelor's degree None None
29-2012 Medical and Clinical Laboratory Technicians Associate's degree None None
29-2021 Dental Hygienists Associate's degree None None $32.74
29-2031 Cardiovascular Technologists and Technicians Associate's degree None None $26.50

59
Appendix Table K – cont’d. Ohio Occupational Education and Training Classification
Work Experience Typical On-The-Job Training Median
Typical Education**** in a Related Needed to Attain Competency in Wage***
Code Occupational Title** Needed for Entry Occupation the Occupation May 2017
29-2032 Diagnostic Medical Sonographers Associate's degree None None $30.30
29-2033 Nuclear Medicine Technologists Associate's degree None None $33.70
29-2034 Radiologic Technologists Associate's degree None None $26.38
29-2035 Magnetic Resonance Imaging Technologists Associate's degree Less than 5 years None $31.12
29-2041 Emergency Medical Technicians and Paramedics Postsecondary non-degree award None None $14.11
29-2051 Dietetic Technicians Associate's degree None None $14.23
29-2052 Pharmacy Technicians High school diploma or equivalent None Moderate-term on-the-job training $13.82
29-2053 Psychiatric Technicians Postsecondary non-degree award Less than 5 years Short-term on-the-job training $15.90
29-2055 Surgical Technologists Postsecondary non-degree award None None $20.67
29-2056 Veterinary Technologists and Technicians Associate's degree None None $15.12
29-2057 Ophthalmic Medical Technicians Postsecondary non-degree award None None $17.03
29-2061 Licensed Practical and Licensed Vocational Nurses Postsecondary non-degree award None None $20.21
29-2071 Medical Records and Health Information Technicians Postsecondary non-degree award None None $18.09
29-2081 Opticians, Dispensing High school diploma or equivalent None Long-term on-the-job training $17.98
29-2092 Hearing Aid Specialists High school diploma or equivalent None Moderate-term on-the-job training $27.84
29-2099 Health Technologists and Technicians, All Other Postsecondary non-degree award None None $18.25
29-9011 Occupational Health and Safety Specialists Bachelor's degree None None $33.67
29-9012 Occupational Health and Safety Technicians High school diploma or equivalent None Moderate-term on-the-job training $24.56
29-9091 Athletic Trainers Bachelor's degree None None $46,570 ††
29-9092 Genetic Counselors Master's degree None None $32.02
29-9099 Healthcare Practitioners and Technical Workers, All Other Postsecondary non-degree award None None $27.35
31-0000 Healthcare Support Occupations $12.32
31-1011 Home Health Aides High school diploma or equivalent None Short-term on-the-job training $10.33
31-1013 Psychiatric Aides High school diploma or equivalent None Short-term on-the-job training $16.36
31-1014 Nursing Assistants Postsecondary non-degree award None None $12.54
31-1015 Orderlies High school diploma or equivalent None Short-term on-the-job training $12.36
31-2011 Occupational Therapist Assistants Associate's degree None None $28.19
31-2021 Physical Therapist Assistants Associate's degree None None $27.63
31-2022 Physical Therapist Aides High school diploma or equivalent None Short-term on-the-job training $13.10
31-9011 Massage Therapists Postsecondary non-degree award None None $16.58
31-9091 Dental Assistants Postsecondary non-degree award None None $17.58
31-9092 Medical Assistants Postsecondary non-degree award None None $14.72
31-9093 Medical Equipment Preparers High school diploma or equivalent None Moderate-term on-the-job training $15.92
31-9094 Medical Transcriptionists Postsecondary non-degree award None None $17.57
31-9095 Pharmacy Aides High school diploma or equivalent None Short-term on-the-job training $12.77
31-9096 Veterinary Assistants and Laboratory Animal Caretakers High school diploma or equivalent None Short-term on-the-job training $11.72
31-9097 Phlebotomists Postsecondary non-degree award None None $15.56
31-9099 Healthcare Support Workers, All Other High school diploma or equivalent None None $16.26
33-0000 Protective Service Occupations $19.18
33-1011 First-Line Supervisors/Mgrs of Correctional Officers High school diploma or equivalent Less than 5 years None $30.98
33-1012 First-Line Superv./Mgrs of Police & Detectives High school diploma or equivalent Less than 5 years Moderate-term on-the-job training $38.22
33-1021 FL Sup/Mgrs of Fire Fighting & Prev. Workers Postsecondary non-degree award Less than 5 years Moderate-term on-the-job training $34.20
33-1099 First-Line Sup/Mgrs, Protective Serv. Work., AO High school diploma or equivalent Less than 5 years None $18.84
33-2011 Fire Fighters Postsecondary non-degree award None Long-term on-the-job training $22.29

60
Appendix Table K – cont’d. Ohio Occupational Education and Training Classification
Work Experience Typical On-The-Job Training Median
Typical Education**** in a Related Needed to Attain Competency in Wage***
Code Occupational Title** Needed for Entry Occupation the Occupation May 2017
33-3011 Bailiffs High school diploma or equivalent None Moderate-term on-the-job training $21.20
33-3012 Correctional Officers and Jailers High school diploma or equivalent None Moderate-term on-the-job training $20.81
33-3021 Detectives and Criminal Investigators High school diploma or equivalent Less than 5 years Moderate-term on-the-job training $31.49
33-3031 Fish and Game Wardens Bachelor's degree None Moderate-term on-the-job training $28.99
33-3041 Parking Enforcement Workers High school diploma or equivalent None Short-term on-the-job training $18.22
33-3051 Police and Sheriff's Patrol Officers High school diploma or equivalent None Moderate-term on-the-job training $29.21
33-3052 Transit and Railroad Police High school diploma or equivalent None Moderate-term on-the-job training $30.00
33-9011 Animal Control Workers High school diploma or equivalent None Moderate-term on-the-job training $15.63
33-9021 Private Detectives and Investigators High school diploma or equivalent Less than 5 years Moderate-term on-the-job training $17.97
33-9031 Gaming Surveillance Officers and Gaming Investigators High school diploma or equivalent Less than 5 years Moderate-term on-the-job training $23.43
33-9032 Security Guards High school diploma or equivalent None Short-term on-the-job training $11.95
33-9091 Crossing Guards No formal educational credential None Short-term on-the-job training $12.52
33-9092 Lifeguards, Ski Patrol, and Other Recreational Protective Service Workers No formal educational credential None Short-term on-the-job training $9.29
33-9093 Transportation Security Screeners High school diploma or equivalent None Short-term on-the-job training $18.62
33-9099 Protective Service Workers, All Other High school diploma or equivalent None Short-term on-the-job training $13.17
35-0000 Food Preparation & Serving Related Occupations $9.45
35-1011 Chefs and Head Cooks High school diploma or equivalent 5 years or more None $17.95
35-1012 FL Sup/Mgrs of Food Prep. & Serving Workers High school diploma or equivalent Less than 5 years None $14.93
35-2011 Cooks, Fast Food No formal educational credential None Short-term on-the-job training $9.38
35-2012 Cooks, Institution and Cafeteria No formal educational credential None Short-term on-the-job training $12.12
35-2014 Cooks, Restaurant No formal educational credential Less than 5 years Moderate-term on-the-job training $11.40
35-2015 Cooks, Short Order No formal educational credential None Short-term on-the-job training $9.69
35-2021 Food Preparation Workers No formal educational credential None Short-term on-the-job training $9.69
35-3011 Bartenders No formal educational credential None Short-term on-the-job training $9.21
35-3021 Comb. Food Prep. & Serv. Work, inc. Fast Food No formal educational credential None Short-term on-the-job training $9.21
35-3022 Counter Attend., Café/Food Concess/Coffee Sh. No formal educational credential None Short-term on-the-job training $9.38
35-3031 Waiters and Waitresses No formal educational credential None Short-term on-the-job training $9.25
35-3041 Food Servers, Nonrestaurant No formal educational credential None Short-term on-the-job training $9.72
35-9011 Dining Room & Cafeteria Attend. & Bar Helpers No formal educational credential None Short-term on-the-job training $9.24
35-9021 Dishwashers No formal educational credential None Short-term on-the-job training $9.35
35-9031 Hosts & Hostesses, Rest./Lounge/Coffee Shop No formal educational credential None Short-term on-the-job training $9.21
35-9099 Food Preparation and Serving Related Workers, All Other No formal educational credential None Short-term on-the-job training $9.70
37-0000 Building & Grounds Cleaning & Maintenance Occupations $11.70
37-1011 FL Sup/Mgrs of Housekping & Janitorial Workers High school diploma or equivalent Less than 5 years None $20.24
37-1012 FL Sup/Mgrs of Lndscap./Lawn Ser/Groundskp High school diploma or equivalent Less than 5 years None $20.91
37-2011 Janitors & Cleaners, ex. Maids/Hsekping Cleaners No formal educational credential None Short-term on-the-job training $11.50
37-2012 Maids and Housekeeping Cleaners No formal educational credential None Short-term on-the-job training $10.13
37-2019 Building Cleaning Workers, All Other No formal educational credential None Short-term on-the-job training $11.52
37-2021 Pest Control Workers High school diploma or equivalent None Moderate-term on-the-job training $15.52
37-3011 Landscaping and Groundskeeping Workers No formal educational credential None Short-term on-the-job training $12.67
37-3012 Pesticide Handlers/Sprayers/Applicators, Veg. High school diploma or equivalent None Moderate-term on-the-job training $15.44
37-3013 Tree Trimmers and Pruners High school diploma or equivalent None Short-term on-the-job training $17.90
37-3019 Grounds Maintenance Workers, All Other No formal educational credential None Short-term on-the-job training $22.46

61
Appendix Table K – cont’d. Ohio Occupational Education and Training Classification
Work Experience Typical On-The-Job Training Median
Typical Education**** in a Related Needed to Attain Competency in Wage***
Code Occupational Title** Needed for Entry Occupation the Occupation May 2017
39-0000 Personal Care & Service Occupations $10.66
39-1011 Gaming Supervisors High school diploma or equivalent Less than 5 years None
39-1012 Slot Supervisors High school diploma or equivalent Less than 5 years None
39-1021 First-Line Sup/Mgrs of Personal Serv. Workers High school diploma or equivalent Less than 5 years None $16.67
39-2011 Animal Trainers High school diploma or equivalent None Moderate-term on-the-job training $12.28
39-2021 Nonfarm Animal Caretakers High school diploma or equivalent None Short-term on-the-job training $9.86
39-3012 Gaming and Sports Book Writers and Runners High school diploma or equivalent None Short-term on-the-job training 13.68
39-3031 Ushers, Lobby Attendants, and Ticket Takers No formal educational credential None Short-term on-the-job training $9.45
39-3091 Amusement and Recreation Attendants No formal educational credential None Short-term on-the-job training $9.30
39-3092 Costume Attendants High school diploma or equivalent None Short-term on-the-job training $17.38
39-3093 Locker Room, Coatroom, & Dressing Room Attendants High school diploma or equivalent None Short-term on-the-job training $9.71
39-4021 Funeral Attendants High school diploma or equivalent None Short-term on-the-job training $11.86
39-5012 Hairdressers, Hairstylists, and Cosmetologists Postsecondary non-degree award None None $10.86
39-5092 Manicurists and Pedicurists Postsecondary non-degree award None None $11.23
39-5093 Shampooers No formal educational credential None Short-term on-the-job training $9.12
39-5094 Skin Care Specialists Postsecondary non-degree award None None $14.37
39-6011 Baggage Porters and Bellhops High school diploma or equivalent None Short-term on-the-job training $9.45
39-6012 Concierges High school diploma or equivalent None Moderate-term on-the-job training $11.09
39-9011 Child Care Workers High school diploma or equivalent None Short-term on-the-job training $9.86
39-9021 Personal and Home Care Aides High school diploma or equivalent None Short-term on-the-job training $10.61
39-9031 Fitness Trainers and Aerobics Instructors High school diploma or equivalent None Short-term on-the-job training $12.43
39-9032 Recreation Workers High school diploma or equivalent None Short-term on-the-job training $11.18
39-9041 Residential Advisors High school diploma or equivalent None Short-term on-the-job training $13.28
39-9099 Personal Care and Service Workers, All Other High school diploma or equivalent None Short-term on-the-job training $10.34
41-0000 Sales & Related Occupations $12.46
41-1011 First-Line Superv./Mgrs of Retail Sales Workers High school diploma or equivalent Less than 5 years None $17.60
41-1012 First-Line Sup./Mgrs of Non-Retail Sales Workers High school diploma or equivalent Less than 5 years None $31.91
41-2011 Cashiers No formal educational credential None Short-term on-the-job training $9.31
41-2012 Gaming Change Persons and Booth Cashiers No formal educational credential None Short-term on-the-job training $11.33
41-2021 Counter and Rental Clerks No formal educational credential None Short-term on-the-job training $11.18
41-2022 Parts Salespersons No formal educational credential None Moderate-term on-the-job training $13.15
41-2031 Retail Salespersons No formal educational credential None Short-term on-the-job training $10.67
41-3011 Advertising Sales Agents High school diploma or equivalent None Moderate-term on-the-job training $22.21
41-3021 Insurance Sales Agents High school diploma or equivalent None Moderate-term on-the-job training $22.38
41-3031 Securities/Commodities/Fin. Serv. Sales Agents Bachelor's degree None Moderate-term on-the-job training $29.03
41-3041 Travel Agents High school diploma or equivalent None Moderate-term on-the-job training $14.42
41-3099 Sales Representatives, Services, All Other High school diploma or equivalent None Moderate-term on-the-job training $23.53
41-4011 Sales Rep., Wholesale & Mfg, Tech./Sci. Prod. Bachelor's degree None Moderate-term on-the-job training $33.84
41-4012 Sales Rep., Wholesale/Mfg, ex. Tech./Sci. Prod. High school diploma or equivalent None Moderate-term on-the-job training $27.59
41-9011 Demonstrators and Product Promoters No formal educational credential None Short-term on-the-job training $12.26
41-9021 Real Estate Brokers High school diploma or equivalent Less than 5 years None $39.91
41-9022 Real Estate Sales Agents High school diploma or equivalent None Moderate-term on-the-job training $15.57
41-9031 Sales Engineers Bachelor's degree None Moderate-term on-the-job training $40.04

62
Appendix Table K – cont’d. Ohio Occupational Education and Training Classification
Work Experience Typical On-The-Job Training Median
Typical Education**** in a Related Needed to Attain Competency in Wage***
Code Occupational Title** Needed for Entry Occupation the Occupation May 2017
41-9041 Telemarketers No formal educational credential None Short-term on-the-job training $11.11
41-9091 Door-To-Door Sales, News/St. Vendors, & Rel. No formal educational credential None Short-term on-the-job training $10.96
41-9099 Sales and Related Workers, All Other High school diploma or equivalent None None $13.19
43-0000 Office & Administrative Support Occupations $16.22
43-1011 First-Line Sup/Mgrs of Office & Admin. Support High school diploma or equivalent Less than 5 years None $25.52
43-2011 Switchboard Operators, Including Answering Service High school diploma or equivalent None Short-term on-the-job training $13.06
43-2021 Telephone Operators High school diploma or equivalent None Short-term on-the-job training $17.69
43-3011 Bill and Account Collectors High school diploma or equivalent None Moderate-term on-the-job training $15.91
43-3021 Billing and Posting Clerks and Machine Operators High school diploma or equivalent None Moderate-term on-the-job training $17.36
43-3031 Bookkeeping, Accounting, and Auditing Clerks Some college, no degree None Moderate-term on-the-job training $18.13
43-3041 Gaming Cage Workers High school diploma or equivalent None Short-term on-the-job training $13.21
43-3051 Payroll and Timekeeping Clerks High school diploma or equivalent None Moderate-term on-the-job training $20.33
43-3061 Procurement Clerks High school diploma or equivalent None Moderate-term on-the-job training $19.41
43-3071 Tellers High school diploma or equivalent None Short-term on-the-job training $12.59
43-3099 Financial Clerks, All Other High school diploma or equivalent None Short-term on-the-job training $18.08
43-4011 Brokerage Clerks High school diploma or equivalent None Moderate-term on-the-job training $21.53
43-4021 Correspondence Clerks High school diploma or equivalent None Short-term on-the-job training $16.68
43-4031 Court, Municipal, and License Clerks High school diploma or equivalent None Moderate-term on-the-job training $17.38
43-4041 Credit Authorizers, Checkers, and Clerks High school diploma or equivalent None Moderate-term on-the-job training $17.54
43-4051 Customer Service Representatives High school diploma or equivalent None Short-term on-the-job training $15.50
43-4061 Eligibility Interviewers, Government Programs High school diploma or equivalent None Moderate-term on-the-job training $19.85
43-4071 File Clerks High school diploma or equivalent None Short-term on-the-job training $15.46
43-4081 Hotel, Motel, and Resort Desk Clerks High school diploma or equivalent None Short-term on-the-job training $9.67
43-4111 Interviewers, Except Eligibility and Loan High school diploma or equivalent None Short-term on-the-job training $15.06
43-4121 Library Assistants, Clerical High school diploma or equivalent None Short-term on-the-job training $11.58
43-4131 Loan Interviewers and Clerks High school diploma or equivalent None Short-term on-the-job training $17.57
43-4141 New Accounts Clerks High school diploma or equivalent None Moderate-term on-the-job training $16.47
43-4151 Order Clerks High school diploma or equivalent None Short-term on-the-job training $15.36
43-4161 Human Resources Assis., ex. Payroll & Timekp Associate's degree None None $18.47
43-4171 Receptionists and Information Clerks High school diploma or equivalent None Short-term on-the-job training $12.29
43-4181 Reservation/Trans. Ticket Agents & Travel Clerks High school diploma or equivalent None Short-term on-the-job training $11.90
43-4199 Information and Record Clerks, All Other High school diploma or equivalent None Short-term on-the-job training $19.51
43-5011 Cargo and Freight Agents High school diploma or equivalent None Short-term on-the-job training $19.04
43-5021 Couriers and Messengers High school diploma or equivalent None Short-term on-the-job training $12.50
43-5031 Police, Fire, and Ambulance Dispatchers High school diploma or equivalent None Moderate-term on-the-job training $20.91
43-5032 Dispatchers, Except Police, Fire, and Ambulance High school diploma or equivalent None Moderate-term on-the-job training $18.76
43-5041 Meter Readers, Utilities High school diploma or equivalent None Short-term on-the-job training $21.38
43-5051 Postal Service Clerks High school diploma or equivalent None Short-term on-the-job training $28.15
43-5052 Postal Service Mail Carriers High school diploma or equivalent None Short-term on-the-job training $26.39
43-5053 Postal Service Mail Sorters/Proc/Proc Mach. Op High school diploma or equivalent None Short-term on-the-job training $27.53
43-5061 Production, Planning, and Expediting Clerks High school diploma or equivalent None Moderate-term on-the-job training $22.47
43-5071 Shipping, Receiving, and Traffic Clerks High school diploma or equivalent None Short-term on-the-job training $15.21
43-5081 Stock Clerks and Order Fillers High school diploma or equivalent None Short-term on-the-job training $11.56
43-5111 Weighers/Meas./Checkers/Samplers, Recordkp High school diploma or equivalent None Short-term on-the-job training $15.65
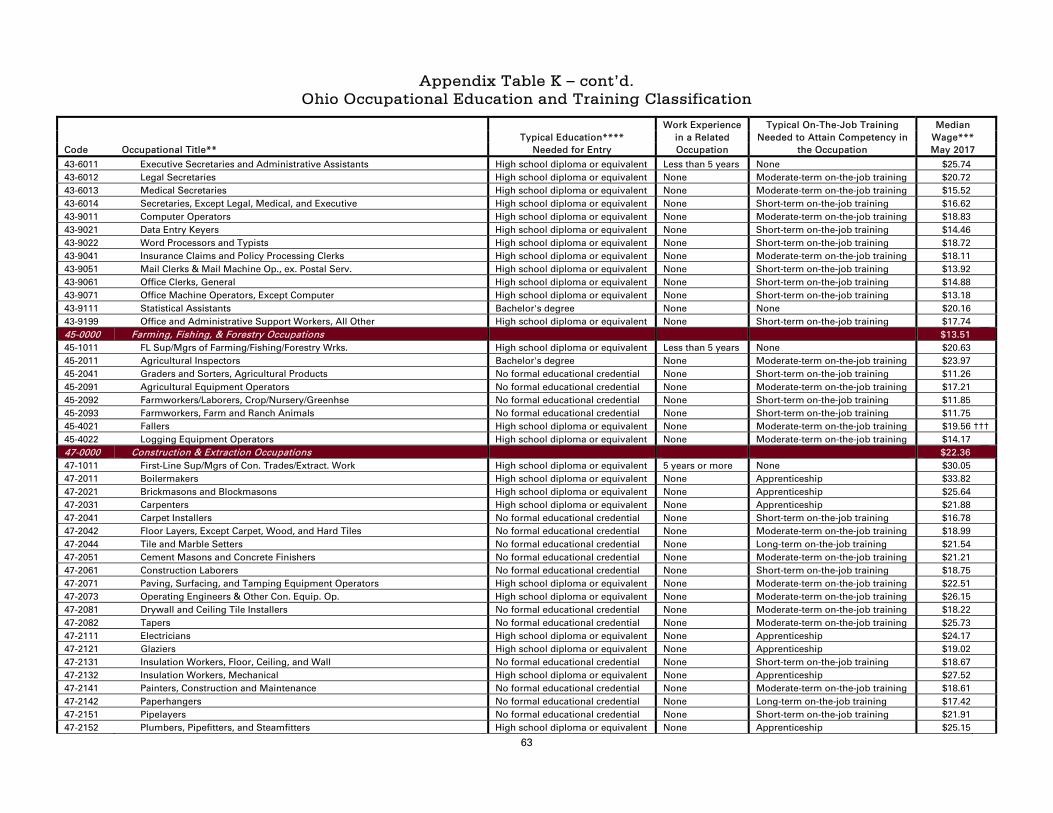
63
Appendix Table K – cont’d. Ohio Occupational Education and Training Classification
Work Experience Typical On-The-Job Training Median
Typical Education**** in a Related Needed to Attain Competency in Wage***
Code Occupational Title** Needed for Entry Occupation the Occupation May 2017
43-6011 Executive Secretaries and Administrative Assistants High school diploma or equivalent Less than 5 years None $25.74
43-6012 Legal Secretaries High school diploma or equivalent None Moderate-term on-the-job training $20.72
43-6013 Medical Secretaries High school diploma or equivalent None Moderate-term on-the-job training $15.52
43-6014 Secretaries, Except Legal, Medical, and Executive High school diploma or equivalent None Short-term on-the-job training $16.62
43-9011 Computer Operators High school diploma or equivalent None Moderate-term on-the-job training $18.83
43-9021 Data Entry Keyers High school diploma or equivalent None Short-term on-the-job training $14.46
43-9022 Word Processors and Typists High school diploma or equivalent None Short-term on-the-job training $18.72
43-9041 Insurance Claims and Policy Processing Clerks High school diploma or equivalent None Moderate-term on-the-job training $18.11
43-9051 Mail Clerks & Mail Machine Op., ex. Postal Serv. High school diploma or equivalent None Short-term on-the-job training $13.92
43-9061 Office Clerks, General High school diploma or equivalent None Short-term on-the-job training $14.88
43-9071 Office Machine Operators, Except Computer High school diploma or equivalent None Short-term on-the-job training $13.18
43-9111 Statistical Assistants Bachelor's degree None None $20.16
43-9199 Office and Administrative Support Workers, All Other High school diploma or equivalent None Short-term on-the-job training $17.74
45-0000 Farming, Fishing, & Forestry Occupations $13.51
45-1011 FL Sup/Mgrs of Farming/Fishing/Forestry Wrks. High school diploma or equivalent Less than 5 years None $20.63
45-2011 Agricultural Inspectors Bachelor's degree None Moderate-term on-the-job training $23.97
45-2041 Graders and Sorters, Agricultural Products No formal educational credential None Short-term on-the-job training $11.26
45-2091 Agricultural Equipment Operators No formal educational credential None Moderate-term on-the-job training $17.21
45-2092 Farmworkers/Laborers, Crop/Nursery/Greenhse No formal educational credential None Short-term on-the-job training $11.85
45-2093 Farmworkers, Farm and Ranch Animals No formal educational credential None Short-term on-the-job training $11.75
45-4021 Fallers High school diploma or equivalent None Moderate-term on-the-job training $19.56 †††
45-4022 Logging Equipment Operators High school diploma or equivalent None Moderate-term on-the-job training $14.17
47-0000 Construction & Extraction Occupations $22.36
47-1011 First-Line Sup/Mgrs of Con. Trades/Extract. Work High school diploma or equivalent 5 years or more None $30.05
47-2011 Boilermakers High school diploma or equivalent None Apprenticeship $33.82
47-2021 Brickmasons and Blockmasons High school diploma or equivalent None Apprenticeship $25.64
47-2031 Carpenters High school diploma or equivalent None Apprenticeship $21.88
47-2041 Carpet Installers No formal educational credential None Short-term on-the-job training $16.78
47-2042 Floor Layers, Except Carpet, Wood, and Hard Tiles No formal educational credential None Moderate-term on-the-job training $18.99
47-2044 Tile and Marble Setters No formal educational credential None Long-term on-the-job training $21.54
47-2051 Cement Masons and Concrete Finishers No formal educational credential None Moderate-term on-the-job training $21.21
47-2061 Construction Laborers No formal educational credential None Short-term on-the-job training $18.75
47-2071 Paving, Surfacing, and Tamping Equipment Operators High school diploma or equivalent None Moderate-term on-the-job training $22.51
47-2073 Operating Engineers & Other Con. Equip. Op. High school diploma or equivalent None Moderate-term on-the-job training $26.15
47-2081 Drywall and Ceiling Tile Installers No formal educational credential None Moderate-term on-the-job training $18.22
47-2082 Tapers No formal educational credential None Moderate-term on-the-job training $25.73
47-2111 Electricians High school diploma or equivalent None Apprenticeship $24.17
47-2121 Glaziers High school diploma or equivalent None Apprenticeship $19.02
47-2131 Insulation Workers, Floor, Ceiling, and Wall No formal educational credential None Short-term on-the-job training $18.67
47-2132 Insulation Workers, Mechanical High school diploma or equivalent None Apprenticeship $27.52
47-2141 Painters, Construction and Maintenance No formal educational credential None Moderate-term on-the-job training $18.61
47-2142 Paperhangers No formal educational credential None Long-term on-the-job training $17.42
47-2151 Pipelayers No formal educational credential None Short-term on-the-job training $21.91
47-2152 Plumbers, Pipefitters, and Steamfitters High school diploma or equivalent None Apprenticeship $25.15

64
Appendix Table K – cont’d. Ohio Occupational Education and Training Classification
Work Experience Typical On-The-Job Training Median
Typical Education**** in a Related Needed to Attain Competency in Wage***
Code Occupational Title** Needed for Entry Occupation the Occupation May 2017
47-2161 Plasterers and Stucco Masons No formal educational credential None Long-term on-the-job training $22.33
47-2171 Reinforcing Iron and Rebar Workers High school diploma or equivalent None Apprenticeship $26.03
47-2181 Roofers No formal educational credential None Moderate-term on-the-job training $17.53
47-2211 Sheet Metal Workers High school diploma or equivalent None Apprenticeship $25.04
47-2221 Structural Iron and Steel Workers High school diploma or equivalent None Apprenticeship $28.63
47-3011 Helpers--Brick/Block/Stone/Tile & Marble Setters No formal educational credential None Short-term on-the-job training $16.86
47-3012 Helpers--Carpenters No formal educational credential None Short-term on-the-job training $13.39
47-3013 Helpers--Electricians High school diploma or equivalent None Short-term on-the-job training $13.51
47-3015 Helpers--Pipelayers/Plumbers/Pipefitters/Steamf High school diploma or equivalent None Short-term on-the-job training $12.58
47-3016 Helpers--Roofers No formal educational credential None Short-term on-the-job training $14.09
47-4011 Construction and Building Inspectors High school diploma or equivalent 5 years or more Moderate-term on-the-job training $26.56
47-4021 Elevator Installers and Repairers High school diploma or equivalent None Apprenticeship $36.60
47-4031 Fence Erectors No formal educational credential None Moderate-term on-the-job training $16.75
47-4041 Hazardous Materials Removal Workers High school diploma or equivalent None Moderate-term on-the-job training $21.00
47-4051 Highway Maintenance Workers High school diploma or equivalent None Moderate-term on-the-job training $19.24
47-4071 Septic Tank Servicers and Sewer Pipe Cleaners High school diploma or equivalent None Moderate-term on-the-job training $20.42
47-4099 Construction and Related Workers, All Other High school diploma or equivalent None Moderate-term on-the-job training
47-5012 Rotary Drill Operators, Oil and Gas No formal educational credential None Moderate-term on-the-job training $24.21
47-5013 Service Unit Operators, Oil, Gas, and Mining No formal educational credential None Moderate-term on-the-job training $20.35
47-5021 Earth Drillers, Except Oil and Gas High school diploma or equivalent None Moderate-term on-the-job training $20.17
47-5041 Continuous Mining Machine Operators No formal educational credential None Moderate-term on-the-job training $28.05
47-5042 Mine Cutting and Channeling Machine Operators High school diploma or equivalent None Moderate-term on-the-job training $21.01
47-5051 Rock Splitters, Quarry No formal educational credential None Short-term on-the-job training $14.93
47-5071 Roustabouts, Oil and Gas No formal educational credential None Moderate-term on-the-job training $16.92
47-5081 Helpers--Extraction Workers High school diploma or equivalent None Moderate-term on-the-job training $12.96
49-0000 Installation, Maintenance, & Repair Occupations $21.02
49-1011 FL Sup/Mgrs of Mechanics/Installers/Repairers High school diploma or equivalent Less than 5 years None $29.66
49-2011 Computer, ATM, & Office Machine Repairers Some college, no degree None Short-term on-the-job training $16.54
49-2021 Radio Mechanics Associate's degree None Moderate-term on-the-job training $27.43
49-2022 Telecomm. Equip. Install/Repair, ex. Line Install Postsecondary non-degree award None Moderate-term on-the-job training $23.05
49-2091 Avionics Technicians Associate's degree None None $24.69
49-2092 Electric Motor, Power Tool, and Related Repairers High school diploma or equivalent Less than 5 years Moderate-term on-the-job training $21.64
49-2093 Electrical/Electronics Install/Repair, Trans. Equip. Postsecondary non-degree award None Long-term on-the-job training $24.31
49-2094 Electrical/Electronics Repair, Comm/Indus Equip. Postsecondary non-degree award None Long-term on-the-job training $27.09
49-2095 Electrical/Electronics Repair, Pwrhse/Substa/Rly Postsecondary non-degree award Less than 5 years Moderate-term on-the-job training $36.00
49-2096 Electronic Equipment Install/Repair, Motor Veh. High school diploma or equivalent None Moderate-term on-the-job training $18.04
49-2097 Electronic Home Entertainm Equip. Install/Repair Postsecondary non-degree award None Short-term on-the-job training $13.37
49-2098 Security and Fire Alarm Systems Installers High school diploma or equivalent None Moderate-term on-the-job training $21.62
49-3011 Aircraft Mechanics and Service Technicians Postsecondary non-degree award None None $26.32
49-3021 Automotive Body and Related Repairers High school diploma or equivalent None Long-term on-the-job training $18.56
49-3022 Automotive Glass Installers and Repairers High school diploma or equivalent None Moderate-term on-the-job training $18.21
49-3023 Automotive Service Technicians and Mechanics Postsecondary non-degree award None Short-term on-the-job training $18.02
49-3031 Bus & Truck Mechanics & Diesel Engine Spec. High school diploma or equivalent None Long-term on-the-job training $21.74
49-3041 Farm Equipment Mechanics High school diploma or equivalent None Long-term on-the-job training $17.18

65
Appendix Table K – cont’d. Ohio Occupational Education and Training Classification
Work Experience Typical On-The-Job Training Median
Typical Education**** in a Related Needed to Attain Competency in Wage***
Code Occupational Title** Needed for Entry Occupation the Occupation May 2017
49-3042 Mobile Heavy Equipment Mechanics, Except Engines High school diploma or equivalent None Long-term on-the-job training $26.07
49-3043 Rail Car Repairers High school diploma or equivalent None Long-term on-the-job training $18.00
49-3051 Motorboat Mechanics High school diploma or equivalent None Long-term on-the-job training $17.48
49-3052 Motorcycle Mechanics Postsecondary non-degree award None Short-term on-the-job training $16.68
49-3053 Outdoor Power Equip. & Other Sm Engine Mech. High school diploma or equivalent None Moderate-term on-the-job training $14.63
49-3091 Bicycle Repairers High school diploma or equivalent None Moderate-term on-the-job training $13.10
49-3092 Recreational Vehicle Service Technicians High school diploma or equivalent None Long-term on-the-job training $16.89
49-3093 Tire Repairers and Changers High school diploma or equivalent None Short-term on-the-job training $11.64
49-9011 Mechanical Door Repairers High school diploma or equivalent None Moderate-term on-the-job training $19.32
49-9012 Control & Valve Install/Repair, ex. Mech. Door High school diploma or equivalent None Moderate-term on-the-job training $29.40
49-9021 Heating, AC, & Refrigeration Mechanics/Installers Postsecondary non-degree award None Long-term on-the-job training $22.19
49-9031 Home Appliance Repairers High school diploma or equivalent None Moderate-term on-the-job training $16.67
49-9041 Industrial Machinery Mechanics High school diploma or equivalent None Long-term on-the-job training $24.14
49-9043 Maintenance Workers, Machinery High school diploma or equivalent None Long-term on-the-job training $21.00
49-9044 Millwrights High school diploma or equivalent None Apprenticeship $29.47
49-9051 Electrical Power-Line Installers and Repairers High school diploma or equivalent None Long-term on-the-job training $33.43
49-9052 Telecommunications Line Installers and Repairers High school diploma or equivalent None Long-term on-the-job training $22.62
49-9062 Medical Equipment Repairers Associate's degree None Moderate-term on-the-job training $23.32
49-9063 Musical Instrument Repairers and Tuners High school diploma or equivalent None Apprenticeship $15.63
49-9064 Watch Repairers High school diploma or equivalent None Long-term on-the-job training $24.93
49-9069 Precision Instrument/Equipment Repairers, AO High school diploma or equivalent None Long-term on-the-job training $28.54
49-9071 Maintenance and Repair Workers, General High school diploma or equivalent None Moderate-term on-the-job training $18.87
49-9091 Coin/Vending/Amusement Machine Serv/Repair High school diploma or equivalent None Short-term on-the-job training $16.03
49-9094 Locksmiths and Safe Repairers High school diploma or equivalent None Long-term on-the-job training $16.53
49-9095 Manufactured Building and Mobile Home Installers High school diploma or equivalent None Short-term on-the-job training $16.35
49-9096 Riggers High school diploma or equivalent None Moderate-term on-the-job training $19.17
49-9098 Helpers--Installation, Maintenance, and Repair Workers High school diploma or equivalent None Short-term on-the-job training $14.61
49-9099 Installation, Maintenance, and Repair Workers, All Other High school diploma or equivalent None Moderate-term on-the-job training $17.74
51-0000 Production Occupations $17.08
51-1011 FL Sup/Mgrs of Production/Operating Workers High school diploma or equivalent Less than 5 years None $28.16
51-2011 Aircraft Struct., Surfaces, Rigging, & Systems Assemblers High school diploma or equivalent None Moderate-term on-the-job training $21.02
51-2021 Coil Winders, Tapers, and Finishers High school diploma or equivalent None Moderate-term on-the-job training $19.42
51-2022 Electrical and Electronic Equipment Assemblers High school diploma or equivalent None Moderate-term on-the-job training
51-2023 Electromechanical Equipment Assemblers High school diploma or equivalent None Moderate-term on-the-job training
51-2031 Engine and Other Machine Assemblers High school diploma or equivalent None Moderate-term on-the-job training $23.14
51-2041 Structural Metal Fabricators and Fitters High school diploma or equivalent None Moderate-term on-the-job training $17.64
51-2091 Fiberglass Laminators and Fabricators High school diploma or equivalent None Moderate-term on-the-job training $15.77
51-2092 Team Assemblers High school diploma or equivalent None Moderate-term on-the-job training
51-2099 Assemblers and Fabricators, All Other High school diploma or equivalent None Moderate-term on-the-job training
51-3011 Bakers No formal educational credential None Long-term on-the-job training $12.12
51-3021 Butchers and Meat Cutters No formal educational credential None Long-term on-the-job training $17.20
51-3022 Meat, Poultry, and Fish Cutters and Trimmers No formal educational credential None Short-term on-the-job training $13.28
51-3023 Slaughterers and Meat Packers No formal educational credential None Short-term on-the-job training $12.94
51-3091 Food and Tobacco Roasting, Baking, and Drying Machine Operators/Tenders No formal educational credential None Moderate-term on-the-job training $16.18

66
Appendix Table K – cont’d. Ohio Occupational Education and Training Classification
Work Experience Typical On-The-Job Training Median
Typical Education**** in a Related Needed to Attain Competency in Wage***
Code Occupational Title** Needed for Entry Occupation the Occupation May 2017
51-3092 Food Batchmakers High school diploma or equivalent None Moderate-term on-the-job training $15.48
51-3093 Food Cooking Machine Operators/Tenders High school diploma or equivalent None Moderate-term on-the-job training $15.88
51-3099 Food Processing Workers, All Other No formal educational credential None Moderate-term on-the-job training $11.87
51-4011 Computer-Controlled Machine Tool Oper., M/P High school diploma or equivalent None Moderate-term on-the-job training $19.28
51-4012 Numerical Tool and Process Control Programmers Postsecondary non-degree award None Moderate-term on-the-job training $23.71
51-4021 Extruding & Drawing Machine Setters, O/T, M/P High school diploma or equivalent None Moderate-term on-the-job training $15.91
51-4022 Forging Mach. Setters/Operators/Tenders, M/P High school diploma or equivalent None Moderate-term on-the-job training $18.59
51-4023 Rolling Machine Setters/Operators/Tenders, M/P High school diploma or equivalent None Moderate-term on-the-job training $18.92
51-4031 Cutting/Punching/Press Machine S/O/T, M/P High school diploma or equivalent None Moderate-term on-the-job training $15.71
51-4032 Drilling & Boring Machine Tool Setters, O/T, M/P High school diploma or equivalent None Moderate-term on-the-job training $18.00
51-4033 Grind/Lapping/Polish/Buff Mach.Tool S/O/T, M/P High school diploma or equivalent None Moderate-term on-the-job training $15.40
51-4034 Lathe & Turning Machine Tool Setters, O/T, M/P High school diploma or equivalent None Moderate-term on-the-job training $19.39
51-4035 Milling & Planing Machine Setters, O/T, M/P High school diploma or equivalent None Moderate-term on-the-job training $22.14
51-4041 Machinists High school diploma or equivalent None Long-term on-the-job training $20.20
51-4051 Metal-Refining Furnace Operators/Tenders High school diploma or equivalent None Moderate-term on-the-job training $17.97
51-4052 Pourers and Casters, Metal High school diploma or equivalent None Moderate-term on-the-job training $16.63
51-4061 Model Makers, Metal and Plastic High school diploma or equivalent None Moderate-term on-the-job training $24.57
51-4062 Patternmakers, Metal and Plastic High school diploma or equivalent None Moderate-term on-the-job training $19.53
51-4071 Foundry Mold and Coremakers High school diploma or equivalent None Moderate-term on-the-job training $16.63
51-4072 Molding/Coremaking/Casting Mach. S/O/T, M/P High school diploma or equivalent None Moderate-term on-the-job training $14.70
51-4081 Multiple Machine Tool Setters, Operators, and Tenders, Metal and Plastic High school diploma or equivalent None Moderate-term on-the-job training $16.45
51-4111 Tool and Die Makers Postsecondary non-degree award None Long-term on-the-job training $24.70
51-4121 Welders, Cutters, Solderers, and Brazers High school diploma or equivalent None Moderate-term on-the-job training $18.58
51-4122 Welding/Soldering/Brazing Machine Setters, O/T High school diploma or equivalent None Moderate-term on-the-job training $17.97
51-4191 Heat Treating Equip. Setters, O/T, M/P High school diploma or equivalent None Moderate-term on-the-job training $18.12
51-4192 Lay-Out Workers, Metal and Plastic High school diploma or equivalent None Moderate-term on-the-job training $18.42
51-4193 Plating & Coating Machine Setters, O/T, M/P High school diploma or equivalent None Moderate-term on-the-job training $15.75
51-4194 Tool Grinders, Filers, and Sharpeners High school diploma or equivalent None Moderate-term on-the-job training $17.35
51-4199 Metal Workers and Plastic Workers, All Other High school diploma or equivalent None Moderate-term on-the-job training $17.24
51-5111 Prepress Technicians and Workers Postsecondary non-degree award None None $18.33
51-5112 Printing Press Operators and Job Printers High school diploma or equivalent None Moderate-term on-the-job training $16.42
51-5113 Print Binding and Finishing Workers High school diploma or equivalent None Moderate-term on-the-job training $13.95
51-6011 Laundry and Dry-Cleaning Workers No formal educational credential None Short-term on-the-job training $9.88
51-6021 Pressers, Textile, Garment, and Related Materials No formal educational credential None Short-term on-the-job training $9.88
51-6031 Sewing Machine Operators No formal educational credential None Short-term on-the-job training $11.80
51-6041 Shoe and Leather Workers and Repairers High school diploma or equivalent None Moderate-term on-the-job training $11.36
51-6062 Textile Cutting Machine Setters, Operators, & Tenders High school diploma or equivalent None Moderate-term on-the-job training $14.28
51-6063 Textile Knitting and Weaving Machine Setters, O/T High school diploma or equivalent None Short-term on-the-job training $13.94
51-6091 Extrud/Form Mach S/O/T, Synthetic/Glass Fibers High school diploma or equivalent None Moderate-term on-the-job training $16.13
51-6093 Upholsterers High school diploma or equivalent None Moderate-term on-the-job training $13.90
51-6099 Textile, Apparel, and Furnishings Workers, All Other High school diploma or equivalent None Short-term on-the-job training $14.45
51-7011 Cabinetmakers and Bench Carpenters High school diploma or equivalent None Moderate-term on-the-job training $15.58
51-7021 Furniture Finishers High school diploma or equivalent None Short-term on-the-job training $14.50
51-7041 Sawing Mach. Setters/Operators/Tenders, Wood High school diploma or equivalent None Moderate-term on-the-job training $15.28

67
Appendix Table K – cont’d. Ohio Occupational Education and Training Classification
Work Experience Typical On-The-Job Training Median
Typical Education**** in a Related Needed to Attain Competency in Wage***
Code Occupational Title** Needed for Entry Occupation the Occupation May 2017
51-7042 Woodworking Machine Setters, O/T, Except Sawing High school diploma or equivalent None Moderate-term on-the-job training $14.46
51-8012 Power Distributors and Dispatchers High school diploma or equivalent None Long-term on-the-job training $38.13
51-8013 Power Plant Operators High school diploma or equivalent None Long-term on-the-job training $34.70
51-8021 Stationary Engineers and Boiler Operators High school diploma or equivalent None Long-term on-the-job training $27.02
51-8031 Water/Liquid Waste Treatment Plant/System Op. High school diploma or equivalent None Long-term on-the-job training $23.05
51-8091 Chemical Plant and System Operators High school diploma or equivalent None Moderate-term on-the-job training $28.30
51-8093 Petroleum Pump System Oper./Refinery Oper./Gaugers High school diploma or equivalent None Moderate-term on-the-job training $30.80
51-8099 Plant and System Operators, All Other High school diploma or equivalent None Moderate-term on-the-job training $25.00
51-9011 Chemical Equipment Operators/Tenders High school diploma or equivalent None Moderate-term on-the-job training $21.30
51-9012 Sep./Filter/Clarify/Precipitating/Still Mach. S/O/T High school diploma or equivalent None Moderate-term on-the-job training $17.66
51-9021 Crushing/Grinding/Polishing Machine S/O/T High school diploma or equivalent None Moderate-term on-the-job training $16.96
51-9022 Grinding and Polishing Workers, Hand No formal educational credential None Moderate-term on-the-job training $14.65
51-9023 Mixing/Blending Machine Setters/Operators/Tenders High school diploma or equivalent None Moderate-term on-the-job training $17.81
51-9032 Cutting/Slicing Mach. Setters/Operators/Tenders High school diploma or equivalent None Moderate-term on-the-job training $16.80
51-9041 Extrud/Form/Pressing/Compacting Mach. S/O/T High school diploma or equivalent None Moderate-term on-the-job training $15.89
51-9051 Furnace/Kiln/Oven/Drier/Kettle Oper./Tenders High school diploma or equivalent None Moderate-term on-the-job training $17.20
51-9061 Inspectors, Testers, Sorters, Samplers, and Weighers High school diploma or equivalent None Moderate-term on-the-job training $18.11
51-9071 Jewelers and Precious Stone and Metal Workers High school diploma or equivalent None Long-term on-the-job training $18.89
51-9081 Dental Laboratory Technicians High school diploma or equivalent None Moderate-term on-the-job training $19.10
51-9082 Medical Appliance Technicians High school diploma or equivalent None Moderate-term on-the-job training $16.11
51-9083 Ophthalmic Laboratory Technicians High school diploma or equivalent None Moderate-term on-the-job training $13.80
51-9111 Packaging and Filling Machine Operators/Tenders High school diploma or equivalent None Moderate-term on-the-job training $14.74
51-9121 Coating/Painting/Spraying Machine Setters, O/T High school diploma or equivalent None Moderate-term on-the-job training $16.54
51-9122 Painters, Transportation Equipment High school diploma or equivalent None Moderate-term on-the-job training $18.63
51-9141 Semiconductor Processors High school diploma or equivalent None Moderate-term on-the-job training $18.81
51-9151 Photographic Process Workers and Processing Machine Operators High school diploma or equivalent None Short-term on-the-job training $13.84
51-9191 Cementing and Gluing Machine Operators/Tenders High school diploma or equivalent None Moderate-term on-the-job training $15.87
51-9192 Cleaning/Washing/Metal Pickling Equipment O/T High school diploma or equivalent None Moderate-term on-the-job training $15.27
51-9193 Cooling and Freezing Equipment Operators/Tenders High school diploma or equivalent None Moderate-term on-the-job training $13.69
51-9194 Etchers and Engravers High school diploma or equivalent None Moderate-term on-the-job training $16.34
51-9195 Molders/Shapers/Casters, ex. Metal & Plastic High school diploma or equivalent None Long-term on-the-job training $15.59
51-9196 Paper Goods Machine Setters, Operators, and Tenders High school diploma or equivalent None Moderate-term on-the-job training $18.24
51-9197 Tire Builders High school diploma or equivalent None Moderate-term on-the-job training $24.31
51-9198 Helpers--Production Workers High school diploma or equivalent None Short-term on-the-job training $13.85
51-9199 Production Workers, All Other High school diploma or equivalent None Moderate-term on-the-job training $14.26
53-0000 Transportation & Material Moving Occupations $14.64
53-1021 FL Sup/Mgrs of Help/Labor/Mat. Movers, Hand High school diploma or equivalent Less than 5 years None
53-1031 FL Sup/Mgr of Trans/Mat.-Mov. Mach & Veh Op High school diploma or equivalent Less than 5 years None
53-2011 Airline Pilots, Copilots, and Flight Attendants Bachelor's degree Less than 5 years Moderate-term on-the-job training $90,890 ††
53-2012 Commercial Pilots High school diploma or equivalent None Moderate-term on-the-job training $77,510 ††
53-2021 Air Traffic Controllers Associate's degree None Long-term on-the-job training $65.96
53-2022 Airfield Operations Specialists High school diploma or equivalent None Long-term on-the-job training $20.12
53-2031 Flight Attendants High school diploma or equivalent Less than 5 years Moderate-term on-the-job training $50,720 ††
53-3011 Ambulance Drivers & Attendants, Ex. EMT High school diploma or equivalent None Moderate-term on-the-job training $10.83

68
Appendix Table K – cont’d. Ohio Occupational Education and Training Classification
Work Experience Typical On-The-Job Training Median
Typical Education**** in a Related Needed to Attain Competency in Wage***
Code Occupational Title** Needed for Entry Occupation the Occupation May 2017
53-3021 Bus Drivers, Transit and Intercity High school diploma or equivalent None Moderate-term on-the-job training $20.18
53-3022 Bus Drivers, School High school diploma or equivalent None Short-term on-the-job training $15.44
53-3031 Driver/Sales Workers High school diploma or equivalent None Short-term on-the-job training $9.47
53-3032 Truck Drivers, Heavy and Tractor-Trailer Postsecondary non-degree award None Short-term on-the-job training $20.09
53-3033 Truck Drivers, Light or Delivery Services High school diploma or equivalent None Short-term on-the-job training $14.27
53-3041 Taxi Drivers and Chauffeurs No formal educational credential None Short-term on-the-job training $10.39
53-3099 Motor Vehicle Operators, All Other No formal educational credential None Short-term on-the-job training $10.04
53-4013 Rail Yard Engineers, Dinkey Operators, & Hostlers High school diploma or equivalent None Moderate-term on-the-job training $26.15
53-4021 Railroad Brake, Signal, and Switch Operators High school diploma or equivalent None Moderate-term on-the-job training $23.95
53-5011 Sailors and Marine Oilers No formal educational credential None Moderate-term on-the-job training $17.26
53-5021 Captains, Mates, and Pilots of Water Vessels Postsecondary non-degree award Less than 5 years None $24.32
53-6011 Bridge and Lock Tenders High school diploma or equivalent None Short-term on-the-job training $25.38
53-6021 Parking Lot Attendants No formal educational credential None Short-term on-the-job training $9.88
53-6031 Service Station Attendants No formal educational credential None Short-term on-the-job training $10.82
53-6041 Traffic Technicians High school diploma or equivalent None Moderate-term on-the-job training $23.98
53-6051 Transportation Inspectors High school diploma or equivalent None Moderate-term on-the-job training $26.66
53-6061 Transportation Attendants, Except Flight Attendants High school diploma or equivalent None Short-term on-the-job training $12.33
53-6099 Transportation Workers, All Other High school diploma or equivalent None Short-term on-the-job training $15.00
53-7011 Conveyor Operators/Tenders No formal educational credential None Short-term on-the-job training $14.91
53-7021 Crane and Tower Operators High school diploma or equivalent Less than 5 years Moderate-term on-the-job training $19.73
53-7032 Excavating & Loading Machine & Dragline Oper. High school diploma or equivalent Less than 5 years Moderate-term on-the-job training $19.58
53-7041 Hoist and Winch Operators No formal educational credential None Short-term on-the-job training $17.77
53-7051 Industrial Truck and Tractor Operators No formal educational credential None Short-term on-the-job training $15.66
53-7061 Cleaners of Vehicles and Equipment No formal educational credential None Short-term on-the-job training $10.82
53-7062 Laborers/Freight/Stock/Material Movers, Hand No formal educational credential None Short-term on-the-job training $12.92
53-7063 Machine Feeders and Offbearers No formal educational credential None Short-term on-the-job training $11.99
53-7064 Packers and Packagers, Hand No formal educational credential None Short-term on-the-job training $10.98
53-7071 Gas Compressor and Gas Pumping Station Operators High school diploma or equivalent None Moderate-term on-the-job training $34.02
53-7072 Pump Operators, Except Wellhead Pumpers High school diploma or equivalent None Moderate-term on-the-job training $15.08
53-7073 Wellhead Pumpers High school diploma or equivalent Less than 5 years Moderate-term on-the-job training $18.21
53-7081 Refuse and Recyclable Material Collectors No formal educational credential None Short-term on-the-job training $16.81
53-7121 Tank Car, Truck, and Ship Loaders No formal educational credential None Short-term on-the-job training $14.87
53-7199 Material Moving Workers, All Other No formal educational credential None Short-term on-the-job training $14.26
* Occupations with 100 or more workers. † National Wages
** Certain Occupations are abbreviated. †† Certain occupations only report wages at the annual level - for elementary and secondary teachers this typically reflects a 9 1/2 month school year.
Abbreviations: ††† Annual National Wages
AO = All Other N/A This wage is equal or greater than $100 per hour or $208,000 per year.
FL Sup/Mgrs = FirstLine Supervisors/Managers Wage data unavailable – OES consolidated these occupations in 2017.
M/P = Metal and Plastic *** Wage estimates are based on Ohio’s OES surveys.
PS = Postsecondary **** Education, experience and training levels associated with occupations were based on national data provided by the BLS.
O/T = Operators and Tenders
S/O/T = Setters, Operators and Tenders
Source: Ohio Department of Job and Family Services, Bureau of Labor Market Information, September 2018.

Ohio Department of Job and Family ServicesOffice of Workforce DevelopmentP.O. Box 1618Columbus, OH 43216-1618
Bureau of Labor Market Information Business Principles for Workforce Development
• Partner with the workforce and economic development community.
• Develop and deploy new information solution tools and systems for the workforce and economic development community.
• Provide products and services that are customer- and demand-driven.
• Be known as an important and reliable source for information solutions that support workforce development goals and outcomes.
Acknowledgments: The Workforce Research Section produced this report under the direction of Bureau Chief Coretta Pettway. For further information, visit http://OhioLMI.com or call the Ohio Bureau of Labor Market Information at 1-888-296-7541 option 6, or (614) 752-9494.
John R. Kasich, GovernorState of Ohiohttp://Ohio.gov
Cynthia C. Dungey, DirectorOhio Department of Job and Family Services
http://jfs.ohio.gov
Office of Workforce Developmenthttp://jfs.ohio.gov/owd/
Bureau of Labor Market Informationhttp://OhioLMI.com
(October 2018)
This institution is an equal opportunity provider and employer.
A proud partner of the American Job Center Network.
This workforce product was funded by a grant awarded by the U.S. Department of Labor’s Employment and Training Administration. The product was created by the recipient and does not necessarily reflect the official position of the U.S. Department of Labor. The Department of Labor makes no guarantees, warranties, or assurances of any kind, express or implied, with respect to such information, including any information on linked sites and including, but not limited to, accuracy of the information or its completeness, timeliness, usefulness, adequacy, continued availability, or ownership. This product is copyrighted by the institution that created it. Internal use by an organization and/or personal use by an individual for non-commercial purposes is permissible. All other uses require the prior authorization of the copyright owner.