ohio english language proficiency...
TRANSCRIPT

Ohio English Language
Proficiency Assessment
Understanding Results Manual
SPRING 2017
Page 1 │ Understanding OELPA Reports 2016-2017
Table of Contents
Introduction ..............................................................................................................................................2
Overview of OELPA..................................................................................................................................2
Grade Levels Tested ................................................................................................................................2 Testing Format .........................................................................................................................................2 Question Formats .....................................................................................................................................2
OELPA Results ........................................................................................................................................3
Performance Levels..................................................................................................................................3
Scale Score Ranges.................................................................................................................................3 Codes for No Data Reported....................................................................................................................5 Exit Criteria ...............................................................................................................................................5
OELPA Reports........................................................................................................................................7
Family Score Reports ...............................................................................................................................7 Online Reporting System .........................................................................................................................7 Welcome Page ........................................................................................................................................ 7
Homepage Dashboard ............................................................................................................................ 7
Home Page Dashboard: Select Test and Administration ....................................................................... 9
Home Page Dashboard: Report Tables ................................................................................................ 10
Test Scale Scores ..................................................................................................................................10 Important differences between the online report and Ohio’s use of test results ...................................10
Online Reports .......................................................................................................................................11
Subject Detail Report .............................................................................................................................11
Domain Detail Report .............................................................................................................................12 Student Listing Report ............................................................................................................................13 Individual Student Report .......................................................................................................................14
Achievement Level Descriptors (ALDs) ..........................................................................................15
Kindergarten...........................................................................................................................................15
Grade 1 ...................................................................................................................................................16
Grades 2-3 ..............................................................................................................................................17 Grades 4-5 ..............................................................................................................................................18 Grades 6-8 ..............................................................................................................................................19
DISCLAIMER: All data included in the images and examples used throughout
this document are fictitious and for demonstration purposes only.

Page 2 │ Understanding OELPA Reports 2016-2017
Understanding OELPA Results
Introduction This document has been prepared to help you understand the score reports for the Ohio English Language
Proficiency Assessment (OELPA) for the 2016-2017 school year.
Authorized district and school personnel can log in to the Online Reporting System to access and view their
score reports. Assistance with the reporting system is available in the Online Reporting System User Guide.
Overview of OELPA Ohio is one of seven members of the English Language Proficiency Assessment for the 21st Century
(ELPA21) consortium. ELPA21 developed the English language proficiency assessment based on the English
Language Proficiency Standards. The ELPA21 assessment is called OELPA when it is administered in Ohio.
The OELPA is designed to measure the performance of English learners (ELs) as they progress through their
K-12 education and work towards achieving college and career readiness. Students identified as ELs are
required to take the OELPA in addition to the state tests.
The OELPA produces measures of English language acquisition in four domains: Listening, Speaking,
Reading, and Writing. All consortium members are committed to ensuring that ELs become skilled in all four
domains and have chosen a model that does not allow a weakness in one domain to be masked by strong
performance in others. Students cannot achieve overall proficiency without strong performance in all four
domains.
For the 2016-2017 school year, districts use a commercial screener to identify students as English learners. The state screener was pilot tested from April-June 2017, and the operational state screener will be available
starting with the 2018-2019 school year.
Grade Levels Tested
OELPA is administered to the following grade bands: kindergarten, grade 1, grades 2-3, grades 4-5, grades 6-
8 and grades 9-12.
Testing Format For the 2016-2017 school year, the OELPA was available in two formats: computer-based testing (online) and
paper-based testing. The OELPA was designed as an online test. Paper versions were intended as an
accommodation for students or districts that were unable to test online, for students who could not use the
online test for cultural/religious reasons, and for students who needed paper test administration per their IEP.
Tests were also available in Braille and large print for students requiring these specific accommodations.
Question Formats Students responded to items in multiple ways, including multiple choice, writing extended responses, and using
interactive technology enhanced item types. Sample items, as well as descriptions and tutorials of the item
types, are available on the Student Practice Site and Test Administrator Practice Site.

Page 3 │ Understanding OELPA Reports 2016-2017
OELPA Results
Performance Levels
A student will receive a numeric performance level for each of the four domain tests taken. Students who do not take four domain tests will receive the appropriate results with an explanation for the tests not taken such as N if the test was not attempted. The test performance levels for each of the four domain tests have a range of 1-5, with 5 as the highest: Level 1 – Beginning Level 2 – Early Intermediate Level 3 – Intermediate Level 4 – Early Advanced Level 5 – Advanced The performance levels on each of the four domains are used to determine an overall performance level. There are three overall performance levels established by ELPA21: Proficient, Progressing, and Emerging. Each EL student must take the OELPA annually until earning a Proficient score and being exited from the program. The performance level cut points, agreed to by the ELPA21 member states, are as follows:
Proficient means a student scored any combination of level 4s and 5s on the four tests.
Progressing means a student scored a combination of levels that did not allow the student to be considered
Proficient or Emerging.
Emerging means a student scored any combination of level 1s and 2s on the four tests.
Scale Score Ranges
The four test scale scores are always expressed as three-digit numbers. There are four-digit scale scores for overall performance and comprehension. There are no cut scores for these scales, and Ohio does not use them for any purpose. They are reported because other consortium members plan to use them as the basis for annual growth measurement.
Scale scores are comparable within the same domain and grade band – i.e., a score of 600 in grade 4 writing and a score of 600 in grade 5 writing indicate the same writing performance - but the cut scores differ across grades, so it is possible for the same scale score to fall in different performance levels in different grades.
Grades 9-12 are the exception to this statement; the cut scores for those grades are identical.
Page 4 │ Understanding OELPA Reports 2016-2017
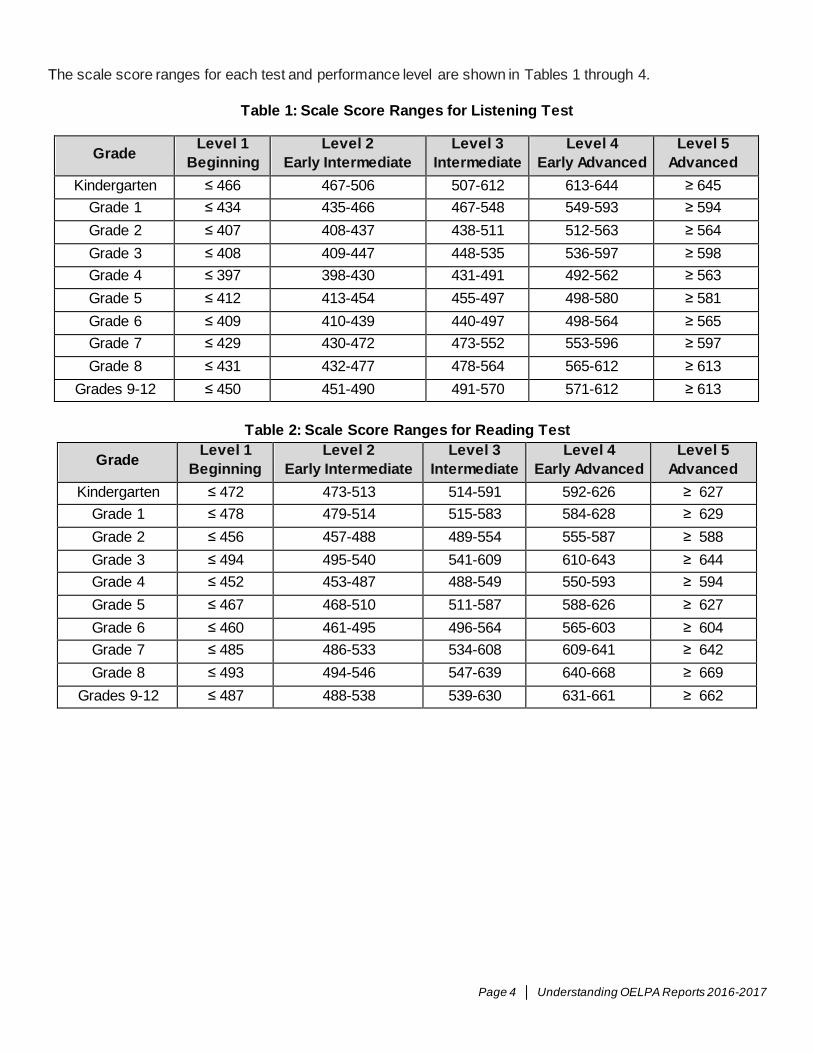
The scale score ranges for each test and performance level are shown in Tables 1 through 4.
Table 1: Scale Score Ranges for Listening Test
Grade Level 1
Beginning
Level 2
Early Intermediate
Level 3
Intermediate
Level 4
Early Advanced
Level 5
Advanced
Kindergarten ≤ 466 467-506 507-612 613-644 ≥ 645
Grade 1 ≤ 434 435-466 467-548 549-593 ≥ 594
Grade 2 ≤ 407 408-437 438-511 512-563 ≥ 564
Grade 3 ≤ 408 409-447 448-535 536-597 ≥ 598
Grade 4 ≤ 397 398-430 431-491 492-562 ≥ 563
Grade 5 ≤ 412 413-454 455-497 498-580 ≥ 581
Grade 6 ≤ 409 410-439 440-497 498-564 ≥ 565
Grade 7 ≤ 429 430-472 473-552 553-596 ≥ 597
Grade 8 ≤ 431 432-477 478-564 565-612 ≥ 613
Grades 9-12 ≤ 450 451-490 491-570 571-612 ≥ 613
Table 2: Scale Score Ranges for Reading Test
Grade Level 1
Beginning
Level 2
Early Intermediate
Level 3
Intermediate
Level 4
Early Advanced
Level 5
Advanced
Kindergarten ≤ 472 473-513 514-591 592-626 ≥ 627
Grade 1 ≤ 478 479-514 515-583 584-628 ≥ 629
Grade 2 ≤ 456 457-488 489-554 555-587 ≥ 588
Grade 3 ≤ 494 495-540 541-609 610-643 ≥ 644
Grade 4 ≤ 452 453-487 488-549 550-593 ≥ 594
Grade 5 ≤ 467 468-510 511-587 588-626 ≥ 627
Grade 6 ≤ 460 461-495 496-564 565-603 ≥ 604
Grade 7 ≤ 485 486-533 534-608 609-641 ≥ 642
Grade 8 ≤ 493 494-546 547-639 640-668 ≥ 669
Grades 9-12 ≤ 487 488-538 539-630 631-661 ≥ 662

Page 5 │ Understanding OELPA Reports 2016-2017
Table 3: Scale Score Ranges for Speaking Test
Grade Level 1
Beginning
Level 2
Early Intermediate
Level 3
Intermediate
Level 4
Early Advanced
Level 5
Advanced
Kindergarten ≤ 486 487-534 535-597 598-624 ≥ 625
Grade 1 ≤ 527 528-576 577-592 593-618 ≥ 619
Grade 2 ≤ 489 490-528 529-554 555-587 ≥ 588
Grade 3 ≤ 499 500-537 538-571 572-611 ≥ 612
Grade 4 ≤ 461 462-505 506-543 544-583 ≥ 584
Grade 5 ≤ 482 483-525 526-572 573-606 ≥ 607
Grade 6 ≤ 464 465-510 511-561 562-594 ≥ 595
Grade 7 ≤ 474 475-526 527-581 582-610 ≥ 611
Grade 8 ≤ 475 476-527 528-589 590-618 ≥ 619
Grades 9-12 ≤ 480 481-535 536-592 593-618 ≥ 619
Table 4: Scale Score Ranges for Writing Test
Grade Level 1
Beginning
Level 2
Early Intermediate
Level 3
Intermediate
Level 4
Early Advanced
Level 5
Advanced
Kindergarten ≤ 496 497-561 562-650 651-672 ≥ 673
Grade 1 ≤ 497 498-547 548-612 613-640 ≥ 641
Grade 2 ≤ 451 452-492 493-554 555-590 ≥ 591
Grade 3 ≤ 497 498-541 542-602 603-635 ≥ 636
Grade 4 ≤ 436 437-480 481-567 568-599 ≥ 600
Grade 5 ≤ 437 438-485 486-597 598-627 ≥ 628
Grade 6 ≤ 424 425-471 472-563 564-593 ≥ 594
Grade 7 ≤ 473 474-519 520-596 597-624 ≥ 625
Grade 8 ≤ 483 484-532 533-618 619-646 ≥ 647
Grades 9-12 ≤ 484 485-532 533-614 615-640 ≥ 641
Codes for No Data Reported
The following abbreviations may appear on some reports:
N – Not Attempted;
INV – Invalidated;
A domain/test is "attempted" once the student has started the test (had the opportunity to view at least one
item). A test/domain is "not attempted" if the student never started the domain/test (i.e., the student never had
the opportunity to view any items).
A test is invalidated when a student is caught cheating or the test is compromised.
Exit Criteria
A student is reclassified (no longer identified as an English learner) when the student has attained a
performance level of Proficient on the OELPA. The Proficient performance level is defined as performance
levels of 4s and 5s in any combination across all four tests (Listening, Reading, Writing, and Speaking). For
Page 6 │ Understanding OELPA Reports 2016-2017
example, Listening = 4, Reading = 4, Writing = 5, Speaking = 4. A student who has an invalidated test or did
not test in one or more domains/tests cannot receive a Proficient level even if the other three tests have all 4s
and 5s; the student will receive the Progressing level. Students in grades K-12 are eligible for reclassification if
the student receives a performance level of Proficient. Please note that K-2 students are eligible to exit the EL
program if they receive a performance level of Proficient.
The Trial Mainstream category for English learners is used for programmatic and funding purposes only. The
Department considers ELs who score a combination of 5’s and 4’s in three domains and a score of 3 in one
domain as Trial Mainstream. These students are still provided all necessary EL program supports, with
targeted intervention on the domain for which they scored a 3. A student in Trial Mainstream cannot exit the
program. The Trial Mainstream category may be in place for only one year or may be many years. The Trial
Mainstream category is determined each year based on the OELPA scores. Students with scores of INV =
invalidated or N = not attempted are not eligible for Trial Mainstream.

Page 7 │ Understanding OELPA Reports 2016-2017
OELPA Reports
Family Score Reports The OELPA Family Score Report is a two-page color report. The report provides the student’s overall
performance reported as Proficient, Progressing or Emerging. The student’s test performance levels for the
four domain level tests are reported on a 1 – 5 scale, where 5 indicates the highest level.
Online Reporting System Authorized district and school personnel can log in to the Online Reporting System (ORS) to access and view
district and building OELPA reports of students. For more information on accessing and navigating online
score reports, readers should refer to the Accessing Score Reports section of Online Reporting System User
Guide.
Welcome Page
The Welcome page appears when you first log onto ORS and asks you to select the type of report you want to
view. Note that you can navigate to a different report at any time within ORS.
Retrieve Student Results allows you to download student data for a district, school, teacher, or roster. The
data includes students’ personal information and their performance on the selected test and administration.
Score Reports provide test score data. You can compare score data between individual students, schools,
and the state.
Homepage Dashboard
After logging into the Online Reporting System, district- and building-level users will first view district or school
aggregation tables on the Homepage Dashboard. The Homepage Dashboard page displays the overall
Speaking

Page 8 │ Understanding OELPA Reports 2016-2017
summary of score data for your district or school and is the starting point for data analysis. You can navigate to
more detailed score reports from the Homepage Dashboard page. The score data you see are dependent on
your role; for example, a building test coordinator only sees that school’s aggregate data.
Aggregation tables that appear on the Homepage Dashboard page display overall score data for students by
grade and provide access to more detailed subject score reports. Click the corresponding grade cell that
contains a value from the table. For example, if you want to view the OELPA detail report for Grade 3, click the
“Number of Students Tested” or “Percent Proficient” buttons in the Grade 3.

Page 9 │ Understanding OELPA Reports 2016-2017
Home Page Dashboard: Select Test and Administration
From the Home Page Dashboard page, you can select the test and administration for which you want to view
score data. You can also specify the students whose data you wish to view using the available radio buttons.
This feature is particularly helpful for school personnel who want to see how students currently assigned to the
user’s class roster performed in previous grades, even if students were enrolled in different schools during
those previous administrations. If you currently have a student who did not test in the selected test and
administration, no data will be displayed for that student.
Scores for students who were mine at the end of the selected administration allows you to see score
data for those students who tested in the selected test and administration and were associated with your
school or district at the end of the selected test and administration.
Scores for my current students allows you to immediately view score data for those students who are
associated to your current rosters, even if they were previously enrolled in a different school or district.
Scores for students who were mine when they tested during the selected administration allows you to
see score data for those students who were associated with your school, district, or roster when they were
tested in the selected test and administration.

Page 10 │ Understanding OELPA Reports 2016-2017
Home Page Dashboard: Report Tables
After defining which students you wish to view, look at the table near the bottom of the Home Page Dashboard
page. This table displays aggregate data for the test. Number of Students Tested displays the number of
students to date who have completed and submitted their tests for scoring. Percent Determined Proficient
displays the percentage of students to date who have scored proficient on each domain/test.
To access score reports for a particular grade, click a cell for the selected grade. You will only see the test
administered by the selected district or school. When you click a cell, a Subject Detail Report will load for the
corresponding grade.
Test Scale Scores
The overall performance scale score and the comprehension score cannot be suppressed during online
reporting. The district needs to be aware that those scores AND reported data based on tallies of those scores
(such as percent proficient), are not applicable in Ohio. This descriptive guide shows the screen shots that
district staff will see but fields that are not properly interpretable under Ohio rules.
Important differences between the online report and Ohio’s use of test results
There are substantial differences in the way Ohio interprets the results and the way that the results are being
reported online by AIR. The OELPA is the product of a consortium and the member states have different
requirements and procedures. The AIR reporting system was designed to satisfy the requirements of all the
states that work with AIR. All features may not be applicable to all of AIR’s customers.
Page 11 │ Understanding OELPA Reports 2016-2017
Online Reports
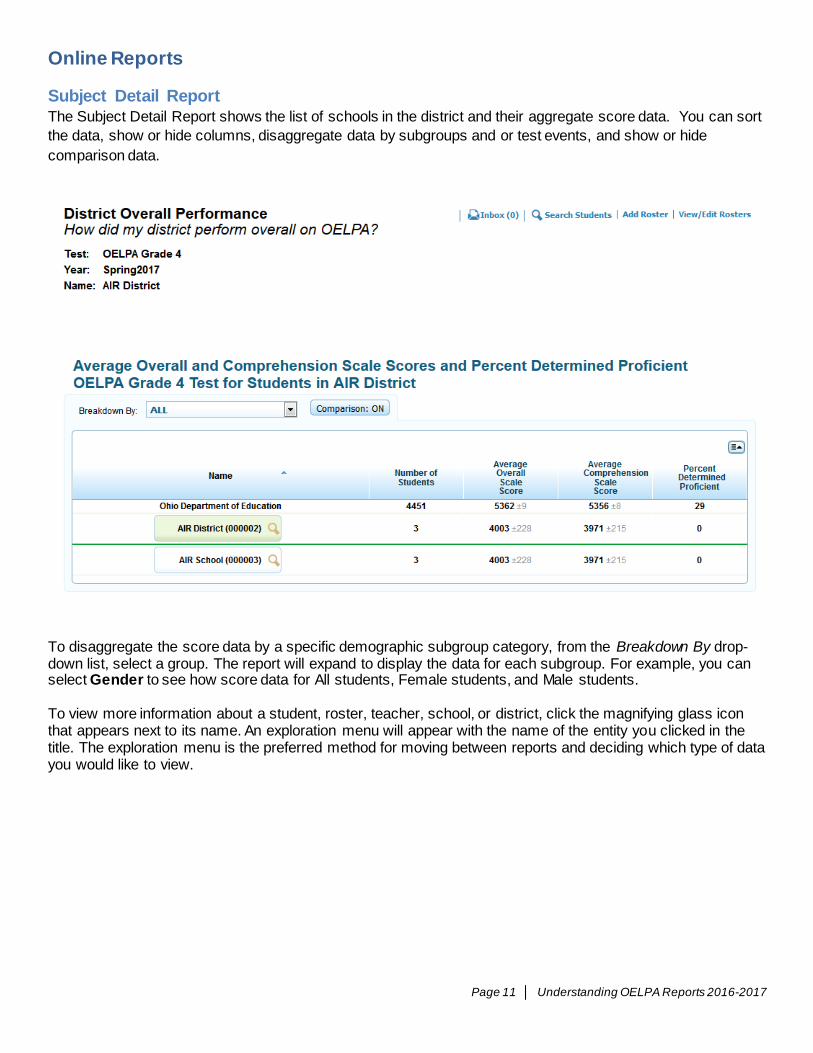
Subject Detail Report
The Subject Detail Report shows the list of schools in the district and their aggregate score data. You can sort
the data, show or hide columns, disaggregate data by subgroups and or test events, and show or hide
comparison data.
To disaggregate the score data by a specific demographic subgroup category, from the Breakdown By drop-down list, select a group. The report will expand to display the data for each subgroup. For example, you can select Gender to see how score data for All students, Female students, and Male students.
To view more information about a student, roster, teacher, school, or district, click the magnifying glass icon that appears next to its name. An exploration menu will appear with the name of the entity you clicked in the title. The exploration menu is the preferred method for moving between reports and deciding which type of data you would like to view.
Page 12 │ Understanding OELPA Reports 2016-2017
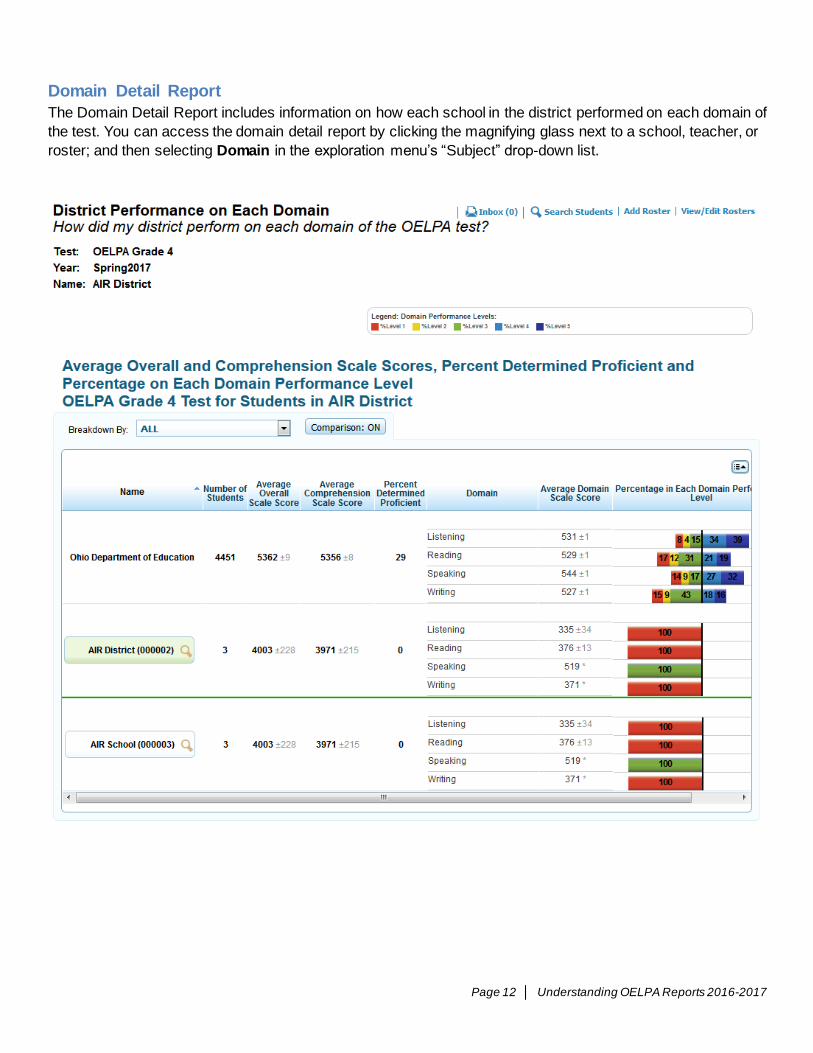
Domain Detail Report
The Domain Detail Report includes information on how each school in the district performed on each domain of
the test. You can access the domain detail report by clicking the magnifying glass next to a school, teacher, or
roster; and then selecting Domain in the exploration menu’s “Subject” drop-down list.
Page 13 │ Understanding OELPA Reports 2016-2017
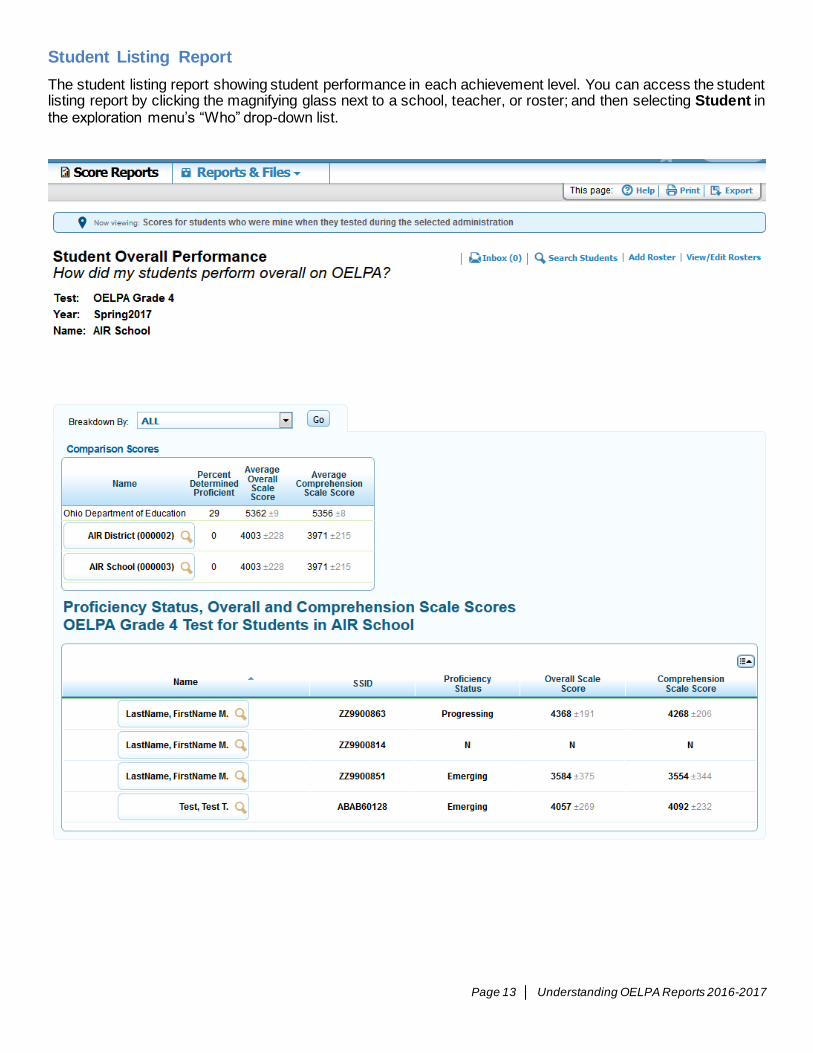
Student Listing Report
The student listing report showing student performance in each achievement level. You can access the student listing report by clicking the magnifying glass next to a school, teacher, or roster; and then selecting Student in the exploration menu’s “Who” drop-down list.
Page 14 │ Understanding OELPA Reports 2016-2017
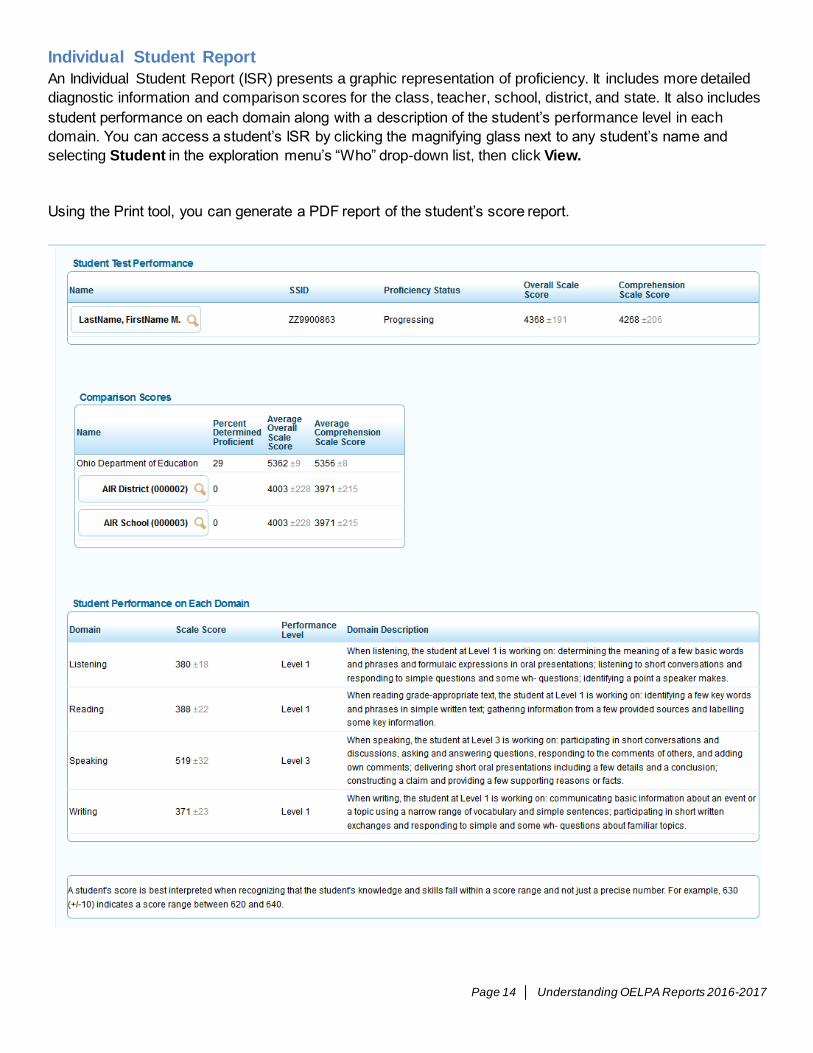
Individual Student Report
An Individual Student Report (ISR) presents a graphic representation of proficiency. It includes more detailed
diagnostic information and comparison scores for the class, teacher, school, district, and state. It also includes
student performance on each domain along with a description of the student’s performance level in each
domain. You can access a student’s ISR by clicking the magnifying glass next to any student’s name and
selecting Student in the exploration menu’s “Who” drop-down list, then click View.
Using the Print tool, you can generate a PDF report of the student’s score report.

Page 15 │ Understanding OELPA Reports 2016-2017
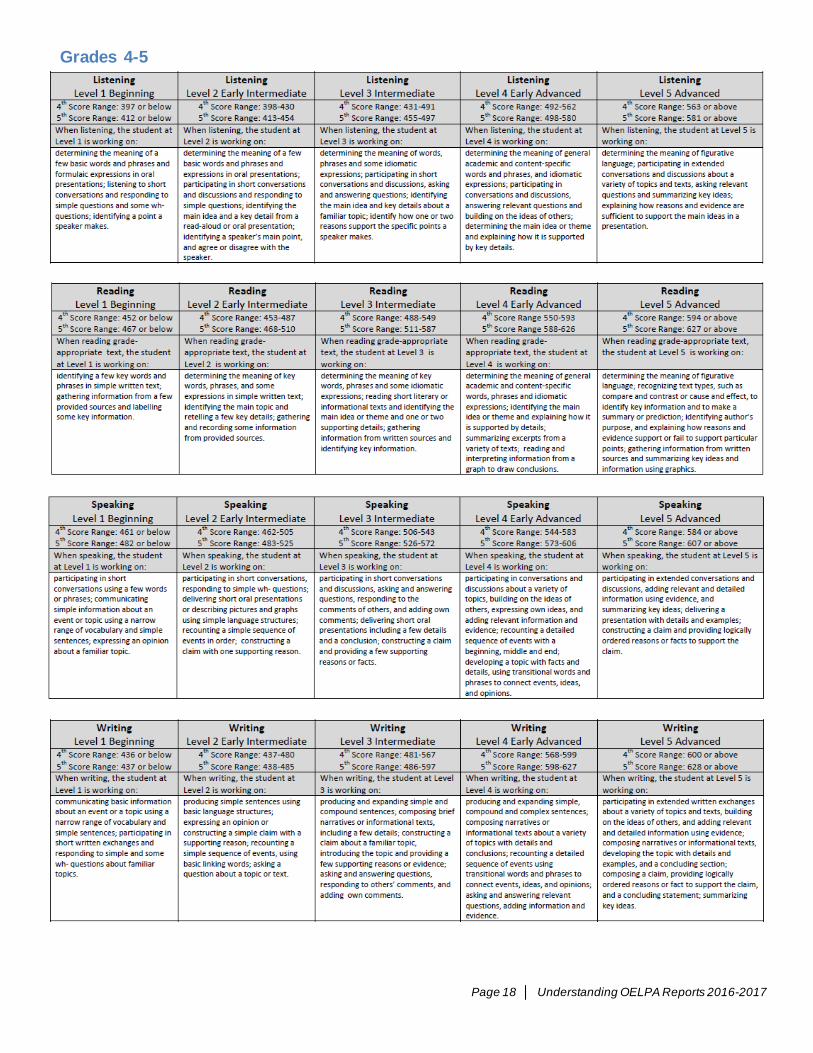
Achievement Level Descriptors (ALDs)
Kindergarten

Page 16 │ Understanding OELPA Reports 2016-2017
Grade 1
Page 17 │ Understanding OELPA Reports 2016-2017
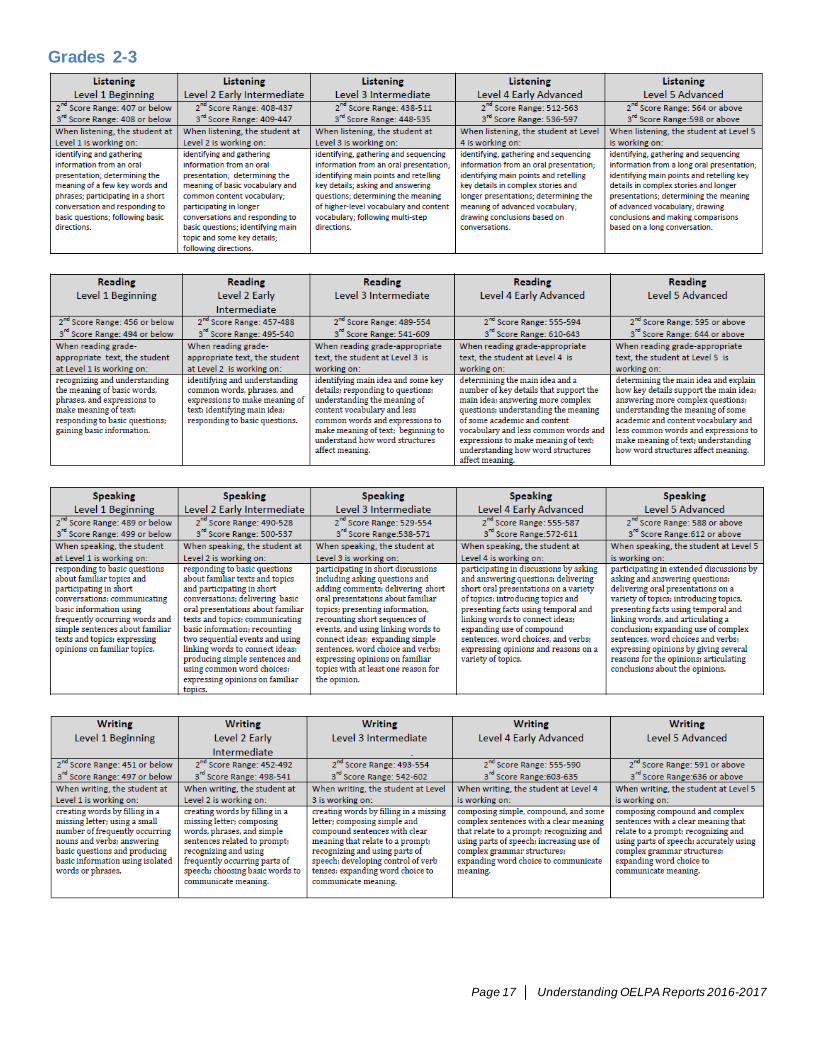
Grades 2-3
Page 18 │ Understanding OELPA Reports 2016-2017
Grades 4-5

Page 19 │ Understanding OELPA Reports 2016-2017
Grades 6-8

Page 20 │ Understanding OELPA Reports 2016-2017
Grades 9-12