offshore wind from a developer and financial investor
TRANSCRIPT

Only the right/intended addressees are allowed to access and read this document.
This document may contain confidential information and shall not be disclosed to
any third party, referred to or published without CIP’s prior written approval.
Offshore wind from a developer and financial investor perspective
Copenhagen Infrastructure Partners
Webinar with NASEO
November 10, 2020

Section Page
1. Introduction to CIP 3
2. Offshore wind in North America – the developer view 9
a. Why offshore wind in the USA
b. Key challenges and attractiveness
3. Securing financing for offshore wind in the USA 15
a. The experience with Vineyard Wind I
Content
2

Copenhagen Infrastructure Partners (CIP) at a Glance
▪ Founded in 2012 by senior executives
from the energy sector and
PensionDanmark as founding investor
▪ 22 partners with extensive energy
sector experience
▪ +140 team of industrialists across 20
nationalities (expected to grow to 150)
▪ The team has a broad range of
competencies within corporate finance,
merger & acquisitions, engineering,
construction, project development and
project management.
▪ Large international industrial network
▪ EUR ~12bn1 of commitments
▪ 65+ blue chip institutional investors
▪ Mainly industrial value creation
The CIP Team
CIP introduces institutional investors to greenfield premium projects CIP Core Values
Global Presence
▪ Sector specialist and market pioneer
▪ Market leader within renewables
▪ Focus on large greenfield projects
▪ Strong ESG commitment
▪ Nordic heritage and corporate
culture
▪ Global presence with 6 offices
across 3 continents
▪ Headquarter in Copenhagen with
~140 employees
▪ Local project offices and presence in
main geographies
▪ CI IV investment strategy focused on
Western Europe, North America,
developed Asia and Australia
Notes: 1) Including LP commitments to date to CI IV of EUR ~4.5bn. The fund is still fund raising and has a target fund size of EUR 5.5bn and a hard cap of EUR 7.0bn. 3
Entry during development phase
Entry at the start of construction phase
Entry during operational phase
3-5%
6-10%
FID COD
▪ Outperformance: Lifetime IRR of
+10% for all predecessor flagship
funds (CI I, CI II, CI III)
▪ Low financial leverage and low
energy price risk exposure
IRR

The history of CIP- Significant growth in a short period of time
Source: Infrastructure Investor, PEI Media
4 51 32 6
Timeline of CIP
2017-2018: CI III
▪ Largest renewable
energy fund ever raised (EUR 3.5bn)
▪ Largest financial investor
within offshore wind
▪ Presence in four continents (Europe,
North America, Asia, Australia)
▪ Team of 80 people and 3 offices
2007-2012: DONG Energy (now Ørsted)
▪ Instrumental in successful
implementation of one of the first energy
transitions of a large utility
▪ Pioneering offshore wind, responsible
for some of the largest projects in the
world
▪ Industrialization of the offshore wind
supply chain and inventing new
financing models
4
2012-2014: Artemis & CI I
▪ Total EUR 1.4bn committed in less than
two years
▪ Offshore Wind,
Onshore wind, Biomass and
Transmission investments in
Northwestern Europe
▪ Team of 15 people
7 8
2012: Establishment of CIP
▪ Invention of new investment product
making utility scale energy projects
accessible to financial investors
▪ EUR 1.0bn in commitments from the
largest labour market pension fund in
Denmark
▪ Team of 4 people in Copenhagen
2019: CI New Markets Fund
▪ Final close achieved in November 2019
with USD 1bn in commitments
▪ Focus on renewable energy investments
primarily in Asia and Latin America
▪ Team of 110 people and 5 offices
2014-2016: CI II
▪ Investor base now comprising group of
prominent Nordic institutional investors
▪ Strong position established in the US
solar and onshore wind market
▪ Team of 30 people
Ongoing: CI IV
▪ Set to become largest renewable
energy fund ever raised (target fund
size of EUR 5.5bn)
▪ First close achieved in June 2020 with
EUR ~1.6bn in preliminary commitments
▪ Team of 140 people (currently
expanding) and 6 offices
2020: CI Artemis II
▪ Special purpose fund created for the
investment in German transmission
assets with PensionDanmark as the only
investor
▪ Team of 110 people and 5 offices
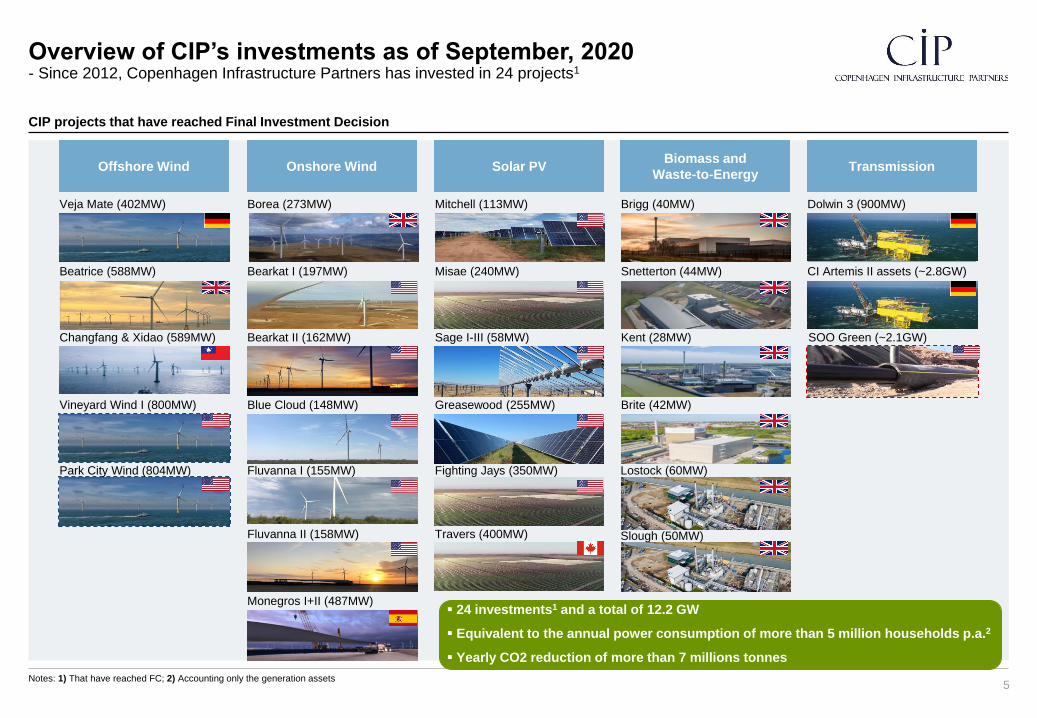
Overview of CIP’s investments as of September, 2020- Since 2012, Copenhagen Infrastructure Partners has invested in 24 projects1
5Notes: 1) That have reached FC; 2) Accounting only the generation assets
Solar PV
Mitchell (113MW)
Misae (240MW)
Sage I-III (58MW)
Greasewood (255MW)
Biomass and
Waste-to-Energy
Brigg (40MW)
Kent (28MW)
Brite (42MW)
Lostock (60MW)
Snetterton (44MW)
Transmission
Dolwin 3 (900MW)
Onshore Wind
Bearkat I (197MW)
Bearkat II (162MW)
Blue Cloud (148MW)
Fluvanna I (155MW)
Fluvanna II (158MW)
Monegros I+II (487MW)
Borea (273MW)
Offshore Wind
Veja Mate (402MW)
Beatrice (588MW)
Changfang & Xidao (589MW)
▪ 24 investments1 and a total of 12.2 GW
▪ Equivalent to the annual power consumption of more than 5 million households p.a.2
▪ Yearly CO2 reduction of more than 7 millions tonnes
CIP projects that have reached Final Investment Decision
CI Artemis II assets (~2.8GW)
Vineyard Wind I (800MW)
Park City Wind (804MW) Fighting Jays (350MW)
Travers (400MW) Slough (50MW)
SOO Green (~2.1GW)

CIP is a leading investor in offshore wind globally- In recent years CIP has established a significant position in the N. America offshore wind market
Notes: 1) Including Vineyard wind (800MW), Rest of Zone (up to ~1.6GW) which includes Park City Wind
Taiwan projects
▪ CIP’s ~600MW
project CFXD
reached FC in
February 2020
▪ CIP is also
developing the
~300MW Zone 29
project together with
CSC, and the project
has secured grid
connection and PPA
Star of the South
▪ CIP is currently developing the Star
of the South offshore wind project in
Victoria with a capacity of 2,200MW
World map of current CIP offshore wind activities
Japan projects
▪ CIP is developing a
portfolio of early stage
projects in Japan
Beatrice
▪ CIP has constructed
the 588MW offshore
wind project
Beatrice, a
partnership with
SSE and Red Rock
Veja Mate
▪ CIP has
constructed the
402MW offshore
wind farm Veja
Mate
Other new markets
▪ CIP is currently investigating potential
opportunities in China, India, Vietnam
and Philippines
South Korea projects
▪ CIP has established a partnership
with a local conglomerate regarding
the co-development of two fixed-
bottom projects
▪ CIP is developing new greenfield
sites for fixed-bottom and floating
offshore wind projects
Magellan
▪ CIP has partnered up with
Magellan Wind to develop
floating offshore wind
projects offshore California
Liberty Wind
▪ CIP is currently involved in the
development of the Liberty Wind
project together with partner
Avangrid with a potential capacity of
up to ~2.2GW
Italy projects
▪ CIP has established a partnership
with a local developer regarding
the development of a floating
offshore wind project and is in
exclusive discussion with the
partner on another floating project
6
Vineyard Wind lease area
▪ CIP is currently developing ~2.4GW1
of offshore wind together with
partner Avangrid, including the
800MW Vineyard Wind project and
the 804MW Park City Wind project,
both with PPA secured

Video: Veja Mate Offshore Wind Farm - A 402MW OWF that reached COD 4-months ahead of schedule and under budget
7

Section Page
1. Introduction to CIP 3
2. Offshore wind in North America – the developer view 9
a. Why offshore wind in the USA
b. Key challenges and attractiveness
3. Securing financing for offshore wind in the USA 15
a. The experience with Vineyard Wind I
Content
8

Fundamentals of offshore wind technology drive future growth
Offshore wind is fundamentally a highly attractive technology - Uniquely positioned to provide scalable decarbonisation for important global demand centres at competitive costs and with limited externalities / land use
9
▪ Global demand for rapid, scalable replacement of carbon intense
centralised power generation
▪ Key global demand centres are in densely populated coastal regions
▪ Onshore land typically scarce, limiting scaleability of other technologies
▪ Offshore wind ideally suited as it has limited externalities
▪ Additionally benefits from stable and predictable wind resources due to
absence of physical obstacles
Illustrative
European LCOE
LCOE journey primarily driven by 3 factors
▪ Economies of scale due to size of projects
▪ Remarkable technological progress through the entire supply chain
▪ Supportive regulatory frameworks
…at highly competitive costs thanks to rapid
technology and supply chain optimisations
450 KW
2.0 MW
3.6 MW
7.0 MW
8.0-10 MW
12 MW
5.0 MW
COD
year1991 2002 2012 2019/202017 2021/22 2023/24 Future
14+ MW
Offshore wind provides a solution to an urgent global
problem…
CCGT
Next evolution: Floating foundations
▪ Ability to access coastal regions with steeper shorelines and
deeper water depths
▪ Will further expand global reach and provide next growth wave
▪ Large potential of costs reductions due to modular production of
foundations
1991 2002 2012 2019/202017 2021/22 2023/24 Future
Nuclear
Offshore
Solar
Onshore

0
50
100
150
200
250
300
350
400
2018 2025 2030 2035 2040
United states
European Union
China
India
Japan
Korea
Rest of world
Forecasted development in global offshore wind (installed GW1)
10
Fundamental attractiveness drives unprecedented growth- Global offshore wind capacity expected to increase 15-fold within the next 2 decades and represent significant investment opportunities
Notes: 1) Based on stated policies; Source: Offshore Wind Outlook 2019: World Energy Outlook Special Report. International Energy Agency and Global Offshore Wind Report 2019, Global Wind Energy Council
23GW
356GW
191GW
International Energy Agency Global Wind Energy Council
23GW
188GW
70GW
▪ Projected global growth measured in multiples of existing capacity
▪ This will require an unprecedented deployment of capital
▪ Europe and APAC expected to be the primary growth drivers over the coming decades, with the US following
0
50
100
150
200
250
300
350
400
2018 2025 2030
United States
European Union
China
Asia excl. China

East coast states drive offshore development in the U.S.- Comparison with the Continental North Sea shows clear potential for U.S. offshore wind
Source: Bureau of Ocean Energy Management (BOEM), European Wind Energy Association, UK Department for International Trade11
US Atlantic and North Sea offshore wind facilities
Coastal
population
Coastline
(Miles)
Distance from
shore (Miles)
Water depth Wind speed # of active
projects
Active
production
(MW)
Anticipated
production
by 2030 (MW)
U.S. Atlantic ~52,000,000 750 Up to 30 miles Up to 60m 9-10 m/s 14 30 9,500
North Sea ~83,000,000 1100 More than 60 miles Up to 70m 9-10m/s 62 15,010 67,500
Strong similarities on key geographical parameters but the US is far behind Europe regarding active and anticipated
production, and with current cost levels for offshore wind this is expected to change
BOEM Lease Areas In operation
Planned
U.S. Atlantic North Sea
UK
DE
DK
NL
USA

Development of projects - Significant difference in size, water depth and distance from shore since the start of offshore wind and today
Source: U. S. Department of Energy, Fraunhofer IWES
Note 1: The chart includes both projects in the permitting / under construction phase and installed / operational stage 12
0
10
20
30
40
50
60
70
80
90
100
110
120
0 2 4 6 8 10 12 14 16 18 20 22 24 26 28 30 32 34 36 38 40 42 44 46 48 50 52 54 56 58 60 62 64 66 68
Water depth (m)
Dis
tance t
o s
hore
(km
)
400 MWBubble size indicates project size:
Vineyard
Wind 1
Installed Under construction/Permitting
Overview of offshore wind projects in terms of size, water depth and distance to shore
The European offshore wind
industry started in 1991 with
small, nearshore projects in
shallow waters
Since 1991, the industry
have moved with projects
further away from shore and
in more deep waters
Today, offshore wind farms are build in
deeper waters and further away from
shore as the nearshore projects have
being utilized. The US offshore industry
has kick-off from where Europe is today
Park City
Wind
Liberty
Wind

Overview of key challenges and attractiveness in US offshore wind
13
Key challenges and attractiveness of US offshore wind- Europe started with low competition and limited financing opportunities whereas today in the US the competition is high and financing is vital
European offshore wind US offshore wind
The US offshore wind industry lean on European technological learnings and kicked off at much more mature level compared
to the start of offshore wind in Europe, however the high competition, the weak infrastructure and the limited supply chain
opportunities present a challenge that offshore wind developers need to find solutions
Site
fundamentals
Competition
Regime
Supply chain
Infrastructure
▪ High wind speeds in the North Sea
▪ Low to medium water depths
▪ Start with nearshore projects
▪ Limited competition in the early days
▪ Local utilities being they players
▪ Strong political support with fixed and high tariffs in the early days
▪ Process to enable a wind farm well designed and very efficient
▪ Supply chain matured in Europe along the way with offshore wind
▪ Infrastructure (ports, vessels, transmission) matured along the way with offshore wind
Financing
opportunities
▪ Balance sheet equity
▪ Project finance
Site
fundamentals
Competition
Supply chain
Infrastructure
Financing
opportunities
✓ Similar high wind speeds in the US east coast
✓ Water depths in the east coast allow for monopiles
➢ US started with projects further away from shore
➢ High competition from international players both in terms of securing seabed and offtake
➢ Limited local supply chain opportunities
➢ Ports not ready to accommodate industry’s needs
➢ Jones Act and limited US vessels opportunities
➢ Weak transmission backbone
▪ Balance sheet equity
▪ Project finance
✓ Tax Equity
Regime
▪ Support through state regimes
➢ Fragmented permitting process (federal, state)
➢ High litigation risk

Section Page
1. Introduction to CIP 3
2. Offshore wind in North America – the developer view 9
a. Why offshore wind in the USA
b. Key challenges and attractiveness
3. Securing financing for offshore wind in the USA 15
a. The experience with Vineyard Wind I
Content
14

Financing opportunities
15
Typical capital structure for offshore wind assets
USEU
75-80%
20-25%
20-25%
58%50-60%
20-25%
Vineyard Wind I
19%
23%
Tax equityEquity Project finance
The US tax credits provide a unique
opportunity for offshore wind projects to
raise tax equity in the US, that leads senior
debt being raised as back-leverage
The Vineyard Wind I experience in 2019
Tax Equity
Back-leverage
✓ Strong interest from the biggest tax equity investors
✓ Attractive terms were secured (Term sheet was signed), however significant education around the risks of offshore wind was required
✓ European banks were leading the consortium of banks that was identified for Vineyard Wind I
✓ American banks gained increasing interest through the process
✓ Vineyard Wind I ended up being oversubscribed and achieved European terms for the first US offshore wind project
Unfortunately, as the permit was delayed due to the
need of cumulative impact assessment of offshore
wind, the whole financing process needs to be re-done.
Interests from tax equity and banks remains strong but
financing parties are hesitant to re-engage before
clarity on permitting is achieved